
Unlocking the inherent value of under-resourced real estate Annual Report and Accounts 2016 Kennedy W ilson Europe R eal Estate Plc / A nnual R eport and A ccounts 2016

Baggot Plaza, Dublin LEED Gold certification In this Report Contents Strategic report 1 Who we are 2 Our business at a glance 4 How we performed in 2016 8 Chair’s introduction 10 Investment proposition 12 Our markets 16 Our business model 20 Our strategy and goals 22 KPIs, Group and EPRA measures 24 Resources and relationships 27 Responsible investments 35 Managing risk 42 Performance review 50 Finance review Governance 57 Letter from the Chair 59 Our statements of compliance 62 Leadership 67 Letter from the chair of the Nominations Committee 69 Effectiveness 70 Letter from the chair of the Audit Committee 74 Accountability 75 Letter from the chair of the Management Engagement Committee 76 Remuneration 77 Relations with shareholders 78 Directors’ report 80 Statement of Directors’ responsibilities Financials 82 Independent audit report 85 Consolidated income statement 86 Consolidated statement of comprehensive income 87 Consolidated balance sheet 88 Consolidated statement of changes in equity 90 Consolidated cash flow statement 92 Notes to the consolidated financial statements Additional information 145 Principal properties 146 Portfolio statistics and EPRA disclosures 149 Alternative performance measures 150 Additional disclosures 154 Directors, advisors and Company information 155 Shareholder information 155 Financial calendar 156 Definitions and glossary For more information Look for page references for additional content Links are illustrated with the following markers: Go to page For further relevant information go to the page reference. Extra web content See website for further content. www.kennedywilson.eu Governance Read about our framework, approach and how we manage our business. Go to page 57 Leadership Accountability Effectiveness Remuneration Relations with shareholders Our markets Read about key trends and conditions across our markets. Go to page 12 Investment proposition Read about the reasons to invest in KWE. Go to page 10 Responsible investments Read about our Priorities and EPRA sBPR performance for 2016. Go to page 27 Go to www.kennedywilson.eu/about-us/responsible- investments/
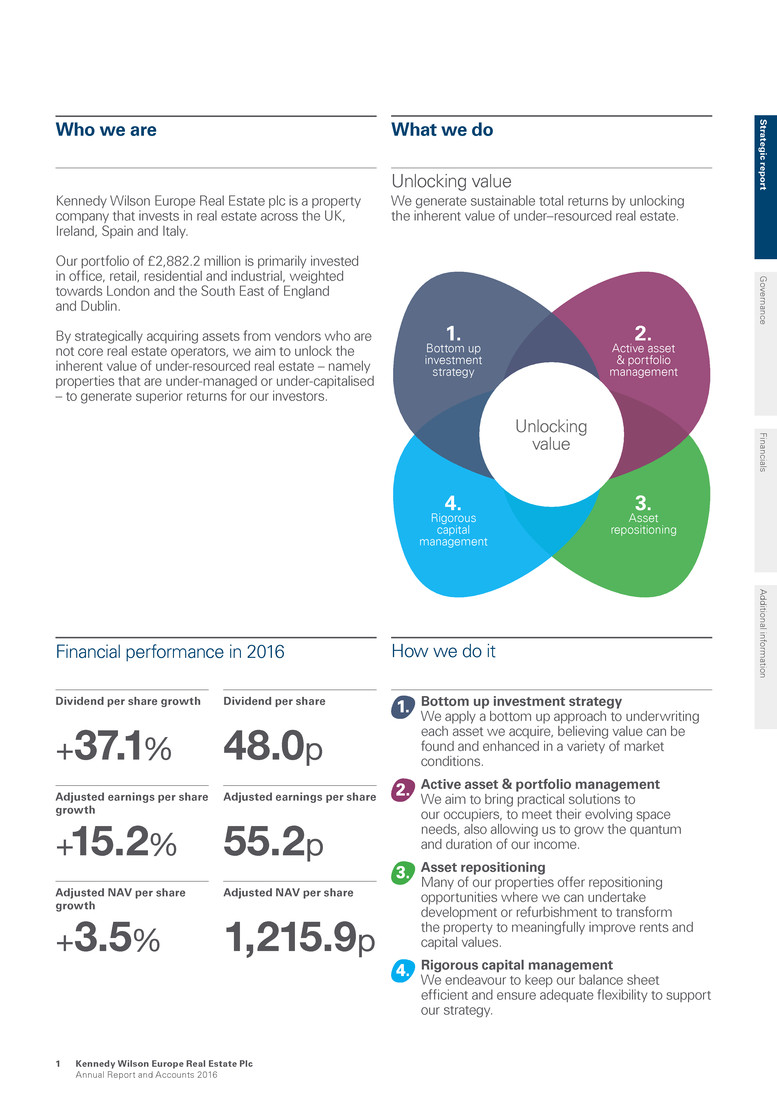
Unlocking value 2. Active asset & portfolio management 1. Bottom up investment strategy 3. Asset repositioning 4. Rigorous capital management Unlocking value We generate sustainable total returns by unlocking the inherent value of under–resourced real estate. Bottom up investment strategy We apply a bottom up approach to underwriting each asset we acquire, believing value can be found and enhanced in a variety of market conditions. Active asset & portfolio management We aim to bring practical solutions to our occupiers, to meet their evolving space needs, also allowing us to grow the quantum and duration of our income. Asset repositioning Many of our properties offer repositioning opportunities where we can undertake development or refurbishment to transform the property to meaningfully improve rents and capital values. Rigorous capital management We endeavour to keep our balance sheet efficient and ensure adequate flexibility to support our strategy. What we do How we do it Who we are Kennedy Wilson Europe Real Estate plc is a property company that invests in real estate across the UK, Ireland, Spain and Italy. Our portfolio of £2,882.2 million is primarily invested in office, retail, residential and industrial, weighted towards London and the South East of England and Dublin. By strategically acquiring assets from vendors who are not core real estate operators, we aim to unlock the inherent value of under-resourced real estate – namely properties that are under-managed or under-capitalised – to generate superior returns for our investors. Financial performance in 2016 Dividend per share growth +37.1% Dividend per share 48.0p Adjusted earnings per share growth +15.2% Adjusted earnings per share 55.2p Adjusted NAV per share growth +3.5% Adjusted NAV per share 1,215.9p S trateg ic rep o rt G overnance Financials A dditional inform ation Kennedy Wilson Europe Real Estate Plc Annual Report and Accounts 2016 1
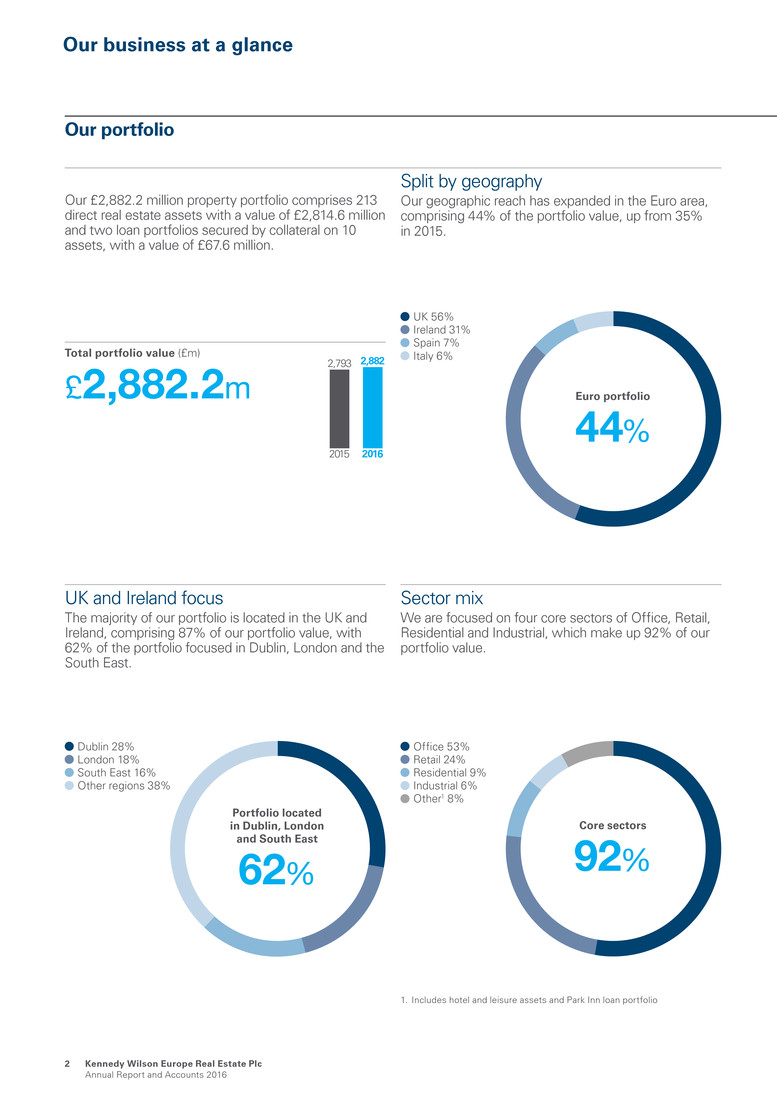
UK 56% Ireland 31% Spain 7% Italy 6% Euro portfolio 44% Core se ctors 92% Off_ice 53% Retail 24% Residential 9% Industrial 6% Other1 8% Portfolio located in Dublin, London an d South East 62% D ublin 28% London 18% South East 16% Other regions 38% 2,793 2015 2,882 2016 Our busine ss at a glanc e Split by geography Our geographic reach has expanded in the Euro area, comprising 44% of the portfolio value, up from 35% in 2015. Our portfolio Our £2,882.2 million property portfolio comprises 213 direct real estate assets with a value of £2,814.6 million and two loan portfolios secured by collateral on 10 assets, with a value of £67.6 million. UK and Ireland focus The majority of our portfolio is located in the UK and Ireland, comprising 87% of our portfolio value, with 62% of the portfolio focused in Dublin, London and the South East. Sector mix We are focused on four core sectors of Office, Retail, Residential and Industrial, which make up 92% of our portfolio value. Total portfolio value (£m) £ 2,882.2 m 1. Includes hotel and leisure assets and Park Inn loan portfolio K e n n e d y Wilson Europe Re al Estate Pl c Annual Report and Ac c o unts 2 016 2
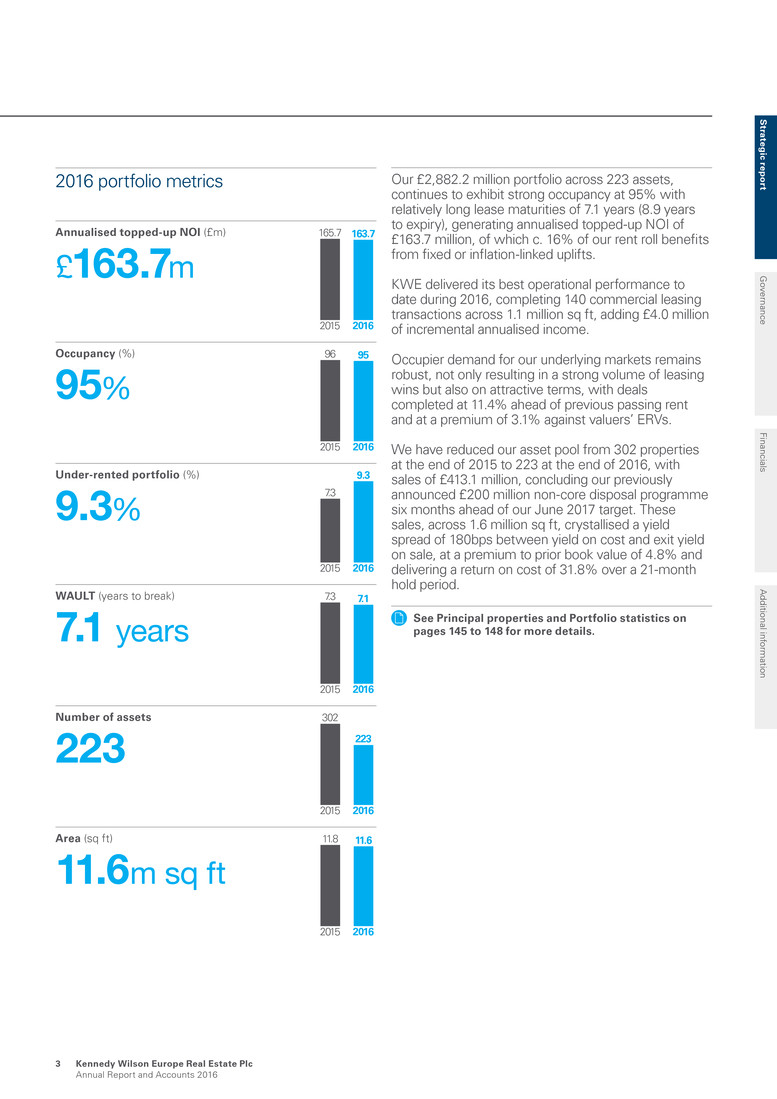
2016 portfolio metrics Annualised topped-up NOI (£m) £163.7m Occupancy (%) 95% Under-rented portfolio (%) 9.3% WAULT (years to break) 7.1 years Number of assets 223 Area (sq ft) 11.6m sq ft Our £2,882.2 million portfolio across 223 assets, continues to exhibit strong occupancy at 95% with relatively long lease maturities of 7.1 years (8.9 years to expiry), generating annualised topped-up NOI of £163.7 million, of which c. 16% of our rent roll benefits from fixed or inflation-linked uplifts. KWE delivered its best operational performance to date during 2016, completing 140 commercial leasing transactions across 1.1 million sq ft, adding £4.0 million of incremental annualised income. Occupier demand for our underlying markets remains robust, not only resulting in a strong volume of leasing wins but also on attractive terms, with deals completed at 11.4% ahead of previous passing rent and at a premium of 3.1% against valuers’ ERVs. We have reduced our asset pool from 302 properties at the end of 2015 to 223 at the end of 2016, with sales of £413.1 million, concluding our previously announced £200 million non-core disposal programme six months ahead of our June 2017 target. These sales, across 1.6 million sq ft, crystallised a yield spread of 180bps between yield on cost and exit yield on sale, at a premium to prior book value of 4.8% and delivering a return on cost of 31.8% over a 21-month hold period. See Principal properties and Portfolio statistics on pages 145 to 148 for more details. 165.7 2015 163.7 2016 96 2015 95 2016 7.3 2015 9.3 2016 7.3 2015 7.1 2016 302 2015 223 2016 11.8 2015 11.6 2016 S trateg ic rep o rt Governance Financials Additional information Kennedy Wilson Europe Real Estate Plc A n n u a l R e p o r t a n d A c c o u n t s 2016 3
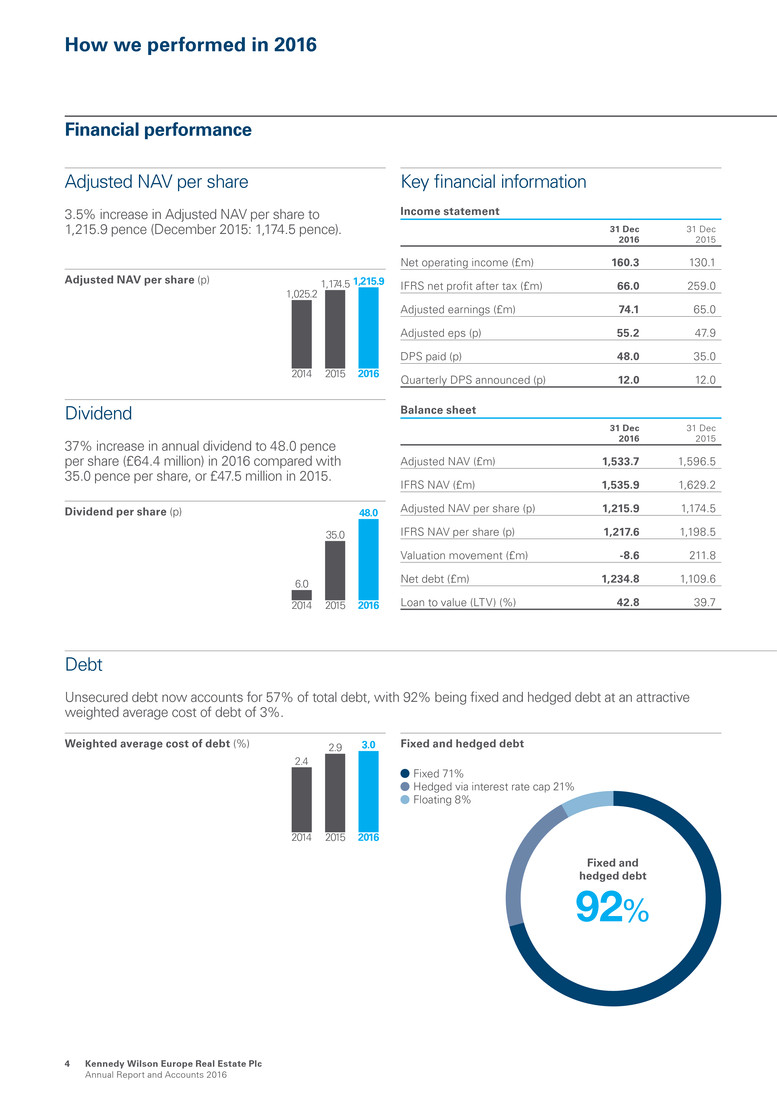
Key financial information How we performed in 2016 Fixed and hedged debt 92% Fixe d 71% Hed g e d v ia interest rate c ap 21% Flo ating 8% 1,025.2 1,174.5 1,215.9 2014 2015 2016 6.0 35.0 48.0 2014 2015 2016 2.9 3.0 2015 2.4 2014 2016 Financial performance Adjusted NAV per share 3.5% increase in Adjusted NAV per share to 1,215.9 pence (December 2015: 1,174.5 pence). Dividend 37% increase in annual dividend to 48.0 pence per share (£64.4 million) in 2016 compared with 35.0 pence per share, or £47.5 million in 2015. Income statement 31 Dec 2016 31 Dec 2015 Net operating income (£m) 160.3 130.1 IFRS net profit after tax (£m) 66.0 259.0 Adjusted earnings (£m) 74.1 65.0 Adjusted eps (p) 55.2 47.9 DPS paid (p) 48.0 35.0 Quarterly DPS announced (p) 12.0 12.0 Balance sheet 31 Dec 2016 31 Dec 2015 Adjusted NAV (£m) 1,533.7 1,596.5 IFRS NAV (£m) 1,535.9 1,629.2 Adjusted NAV per share (p) 1,215.9 1,174.5 IFRS NAV per share (p) 1,217.6 1,198.5 Valuation movement (£m) -8.6 211.8 Net debt (£m) 1,234.8 1,109.6 Loan to value (LTV) (%) 42.8 39.7 Debt Unsecured debt now accounts for 57% of total debt, with 92% being fixed and hedged debt at an attractive weighted average cost of debt of 3%. Adjusted NAV per share (p) Dividend per share (p) Weighted average cost of debt (%) Fixed and hedged debt Kennedy Wilson Europe Real Estate Plc A n n u a l R e p o r t a n d A c c o u n t s 2016 4

14.6 3.0 2.7 2.4 Residential Off_ice Industrial Retail 17 15 13 6 -2 Leisure Residential Off_ice Industrial Retail Valuation movement components Total valuation movement (£m) (8.6) Like-for-like valuation (16.6) 2016 acquisition valuation 2.6 2016 disposal valuation 5.4 Timing of total valuation movement (£m) H1 47.4 H2 (56.0) Currency of total valuation movement Euro (£m) 69.0 Sterling (£m) (77.6) Sector contributions to total valuation movement (£m) Office (30.4) Retail 5.5 Industrial (5.0) Residential 16.3 Other 5.0 Portfolio ERVs 9.2% under rented portfolio Under/(over) rented (%)1 3.7% like-for-like ERV growth Breakdown by sector (%) 1. Based on 31 December 2016 ERVs Total debt £1,691.3m Secured debt 43% Unsecured debt 57% Debt Unsecured debt now accounts for 57% of total debt, with 92% being fixed and hedged debt at an attractive weighted average cost of debt of 3%. Debt mix Unsecured debt £969.5 m Term to maturity: 7.1 years Total fixed cost: 3.5% Fixed debt: 100% Secured debt £721.8 m Term to maturity: 4.6 years Total fixed cost: 2.4% Fixed debt: 80% S trateg ic rep o rt Governance Financials Additional information Kennedy Wilson Europe Real Estate Plc Annual Report and Accounts 2016 5

111 Buckingham Palace Road, SW1, London, UK Acquired November 2014 224,120 sq ft office Detail of lamp shades in Sky Lobby Unlocking value at 111 Buckingham Palace Road 1. Bottom up investment strategy We acquired 111 BPR in November 2014, attracted to the material reversionary potential that could be visibly unlocked over the following three years, with the entire rent roll having staggered lease events over this time frame. The core Victoria location, directly over the mainline Victoria railway station and fronting Buckingham Palace Road, was attractive along with the broader regeneration of the local area. 2. Active asset & portfolio management With a low average passing rent of £47.00 psf, most of the rent roll up for rent review, and the remaining 11% expiring, this presented a substantial opportunity to drive rental uplifts. This strategy was supported by our asset repositioning plans. 3. Asset repositioning A comprehensive redevelopment of the reception, including a generous art installation, and refurbishment of the Sky Lobby completed in November 2016. The newly transformed reception now competes with any new build in the market, dramatically improving the arrival experience for all working and visiting the building. Average passing rent psf £47.00 Rent roll due for rent review 70% Unlocking value 2. Active asset & portfolio management 1. Bottom up investment strategy 3. Asset repositioning 4. Rigorous capital management Kennedy Wilson Europe Real Estate Plc Annual Report and Accounts 2016 6

Sky Lobby café Polished plaster above the escalator framed by ‘halo lighting’ Brass detail in the main reception 7 Kennedy Wilson Europe Real Estate Plc Annual Report and Accounts 2016 Meet the artist Known mainly for her suspended sculptures, Claire Morgan’s work has been exhibited in museums and galleries around the world, including Europe, the United States and Asia. Her work reflects her interest in natural processes and hanging materials, and probes elemental conditions of humans in their natural habitat. Background to the art installation The art is the centre piece of the reception, filling the volume of space. The design shows the organic movement through the reception to the escalators whilst also holding its geometric shape. Meet the architect Eric Parry, owner and founder of Eric Parry Architects, is a leader in his field and member of the Royal Academy. His practice has received more than 30 awards, and Parry himself holds an honorary doctorate from the University of Bath. A former president of the Architectural Association, Parry’s work is often enhanced by the work of accomplished artists. Background to the refurbishment The new design doubles the floor area of the reception and brings in light through both the 6m-high listed arches and 15m-high skylight. The reconfiguration also opens up the escalator space to create a calming transition- zone to the newly created Sky Lobby, which comprises a café, relaxed space and flexible work area. S trateg ic rep o rt G overnance Financials A dditional inform ation

Chair’s introduction On behalf of the Board, I am pleased to present our full-year results for 2016. The investment management team delivered significant operational wins across the portfolio, delivering its best leasing results to date; a notable achievement in a year marked by significant political and capital market turbulence. In this context, the Group delivered a solid financial performance, growing earnings and delivering on the annual dividend target. At the same time the team improved the mix of unsecured debt and extended debt maturities whilst keeping our average cost of debt low. The portfolio stands at £2,882.2 million, primarily driven by £295.9 million of acquisition and capital expenditure activity and £165.1 million in foreign exchange gain, owing to material Euro appreciation relative to Sterling. This was offset by very profitable disposal activity and a modest portfolio valuation decline of £8.6 million or only -0.3%. The team also delivered considerable development projects, achieving practical completion, on time and budget, at both Baggot Plaza, Dublin 4, which is let to Bank of Ireland for 25 years, and Block K, Central Park, Dublin 18, where 166 new PRS units were built adjacent to our existing Vantage scheme. Notably, we have already let 72% of the units in the three months to December 2016. Furthermore, the significant refurbishments completions at 111 Buckingham Palace Road, Victoria, London SW1 and Portmarnock Hotel, Co. Dublin, have transformed both properties and are expected to drive income to the bottom line. The business benefitted from active balance sheet management in the year, utilising both of KWE’s unsecured bonds, raising £318.6 million by tapping the 2025 Euro bond by €150 million and the 2022 Sterling bond by £200 million, increasing the bonds outstanding to €550 million and £500 million, respectively. Together they extended our debt maturities to 6.1 years and locked in additional fixed rate debt. “KWE reported a solid financial performance, with strong earnings growth and delivery of the annual dividend target of 48.0 pence per share. In a year marked by material political and capital market turbulence, we undertook an accretive share buyback programme and continuously assess the best use of capital to ensure efficient balance sheet management. The Board is alert that the potential for increased volatility remains high. In this context, the business is on a solid foundation to deliver attractive investor returns.“ Charlotte Valeur Chair, Kennedy Wilson Europe Real Estate Plc Kennedy Wilson Europe Real Estate Plc Annual Report and Accounts 2016 8
Along with the rest of the UK listed real estate sector, and despite strong progress across all parts of the business, we witnessed a material disconnect between KWE’s share price and the underlying business. As part of our ongoing commitment to balance sheet management, we undertook a £100 million share buyback programme, which was accretive to both earnings and NAV per share. We continue to monitor how we can best deliver sustainable total returns for shareholders and have distributed £164.4 million in 2016 through a combination of dividends and share buybacks. Results The Group delivered Adjusted NAV per share of 1,215.9 pence, up 3.5% over December 2015. Adjusted earnings per share were 55.2 pence per share (£74.1 million in total) and basic earnings per share were 49.1 pence per share (£66.0 million in total). To view the Finance review go to pages 50 to 54. Dividends Dividends of 48.0 pence per share, or £64.4 million were paid during the year, reflecting a dividend cover based on 2016 adjusted earnings of 1.1 times, and a 37% increase on the 35.0 pence per share paid in 2015. The Board announces a quarterly interim dividend of 12.0 pence per share. The quarterly dividend will be paid on 31 March 2017 to shareholders on the register at the close of business on 10 March 2017. In the context of the material disposals delivered to date, the Board is comfortable with the level of the dividend being both sustainable and offering an attractive dividend yield to shareholders of c. 5%. The Board will continue to assess the appropriate dividend pay-out on a quarterly basis. Industry achievements In March 2016, the shares of KWE became constituent members of the FTSE EPRA/NAREIT Global Real Estate Index Series and the GPR 250 Index Series. These are both important specialist indices for our investors, in addition to the FTSE 250 Index, which KWE has been a member of since 2014. The Company is a fee-paying member of EPRA, the European trade body for listed real estate securities, and follows EPRA’s Best Practice Recommendations for both operational (EPRA BPRs) and sustainability (EPRA sBPRs) reporting disclosure. In 2015, we achieved EPRA Silver and Bronze for operational and sustainable reporting disclosures respectively, and aim to further improve on this. For further details on Responsible investments go to pages 27 to 33. Outlook The investment and occupier markets across our business remain open and active, illustrated by our record-breaking leasing and disposal activity, both ahead of preceding valuations and delivering attractive returns. We expect the period of market uncertainty to persist and market volatility to potentially increase, as it remains too early to ascertain the impact of the UK’s negotiations to exit the EU and the impact that will have on the UK and the rest of Europe. The Board remains alert to both potential risks and opportunities for KWE’s business. With £539.7 million of disposals since 2015, the natural evolution away from smaller lot sizes demonstrates that our wholesale to retail strategy is working. It has not only improved the portfolio quality but also delivered solid occupancy, longer leases and attractive profits. KWE benefits from a diversified portfolio, both geographically and by sector, low capital commitments and ample liquidity to capitalise on potential opportunities. This, combined with KWE’s unique blend of debt and equity skills, strong market relationships and a wealth of experience working through market dislocations, places the business on a solid foundation. Charlotte Valeur Chair Strateg ic rep o rt G overnance Financials A dditional inform ation Kennedy Wilson Europe Real Estate Plc Annual Report and Accounts 2016 9
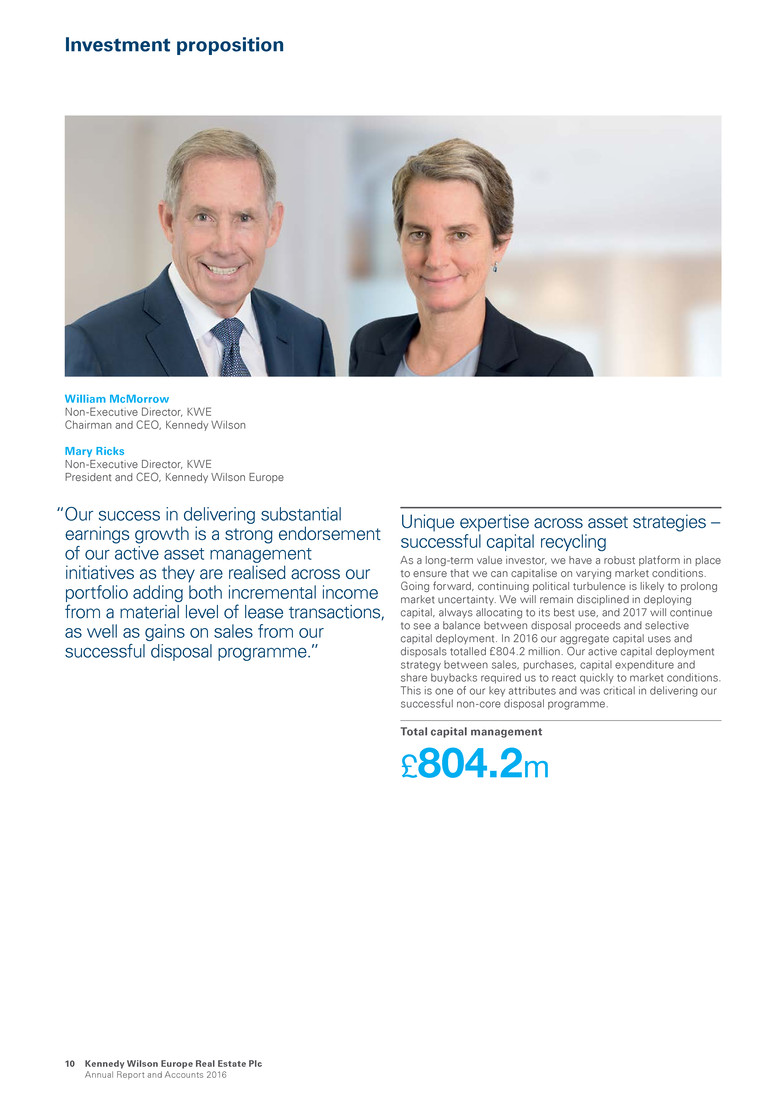
Unique expertise across asset strategies – successful capital recycling As a long-term value investor, we have a robust platform in place to ensure that we can capitalise on varying market conditions. Going forward, continuing political turbulence is likely to prolong market uncertainty. We will remain disciplined in deploying capital, always allocating to its best use, and 2017 will continue to see a balance between disposal proceeds and selective capital deployment. In 2016 our aggregate capital uses and disposals totalled £804.2 million. Our active capital deployment strategy between sales, purchases, capital expenditure and share buybacks required us to react quickly to market conditions. This is one of our key attributes and was critical in delivering our successful non-core disposal programme. Total capital management £804.2m Investment proposition “Our success in delivering substantial earnings growth is a strong endorsement of our active asset management initiatives as they are realised across our portfolio adding both incremental income from a material level of lease transactions, as well as gains on sales from our successful disposal programme.” William McMorrow Non-Executive Director, KWE Chairman and CEO, Kennedy Wilson Mary Ricks Non-Executive Director, KWE President and CEO, Kennedy Wilson Europe Kennedy Wilson Europe Real Estate Plc Annual Report and Accounts 2016 10
A track record of value creation – growing income through asset management We aim to add value at acquisition, through asset management and asset repositioning, meaning that we are not reliant on market rental growth to generate our returns. In 2016 we completed 140 commercial leases transactions, 11.4% ahead of previous passing rents and 3.1% ahead of valuers’ ERV. We delivered like-for-like ERV growth of 3.7% and like-for-like NOI growth of 3.4%. Once we have achieved our asset management, our non-core programme allows us to crystallise valuation gains. Over the year we sold 89 assets for £413.1 million at a premium to book value of 4.8% and a return on cost of 31.8%. Total return on cost on disposals 31.8% Financial flexibility to implement our strategy We aim for an efficient mix of equity and debt to support our returns without taking undue risk. Over the year we have shown our commitment to our unsecured debt strategy by tapping both our Euro 2025 and Sterling 2022 notes, raising £391.6 million and further locking in fixed rate debt. Our unsecured debt is now 57% of our total debt. Our term to maturity is a comfortable 6.1 years and our financing capacity sits at £681.5 million, giving us ample liquidity to be able to react to potential market opportunities that may arise in 2017. Total liquidity £681.5m Delivering strong returns for shareholders – diversified cash flows underpin dividends Our total return model rewards investors through a secure income base that is poised for future growth. In 2016 we delivered on our 48.0 pence per share dividend target, up 37.1% over 2015’s 35.0 pence per share. The 2016 dividend contributed 4.1% to our 7.6% total accounting return over the year. In addition, we undertook a £100 million share buyback, returning a total of £164.4 million to shareholders. The share buyback was accretive to both NAV per share and earnings per share, enhancing the NAV per share movement in 2016 by 1.2% and we expect the pro forma annualised earnings per share growth to be 7.8%. Capital returned to shareholders in 2016 £164.4m Incentivised to deliver for shareholders KW owns 23.6% of KWE, which is its largest single investment. With 50% of the investment manager fee paid in shares, KW is highly incentivised to deliver value over the long term, to the benefit of all shareholders. Payment of Investment Manager fee in shares 50.0% Strateg ic rep o rt G overnance Financials A dditional inform ation Kennedy Wilson Europe Real Estate Plc Annual Report and Accounts 2016 11
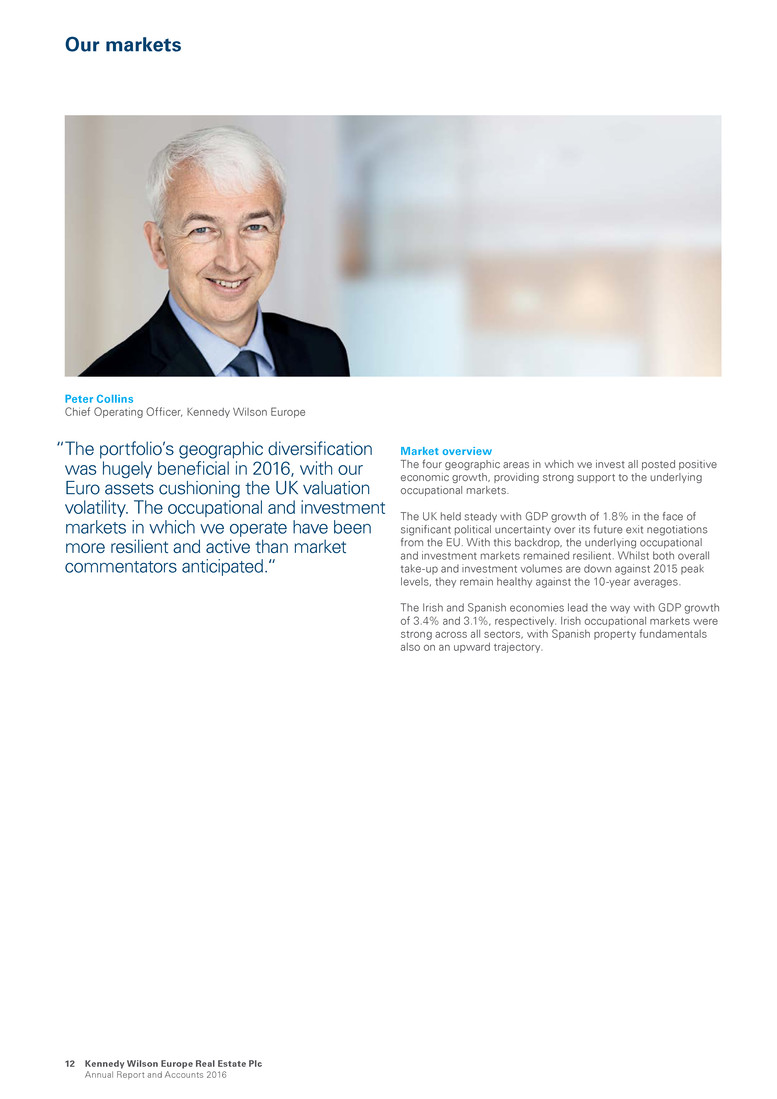
Our markets Market overview The four geographic areas in which we invest all posted positive economic growth, providing strong support to the underlying occupational markets. The UK held steady with GDP growth of 1.8% in the face of significant political uncertainty over its future exit negotiations from the EU. With this backdrop, the underlying occupational and investment markets remained resilient. Whilst both overall take-up and investment volumes are down against 2015 peak levels, they remain healthy against the 10-year averages. The Irish and Spanish economies lead the way with GDP growth of 3.4% and 3.1%, respectively. Irish occupational markets were strong across all sectors, with Spanish property fundamentals also on an upward trajectory. “The portfolio’s geographic diversification was hugely beneficial in 2016, with our Euro assets cushioning the UK valuation volatility. The occupational and investment markets in which we operate have been more resilient and active than market commentators anticipated.“ Peter Collins Chief Operating Officer, Kennedy Wilson Europe Kennedy Wilson Europe Real Estate Plc Annual Report and Accounts 2016 12
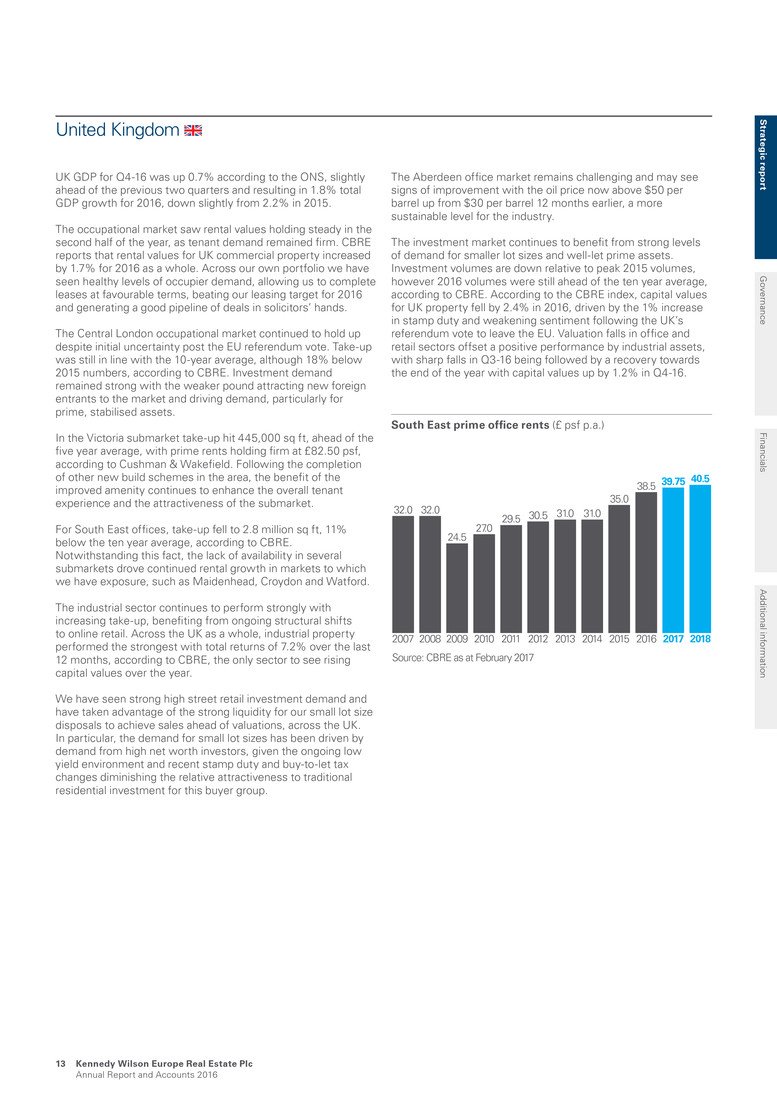
UK GDP for Q4-16 was up 0.7% according to the ONS, slightly ahead of the previous two quarters and resulting in 1.8% total GDP growth for 2016, down slightly from 2.2% in 2015. The occupational market saw rental values holding steady in the second half of the year, as tenant demand remained firm. CBRE reports that rental values for UK commercial property increased by 1.7% for 2016 as a whole. Across our own portfolio we have seen healthy levels of occupier demand, allowing us to complete leases at favourable terms, beating our leasing target for 2016 and generating a good pipeline of deals in solicitors’ hands. The Central London occupational market continued to hold up despite initial uncertainty post the EU referendum vote. Take-up was still in line with the 10-year average, although 18% below 2015 numbers, according to CBRE. Investment demand remained strong with the weaker pound attracting new foreign entrants to the market and driving demand, particularly for prime, stabilised assets. In the Victoria submarket take-up hit 445,000 sq ft, ahead of the five year average, with prime rents holding firm at £82.50 psf, according to Cushman & Wakefield. Following the completion of other new build schemes in the area, the benefit of the improved amenity continues to enhance the overall tenant experience and the attractiveness of the submarket. For South East offices, take-up fell to 2.8 million sq ft, 11% below the ten year average, according to CBRE. Notwithstanding this fact, the lack of availability in several submarkets drove continued rental growth in markets to which we have exposure, such as Maidenhead, Croydon and Watford. The industrial sector continues to perform strongly with increasing take-up, benefiting from ongoing structural shifts to online retail. Across the UK as a whole, industrial property performed the strongest with total returns of 7.2% over the last 12 months, according to CBRE, the only sector to see rising capital values over the year. We have seen strong high street retail investment demand and have taken advantage of the strong liquidity for our small lot size disposals to achieve sales ahead of valuations, across the UK. In particular, the demand for small lot sizes has been driven by demand from high net worth investors, given the ongoing low yield environment and recent stamp duty and buy-to-let tax changes diminishing the relative attractiveness to traditional residential investment for this buyer group. The Aberdeen office market remains challenging and may see signs of improvement with the oil price now above $50 per barrel up from $30 per barrel 12 months earlier, a more sustainable level for the industry. The investment market continues to benefit from strong levels of demand for smaller lot sizes and well-let prime assets. Investment volumes are down relative to peak 2015 volumes, however 2016 volumes were still ahead of the ten year average, according to CBRE. According to the CBRE index, capital values for UK property fell by 2.4% in 2016, driven by the 1% increase in stamp duty and weakening sentiment following the UK’s referendum vote to leave the EU. Valuation falls in office and retail sectors offset a positive performance by industrial assets, with sharp falls in Q3-16 being followed by a recovery towards the end of the year with capital values up by 1.2% in Q4-16. South East prime office rents (£ psf p.a.) 32.0 32.0 24.5 27.0 29.5 30.5 31.0 31.0 38.5 35.0 39.75 40.5 2007 Source: CBRE as at February 2017 2008 2009 2010 2011 2012 2013 2014 20162015 2017 2018 United Kingdom Strategic report Governance Financials Additional information K e n n e d y W i l s o n E u r o p e R e a l E s t a t e P l c A n nual Report and Accounts 2016 13

Ireland The Irish economy continues to outperform, with unemployment down to 7.2% at the end of the year and with employment numbers pushing past the two million mark for the first time since 2009, according to the Central Statistics Office. This has supported consumer spending, with retail sales up 3.4% year-on-year to December 2016. This has led to retailer expansions and new entrants in the market, according to CBRE, and we expect our shopping centres to benefit from this in due course. Across the hotel market, ADR and RevPAR metrics are up significantly, according to CBRE, and we expect Portmarnock Hotel and Golf Links to benefit now that the works are complete – its award as 2016 Irish Golf Resort of the Year is a very positive early win, given the importance of tour operators in this market. Property investment volumes were up a healthy 29% year-on-year to €4.5 billion, according to CBRE. It is worth noting that almost one-third of the improvement was owing to Blanchardstown and Liffey Valley shopping centres, which are positive endorsements to the institutional interest from new entrants to the market. Year-on-year Dublin office take-up was 2.6 million sq ft, nearly on par with 2015, according to CBRE, and the Dublin city centre vacancy rate reduced to 4.7%. Prime rents ended the year at €62.50 psf, up 14% year-on-year, according to CBRE, with prime office yields at 4.65%. This bodes well for our under-rented Dublin CBD office portfolio, where average passing rents are €40.65 psf and average ERVs are €47.50 psf. The Dublin suburban office market represented almost one- quarter of all take-up in 2016, with nearly three-quarters of the Q4-16 suburban leasing activity focused on the South suburbs, according to CBRE. Prime rents are now €27.50 psf, significantly in excess of our average South Dublin suburban office passing rents of €17.35 psf. Our portfolio remains reversionary, with ERVs at €24.35 psf. 40/42 Mespil Road, Dublin 4 Part of Opera portfolio Acquired June 2014 118,000 sq ft city centre office Dublin is expected to benefit from potential job relocations from companies seeking to realign their geographic footprint after the EU referendum. A number of UK-based financial services firms have already announced that they have either settled on Dublin as their new EU base, or are seriously considering it. The PRS market performed well throughout the year, and we benefited from continued growth at both Vantage (including Block K) and Liffey Trust. In December 2016, the Irish Government imposed a 4% rental cap on ‘rent pressure zones’ for a period of three years. This relates to areas where rents have increased 7% or more in four of the last six quarters and in the first instance impacts the Dublin market. Our recently developed Block K units, at Vantage are exempt from this rental cap, as will be any existing unit which has undergone substantial refurbishment. Dublin prime office rents (£ psf p.a.) 63.0 58.0 35.0 32.0 30.0 27.0 35.0 45.0 62.5 55.0 64.0 67.0 2007 Source: Historical data as per CBRE as at February 2017. Forecasts as per Savills as at February 2017 2008 2009 2010 2011 2012 2013 2014 20162015 2017 2018 Our markets continued K e n n e d y W i l s o n E u r o p e R e a l E s t a t e P l c A n nual Report and Accounts 2016 14
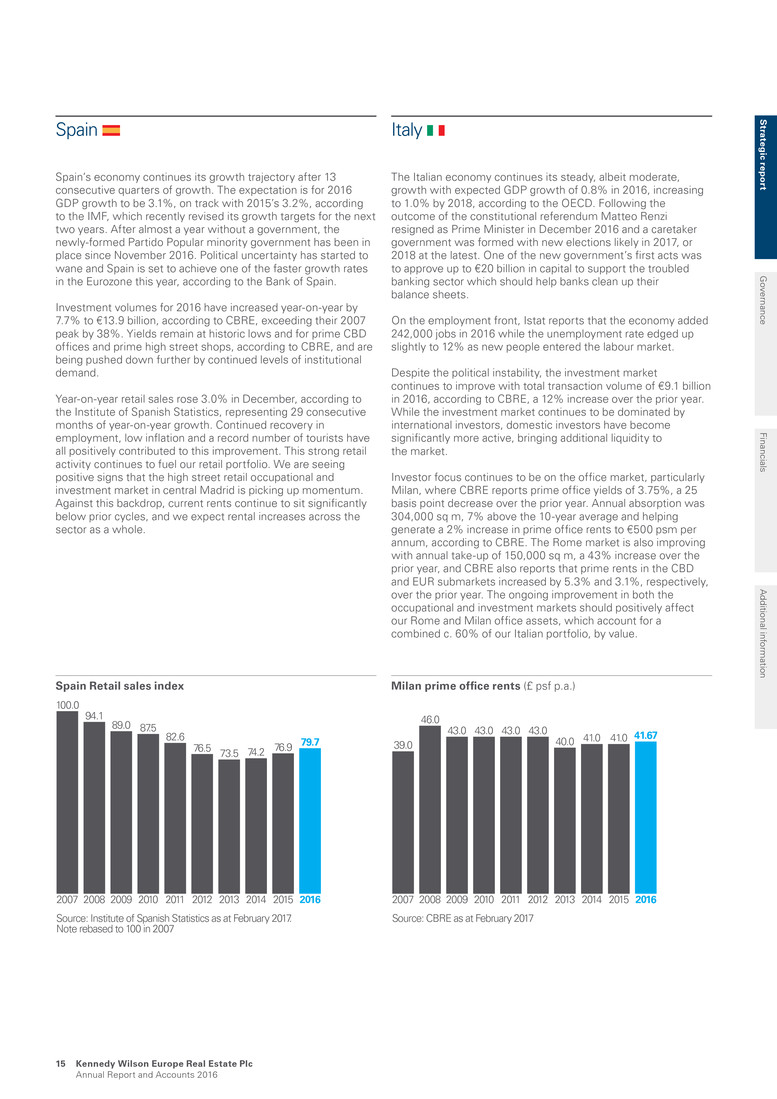
Spain Spain’s economy continues its growth trajectory after 13 consecutive quarters of growth. The expectation is for 2016 GDP growth to be 3.1%, on track with 2015’s 3.2%, according to the IMF, which recently revised its growth targets for the next two years. After almost a year without a government, the newly-formed Partido Popular minority government has been in place since November 2016. Political uncertainty has started to wane and Spain is set to achieve one of the faster growth rates in the Eurozone this year, according to the Bank of Spain. Investment volumes for 2016 have increased year-on-year by 7.7% to €13.9 billion, according to CBRE, exceeding their 2007 peak by 38%. Yields remain at historic lows and for prime CBD offices and prime high street shops, according to CBRE, and are being pushed down further by continued levels of institutional demand. Year-on-year retail sales rose 3.0% in December, according to the Institute of Spanish Statistics, representing 29 consecutive months of year-on-year growth. Continued recovery in employment, low inflation and a record number of tourists have all positively contributed to this improvement. This strong retail activity continues to fuel our retail portfolio. We are seeing positive signs that the high street retail occupational and investment market in central Madrid is picking up momentum. Against this backdrop, current rents continue to sit significantly below prior cycles, and we expect rental increases across the sector as a whole. Spain Retail sales index 100.0 94.1 89.0 87.5 82.6 76.5 73.5 74.2 79.776.9 2007 Source: Institute of Spanish Statistics as at February 2017. Note rebased to 100 in 2007 2008 2009 2010 2011 2012 2013 2014 20162015 Italy The Italian economy continues its steady, albeit moderate, growth with expected GDP growth of 0.8% in 2016, increasing to 1.0% by 2018, according to the OECD. Following the outcome of the constitutional referendum Matteo Renzi resigned as Prime Minister in December 2016 and a caretaker government was formed with new elections likely in 2017, or 2018 at the latest. One of the new government’s first acts was to approve up to €20 billion in capital to support the troubled banking sector which should help banks clean up their balance sheets. On the employment front, Istat reports that the economy added 242,000 jobs in 2016 while the unemployment rate edged up slightly to 12% as new people entered the labour market. Despite the political instability, the investment market continues to improve with total transaction volume of €9.1 billion in 2016, according to CBRE, a 12% increase over the prior year. While the investment market continues to be dominated by international investors, domestic investors have become significantly more active, bringing additional liquidity to the market. Investor focus continues to be on the office market, particularly Milan, where CBRE reports prime office yields of 3.75%, a 25 basis point decrease over the prior year. Annual absorption was 304,000 sq m, 7% above the 10-year average and helping generate a 2% increase in prime office rents to €500 psm per annum, according to CBRE. The Rome market is also improving with annual take-up of 150,000 sq m, a 43% increase over the prior year, and CBRE also reports that prime rents in the CBD and EUR submarkets increased by 5.3% and 3.1%, respectively, over the prior year. The ongoing improvement in both the occupational and investment markets should positively affect our Rome and Milan office assets, which account for a combined c. 60% of our Italian portfolio, by value. Milan prime office rents (£ psf p.a.) 39.0 46.0 43.0 43.0 43.0 43.0 40.0 41.0 41.6741.0 2007 Source: CBRE as at February 2017 2008 2009 2010 2011 2012 2013 2014 20162015 Strategic report Governance Financials Additional information K e n n e d y W i l s o n E u r o p e R e a l E s t a t e P l c Annual Report and Accounts 2016 15

Our business model Real estate operators Expert local presence Debt and equity synergies Excellent relationships Strong pricing discipline Unlocking value 2. Active asset & portfolio management 1. Bottom up investment strategy 3. Asset repositioning 4. Rigorous capital management Kennedy Wilson Europe Real Estate Plc Annual Report and Accounts 2016 16 Financial Equity provided by our shareholders, debt provided by our unsecured and secured stakeholders and ongoing retained profits from operations. Intellectual The Investment Manager’s deep understanding of our markets and its specialist approach to due diligence, development, asset and portfolio management. Human The Investment Manager’s team of equity, debt, property and finance specialists. Social/relationships The Investment Manager’s extensive relationships with financial institutions and other real estate owners, and its close ties with contractors, planners, councils, consultants and its end occupier customers property and finance specialists. Investors Accretive acquisitions along with existing portfolio providing secure and growing income, underpinning dividends, value enhancing projects and ongoing recycling to crystallising profits on disposals. See Resources and relationships page 24. Occupiers High quality commercial and residential property, meeting their space requirements, business and personal needs. Communities Working with communities in proximity to our major assets. See Social responsibility on page 29. KW Employees Interesting and challenging careers in a growing and successful business. Suppliers Potential to grow their business through a mutually beneficial long-term partnership. Key inputs How we unlock value Value we create for stakeholders
KWE unlocks the value of real estate that has been under- managed or under-capitalised by its previous owners. We use our strong balance sheet to acquire assets, which we source through our excellent relationships with financial institutions, administrators and other vendors who are not natural real estate operators. We then use our asset management and development skills to release each asset’s inherent value, for the benefit of all our stakeholders. The key components of our business model are described below. How we unlock value Our aims We generate sustainable total returns by unlocking the inherent value of under-resourced real estate. 1. Bottom up invstment strategy We apply a bottom up approach to underwriting each asset we acquire, believing value can be found and enhanced in a variety of market conditions. 2. Active asset and portfolio management We aim to bring practical solutions to our occupiers, to meet their evolving space needs, also allowing us to grow the quantum and duration of our income. 3. Asset repositioning Many of our properties offer repositioning opportunities where we can undertake development and refurbishment to transform the property to meaningfully improve rents and capital values. 4. Rigorous capital management We endeavour to keep our balance sheet efficient and ensure adequate flexibility to support our real estate strategy. The components Real estate operators Asset management sits at the heart of our value creation. During due diligence we produce a business plan for every asset, so the asset management team can start implementing actions on day one. An experienced in-house development team also helps to generate new thinking about the best way to develop an asset. KWE has permanent capital, so we can take a long-term view of each asset’s potential. An asset that is currently a core part of our portfolio may present asset management or development opportunities in several years’ time. We will also dispose of assets, for example where we have completed our value enhancement initiatives, so we can recycle the proceeds into other opportunities. Expert local presence Having expert people located in each of our markets is crucial for capitalising on local opportunities. We continue to grow to support our business and the wider KW team has grown to over 90 employees, comprising asset managers, investment specialists, and finance and operations, located in the UK, Ireland, Spain, Jersey and Luxembourg. This local expert knowledge and presence ensures we take a bottom-up approach to investment and asset management, and gives us the infrastructure to execute large portfolio transactions. Strong pricing discipline Our distinctive investment strategy opens up a wide range of opportunities for us, meaning we can be highly selective about the ones we pursue and can exercise strong risk-return pricing discipline. We apply the KW team’s expertise and resources to perform detailed due diligence on everything we buy, whether it is a single asset or a large portfolio. This means we develop a deep understanding of what we are acquiring and the value we can add to it, enabling us to determine the appropriate price. This differentiates us from private equity firms, who are amongst our main competitors for the portfolios we acquire. Excellent relationships The Investment Manager and its advisors have excellent, strong relationships with financial institutions, as well as other potential sellers of under-resourced assets such as government agencies, commercial real estate lenders, receivers, REITs and property funds. These relationships give us a critical advantage in sourcing attractive investment opportunities, either off-market or with limited competition. Our ability to expeditiously complete transactions encourages vendors to transact with us and leads to repeat deal flow. Debt and equity synergies The Investment Manager and its advisors employ debt and equity professionals who work seamlessly together. Uniquely among our listed peers, this allows us to invest in both direct real estate and loans, and to carefully assess the quality of both the debt and the underlying property asset before making a purchasing decision. Acquiring debt at a discount to its market value gives us control of the underlying asset. We can then execute asset management strategies that create further value for our shareholders. Our business structure Being externally managed has a number of advantages for us. In particular, we have access to the experience and relationships of KW’s senior management and to the expertise of KW’s substantial wider team in Europe, at a cost to us that is substantially less then employing those resources in-house. Our business platform also benefits from the Investment Manager’s robust systems and processes, which it continues to enhance, and from our strong corporate governance, which ensures we meet our compliance, regulatory and filing requirements in each of the jurisdictions we operate in. See Resources and relationships, page 24 and Leadership, pages 62 to 66. S trateg ic rep o rt G overnance Financials A dditional inform ation Kennedy Wilson Europe Real Estate Plc Annual Report and Accounts 2016 17
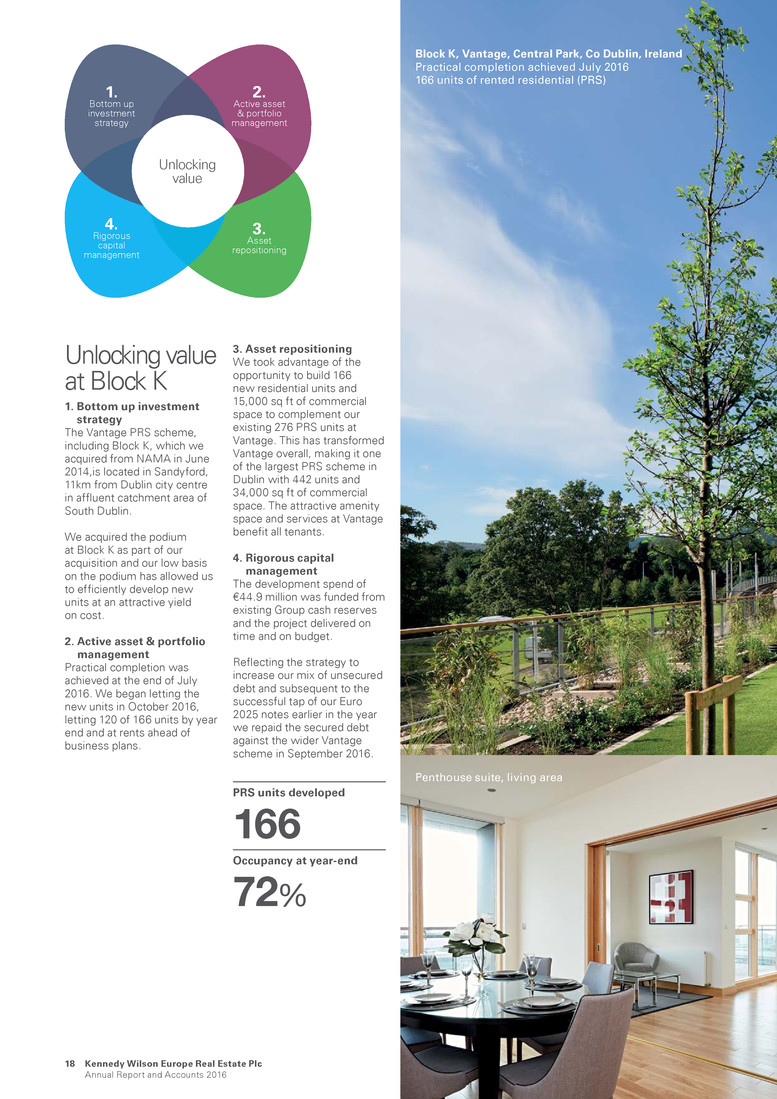
Unlocking value 2. Active asset & portfolio management 1. Bottom up investment strategy 3. Asset repositioning 4. Rigorous capital management Penthouse suite, living area Block K, Vantage, Central Park, Co Dublin, Ireland Practical completion achieved July 2016 166 units of rented residential (PRS) Unlocking value at Block K 1. Bottom up investment strategy The Vantage PRS scheme, including Block K, which we acquired from NAMA in June 2014,is located in Sandyford, 11km from Dublin city centre in affluent catchment area of South Dublin. We acquired the podium at Block K as part of our acquisition and our low basis on the podium has allowed us to efficiently develop new units at an attractive yield on cost. 2. Active asset & portfolio management Practical completion was achieved at the end of July 2016. We began letting the new units in October 2016, letting 120 of 166 units by year end and at rents ahead of business plans. 3. Asset repositioning We took advantage of the opportunity to build 166 new residential units and 15,000 sq ft of commercial space to complement our existing 276 PRS units at Vantage. This has transformed Vantage overall, making it one of the largest PRS scheme in Dublin with 442 units and 34,000 sq ft of commercial space. The attractive amenity space and services at Vantage benefit all tenants. 4. Rigorous capital management The development spend of €44.9 million was funded from existing Group cash reserves and the project delivered on time and on budget. Reflecting the strategy to increase our mix of unsecured debt and subsequent to the successful tap of our Euro 2025 notes earlier in the year we repaid the secured debt against the wider Vantage scheme in September 2016. PRS units developed 166 Occupancy at year-end 72% Kennedy Wilson Europe Real Estate Plc Annual Report and Accounts 2016 18

Tenant amenity loungePenthouse suite bedroom S trateg ic rep o rt G overnance Financials A dditional inform ation Kennedy Wilson Europe Real Estate Plc Annual Report and Accounts 2016 19
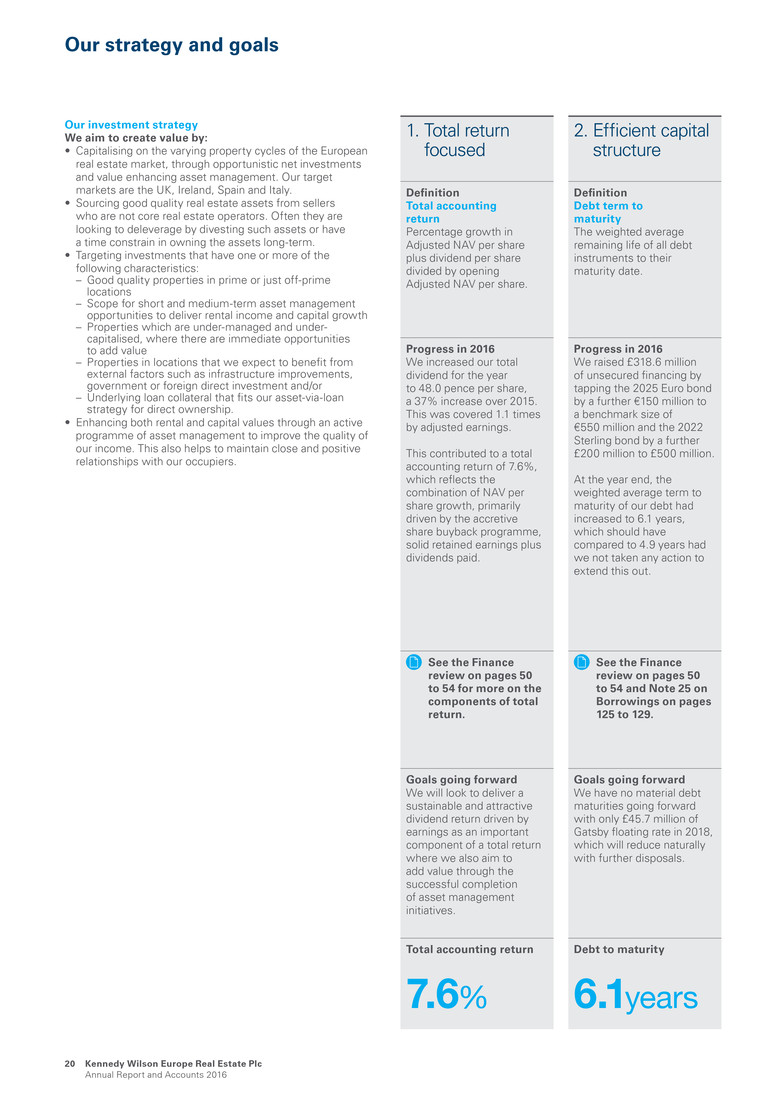
1. Total return focused Definition Total accounting return Percentage growth in Adjusted NAV per share plus dividend per share divided by opening Adjusted NAV per share. Progress in 2016 We increased our total dividend for the year to 48.0 pence per share, a 37% increase over 2015. This was covered 1.1 times by adjusted earnings. This contributed to a total accounting return of 7.6%, which reflects the combination of NAV per share growth, primarily driven by the accretive share buyback programme, solid retained earnings plus dividends paid. See the Finance review on pages 50 to 54 for more on the components of total return. Goals going forward We will look to deliver a sustainable and attractive dividend return driven by earnings as an important component of a total return where we also aim to add value through the successful completion of asset management initiatives. Total accounting return 7.6% 2. Efficient capital structure Definition Debt term to maturity The weighted average remaining life of all debt instruments to their maturity date. Progress in 2016 We raised £318.6 million of unsecured financing by tapping the 2025 Euro bond by a further €150 million to a benchmark size of €550 million and the 2022 Sterling bond by a further £200 million to £500 million. At the year end, the weighted average term to maturity of our debt had increased to 6.1 years, which should have compared to 4.9 years had we not taken any action to extend this out. See the Finance review on pages 50 to 54 and Note 25 on Borrowings on pages 125 to 129. Goals going forward We have no material debt maturities going forward with only £45.7 million of Gatsby floating rate in 2018, which will reduce naturally with further disposals. Debt to maturity 6.1years Our investment strategy We aim to create value by: • Capitalising on the varying property cycles of the European real estate market, through opportunistic net investments and value enhancing asset management. Our target markets are the UK, Ireland, Spain and Italy. • Sourcing good quality real estate assets from sellers who are not core real estate operators. Often they are looking to deleverage by divesting such assets or have a time constrain in owning the assets long-term. • Targeting investments that have one or more of the following characteristics: – Good quality properties in prime or just off-prime locations – Scope for short and medium-term asset management opportunities to deliver rental income and capital growth – Properties which are under-managed and under- capitalised, where there are immediate opportunities to add value – Properties in locations that we expect to benefit from external factors such as infrastructure improvements, government or foreign direct investment and/or – Underlying loan collateral that fits our asset-via-loan strategy for direct ownership. • Enhancing both rental and capital values through an active programme of asset management to improve the quality of our income. This also helps to maintain close and positive relationships with our occupiers. Our strategy and goals Kennedy Wilson Europe Real Estate Plc Annual Report and Accounts 2016 20
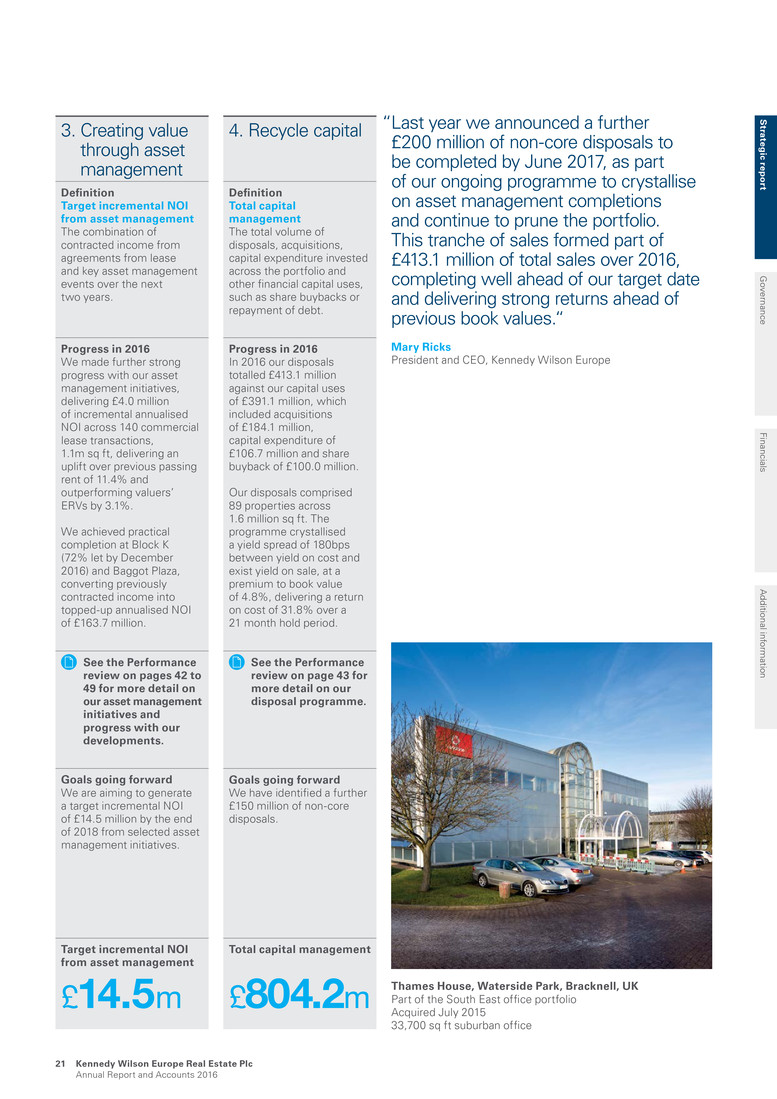
3. Creating value through asset management Definition Target incremental NOI from asset management The combination of contracted income from agreements from lease and key asset management events over the next two years. Progress in 2016 We made further strong progress with our asset management initiatives, delivering £4.0 million of incremental annualised NOI across 140 commercial lease transactions, 1.1m sq ft, delivering an uplift over previous passing rent of 11.4% and outperforming valuers’ ERVs by 3.1%. We achieved practical completion at Block K (72% let by December 2016) and Baggot Plaza, converting previously contracted income into topped-up annualised NOI of £163.7 million. See the Performance review on pages 42 to 49 for more detail on our asset management initiatives and progress with our developments. Goals going forward We are aiming to generate a target incremental NOI of £14.5 million by the end of 2018 from selected asset management initiatives. Target incremental NOI from asset management £14.5m 4. Recycle capital Definition Total capital management The total volume of disposals, acquisitions, capital expenditure invested across the portfolio and other financial capital uses, such as share buybacks or repayment of debt. Progress in 2016 In 2016 our disposals totalled £413.1 million against our capital uses of £391.1 million, which included acquisitions of £184.1 million, capital expenditure of £106.7 million and share buyback of £100.0 million. Our disposals comprised 89 properties across 1.6 million sq ft. The programme crystallised a yield spread of 180bps between yield on cost and exist yield on sale, at a premium to book value of 4.8%, delivering a return on cost of 31.8% over a 21 month hold period. See the Performance review on page 43 for more detail on our disposal programme. Goals going forward We have identified a further £150 million of non-core disposals. Total capital management £804.2m Thames House, Waterside Park, Bracknell, UKPart of the South East office portfolio Acquired July 2015 33,700 sq ft suburban office “Last year we announced a further £200 million of non-core disposals to be completed by June 2017, as part of our ongoing programme to crystallise on asset management completions and continue to prune the portfolio. This tranche of sales formed part of £413.1 million of total sales over 2016, completing well ahead of our target date and delivering strong returns ahead of previous book values.“ Mary Ricks President and CEO, Kennedy Wilson Europe S trateg ic rep o rt G overnance Financials A dditional inform ation Kennedy Wilson Europe Real Estate Plc Annual Report and Accounts 2016 21

We use the following financial and non-financial metrics to track the implementation of our strategy and our operational and financial performance. Bartley Wood Business Park, Hook, UK Part of the South East office portfolio Acquired July 2015 113,672 sq ft suburban office Yield on cost Definition The estimated annual NOI at the date of purchase divided by the purchase price using actual purchaser’s costs. Exit yield on sale Definition The estimated annual NOI at the date of sale divided by the sale price using seller’s costs. Link to business model Shows our ability to source assets at attractive entry points. Links to business model: Performance in 2016 We sold £413.1 million across 89 properties, crystallising a yield spread of 180bps when comparing the yield on cost of 7.6% versus the exit yield of 5.8%. Sales generating £104 million of total return and an attractive return on cost of 31.8%. Measures 180bps Yield spread between YOC and exit yield 5.8% Exit yield on 2016 sales KPIs, Group and EPRA measures Kennedy Wilson Europe Real Estate Plc Annual Report and Accounts 2016 22
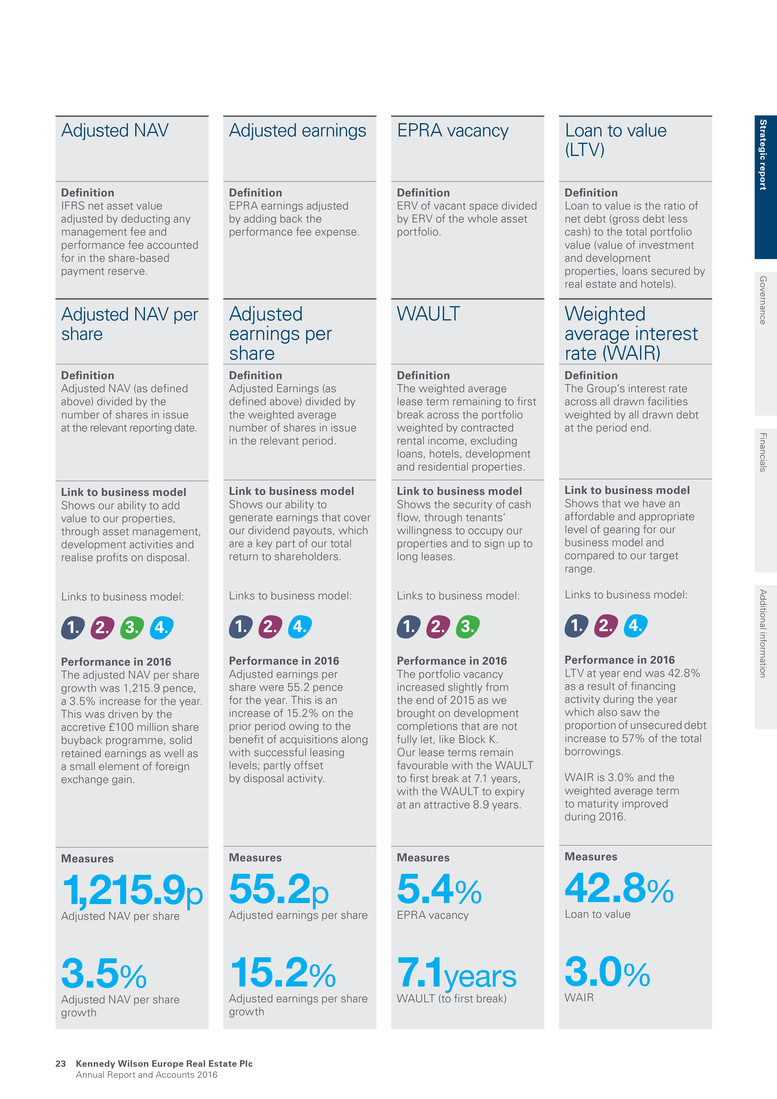
Adjusted NAV Definition IFRS net asset value adjusted by deducting any management fee and performance fee accounted for in the share-based payment reserve. Adjusted NAV per share Definition Adjusted NAV (as defined above) divided by the number of shares in issue at the relevant reporting date. Link to business model Shows our ability to add value to our properties, through asset management, development activities and realise profits on disposal. Links to business model: Performance in 2016 The adjusted NAV per share growth was 1,215.9 pence, a 3.5% increase for the year. This was driven by the accretive £100 million share buyback programme, solid retained earnings as well as a small element of foreign exchange gain. Measures 1,215.9p Adjusted NAV per share 3.5% Adjusted NAV per share growth Adjusted earnings Definition EPRA earnings adjusted by adding back the performance fee expense. Adjusted earnings per share Definition Adjusted Earnings (as defined above) divided by the weighted average number of shares in issue in the relevant period. Link to business model Shows our ability to generate earnings that cover our dividend payouts, which are a key part of our total return to shareholders. Links to business model: Performance in 2016 Adjusted earnings per share were 55.2 pence for the year. This is an increase of 15.2% on the prior period owing to the benefit of acquisitions along with successful leasing levels; partly offset by disposal activity. Measures 55.2p Adjusted earnings per share 15.2% Adjusted earnings per share growth EPRA vacancy Definition ERV of vacant space divided by ERV of the whole asset portfolio. WAULT Definition The weighted average lease term remaining to first break across the portfolio weighted by contracted rental income, excluding loans, hotels, development and residential properties. Link to business model Shows the security of cash flow, through tenants’ willingness to occupy our properties and to sign up to long leases. Links to business model: Performance in 2016 The portfolio vacancy increased slightly from the end of 2015 as we brought on development completions that are not fully let, like Block K. Our lease terms remain favourable with the WAULT to first break at 7.1 years, with the WAULT to expiry at an attractive 8.9 years. Measures 5.4% EPRA vacancy 7.1years WAULT (to first break) Loan to value (LTV) Definition Loan to value is the ratio of net debt (gross debt less cash) to the total portfolio value (value of investment and development properties, loans secured by real estate and hotels). Weighted average interest rate (WAIR) Definition The Group’s interest rate across all drawn facilities weighted by all drawn debt at the period end. Link to business model Shows that we have an affordable and appropriate level of gearing for our business model and compared to our target range. Links to business model: Performance in 2016 LTV at year end was 42.8% as a result of financing activity during the year which also saw the proportion of unsecured debt increase to 57% of the total borrowings. WAIR is 3.0% and the weighted average term to maturity improved during 2016. Measures 42.8% Loan to value 3.0% WAIR S trateg ic rep o rt G overnance Financials A dditional inform ation Kennedy Wilson Europe Real Estate Plc Annual Report and Accounts 2016 23
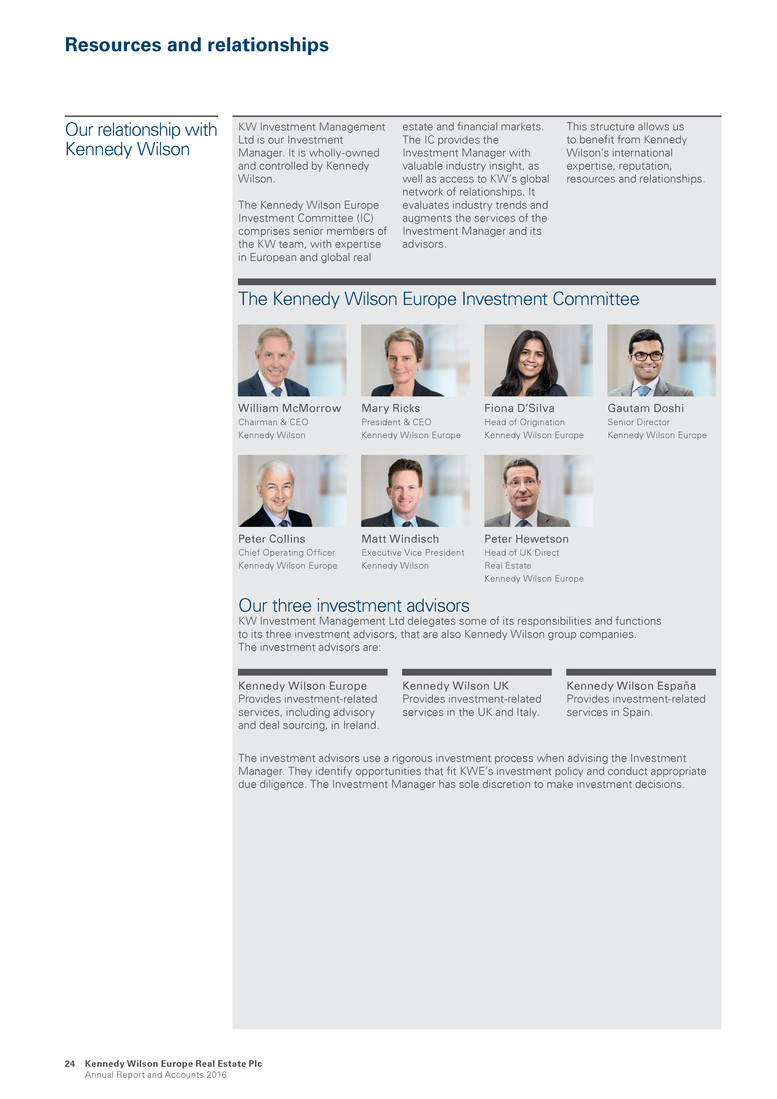
Resources and relationships Our relationship with Kennedy Wilson KW Investment Management Ltd is our Investment Manager. It is wholly-owned and controlled by Kennedy Wilson. The Kennedy Wilson Europe Investment Committee (IC) comprises senior members of the KW team, with expertise in European and global real estate and financial markets. The IC provides the Investment Manager with valuable industry insight, as well as access to KW’s global network of relationships. It evaluates industry trends and augments the services of the Investment Manager and its advisors. This structure allows us to benefit from Kennedy Wilson’s international expertise, reputation, resources and relationships. Kennedy Wilson Europe Provides investment-related services, including advisory and deal sourcing, in Ireland. Kennedy Wilson UK Provides investment-related services in the UK and Italy. Kennedy Wilson España Provides investment-related services in Spain. The Kennedy Wilson Europe Investment Committee William McMorrow Chairman & CEO Kennedy Wilson Mary Ricks President & CEO Kennedy Wilson Europe Fiona D’Silva Head of Origination Kennedy Wilson Europe Gautam Doshi Senior Director Kennedy Wilson Europe Peter Collins Chief Operating Officer Kennedy Wilson Europe Matt Windisch Executive Vice President Kennedy Wilson Peter Hewetson Head of UK Direct Real Estate Kennedy Wilson Europe Our three investment advisors KW Investment Management Ltd delegates some of its responsibilities and functions to its three investment advisors, that are also Kennedy Wilson group companies. The investment advisors are: The investment advisors use a rigorous investment process when advising the Investment Manager. They identify opportunities that fit KWE’s investment policy and conduct appropriate due diligence. The Investment Manager has sole discretion to make investment decisions. Kennedy Wilson Europe Real Estate Plc Annual Report and Accounts 2016 24

Supported by KW’s team culture KW’s strong team culture ensures that the team’s broad and complementary skill sets in equity, debt and real estate all work towards delivering total shareholder return for KWE. This enables the KW team to capitalise on numerous investment opportunities across all facets of the real estate market. KW’s track record in Europe and its reputation as a reliable counterparty that closes deals quickly strengthens the Investment Manager’s sourcing ability and puts KWE in a strong position to capitalise on opportunities as appropriate. As KWE’s portfolio has grown, we have benefited from KW expanding its European management and advisory team. This has increased from around 50 people at the time of the IPO in February 2014 to over 90 at the year end, with senior local managers representing each part of the business. These professionals further strengthen KW’s local contacts with agents, brokers, joint venture partners, private equity participants and vendors. Orion Business Park, Ipswich, UK Acquired November 2016 203,370 sq ft industrial park S trateg ic rep o rt G overnance Financials A dditional inform ation Kennedy Wilson Europe Real Estate Plc Annual Report and Accounts 2016 25
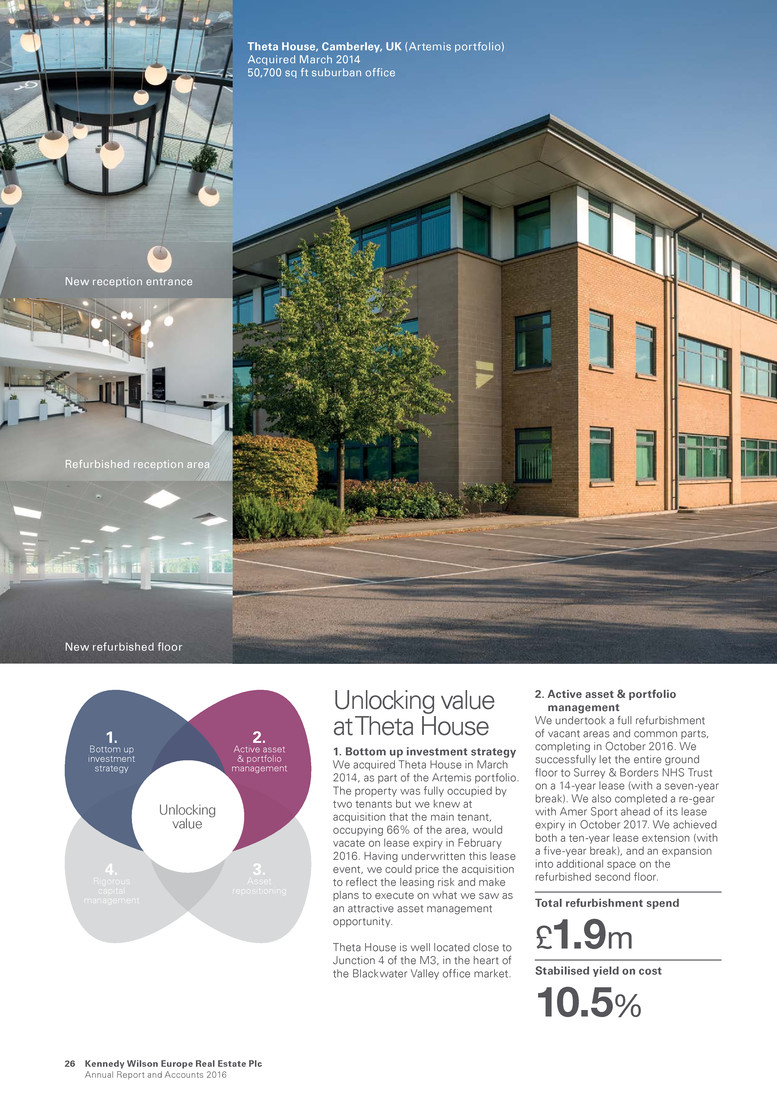
Kennedy Wilson Europe Real Estate Plc Annual Report and Accounts 2016 26 New refurbished floor Refurbished reception area New reception entrance Theta House, Camberley, UK (Artemis portfolio) Acquired March 2014 50,700 sq ft suburban office Unlocking value 2. Active asset & portfolio management 1. Bottom up investment strategy 3. Asset repositioning 4. Rigorous capital management Unlocking value at Theta House 1. Bottom up investment strategy We acquired Theta House in March 2014, as part of the Artemis portfolio. The property was fully occupied by two tenants but we knew at acquisition that the main tenant, occupying 66% of the area, would vacate on lease expiry in February 2016. Having underwritten this lease event, we could price the acquisition to reflect the leasing risk and make plans to execute on what we saw as an attractive asset management opportunity. Theta House is well located close to Junction 4 of the M3, in the heart of the Blackwater Valley office market. 2. Active asset & portfolio management We undertook a full refurbishment of vacant areas and common parts, completing in October 2016. We successfully let the entire ground floor to Surrey & Borders NHS Trust on a 14-year lease (with a seven-year break). We also completed a re-gear with Amer Sport ahead of its lease expiry in October 2017. We achieved both a ten-year lease extension (with a five-year break), and an expansion into additional space on the refurbished second floor. Total refurbishment spend £1.9m Stabilised yield on cost 10.5%
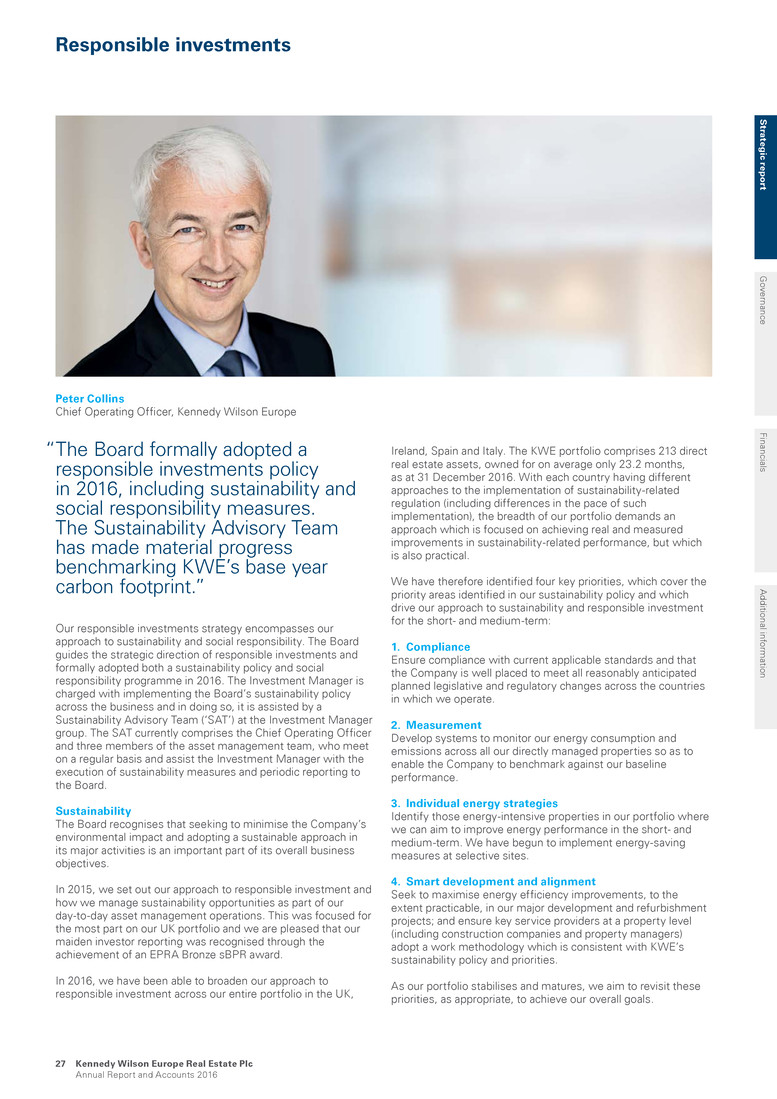
Responsible investments “The Board formally adopted a responsible investments policy in 2016, including sustainability and social responsibility measures. The Sustainability Advisory Team has made material progress benchmarking KWE’s base year carbon footprint.” Our responsible investments strategy encompasses our approach to sustainability and social responsibility. The Board guides the strategic direction of responsible investments and formally adopted both a sustainability policy and social responsibility programme in 2016. The Investment Manager is charged with implementing the Board’s sustainability policy across the business and in doing so, it is assisted by a Sustainability Advisory Team (‘SAT’) at the Investment Manager group. The SAT currently comprises the Chief Operating Officer and three members of the asset management team, who meet on a regular basis and assist the Investment Manager with the execution of sustainability measures and periodic reporting to the Board. Sustainability The Board recognises that seeking to minimise the Company’s environmental impact and adopting a sustainable approach in its major activities is an important part of its overall business objectives. In 2015, we set out our approach to responsible investment and how we manage sustainability opportunities as part of our day-to-day asset management operations. This was focused for the most part on our UK portfolio and we are pleased that our maiden investor reporting was recognised through the achievement of an EPRA Bronze sBPR award. In 2016, we have been able to broaden our approach to responsible investment across our entire portfolio in the UK, Peter Collins Chief Operating Officer, Kennedy Wilson Europe Ireland, Spain and Italy. The KWE portfolio comprises 213 direct real estate assets, owned for on average only 23.2 months, as at 31 December 2016. With each country having different approaches to the implementation of sustainability-related regulation (including differences in the pace of such implementation), the breadth of our portfolio demands an approach which is focused on achieving real and measured improvements in sustainability-related performance, but which is also practical. We have therefore identified four key priorities, which cover the priority areas identified in our sustainability policy and which drive our approach to sustainability and responsible investment for the short- and medium-term: 1. Compliance Ensure compliance with current applicable standards and that the Company is well placed to meet all reasonably anticipated planned legislative and regulatory changes across the countries in which we operate. 2. Measurement Develop systems to monitor our energy consumption and emissions across all our directly managed properties so as to enable the Company to benchmark against our baseline performance. 3. Individual energy strategies Identify those energy-intensive properties in our portfolio where we can aim to improve energy performance in the short- and medium-term. We have begun to implement energy-saving measures at selective sites. 4. Smart development and alignment Seek to maximise energy efficiency improvements, to the extent practicable, in our major development and refurbishment projects; and ensure key service providers at a property level (including construction companies and property managers) adopt a work methodology which is consistent with KWE’s sustainability policy and priorities. As our portfolio stabilises and matures, we aim to revisit these priorities, as appropriate, to achieve our overall goals. S trateg ic rep o rt G overnance Financials A dditional inform ation Kennedy Wilson Europe Real Estate Plc Annual Report and Accounts 2016 27
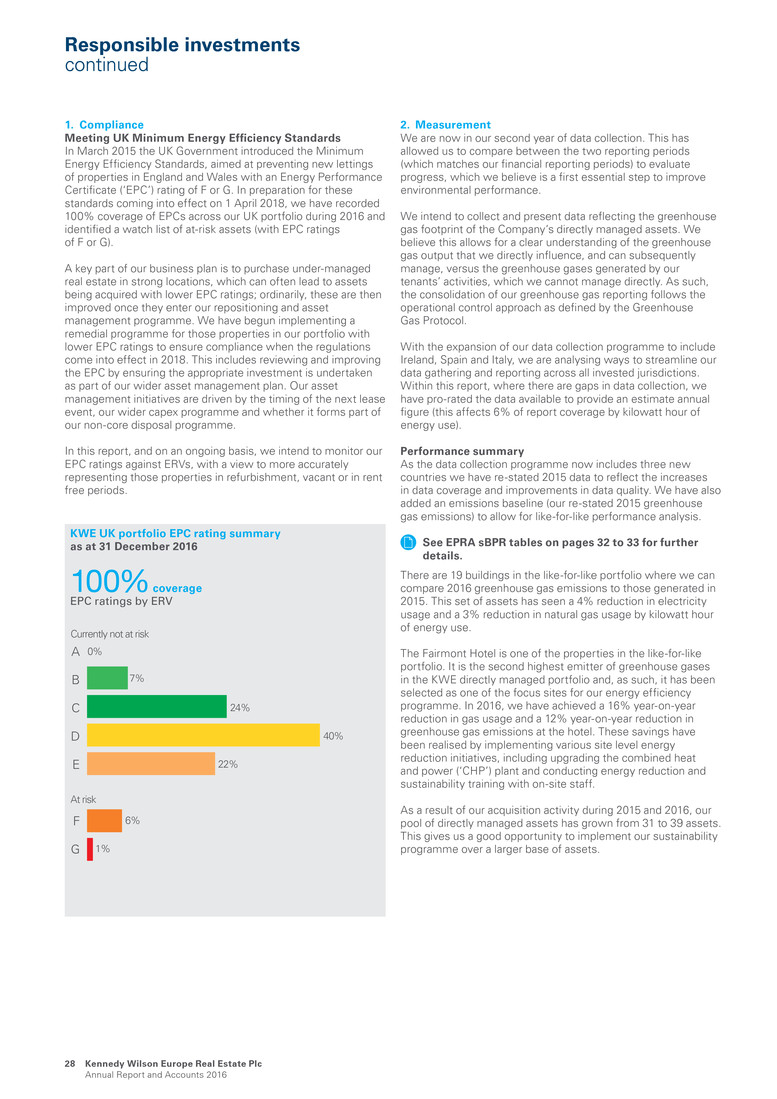
1. Compliance Meeting UK Minimum Energy Efficiency Standards In March 2015 the UK Government introduced the Minimum Energy Efficiency Standards, aimed at preventing new lettings of properties in England and Wales with an Energy Performance Certificate (‘EPC’) rating of F or G. In preparation for these standards coming into effect on 1 April 2018, we have recorded 100% coverage of EPCs across our UK portfolio during 2016 and identified a watch list of at-risk assets (with EPC ratings of F or G). A key part of our business plan is to purchase under-managed real estate in strong locations, which can often lead to assets being acquired with lower EPC ratings; ordinarily, these are then improved once they enter our repositioning and asset management programme. We have begun implementing a remedial programme for those properties in our portfolio with lower EPC ratings to ensure compliance when the regulations come into effect in 2018. This includes reviewing and improving the EPC by ensuring the appropriate investment is undertaken as part of our wider asset management plan. Our asset management initiatives are driven by the timing of the next lease event, our wider capex programme and whether it forms part of our non-core disposal programme. In this report, and on an ongoing basis, we intend to monitor our EPC ratings against ERVs, with a view to more accurately representing those properties in refurbishment, vacant or in rent free periods. KWE UK portfolio EPC rating summary as at 31 December 2016 100% coverage EPC ratings by ERV B A C D E F G 7% 24% 40% 22% 6% 1% At risk Currently not at risk 0% 2. Measurement We are now in our second year of data collection. This has allowed us to compare between the two reporting periods (which matches our financial reporting periods) to evaluate progress, which we believe is a first essential step to improve environmental performance. We intend to collect and present data reflecting the greenhouse gas footprint of the Company’s directly managed assets. We believe this allows for a clear understanding of the greenhouse gas output that we directly influence, and can subsequently manage, versus the greenhouse gases generated by our tenants’ activities, which we cannot manage directly. As such, the consolidation of our greenhouse gas reporting follows the operational control approach as defined by the Greenhouse Gas Protocol. With the expansion of our data collection programme to include Ireland, Spain and Italy, we are analysing ways to streamline our data gathering and reporting across all invested jurisdictions. Within this report, where there are gaps in data collection, we have pro-rated the data available to provide an estimate annual figure (this affects 6% of report coverage by kilowatt hour of energy use). Performance summary As the data collection programme now includes three new countries we have re-stated 2015 data to reflect the increases in data coverage and improvements in data quality. We have also added an emissions baseline (our re-stated 2015 greenhouse gas emissions) to allow for like-for-like performance analysis. See EPRA sBPR tables on pages 32 to 33 for further details. There are 19 buildings in the like-for-like portfolio where we can compare 2016 greenhouse gas emissions to those generated in 2015. This set of assets has seen a 4% reduction in electricity usage and a 3% reduction in natural gas usage by kilowatt hour of energy use. The Fairmont Hotel is one of the properties in the like-for-like portfolio. It is the second highest emitter of greenhouse gases in the KWE directly managed portfolio and, as such, it has been selected as one of the focus sites for our energy efficiency programme. In 2016, we have achieved a 16% year-on-year reduction in gas usage and a 12% year-on-year reduction in greenhouse gas emissions at the hotel. These savings have been realised by implementing various site level energy reduction initiatives, including upgrading the combined heat and power (‘CHP’) plant and conducting energy reduction and sustainability training with on-site staff. As a result of our acquisition activity during 2015 and 2016, our pool of directly managed assets has grown from 31 to 39 assets. This gives us a good opportunity to implement our sustainability programme over a larger base of assets. Kennedy Wilson Europe Real Estate Plc Annual Report and Accounts 2016 28 Responsible investments continued

Building on the energy reduction programme implemented at 111 BPR in 2015, we undertook significant investment into various energy efficiency measures in 2016. These include: Lighting controls have been improved to enable more efficient use A rolling LED lighting change programme is in place Quarterly tenant engagement meetings include energy performance and reduction A collaborative asset performance programme has been commissioned, working across site engineering teams focusing on improving building management system controls, with the aim of further reducing natural gas usage, and electricity usage in summer months Collecting and analysing automated sub-meter readings to target energy wastage (as part of the KWE sustainability data programme) Introduction of a bee hotel and signing up to The Victoria BID Air Quality Pledge Certificate Most of the changes at 111 BPR have related to building controls, which has resulted in a 15% decrease in natural gas consumption year-on-year, leading to a 10% overall reduction in greenhouse gas emissions. We are looking to implement further energy improvements at 111 BPR and if such improvements are successful we expect to see continued reductions in emissions in 2017. 3. Individual energy strategies In 2015 we identified 111 Buckingham Palace Road (‘111 BPR’) as one of our major energy users and started a programme to improve its energy efficiency. This year we have added four other high priority ‘focus sites’ across our portfolio which, together with 111 BPR, account for 51% of KWE’s Scope 1 and 2 greenhouse gas emissions. Our focus sites with individual energy strategies include: 111 Buckingham Palace Road, London 224,120 sq ft multi-let office Baggot Plaza, Dublin 129,300 sq ft single let office Fairmont Hotel, St Andrews 209 bed 5-star hotel Vantage, Central Park, Dublin 442 residential unit estate Moraleja Green, Madrid 324,800 sq ft community shopping centre Social responsibility In May 2016, the Board formally adopted a social responsibility programme with a particular focus on working with communities in proximity to our major assets and a budget of £50,000. Over the year we supported two significant social causes and events at our major assets: • At Hill of Rubislaw, we hosted a talk by Sir Ranulph Fiennes in partnership with Marie Curie Cancer Care, and made a £10,000 donation to Marie Curie • At Towers Business Park, we raised £7,500 for Francis House Children’s Hospice by hosting fundraising events with the tenants Hill of Rubislaw, Aberdeen Sir Ranulph Fiennes (left) in partnership with Marie Curie Towers Business Park, Manchester Fundraising efforts for Francis House Children’s Hospice S trateg ic rep o rt G overnance Financials A dditional inform ation Kennedy Wilson Europe Real Estate Plc Annual Report and Accounts 2016 29
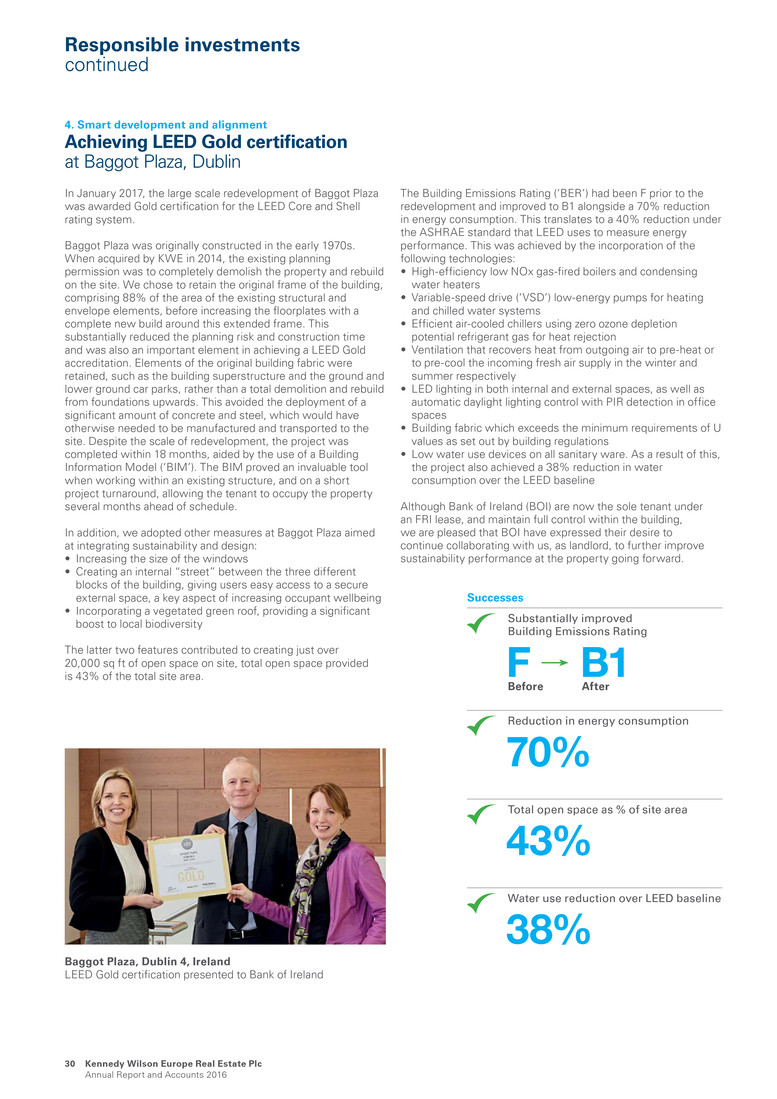
4. Smart development and alignment Achieving LEED Gold certification at Baggot Plaza, Dublin In January 2017, the large scale redevelopment of Baggot Plaza was awarded Gold certification for the LEED Core and Shell rating system. Baggot Plaza was originally constructed in the early 1970s. When acquired by KWE in 2014, the existing planning permission was to completely demolish the property and rebuild on the site. We chose to retain the original frame of the building, comprising 88% of the area of the existing structural and envelope elements, before increasing the floorplates with a complete new build around this extended frame. This substantially reduced the planning risk and construction time and was also an important element in achieving a LEED Gold accreditation. Elements of the original building fabric were retained, such as the building superstructure and the ground and lower ground car parks, rather than a total demolition and rebuild from foundations upwards. This avoided the deployment of a significant amount of concrete and steel, which would have otherwise needed to be manufactured and transported to the site. Despite the scale of redevelopment, the project was completed within 18 months, aided by the use of a Building Information Model (‘BIM’). The BIM proved an invaluable tool when working within an existing structure, and on a short project turnaround, allowing the tenant to occupy the property several months ahead of schedule. In addition, we adopted other measures at Baggot Plaza aimed at integrating sustainability and design: • Increasing the size of the windows • Creating an internal “street” between the three different blocks of the building, giving users easy access to a secure external space, a key aspect of increasing occupant wellbeing • Incorporating a vegetated green roof, providing a significant boost to local biodiversity The latter two features contributed to creating just over 20,000 sq ft of open space on site, total open space provided is 43% of the total site area. Baggot Plaza, Dublin 4, Ireland LEED Gold certification presented to Bank of Ireland The Building Emissions Rating (‘BER’) had been F prior to the redevelopment and improved to B1 alongside a 70% reduction in energy consumption. This translates to a 40% reduction under the ASHRAE standard that LEED uses to measure energy performance. This was achieved by the incorporation of the following technologies: • High-efficiency low NOx gas-fired boilers and condensing water heaters • Variable-speed drive (‘VSD’) low-energy pumps for heating and chilled water systems • Efficient air-cooled chillers using zero ozone depletion potential refrigerant gas for heat rejection • Ventilation that recovers heat from outgoing air to pre-heat or to pre-cool the incoming fresh air supply in the winter and summer respectively • LED lighting in both internal and external spaces, as well as automatic daylight lighting control with PIR detection in office spaces • Building fabric which exceeds the minimum requirements of U values as set out by building regulations • Low water use devices on all sanitary ware. As a result of this, the project also achieved a 38% reduction in water consumption over the LEED baseline Although Bank of Ireland (BOI) are now the sole tenant under an FRI lease, and maintain full control within the building, we are pleased that BOI have expressed their desire to continue collaborating with us, as landlord, to further improve sustainability performance at the property going forward. Successes Substantially improved Building Emissions Rating F B1 Before After Reduction in energy consumption 70% Total open space as % of site area 43% Water use reduction over LEED baseline 38% Responsible investments continued Kennedy Wilson Europe Real Estate Plc Annual Report and Accounts 2016 30

S trateg ic rep o rt G overnance Financials A dditional inform ation 31 Kennedy Wilson Europe Real Estate Plc Annual Report and Accounts 2016
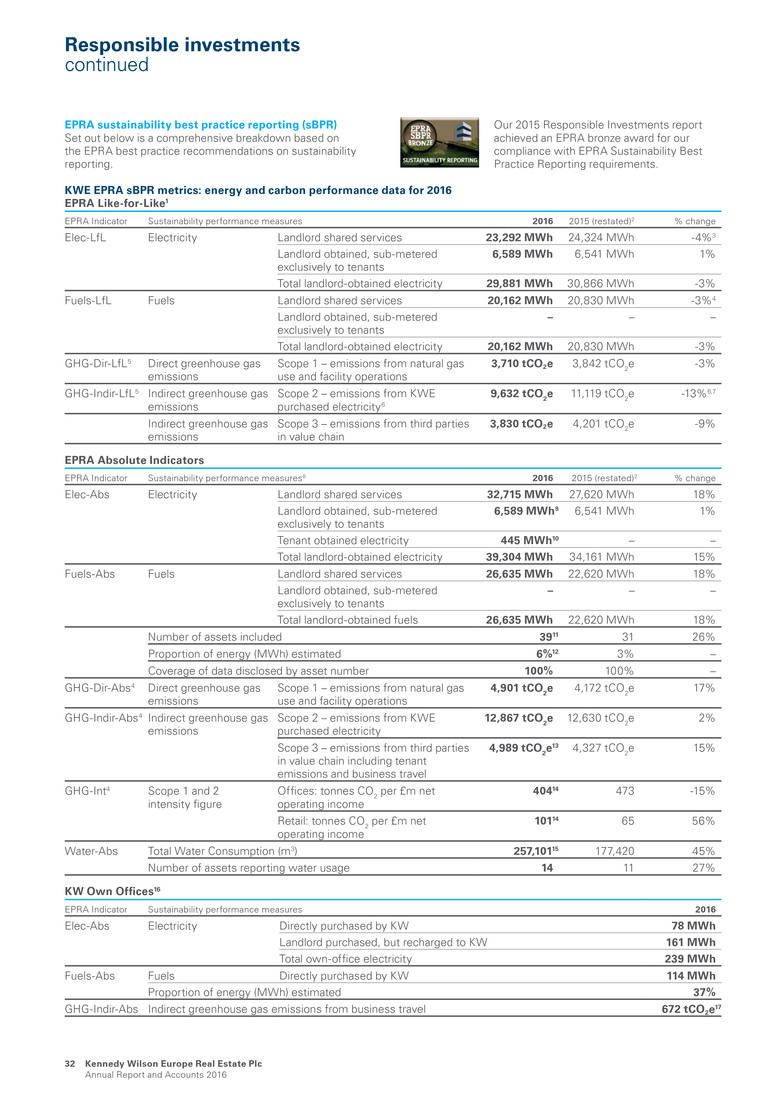
EPRA sustainability best practice reporting (sBPR) Set out below is a comprehensive breakdown based on the EPRA best practice recommendations on sustainability reporting. KWE EPRA sBPR metrics: energy and carbon performance data for 2016 EPRA Like-for-Like1 EPRA Indicator Sustainability performance measures 2016 2015 (restated)2 % change Elec-LfL Electricity Landlord shared services 23,292 MWh 24,324 MWh -4%3 Landlord obtained, sub-metered exclusively to tenants 6,589 MWh 6,541 MWh 1% Total landlord-obtained electricity 29,881 MWh 30,866 MWh -3% Fuels-LfL Fuels Landlord shared services 20,162 MWh 20,830 MWh -3%4 Landlord obtained, sub-metered exclusively to tenants – – – Total landlord-obtained electricity 20,162 MWh 20,830 MWh -3% GHG-Dir-LfL5 Direct greenhouse gas emissions Scope 1 – emissions from natural gas use and facility operations 3,710 tCO2e 3,842 tCO2e -3% GHG-Indir-LfL5 Indirect greenhouse gas emissions Scope 2 – emissions from KWE purchased electricity6 9,632 tCO2e 11,119 tCO2e -13% 6,7 Indirect greenhouse gas emissions Scope 3 – emissions from third parties in value chain 3,830 tCO2e 4,201 tCO2e -9% EPRA Absolute Indicators EPRA Indicator Sustainability performance measures8 2016 2015 (restated)2 % change Elec-Abs Electricity Landlord shared services 32,715 MWh 27,620 MWh 18% Landlord obtained, sub-metered exclusively to tenants 6,589 MWh9 6,541 MWh 1% Tenant obtained electricity 445 MWh10 – – Total landlord-obtained electricity 39,304 MWh 34,161 MWh 15% Fuels-Abs Fuels Landlord shared services 26,635 MWh 22,620 MWh 18% Landlord obtained, sub-metered exclusively to tenants – – – Total landlord-obtained fuels 26,635 MWh 22,620 MWh 18% Number of assets included 3911 31 26% Proportion of energy (MWh) estimated 6%12 3% – Coverage of data disclosed by asset number 100% 100% – GHG-Dir-Abs4 Direct greenhouse gas emissions Scope 1 – emissions from natural gas use and facility operations 4,901 tCO2e 4,172 tCO2e 17% GHG-Indir-Abs4 Indirect greenhouse gas emissions Scope 2 – emissions from KWE purchased electricity 12,867 tCO2e 12,630 tCO2e 2% Scope 3 – emissions from third parties in value chain including tenant emissions and business travel 4,989 tCO2e 13 4,327 tCO2e 15% GHG-Int4 Scope 1 and 2 intensity figure Offices: tonnes CO2 per £m net operating income 40414 473 -15% Retail: tonnes CO2 per £m net operating income 10114 65 56% Water-Abs Total Water Consumption (m3) 257,10115 177,420 45% Number of assets reporting water usage 14 11 27% KW Own Offices16 EPRA Indicator Sustainability performance measures 2016 Elec-Abs Electricity Directly purchased by KW 78 MWh Landlord purchased, but recharged to KW 161 MWh Total own-office electricity 239 MWh Fuels-Abs Fuels Directly purchased by KW 114 MWh Proportion of energy (MWh) estimated 37% GHG-Indir-Abs Indirect greenhouse gas emissions from business travel 672 tCO2e17 Our 2015 Responsible Investments report achieved an EPRA bronze award for our compliance with EPRA Sustainability Best Practice Reporting requirements. Kennedy Wilson Europe Real Estate Plc Annual Report and Accounts 2016 32 Responsible investments continued
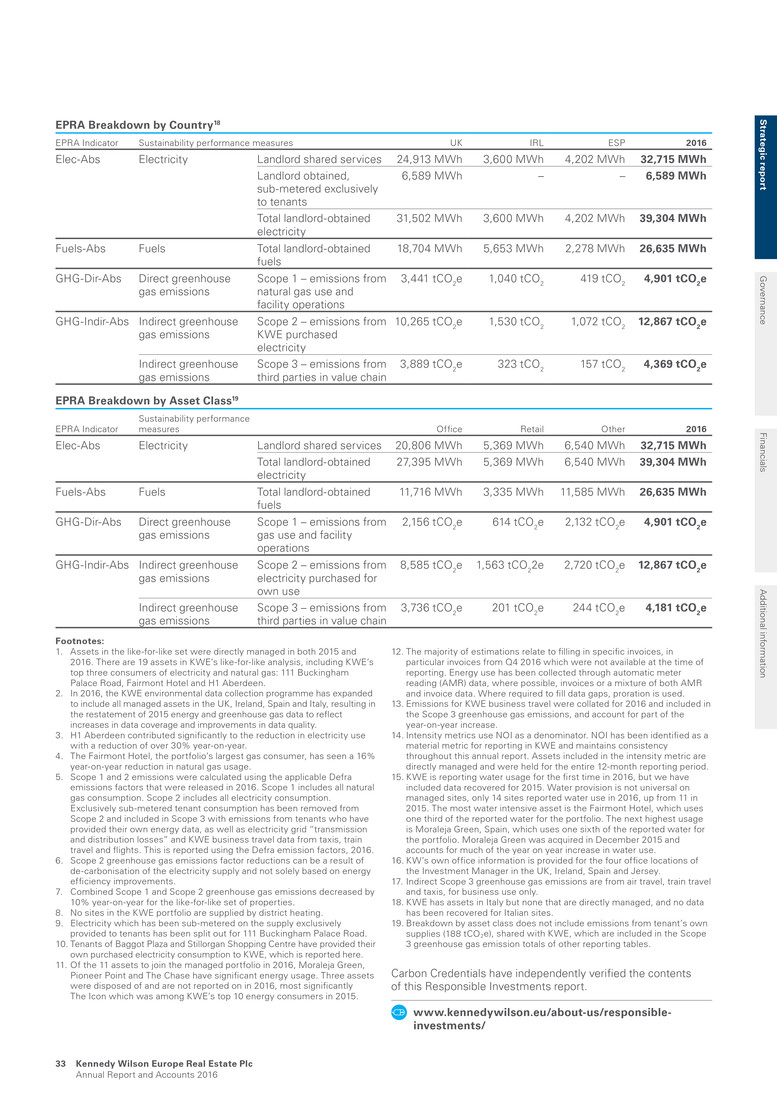
EPRA Breakdown by Country18 EPRA Indicator Sustainability performance measures UK IRL ESP 2016 Elec-Abs Electricity Landlord shared services 24,913 MWh 3,600 MWh 4,202 MWh 32,715 MWh Landlord obtained, sub-metered exclusively to tenants 6,589 MWh – – 6,589 MWh Total landlord-obtained electricity 31,502 MWh 3,600 MWh 4,202 MWh 39,304 MWh Fuels-Abs Fuels Total landlord-obtained fuels 18,704 MWh 5,653 MWh 2,278 MWh 26,635 MWh GHG-Dir-Abs Direct greenhouse gas emissions Scope 1 – emissions from natural gas use and facility operations 3,441 tCO2e 1,040 tCO2 419 tCO2 4,901 tCO2e GHG-Indir-Abs Indirect greenhouse gas emissions Scope 2 – emissions from KWE purchased electricity 10,265 tCO2e 1,530 tCO2 1,072 tCO2 12,867 tCO2e Indirect greenhouse gas emissions Scope 3 – emissions from third parties in value chain 3,889 tCO2e 323 tCO2 157 tCO2 4,369 tCO2e EPRA Breakdown by Asset Class19 EPRA Indicator Sustainability performance measures Office Retail Other 2016 Elec-Abs Electricity Landlord shared services 20,806 MWh 5,369 MWh 6,540 MWh 32,715 MWh Total landlord-obtained electricity 27,395 MWh 5,369 MWh 6,540 MWh 39,304 MWh Fuels-Abs Fuels Total landlord-obtained fuels 11,716 MWh 3,335 MWh 11,585 MWh 26,635 MWh GHG-Dir-Abs Direct greenhouse gas emissions Scope 1 – emissions from gas use and facility operations 2,156 tCO2e 614 tCO2e 2,132 tCO2e 4,901 tCO2e GHG-Indir-Abs Indirect greenhouse gas emissions Scope 2 – emissions from electricity purchased for own use 8,585 tCO2e 1,563 tCO22e 2,720 tCO2e 12,867 tCO2e Indirect greenhouse gas emissions Scope 3 – emissions from third parties in value chain 3,736 tCO2e 201 tCO2e 244 tCO2e 4,181 tCO2e Footnotes: 1. Assets in the like-for-like set were directly managed in both 2015 and 2016. There are 19 assets in KWE’s like-for-like analysis, including KWE’s top three consumers of electricity and natural gas: 111 Buckingham Palace Road, Fairmont Hotel and H1 Aberdeen. 2. In 2016, the KWE environmental data collection programme has expanded to include all managed assets in the UK, Ireland, Spain and Italy, resulting in the restatement of 2015 energy and greenhouse gas data to reflect increases in data coverage and improvements in data quality. 3. H1 Aberdeen contributed significantly to the reduction in electricity use with a reduction of over 30% year-on-year. 4. The Fairmont Hotel, the portfolio’s largest gas consumer, has seen a 16% year-on-year reduction in natural gas usage. 5. Scope 1 and 2 emissions were calculated using the applicable Defra emissions factors that were released in 2016. Scope 1 includes all natural gas consumption. Scope 2 includes all electricity consumption. Exclusively sub-metered tenant consumption has been removed from Scope 2 and included in Scope 3 with emissions from tenants who have provided their own energy data, as well as electricity grid “transmission and distribution losses” and KWE business travel data from taxis, train travel and flights. This is reported using the Defra emission factors, 2016. 6. Scope 2 greenhouse gas emissions factor reductions can be a result of de-carbonisation of the electricity supply and not solely based on energy efficiency improvements. 7. Combined Scope 1 and Scope 2 greenhouse gas emissions decreased by 10% year-on-year for the like-for-like set of properties. 8. No sites in the KWE portfolio are supplied by district heating. 9. Electricity which has been sub-metered on the supply exclusively provided to tenants has been split out for 111 Buckingham Palace Road. 10. Tenants of Baggot Plaza and Stillorgan Shopping Centre have provided their own purchased electricity consumption to KWE, which is reported here. 11. Of the 11 assets to join the managed portfolio in 2016, Moraleja Green, Pioneer Point and The Chase have significant energy usage. Three assets were disposed of and are not reported on in 2016, most significantly The Icon which was among KWE’s top 10 energy consumers in 2015. 12. The majority of estimations relate to filling in specific invoices, in particular invoices from Q4 2016 which were not available at the time of reporting. Energy use has been collected through automatic meter reading (AMR) data, where possible, invoices or a mixture of both AMR and invoice data. Where required to fill data gaps, proration is used. 13. Emissions for KWE business travel were collated for 2016 and included in the Scope 3 greenhouse gas emissions, and account for part of the year-on-year increase. 14. Intensity metrics use NOI as a denominator. NOI has been identified as a material metric for reporting in KWE and maintains consistency throughout this annual report. Assets included in the intensity metric are directly managed and were held for the entire 12-month reporting period. 15. KWE is reporting water usage for the first time in 2016, but we have included data recovered for 2015. Water provision is not universal on managed sites, only 14 sites reported water use in 2016, up from 11 in 2015. The most water intensive asset is the Fairmont Hotel, which uses one third of the reported water for the portfolio. The next highest usage is Moraleja Green, Spain, which uses one sixth of the reported water for the portfolio. Moraleja Green was acquired in December 2015 and accounts for much of the year on year increase in water use. 16. KW’s own office information is provided for the four office locations of the Investment Manager in the UK, Ireland, Spain and Jersey. 17. Indirect Scope 3 greenhouse gas emissions are from air travel, train travel and taxis, for business use only. 18. KWE has assets in Italy but none that are directly managed, and no data has been recovered for Italian sites. 19. Breakdown by asset class does not include emissions from tenant’s own supplies (188 tCO2e), shared with KWE, which are included in the Scope 3 greenhouse gas emission totals of other reporting tables. Carbon Credentials have independently verified the contents of this Responsible Investments report. www.kennedywilson.eu/about-us/responsible- investments/ S trateg ic rep o rt G overnance Financials A dditional inform ation Kennedy Wilson Europe Real Estate Plc Annual Report and Accounts 2016 33

Santisma Trinidad 5, Madrid, Spain Acquired December 2014 Conversion of office to 24 for sale residential units Unlocking value 2. Active asset & portfolio management 1. Bottom up investment strategy 3. Asset repositioning 4. Rigorous capital management Unlocking value at ST5 1. Bottom up investment strategy We acquired ST5 in December 2014, as an office asset with the purpose of converting the property to high end residential units for sale. The 31,750 sq ft for office provided for 28 parking spaces and is in the Chamberi area, one of the prime residential areas of Madrid. 2. Active asset & portfolio management We have completed the sale of 22 of 24 available units with a further unit sold after year-end, leaving one penthouse unit available for sale. The sales programme has achieved attractive returns over a 22-month hold period, generating a profit of €2.1 million and premium to book value of 28.5%. 3. Asset repositioning Vacant possession was achieved to allow for the extensive reconfiguration and comprehensive refurbishment works of both the interior and exterior of the property. The former office building was successfully transformed into 24 high end residential units for sale. Number of units sold in 2016 22 Return on cost 23.1% Kennedy Wilson Europe Real Estate Plc Annual Report and Accounts 2016 34

KWE’s approach to risk management At KWE, assessment of risk is a cornerstone of our strategy and our risk management framework is fundamental to its delivery. Our integrated approach reflects a combination of a top-down strategic view with complementary bottom-up operational processes. The top-down approach involves a review of the external environment in which we operate, to guide an assessment of the risks which we are comfortable exposing the business to in pursuit of our strategy. The bottom-up process involves the identification, management and monitoring of risks in each area of our business to ensure that risk management is embedded in the business operations and policies. Oversight of this process is provided through maintenance of a composite risk register at the Group-level as well as regional risk registers in target markets where we operate through regulated vehicles. This approach ensures that operational risks are fully considered in determining the risk appetite and corresponding strategy of the business. Board’s role in the process The Board is ultimately responsible for determining the nature and extent of the principal risks it is willing to take to achieve its strategic objectives. Its policy is to have systems in place which optimise the Company’s ability to manage risk in an effective and appropriate manner. By regularly reviewing the risk appetite of the business, the Board ensures that the risk exposure remains appropriate at any point in the cycle. Importantly the Board perceives risk not only as having a potential negative influence on the business but also as an opportunity for financial outperformance as we have access to the Investment Manager’s expertise to take and manage risks. As a property company in the post-Brexit world, exposure to risk is inherent in our business but is subject to an extensive range of mitigating controls. Audit Committee’s role in the process The Board has delegated responsibility for detailed assessment of the risk management process to the Audit Committee. At each quarterly meeting, the Audit Committee carries out a detailed review of the risk register, the control processes run by the Investment Manager, and the manner in which any required corrective action is to be taken by the Investment Manager and reports its findings to the Board. Investment Manager’s role in the process The Investment Manager acts as KWE’s Alternative Investment Fund Manager (AIFM) for the purposes of the Jersey Financial Services Commission’s (JFSC) The Alternate Investment Fund Managers Directive (AIFMD) related regulations, and is responsible for risk management. The Investment Manager is responsible for the ongoing process of identifying, evaluating, monitoring, and managing risks facing the business, together with maintaining controls to manage these risks. The Investment Manager in turn places reliance on its advisory teams to monitor and manage operational risk on an ongoing basis, as well as identifying emerging risks and putting appropriate responses in place. Risk registers, which exist at both the Group and regional levels where the Group invests through regulated vehicles, provide a framework for all staff of the Investment Manager group to contribute to delivering our strategy by recognising their shared responsibility for the effective management of risk. Processes Risk identification Assessment & Quantification Mitigating Actions Ongoing Monitoring Reporting to Board Board Audit Committee Investment Manager Investment Advisors Staff of Investment Manager Group Managing risk Strateg ic rep o rt G overnance Financials A dditional inform ation Kennedy Wilson Europe Real Estate Plc Annual Report and Accounts 2016 35

Macro-economic risks Risk Impact Mitigation General economic conditions Impact: Medium Likelihood: High Link to business model: Low European growth and weak productivity indicators, coupled with the UK exit from the EU and an increase in protectionist rhetoric in the USA (albeit alongside an apparently expansionary fiscal policy) remain a concern in our current markets of operation. A slowdown in economic growth increases the risk of lower than expected rental levels, occupancy deterioration and asset valuation uncertainty. • Regular review of the economic environment to assess whether any changes in outlook present risks, as well as opportunities, which impact execution of our strategy • Broad mandate to investment management team allowing for flexible approach to investing across real estate markets in Europe, with limited restrictions across asset class, sector or capital structure, resulting in risk diversification across the portfolio • High occupancy levels (95%) and long WAULT (7.1 years to first break), making any deterioration in the occupier market have a muted short-term effect on the Group’s turnover Mapping our principal risks Risk unchanged since last year Risk decreased since last year Risk increased since last year Po te n ti al im p ac t b ef o re m it ig at io n Likelihood of occurrence after mitigation Low Medium High Lo w M ed iu m H ig h 9 10 1 2 4 8 6 7 3 5 Managing risk continued Kennedy Wilson Europe Real Estate Plc Annual Report and Accounts 2016 36
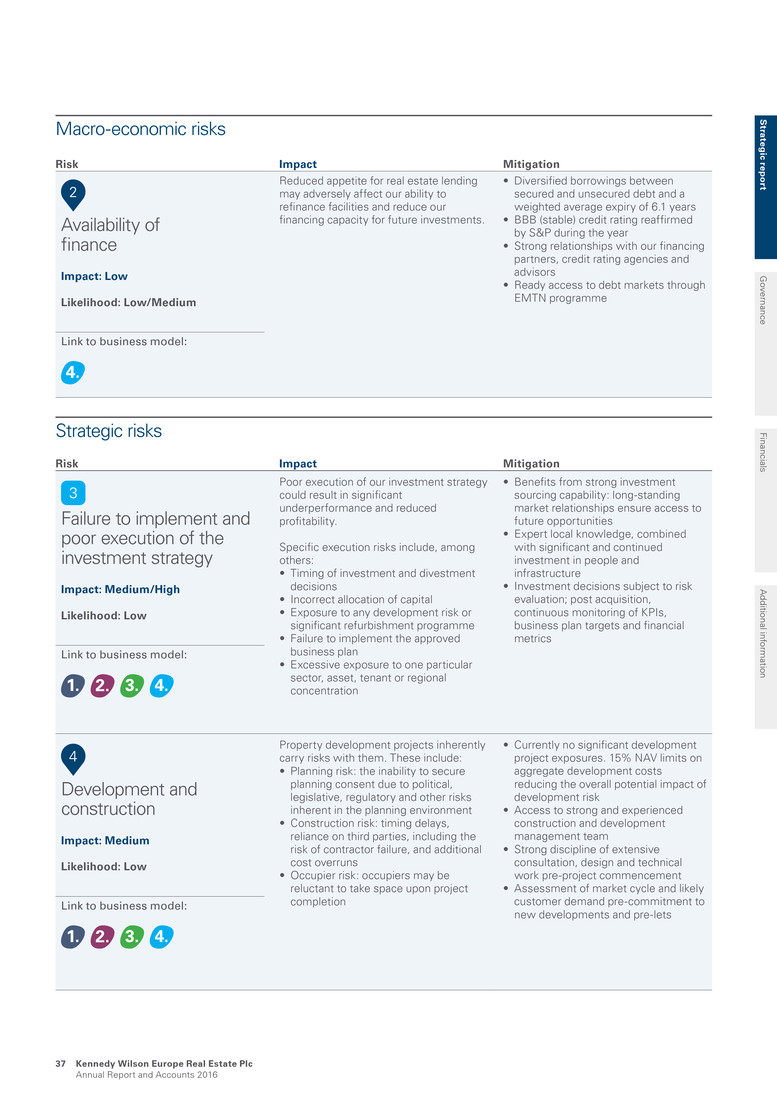
Risk Impact Mitigation Availability of finance Impact: Low Likelihood: Low/Medium Link to business model: Reduced appetite for real estate lending may adversely affect our ability to refinance facilities and reduce our financing capacity for future investments. • Diversified borrowings between secured and unsecured debt and a weighted average expiry of 6.1 years • BBB (stable) credit rating reaffirmed by S&P during the year • Strong relationships with our financing partners, credit rating agencies and advisors • Ready access to debt markets through EMTN programme Strategic risks Risk Impact Mitigation Failure to implement and poor execution of the investment strategy Impact: Medium/High Likelihood: Low Link to business model: Poor execution of our investment strategy could result in significant underperformance and reduced profitability. Specific execution risks include, among others: • Timing of investment and divestment decisions • Incorrect allocation of capital • Exposure to any development risk or significant refurbishment programme • Failure to implement the approved business plan • Excessive exposure to one particular sector, asset, tenant or regional concentration • Benefits from strong investment sourcing capability: long-standing market relationships ensure access to future opportunities • Expert local knowledge, combined with significant and continued investment in people and infrastructure • Investment decisions subject to risk evaluation; post acquisition, continuous monitoring of KPIs, business plan targets and financial metrics Development and construction Impact: Medium Likelihood: Low Link to business model: Property development projects inherently carry risks with them. These include: • Planning risk: the inability to secure planning consent due to political, legislative, regulatory and other risks inherent in the planning environment • Construction risk: timing delays, reliance on third parties, including the risk of contractor failure, and additional cost overruns • Occupier risk: occupiers may be reluctant to take space upon project completion • Currently no significant development project exposures. 15% NAV limits on aggregate development costs reducing the overall potential impact of development risk • Access to strong and experienced construction and development management team • Strong discipline of extensive consultation, design and technical work pre-project commencement • Assessment of market cycle and likely customer demand pre-commitment to new developments and pre-lets Macro-economic risks Strateg ic rep o rt G overnance Financials A dditional inform ation Kennedy Wilson Europe Real Estate Plc Annual Report and Accounts 2016 37
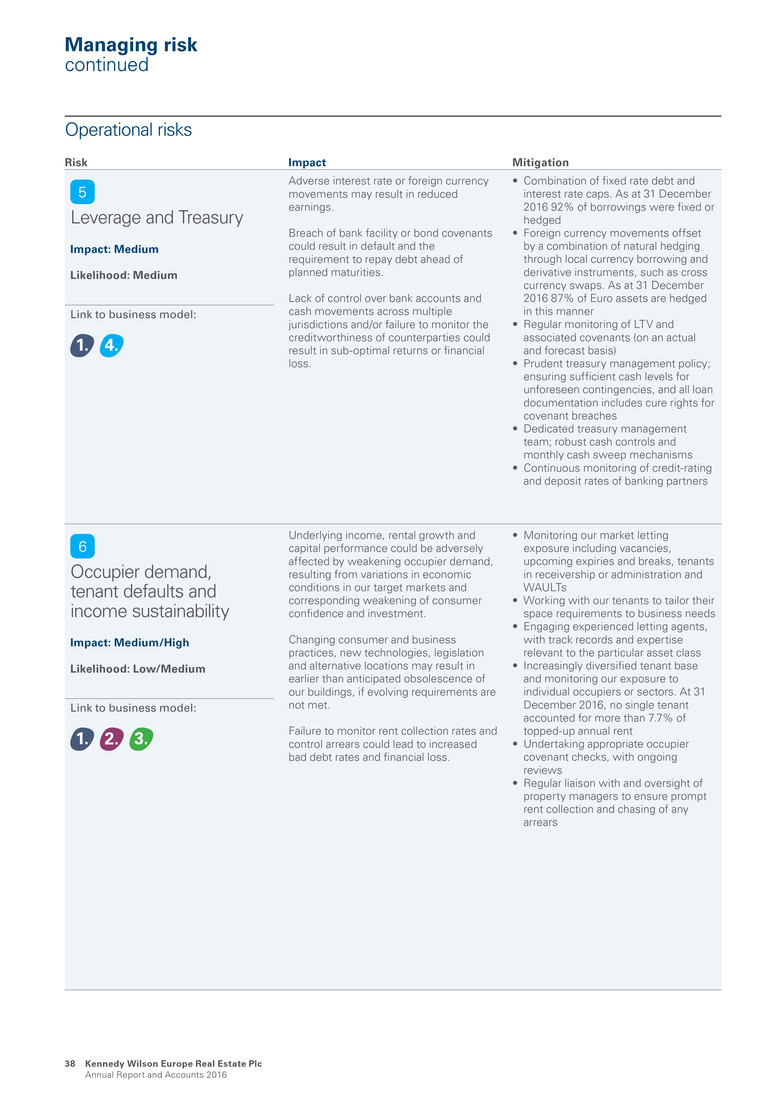
Operational risks Risk Impact Mitigation Leverage and Treasury Impact: Medium Likelihood: Medium Link to business model: Adverse interest rate or foreign currency movements may result in reduced earnings. Breach of bank facility or bond covenants could result in default and the requirement to repay debt ahead of planned maturities. Lack of control over bank accounts and cash movements across multiple jurisdictions and/or failure to monitor the creditworthiness of counterparties could result in sub-optimal returns or financial loss. • Combination of fixed rate debt and interest rate caps. As at 31 December 2016 92% of borrowings were fixed or hedged • Foreign currency movements offset by a combination of natural hedging through local currency borrowing and derivative instruments, such as cross currency swaps. As at 31 December 2016 87% of Euro assets are hedged in this manner • Regular monitoring of LTV and associated covenants (on an actual and forecast basis) • Prudent treasury management policy; ensuring sufficient cash levels for unforeseen contingencies, and all loan documentation includes cure rights for covenant breaches • Dedicated treasury management team; robust cash controls and monthly cash sweep mechanisms • Continuous monitoring of credit-rating and deposit rates of banking partners Occupier demand, tenant defaults and income sustainability Impact: Medium/High Likelihood: Low/Medium Link to business model: Underlying income, rental growth and capital performance could be adversely affected by weakening occupier demand, resulting from variations in economic conditions in our target markets and corresponding weakening of consumer confidence and investment. Changing consumer and business practices, new technologies, legislation and alternative locations may result in earlier than anticipated obsolescence of our buildings, if evolving requirements are not met. Failure to monitor rent collection rates and control arrears could lead to increased bad debt rates and financial loss. • Monitoring our market letting exposure including vacancies, upcoming expiries and breaks, tenants in receivership or administration and WAULTs • Working with our tenants to tailor their space requirements to business needs • Engaging experienced letting agents, with track records and expertise relevant to the particular asset class • Increasingly diversified tenant base and monitoring our exposure to individual occupiers or sectors. At 31 December 2016, no single tenant accounted for more than 7.7% of topped-up annual rent • Undertaking appropriate occupier covenant checks, with ongoing reviews • Regular liaison with and oversight of property managers to ensure prompt rent collection and chasing of any arrears Managing risk continued Kennedy Wilson Europe Real Estate Plc Annual Report and Accounts 2016 38
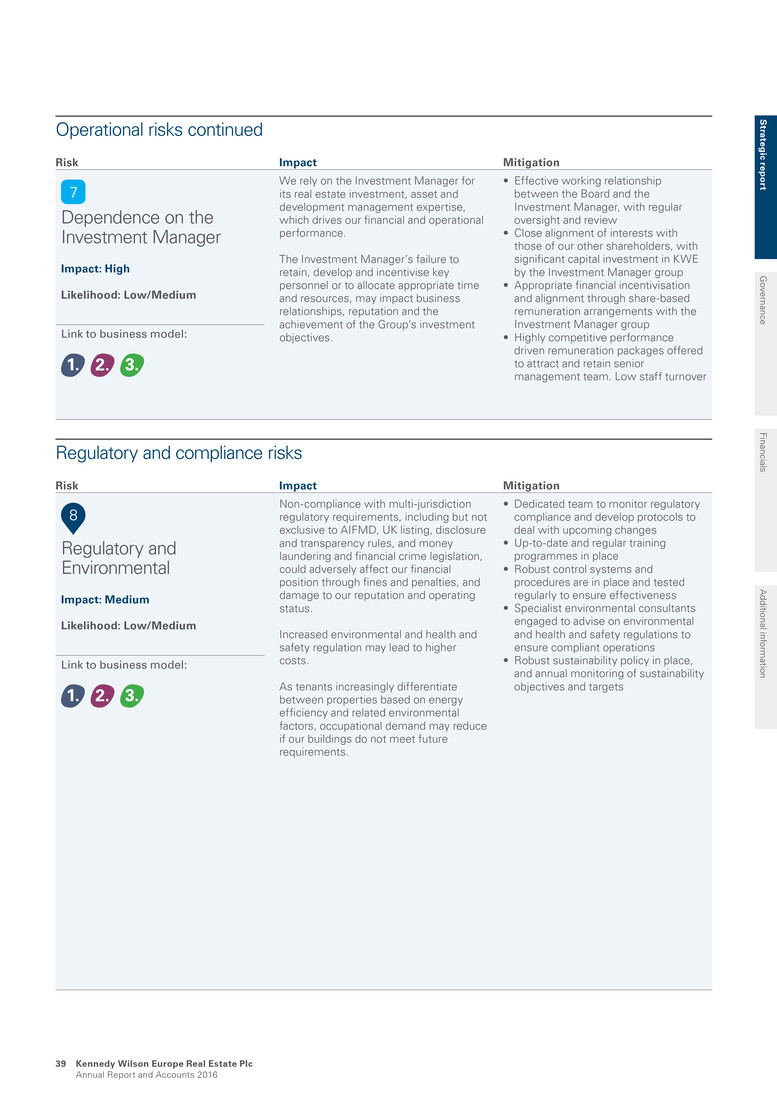
Operational risks continued Risk Impact Mitigation Dependence on the Investment Manager Impact: High Likelihood: Low/Medium Link to business model: We rely on the Investment Manager for its real estate investment, asset and development management expertise, which drives our financial and operational performance. The Investment Manager’s failure to retain, develop and incentivise key personnel or to allocate appropriate time and resources, may impact business relationships, reputation and the achievement of the Group’s investment objectives. • Effective working relationship between the Board and the Investment Manager, with regular oversight and review • Close alignment of interests with those of our other shareholders, with significant capital investment in KWE by the Investment Manager group • Appropriate financial incentivisation and alignment through share-based remuneration arrangements with the Investment Manager group • Highly competitive performance driven remuneration packages offered to attract and retain senior management team. Low staff turnover Regulatory and compliance risks Risk Impact Mitigation Regulatory and Environmental Impact: Medium Likelihood: Low/Medium Link to business model: Non-compliance with multi-jurisdiction regulatory requirements, including but not exclusive to AIFMD, UK listing, disclosure and transparency rules, and money laundering and financial crime legislation, could adversely affect our financial position through fines and penalties, and damage to our reputation and operating status. Increased environmental and health and safety regulation may lead to higher costs. As tenants increasingly differentiate between properties based on energy efficiency and related environmental factors, occupational demand may reduce if our buildings do not meet future requirements. • Dedicated team to monitor regulatory compliance and develop protocols to deal with upcoming changes • Up-to-date and regular training programmes in place • Robust control systems and procedures are in place and tested regularly to ensure effectiveness • Specialist environmental consultants engaged to advise on environmental and health and safety regulations to ensure compliant operations • Robust sustainability policy in place, and annual monitoring of sustainability objectives and targets Strateg ic rep o rt G overnance Financials A dditional inform ation Kennedy Wilson Europe Real Estate Plc Annual Report and Accounts 2016 39
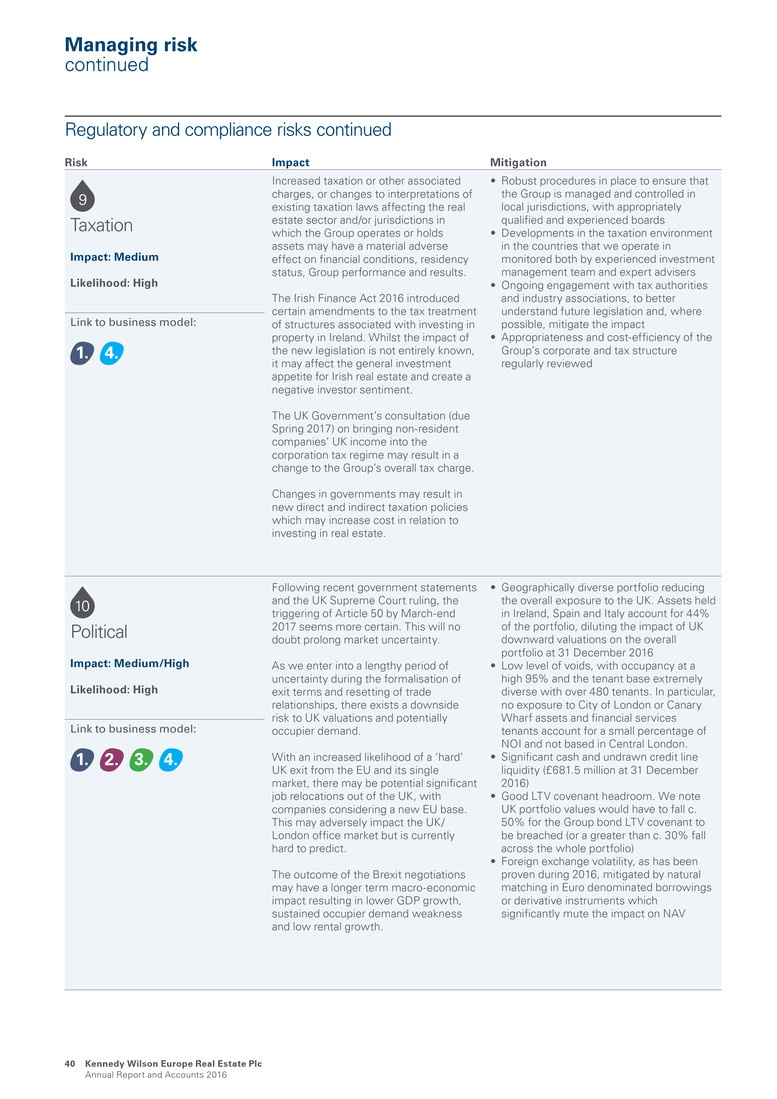
Regulatory and compliance risks continued Risk Impact Mitigation Taxation Impact: Medium Likelihood: High Link to business model: Increased taxation or other associated charges, or changes to interpretations of existing taxation laws affecting the real estate sector and/or jurisdictions in which the Group operates or holds assets may have a material adverse effect on financial conditions, residency status, Group performance and results. The Irish Finance Act 2016 introduced certain amendments to the tax treatment of structures associated with investing in property in Ireland. Whilst the impact of the new legislation is not entirely known, it may affect the general investment appetite for Irish real estate and create a negative investor sentiment. The UK Government’s consultation (due Spring 2017) on bringing non-resident companies’ UK income into the corporation tax regime may result in a change to the Group’s overall tax charge. Changes in governments may result in new direct and indirect taxation policies which may increase cost in relation to investing in real estate. • Robust procedures in place to ensure that the Group is managed and controlled in local jurisdictions, with appropriately qualified and experienced boards • Developments in the taxation environment in the countries that we operate in monitored both by experienced investment management team and expert advisers • Ongoing engagement with tax authorities and industry associations, to better understand future legislation and, where possible, mitigate the impact • Appropriateness and cost-efficiency of the Group’s corporate and tax structure regularly reviewed Political Impact: Medium/High Likelihood: High Link to business model: Following recent government statements and the UK Supreme Court ruling, the triggering of Article 50 by March-end 2017 seems more certain. This will no doubt prolong market uncertainty. As we enter into a lengthy period of uncertainty during the formalisation of exit terms and resetting of trade relationships, there exists a downside risk to UK valuations and potentially occupier demand. With an increased likelihood of a ‘hard’ UK exit from the EU and its single market, there may be potential significant job relocations out of the UK, with companies considering a new EU base. This may adversely impact the UK/ London office market but is currently hard to predict. The outcome of the Brexit negotiations may have a longer term macro-economic impact resulting in lower GDP growth, sustained occupier demand weakness and low rental growth. • Geographically diverse portfolio reducing the overall exposure to the UK. Assets held in Ireland, Spain and Italy account for 44% of the portfolio, diluting the impact of UK downward valuations on the overall portfolio at 31 December 2016 • Low level of voids, with occupancy at a high 95% and the tenant base extremely diverse with over 480 tenants. In particular, no exposure to City of London or Canary Wharf assets and financial services tenants account for a small percentage of NOI and not based in Central London. • Significant cash and undrawn credit line liquidity (£681.5 million at 31 December 2016) • Good LTV covenant headroom. We note UK portfolio values would have to fall c. 50% for the Group bond LTV covenant to be breached (or a greater than c. 30% fall across the whole portfolio) • Foreign exchange volatility, as has been proven during 2016, mitigated by natural matching in Euro denominated borrowings or derivative instruments which significantly mute the impact on NAV Managing risk continued Kennedy Wilson Europe Real Estate Plc Annual Report and Accounts 2016 40

Portmarnock Hotel & Golf Links, Co Dublin, Ireland Acquired July 2014 135 room hotel Newly refurbished reception area Newly refurbished restaurant facility Unlocking value 2. Active asset & portfolio management 1. Bottom up investment strategy 3. Asset repositioning 4. Rigorous capital management Unlocking value at Portmarnock 1. Bottom up investment strategy We acquired Portmarnock, a four-star hotel with an 18 hole golf links facility, in July 2014 from NAMA. It is attractively located, being the only resort hotel with a golf links offering within Dublin city centre. 2. Active asset & portfolio management Portmarnock was acquired as an unflagged hotel, this allowed us to transform and reposition the facility. Operationally we improved all aspects of the hotel which enhanced the overall customer experience, drove room revenue and increased golf green fee rates. Strong trading resulted in a 57% growth in ADR since acquisition – further upside will be captured as trading benefits from a recently completed capital programme. 3. Asset repositioning Planning permission was secured to undertake a material refurbishment programme which included a new elevated podium entrance, a refurbishment of 90 bedrooms, a newly renovated reception, Seaview lounge, restaurant, gym and spa offering. The Bernard Langer designed golf links benefited from a substantial upgrade as we commenced a rolling refurbishment of the course, which has translated to a 20% increase in green fee rates. Total refurbishment spend €9.8m Stabilised yield on cost 6.9% S trateg ic rep o rt G overnance Financials A dditional inform ation Kennedy Wilson Europe Real Estate Plc Annual Report and Accounts 2016 41
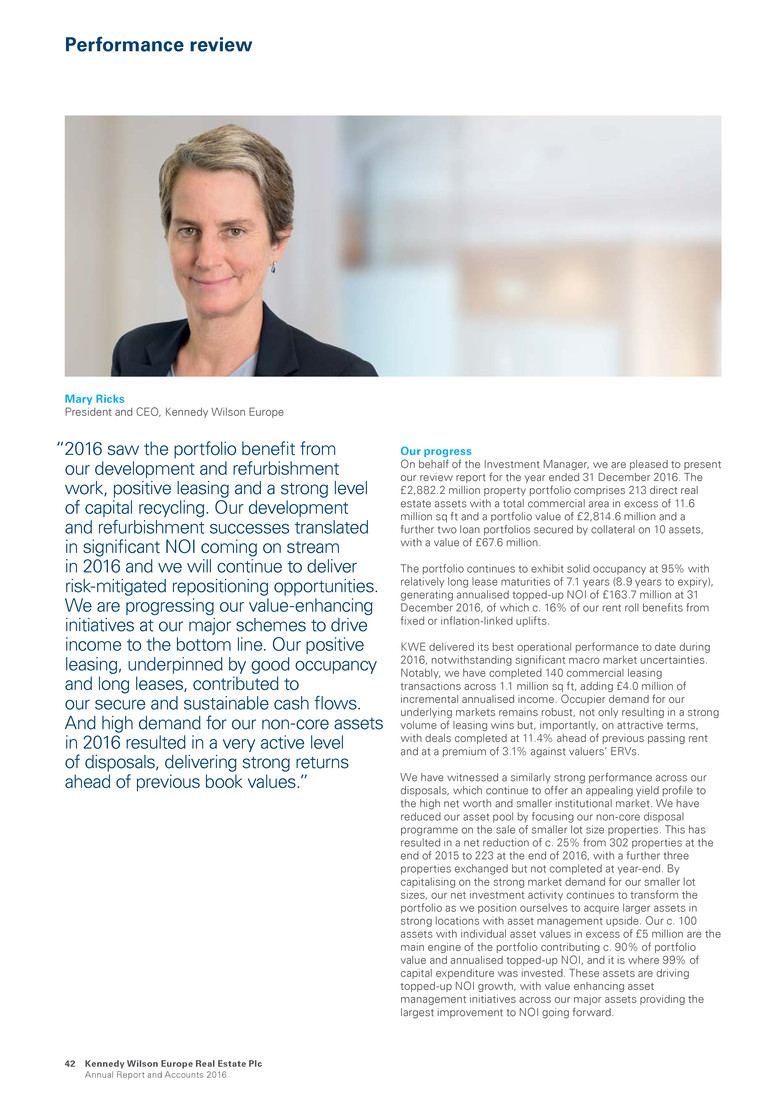
Performance review Our progress On behalf of the Investment Manager, we are pleased to present our review report for the year ended 31 December 2016. The £2,882.2 million property portfolio comprises 213 direct real estate assets with a total commercial area in excess of 11.6 million sq ft and a portfolio value of £2,814.6 million and a further two loan portfolios secured by collateral on 10 assets, with a value of £67.6 million. The portfolio continues to exhibit solid occupancy at 95% with relatively long lease maturities of 7.1 years (8.9 years to expiry), generating annualised topped-up NOI of £163.7 million at 31 December 2016, of which c. 16% of our rent roll benefits from fixed or inflation-linked uplifts. KWE delivered its best operational performance to date during 2016, notwithstanding significant macro market uncertainties. Notably, we have completed 140 commercial leasing transactions across 1.1 million sq ft, adding £4.0 million of incremental annualised income. Occupier demand for our underlying markets remains robust, not only resulting in a strong volume of leasing wins but, importantly, on attractive terms, with deals completed at 11.4% ahead of previous passing rent and at a premium of 3.1% against valuers’ ERVs. We have witnessed a similarly strong performance across our disposals, which continue to offer an appealing yield profile to the high net worth and smaller institutional market. We have reduced our asset pool by focusing our non-core disposal programme on the sale of smaller lot size properties. This has resulted in a net reduction of c. 25% from 302 properties at the end of 2015 to 223 at the end of 2016, with a further three properties exchanged but not completed at year-end. By capitalising on the strong market demand for our smaller lot sizes, our net investment activity continues to transform the portfolio as we position ourselves to acquire larger assets in strong locations with asset management upside. Our c. 100 assets with individual asset values in excess of £5 million are the main engine of the portfolio contributing c. 90% of portfolio value and annualised topped-up NOI, and it is where 99% of capital expenditure was invested. These assets are driving topped-up NOI growth, with value enhancing asset management initiatives across our major assets providing the largest improvement to NOI going forward. “2016 saw the portfolio benefit from our development and refurbishment work, positive leasing and a strong level of capital recycling. Our development and refurbishment successes translated in significant NOI coming on stream in 2016 and we will continue to deliver risk-mitigated repositioning opportunities. We are progressing our value-enhancing initiatives at our major schemes to drive income to the bottom line. Our positive leasing, underpinned by good occupancy and long leases, contributed to our secure and sustainable cash flows. And high demand for our non-core assets in 2016 resulted in a very active level of disposals, delivering strong returns ahead of previous book values.” Mary Ricks President and CEO, Kennedy Wilson Europe Kennedy Wilson Europe Real Estate Plc Annual Report and Accounts 2016 42
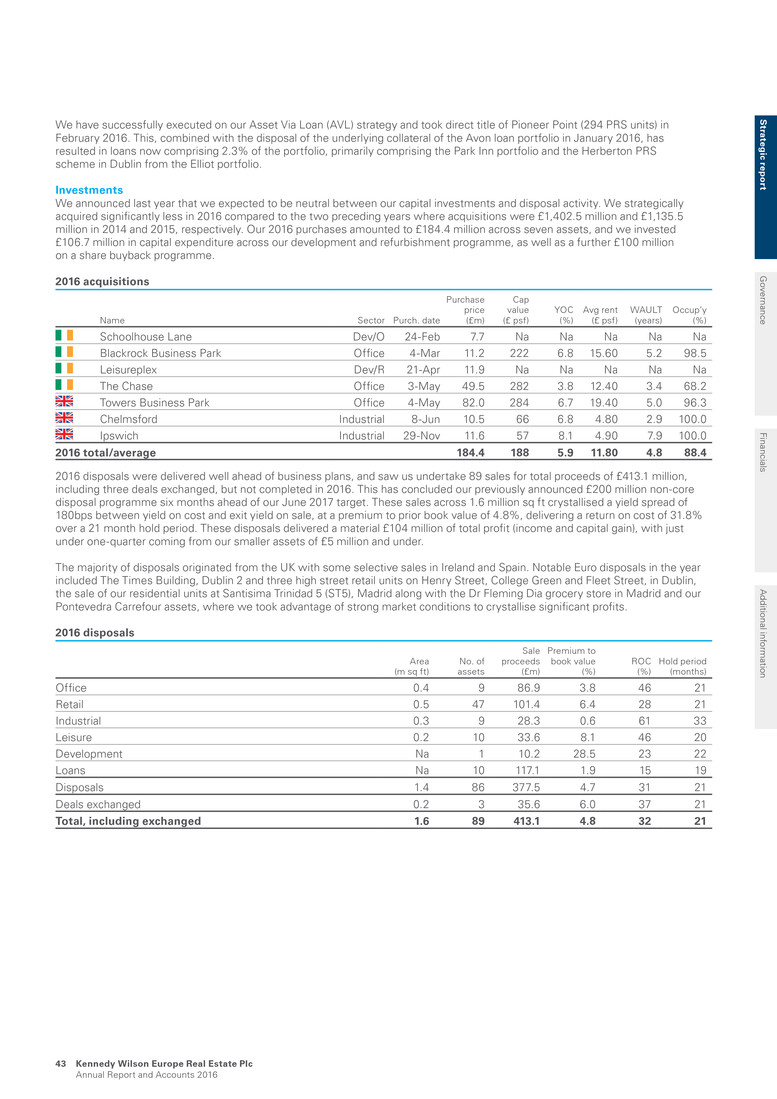
We have successfully executed on our Asset Via Loan (AVL) strategy and took direct title of Pioneer Point (294 PRS units) in February 2016. This, combined with the disposal of the underlying collateral of the Avon loan portfolio in January 2016, has resulted in loans now comprising 2.3% of the portfolio, primarily comprising the Park Inn portfolio and the Herberton PRS scheme in Dublin from the Elliot portfolio. Investments We announced last year that we expected to be neutral between our capital investments and disposal activity. We strategically acquired significantly less in 2016 compared to the two preceding years where acquisitions were £1,402.5 million and £1,135.5 million in 2014 and 2015, respectively. Our 2016 purchases amounted to £184.4 million across seven assets, and we invested £106.7 million in capital expenditure across our development and refurbishment programme, as well as a further £100 million on a share buyback programme. 2016 acquisitions Name Sector Purch. date Purchase price (£m) Cap value (£ psf) YOC (%) Avg rent (£ psf) WAULT (years) Occup’y (%) Schoolhouse Lane Dev/O 24-Feb 7.7 Na Na Na Na Na Blackrock Business Park Office 4-Mar 11.2 222 6.8 15.60 5.2 98.5 Leisureplex Dev/R 21-Apr 11.9 Na Na Na Na Na The Chase Office 3-May 49.5 282 3.8 12.40 3.4 68.2 Towers Business Park Office 4-May 82.0 284 6.7 19.40 5.0 96.3 Chelmsford Industrial 8-Jun 10.5 66 6.8 4.80 2.9 100.0 Ipswich Industrial 29-Nov 11.6 57 8.1 4.90 7.9 100.0 2016 total/average 184.4 188 5.9 11.80 4.8 88.4 2016 disposals were delivered well ahead of business plans, and saw us undertake 89 sales for total proceeds of £413.1 million, including three deals exchanged, but not completed in 2016. This has concluded our previously announced £200 million non-core disposal programme six months ahead of our June 2017 target. These sales across 1.6 million sq ft crystallised a yield spread of 180bps between yield on cost and exit yield on sale, at a premium to prior book value of 4.8%, delivering a return on cost of 31.8% over a 21 month hold period. These disposals delivered a material £104 million of total profit (income and capital gain), with just under one-quarter coming from our smaller assets of £5 million and under. The majority of disposals originated from the UK with some selective sales in Ireland and Spain. Notable Euro disposals in the year included The Times Building, Dublin 2 and three high street retail units on Henry Street, College Green and Fleet Street, in Dublin, the sale of our residential units at Santisima Trinidad 5 (ST5), Madrid along with the Dr Fleming Dia grocery store in Madrid and our Pontevedra Carrefour assets, where we took advantage of strong market conditions to crystallise significant profits. 2016 disposals Area (m sq ft) No. of assets Sale proceeds (£m) Premium to book value (%) ROC (%) Hold period (months) Office 0.4 9 86.9 3.8 46 21 Retail 0.5 47 101.4 6.4 28 21 Industrial 0.3 9 28.3 0.6 61 33 Leisure 0.2 10 33.6 8.1 46 20 Development Na 1 10.2 28.5 23 22 Loans Na 10 117.1 1.9 15 19 Disposals 1.4 86 377.5 4.7 31 21 Deals exchanged 0.2 3 35.6 6.0 37 21 Total, including exchanged 1.6 89 413.1 4.8 32 21 S trateg ic rep o rt G overnance Financials A dditional inform ation Kennedy Wilson Europe Real Estate Plc Annual Report and Accounts 2016 43
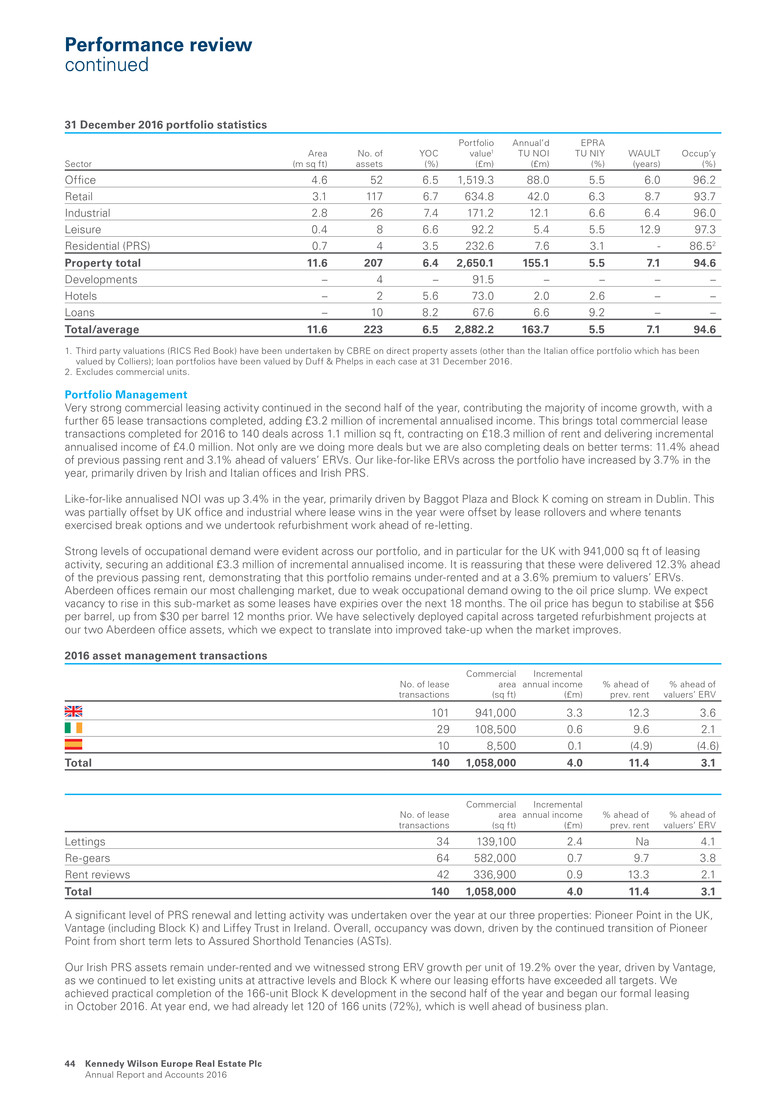
31 December 2016 portfolio statistics Sector Area (m sq ft) No. of assets YOC (%) Portfolio value1 (£m) Annual’d TU NOI (£m) EPRA TU NIY (%) WAULT (years) Occup’y (%) Office 4.6 52 6.5 1,519.3 88.0 5.5 6.0 96.2 Retail 3.1 117 6.7 634.8 42.0 6.3 8.7 93.7 Industrial 2.8 26 7.4 171.2 12.1 6.6 6.4 96.0 Leisure 0.4 8 6.6 92.2 5.4 5.5 12.9 97.3 Residential (PRS) 0.7 4 3.5 232.6 7.6 3.1 - 86.52 Property total 11.6 207 6.4 2,650.1 155.1 5.5 7.1 94.6 Developments – 4 – 91.5 – – – – Hotels – 2 5.6 73.0 2.0 2.6 – – Loans – 10 8.2 67.6 6.6 9.2 – – Total/average 11.6 223 6.5 2,882.2 163.7 5.5 7.1 94.6 1. Third party valuations (RICS Red Book) have been undertaken by CBRE on direct property assets (other than the Italian office portfolio which has been valued by Colliers); loan portfolios have been valued by Duff & Phelps in each case at 31 December 2016. 2. Excludes commercial units. Portfolio Management Very strong commercial leasing activity continued in the second half of the year, contributing the majority of income growth, with a further 65 lease transactions completed, adding £3.2 million of incremental annualised income. This brings total commercial lease transactions completed for 2016 to 140 deals across 1.1 million sq ft, contracting on £18.3 million of rent and delivering incremental annualised income of £4.0 million. Not only are we doing more deals but we are also completing deals on better terms: 11.4% ahead of previous passing rent and 3.1% ahead of valuers’ ERVs. Our like-for-like ERVs across the portfolio have increased by 3.7% in the year, primarily driven by Irish and Italian offices and Irish PRS. Like-for-like annualised NOI was up 3.4% in the year, primarily driven by Baggot Plaza and Block K coming on stream in Dublin. This was partially offset by UK office and industrial where lease wins in the year were offset by lease rollovers and where tenants exercised break options and we undertook refurbishment work ahead of re-letting. Strong levels of occupational demand were evident across our portfolio, and in particular for the UK with 941,000 sq ft of leasing activity, securing an additional £3.3 million of incremental annualised income. It is reassuring that these were delivered 12.3% ahead of the previous passing rent, demonstrating that this portfolio remains under-rented and at a 3.6% premium to valuers’ ERVs. Aberdeen offices remain our most challenging market, due to weak occupational demand owing to the oil price slump. We expect vacancy to rise in this sub-market as some leases have expiries over the next 18 months. The oil price has begun to stabilise at $56 per barrel, up from $30 per barrel 12 months prior. We have selectively deployed capital across targeted refurbishment projects at our two Aberdeen office assets, which we expect to translate into improved take-up when the market improves. 2016 asset management transactions No. of lease transactions Commercial area (sq ft) Incremental annual income (£m) % ahead of prev. rent % ahead of valuers’ ERV 101 941,000 3.3 12.3 3.6 29 108,500 0.6 9.6 2.1 10 8,500 0.1 (4.9) (4.6) Total 140 1,058,000 4.0 11.4 3.1 No. of lease transactions Commercial area (sq ft) Incremental annual income (£m) % ahead of prev. rent % ahead of valuers’ ERV Lettings 34 139,100 2.4 Na 4.1 Re-gears 64 582,000 0.7 9.7 3.8 Rent reviews 42 336,900 0.9 13.3 2.1 Total 140 1,058,000 4.0 11.4 3.1 A significant level of PRS renewal and letting activity was undertaken over the year at our three properties: Pioneer Point in the UK, Vantage (including Block K) and Liffey Trust in Ireland. Overall, occupancy was down, driven by the continued transition of Pioneer Point from short term lets to Assured Shorthold Tenancies (ASTs). Our Irish PRS assets remain under-rented and we witnessed strong ERV growth per unit of 19.2% over the year, driven by Vantage, as we continued to let existing units at attractive levels and Block K where our leasing efforts have exceeded all targets. We achieved practical completion of the 166-unit Block K development in the second half of the year and began our formal leasing in October 2016. At year end, we had already let 120 of 166 units (72%), which is well ahead of business plan. Performance review continued Kennedy Wilson Europe Real Estate Plc Annual Report and Accounts 2016 44
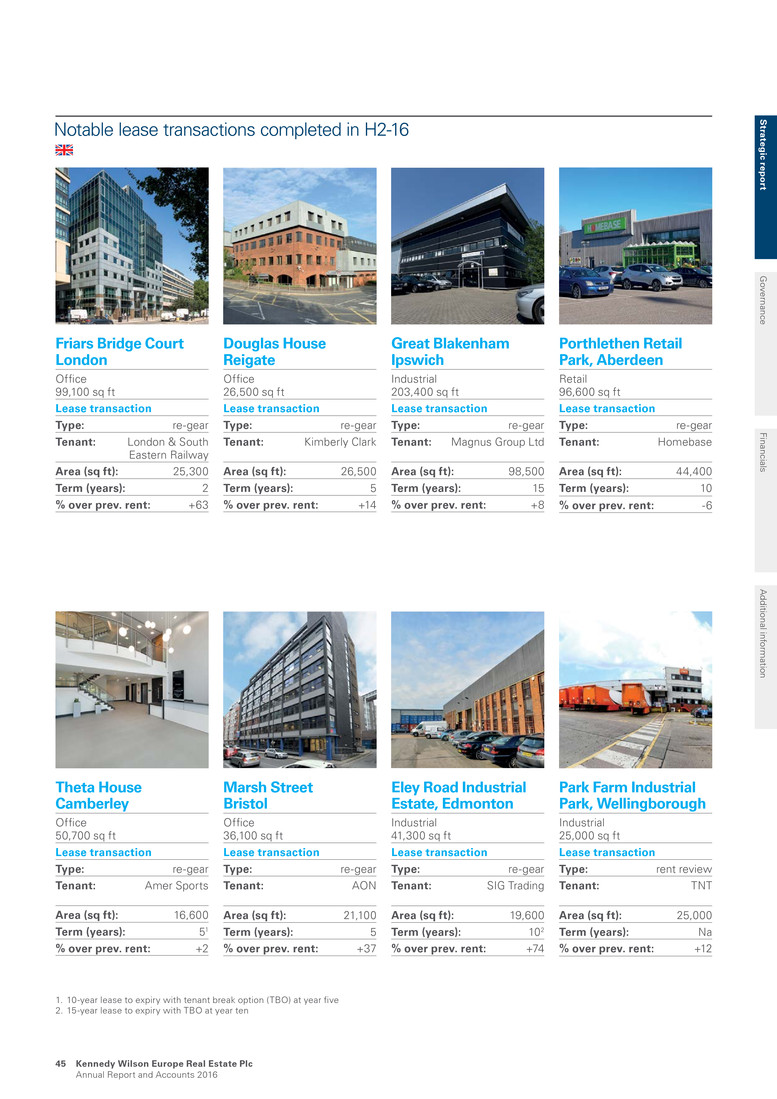
Notable lease transactions completed in H2-16 Friars Bridge Court London Office 99,100 sq ft Lease transaction Type: re-gear Tenant: London & South Eastern Railway Area (sq ft): 25,300 Term (years): 2 % over prev. rent: +63 Douglas House Reigate Office 26,500 sq ft Lease transaction Type: re-gear Tenant: Kimberly Clark Area (sq ft): 26,500 Term (years): 5 % over prev. rent: +14 Great Blakenham Ipswich Industrial 203,400 sq ft Lease transaction Type: re-gear Tenant: Magnus Group Ltd Area (sq ft): 98,500 Term (years): 15 % over prev. rent: +8 Porthlethen Retail Park, Aberdeen Retail 96,600 sq ft Lease transaction Type: re-gear Tenant: Homebase Area (sq ft): 44,400 Term (years): 10 % over prev. rent: -6 Theta House Camberley Office 50,700 sq ft Lease transaction Type: re-gear Tenant: Amer Sports Area (sq ft): 16,600 Term (years): 51 % over prev. rent: +2 Marsh Street Bristol Office 36,100 sq ft Lease transaction Type: re-gear Tenant: AON Area (sq ft): 21,100 Term (years): 5 % over prev. rent: +37 Eley Road Industrial Estate, Edmonton Industrial 41,300 sq ft Lease transaction Type: re-gear Tenant: SIG Trading Area (sq ft): 19,600 Term (years): 102 % over prev. rent: +74 Park Farm Industrial Park, Wellingborough Industrial 25,000 sq ft Lease transaction Type: rent review Tenant: TNT Area (sq ft): 25,000 Term (years): Na % over prev. rent: +12 1. 10-year lease to expiry with tenant break option (TBO) at year five 2. 15-year lease to expiry with TBO at year ten S trateg ic rep o rt G overnance Financials A dditional inform ation Kennedy Wilson Europe Real Estate Plc Annual Report and Accounts 2016 45

Notable lease transactions completed in H2-16 continued Theta House Camberley Office 50,700 sq ft Lease transaction Type: new lease Tenant: Surrey & Borders NHS Trust Area (sq ft): 16,500 Term (years): 71 % over prev. rent: prev. vacant Russell Court Dublin 2 Office 138,800 sq ft Lease transaction Type: re-gear Tenant: Government of Finland Area (sq ft): 2,600 Term (years): 10 % over prev. rent: +6 Porthlethen Retail Park, Aberdeen Retail 96,600 sq ft Lease transaction Type: new lease Tenant: B&M Area (sq ft): 23,000 Term (years): 15 % over prev. rent: prev. vacant Vantage Dublin 18 Office 17,8004 sq ft Lease transaction Type: new lease Tenant: Dyson Area (sq ft): 3,800 Term (years): 65 % over prev. rent: prev. vacant 8 Wells Place Mertsham Industrial 19,400 sq ft Lease transaction Type: new lease Tenant: FG Curtis Area (sq ft): 19,400 Term (years): 102 % over prev. rent: prev. vacant Southbank House Dublin 4 Office 62,100 sq ft Lease transaction Type: rent review Tenant: Mason Hayes & Curran Area (sq ft): 62,100 Term (years): Na % over prev. rent: +6 6 Lochside Edinburgh Office 40,000 sq ft Lease transaction Type: new lease Tenant: HSBC Area (sq ft): 9,000 Term (years): 53 % over prev. rent: prev. vacant Blackrock Business Park, Dublin 18 Office 50,500 sq ft Lease transaction Type: rent review Tenant: Ipsos MRBI Area (sq ft): 4,600 Term (years): Na % over prev. rent: +16 Performance review continued 1. 14-year lease to expiry with TBO at year seven 2. 15-year lease to expiry with TBO at year ten 3. 10-year lease to expiry with tenant break option (TBO) at year five 4. Area of commercial space 5. 10-year lease to expiry with TBO at year six Kennedy Wilson Europe Real Estate Plc Annual Report and Accounts 2016 46
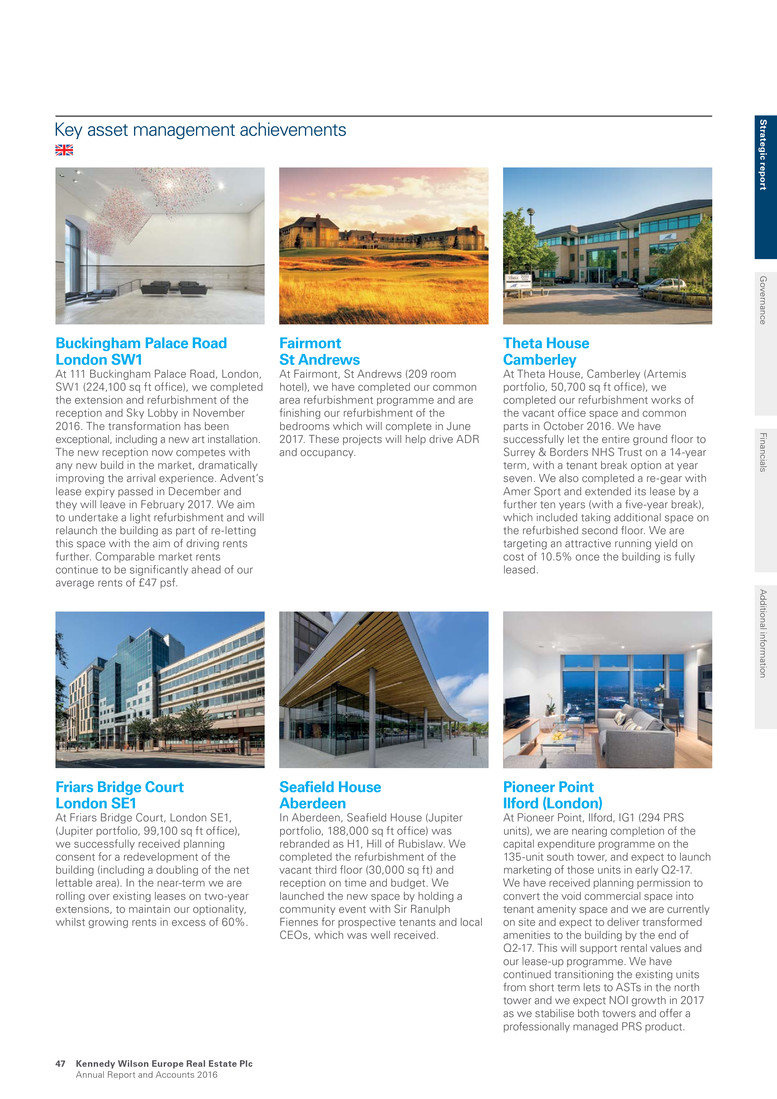
Key asset management achievements Friars Bridge Court London SE1 At Friars Bridge Court, London SE1, (Jupiter portfolio, 99,100 sq ft office), we successfully received planning consent for a redevelopment of the building (including a doubling of the net lettable area). In the near-term we are rolling over existing leases on two-year extensions, to maintain our optionality, whilst growing rents in excess of 60%. Buckingham Palace Road London SW1 At 111 Buckingham Palace Road, London, SW1 (224,100 sq ft office), we completed the extension and refurbishment of the reception and Sky Lobby in November 2016. The transformation has been exceptional, including a new art installation. The new reception now competes with any new build in the market, dramatically improving the arrival experience. Advent’s lease expiry passed in December and they will leave in February 2017. We aim to undertake a light refurbishment and will relaunch the building as part of re-letting this space with the aim of driving rents further. Comparable market rents continue to be significantly ahead of our average rents of £47 psf. Fairmont St Andrews At Fairmont, St Andrews (209 room hotel), we have completed our common area refurbishment programme and are finishing our refurbishment of the bedrooms which will complete in June 2017. These projects will help drive ADR and occupancy. Pioneer Point Ilford (London) At Pioneer Point, Ilford, IG1 (294 PRS units), we are nearing completion of the capital expenditure programme on the 135-unit south tower, and expect to launch marketing of those units in early Q2-17. We have received planning permission to convert the void commercial space into tenant amenity space and we are currently on site and expect to deliver transformed amenities to the building by the end of Q2-17. This will support rental values and our lease-up programme. We have continued transitioning the existing units from short term lets to ASTs in the north tower and we expect NOI growth in 2017 as we stabilise both towers and offer a professionally managed PRS product. Theta House Camberley At Theta House, Camberley (Artemis portfolio, 50,700 sq ft office), we completed our refurbishment works of the vacant office space and common parts in October 2016. We have successfully let the entire ground floor to Surrey & Borders NHS Trust on a 14-year term, with a tenant break option at year seven. We also completed a re-gear with Amer Sport and extended its lease by a further ten years (with a five-year break), which included taking additional space on the refurbished second floor. We are targeting an attractive running yield on cost of 10.5% once the building is fully leased. Seafield House Aberdeen In Aberdeen, Seafield House (Jupiter portfolio, 188,000 sq ft office) was rebranded as H1, Hill of Rubislaw. We completed the refurbishment of the vacant third floor (30,000 sq ft) and reception on time and budget. We launched the new space by holding a community event with Sir Ranulph Fiennes for prospective tenants and local CEOs, which was well received. S trateg ic rep o rt G overnance Financials A dditional inform ation Kennedy Wilson Europe Real Estate Plc Annual Report and Accounts 2016 47

Key asset management achievements continued Performance review continued Portmarnock Hotel & Golf Links, Dublin At Portmarnock Hotel & Golf Links, Co. Dublin (135 room hotel), extensive refurbishment to the exterior entrance, bedrooms, lounges, reception and restaurant areas completed in the year. Customers’ reaction to the improvements have been very positive and culminated with the Irish Golf Tour Operators awarding the hotel Irish Golf Resort of the Year for 2016. School House Lane Dublin At School House Lane, Dublin 2 (13,300 sq ft office redevelopment), we received our planning consent in Q3-16 to extend the building to approximately 16,000 sq ft. We are currently on site and expect to complete the full works by summer 2017 and are targeting a stabilised yield of approximately 6.3%, once the building is fully let. Baggot Plaza Dublin At Baggot Plaza, Dublin 4 (Opera portfolio,129,300 sq ft office redevelopment), practical completion and handover to the Bank of Ireland (BOI) was achieved on 1 July 2016. BOI staff commenced occupation in mid-August, well ahead of BOI’s original target of Q2-17 which showcases our commitment to partnering with our tenants to achieve the desired result of early occupation. KWE agreed a pre-let for the entire building to Bank of Ireland on a 25-year lease (20-year term certain) at a headline rent of €47.50 psf in Q4-15 reflecting a stabilised yield on cost of 8.6%. Stillorgan Shopping Centre Dublin At Stillorgan Shopping Centre, Dublin 18, (Opera portfolio, 142,300 sq ft retail), we obtained planning permission to build a new extension unit of c. 11,000 sq ft. In conjunction with this, we signed an agreement for lease with Tesco, the main anchor, for a new 25-year lease (term certain of 15 years). The deal will see Tesco move into this space, allowing it to expand the grocery offer. The transaction will unlock new asset management opportunities to further improve tenant mix and increase the rent roll. The recent acquisition of Leisureplex adjacent to Stillorgan provides further opportunities for the centre. We are in early stages of design for a potential mixed use scheme offering retail and PRS uses. Block K Vantage Central Park, Dublin At Block K Vantage at Central Park, Dublin 18 (166 PRS units and 15,000 sq ft of commercial space), practical completion was achieved at the end of July 2016 and we began letting units in October 2016. By year end we had successfully let 120 of the 166 units, a significant achievement and at rents ahead of business plan. The development complements the existing 276-unit Vantage scheme and brings KWE’s total ownership at Central Park to 442 PRS units and 34,000 sq ft of commercial space. The Chase Dublin At The Chase in Dublin 18 (175,600 sq ft), the partial fit-out works of the vacant office space (55,200 sq ft) completed by year-end. We have also engaged a design team to undertake a refurbishment and remodelling of some of the ground floor to create an impressive reception commensurate with the quality and size of the building. Contractors are now on site and we expect to complete these works by Q3-17. Kennedy Wilson Europe Real Estate Plc Annual Report and Accounts 2016 48

Santisima Trinidad 5 Madrid At Santisima Trinidad 5, Madrid (31,750 sq ft commercial to residential conversion), we have completed the sale of 22 of 24 available units in this high end residential block with 28 parking spaces. Since year-end, we sold one further unit, leaving one penthouse unit available for sale. Puerta del Sol 9 Madrid At Puerta del Sol 9, Madrid (37,000 sq ft commercial/residential conversion to retail redevelopment), which is located on one of Madrid’s busiest squares, we submitted a planning application to convert to retail use as a flagship store. We have received positive preliminary feedback from both the municipality and potential retail tenants. S trateg ic rep o rt G overnance Financials A dditional inform ation Kennedy Wilson Europe Real Estate Plc Annual Report and Accounts 2016 49

Financial key performance indicators (KPIs) 31 December 2016 31 December 2015 Total accounting return (%) 7.6 18.0 Adjusted NAV per share (p) 1,215.9 1,174.5 Adjusted earnings per share (p) 55.2 47.9 Dividends paid (p) 48.0 35.0 LTV (%) 42.8 39.7 Weighted average cost of debt (%) 3.0 2.9 “The strong double-digit growth across all income metrics in 2016 reflects the successful execution of our operational strategy since IPO.“ Fraser Kennedy Head of Finance, Kennedy Wilson Europe Overview The 2016 financial results reflect continued positive profits and earnings growth. NOI grew to £160.3 million, an increase of 23% on the prior year primarily owing to the benefit of acquisitions along with successful leasing levels; partly offset by disposals activity. This resulted in increased adjusted earnings of 55.2 pence per share, a 15.2% increase on 2015. Increased earnings have been reflected in dividend levels paid in the year which amounted to 48.0 pence per share, 2015: 35.0 pence per share, a 37% year on year increase and meeting the target we set last year. The dividend cover from adjusted earnings was 1.1 times during 2016. The first interim dividend of 2017 declared by the Board of 12.0 pence per share will continue to provide a sustainable and attractive dividend yield for our investors. The total accounting return for the year was 7.6% which was the combination of NAV per share growth primarily driven by the accretive share buyback programme, solid retained earnings as well as a small element of foreign exchange gain plus dividends paid, which contributed 4.1% to the total return. In June 2016, our investment grade credit rating was reaffirmed by S&P and we have continued to actively manage our debt profile to increase the mix of unsecured debt. This was achieved through a successful £200 million tap of our 2022 £300 million notes which were issued in June 2015 and a €150 million tap of our 2025 €400 million notes issued in November 2015. Finance review Kennedy Wilson Europe Real Estate Plc Annual Report and Accounts 2016 50

Secured debt principal totalling £230.0 million was repaid in the year and, as a consequence, unsecured debt represents 57% of all debt drawn at year end. This positive financing activity has resulted in our average term to maturity increasing to 6.1 years (2015: 5.9 years). Our weighted average cost of debt is a competitive 3.0% which also enjoys a high level of certainty given 92% of borrowings are fixed rate or hedged by way of interest rate caps. In September 2016, we announced a share buyback programme of £100 million which completed on 28 November. This added 1.2% to the NAV per share return in the year and demonstrates our ongoing commitment to proactive balance sheet management. Net operating income Net operating income consists of net rental income, the hotel earnings and loan portfolio interest income. The chief drivers of the notable net operating income growth in the year are the full period impact of acquisitions completed in 2015 and part period impact of those acquisitions completed in the year, along with a successful level of leasing activity. This was partly offset by increased disposals for 2016, in excess of our targets. Administrative expenses Total administrative expenses (excluding hotel operations, which are included in NOI) are £11.6 million (2015: £10.9 million). A significant proportion of the expenses are fixed in nature which means that as the Group has become more fully invested the administrative expenses as a percentage of NOI have dropped to 7.2% from 8.4% in 2015. The cost to portfolio value ratio of 40bps is in line with the expectation at the half-year. Investment Management fees Investment Manager fees The Investment Manager receives a management fee at an annual rate of 1.0% of the Group’s EPRA NAV, payable quarterly. The fee is settled 50% in cash and 50% in shares, in line with the investment management agreement. Where the prevailing share price is at a discount to IFRS NAV, an amount equivalent to the fee is applied insofar as possible towards market purchases of existing shares. The total management fee for 2016 is £16.3 million (2015: £15.2 million). The management fee in respect of the fourth quarter is £3.9 million, where the 50% share component is expected to be settled through market purchases of existing shares. Performance fee The 2016 performance fee threshold was not met and a performance fee charge has not been recognised in the income statement. To be eligible for a performance fee in 2017 the minimum total return required is 10% of the 31 December 2016 EPRA NAV of 1,217.4 pence per share. Financing costs Net finance costs increased to £57.1 million during 2016 (2015: £36.2 million). This increase reflects the normal level of leverage for the Group, as the balance sheet has matured beyond the initial investment phases post IPO in 2014 and 2015. Included within finance costs are amortisation of capitalised loan arrangement fees together with commitment fees in respect of the revolving credit facility. Fair value of uncrystallised foreign exchange movements of £1.8 million are also included in the charge. We repaid £230.0 million of secured debt in the year and debt close out costs on early repayment of secured borrowings amounted to only £0.2 million in the year. Increasing our fixed rate unsecured notes has resulted in 71% of borrowings being fixed, with 92% of borrowings fixed when including hedges by way of interest rate caps. Tax The Group tax charge for the year was £7.3 million (2015: £7.6 million) representing an effective rate of tax of 9.0% on adjusted earnings before taxation (2015: 10.5%). The charge is reduced from 2015 primarily due to a number of successful capital allowance reviews completed in 2016 in respect of the UK investment property portfolio. A deferred taxation charge has been recognised in respect of fair value gains in the Spanish portfolio where the Group is subject to corporate income tax. S trateg ic rep o rt G overnance Financials A dditional inform ation Kennedy Wilson Europe Real Estate Plc Annual Report and Accounts 2016 51
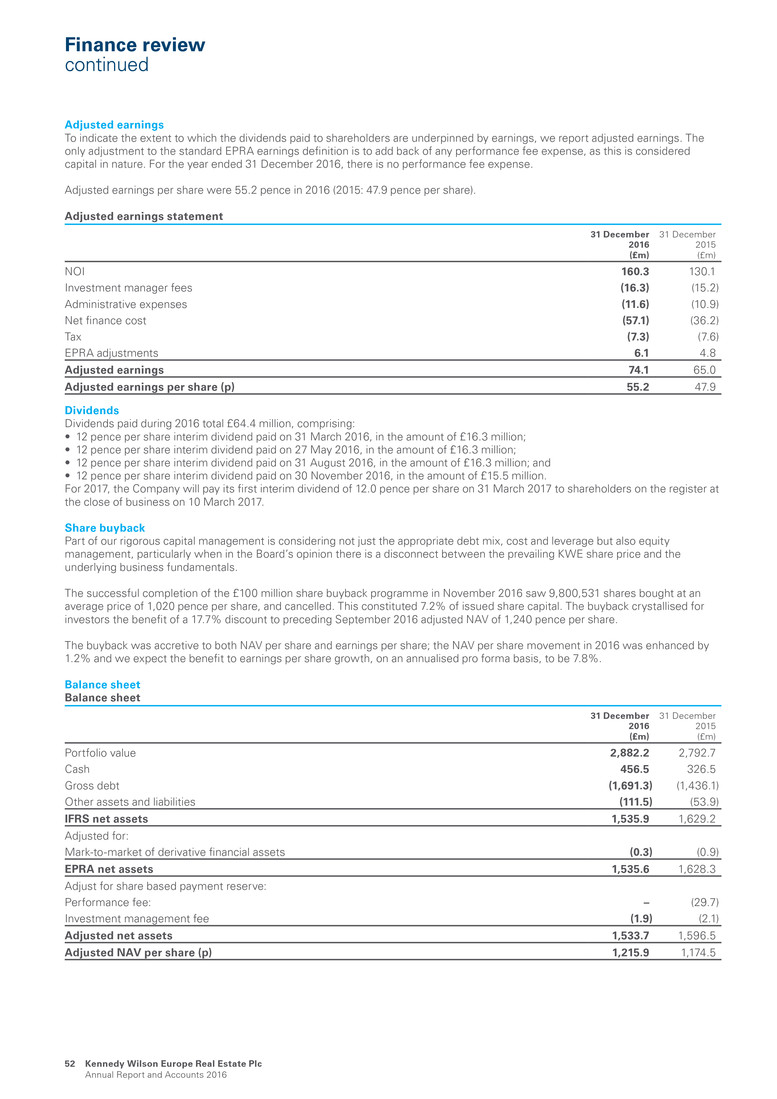
Adjusted earnings To indicate the extent to which the dividends paid to shareholders are underpinned by earnings, we report adjusted earnings. The only adjustment to the standard EPRA earnings definition is to add back of any performance fee expense, as this is considered capital in nature. For the year ended 31 December 2016, there is no performance fee expense. Adjusted earnings per share were 55.2 pence in 2016 (2015: 47.9 pence per share). Adjusted earnings statement 31 December 2016 (£m) 31 December 2015 (£m) NOI 160.3 130.1 Investment manager fees (16.3) (15.2) Administrative expenses (11.6) (10.9) Net finance cost (57.1) (36.2) Tax (7.3) (7.6) EPRA adjustments 6.1 4.8 Adjusted earnings 74.1 65.0 Adjusted earnings per share (p) 55.2 47.9 Dividends Dividends paid during 2016 total £64.4 million, comprising: • 12 pence per share interim dividend paid on 31 March 2016, in the amount of £16.3 million; • 12 pence per share interim dividend paid on 27 May 2016, in the amount of £16.3 million; • 12 pence per share interim dividend paid on 31 August 2016, in the amount of £16.3 million; and • 12 pence per share interim dividend paid on 30 November 2016, in the amount of £15.5 million. For 2017, the Company will pay its first interim dividend of 12.0 pence per share on 31 March 2017 to shareholders on the register at the close of business on 10 March 2017. Share buyback Part of our rigorous capital management is considering not just the appropriate debt mix, cost and leverage but also equity management, particularly when in the Board’s opinion there is a disconnect between the prevailing KWE share price and the underlying business fundamentals. The successful completion of the £100 million share buyback programme in November 2016 saw 9,800,531 shares bought at an average price of 1,020 pence per share, and cancelled. This constituted 7.2% of issued share capital. The buyback crystallised for investors the benefit of a 17.7% discount to preceding September 2016 adjusted NAV of 1,240 pence per share. The buyback was accretive to both NAV per share and earnings per share; the NAV per share movement in 2016 was enhanced by 1.2% and we expect the benefit to earnings per share growth, on an annualised pro forma basis, to be 7.8%. Balance sheet Balance sheet 31 December 2016 (£m) 31 December 2015 (£m) Portfolio value 2,882.2 2,792.7 Cash 456.5 326.5 Gross debt (1,691.3) (1,436.1) Other assets and liabilities (111.5) (53.9) IFRS net assets 1,535.9 1,629.2 Adjusted for: Mark-to-market of derivative financial assets (0.3) (0.9) EPRA net assets 1,535.6 1,628.3 Adjust for share based payment reserve: Performance fee: – (29.7) Investment management fee (1.9) (2.1) Adjusted net assets 1,533.7 1,596.5 Adjusted NAV per share (p) 1,215.9 1,174.5 Finance review continued Kennedy Wilson Europe Real Estate Plc Annual Report and Accounts 2016 52

Portfolio valuation As at 31 December 2016, the investment portfolio value was £2,882.2 million, reflecting net selling activity in the year, offset by foreign exchange gains. Notably, the small negative valuation movement was only £8.6 million or -0.3%, reflecting strong performance of our Euro assets (+£69.0 million) offsetting falls in the UK (-£77.6 million), illustrating the benefits of our geographically diversified portfolio. Portfolio valuation movements (£m) 2015 portfolio valuation 2,792.7 Valuation movement (8.6) Acquisitions 189.2 Disposals (362.9) Capital expenditure 106.7 Foreign exchange/other 165.1 2016 portfolio valuation 2,882.2 Adjusted NAV We report Adjusted NAV to illustrate EPRA NAV after the impact of the fees recognised in the share-based payments reserve. The 3.5% Adjusted NAV per share growth reflects retained earnings, including gains on sale from disposals, which reflected a 4.8% premium over preceding valuation, and the benefit of the share buyback. Foreign exchange also contributed but comparing to the portfolio level gain it is clear that our hedging policy worked well during the year to significantly reduce the impact of substantial Euro strengthening. At year end, 87% of Euro assets were hedged, 66% through local currency borrowing and 21% through derivative instruments. EPRA NAV movements (£m) (p per share) 2015 adjusted NAV 1,596.5 1,174.5 Valuation movement (8.6) Gains on sale 8.5 Adjusted earnings 74.1 Dividends (64.4) Share buyback (100.0) Foreign exchange/other 27.6 2016 adjusted NAV 1,533.7 1,215.9 Cash flow and treasury management Liquidity, comprising cash and undrawn facilities, totals £681.5 million at 31 December 2016, compared with £551.5 million at 31 December 2015. The major sources of cash during the year were: • Proceeds from predominantly unsecured financing activity of £391.6 million • Proceeds on disposal of assets, which generated cash of £371.6 million KWE maintains a £225.0 million multi-currency revolving credit facility. At 31 December 2016, the full £225.0 million facility was available to be drawn. The Group’s interest rate hedging policy is to eliminate substantially the risk associated with interest rate volatility, through a combination of fixed rate borrowings and, in respect of floating rate debt, the use of interest rate caps. S trateg ic rep o rt G overnance Financials A dditional inform ation Kennedy Wilson Europe Real Estate Plc Annual Report and Accounts 2016 53
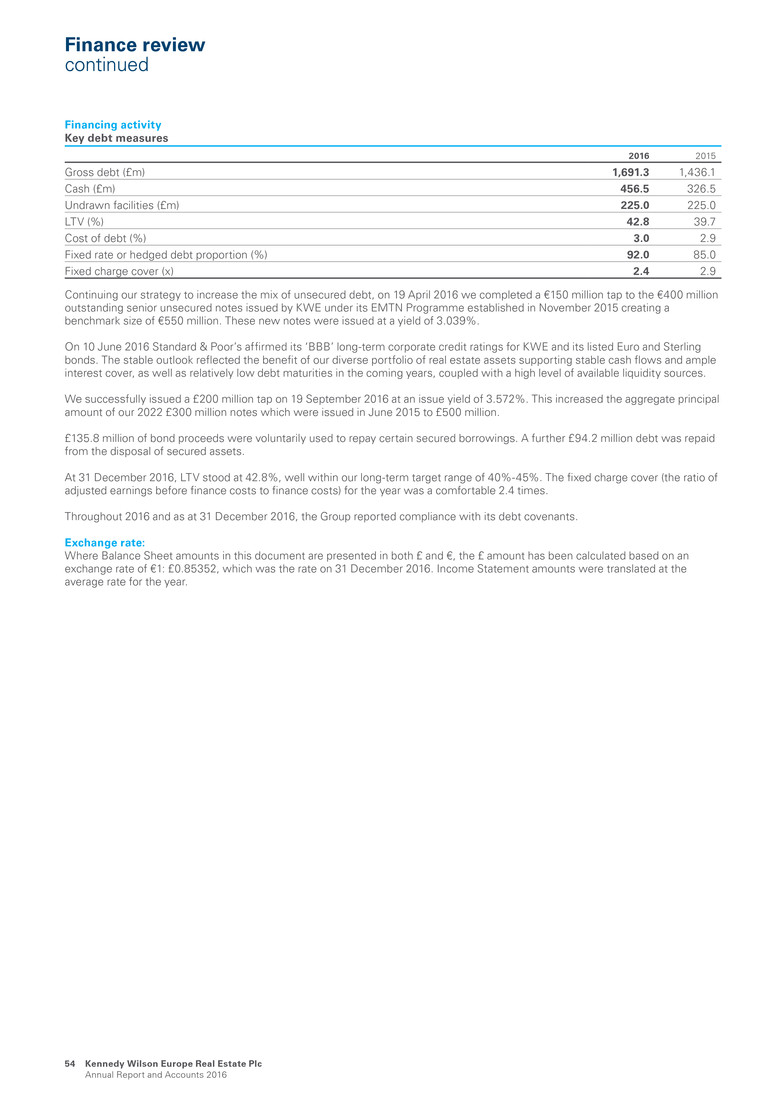
Financing activity Key debt measures 2016 2015 Gross debt (£m) 1,691.3 1,436.1 Cash (£m) 456.5 326.5 Undrawn facilities (£m) 225.0 225.0 LTV (%) 42.8 39.7 Cost of debt (%) 3.0 2.9 Fixed rate or hedged debt proportion (%) 92.0 85.0 Fixed charge cover (x) 2.4 2.9 Continuing our strategy to increase the mix of unsecured debt, on 19 April 2016 we completed a €150 million tap to the €400 million outstanding senior unsecured notes issued by KWE under its EMTN Programme established in November 2015 creating a benchmark size of €550 million. These new notes were issued at a yield of 3.039%. On 10 June 2016 Standard & Poor’s affirmed its ‘BBB’ long-term corporate credit ratings for KWE and its listed Euro and Sterling bonds. The stable outlook reflected the benefit of our diverse portfolio of real estate assets supporting stable cash flows and ample interest cover, as well as relatively low debt maturities in the coming years, coupled with a high level of available liquidity sources. We successfully issued a £200 million tap on 19 September 2016 at an issue yield of 3.572%. This increased the aggregate principal amount of our 2022 £300 million notes which were issued in June 2015 to £500 million. £135.8 million of bond proceeds were voluntarily used to repay certain secured borrowings. A further £94.2 million debt was repaid from the disposal of secured assets. At 31 December 2016, LTV stood at 42.8%, well within our long-term target range of 40%-45%. The fixed charge cover (the ratio of adjusted earnings before finance costs to finance costs) for the year was a comfortable 2.4 times. Throughout 2016 and as at 31 December 2016, the Group reported compliance with its debt covenants. Exchange rate: Where Balance Sheet amounts in this document are presented in both £ and €, the £ amount has been calculated based on an exchange rate of €1: £0.85352, which was the rate on 31 December 2016. Income Statement amounts were translated at the average rate for the year. Finance review continued Kennedy Wilson Europe Real Estate Plc Annual Report and Accounts 2016 54

Unlocking value from the Elliott loan portfolio 1. Bottom up investment strategy We acquired the Elliott loan portfolio off market in September 2014 for €75.5 million, compared to an unpaid principal balance of €202.3 million. The loan portfolio comprised of underlying collateral across 17 assets but the key attractions were the Times Building, Lakeland Retail Park and Herberton PRS scheme, comprising 90% of the portfolio value. 2. Active asset & portfolio management We grew NOI at the Times building and Lakeland Retail Park by 38% and 55%, respectively, by repositioning both assets, which led to improved leasing. 3. Asset repositioning The loan portfolio was transformed by converting the underlying collateral of the Times Building and Lakeland in June and September 2015, respectively. We then completed our asset management plans and sold these assets over the course of 2016 at a return cost of 31% for the Times Building and 40% for Lakeland. We are the asset manager at Herberton and will look to take title over the next 12 months. Realisations to date €78.5m Return on cost on Times and Lakeland disposals 32.4% Unlocking value 2. Active asset & portfolio management 1. Bottom up investment strategy 3. Asset repositioning 4. Rigorous capital management Elliott loan portfolio, Ireland 17 loan assets Acquired September 2014 Herberton loan, Dublin 8 136 units of rented residential (PRS) Lakeland Retail Park, Cavan Conversion to direct real estate September 2015 83,000 sq ft retail park Irish Times Building, Dublin 2 Conversion to direct real estate June 2015 76,000 sq ft office S trateg ic rep o rt G overnance Financials A dditional inform ation Kennedy Wilson Europe Real Estate Plc Annual Report and Accounts 2016 55

Governance 57 Letter from the Chair 59 Our statements of compliance 62 Board composition 62 Biographies 62 Leadership 67 Letter from the chair of the Nominations Committee 69 Effectiveness 70 Letter from the chair of the Audit Committee 74 Accountability 75 Letter from the chair of the Management Engagement Committee 76 Remuneration 77 Relations with shareholders 78 Directors’ report 80 Statement of Directors’ responsibilities Southbank House, Dublin, Ireland Part of the Opera portfolio, acquired June 2014 56 Kennedy Wilson Europe Real Estate Plc Annual Report and Accounts 2016
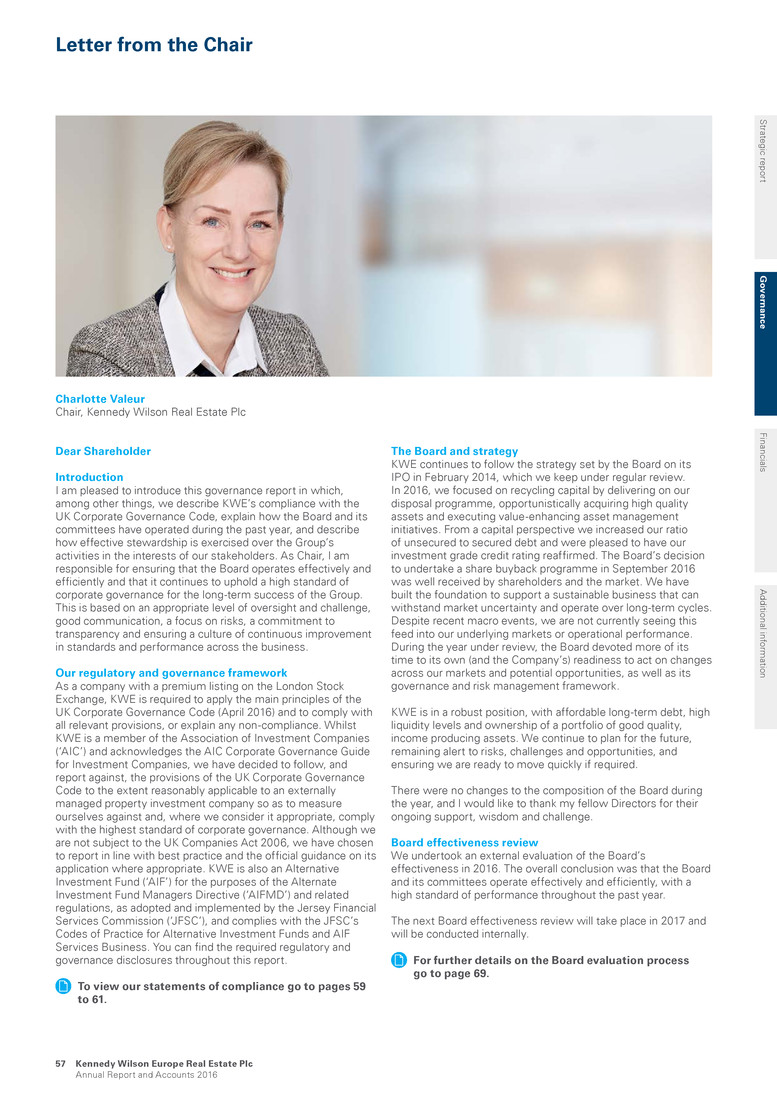
Charlotte Valeur Chair, Kennedy Wilson Real Estate Plc Letter from the Chair Dear Shareholder Introduction I am pleased to introduce this governance report in which, among other things, we describe KWE’s compliance with the UK Corporate Governance Code, explain how the Board and its committees have operated during the past year, and describe how effective stewardship is exercised over the Group’s activities in the interests of our stakeholders. As Chair, I am responsible for ensuring that the Board operates effectively and efficiently and that it continues to uphold a high standard of corporate governance for the long-term success of the Group. This is based on an appropriate level of oversight and challenge, good communication, a focus on risks, a commitment to transparency and ensuring a culture of continuous improvement in standards and performance across the business. Our regulatory and governance framework As a company with a premium listing on the London Stock Exchange, KWE is required to apply the main principles of the UK Corporate Governance Code (April 2016) and to comply with all relevant provisions, or explain any non-compliance. Whilst KWE is a member of the Association of Investment Companies (‘AIC’) and acknowledges the AIC Corporate Governance Guide for Investment Companies, we have decided to follow, and report against, the provisions of the UK Corporate Governance Code to the extent reasonably applicable to an externally managed property investment company so as to measure ourselves against and, where we consider it appropriate, comply with the highest standard of corporate governance. Although we are not subject to the UK Companies Act 2006, we have chosen to report in line with best practice and the official guidance on its application where appropriate. KWE is also an Alternative Investment Fund (‘AIF’) for the purposes of the Alternate Investment Fund Managers Directive (‘AIFMD’) and related regulations, as adopted and implemented by the Jersey Financial Services Commission (‘JFSC’), and complies with the JFSC’s Codes of Practice for Alternative Investment Funds and AIF Services Business. You can find the required regulatory and governance disclosures throughout this report. To view our statements of compliance go to pages 59 to 61. The Board and strategy KWE continues to follow the strategy set by the Board on its IPO in February 2014, which we keep under regular review. In 2016, we focused on recycling capital by delivering on our disposal programme, opportunistically acquiring high quality assets and executing value-enhancing asset management initiatives. From a capital perspective we increased our ratio of unsecured to secured debt and were pleased to have our investment grade credit rating reaffirmed. The Board’s decision to undertake a share buyback programme in September 2016 was well received by shareholders and the market. We have built the foundation to support a sustainable business that can withstand market uncertainty and operate over long-term cycles. Despite recent macro events, we are not currently seeing this feed into our underlying markets or operational performance. During the year under review, the Board devoted more of its time to its own (and the Company’s) readiness to act on changes across our markets and potential opportunities, as well as its governance and risk management framework. KWE is in a robust position, with affordable long-term debt, high liquidity levels and ownership of a portfolio of good quality, income producing assets. We continue to plan for the future, remaining alert to risks, challenges and opportunities, and ensuring we are ready to move quickly if required. There were no changes to the composition of the Board during the year, and I would like to thank my fellow Directors for their ongoing support, wisdom and challenge. Board effectiveness review We undertook an external evaluation of the Board’s effectiveness in 2016. The overall conclusion was that the Board and its committees operate effectively and efficiently, with a high standard of performance throughout the past year. The next Board effectiveness review will take place in 2017 and will be conducted internally. For further details on the Board evaluation process go to page 69. Strategic report Govern an ce Financials A dditional inform ation Kennedy Wilson Europe Real Estate Plc Annual Report and Accounts 2016 57
Sustainability The Board is mindful of the way that KWE (and its priorities) fits with and supports wider goals in society. In my view, this wider social perspective is an essential ingredient to be considered by any board when making decisions to ensure that longer term viability is properly taken into account. The risks that could affect KWE specifically, together with broader threats affecting the property sector or the economy as a whole, are outlined Managing risk on pages 35 to 40. This is supplemented (as in last year’s report) by the inclusion of a viability statement, for which the Board has again chosen to use a three-year time horizon. To view the viability statement go to page 61. Sustainability in a broad sense was a key topic of discussion at our Board meetings in 2016 and we have issued a separate sustainability report that sets out our approach to responsible investment in the medium term and describes our 2016 activity. For more details go to pages 27 to 33. Changing risk landscape and year ahead Risk management and the nature of the principal risks facing the Company are discussed by the Board on at least a quarterly basis. For more details on the Company’s risks and uncertainties go to pages 35 to 40. The legislative environment and market conditions in which any business operates are constantly changing. For KWE, the future may be affected by many factors, not least being the UK’s terms of trade with the EU. This will undoubtedly result in a lengthy period of uncertainty during the formalisation of exit terms and may adversely impact occupiers, valuations, investment decisions and stock markets. Our portfolio and business have shown tremendous resilience to market volatility and uncertainty following the referendum result in June 2016. We believe the Group is well-positioned to deal with this uncertainty given its strong liquidity position and the significant proportion of Euro assets in the investment portfolio; however, the longer-term impact on the Group is harder to predict. The Board will continue to work closely with the Investment Manager to ensure that it addresses these risks in a way that is consistent with the Group’s strategy and vision. Thank you On behalf of the Board, I would like to thank the investment management team at Kennedy Wilson and all our advisors for their work, energy and passion throughout the year, and for the results that they have achieved. I am confident that we have an excellent team at Kennedy Wilson to steer KWE through the challenges and opportunities ahead. Charlotte Valeur Chair Letter from the Chair continued Our statements of compliance How we set high governance standards For more information go to pages 59 to 61 Leadership How the Board and its committees lead to deliver our strategy For more information go to pages 62 to 66 Effectiveness How the Board evaluates itself and ensures it has the right skills and balance For more information go to page 69 Accountability How the Audit Committee fulfils its oversight responsibilities For more information go to page 74 Remuneration How we follow appropriate standards in line with best practice For more information go to page 76 Relations with shareholders How we constructively engage with our stakeholders For more information go to page 77 Kennedy Wilson Europe Real Estate Plc Annual Report and Accounts 2016 58
Our statements of compliance UK Corporate Governance Code compliance As a Board, we support and are committed to implementing high standards of corporate governance as well as the development of corporate governance policies and procedures derived from the UK Corporate Governance Code. We consider that reporting in line with the principles and provisions of the UK Corporate Governance Code, with explanations as necessary, and taking account of the AIC Corporate Governance Guide for Investment Companies (the ‘AIC Guide’) where appropriate, ensures full transparency and provides clear information for all our stakeholders. A copy of the UK Corporate Governance Code is publicly available at www.frc.org.uk. The AIC Guide can be found at www.theaic.co.uk. The Board considers that KWE complied throughout 2016 with those provisions of the UK Corporate Governance Code (September 2014) that the Board considers to be applicable to the Company, except as set out below. The Board does not have a formally written schedule of reserved matters (A.1.1). This is explained as follows: The Board meets sufficiently regularly to discharge its duties effectively. Being externally managed, except for matters involving any conflict of interest, the Board has granted full discretionary authority to make all investment and financing decisions (on behalf of the Group) to the Investment Manager. However, the Board is responsible for determining the Company’s strategy and investment policy, its corporate governance practices, and is responsible for overseeing the performance of the Investment Manager and other service providers. For further details on the role of the Board go to page 65. For the reasons set out in the AIC Guide, and in line with Chapter 15 of the UK Listing Rules, the Board also considers that the following provisions of the UK Corporate Governance Code are not relevant to the Company as an externally managed investment company with no executive employees and accordingly has not reported on them: • the role of a chief executive (A.2.1) • remuneration arrangements for executive directors (D.1.1, D.1.2 and D.2.4) • the establishment and role of a remuneration committee (D.2.1 and D.2.2) The Board further notes that it considers an internal audit function to be unnecessary at the moment as the Company’s risk exposure and the effectiveness of the risk management and internal control systems are monitored by the Investment Manager. These are further reviewed by the Audit Committee, which also acts as a risk committee, with oversight from the Board and, where the Board considers it appropriate, the Investment Manager group’s internal control functions provide the appropriate framework and support. Application of the Code principles We have structured this section around the main principles of the UK Corporate Governance Code to enable shareholders to evaluate how the principles have been applied. Leadership The role of the Board The Board is collectively responsible for promoting the success of the Group by directing and supervising the Group’s investment policy and strategy, and is responsible to shareholders for the Group’s financial and operational performance and risk management. Responsibility for the development and implementation of the Group’s investment policy and strategy, and day-to-day management is delegated by the Board to the Investment Manager and its group. The relationship between the Board and the Investment Manager is supportive, cooperative and transparent. For further details on the Board go to page 62. The role of the Chair The Board is chaired by Charlotte Valeur, who also chairs the Management Engagement Committee and attends the meetings of the Audit Committee in her capacity as a member. The Chair provides the leadership of the Board and is the main point of contact between the Board and the business, with input from the Investment Manager. The Chair has led the external Board evaluation process and is responsible for the ongoing emphasis on adhering to high standards of corporate governance by the Company. The role of the Senior Independent Director The Senior Independent Director is Mark McNicholas who, along with the Chair, is available to shareholders and also acts as a sounding board for the Chair, and as an intermediary for the other directors with the Chair, when necessary. The Senior Independent Director’s role includes responsibility for the Chair’s appraisal. Mark serves as chair of the Nominations Committee and attends the other committee meetings in his capacity as a member. Non-executive Directors The Chair promotes an open and constructive environment in the boardroom and actively invites the views of the other non-executive Directors. The independent non-executive Directors on the Board have a diverse range of skills, experience and backgrounds, as detailed in their biographies. The non- executive Directors possess experience from across the globe in investment banking, funds management, real estate finance, property investment and management, private equity investing and not-for-profit organisations. They provide constructive, objective and rigorous challenge to the Group’s investment management and advisory teams in implementing the Group’s strategy. All Directors have access to the services of the Administrator and the Company secretary and may take independent professional advice at the Company’s expense in conducting their duties. The Company provides insurance cover for its directors and officers. For biographies of the independent and non-executive Directors go to pages 62 to 63. Strategic report G overn an ce Financials A dditional inform ation Kennedy Wilson Europe Real Estate Plc Annual Report and Accounts 2016 59
Our statements of compliance continued Accountability Reporting The Board is responsible for ensuring fair, balanced and understandable reporting of KWE’s business model, performance, investment policy, strategy and the risks and uncertainties relating to its future prospects, with input from the Investment Manager. Go to page 61 for the Board’s statement on ‘fair, balanced and understandable’. Risk management and internal control The Board determines the Group’s risk appetite and monitors and reviews the effectiveness of the Group’s risk management and internal control systems. Go to page 74 for details on the activities of the Investment Manager and the oversight of the Audit Committee, which assists the Board with its responsibilities in relation to the management of risk. Audit Committee and Auditors The Board has delegated a number of responsibilities to the Audit Committee, which assists the Board in fulfilling its responsibilities in relation to overseeing the Company’s financial reporting processes, internal control and risk management framework, and maintaining an appropriate relationship with the external auditor and reviewing their effectiveness, independence and objectivity. The chair of the Audit Committee provides regular updates to the Board. To view the letter from the chair of the Audit Committee go to pages 70 to 73. Directors’ remuneration As the Company is externally managed, KWE has no executive directors or senior management employees, nor does it operate any pension, share option or other incentive plans. The fees payable to the independent non-executive Directors represent compensation in connection with contribution to Board and committee meetings and, where appropriate, for devoting additional time and expertise for the benefit of the Group in a wider capacity. William McMorrow and Mary Ricks have waived their entitlement to receive fees for their respective appointments as non-executive Directors on the Board. For more information on Directors’ remuneration go to page 76. Relations with shareholders Dialogue with shareholders The relationship with current and potential shareholders and investment analysts is given high priority by the Company. KWE has a communication and investor relations programme in place to address the needs of investors and analysts, which provides a regular flow of information about the Company, its strategy, performance and competitive position. On behalf of the Board, the representatives of the Investment Manager and the Investor Relations team meet regularly with investors and the Board receives regular input on investor feedback from the investment management team, the Company’s brokers and advisors. The Chair and the Senior Independent Director are available to attend one-on-one shareholder meetings if requested or appropriate. For an overview of the Company’s approach to shareholder relations go to page 77. Effectiveness The composition of the Board The Board comprises five Directors, all of whom are non- executive Directors. The independence of each non-executive Director is assessed annually by the Board. The Board has confirmed that all of the Directors are standing for re-election at the 2017 AGM. For further details go to page 69. Time commitment Letters of appointment for non-executive Directors do not set out a fixed time-commitment for Board attendance and duties but give an indication of the likely time required. It is anticipated that the time required by Directors will fluctuate depending on the demands of the business and other events. Development All Directors are regularly briefed on important developments in the Group’s business activities and receive extensive information concerning its target markets, investments, financial position and risk factors, enabling them to fulfil their duties and obligations as directors. The Directors are also frequently advised on the Group’s regulatory requirements and legal obligations to ensure it remains in compliance with applicable law and regulation. KWE has in place a detailed induction programme for newly appointed non-executive Directors to the Board, including one-to-one meetings with the Investment Manager and the external auditors to gain familiarity with the business, briefings on the duties of directors of a Jersey company, and an introduction to other applicable policies and procedures in place at KWE. The induction will also cover the Board committees that a new Director may join. For further details on the ongoing development and training of Directors go to page 69. Evaluation KWE undertakes an annual review of the Board, its committees and individual Directors. Pursuant to our commitment to undertake an external evaluation every three years, the evaluation process for 2016 was externally facilitated for the first time. For further details on the external evaluation go to page 69. Re-election The Directors submit themselves for annual re-election at each AGM if they wish to continue serving and are recommended by the Board. Directors may be appointed by shareholders by ordinary resolution or by the Board on the recommendation of the Nominations Committee and must then stand for re-election at the next AGM, where they may be re-elected by ordinary resolution of the shareholders. Diversity The Board recognises and acknowledges the importance of diversity, including gender, nationality, age and educational and professional background, for its effective functioning and is committed to supporting diversity of business skills, experience and background in the boardroom. For more information on the Company’s diversity policy go to page 68. Kennedy Wilson Europe Real Estate Plc Annual Report and Accounts 2016 60
The Annual General Meeting The 2017 AGM will be held on Wednesday 26 April 2017 at 10.00 am at the offices of Allen & Overy LLP, One Bishops Square, London E1 6AD. A separate notice convening the meeting will be distributed to shareholders and published on KWE’s website. All resolutions for which notice has been given will be decided on a poll. Other statements of compliance Fair, balanced and understandable The Board considers that the 2016 Annual Report and Accounts, taken as a whole, is fair, balanced and understandable and provides the information necessary for shareholders to assess the Company’s position, performance, business model and strategy. For further details on how the Audit Committee approached this on behalf of the Board go to page 71. Statement of effectiveness of risk management and internal controls The Board is of the view that KWE operates an effective system of internal control, which is maintained and reviewed in accordance with the UK Corporate Governance Code and the FRC Guidance on Risk Management, Internal Control and Related Financial and Business Reporting, as applicable. In 2016, the Board has undertaken a robust assessment of the principal risks faced by the Group, including those that could threaten its business model, future performance, solvency or liquidity. For further details on these principal risks go to pages 35 to 40. With risk assessment and management undertaken by the Investment Manager, supplemented by oversight and recommendations from the Audit Committee, the Board reviewed the effectiveness of the systems of internal control and risk management in place throughout the year, and up to the date of this report, and believes them to be operating effectively. As the Company’s system of internal controls is substantially reliant on the Investment Manager group’s own internal controls and processes due to the nature of the relationship in place, the Board’s review took into account the valuable assurance work undertaken by the Investment Manager towards risk management (acting investment manager and AIFM to the Company). In addition, the relevant process, controls and testing work undertaken by KPMG as part of their half year review and full year audit was a key consideration for the Board. No weaknesses or control failures significant to the Group were identified. Where areas for improvement were identified, new procedures have been introduced to strengthen the controls and will themselves be subject to regular review as part of the ongoing assurance process. For further details of the risk management and internal control processes go to page 72. Viability statement The Directors have assessed the Group’s viability over a three-year period, with reference to the Group’s current position and prospects, principal risks and changing competitive landscape. Based on the results of this assessment, the Directors have a reasonable expectation that the Company will be able to continue in operation and meet its liabilities as they fall due over the three-year period of the assessment. For further details, including an explanation as to why the three-year period was chosen go to page 72. Going concern The Directors are required to consider whether it is appropriate to prepare the financial statements on the basis that the Company is a going concern. As part of its normal business practice, the Directors have assessed the Group’s: business activities and assets (see pages 1 to 54); financial position and resources (see pages 50 to 54); and exposure to risks, including credit risk and liquidity risk (see Note 27 to the consolidated financial statements). In particular, the Directors have considered the annual and longer-term three-year business plans, as well as the projected 12-month cash flows for the Group’s portfolio. The Directors have also considered the Group’s robust liquidity position, comprising cash and the undrawn corporate credit facility, together with its ability to tap debt capital markets quickly under its bond programme. Following their review of this information, the Directors believe that the Group has adequate resources for the foreseeable future, being a period of at least 12-months from the date of approval of the consolidated financial statements, and it is, therefore, appropriate for the Company to continue to adopt the going concern basis in preparing the consolidated financial statements. Responsibility statements For the Directors’ further statements in respect of their responsibility for the 2016 Annual Report and Accounts go to page 80. Strategic report G overn an ce Financials A dditional inform ation Kennedy Wilson Europe Real Estate Plc Annual Report and Accounts 2016 61
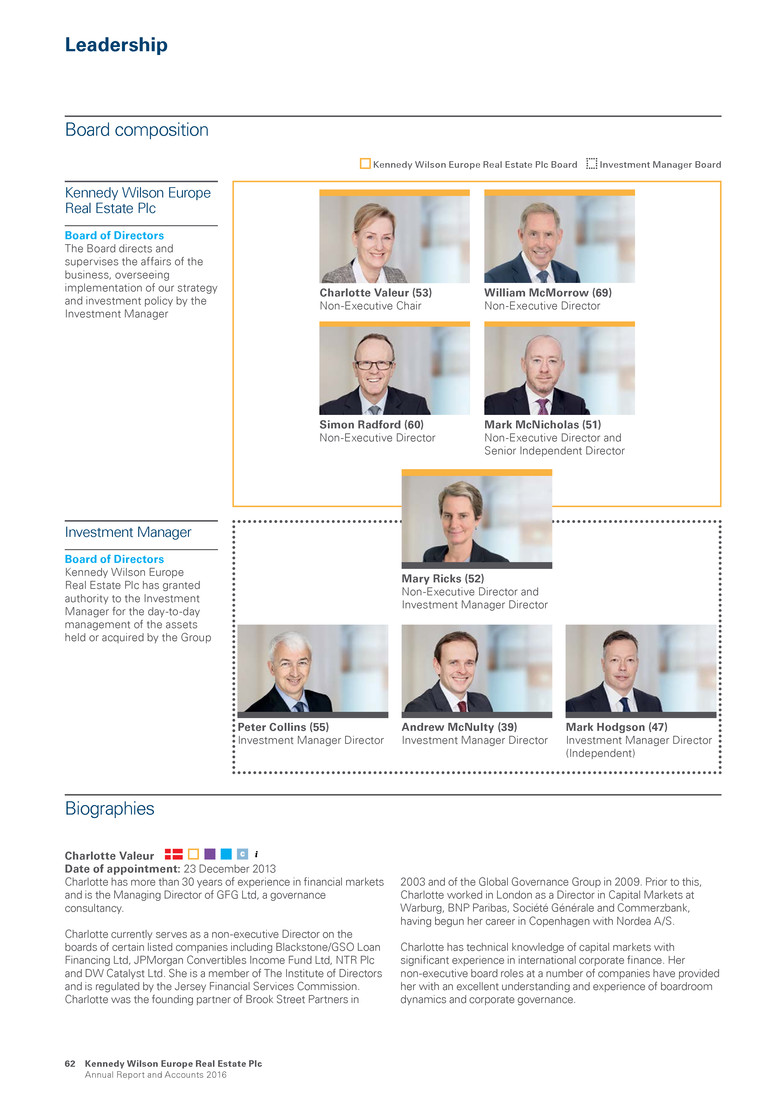
Leadership Charlotte Valeur Date of appointment: 23 December 2013 Charlotte has more than 30 years of experience in financial markets and is the Managing Director of GFG Ltd, a governance consultancy. Charlotte currently serves as a non-executive Director on the boards of certain listed companies including Blackstone/GSO Loan Financing Ltd, JPMorgan Convertibles Income Fund Ltd, NTR Plc and DW Catalyst Ltd. She is a member of The Institute of Directors and is regulated by the Jersey Financial Services Commission. Charlotte was the founding partner of Brook Street Partners in 2003 and of the Global Governance Group in 2009. Prior to this, Charlotte worked in London as a Director in Capital Markets at Warburg, BNP Paribas, Société Générale and Commerzbank, having begun her career in Copenhagen with Nordea A/S. Charlotte has technical knowledge of capital markets with significant experience in international corporate finance. Her non-executive board roles at a number of companies have provided her with an excellent understanding and experience of boardroom dynamics and corporate governance. Kennedy Wilson Europe Real Estate Plc Board of Directors The Board directs and supervises the affairs of the business, overseeing implementation of our strategy and investment policy by the Investment Manager Investment Manager Board of Directors Kennedy Wilson Europe Real Estate Plc has granted authority to the Investment Manager for the day-to-day management of the assets held or acquired by the Group Charlotte Valeur (53) Non-Executive Chair William McMorrow (69) Non-Executive Director Kennedy Wilson Europe Real Estate Plc Board Investment Manager Board Mark Hodgson (47) Investment Manager Director (Independent) Andrew McNulty (39) Investment Manager Director Peter Collins (55) Investment Manager Director Mark McNicholas (51) Non-Executive Director and Senior Independent Director Simon Radford (60) Non-Executive Director Board composition Biographies Mary Ricks (52) Non-Executive Director and Investment Manager Director Kennedy Wilson Europe Real Estate Plc Annual Report and Accounts 2016 62
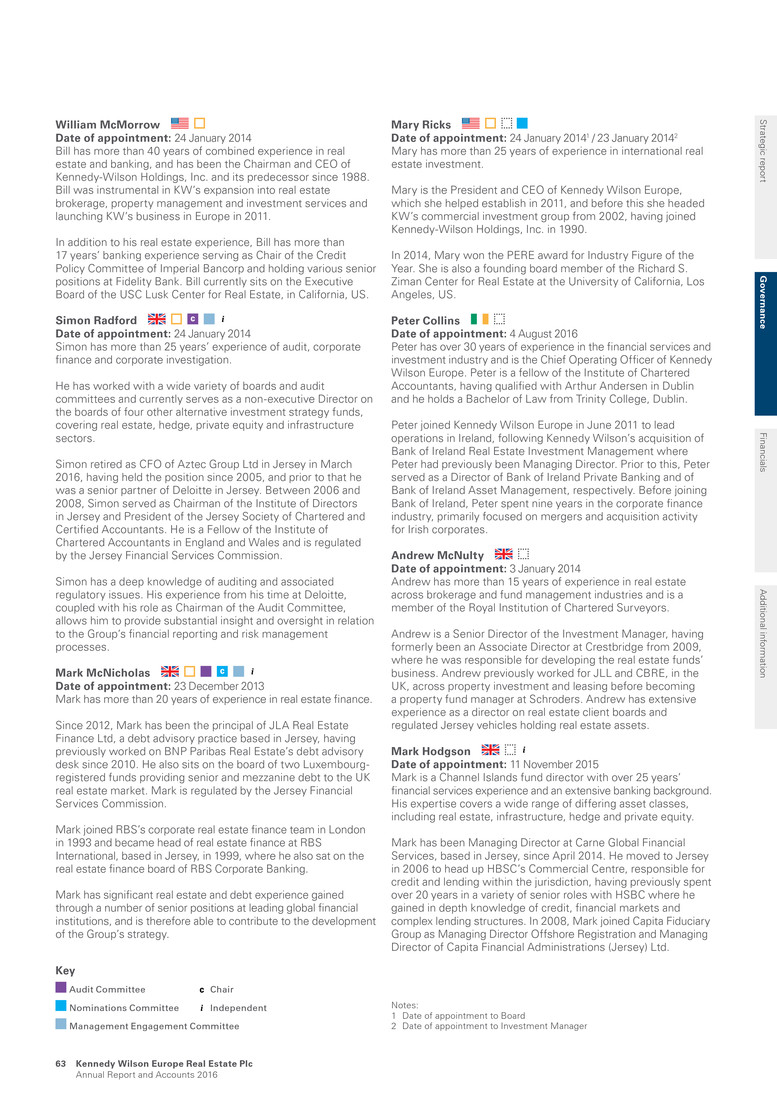
William McMorrow Date of appointment: 24 January 2014 Bill has more than 40 years of combined experience in real estate and banking, and has been the Chairman and CEO of Kennedy-Wilson Holdings, Inc. and its predecessor since 1988. Bill was instrumental in KW’s expansion into real estate brokerage, property management and investment services and launching KW’s business in Europe in 2011. In addition to his real estate experience, Bill has more than 17 years’ banking experience serving as Chair of the Credit Policy Committee of Imperial Bancorp and holding various senior positions at Fidelity Bank. Bill currently sits on the Executive Board of the USC Lusk Center for Real Estate, in California, US. Simon Radford Date of appointment: 24 January 2014 Simon has more than 25 years’ experience of audit, corporate finance and corporate investigation. He has worked with a wide variety of boards and audit committees and currently serves as a non-executive Director on the boards of four other alternative investment strategy funds, covering real estate, hedge, private equity and infrastructure sectors. Simon retired as CFO of Aztec Group Ltd in Jersey in March 2016, having held the position since 2005, and prior to that he was a senior partner of Deloitte in Jersey. Between 2006 and 2008, Simon served as Chairman of the Institute of Directors in Jersey and President of the Jersey Society of Chartered and Certified Accountants. He is a Fellow of the Institute of Chartered Accountants in England and Wales and is regulated by the Jersey Financial Services Commission. Simon has a deep knowledge of auditing and associated regulatory issues. His experience from his time at Deloitte, coupled with his role as Chairman of the Audit Committee, allows him to provide substantial insight and oversight in relation to the Group’s financial reporting and risk management processes. Mark McNicholas Date of appointment: 23 December 2013 Mark has more than 20 years of experience in real estate finance. Since 2012, Mark has been the principal of JLA Real Estate Finance Ltd, a debt advisory practice based in Jersey, having previously worked on BNP Paribas Real Estate’s debt advisory desk since 2010. He also sits on the board of two Luxembourg- registered funds providing senior and mezzanine debt to the UK real estate market. Mark is regulated by the Jersey Financial Services Commission. Mark joined RBS’s corporate real estate finance team in London in 1993 and became head of real estate finance at RBS International, based in Jersey, in 1999, where he also sat on the real estate finance board of RBS Corporate Banking. Mark has significant real estate and debt experience gained through a number of senior positions at leading global financial institutions, and is therefore able to contribute to the development of the Group’s strategy. Mary Ricks Date of appointment: 24 January 20141 / 23 January 20142 Mary has more than 25 years of experience in international real estate investment. Mary is the President and CEO of Kennedy Wilson Europe, which she helped establish in 2011, and before this she headed KW’s commercial investment group from 2002, having joined Kennedy-Wilson Holdings, Inc. in 1990. In 2014, Mary won the PERE award for Industry Figure of the Year. She is also a founding board member of the Richard S. Ziman Center for Real Estate at the University of California, Los Angeles, US. Peter Collins Date of appointment: 4 August 2016 Peter has over 30 years of experience in the financial services and investment industry and is the Chief Operating Officer of Kennedy Wilson Europe. Peter is a fellow of the Institute of Chartered Accountants, having qualified with Arthur Andersen in Dublin and he holds a Bachelor of Law from Trinity College, Dublin. Peter joined Kennedy Wilson Europe in June 2011 to lead operations in Ireland, following Kennedy Wilson’s acquisition of Bank of Ireland Real Estate Investment Management where Peter had previously been Managing Director. Prior to this, Peter served as a Director of Bank of Ireland Private Banking and of Bank of Ireland Asset Management, respectively. Before joining Bank of Ireland, Peter spent nine years in the corporate finance industry, primarily focused on mergers and acquisition activity for Irish corporates. Andrew McNulty Date of appointment: 3 January 2014 Andrew has more than 15 years of experience in real estate across brokerage and fund management industries and is a member of the Royal Institution of Chartered Surveyors. Andrew is a Senior Director of the Investment Manager, having formerly been an Associate Director at Crestbridge from 2009, where he was responsible for developing the real estate funds’ business. Andrew previously worked for JLL and CBRE, in the UK, across property investment and leasing before becoming a property fund manager at Schroders. Andrew has extensive experience as a director on real estate client boards and regulated Jersey vehicles holding real estate assets. Mark Hodgson Date of appointment: 11 November 2015 Mark is a Channel Islands fund director with over 25 years’ financial services experience and an extensive banking background. His expertise covers a wide range of differing asset classes, including real estate, infrastructure, hedge and private equity. Mark has been Managing Director at Carne Global Financial Services, based in Jersey, since April 2014. He moved to Jersey in 2006 to head up HBSC’s Commercial Centre, responsible for credit and lending within the jurisdiction, having previously spent over 20 years in a variety of senior roles with HSBC where he gained in depth knowledge of credit, financial markets and complex lending structures. In 2008, Mark joined Capita Fiduciary Group as Managing Director Offshore Registration and Managing Director of Capita Financial Administrations (Jersey) Ltd. Notes: 1 Date of appointment to Board 2 Date of appointment to Investment Manager Key Audit Committee Chair Nominations Committee Independent Management Engagement Committee Strategic report G overn an ce Financials A dditional inform ation Kennedy Wilson Europe Real Estate Plc Annual Report and Accounts 2016 63
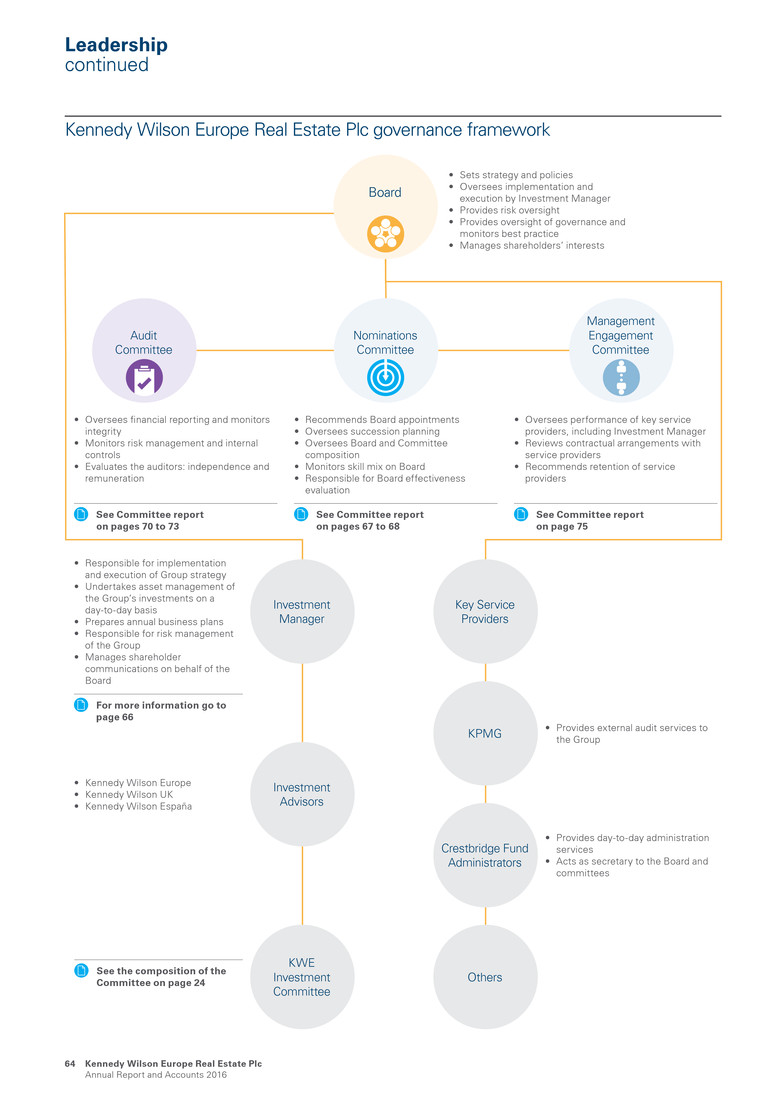
Nominations Committee Audit Committee KWE Investment Committee Others Key Service Providers • Sets strategy and policies • Oversees implementation and execution by Investment Manager • Provides risk oversight • Provides oversight of governance and monitors best practice • Manages shareholders’ interests • Recommends Board appointments • Oversees succession planning • Oversees Board and Committee composition • Monitors skill mix on Board • Responsible for Board effectiveness evaluation • Oversees performance of key service providers, including Investment Manager • Reviews contractual arrangements with service providers • Recommends retention of service providers Crestbridge Fund Administrators • Provides day-to-day administration services • Acts as secretary to the Board and committees KPMG • Provides external audit services to the Group • Kennedy Wilson Europe • Kennedy Wilson UK • Kennedy Wilson España Investment Advisors • Oversees financial reporting and monitors integrity • Monitors risk management and internal controls • Evaluates the auditors: independence and remuneration See Committee report on pages 70 to 73 See Committee report on page 75 See Committee report on pages 67 to 68 Investment Manager • Responsible for implementation and execution of Group strategy • Undertakes asset management of the Group’s investments on a day-to-day basis • Prepares annual business plans • Responsible for risk management of the Group • Manages shareholder communications on behalf of the Board For more information go to page 66 See the composition of the Committee on page 24 Board Management Engagement Committee Leadership continued Kennedy Wilson Europe Real Estate Plc governance framework Kennedy Wilson Europe Real Estate Plc Annual Report and Accounts 2016 64
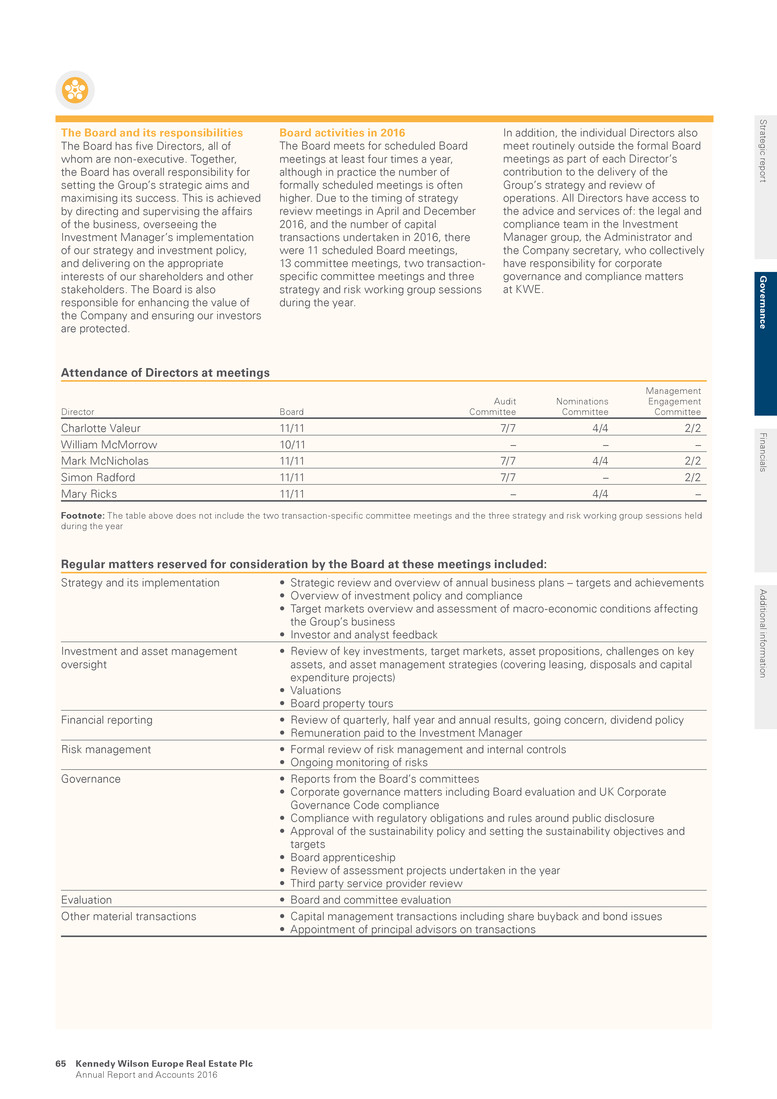
The Board and its responsibilities The Board has five Directors, all of whom are non-executive. Together, the Board has overall responsibility for setting the Group’s strategic aims and maximising its success. This is achieved by directing and supervising the affairs of the business, overseeing the Investment Manager’s implementation of our strategy and investment policy, and delivering on the appropriate interests of our shareholders and other stakeholders. The Board is also responsible for enhancing the value of the Company and ensuring our investors are protected. Board activities in 2016 The Board meets for scheduled Board meetings at least four times a year, although in practice the number of formally scheduled meetings is often higher. Due to the timing of strategy review meetings in April and December 2016, and the number of capital transactions undertaken in 2016, there were 11 scheduled Board meetings, 13 committee meetings, two transaction- specific committee meetings and three strategy and risk working group sessions during the year. In addition, the individual Directors also meet routinely outside the formal Board meetings as part of each Director’s contribution to the delivery of the Group’s strategy and review of operations. All Directors have access to the advice and services of: the legal and compliance team in the Investment Manager group, the Administrator and the Company secretary, who collectively have responsibility for corporate governance and compliance matters at KWE. Attendance of Directors at meetings Director Board Audit Committee Nominations Committee Management Engagement Committee Charlotte Valeur 11/11 7/7 4/4 2/2 William McMorrow 10/11 – – – Mark McNicholas 11/11 7/7 4/4 2/2 Simon Radford 11/11 7/7 – 2/2 Mary Ricks 11/11 – 4/4 – Footnote: The table above does not include the two transaction-specific committee meetings and the three strategy and risk working group sessions held during the year Regular matters reserved for consideration by the Board at these meetings included: Strategy and its implementation • Strategic review and overview of annual business plans – targets and achievements • Overview of investment policy and compliance • Target markets overview and assessment of macro-economic conditions affecting the Group’s business • Investor and analyst feedback Investment and asset management oversight • Review of key investments, target markets, asset propositions, challenges on key assets, and asset management strategies (covering leasing, disposals and capital expenditure projects) • Valuations • Board property tours Financial reporting • Review of quarterly, half year and annual results, going concern, dividend policy • Remuneration paid to the Investment Manager Risk management • Formal review of risk management and internal controls • Ongoing monitoring of risks Governance • Reports from the Board’s committees • Corporate governance matters including Board evaluation and UK Corporate Governance Code compliance • Compliance with regulatory obligations and rules around public disclosure • Approval of the sustainability policy and setting the sustainability objectives and targets • Board apprenticeship • Review of assessment projects undertaken in the year • Third party service provider review Evaluation • Board and committee evaluation Other material transactions • Capital management transactions including share buyback and bond issues • Appointment of principal advisors on transactions Strategic report G overn an ce Financials A dditional inform ation Kennedy Wilson Europe Real Estate Plc Annual Report and Accounts 2016 65
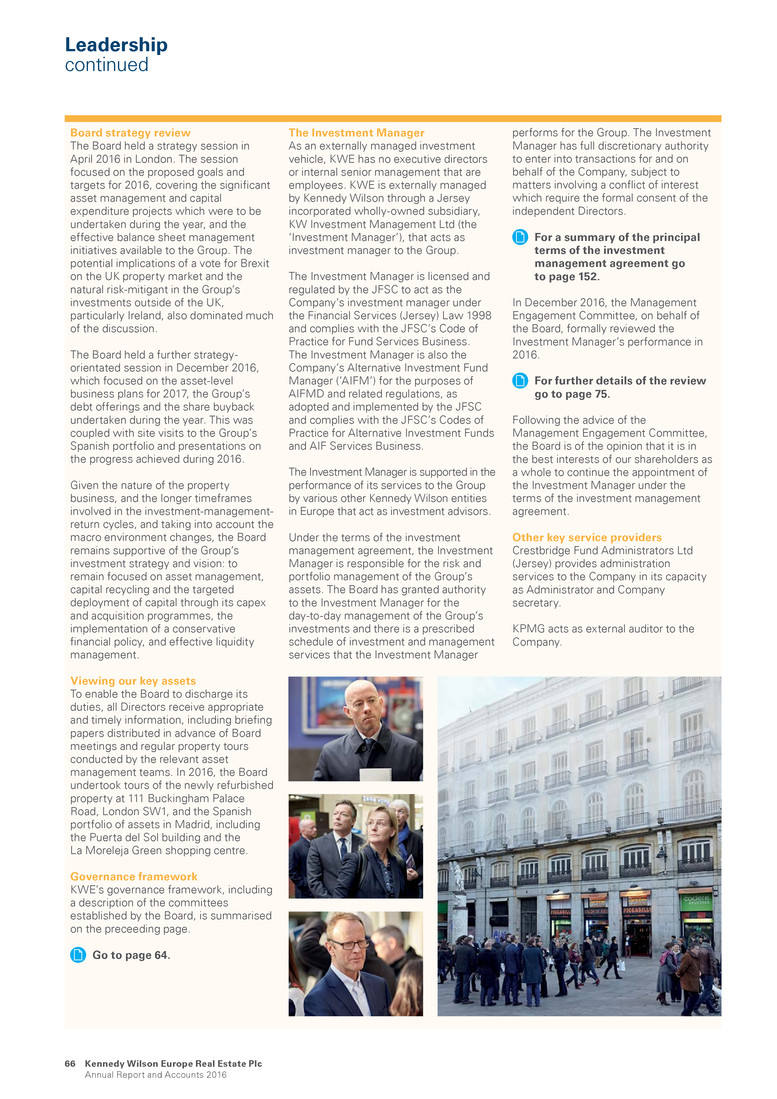
Leadership continued Board strategy review The Board held a strategy session in April 2016 in London. The session focused on the proposed goals and targets for 2016, covering the significant asset management and capital expenditure projects which were to be undertaken during the year, and the effective balance sheet management initiatives available to the Group. The potential implications of a vote for Brexit on the UK property market and the natural risk-mitigant in the Group’s investments outside of the UK, particularly Ireland, also dominated much of the discussion. The Board held a further strategy- orientated session in December 2016, which focused on the asset-level business plans for 2017, the Group’s debt offerings and the share buyback undertaken during the year. This was coupled with site visits to the Group’s Spanish portfolio and presentations on the progress achieved during 2016. Given the nature of the property business, and the longer timeframes involved in the investment-management- return cycles, and taking into account the macro environment changes, the Board remains supportive of the Group’s investment strategy and vision: to remain focused on asset management, capital recycling and the targeted deployment of capital through its capex and acquisition programmes, the implementation of a conservative financial policy, and effective liquidity management. Viewing our key assets To enable the Board to discharge its duties, all Directors receive appropriate and timely information, including briefing papers distributed in advance of Board meetings and regular property tours conducted by the relevant asset management teams. In 2016, the Board undertook tours of the newly refurbished property at 111 Buckingham Palace Road, London SW1, and the Spanish portfolio of assets in Madrid, including the Puerta del Sol building and the La Moreleja Green shopping centre. Governance framework KWE’s governance framework, including a description of the committees established by the Board, is summarised on the preceeding page. Go to page 64. The Investment Manager As an externally managed investment vehicle, KWE has no executive directors or internal senior management that are employees. KWE is externally managed by Kennedy Wilson through a Jersey incorporated wholly-owned subsidiary, KW Investment Management Ltd (the ‘Investment Manager’), that acts as investment manager to the Group. The Investment Manager is licensed and regulated by the JFSC to act as the Company’s investment manager under the Financial Services (Jersey) Law 1998 and complies with the JFSC’s Code of Practice for Fund Services Business. The Investment Manager is also the Company’s Alternative Investment Fund Manager (‘AIFM’) for the purposes of AIFMD and related regulations, as adopted and implemented by the JFSC and complies with the JFSC’s Codes of Practice for Alternative Investment Funds and AIF Services Business. The Investment Manager is supported in the performance of its services to the Group by various other Kennedy Wilson entities in Europe that act as investment advisors. Under the terms of the investment management agreement, the Investment Manager is responsible for the risk and portfolio management of the Group’s assets. The Board has granted authority to the Investment Manager for the day-to-day management of the Group’s investments and there is a prescribed schedule of investment and management services that the Investment Manager performs for the Group. The Investment Manager has full discretionary authority to enter into transactions for and on behalf of the Company, subject to matters involving a conflict of interest which require the formal consent of the independent Directors. For a summary of the principal terms of the investment management agreement go to page 152. In December 2016, the Management Engagement Committee, on behalf of the Board, formally reviewed the Investment Manager’s performance in 2016. For further details of the review go to page 75. Following the advice of the Management Engagement Committee, the Board is of the opinion that it is in the best interests of our shareholders as a whole to continue the appointment of the Investment Manager under the terms of the investment management agreement. Other key service providers Crestbridge Fund Administrators Ltd (Jersey) provides administration services to the Company in its capacity as Administrator and Company secretary. KPMG acts as external auditor to the Company. Kennedy Wilson Europe Real Estate Plc Annual Report and Accounts 2016 66
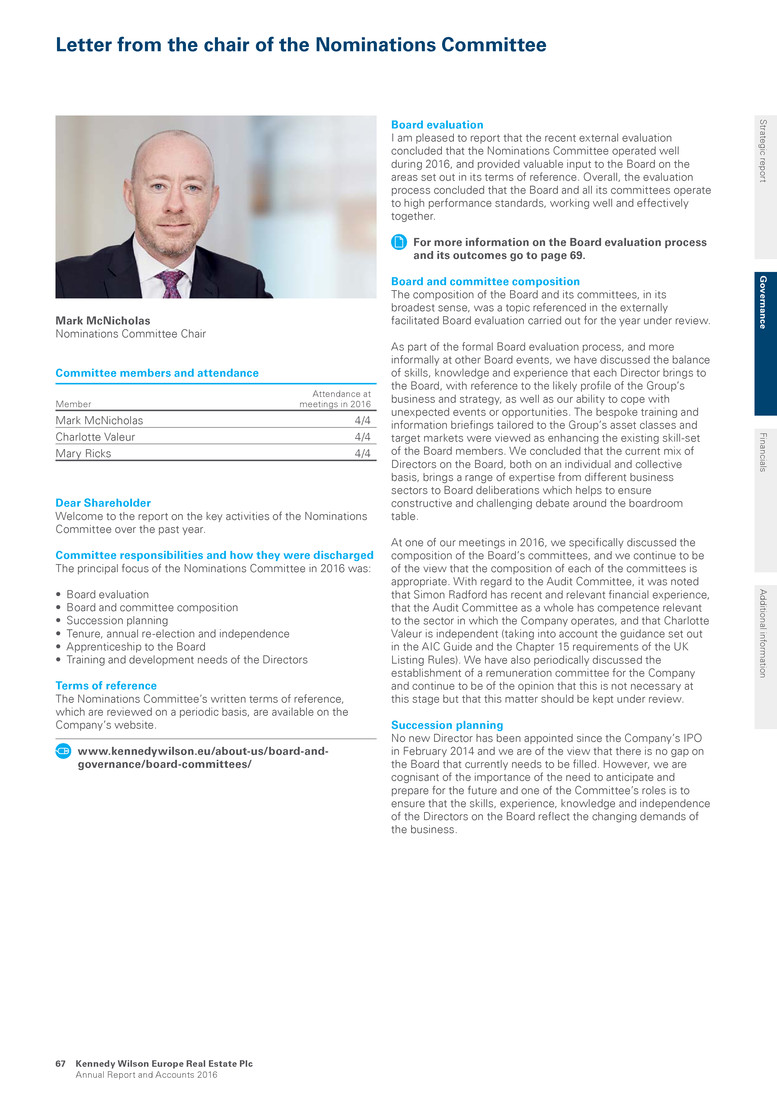
Letter from the chair of the Nominations Committee Committee members and attendance Member Attendance at meetings in 2016 Mark McNicholas 4/4 Charlotte Valeur 4/4 Mary Ricks 4/4 Dear Shareholder Welcome to the report on the key activities of the Nominations Committee over the past year. Committee responsibilities and how they were discharged The principal focus of the Nominations Committee in 2016 was: • Board evaluation • Board and committee composition • Succession planning • Tenure, annual re-election and independence • Apprenticeship to the Board • Training and development needs of the Directors Terms of reference The Nominations Committee’s written terms of reference, which are reviewed on a periodic basis, are available on the Company’s website. www.kennedywilson.eu/about-us/board-and- governance/board-committees/ Mark McNicholas Nominations Committee Chair Board evaluation I am pleased to report that the recent external evaluation concluded that the Nominations Committee operated well during 2016, and provided valuable input to the Board on the areas set out in its terms of reference. Overall, the evaluation process concluded that the Board and all its committees operate to high performance standards, working well and effectively together. For more information on the Board evaluation process and its outcomes go to page 69. Board and committee composition The composition of the Board and its committees, in its broadest sense, was a topic referenced in the externally facilitated Board evaluation carried out for the year under review. As part of the formal Board evaluation process, and more informally at other Board events, we have discussed the balance of skills, knowledge and experience that each Director brings to the Board, with reference to the likely profile of the Group’s business and strategy, as well as our ability to cope with unexpected events or opportunities. The bespoke training and information briefings tailored to the Group’s asset classes and target markets were viewed as enhancing the existing skill-set of the Board members. We concluded that the current mix of Directors on the Board, both on an individual and collective basis, brings a range of expertise from different business sectors to Board deliberations which helps to ensure constructive and challenging debate around the boardroom table. At one of our meetings in 2016, we specifically discussed the composition of the Board’s committees, and we continue to be of the view that the composition of each of the committees is appropriate. With regard to the Audit Committee, it was noted that Simon Radford has recent and relevant financial experience, that the Audit Committee as a whole has competence relevant to the sector in which the Company operates, and that Charlotte Valeur is independent (taking into account the guidance set out in the AIC Guide and the Chapter 15 requirements of the UK Listing Rules). We have also periodically discussed the establishment of a remuneration committee for the Company and continue to be of the opinion that this is not necessary at this stage but that this matter should be kept under review. Succession planning No new Director has been appointed since the Company’s IPO in February 2014 and we are of the view that there is no gap on the Board that currently needs to be filled. However, we are cognisant of the importance of the need to anticipate and prepare for the future and one of the Committee’s roles is to ensure that the skills, experience, knowledge and independence of the Directors on the Board reflect the changing demands of the business. Strategic report G overn an ce Financials A dditional inform ation Kennedy Wilson Europe Real Estate Plc Annual Report and Accounts 2016 67
We will continue to keep the leadership needs of the Company under review and to ensure the leadership of the Company is well-equipped to deal with any strategic issues and commercial changes affecting the Company and the markets in which it operates. In the event a new appointment needs to be made to the Board, the Committee intends to follow the formal policy for the appointment and selection of a non-executive Director (which is set out in the terms of reference of the Nominations Committee), taking advantage, where appropriate, of its vast and strong network of relationships with highly qualified, skilled and experienced senior professionals, both within and outside of the Channel Islands, who may be suitable candidates. Diversity policy The Board embraces diversity in its broadest sense, believing that a wider range of experience, background, perspective, skills and knowledge combine to contribute towards a high performing, effective Board, which is better able to support and direct the Company. The Board has a formally documented diversity policy for the Company which can be viewed on the KWE website. www.kennedywilson.eu/about-us/board-and- governance/diversity/ Currently, the Committee does not consider that it is appropriate, or in the interest of the Company and its shareholders, to set a prescriptive diversity target for the Board. As at the date of this report, women comprised 40% of the board of KWE. Board apprenticeship We remain committed to improving opportunities for people from a diverse range of backgrounds to understand and prepare for membership and appointment to corporate boards. In 2016, a second apprentice from Board Apprentice Ltd commenced a year of apprenticeship with the Company. We continue to strongly believe in the potential for positive impact and influence the apprenticeship scheme can create and have again committed to take on an apprentice for the coming year. Ongoing development and training During 2016, the Board was briefed by industry experts on the impact of Brexit on the UK property market, the commercial and retail property markets and demand in Spain, and relevant regulatory and corporate governance developments, in particular the recently implemented market abuse regulations and changes to the Irish finance bill introduced in October 2016. These briefings were found to be extremely useful to the broader discussion at Board level. Mark McNicholas Nominations Committee Chair Letter from the chair of the Nominations Committee continued Kennedy Wilson Europe Real Estate Plc Annual Report and Accounts 2016 68
Board evaluation 2016 Internal evaluations of the Board and its committees were carried out in our first two years of operation as a UK listed company. In keeping with the recommendations of the UK Corporate Governance Code, an externally facilitated evaluation of Board effectiveness was commenced towards the end of 2016 and completed in early 2017. The evaluation was conducted by Equity Communications Limited, a leading specialist consultancy (with no other connection with the Group), who were given access to each of the Directors and key representatives of the investment management team and provided with supporting materials to enhance the evaluation team’s understanding of how the Board, its committees and each of the Directors operate. In addition to completing detailed questionnaires, one-on-one interviews were conducted with each Director and the key representatives of the investment management team, against a formalised set of questions. The overall conclusion from the evaluation was that the Board, its committees and each of the Directors operate effectively and efficiently, with a continuous and high standard of performance throughout the past year. The high levels of commitment and integrity of fellow Board members are deeply valued by the Directors. The Directors believe that they are able to challenge each other during Board meetings and that the spirit of openness that exists enables everyone to participate fully in discussions. The Directors were observed to take their responsibilities seriously and to be committed to their roles, and the culture of transparency that exists between them is seen as a key strength. The Board is pleased with the increasing amount of time being allocated to future issues that may affect the business, whilst at the same time maintaining rigorous oversight of ongoing performance. We have plans in place to ensure that we keep challenging ourselves to get better. Board environment and access to appropriate information There was positive comment on the Board’s environment and culture of transparency at its meetings in this year’s external evaluation report. The Board and its committees receive papers in a timely fashion and Directors have access to information, support and advice from the investment management team throughout the year. Professional development and support The majority of the Directors are Jersey residents and each Board member is approved by the JFSC which requires them to undertake 25 hours per annum of continued professional development (‘CPD’). Accordingly, each Director (and any other individual who forms part of the JFSC’s ‘span of control’ for the Company, including the Directors of the Investment Manager) must ensure that the appropriate CPD requirements have been met during the year. In addition, each Director maintains membership of relevant professional bodies in order to keep themselves abreast of changes in applicable regulation, and conduct and reporting guidance. The Board has also held several specific knowledge development and working group sessions during 2016 on matters affecting risk profile, corporate reputation, property trends and market updates. The Directors also receive regular reports facilitating greater awareness and understanding of the Group’s business and the legal, regulatory and industry-specific environment in which it operates. This is complemented by visits to properties owned, managed or being developed by the Group which enables a deeper insight into the operations of the business and provides Directors with the opportunity to meet with the local asset management teams and business advisors. Tenure, annual re-election and independence The Board’s policy on tenure is that continuity and experience are considered to add significantly to the strength of the Board. The Board collectively shares the view that property is a long-term business, and experience gained through one property cycle is invaluable background for the next. Moreover, depending on our business needs and the progress of the property cycle, it may be in the Company’s best interests for some Directors to stay beyond the nine-year time period referred to in the UK Corporate Governance Code (a view also supported by the AIC) at which point some investors or governance bodies may begin to question their independence. Any such decision will be taken by reference to the facts as they exist at the time and fully explained to shareholders. Accordingly, other than an initial term of three years from the date of appointment (as extended from time to time), no limit on the overall length of service of any of the Directors, including the Chair, has been imposed. At the meeting held in December 2016, the initial term of three years for all Directors, which was expiring on 10 February 2017, was further extended by another three years (subject to each Director being re- elected by shareholders at each AGM). In accordance with the requirements of the UK Corporate Governance Code, the Directors will be standing for re-election on an annual basis and their biographies, setting out their relevant skills and experience, other professional commitments, and individual contributions to the Board, are set out in the Leadership section of this report. Go to pages 64 to 66. The Board also considered the independence criteria set out in the UK Corporate Governance Code and the extent to which they are appropriate to an externally managed property investment company. Taking into account the guidance set out in the AIC Guide and the Chapter 15 requirements of the UK Listing Rules, the Board concluded that Mark McNicholas, Simon Radford and Charlotte Valeur are each considered to be independent. William McMorrow and Mary Ricks are not considered independent by the Board because of their relationship with the Investment Manager. In addition, the Board considered the time-commitment of each of the Directors and was satisfied with the contributions of all the Directors during the year. Effectiveness Strategic report G overn an ce Financials A dditional inform ation Kennedy Wilson Europe Real Estate Plc Annual Report and Accounts 2016 69

• Overseeing continued compliance with applicable laws and regulations and reporting requirements, including all relevant regulations of the FCA, JFSC and EU legislation, such as the market abuse regulations, through regular reporting • Reviewing and monitoring the Group’s data and information governance project • Considering whether the 2016 Annual Report and Accounts is fair, balanced and understandable During the year, the Committee held seven meetings, which were also attended by the investment management team representatives (including Mary Ricks, the Investment Manager Directors, the Head of Finance and the General Counsel, Europe) and the Company secretary, as well as KPMG, the Company’s external auditor, in certain instances. Terms of reference The Audit Committee’s written terms of reference, which are reviewed on a periodic basis, are available on the Company’s website. www.kennedywilson.eu/about-us/board-and- governance/board-committees/ Committee effectiveness During the year, our externally facilitated Board evaluation concluded that the Audit Committee was effective in fulfilling its duties. This confirms my personal view that the Committee plays an important role in ensuring that the appropriate governance environment, underpinned by the appropriate risk management, control and assurance processes, is embedded throughout the business. Financial reporting and significant accounting judgements For the year under review, we monitored the integrity of the financial information published in the interim and annual consolidated financial statements, as well as quarterly business updates, and considered the extent to which suitable accounting policies have been adopted, presented and disclosed. In making our assessment, we received and considered reports from the Investment Manager, the audit strategy and focus of the external auditors, and the methodology adopted by the Group’s external valuers. Taking into account information from these activities, and with input from KPMG, the Committee considered whether the Investment Manager had made suitable and appropriate estimates and judgements in the process of applying the Group’s accounting policies. See KPMG’s audit report on pages 82 to 84 for further details. Letter from the chair of the Audit Committee Committee members and attendance Member Attendance at meetings in 2016 Simon Radford 7/7 Mark McNicholas 7/7 Charlotte Valeur 7/7 Dear Shareholder I am pleased to present the Audit Committee report which summarises our work over the past year. Committee responsibilities and how they were discharged The main matters with which we dealt, and on which we reported to the Board, during 2016 were as follows: • Monitoring the integrity of the Company’s financial statements and reviewing significant financial reporting judgements • Review and approval of the annual audit plan of the external auditors, and discussion of reports from the external auditors following their review and audit of financial statements • Review of the independence and objectivity of the external auditor, with particular regard to non-audit fees • Assisting the Board in meeting its responsibilities in respect of carrying out a robust assessment of the principal risks affecting the Group and reviewing and reporting on the systems and key elements of risk management as they affect the Group • Reviewing internal controls and considering the need for an internal audit function specific to the Company • The appointment of third party valuers, the valuation methodology adopted and approval of the valuations of the Group’s investments • The declaration and payment of quarterly dividends, and monitoring the regulatory solvency requirements • Reviewing and monitoring the implementation of the Group’s financial policy with particular focus on secured and unsecured debt, the impact of foreign exchange and cash management, and the continued ability of the Group to adopt the going concern basis in preparing financial statements • Reviewing the Group’s tax strategy Simon Radford Audit Committee Chair Kennedy Wilson Europe Real Estate Plc Annual Report and Accounts 2016 70
The area of significant judgement considered by the Committee and how this was addressed in relation to the financial statements is set out below: Matter Action Property valuation Property valuation is central to the business and is a significant area of judgement. Although valued by an independent firm of valuers, CBRE, the valuation is inherently subjective. Errors in valuation could have a material impact on the Company’s net asset value. • We reviewed the outcomes of the valuation process throughout the year and discussed the details of each bi-annual valuation with the Investment Manager at the Board meetings. • The chair of the Audit Committee held discussions with CBRE to discuss the process, assumptions, independence and communication with the Investment Manager. • As this is the main area of audit focus, the auditors contacted the valuers directly and independently of the Investment Manager and the Company. • We also received detailed quarterly reports on this matter from the Investment Manager, and reports from KPMG as part of their interim and year end reporting to the Audit Committee. • On the basis of the above, we concluded that the valuations were suitable for inclusion in the financial statements. External valuations and valuers The bi-annual external valuation of the Group’s portfolio is a key determinant of the Group’s balance sheet, overall business performance and year end results, as well as being pivotal to determining certain aspects of the Investment Manager’s remuneration. Although property valuations are based on the consideration of third party, market and internal evidence, there is a subjective element that requires valuers to make significant judgements and assumptions based on their experience. Given the importance of external valuations to the assessment of the Group’s and Investment Manager’s performance, we take a rigorous approach to monitoring and reviewing the valuation process and the effectiveness of the Group’s valuers. For the year ended 31 December 2016, the Committee performed a half-yearly review of the effectiveness of the Group’s external valuations, focusing on a qualitative analysis of capital values, in terms of market testing, yield benchmarking, availability of comparable market evidence and major outliers to sub-sector movements. The external valuers presented directly to the Committee at the half-year and annual results, including confirmation of their valuation process, marketing conditions and significant judgements made. The Company’s external auditor also reviewed the valuations and valuation process, having full access to the valuers to determine that due process has been followed using appropriate information, and reported its conclusions to the Committee. FRC Corporate Reporting Review team In accordance with the FRC Guidance on Audit Committees, we are pleased to confirm that the Company received a letter from the FRC Corporate Reporting Review team (‘FRC Review Team’) in July 2016, informing us that it had reviewed the Company’s 2015 Annual Report and Accounts. The letter confirmed that the FRC Review Team did not have any questions or queries that it wished to raise with us. The FRC Review Team asked us to make clear that its work is based solely on published reports and accounts and so does not benefit from a detailed knowledge of our business or an understanding of the underlying transactions entered into. Fair, balanced and understandable (FBU) In accordance with the provisions of the UK Corporate Governance Code, we examined, on behalf of the Board, whether the 2016 Annual Report and Accounts was fair, balanced and understandable, and provided the information necessary for shareholders to assess the Group’s position, performance, business model and strategy. In doing so, we applied the same approach adopted in previous years and reviewed an advanced draft of the report for review and comment, and also gathered an understanding of the governance processes involved its compilation. This included taking into account that: • Individual sections of the annual report and financial statements are drafted by appropriate members of the investment management team, with regular review meetings to ensure consistency of the whole document • Detailed reviews of appropriate draft sections of the annual report and financial statements are undertaken by the investment management team • Advanced drafts are reviewed by the Audit Committee and the auditors on a timely basis to allow sufficient consideration and are discussed with the investment management team prior to consideration by the Board • Discussions are arranged with those in the investment management team who were responsible for preparing, compiling and verifying the content and, with input from advisors, the Administrator and auditors, ensuring that consistent reporting and appropriate links existed between key messages and sections of the annual report • An independent review, challenge and assessment of the annual report is conducted by a governance specialist consulting firm, FutureValue, and by our external legal advisors Following this review, we recommended to the Board that, in our view, the Annual Report and Accounts for the year ended 31 December 2016, taken as a whole, is fair, balanced and understandable, and provides the information necessary for our shareholders to assess the Group’s position and performance, business model and strategy. The Board subsequently considered the report as a whole and discussed the report’s tone, balance and language for compliance with these standards. The Board’s statement on ‘fair, balanced and understandable’ is made on page 61. Strategic report G overn an ce Financials A dditional inform ation Kennedy Wilson Europe Real Estate Plc Annual Report and Accounts 2016 71

Letter from the chair of the Audit Committee continued True and fair view We have reviewed the Group’s consolidated financial statements which have been prepared in accordance with IFRS and applicable company law. The Group’s financial model is underpinned by the application of prudent, appropriate accounting policies chosen by the Directors to ensure that the financial statements present a true and fair view of the state of the Group’s affairs. The continued appropriateness of the accounting policies and the methods of applying those policies in practice are reviewed at least annually. The significant accounting policies, which are consistent with last year’s, are set out on pages 92 to 98. In order to assist shareholders and other users of the Group’s financial statements, supplementary commentary has been provided within the notes to the Group’s consolidated financial statements. The additional commentary addresses information regularly sought by investors, analysts and other stakeholders, as well as providing further insight into the Group’s key accounting policies, financial model and important movements in income statement and balance sheet items during the year. Viability statement On behalf of the Board, we have undertaken an assessment of the Group’s viability for the next three years, with reference to the Group’s current position and prospects, principal risks and changing competitive landscape. This three-year period has been chosen as it primarily aligns with the underlying individual asset-level business plans and cash flow forecasts, which are prepared on a one- and three-year basis, and with the Group’s strategic review (covering, amongst others, net operating income, cash flows, dividend cover and LTV metrics), which also extends over a three-year period. In addition, the three-year period captures sufficient reversionary risk as the Group’s WAULT is close to seven years. Sensitivity analysis has been applied to reflect the potential impact of one, or a combination of, the principal risks and uncertainties on the Group’s profitability, liquidity and solvency, business model and future performance. In particular, the analysis considered: the impact of reducing occupational demand on revenue, costs, interest cover and dividend levels; the impact of valuation falls on loan-to-value covenants; the impact of foreign exchange movements on net asset value and cash flows; the mitigants in the Group’s business profile; and any consequential legal, regulatory and other changes in the Group’s key markets that might impact the Group’s viability over the three-year viability period. For further details on principal risks and uncertainties go to pages 35 to 40. The Board’s viability statement is made on page 61. Risk management and internal control Throughout the year, the Investment Manager effectively carried out its risk management functions, monitored the broader market conditions and the risks and challenges relevant to the Group, and made periodic reports to the Committee. In addition to assessing the impact of the Brexit vote, with appropriate input from the Investment Manager, the Committee considered other threats such as cyber-security, volatility in foreign exchange rates and hedging, new and potential changes in taxation legislation, as well as the broader market cycle and property trends that impact our business strategy and execution. We ensured that the Investment Manager properly categorised these risks in the risk register of the Company, that the potential impact to the Group was understood by the Board, and that appropriate resources were allocated by the Investment Manager to provide assurance to us that agreed mitigating actions were implemented. Following the extensive external risk assessment exercise undertaken in 2015, with input from the Investment Manager, we identified certain strategic assessment projects that could benefit the Group’s risk management structure, two of which were initiated by the Investment Manager in 2016. We instructed the Investment Manager’s legal and compliance team to undertake an assessment of the Group’s regulatory compliance controls, with the aim of addressing and mitigating the risk of non-compliance with multi-jurisdictional regulatory requirements, including the newly implemented market abuse regulations, anti-bribery laws, data protection, environmental and HSE legislation. The project involved: a detailed review of the existing compliance systems, including the procedures to determine the applicability of current and upcoming law and regulation in Group operations, and ensure ongoing compliance; monitoring the Group’s regulated structures in Jersey, Ireland and Italy; a resource assessment of the compliance teams assisting the Group; evaluation of training needs; and delivery of bespoke training to meet development needs. The assessment report concluded that the Group’s approach to compliance and reporting was effective; the processes and training programmes the Group has in place to ensure compliance with ongoing regulations are adequate and the procedures deployed to assist with horizon-mapping are effective. Separately, an initial review of the third-party property managers of the Group’s assets was also undertaken this year. This involved the completion of detailed questionnaires and interviews with the asset management and finance functions of the Investment Manager group, as well as preparation of a SWOT analysis for each service provider. Recommendations concerning better communication and further quality assurance procedures will be implemented during 2017. Kennedy Wilson Europe Real Estate Plc Annual Report and Accounts 2016 72
In addition, we authorised the Investment Manager to conduct an assessment of the Group’s data governance and information management processes. The project was aimed at identifying and minimising errors, omissions and inaccuracies in data used for both internal and external reporting, which can undermine the integrity of management information used for decision- making, and at reducing the risk of losing information considered highly sensitive to the Company. The assessment results concluded that the Group has in place formal, effective processes for ensuring accuracy and consistency of financial and non-financial/operational reporting by the Company, and recommended ongoing engagement with, and monitoring of, third party service providers who release Company information. Internal audit At our meeting in December 2016, we discussed whether there was a need to establish a formal internal audit function for the Company. It was concluded that, due to the Company’s size and externally-managed structure, it currently does not need an internal audit function, but this matter will continue to be kept under review by the Committee. Although there is no formal internal audit function, the Group relies heavily on internal audit and control support services provided by the Investment Manager group. This is further supplemented by a rolling programme of review of key controls, which is conducted through a combination of the external audit process and reviews by members of the investment management team and/or external advisors, as appropriate. We will continue to consider the engagement of external advisors to undertake individual assessment projects on specific risk areas where it is felt that this is necessary or where in our view the Investment Manager is conflicted. External audit and auditors As part of our review of the scope and results of the audit, during the year we considered and approved KPMG’s plan for the audit of the financial statements for the year ended 31 December 2016. We also held private meetings with the external auditors and the chair met privately with the external auditors before the Board meetings. At the conclusion of the audit, KPMG did not highlight any issues to us which would cause KPMG to qualify its audit report, nor did it highlight any fundamental internal control weaknesses. KPMG has issued an unqualified audit report. See KPMG’s audit report on pages 82 to 84. As part of the review of auditor independence and effectiveness, KPMG have confirmed that they are independent of the Group and have complied with relevant auditing standards. In evaluating KPMG, we have taken into consideration the standing, skills and experience of the firm and the audit team. The Committee assesses the effectiveness of the audit process through the reporting it receives from KPMG in respect of the year-end annual report and financial statements. We remain satisfied that KPMG continues to provide effective independent challenge in carrying out its responsibilities. On the basis of this assessment, we have recommended to the Board that KPMG be reappointed as the external auditor to the Group for the year ending 31 December 2017 and that a resolution to this effect be proposed to shareholders at the AGM to be held on 26 April 2017. We intend to review the performance of the Company’s external auditors annually and to follow the EU Directive and Regulation on Audit Reform, even though this does not apply to a non-EU Company. The external audit contract has not been put out to tender since the Company’s IPO in 2014. Although there is no immediate intention to tender the audit contract, the Company will re-tender at the latest by the 2024 year-end, in line with the transitional arrangements regarding the competitive tender of external audit contracts applicable to UK-listed companies. Following professional guidelines, the audit partner rotates after five years and this is the third year for the current partner. Non-audit services In 2015, we established a policy regarding non-audit services that may be provided by KWE’s external auditors, which prohibits KPMG from providing certain categories of work in line with the relevant guidance on independence, such as the ethical standards issued by the Auditing Practices Board and EU rules. Other categories of work, such as transaction advisory services, including tax structuring and financial and tax due diligence, may, if pre-approved by the Committee, be provided by the auditors, where there is compelling commercial rationale for appointing the auditor and the overall audit versus non-audit fee levels do not exceed specified levels. As a Committee, we have reviewed the provision of non-audit services by KPMG in 2016. For the year ended 31 December 2016, KPMG was paid approximately £0.6 million in fees for audit and audit related services (2015: £0.6 million) and approximately £0.1 million in fees for non-audit services (2015: £0.7 million). The fees for non-audit services related primarily to the provision of tax advisory services (£0.1 million) involving ongoing tax structuring and implementation advice in connection with our Luxembourg entities. The non-audit services undertaken by KPMG in 2016 were a continuation of services being provided by KPMG in 2015, prior to implementation of the non-audit services policy described above. Full details of the fees paid to the auditor for audit services, audit related services and non-audit services are set out in Note 39 to the consolidated financial statements. Notwithstanding such services, the Committee considers KPMG to be independent of the Group. We do not consider that the provision of such non-audit services is a threat to the objectivity and independence of the conduct of the audit services by KPMG. Simon Radford Audit Committee Chair Strategic report G overn an ce Financials A dditional inform ation Kennedy Wilson Europe Real Estate Plc Annual Report and Accounts 2016 73
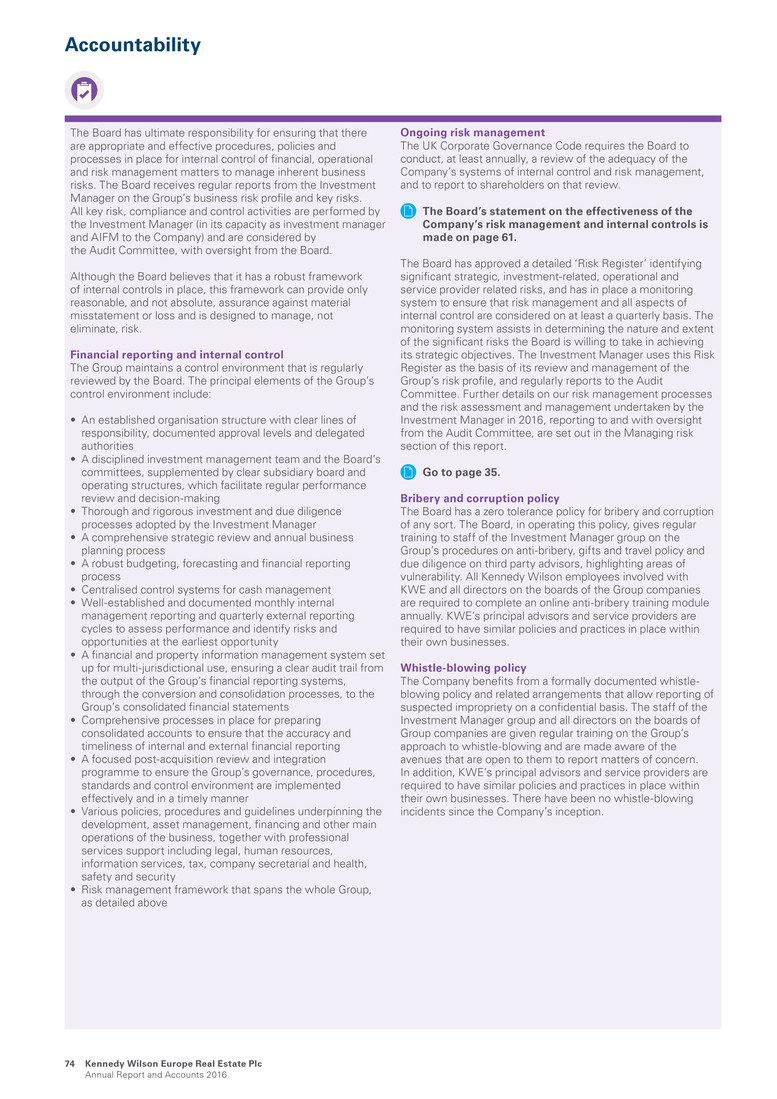
Accountability The Board has ultimate responsibility for ensuring that there are appropriate and effective procedures, policies and processes in place for internal control of financial, operational and risk management matters to manage inherent business risks. The Board receives regular reports from the Investment Manager on the Group’s business risk profile and key risks. All key risk, compliance and control activities are performed by the Investment Manager (in its capacity as investment manager and AIFM to the Company) and are considered by the Audit Committee, with oversight from the Board. Although the Board believes that it has a robust framework of internal controls in place, this framework can provide only reasonable, and not absolute, assurance against material misstatement or loss and is designed to manage, not eliminate, risk. Financial reporting and internal control The Group maintains a control environment that is regularly reviewed by the Board. The principal elements of the Group’s control environment include: • An established organisation structure with clear lines of responsibility, documented approval levels and delegated authorities • A disciplined investment management team and the Board’s committees, supplemented by clear subsidiary board and operating structures, which facilitate regular performance review and decision-making • Thorough and rigorous investment and due diligence processes adopted by the Investment Manager • A comprehensive strategic review and annual business planning process • A robust budgeting, forecasting and financial reporting process • Centralised control systems for cash management • Well-established and documented monthly internal management reporting and quarterly external reporting cycles to assess performance and identify risks and opportunities at the earliest opportunity • A financial and property information management system set up for multi-jurisdictional use, ensuring a clear audit trail from the output of the Group’s financial reporting systems, through the conversion and consolidation processes, to the Group’s consolidated financial statements • Comprehensive processes in place for preparing consolidated accounts to ensure that the accuracy and timeliness of internal and external financial reporting • A focused post-acquisition review and integration programme to ensure the Group’s governance, procedures, standards and control environment are implemented effectively and in a timely manner • Various policies, procedures and guidelines underpinning the development, asset management, financing and other main operations of the business, together with professional services support including legal, human resources, information services, tax, company secretarial and health, safety and security • Risk management framework that spans the whole Group, as detailed above Ongoing risk management The UK Corporate Governance Code requires the Board to conduct, at least annually, a review of the adequacy of the Company’s systems of internal control and risk management, and to report to shareholders on that review. The Board’s statement on the effectiveness of the Company’s risk management and internal controls is made on page 61. The Board has approved a detailed ‘Risk Register’ identifying significant strategic, investment-related, operational and service provider related risks, and has in place a monitoring system to ensure that risk management and all aspects of internal control are considered on at least a quarterly basis. The monitoring system assists in determining the nature and extent of the significant risks the Board is willing to take in achieving its strategic objectives. The Investment Manager uses this Risk Register as the basis of its review and management of the Group’s risk profile, and regularly reports to the Audit Committee. Further details on our risk management processes and the risk assessment and management undertaken by the Investment Manager in 2016, reporting to and with oversight from the Audit Committee, are set out in the Managing risk section of this report. Go to page 35. Bribery and corruption policy The Board has a zero tolerance policy for bribery and corruption of any sort. The Board, in operating this policy, gives regular training to staff of the Investment Manager group on the Group’s procedures on anti-bribery, gifts and travel policy and due diligence on third party advisors, highlighting areas of vulnerability. All Kennedy Wilson employees involved with KWE and all directors on the boards of the Group companies are required to complete an online anti-bribery training module annually. KWE’s principal advisors and service providers are required to have similar policies and practices in place within their own businesses. Whistle-blowing policy The Company benefits from a formally documented whistle- blowing policy and related arrangements that allow reporting of suspected impropriety on a confidential basis. The staff of the Investment Manager group and all directors on the boards of Group companies are given regular training on the Group’s approach to whistle-blowing and are made aware of the avenues that are open to them to report matters of concern. In addition, KWE’s principal advisors and service providers are required to have similar policies and practices in place within their own businesses. There have been no whistle-blowing incidents since the Company’s inception. Kennedy Wilson Europe Real Estate Plc Annual Report and Accounts 2016 74

Committee members and attendance Member Attendance at meetings in 2016 Charlotte Valeur 2/2 Mark McNicholas 2/2 Simon Radford 2/2 Dear Shareholder Welcome to the report of the Management Engagement Committee which provides an overview of our activities during the past year. Committee responsibilities and how they were discharged The principal focus of the Management Engagement Committee in 2016 was: • the review and evaluation of the performance of, and the retention of, the Investment Manager and the Company’s other key third party service providers, and to ensure the terms of the Company’s arrangements with them are fair and reasonable for shareholders • to satisfy itself as to the adequacy of systems and procedures to meet all legal and regulatory requirements applicable to the Company Terms of reference The Management Engagement Committee’s written terms of reference, which are reviewed on a periodic basis, are available on the Company’s website. www.kennedywilson.eu/about-us/board-and- governance/board-committees/ Committee effectiveness During the year, the externally facilitated Board evaluation concluded that the Committee operated well and in accordance with its terms of reference. Charlotte Valeur Management Engagement Committee Chair Evaluation of the Investment Manager and key service providers The Committee discussed the performance of the Company’s investment portfolio and its financial performance in 2016. It was observed that the progress made by the investment management team in successfully delivering on the 2015 business plans for the Group’s investments, in spite of recent macro events creating a challenging economic outlook and an uncertain political environment, and the focused, strategic and high quality acquisitions made in 2016, were commendable. The effective execution of the Group’s conservative financial policy in 2016, through effective balance sheet and liquidity management (covering share buyback, bond issues, pay down of certain secured debt) was also noted. We also noted that KPMG acted as external auditor to the Investment Manager and its group, and we are satisfied that no conflicts have arisen in this regard. At our meeting held in December 2016, we concluded that the Investment Manager’s continued appointment (on the terms agreed in the investment management agreement) is in the best interests of the Company and its shareholders as a whole. Following discussions with the investment management team, we are of the view that the other key service providers to the Company operate effectively with sufficient oversight from the Investment Manager, and no changes were recommended. Legal and regulatory compliance We took into account the results of the regulatory compliance assessment project undertaken by the Investment Manager’s legal and compliance team in 2016. Details of the scope of the project are set out on page 72. A review of the assessment results report concluded that the Group had robust procedures for ensuring compliance with current applicable regulations, and effective controls for horizon mapping, coupled with adequate access to qualified specialist advisors, the investment management team and a dedicated compliance function at the Administrator. Charlotte Valeur Management Engagement Committee Chair Letter from the chair of the Management Engagement Committee Strategic report G overn an ce Financials A dditional inform ation Kennedy Wilson Europe Real Estate Plc Annual Report and Accounts 2016 75
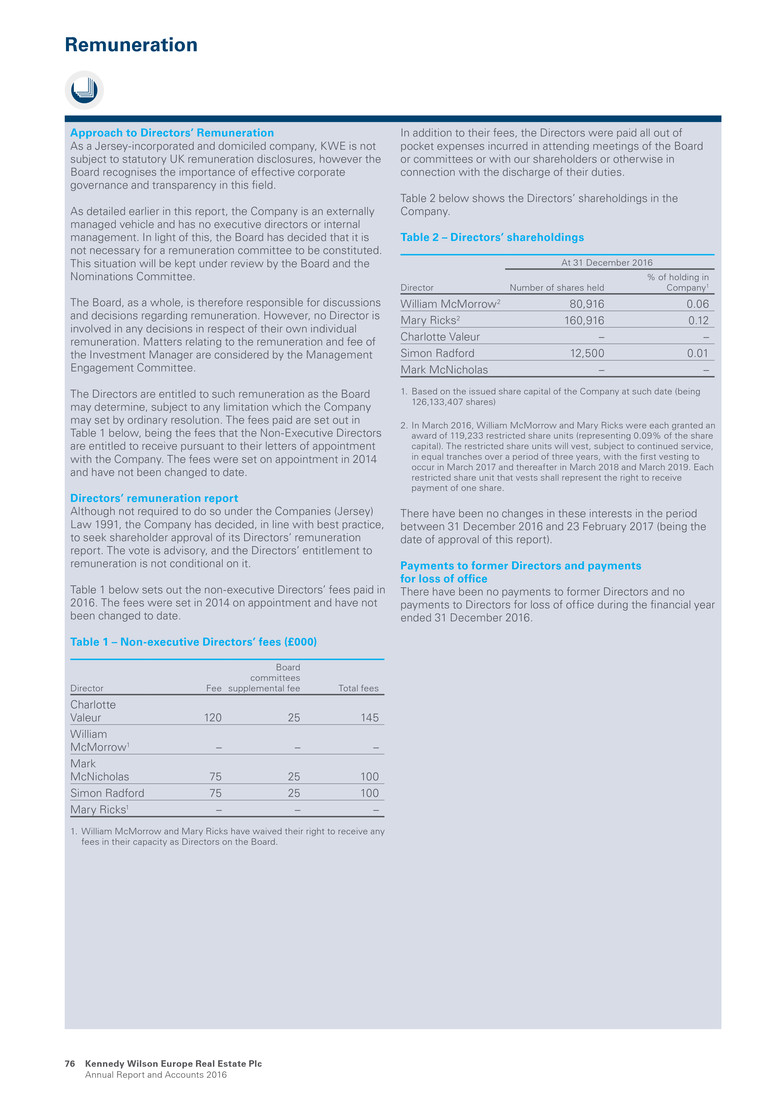
Remuneration Approach to Directors’ Remuneration As a Jersey-incorporated and domiciled company, KWE is not subject to statutory UK remuneration disclosures, however the Board recognises the importance of effective corporate governance and transparency in this field. As detailed earlier in this report, the Company is an externally managed vehicle and has no executive directors or internal management. In light of this, the Board has decided that it is not necessary for a remuneration committee to be constituted. This situation will be kept under review by the Board and the Nominations Committee. The Board, as a whole, is therefore responsible for discussions and decisions regarding remuneration. However, no Director is involved in any decisions in respect of their own individual remuneration. Matters relating to the remuneration and fee of the Investment Manager are considered by the Management Engagement Committee. The Directors are entitled to such remuneration as the Board may determine, subject to any limitation which the Company may set by ordinary resolution. The fees paid are set out in Table 1 below, being the fees that the Non-Executive Directors are entitled to receive pursuant to their letters of appointment with the Company. The fees were set on appointment in 2014 and have not been changed to date. Directors’ remuneration report Although not required to do so under the Companies (Jersey) Law 1991, the Company has decided, in line with best practice, to seek shareholder approval of its Directors’ remuneration report. The vote is advisory, and the Directors’ entitlement to remuneration is not conditional on it. Table 1 below sets out the non-executive Directors’ fees paid in 2016. The fees were set in 2014 on appointment and have not been changed to date. Table 1 – Non-executive Directors’ fees (£000) Director Fee Board committees supplemental fee Total fees Charlotte Valeur 120 25 145 William McMorrow1 – – – Mark McNicholas 75 25 100 Simon Radford 75 25 100 Mary Ricks1 – – – 1. William McMorrow and Mary Ricks have waived their right to receive any fees in their capacity as Directors on the Board. In addition to their fees, the Directors were paid all out of pocket expenses incurred in attending meetings of the Board or committees or with our shareholders or otherwise in connection with the discharge of their duties. Table 2 below shows the Directors’ shareholdings in the Company. Table 2 – Directors’ shareholdings At 31 December 2016 Director Number of shares held % of holding in Company1 William McMorrow2 80,916 0.06 Mary Ricks2 160,916 0.12 Charlotte Valeur – – Simon Radford 12,500 0.01 Mark McNicholas – – 1. Based on the issued share capital of the Company at such date (being 126,133,407 shares) 2. In March 2016, William McMorrow and Mary Ricks were each granted an award of 119,233 restricted share units (representing 0.09% of the share capital). The restricted share units will vest, subject to continued service, in equal tranches over a period of three years, with the first vesting to occur in March 2017 and thereafter in March 2018 and March 2019. Each restricted share unit that vests shall represent the right to receive payment of one share. There have been no changes in these interests in the period between 31 December 2016 and 23 February 2017 (being the date of approval of this report). Payments to former Directors and payments for loss of office There have been no payments to former Directors and no payments to Directors for loss of office during the financial year ended 31 December 2016. Kennedy Wilson Europe Real Estate Plc Annual Report and Accounts 2016 76
Relations with shareholders Approach The Board is committed to maintaining an open dialogue with investors and recognises the importance of that relationship in the governance process, and the key role played by the investment management team in that process. The Company has a comprehensive investor relations programme which aims to help existing and potential investors understand the Group’s business strategy, investments and performance. Investor feedback, as available from the various investor initiatives detailed below, is regularly provided to the Board to ensure an understanding of the objectives and views of investors and to continue to deliver on KWE’s corporate strategy. Further details regarding the programme of investor events over the past year are set out below. Institutional investor programme During 2016, the programme of institutional investor events included: Meetings with principal investors • Meetings with the investment management team and Investor Relations team took place throughout the year. The geographic spread of the investor programme covered Europe and North America. The investment management team conducted the well-established bi-annual investor meetings in February/March and August/September with meetings in London, Dublin, Paris, Brussels, Amsterdam, Toronto and the US • The Board was regularly informed of shareholder views • Institutional shareholders were invited to attend the Company’s full year and half year results presentations • The Chair, the Senior Independent Director and other Directors were available to meet with shareholders Investor site-tours and presentations • We hosted an investor afternoon at our largest asset, 111 Buckingham Palace Road, Victoria, London SW1, with equity and debt investors, as well as equity analysts, to showcase the completed extensive reception and Sky Lobby works • We also conducted seven ad hoc property tours with investors and analysts, visiting our main assets in Dublin, Central London and Madrid • We conducted four sales team meetings and investor seminars during the year, organised by various brokers. This provided the investment management team with the opportunity to present the KWE strategy and performance directly to both sales teams and target investor groups Industry conferences • Industry conferences give the Investment Management team an opportunity to meet a large number of investors on a formal and informal basis. Conferences attended in 2016 included the JPMC European CEO Conference in London, the Davy Real Estate & Financials Conference in Dublin, the BAML European Real Estate Conference in London, the BAML Global Real Estate Conference in New York, and the Morgan Stanley European & EEMA Property Conference in London Debt investors programme • During 2016, the senior representatives of the investment management team held ad hoc credit investor and analyst meetings, and undertook a comprehensive deal roadshow as part of the Company’s bond offering efforts • The investment management team also participated in non-deal roadshows organised by brokers and attended industry conferences where individual and group meetings were held, which provided a good forum to meet both existing and target credit investors. These included the BAML European Credit Conference and the Morgan Stanley Fixed Income Real Estate Conference Feedback on investor relations The Board receives detailed feedback on investor relations on a quarterly basis. The Investor Relations team received feedback from analysts and investors during the year and also from the Group’s corporate advisors. The Company secretary and the legal and compliance team at the Investment Manager group also received feedback on governance matters directly from shareholder bodies. The information was shared with the Board to help members develop their understanding of shareholders’ needs and expectations. Annual General Meeting (AGM) The 2016 AGM provided all shareholders with an opportunity to question the Board and the chair of each of the Board’s committees on matters put to the meeting, including the 2015 Annual Report and Accounts. The results of voting at the 2016 AGM are published on the Company’s website. www.kennedywilson.eu/investors/ shareholder-information/agm/2016-agm/ The 2017 AGM will be held on 26 April 2017. The Notice of AGM can be found on our website. www.kennedywilson.eu/investors/ shareholder-information/agm/ Strategic report G overn an ce Financials A dditional inform ation Kennedy Wilson Europe Real Estate Plc Annual Report and Accounts 2016 77

Information contained elsewhere in the 2016 Annual Report and Accounts The following information can be found elsewhere in the 2016 Annual Report and Accounts as indicated in the table below and is incorporated into this report by reference: Information Pages Post balance sheet events Note 34 on page 141 Likely future developments in the business of the Company or its subsidiaries 20 to 21 Directors 62 to 63 Directors’ interests in shares 76 Investment Manager and service providers 66 Fair, balanced and understandable statement 61 Going concern statement 61 Viability statement 61 Statement on review of principal risks 35 to 40 Directors’ statement of responsibilities in respect of the 2016 Annual Report and Accounts 80 Statement of disclosures of information to the auditor 80 Responsible investments 27 to 33 Share capital Note 28 on page 135 to 136 Financial instruments: Information on the Group’s financial risk management objectives and policies, and its exposure to credit risk, liquidity risk, interest rate risk and foreign currency risk Note 27 on page 130 to 135 Management report This Directors’ report together with the Strategic report on pages 1 to 54 form the Management report for the purposes of DTR 4.1.5 R. Corporate governance statement The information that fulfils the requirements of the corporate governance statement for the purposes of DTR 7.2 can be found on pages 57 to 77 (which are incorporated into this Directors’ report by reference), with the exception of the information referred to in DTR 7.2.6, which is located in this Directors’ report. Disclosure of information under LR 9.8.4R The information that fulfils the reporting requirements under LR 9.8.4R relating to the following matters can be found on the pages identified below: Information Pages Details of any arrangements under which a Director of the Company has waived or agreed to waive any emoluments from the Company or any subsidiary undertaking 60 and 76 Details of the investment management agreement, as a contract of significance, subsisting during the period to which the Company is a party and in which a Director of the Company is or was materially interested 152 to 153 Results and dividends The financial results for the year ended 31 December 2016 can be found in the consolidated statement of comprehensive income as set out on page 86 and in the financial review as set out on pages 50 to 54. Details of the dividends declared and paid during the financial year ended 31 December 2016 are set out in Note 29 to the consolidated financial statements. An additional interim dividend of 12 pence per share was declared on 24 February 2017 and will be paid on 31 March 2017 to shareholders on the register on 10 March 2017. Political donations No political donations were made during the year under review. Directors’ letters of appointment of Directors The Directors do not have contracts of employment, but hold their office in accordance with their letters of appointment and the articles of association of the Company. Each Director has a letter of appointment dated 10 February 2014, as amended. The Directors were appointed for an initial three-year term, which was to expire in February 2017, renewable thereafter at the discretion of the Board. The initial three-year term was extended by a further three-year term in December 2016. The Directors’ appointments can be terminated with three months’ notice and the Company is entitled to make a payment in lieu of the notice period on termination. The letters of appointment provide that the office of a Director can be terminated with immediate effect without notice or payment in lieu of notice in certain circumstances including fraud, dishonesty or serious misconduct, bankruptcy, disqualification as a director or material breach of obligations under their respective letters of appointment. Employees The Company has no employees. The Group has no employees (except in certain of its wholly- owned operating subsidiaries) and accordingly, there are no employee share schemes in place. Amendment of articles of association There are no restrictions on amending the articles of association of the Company other than the need to pass a special resolution of the Company’s shareholders. Powers of the Directors Subject to the Company’s articles of association, the Companies (Jersey) Law 1991 and any directions given by the Company by special resolution, the business of the Company will be managed by the Board, which may exercise all the powers of the Company including in relation to the issuing and buying back by the Company of its shares. Share capital The Company’s share capital consists of 126,133,407 ordinary no par value shares. The rights and obligations relating to the ordinary share capital are outlined in the Company’s articles of association. At the 2016 AGM held on 27 April 2016, the Directors were granted authorities to allot and issue certain shares for cash on a non-pre-emptive basis and to make market purchases of shares of up to 14.99% of the shares in issue at the time of approval. Following its announcement on 28 September 2016 of a £100 million share buyback programme, in the period from 4 October 2016 to 28 November 2016, the Company re-purchased 9,800,531 ordinary shares (representing 7.2% of the Company’s issued share capital) at an average price of 1,020p per share in the market in accordance with this authority. The ordinary shares repurchased by the Company have been cancelled. In 2016, no shares were issued for cash free from pre-emption rights. Details of share capital movements are given in Note 28 to the consolidated financial statements and further information on the share buyback can be found on page 52. The Directors intend to seek renewal of these authorities at the 2017 AGM to be held on 26 April 2017. Directors’ report Kennedy Wilson Europe Real Estate Plc Annual Report and Accounts 2016 78

Restrictions on transfer of securities and voting rights in the Company There are no restrictions on the transfer of securities in the Company, save as follows: • Pursuant to the Listing Rules of the Financial Conduct Authority (the ‘Listing Rules’) and the Company’s share dealing code, whereby the Directors of the Company require approval prior to dealing in the Company’s shares • Pursuant to the Company’s articles of association, whereby the Board may decline to register a transfer of shares or otherwise impose a restriction on shares to prevent the Company breaching any law or regulation Except as described in Note 31A to the consolidated financial statements, the Company is not aware of any agreements between holders of securities that may result in restrictions on the transfer of securities in the Company. There are no restrictions on the voting rights of securities in the Company. The notice of the 2017 AGM specifies deadlines for appointing a proxy or proxies to vote in relation to resolutions to be passed at the 2017 AGM to be held on 26 April 2017. Securities carrying special rights No person holds securities in the Company carrying special rights with regard to control of the Company. Substantial shareholdings The Company is aware of the material shareholders shown in Table 1 who were, directly or indirectly, interested in 5% or more of the total voting rights in the Company’s issued share capital. Information provided to the Company pursuant to the Disclosure Guidance and Transparency Rules is publicly available via the regulatory information services and on the Company’s website. Additional information on share ownership is set out on page 155. Table 1 – Substantial shareholdings Shareholder At 31 December 20161 Number of shares held % of holding in Company2 Kennedy-Wilson Holdings, Inc. 29,769,435 23.60 Quantum Strategic Partners Ltd. 15,981,750 12.67 Franklin Resources Inc. 11,421,867 9.06 Footnote: 1. There have been no changes in these interests between 31 December 2016 and 23 February 2017 (being the date of approval of this report). 2. Based on the issued share capital of the Company at such date (being 126,133,407 shares). Change of control Under the Group’s financing facilities, any change of control at the borrower or immediate parent company level may trigger a pre-payment of the outstanding amounts to the lending banks and, in certain facilities, the change of control provisions are extended to include a change of control at the ultimate parent company level as well. In addition, the Group has a revolving credit facility in the amount of £225 million due August 2017 (which remained undrawn as at 31 December 2016), the terms of which require the consent of the majority of the lenders to any proposed merger or consolidation of the Company (or of any of the borrowers or guarantors under that facility) where the Company (or relevant obligated entity) would cease to be the surviving legal entity from such merger or consolidation. The Company has outstanding unsecured corporate bonds in issue, which are listed on the London Stock Exchange, and which contain change of control provisions. Upon a change of control of the Company and subject to certain credit rating conditions being met (as set out in the relevant terms and conditions of the bonds), each holder of a bond has the option to require the Company to imminently repay the principal amount of the bonds held by such holder. Appointment and replacement of Directors The Company’s rules on the appointment and replacement of Directors are contained within its articles of association. The Directors have the power at any time, and from time to time, to appoint any natural person (other than one disqualified or ineligible by law or under the Company’s articles of association to act as a director of a company) to be a Director in accordance with the articles of association. The Company may, by ordinary resolution, appoint any natural person (other than one disqualified or ineligible by law or under the Company’s articles of association to act as a director of a company) as a Director and remove any Director from office. Directors’ and officers’ insurance An appropriate level of directors’ and officers’ insurance is maintained by the Company whereby the Directors are indemnified against liabilities to third parties to the extent permitted by the Companies (Jersey) Law 1991. Auditors KPMG has been the Company’s external auditor since the Company’s incorporation in December 2013. KPMG has expressed its willingness to continue as auditor for the financial year ending 31 December 2017. A resolution relating to KPMG’s re-appointment as auditor and authority for the Audit Committee to determine its remuneration for the period will be tabled at the forthcoming AGM. Annual General Meeting The 2017 AGM of the Company will be held at 10.00 am at the offices of Allen & Overy LLP, One Bishops Square, London E1 6AD on 26 April 2017. Details of the resolutions to be proposed at the 2017 AGM, together with the explanations, will appear in the notice of the AGM to be distributed to shareholders together with the 2016 Annual Report and Accounts. Members of the Board, including the chair and the Chair of the Audit Committee, as well as representatives of the Investment Manager, will be in attendance at the AGM to answer any shareholder questions. This report was approved by the Board on 23 February 2017. Signed on behalf of the Board by: Charlotte Valeur Simon Radford Chair Director Strategic report G overn an ce Financials A dditional inform ation Kennedy Wilson Europe Real Estate Plc Annual Report and Accounts 2016 79

Statement of Directors’ responsibilities Introduction The Directors, whose names are set out on pages 62 to 63, are responsible for preparing the annual report and the consolidated financial statements in accordance with applicable law and regulations. The Companies (Jersey) Law 1991 requires the Directors to prepare the consolidated financial statements for each financial year. The consolidated financial statements have been prepared in accordance with International Financial Reporting Standards as adopted by the European Union (‘IFRS’). Under the Companies (Jersey) Law 1991, the Directors must not approve the consolidated financial statements unless they are satisfied that, to the best of their knowledge, they give a true and fair view of, or are presented fairly in all material respects so as to show, the Group’s profit or loss for the financial period and the state of affairs of the Group as at the end of that period. In preparing the financial statements, the Directors are required to: • Present fairly the financial position, the financial performance and cash flows of the Group • Select suitable accounting policies and then apply them consistently • Present information, including accounting policies, in a manner that provides relevant, reliable, comparable and understandable information • Make judgements and estimates that are reasonable and prudent • Provide additional disclosures when compliance with specific requirements in IFRS is insufficient to enable users to understand the impact of particular transactions, other events and conditions on the Group’s financial position and financial performance • For the consolidated financial statements, state whether they have been prepared in accordance with IFRS • Prepare the consolidated financial statements on the going concern basis unless it is inappropriate to presume that the Group will continue in business The Directors are responsible for keeping adequate accounting records that are sufficient to show and explain the Group’s transactions and disclose with reasonable accuracy at any time the financial position of the Group and enable them to ensure that its consolidated financial statements comply with the provisions of the Companies (Jersey) Law 1991 and Article 4 of the IAS Regulation. They also have a general responsibility for taking such steps as are reasonably open to them to safeguard the assets of the Group and hence for taking reasonable steps for the prevention and detection of fraud and other irregularities. Statement of responsibility Pursuant to Rule 4.1.12 of the DTRs, each of the Directors, whose names and functions are listed on pages 62 to 63 of this 2016 Annual Report and Accounts, confirm that, to the best of his or her knowledge: • The consolidated financial statements, prepared in accordance with IFRS, give a true and fair view of the assets, liabilities, financial position and profit or loss of the Company and the undertakings included in the consolidation taken as a whole • The management report, contained in the 2016 Annual Report and Accounts, includes a fair review of the development and performance of the business and the position of the Company and the undertakings included in the consolidation taken as a whole, together with a description of the principal risks and uncertainties that they face Statement of disclosure of information to the auditor The Directors confirm that, having made requisite enquiries and so far as they are aware, there is no relevant audit information (being information needed by the auditors in connection with preparing their audit report) of which the Company’s auditors are unaware, and each of the Directors has taken all the steps that he or she ought to have taken as a Director in order to make himself or herself aware of any relevant audit information and to establish that the Company’s auditors are aware of that information. Website publication The Directors are responsible for ensuring the 2016 Annual Report and Accounts, including the consolidated financial statements, is made available on the Company’s website. The maintenance and integrity of the corporate and financial information included on the Company’s website is the responsibility of the Directors. Legislation in the United Kingdom and Jersey governing the preparation and dissemination of financial statements may vary from legislation in other jurisdictions. Signed on behalf of the Board by: Charlotte Valeur Simon Radford Chair Director 23 February 2017 Kennedy Wilson Europe Real Estate Plc Annual Report and Accounts 2016 80

Financials 82 Independent audit report 85 Consolidated income statement 86 Consolidated statement of comprehensive income 87 Consolidated balance sheet 88 Consolidated statement of changes in equity 90 Consolidated cash flow statement 92 Notes to the consolidated financial statements Towers Business Park, Manchester, UK Acquired in May 2016 Strategic report G overnance Fin an cials A dditional inform ation 81 Kennedy Wilson Europe Real Estate Plc Annual Report and Accounts 2016
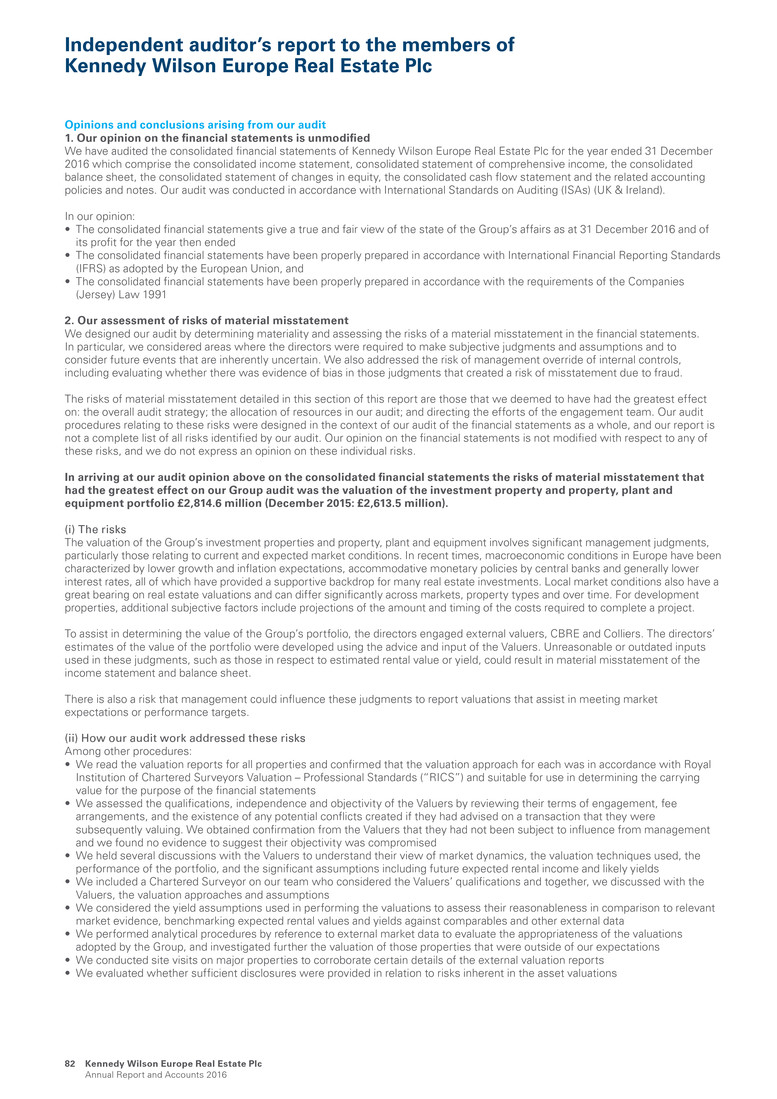
Opinions and conclusions arising from our audit 1. Our opinion on the financial statements is unmodified We have audited the consolidated financial statements of Kennedy Wilson Europe Real Estate Plc for the year ended 31 December 2016 which comprise the consolidated income statement, consolidated statement of comprehensive income, the consolidated balance sheet, the consolidated statement of changes in equity, the consolidated cash flow statement and the related accounting policies and notes. Our audit was conducted in accordance with International Standards on Auditing (ISAs) (UK & Ireland). In our opinion: • The consolidated financial statements give a true and fair view of the state of the Group’s affairs as at 31 December 2016 and of its profit for the year then ended • The consolidated financial statements have been properly prepared in accordance with International Financial Reporting Standards (IFRS) as adopted by the European Union, and • The consolidated financial statements have been properly prepared in accordance with the requirements of the Companies (Jersey) Law 1991 2. Our assessment of risks of material misstatement We designed our audit by determining materiality and assessing the risks of a material misstatement in the financial statements. In particular, we considered areas where the directors were required to make subjective judgments and assumptions and to consider future events that are inherently uncertain. We also addressed the risk of management override of internal controls, including evaluating whether there was evidence of bias in those judgments that created a risk of misstatement due to fraud. The risks of material misstatement detailed in this section of this report are those that we deemed to have had the greatest effect on: the overall audit strategy; the allocation of resources in our audit; and directing the efforts of the engagement team. Our audit procedures relating to these risks were designed in the context of our audit of the financial statements as a whole, and our report is not a complete list of all risks identified by our audit. Our opinion on the financial statements is not modified with respect to any of these risks, and we do not express an opinion on these individual risks. In arriving at our audit opinion above on the consolidated financial statements the risks of material misstatement that had the greatest effect on our Group audit was the valuation of the investment property and property, plant and equipment portfolio £2,814.6 million (December 2015: £2,613.5 million). (i) The risks The valuation of the Group’s investment properties and property, plant and equipment involves significant management judgments, particularly those relating to current and expected market conditions. In recent times, macroeconomic conditions in Europe have been characterized by lower growth and inflation expectations, accommodative monetary policies by central banks and generally lower interest rates, all of which have provided a supportive backdrop for many real estate investments. Local market conditions also have a great bearing on real estate valuations and can differ significantly across markets, property types and over time. For development properties, additional subjective factors include projections of the amount and timing of the costs required to complete a project. To assist in determining the value of the Group’s portfolio, the directors engaged external valuers, CBRE and Colliers. The directors’ estimates of the value of the portfolio were developed using the advice and input of the Valuers. Unreasonable or outdated inputs used in these judgments, such as those in respect to estimated rental value or yield, could result in material misstatement of the income statement and balance sheet. There is also a risk that management could influence these judgments to report valuations that assist in meeting market expectations or performance targets. (ii) How our audit work addressed these risks Among other procedures: • We read the valuation reports for all properties and confirmed that the valuation approach for each was in accordance with Royal Institution of Chartered Surveyors Valuation – Professional Standards (“RICS”) and suitable for use in determining the carrying value for the purpose of the financial statements • We assessed the qualifications, independence and objectivity of the Valuers by reviewing their terms of engagement, fee arrangements, and the existence of any potential conflicts created if they had advised on a transaction that they were subsequently valuing. We obtained confirmation from the Valuers that they had not been subject to influence from management and we found no evidence to suggest their objectivity was compromised • We held several discussions with the Valuers to understand their view of market dynamics, the valuation techniques used, the performance of the portfolio, and the significant assumptions including future expected rental income and likely yields • We included a Chartered Surveyor on our team who considered the Valuers’ qualifications and together, we discussed with the Valuers, the valuation approaches and assumptions • We considered the yield assumptions used in performing the valuations to assess their reasonableness in comparison to relevant market evidence, benchmarking expected rental values and yields against comparables and other external data • We performed analytical procedures by reference to external market data to evaluate the appropriateness of the valuations adopted by the Group, and investigated further the valuation of those properties that were outside of our expectations • We conducted site visits on major properties to corroborate certain details of the external valuation reports • We evaluated whether sufficient disclosures were provided in relation to risks inherent in the asset valuations Independent auditor’s report to the members of Kennedy Wilson Europe Real Estate Plc Kennedy Wilson Europe Real Estate Plc Annual Report and Accounts 2016 82
3. Our application of materiality and an overview of the scope of our audit We apply a concept of materiality in planning and performing our audit, and also in evaluating the effects of misstatements on our audit and on the financial statements. In considering whether the financial statements are free of material misstatement, we consider the magnitude of misstatement that makes it probable that the economic decisions of a knowledgeable member, relying on the financial statements, would be altered or influenced. We then use this materiality to determine the extent of testing needed to reduce the probability that the aggregate of uncorrected and undetected misstatements exceeds materiality for the financial statements as a whole to an appropriately low level. The materiality for the consolidated financial statements as a whole was set at £33.0 million (2015: £30.0 million), or 1% of total assets. Because real estate investments represent almost 88% of total assets, we consider total assets to be one of the principal measurements for members of the Company in assessing the financial performance of the Group. In addition, a number of key performance indicators are driven by income statement items and, accordingly, we applied a lower specific materiality of £9.2 million (2015: £7.4 million) based on profit before tax, valuation movements, and finance costs, for testing other account balances. We agreed with the Audit Committee to report to them corrected and uncorrected misstatements we identified through our audit with a value in excess of £1.65 million (2015: £1.5 million) in respect of investment property and property, plant and equipment, as well as those with a value in excess of £0.46 million (2015: £0.37 million) for other account balances. We also agreed to report other audit misstatements below these thresholds that we believe warranted reporting on qualitative grounds. The structure of the Group’s finance function is such that transactions and balances are accounted for by a central group finance team. We performed audit procedures, including those in relation to the risks set out above, on those transactions and balances accounted for at group level. Our audits covered 100% of total consolidated revenue, 100% of consolidated profit before tax and 100% of consolidated total assets. 4. We have nothing to report on the disclosures of principal risks Based on the knowledge we acquired during our audit, we have nothing material to add or draw attention to in relation to: • The Directors’ statement in the annual report concerning the principal risks, their management, and, based on that, the directors’ assessment and expectations of the Group continuing in operation over the three year period to 2019, or • The disclosures in the Directors’ statement in the annual report concerning the use of the going concern basis of accounting 5. We have nothing to report in respect of the matters on which we are required to report by exception Under the ISAs (UK & Ireland) we are required to report to you if, based on the knowledge we acquired during our audit, we have identified information in the annual report that contains a material inconsistency with either that knowledge or the financial statements, a material misstatement of fact, or that is otherwise misleading. In particular, we are required to report to you if: • We have identified any inconsistencies between the knowledge we acquired during our audit and the Directors’ statement that they consider the annual report and the financial statements as a whole is fair, balanced and understandable and provides information necessary for shareholders to assess the entity’s position and performance, business model and strategy, or • The report from the Audit Committee does not appropriately disclose those matters that we communicated to the Audit Committee The Listing Rules of the Financial Conduct Authority require us to review: • The Directors’ statement in the annual report in relation to going concern and longer term viability • The part of the Corporate Governance Statement in the annual report relating to the Company’s compliance with the provisions of the UK Corporate Governance Code specified for our review, and • Certain elements of remuneration disclosures in the report to shareholders by the directors 6. Our conclusions on other matters on which we are required to report by the Companies (Jersey) Law 1991 are set out below We have nothing to report in respect of the following matters where the Companies (Jersey) Law 1991 which requires us to report to you if, in our opinion: • Adequate accounting records have not been kept by the parent company • Returns adequate for our audit have not been received from branches not visited by us • The financial statements are not in agreement with the accounting records, or • We have not received all the information and explanations we require for our audit Strategic report G overnance Fin an cials A dditional inform ation Kennedy Wilson Europe Real Estate Plc Annual Report and Accounts 2016 83

Independent auditor’s report to the members of Kennedy Wilson Europe Real Estate Plc continued Basis of our report, responsibilities and restrictions on use As explained more fully in the Directors’ responsibilities statement set out in the annual report the directors are responsible for the preparation of the financial statements and for being satisfied that they give a true and fair view. Our responsibility is to audit and express an opinion on the consolidated financial statements in accordance with applicable law and International Standards on Auditing (ISAs) (UK & Ireland). Those standards require us to comply with the Financial Reporting Council’s Ethical Standards for Auditors. An audit undertaken in accordance with ISAs (UK & Ireland) involves obtaining evidence about the amounts and disclosures in the financial statements sufficient to give reasonable assurance that the financial statements are free from material misstatement, whether caused by fraud or error. This includes an assessment of: whether the accounting policies are appropriate to the Group’s circumstances and have been consistently applied and adequately disclosed; the reasonableness of significant accounting estimates made by the directors; and the overall presentation of the financial statements. In addition, we read all the financial and non-financial information in the Annual Report and Accounts to identify material inconsistencies with the audited consolidated financial statements and to identify any information that is apparently materially incorrect based on, or materially inconsistent with, the knowledge acquired by us in the course of performing the audit. If we become aware of any apparent material misstatements or inconsistencies we consider the implications for our report. While an audit conducted in accordance with ISAs (UK & Ireland) is designed to provide reasonable assurance of identifying material misstatements or omissions it is not guaranteed to do so. Rather, the auditor plans the audit to determine the extent of testing needed to reduce to an appropriately low level the probability that the aggregate of uncorrected and undetected misstatements does not exceed materiality for the financial statements as a whole. This testing requires us to conduct significant audit work on a broad range of assets, liabilities, income and expense as well as devoting significant time of the most experienced members of the audit team, in particular the engagement partner responsible for the audit, to subjective areas of the accounting and reporting. Our report is made solely to the Company’s members, as a body, in accordance with Article 113A of the Companies (Jersey) Law 1991. Our audit work has been undertaken so that we might state to the Company’s members those matters we are required to state to them in an auditor’s report and for no other purpose. To the fullest extent permitted by law, we do not accept or assume responsibility to anyone other than the Company and the Company’s members as a body, for our audit work, for this report, or for the opinions we have formed. Michael Gibbons for and on behalf of KPMG Chartered Accountants, Statutory Audit Firm 1 Stokes Place, St Stephen’s Green, Dublin 2, Ireland 23 February 2017 Kennedy Wilson Europe Real Estate Plc Annual Report and Accounts 2016 84

Notes Year ended 31 December 2016 £m Year ended 31 December 2015 £m Revenue Rental income 7 191.5 138.8 Hotel revenue 10 19.4 20.0 Interest income from loans secured by real estate 13 6.3 13.4 217.2 172.2 Property related expenses 8 (35.8) (22.7) Hotel cost of sales 11 (16.3) (14.4) (52.1) (37.1) Gross profit 165.1 135.1 Gain on sale of investment and development property and loan collateral 9 8.5 14.6 Net change in fair value of investment and development property 17 (10.8) 208.0 Net change in fair value of loans secured by real estate 18 0.3 5.1 Other gains – 0.8 163.1 363.6 Expenses Administrative expenses 12 (16.4) (15.9) Investment management fee 31A(i) (16.3) (15.2) Performance fee 31A(ii) – (29.7) (32.7) (60.8) Results from operating activities before financing income and costs 130.4 302.8 Interest income from cash and cash equivalents 13 0.6 0.6 Finance costs 14 (57.7) (36.8) Net finance expense (57.1) (36.2) Profit before taxation 73.3 266.6 Taxation 15 (7.3) (7.6) Profit for the year after taxation 66.0 259.0 Earnings per share (basic and diluted) 16A 49.1p 191.0p The accompanying notes form an integral part of these consolidated financial statements. On behalf of the Board Simon Radford Mark McNicholas Director Director Consolidated income statement Strategic report G overnance Fin an cials A dditional inform ation Kennedy Wilson Europe Real Estate Plc Annual Report and Accounts 2016 85

Notes Year ended 31 December 2016 £m Year ended 31 December 2015 £m Profit for the year after taxation 66.0 259.0 Other comprehensive income: Items that may be reclassified subsequently to profit or loss: Foreign operations – foreign currency translation differences 30A 126.2 (12.2) Hedge of net investment in foreign operations 30A (93.0) 3.9 33.2 (8.3) Items that will never be reclassified to profit or loss: Net change in fair value of property, plant and equipment 19 1.9 (1.3) Other comprehensive income for the year 35.1 (9.6) Total comprehensive income for the year, net of tax 101.1 249.4 Profit attributable to: Owners of the Company 65.9 259.0 Non-controlling interests 3A(iii) 0.1 – 66.0 259.0 Total comprehensive income attributable to: Owners of the Company 101.0 249.4 Non-controlling interests 3A(iii) 0.1 – 101.1 249.4 The accompanying notes form an integral part of these consolidated financial statements. On behalf of the Board Simon Radford Mark McNicholas Director Director Consolidated statement of comprehensive income Kennedy Wilson Europe Real Estate Plc Annual Report and Accounts 2016 86
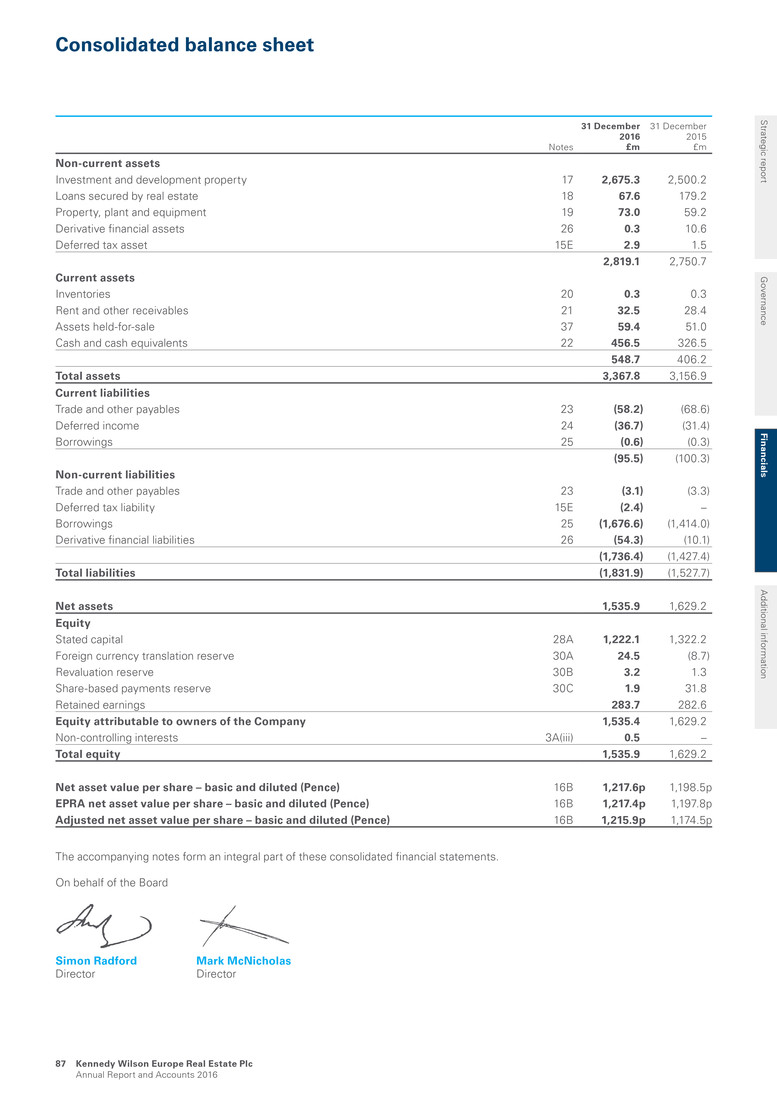
Notes 31 December 2016 £m 31 December 2015 £m Non-current assets Investment and development property 17 2,675.3 2,500.2 Loans secured by real estate 18 67.6 179.2 Property, plant and equipment 19 73.0 59.2 Derivative financial assets 26 0.3 10.6 Deferred tax asset 15E 2.9 1.5 2,819.1 2,750.7 Current assets Inventories 20 0.3 0.3 Rent and other receivables 21 32.5 28.4 Assets held-for-sale 37 59.4 51.0 Cash and cash equivalents 22 456.5 326.5 548.7 406.2 Total assets 3,367.8 3,156.9 Current liabilities Trade and other payables 23 (58.2) (68.6) Deferred income 24 (36.7) (31.4) Borrowings 25 (0.6) (0.3) (95.5) (100.3) Non-current liabilities Trade and other payables 23 (3.1) (3.3) Deferred tax liability 15E (2.4) – Borrowings 25 (1,676.6) (1,414.0) Derivative financial liabilities 26 (54.3) (10.1) (1,736.4) (1,427.4) Total liabilities (1,831.9) (1,527.7) Net assets 1,535.9 1,629.2 Equity Stated capital 28A 1,222.1 1,322.2 Foreign currency translation reserve 30A 24.5 (8.7) Revaluation reserve 30B 3.2 1.3 Share-based payments reserve 30C 1.9 31.8 Retained earnings 283.7 282.6 Equity attributable to owners of the Company 1,535.4 1,629.2 Non-controlling interests 3A(iii) 0.5 – Total equity 1,535.9 1,629.2 Net asset value per share – basic and diluted (Pence) 16B 1,217.6p 1,198.5p EPRA net asset value per share – basic and diluted (Pence) 16B 1,217.4p 1,197.8p Adjusted net asset value per share – basic and diluted (Pence) 16B 1,215.9p 1,174.5p The accompanying notes form an integral part of these consolidated financial statements. On behalf of the Board Simon Radford Mark McNicholas Director Director Consolidated balance sheet Strategic report G overnance Fin an cials A dditional inform ation Kennedy Wilson Europe Real Estate Plc Annual Report and Accounts 2016 87
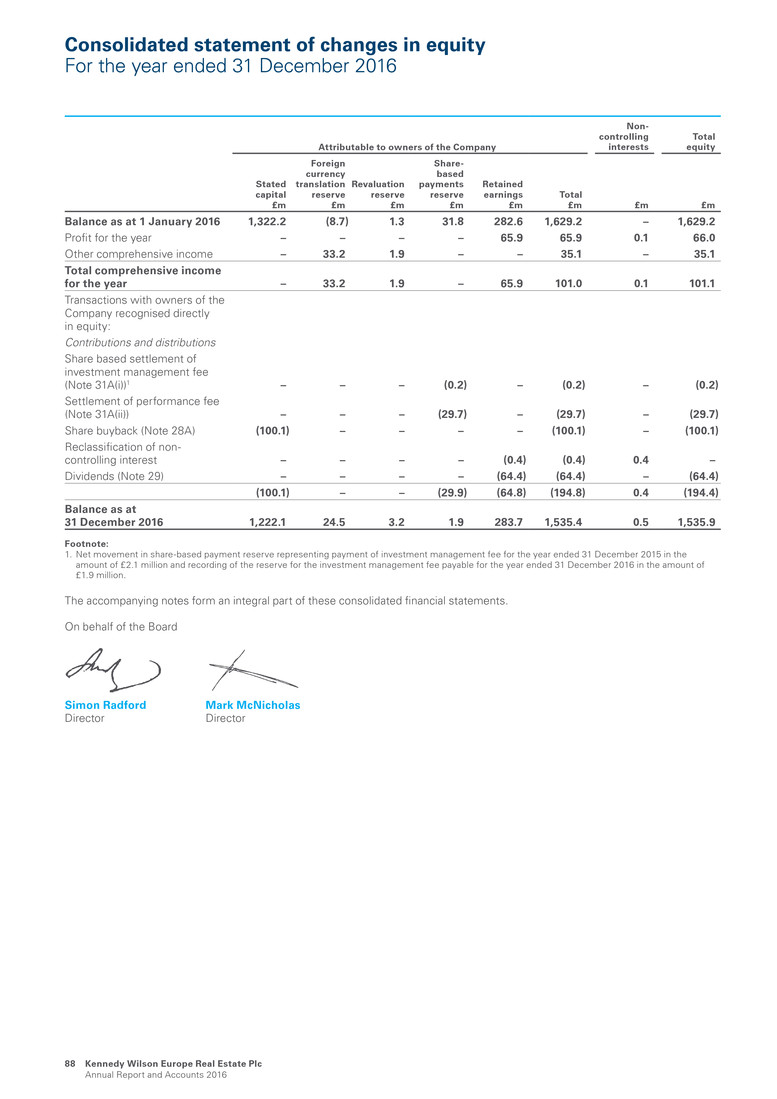
Attributable to owners of the Company Non- controlling interests Total equity Stated capital £m Foreign currency translation reserve £m Revaluation reserve £m Share- based payments reserve £m Retained earnings £m Total £m £m £m Balance as at 1 January 2016 1,322.2 (8.7) 1.3 31.8 282.6 1,629.2 – 1,629.2 Profit for the year – – – – 65.9 65.9 0.1 66.0 Other comprehensive income – 33.2 1.9 – – 35.1 – 35.1 Total comprehensive income for the year – 33.2 1.9 – 65.9 101.0 0.1 101.1 Transactions with owners of the Company recognised directly in equity: Contributions and distributions Share based settlement of investment management fee (Note 31A(i))1 – – – (0.2) – (0.2) – (0.2) Settlement of performance fee (Note 31A(ii)) – – – (29.7) – (29.7) – (29.7) Share buyback (Note 28A) (100.1) – – – – (100.1) – (100.1) Reclassification of non- controlling interest – – – – (0.4) (0.4) 0.4 – Dividends (Note 29) – – – – (64.4) (64.4) – (64.4) (100.1) – – (29.9) (64.8) (194.8) 0.4 (194.4) Balance as at 31 December 2016 1,222.1 24.5 3.2 1.9 283.7 1,535.4 0.5 1,535.9 Footnote: 1. Net movement in share-based payment reserve representing payment of investment management fee for the year ended 31 December 2015 in the amount of £2.1 million and recording of the reserve for the investment management fee payable for the year ended 31 December 2016 in the amount of £1.9 million. The accompanying notes form an integral part of these consolidated financial statements. On behalf of the Board Simon Radford Mark McNicholas Director Director Consolidated statement of changes in equity For the year ended 31 December 2016 Kennedy Wilson Europe Real Estate Plc Annual Report and Accounts 2016 88

Attributable to owners of the Company Non- controlling interests1 Total equity Stated capital £m Foreign currency translation reserve £m Revaluation reserve £m Share- based payments reserve £m Retained earnings £m Total £m £m £m Balance as at 1 January 2015 1,314.9 (0.4) 2.6 1.7 71.1 1,389.9 – 1,389.9 Profit for the year – – – – 259.0 259.0 – 259.0 Other comprehensive loss – (8.3) (1.3) – – (9.6) – (9.6) Total comprehensive income for the year – (8.3) (1.3) – 259.0 249.4 – 249.4 Transactions with owners of the Company recognised directly in equity: Contributions and distributions Share based settlement of investment management fee (Notes 28 and 31A(i))2 7.3 – – 0.4 – 7.7 – 7.7 Performance fee expense (Note 31A(ii)) – – – 29.7 – 29.7 – 29.7 Dividends (Note 29) – – – – (47.5) (47.5) – (47.5) 7.3 – – 30.1 (47.5) (10.1) – (10.1) Balance as at 31 December 2015 1,322.2 (8.7) 1.3 31.8 282.6 1,629.2 – 1,629.2 Footnotes: 1. Non-controlling interests relate to certain development properties in Spain. As at and for the year ended 31 December 2015, such amounts were not material. 2. Net movement in share-based payment reserve representing reversal of £1.7 million opening reserve and recording of year end reserve for the investment management fee payable in the amount of £2.1 million. The accompanying notes form an integral part of these consolidated financial statements. On behalf of the Board Simon Radford Mark McNicholas Director Director Consolidated statement of changes in equity For the year ended 31 December 2015 Strategic report G overnance Fin an cials A dditional inform ation Kennedy Wilson Europe Real Estate Plc Annual Report and Accounts 2016 89
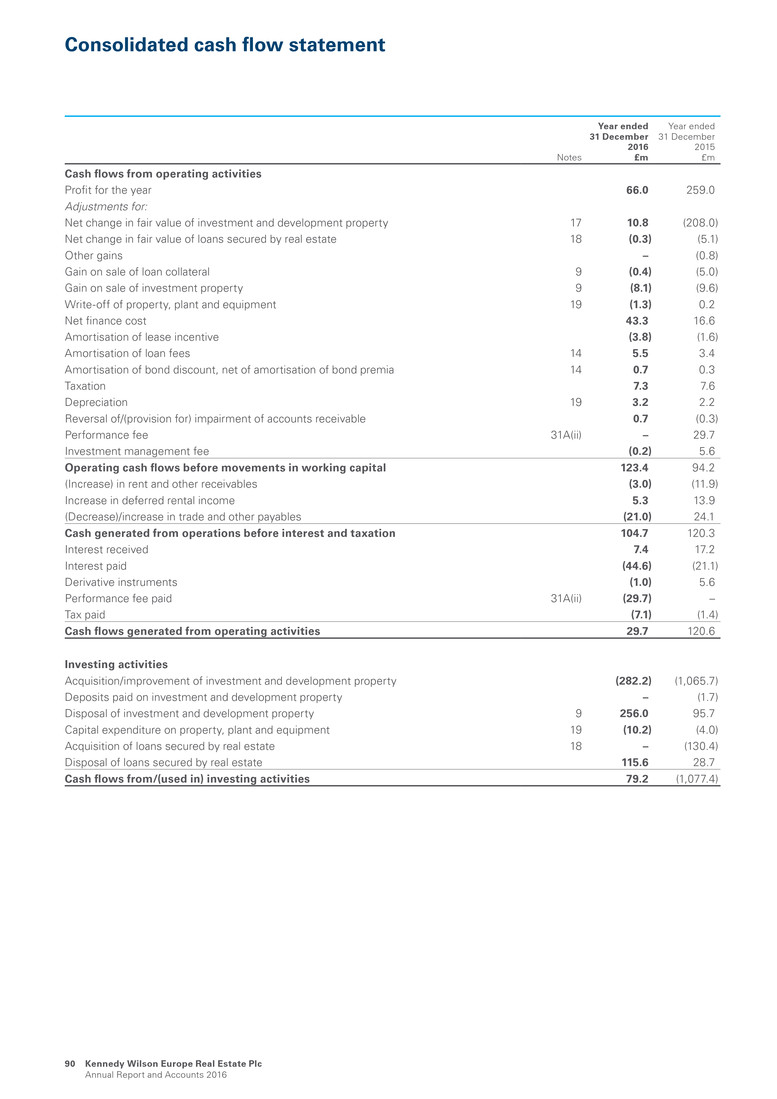
Notes Year ended 31 December 2016 £m Year ended 31 December 2015 £m Cash flows from operating activities Profit for the year 66.0 259.0 Adjustments for: Net change in fair value of investment and development property 17 10.8 (208.0) Net change in fair value of loans secured by real estate 18 (0.3) (5.1) Other gains – (0.8) Gain on sale of loan collateral 9 (0.4) (5.0) Gain on sale of investment property 9 (8.1) (9.6) Write-off of property, plant and equipment 19 (1.3) 0.2 Net finance cost 43.3 16.6 Amortisation of lease incentive (3.8) (1.6) Amortisation of loan fees 14 5.5 3.4 Amortisation of bond discount, net of amortisation of bond premia 14 0.7 0.3 Taxation 7.3 7.6 Depreciation 19 3.2 2.2 Reversal of/(provision for) impairment of accounts receivable 0.7 (0.3) Performance fee 31A(ii) – 29.7 Investment management fee (0.2) 5.6 Operating cash flows before movements in working capital 123.4 94.2 (Increase) in rent and other receivables (3.0) (11.9) Increase in deferred rental income 5.3 13.9 (Decrease)/increase in trade and other payables (21.0) 24.1 Cash generated from operations before interest and taxation 104.7 120.3 Interest received 7.4 17.2 Interest paid (44.6) (21.1) Derivative instruments (1.0) 5.6 Performance fee paid 31A(ii) (29.7) – Tax paid (7.1) (1.4) Cash flows generated from operating activities 29.7 120.6 Investing activities Acquisition/improvement of investment and development property (282.2) (1,065.7) Deposits paid on investment and development property – (1.7) Disposal of investment and development property 9 256.0 95.7 Capital expenditure on property, plant and equipment 19 (10.2) (4.0) Acquisition of loans secured by real estate 18 – (130.4) Disposal of loans secured by real estate 115.6 28.7 Cash flows from/(used in) investing activities 79.2 (1,077.4) Consolidated cash flow statement Kennedy Wilson Europe Real Estate Plc Annual Report and Accounts 2016 90
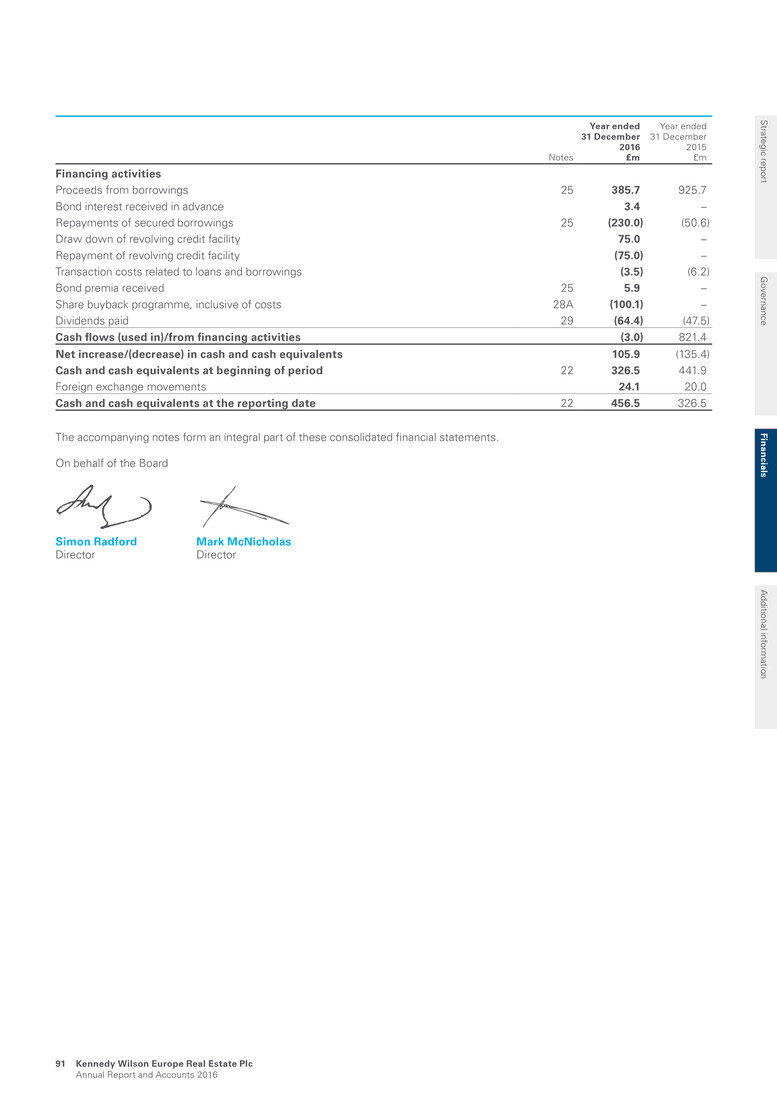
Notes Year ended 31 December 2016 £m Year ended 31 December 2015 £m Financing activities Proceeds from borrowings 25 385.7 925.7 Bond interest received in advance 3.4 – Repayments of secured borrowings 25 (230.0) (50.6) Draw down of revolving credit facility 75.0 – Repayment of revolving credit facility (75.0) – Transaction costs related to loans and borrowings (3.5) (6.2) Bond premia received 25 5.9 – Share buyback programme, inclusive of costs 28A (100.1) – Dividends paid 29 (64.4) (47.5) Cash flows (used in)/from financing activities (3.0) 821.4 Net increase/(decrease) in cash and cash equivalents 105.9 (135.4) Cash and cash equivalents at beginning of period 22 326.5 441.9 Foreign exchange movements 24.1 20.0 Cash and cash equivalents at the reporting date 22 456.5 326.5 The accompanying notes form an integral part of these consolidated financial statements. On behalf of the Board Simon Radford Mark McNicholas Director Director Strategic report G overnance Fin an cials A dditional inform ation Kennedy Wilson Europe Real Estate Plc Annual Report and Accounts 2016 91

1. General information The Company is a limited liability, closed-ended investment company incorporated and domiciled in Jersey on 23 December 2013. The Group comprises the Company and its subsidiaries (collectively the ‘Group’ and individually ‘Group companies’). The Company’s ordinary shares are listed on the main market for listed securities of the London Stock Exchange. The registered office of the Company is 47 Esplanade, St Helier, Jersey, JE1 0BD, Channel Islands. The Company invests in investment and development property, hotel businesses and loans secured by real estate in Europe with the objective of generating and growing long-term cash flows to pay dividends and to enhance capital values through focused asset management and strategic acquisitions. The consolidated financial statements were approved and authorised for issue on 23 February 2017 and signed by Simon Radford and Mark McNicholas on behalf of the Board. 2. Basis of preparation A. Statement of compliance The consolidated financial statements included in this report have been prepared in accordance with International Financial Reporting Standards as adopted by the European Union (‘IFRS’). The Company has not early adopted any forthcoming IASB standards. Note 4 sets out the details of such upcoming standards. The consolidated financial statements have been prepared on a basis consistent with the prior year, save for the re-presentation of the certain segment note disclosures set out in Note 6B(IV) and Note 6C(IV). B. Basis of measurement The consolidated financial statements are for the year ended 31 December 2016 and have been prepared on the going concern basis, applying the historical cost convention except for investment and development property, loans secured by real estate, property, plant and equipment and derivative financial instruments which are stated at their fair value using the accounting policies as set out in Note 3. C. Functional and presentational currency The consolidated financial statements are presented in Pound Sterling as this is the Company’s functional currency. All financial information presented in Pound Sterling has been rounded to the nearest million, and presented to one decimal place, except where otherwise stated. D. Use of estimates and judgements The preparation of the consolidated financial statements in conformity with IFRS requires management to make judgements, estimates and assumptions that affect the application of the Group’s accounting policies and the reported amounts of assets, liabilities, income and expenses. Actual results may differ from these estimates. Estimates and underlying assumptions are reviewed on an ongoing basis. Revisions to accounting estimates are recognised in the period in which the estimates are revised if the revision affects only that period or in the period of revision and future periods if the revision affects both current and future periods. Critical judgements in applying accounting policies that have the most significant effect on amounts recognised in the financial statements in the year ending 31 December 2016 include management’s estimates of the fair value of investment and development property (Note 17), loans secured by real estate (Note 18) and land and buildings within property, plant and equipment (Note 19). 3. Significant accounting policies The following new and amended standards and interpretations are effective for the Group for the first time for the financial year beginning 1 January 2016. None of these had a material impact on the Group: • Amendments to IAS 1 Disclosure initiative • Amendments to IAS 16 and IAS 38 Clarification of acceptable methods of depreciation and amortisation • Amendments to IAS 27 Equity method in Separate Financial Statements • Amendments to IAS 16 Property, Plant and Equipment and IAS 41 Bearer Plants • Amendments to IFRS 11 Accounting for Acquisitions of Interests in Joint Operations • Annual improvements to IFRSs 2012 – 2014 Cycle, and • Amendments to IFRS 10, IFRS 12 and IAS 28: Investment entities – exception to consolidation A. Basis of consolidation (i). Subsidiaries Subsidiaries are those entities controlled by the Group. The Group controls an entity when it is exposed to, or has rights to, variable returns from its involvement with the entity and has the ability to affect those returns through its power over the entity. The financial statements of subsidiaries are included in the consolidated financial statements from the date on which control commences until the date on which control ceases. Notes to the consolidated financial statements For the year ended 31 December 2016 Kennedy Wilson Europe Real Estate Plc Annual Report and Accounts 2016 92

(ii). Business combinations The Group acquires subsidiaries that may own investment and development property or carry on businesses, including the ownership of hotels or other forms of own-use assets. At the time of acquisition, the Group considers whether each acquisition represents the acquisition of a business or the acquisition of an asset. The Group accounts for an acquisition as a business combination where an integrated set of activities is acquired in addition to the property. More specifically, consideration is given as to the extent to which significant processes are acquired and, in particular, the extent of services provided by the subsidiary. When the acquisition of subsidiaries does not represent a business, it is accounted for as an acquisition of a group of assets and liabilities. The cost of the acquisition is allocated to the assets and liabilities acquired based upon their relative fair values, and no goodwill or related deferred tax is recognised. Any contingent consideration is measured at fair value at the date of acquisition. If an obligation to pay contingent consideration that meets the definition of a financial instrument is classified as equity, then it is not remeasured and settlement is accounted for within equity. Otherwise, other contingent consideration is remeasured at fair value at each reporting date and subsequent changes in the fair value of the contingent consideration are recognised in profit or loss. (iii). Non-controlling interests Non-controlling interests (‘NCI’) are measured at their proportionate share of the acquiree’s identifiable net assets at the date of acquisition. Changes in the Group’s interest in a subsidiary that do not result in a loss of control are accounted for as equity transactions. (iv). Transactions eliminated on consolidation Intra-group balances and transactions, and any unrealised income and expenses arising from intra-group transactions, are eliminated. B. Property acquisitions and business combinations Where property is acquired, via corporate acquisitions or otherwise, management considers the substance of the assets and activities of the acquired entity in determining whether the acquisition represents the acquisition of a business. The consideration transferred does not include amounts related to the settlement of pre-existing relationships. Such amounts are generally recognised in profit or loss. Any excess of the purchase price of business combinations over the fair value of the assets, liabilities and contingent liabilities and resulting deferred taxes thereon is recognised as goodwill. Where the Group judges that an acquisition is a business combination it uses the acquisition method of accounting in accordance with IFRS 3 Business Combinations at the date that control is transferred to the Group (see policy A(ii)). The consideration transferred in the acquisition is generally measured at fair value, as are the identifiable net assets acquired. Any excess of the purchase price of business combinations over the fair value of the assets and liabilities is recognised as goodwill. Any gain arising on a bargain purchase is recognised in profit or loss immediately. Transaction costs are expensed as incurred, except if related to the issue of debt or equity securities. Any goodwill that arises is tested annually for impairment. Where such acquisitions are not judged to be an acquisition of a business, they are not accounted for as business combinations. Instead, the cost of acquisition is allocated between the identifiable assets and liabilities of the entity based on the relative fair values at the acquisition date. Accordingly, no goodwill or additional deferred taxation arises. C. Foreign currency translation Items included within the financial statements of each of the Group’s entities are measured using the currency of the primary economic environment in which the entity operates (its ‘functional currency’). (i). Transactions and balances Transactions in currencies other than an entity’s functional currency are recorded at the exchange rate prevailing at the date of the transaction. Foreign exchange gains and losses resulting from the settlement of such transactions and from the translation at year-end exchange rates of monetary assets and liabilities denominated in foreign currencies are recognised in profit or loss for the financial period (see policy C(ii)). (ii). Foreign operations The assets and liabilities of foreign operations are translated to Pound Sterling at the exchange rate prevailing at the reporting date. The revenues and expenses of foreign operations are translated to Pound Sterling at rates approximating to the foreign exchange rates ruling at the dates of the transactions. Foreign exchange differences arising on re-translation are taken to other comprehensive income (‘OCI’) and then accumulated in a separate foreign currency translation reserve. Strategic report G overnance Fin an cials A dditional inform ation Kennedy Wilson Europe Real Estate Plc Annual Report and Accounts 2016 93

Notes to the consolidated financial statements For the year ended 31 December 2016 continued When a foreign operation is disposed of in its entirety or partially such that control, significant influence or joint control is lost, the cumulative amount in the translation reserve related to that foreign operation is reclassified to profit or loss as part of the gain or loss on disposal. If the Group disposes of part of its interest in a subsidiary but retains control, then the relevant proportion of the cumulative amount is reattributed to NCIs. When the Group disposes of any part of an associate or joint venture while retaining significant influence or joint control, the relevant proportion of the cumulative amount is reclassified to profit or loss. D. Revenue recognition Revenue includes rental income and other property related revenue, service charges and management charges from properties, hotel revenue and interest income from loans secured by real estate. (i). Rental income Rental income from operating leases on investment property is recognised on a straight-line basis over the lease term. When the Group provides incentives to its tenants, the cost of incentives is recognised over the lease term, on a straight-line basis, as a reduction of rental income. The lease term is the non-cancellable period of the lease together with any further term for which the tenant has the option to continue the lease, where, at the inception of the lease, the Directors are reasonably certain that the tenant will exercise the option. Contingent rents, which are dependent on the turnover levels of lessees are recognised as income in the periods in which they are earned. Any financial statement impact of rent reviews are recognised when such rent reviews have been agreed with the tenants. Surrender premia received are considered a component of rental income. Lease incentives are recognised as an integral part of the net consideration for use of the property and are amortised on a straight line basis over the term of the lease, or the period to the first tenant break, if shorter, unless there is reasonable certainty that the break will not be exercised. Income arising from expenses recharged to tenants is recognised in the period in which the compensation becomes receivable. Service and management charges and other such receipts are included in rental income gross of the related costs, as the Directors consider the Group acts as principal in this respect. (ii). Interest income on loans secured by real estate Interest income on loans secured by real estate is recognised in profit or loss on an effective interest rate basis over the period to expected maturity. (iii). Hotel revenue Hotel revenue represents sales (excluding VAT and similar taxes) of goods and services, net of discounts, provided in the normal course of business and recognised when services have been rendered. Such revenues typically include rental of rooms, food and beverage sales and other ancillary revenues from hotels owned by the Group. Revenue is recognised when rooms are occupied and food and beverages are sold. E. Employee benefits (i). Short-term employee benefits Short-term employee benefits are expensed as the related service is provided. A liability is recognised for the amount expected to be paid if the Group has a present legal or constructive obligation to pay this amount as a result of past service provided by the employee and the obligation can be estimated reliably. (ii). Defined contribution plans Obligations for contributions to defined contribution plans are expensed as the related service is provided. Prepaid contributions are recognised as an asset to the extent that a cash refund or reduction in future payments is available. F. Interest income from cash and cash equivalents Interest income from cash and cash equivalents is recognised as it accrues in profit or loss, using the effective interest rate method. G. Finance costs Finance costs comprise interest expense on borrowings (including amortisation of deferred debt issue costs, and amortisation of discounts and premia on corporate bonds) and are recognised in profit or loss using the effective interest method. All interest expense on borrowings is recognised in profit or loss in the period in which it is incurred, unless it is directly related to investment property under development in which case it is capitalised. H. Taxation Income tax expense comprises current and deferred tax. It is recognised in profit or loss except to the extent that it relates to the recording of a business combination or items recognised directly in equity or in OCI. (i). Current tax Current tax is calculated as the expected tax payable or receivable on the taxable income or loss for the financial period, using tax rates enacted or substantively enacted at the reporting date, with any adjustments to tax payable in respect of previous years. Kennedy Wilson Europe Real Estate Plc Annual Report and Accounts 2016 94
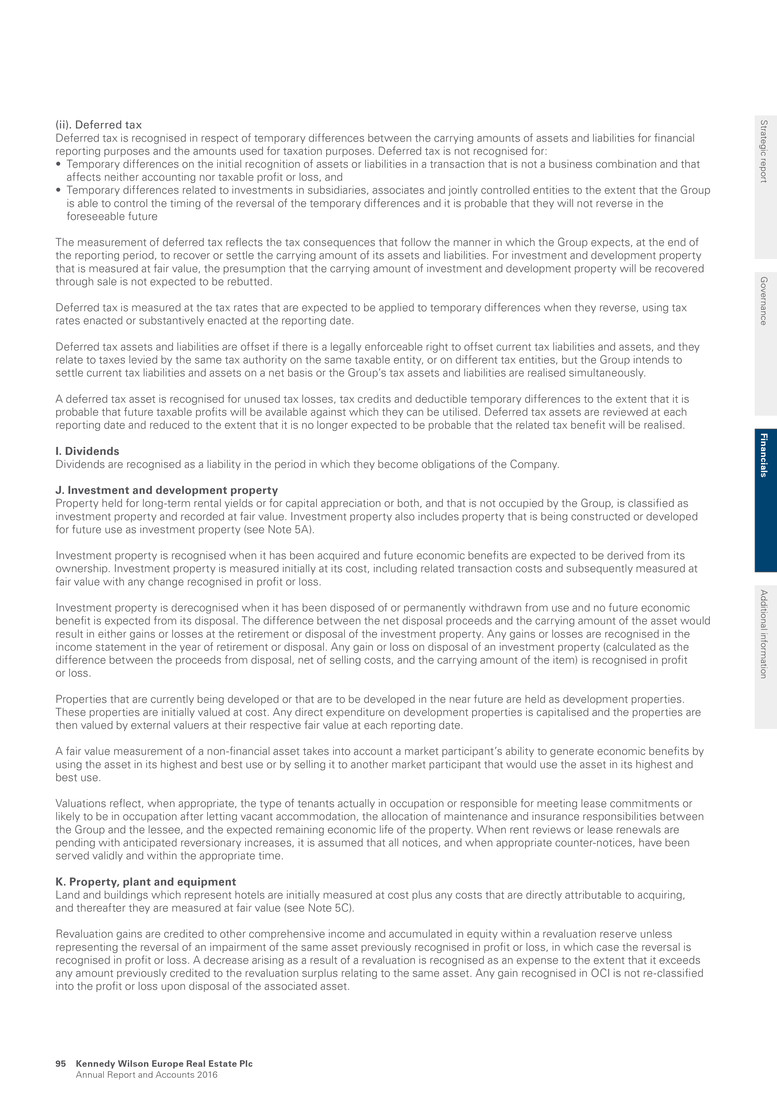
(ii). Deferred tax Deferred tax is recognised in respect of temporary differences between the carrying amounts of assets and liabilities for financial reporting purposes and the amounts used for taxation purposes. Deferred tax is not recognised for: • Temporary differences on the initial recognition of assets or liabilities in a transaction that is not a business combination and that affects neither accounting nor taxable profit or loss, and • Temporary differences related to investments in subsidiaries, associates and jointly controlled entities to the extent that the Group is able to control the timing of the reversal of the temporary differences and it is probable that they will not reverse in the foreseeable future The measurement of deferred tax reflects the tax consequences that follow the manner in which the Group expects, at the end of the reporting period, to recover or settle the carrying amount of its assets and liabilities. For investment and development property that is measured at fair value, the presumption that the carrying amount of investment and development property will be recovered through sale is not expected to be rebutted. Deferred tax is measured at the tax rates that are expected to be applied to temporary differences when they reverse, using tax rates enacted or substantively enacted at the reporting date. Deferred tax assets and liabilities are offset if there is a legally enforceable right to offset current tax liabilities and assets, and they relate to taxes levied by the same tax authority on the same taxable entity, or on different tax entities, but the Group intends to settle current tax liabilities and assets on a net basis or the Group’s tax assets and liabilities are realised simultaneously. A deferred tax asset is recognised for unused tax losses, tax credits and deductible temporary differences to the extent that it is probable that future taxable profits will be available against which they can be utilised. Deferred tax assets are reviewed at each reporting date and reduced to the extent that it is no longer expected to be probable that the related tax benefit will be realised. I. Dividends Dividends are recognised as a liability in the period in which they become obligations of the Company. J. Investment and development property Property held for long-term rental yields or for capital appreciation or both, and that is not occupied by the Group, is classified as investment property and recorded at fair value. Investment property also includes property that is being constructed or developed for future use as investment property (see Note 5A). Investment property is recognised when it has been acquired and future economic benefits are expected to be derived from its ownership. Investment property is measured initially at its cost, including related transaction costs and subsequently measured at fair value with any change recognised in profit or loss. Investment property is derecognised when it has been disposed of or permanently withdrawn from use and no future economic benefit is expected from its disposal. The difference between the net disposal proceeds and the carrying amount of the asset would result in either gains or losses at the retirement or disposal of the investment property. Any gains or losses are recognised in the income statement in the year of retirement or disposal. Any gain or loss on disposal of an investment property (calculated as the difference between the proceeds from disposal, net of selling costs, and the carrying amount of the item) is recognised in profit or loss. Properties that are currently being developed or that are to be developed in the near future are held as development properties. These properties are initially valued at cost. Any direct expenditure on development properties is capitalised and the properties are then valued by external valuers at their respective fair value at each reporting date. A fair value measurement of a non-financial asset takes into account a market participant’s ability to generate economic benefits by using the asset in its highest and best use or by selling it to another market participant that would use the asset in its highest and best use. Valuations reflect, when appropriate, the type of tenants actually in occupation or responsible for meeting lease commitments or likely to be in occupation after letting vacant accommodation, the allocation of maintenance and insurance responsibilities between the Group and the lessee, and the expected remaining economic life of the property. When rent reviews or lease renewals are pending with anticipated reversionary increases, it is assumed that all notices, and when appropriate counter-notices, have been served validly and within the appropriate time. K. Property, plant and equipment Land and buildings which represent hotels are initially measured at cost plus any costs that are directly attributable to acquiring, and thereafter they are measured at fair value (see Note 5C). Revaluation gains are credited to other comprehensive income and accumulated in equity within a revaluation reserve unless representing the reversal of an impairment of the same asset previously recognised in profit or loss, in which case the reversal is recognised in profit or loss. A decrease arising as a result of a revaluation is recognised as an expense to the extent that it exceeds any amount previously credited to the revaluation surplus relating to the same asset. Any gain recognised in OCI is not re-classified into the profit or loss upon disposal of the associated asset. Strategic report G overnance Fin an cials A dditional inform ation Kennedy Wilson Europe Real Estate Plc Annual Report and Accounts 2016 95
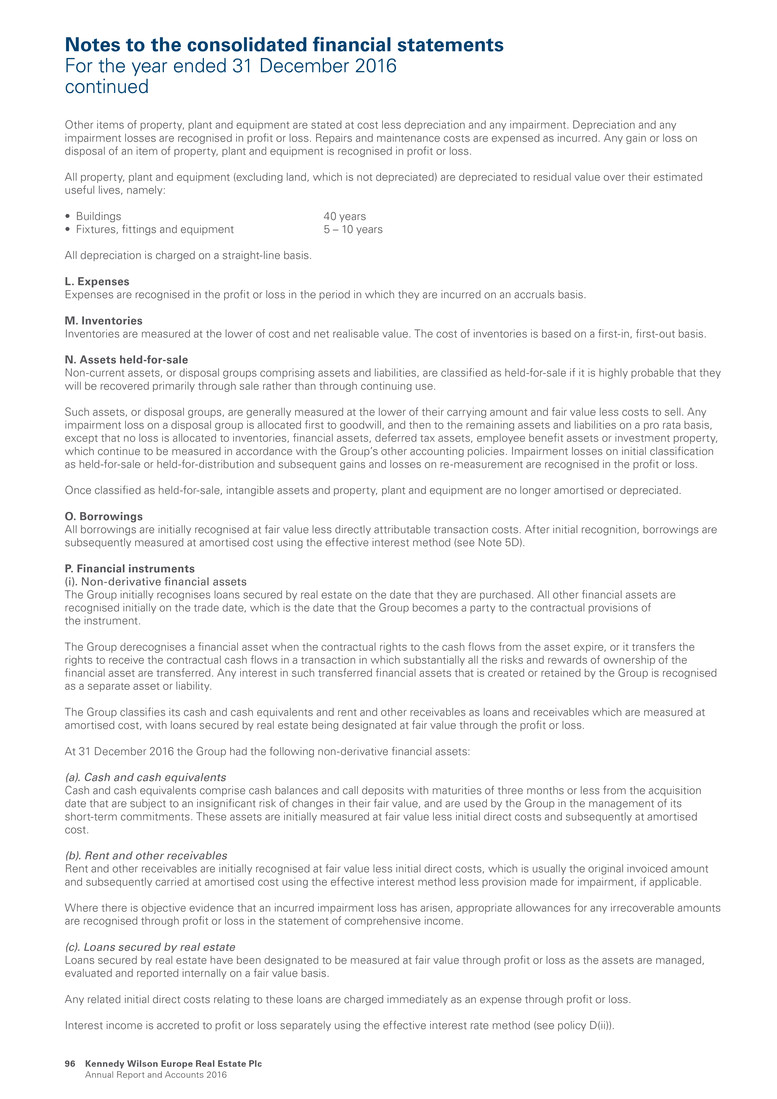
Other items of property, plant and equipment are stated at cost less depreciation and any impairment. Depreciation and any impairment losses are recognised in profit or loss. Repairs and maintenance costs are expensed as incurred. Any gain or loss on disposal of an item of property, plant and equipment is recognised in profit or loss. All property, plant and equipment (excluding land, which is not depreciated) are depreciated to residual value over their estimated useful lives, namely: • Buildings 40 years • Fixtures, fittings and equipment 5 – 10 years All depreciation is charged on a straight-line basis. L. Expenses Expenses are recognised in the profit or loss in the period in which they are incurred on an accruals basis. M. Inventories Inventories are measured at the lower of cost and net realisable value. The cost of inventories is based on a first-in, first-out basis. N. Assets held-for-sale Non-current assets, or disposal groups comprising assets and liabilities, are classified as held-for-sale if it is highly probable that they will be recovered primarily through sale rather than through continuing use. Such assets, or disposal groups, are generally measured at the lower of their carrying amount and fair value less costs to sell. Any impairment loss on a disposal group is allocated first to goodwill, and then to the remaining assets and liabilities on a pro rata basis, except that no loss is allocated to inventories, financial assets, deferred tax assets, employee benefit assets or investment property, which continue to be measured in accordance with the Group’s other accounting policies. Impairment losses on initial classification as held-for-sale or held-for-distribution and subsequent gains and losses on re-measurement are recognised in the profit or loss. Once classified as held-for-sale, intangible assets and property, plant and equipment are no longer amortised or depreciated. O. Borrowings All borrowings are initially recognised at fair value less directly attributable transaction costs. After initial recognition, borrowings are subsequently measured at amortised cost using the effective interest method (see Note 5D). P. Financial instruments (i). Non-derivative financial assets The Group initially recognises loans secured by real estate on the date that they are purchased. All other financial assets are recognised initially on the trade date, which is the date that the Group becomes a party to the contractual provisions of the instrument. The Group derecognises a financial asset when the contractual rights to the cash flows from the asset expire, or it transfers the rights to receive the contractual cash flows in a transaction in which substantially all the risks and rewards of ownership of the financial asset are transferred. Any interest in such transferred financial assets that is created or retained by the Group is recognised as a separate asset or liability. The Group classifies its cash and cash equivalents and rent and other receivables as loans and receivables which are measured at amortised cost, with loans secured by real estate being designated at fair value through the profit or loss. At 31 December 2016 the Group had the following non-derivative financial assets: (a). Cash and cash equivalents Cash and cash equivalents comprise cash balances and call deposits with maturities of three months or less from the acquisition date that are subject to an insignificant risk of changes in their fair value, and are used by the Group in the management of its short-term commitments. These assets are initially measured at fair value less initial direct costs and subsequently at amortised cost. (b). Rent and other receivables Rent and other receivables are initially recognised at fair value less initial direct costs, which is usually the original invoiced amount and subsequently carried at amortised cost using the effective interest method less provision made for impairment, if applicable. Where there is objective evidence that an incurred impairment loss has arisen, appropriate allowances for any irrecoverable amounts are recognised through profit or loss in the statement of comprehensive income. (c). Loans secured by real estate Loans secured by real estate have been designated to be measured at fair value through profit or loss as the assets are managed, evaluated and reported internally on a fair value basis. Any related initial direct costs relating to these loans are charged immediately as an expense through profit or loss. Interest income is accreted to profit or loss separately using the effective interest rate method (see policy D(ii)). Notes to the consolidated financial statements For the year ended 31 December 2016 continued Kennedy Wilson Europe Real Estate Plc Annual Report and Accounts 2016 96

(ii). Non-derivative financial liabilities All non-derivative financial liabilities are recognised initially at the date that the Group becomes a party to the contractual provisions of the instrument and are measured initially at fair value less initial direct costs and subsequently measured at amortised cost. The Group derecognises a financial liability when its contractual obligations are discharged, cancelled or expire. (iii). Derivative financial instruments and net investment hedge accounting The Group uses a variety of derivative instruments to mitigate certain interest rate and foreign currency financial risks including interest rate caps, cross-currency swaps, foreign currency forward contracts and foreign currency zero premium options. The Group does not enter into derivative contracts for speculative purposes. Derivative instruments are used for hedging purposes to alter the risk profile of an existing underlying exposure of the Group in line with its risk management policies. All derivatives are recognised at fair value. The treatment of the change in fair value depends on whether the derivative is designated as a hedging instrument, the nature of the item being hedged and the effectiveness of the hedge (see Note 5E). Derivative financial instruments are initially recognised at fair value on the date on which a derivative contract is entered into and are subsequently re-measured at fair value. Derivatives are carried as assets when the fair value is positive and as liabilities when the fair value is negative. (a). Net investment hedges The Group designates foreign currency forward contracts, zero-cost foreign currency options, interest rate cross-currency swaps and certain foreign currency denominated corporate debt as hedges of its net investment in foreign operations. At inception, the Group documents the relationship between the hedging instrument and the hedged items, its risk management objectives and the strategy for undertaking the transaction. The Group also documents its assessment of whether the hedging instrument is highly effective in offsetting changes in fair value or cash flows of hedged items, both at inception and future periods. Any gain or loss on the hedging instrument relating to the effective portion of the hedge is recognised in OCI. The gain or loss relating to the ineffective portion is recognised immediately in profit or loss within finance income or costs as appropriate. If the hedging instrument no longer meets the criteria for hedge accounting, expires or is sold, terminated or exercised, or if the foreign operation is sold then hedge accounting is discontinued prospectively and gains or losses accumulated in OCI are reclassified to profit or loss. (b). Derivatives not designated as hedges Interest rate caps are used to economically hedge the Group’s exposure to certain borrowing related interest rate risks and are not formally designated as hedges for hedge accounting purposes. Changes in the fair value of these derivatives are recognised in profit or loss within finance income or finance cost as appropriate. The fair values of derivative instruments used for hedging purposes are disclosed in Note 26. The full fair value of a derivative is classified as a non-current asset or liability when its remaining maturity is more than one year; it is classified as a current asset or liability when its remaining maturity is less than one year. (c). Master netting or similar agreements The derivatives do not meet the criteria for offsetting in the balance sheet. This is because the Group does not have any currently legally enforceable right to offset recognised amounts, because the right to offset is enforceable only on the occurrence of future events such as credit events. Q. Share-based payments The Group enters into equity-settled share-based payment arrangements in respect of services provided to it by KW Investment Management Ltd (the ‘Investment Manager’). The Company recognised an obligation where the method of settlement of the award is dependent on the achievement of a market-based performance condition which is outside of the control of the Company, and the award may be settled either through market purchase of shares or the issue of shares. (i). Investment management fee In relation to the Investment Manager’s management fee at grant date, the monetary value of the award it will receive is dependent on a non-market performance condition, being the EPRA NAV at each quarter end. The award is accounted for as an equity settled share based payment arrangement. The cost of the services received in respect of the shares is recognised in the profit or loss over the vesting period, with a corresponding credit to equity. (ii). Performance fee The performance fee arrangement is accounted for as an equity settled share based payment arrangement. The grant date is 1 January and on that date, the Company estimates the grant date fair value of each equity instrument and the number of equity instruments for which the service and non-market performance conditions are expected to be satisfied, resulting in the initial estimate of the total share based payment cost which is expensed over the vesting period. Subsequent to the initial recognition and measurement, the estimate of the number of equity instruments for which the service and non-market performance conditions are expected to be satisfied is revised during the vesting period, that is, the period from 1 January to 31 December. The share based payment cost is based on the fair value of the number of equity instruments issued upon satisfaction of these conditions. R. Stated capital (i). Ordinary shares Ordinary shares are classified as equity. Incremental costs directly attributable to the issue of ordinary shares are recognised as a deduction from the stated capital account included in equity. Strategic report G overnance Fin an cials A dditional inform ation Kennedy Wilson Europe Real Estate Plc Annual Report and Accounts 2016 97
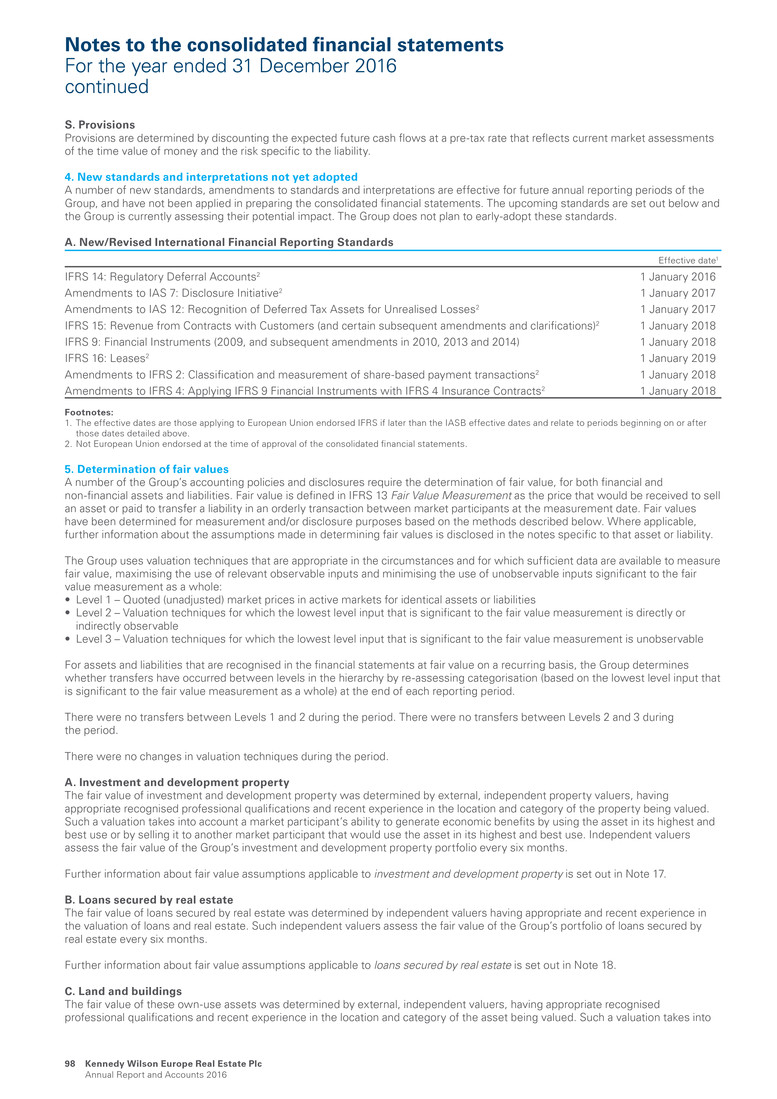
S. Provisions Provisions are determined by discounting the expected future cash flows at a pre-tax rate that reflects current market assessments of the time value of money and the risk specific to the liability. 4. New standards and interpretations not yet adopted A number of new standards, amendments to standards and interpretations are effective for future annual reporting periods of the Group, and have not been applied in preparing the consolidated financial statements. The upcoming standards are set out below and the Group is currently assessing their potential impact. The Group does not plan to early-adopt these standards. A. New/Revised International Financial Reporting Standards Effective date1 IFRS 14: Regulatory Deferral Accounts2 1 January 2016 Amendments to IAS 7: Disclosure Initiative2 1 January 2017 Amendments to IAS 12: Recognition of Deferred Tax Assets for Unrealised Losses2 1 January 2017 IFRS 15: Revenue from Contracts with Customers (and certain subsequent amendments and clarifications)2 1 January 2018 IFRS 9: Financial Instruments (2009, and subsequent amendments in 2010, 2013 and 2014) 1 January 2018 IFRS 16: Leases2 1 January 2019 Amendments to IFRS 2: Classification and measurement of share-based payment transactions2 1 January 2018 Amendments to IFRS 4: Applying IFRS 9 Financial Instruments with IFRS 4 Insurance Contracts2 1 January 2018 Footnotes: 1. The effective dates are those applying to European Union endorsed IFRS if later than the IASB effective dates and relate to periods beginning on or after those dates detailed above. 2. Not European Union endorsed at the time of approval of the consolidated financial statements. 5. Determination of fair values A number of the Group’s accounting policies and disclosures require the determination of fair value, for both financial and non-financial assets and liabilities. Fair value is defined in IFRS 13 Fair Value Measurement as the price that would be received to sell an asset or paid to transfer a liability in an orderly transaction between market participants at the measurement date. Fair values have been determined for measurement and/or disclosure purposes based on the methods described below. Where applicable, further information about the assumptions made in determining fair values is disclosed in the notes specific to that asset or liability. The Group uses valuation techniques that are appropriate in the circumstances and for which sufficient data are available to measure fair value, maximising the use of relevant observable inputs and minimising the use of unobservable inputs significant to the fair value measurement as a whole: • Level 1 – Quoted (unadjusted) market prices in active markets for identical assets or liabilities • Level 2 – Valuation techniques for which the lowest level input that is significant to the fair value measurement is directly or indirectly observable • Level 3 – Valuation techniques for which the lowest level input that is significant to the fair value measurement is unobservable For assets and liabilities that are recognised in the financial statements at fair value on a recurring basis, the Group determines whether transfers have occurred between levels in the hierarchy by re-assessing categorisation (based on the lowest level input that is significant to the fair value measurement as a whole) at the end of each reporting period. There were no transfers between Levels 1 and 2 during the period. There were no transfers between Levels 2 and 3 during the period. There were no changes in valuation techniques during the period. A. Investment and development property The fair value of investment and development property was determined by external, independent property valuers, having appropriate recognised professional qualifications and recent experience in the location and category of the property being valued. Such a valuation takes into account a market participant’s ability to generate economic benefits by using the asset in its highest and best use or by selling it to another market participant that would use the asset in its highest and best use. Independent valuers assess the fair value of the Group’s investment and development property portfolio every six months. Further information about fair value assumptions applicable to investment and development property is set out in Note 17. B. Loans secured by real estate The fair value of loans secured by real estate was determined by independent valuers having appropriate and recent experience in the valuation of loans and real estate. Such independent valuers assess the fair value of the Group’s portfolio of loans secured by real estate every six months. Further information about fair value assumptions applicable to loans secured by real estate is set out in Note 18. C. Land and buildings The fair value of these own-use assets was determined by external, independent valuers, having appropriate recognised professional qualifications and recent experience in the location and category of the asset being valued. Such a valuation takes into Notes to the consolidated financial statements For the year ended 31 December 2016 continued Kennedy Wilson Europe Real Estate Plc Annual Report and Accounts 2016 98
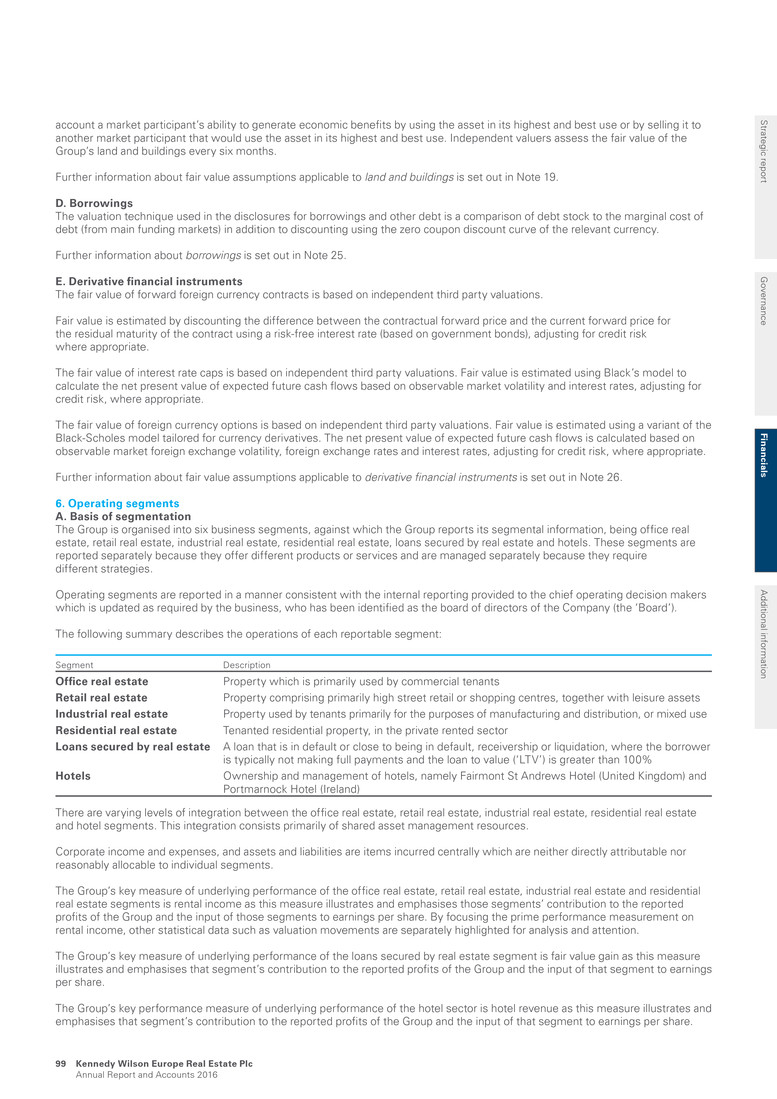
account a market participant’s ability to generate economic benefits by using the asset in its highest and best use or by selling it to another market participant that would use the asset in its highest and best use. Independent valuers assess the fair value of the Group’s land and buildings every six months. Further information about fair value assumptions applicable to land and buildings is set out in Note 19. D. Borrowings The valuation technique used in the disclosures for borrowings and other debt is a comparison of debt stock to the marginal cost of debt (from main funding markets) in addition to discounting using the zero coupon discount curve of the relevant currency. Further information about borrowings is set out in Note 25. E. Derivative financial instruments The fair value of forward foreign currency contracts is based on independent third party valuations. Fair value is estimated by discounting the difference between the contractual forward price and the current forward price for the residual maturity of the contract using a risk-free interest rate (based on government bonds), adjusting for credit risk where appropriate. The fair value of interest rate caps is based on independent third party valuations. Fair value is estimated using Black’s model to calculate the net present value of expected future cash flows based on observable market volatility and interest rates, adjusting for credit risk, where appropriate. The fair value of foreign currency options is based on independent third party valuations. Fair value is estimated using a variant of the Black-Scholes model tailored for currency derivatives. The net present value of expected future cash flows is calculated based on observable market foreign exchange volatility, foreign exchange rates and interest rates, adjusting for credit risk, where appropriate. Further information about fair value assumptions applicable to derivative financial instruments is set out in Note 26. 6. Operating segments A. Basis of segmentation The Group is organised into six business segments, against which the Group reports its segmental information, being office real estate, retail real estate, industrial real estate, residential real estate, loans secured by real estate and hotels. These segments are reported separately because they offer different products or services and are managed separately because they require different strategies. Operating segments are reported in a manner consistent with the internal reporting provided to the chief operating decision makers which is updated as required by the business, who has been identified as the board of directors of the Company (the ‘Board’). The following summary describes the operations of each reportable segment: Segment Description Office real estate Property which is primarily used by commercial tenants Retail real estate Property comprising primarily high street retail or shopping centres, together with leisure assets Industrial real estate Property used by tenants primarily for the purposes of manufacturing and distribution, or mixed use Residential real estate Tenanted residential property, in the private rented sector Loans secured by real estate A loan that is in default or close to being in default, receivership or liquidation, where the borrower is typically not making full payments and the loan to value (‘LTV’) is greater than 100% Hotels Ownership and management of hotels, namely Fairmont St Andrews Hotel (United Kingdom) and Portmarnock Hotel (Ireland) There are varying levels of integration between the office real estate, retail real estate, industrial real estate, residential real estate and hotel segments. This integration consists primarily of shared asset management resources. Corporate income and expenses, and assets and liabilities are items incurred centrally which are neither directly attributable nor reasonably allocable to individual segments. The Group’s key measure of underlying performance of the office real estate, retail real estate, industrial real estate and residential real estate segments is rental income as this measure illustrates and emphasises those segments’ contribution to the reported profits of the Group and the input of those segments to earnings per share. By focusing the prime performance measurement on rental income, other statistical data such as valuation movements are separately highlighted for analysis and attention. The Group’s key measure of underlying performance of the loans secured by real estate segment is fair value gain as this measure illustrates and emphasises that segment’s contribution to the reported profits of the Group and the input of that segment to earnings per share. The Group’s key performance measure of underlying performance of the hotel sector is hotel revenue as this measure illustrates and emphasises that segment’s contribution to the reported profits of the Group and the input of that segment to earnings per share. Strategic report G overnance Fin an cials A dditional inform ation Kennedy Wilson Europe Real Estate Plc Annual Report and Accounts 2016 99

Information related to each reportable segment is set out below. Segment profit/(loss) before tax is used to measure performance because management believes that this information is the most relevant in evaluating the results of the respective segments relative to other entities that operate in similar sectors. B. Information about reportable segments I. Profit before tax for the year ended 31 December 2016 Office real estate1 £m Retail real estate1 £m Industrial real estate1 £m Residential real estate1 £m Loans secured by real estate £m Hotels £m Segment total £m Corporate £m Total £m Revenue Rental income 103.6 64.9 13.9 9.1 – – 191.5 – 191.5 Hotel revenue – – – – – 19.4 19.4 – 19.4 Interest income from loans secured by real estate – – – – 6.3 – 6.3 – 6.3 103.6 64.9 13.9 9.1 6.3 19.4 217.2 – 217.2 Property related expenses (18.9) (11.5) (1.0) (4.1) (0.3) – (35.8) – (35.8) Hotel cost of sales – – – – – (16.3) (16.3) – (16.3) Administrative costs – – – – – (4.8) (4.8) – (4.8) Net operating income 84.7 53.4 12.9 5.0 6.0 (1.7) 160.3 – 160.3 Net change in the fair value of investment and development property (29.6) 7.4 (5.0) 16.4 – – (10.8) – (10.8) Net change in the fair value of loans secured by real estate – – – – 0.3 – 0.3 – 0.3 Gain/(loss) on sale and other gains 1.8 6.6 (0.3) – 0.4 – 8.5 – 8.5 56.9 67.4 7.6 21.4 6.7 (1.7) 158.3 – 158.3 Overhead costs Administrative expenses (2.5) (1.4) (0.3) (0.6) (0.3) – (5.1) (6.5) (11.6) Investment management fee – – – – – – – (16.3) (16.3) (2.5) (1.4) (0.3) (0.6) (0.3) – (5.1) (22.8) (27.9) Results from operating activities before financing income and costs 54.4 66.0 7.3 20.8 6.4 (1.7) 153.2 (22.8) 130.4 Interest income from cash and cash equivalents – – – – – – – 0.6 0.6 Finance costs (9.7) (11.8) (2.7) (1.8) – – (26.0) (31.7) (57.7) (9.7) (11.8) (2.7) (1.8) – – (26.0) (31.1) (57.1) Segment profit/(loss) before tax 44.7 54.2 4.6 19.0 6.4 (1.7) 127.2 (53.9) 73.3 Footnote: 1. Investment property under development, as identified in Note 17A(ii) is allocated into a segment based on the current expected future use. Notes to the consolidated financial statements For the year ended 31 December 2016 continued Kennedy Wilson Europe Real Estate Plc Annual Report and Accounts 2016 100

II. Profit before tax for the year ended 31 December 2015 Office real estate1 £m Retail real estate1 £m Industrial real estate1 £m Residential real estate1 £m Loans secured by real estate £m Hotels £m Segment total £m Corporate £m Total £m Revenue Rental income 71.8 49.7 12.2 5.1 – – 138.8 – 138.8 Hotel revenue – – – – – 20.0 20.0 – 20.0 Interest income from loans secured by real estate – – – – 13.4 – 13.4 – 13.4 71.8 49.7 12.2 5.1 13.4 20.0 172.2 – 172.2 Property related expenses (15.1) (5.4) (0.5) (1.4) – – (22.4) (0.3) (22.7) Hotel cost of sales – – – – – (14.4) (14.4) – (14.4) Administrative costs – – – – – (5.0) (5.0) – (5.0) Net operating income 56.7 44.3 11.7 3.7 13.4 0.6 130.4 (0.3) 130.1 Net change in the fair value of investment and development property 141.5 36.7 21.3 8.5 – – 208.0 – 208.0 Net change in the fair value of loans secured by real estate – – – – 5.1 – 5.1 – 5.1 Gain on sale and other gains 2.9 6.2 0.5 – 5.0 – 14.6 0.8 15.4 201.1 87.2 33.5 12.2 23.5 0.6 358.1 0.5 358.6 Overhead costs Administrative expenses (1.5) (1.3) (0.1) (0.6) (1.5) – (5.0) (5.9) (10.9) Investment management fee – – – – – – – (15.2) (15.2) Performance fee – – – – – – – (29.7) (29.7) (1.5) (1.3) (0.1) (0.6) (1.5) – (5.0) (50.8) (55.8) Results from operating activities before financing income and costs 199.6 85.9 33.4 11.6 22.0 0.6 353.1 (50.3) 302.8 Interest income from cash and cash equivalents – – – – – – – 0.6 0.6 Finance costs (8.4) (12.0) (3.0) (1.0) – – (24.4) (12.4) (36.8) (8.4) (12.0) (3.0) (1.0) – – (24.4) (11.8) (36.2) Segment profit/(loss) before tax 191.2 73.9 30.4 10.6 22.0 0.6 328.7 (62.1) 266.6 Footnote: 1. Investment property under development, as identified in Note 17A(ii) is allocated into a segment based on the current expected future use Strategic report G overnance Fin an cials A dditional inform ation Kennedy Wilson Europe Real Estate Plc Annual Report and Accounts 2016 101
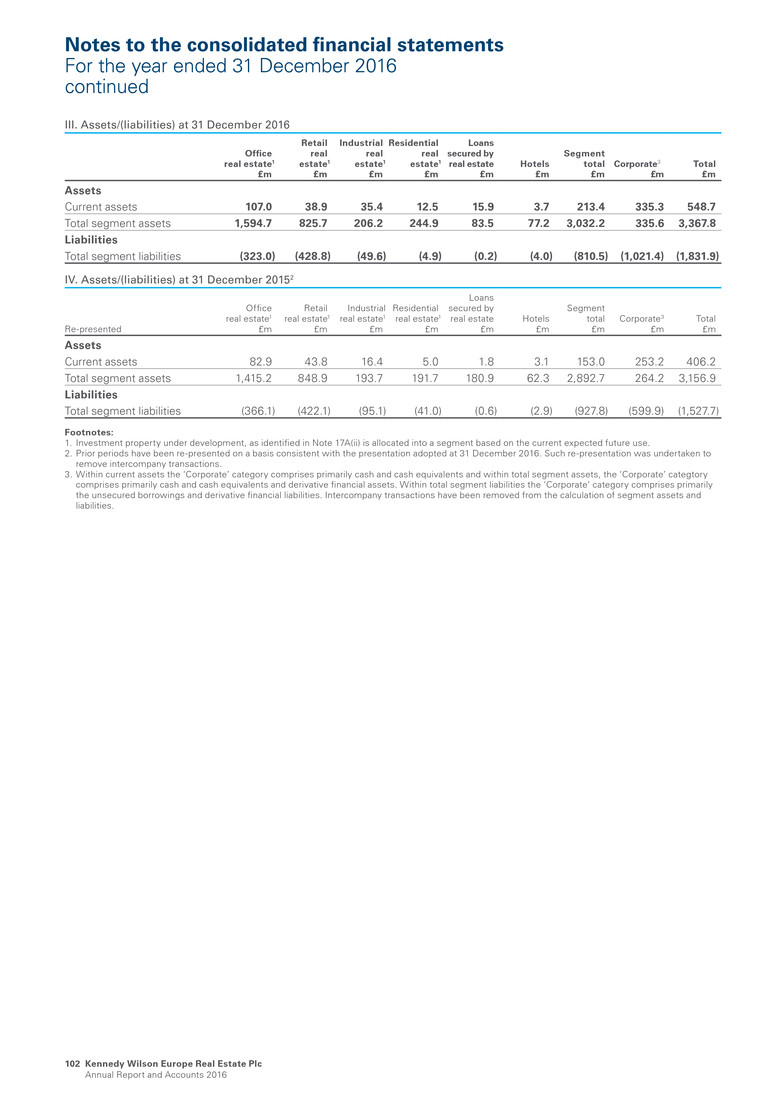
III. Assets/(liabilities) at 31 December 2016 Office real estate1 £m Retail real estate1 £m Industrial real estate1 £m Residential real estate1 £m Loans secured by real estate £m Hotels £m Segment total £m Corporate3 £m Total £m Assets Current assets 107.0 38.9 35.4 12.5 15.9 3.7 213.4 335.3 548.7 Total segment assets 1,594.7 825.7 206.2 244.9 83.5 77.2 3,032.2 335.6 3,367.8 Liabilities Total segment liabilities (323.0) (428.8) (49.6) (4.9) (0.2) (4.0) (810.5) (1,021.4) (1,831.9) IV. Assets/(liabilities) at 31 December 20152 Re-presented Office real estate1 £m Retail real estate1 £m Industrial real estate1 £m Residential real estate1 £m Loans secured by real estate £m Hotels £m Segment total £m Corporate3 £m Total £m Assets Current assets 82.9 43.8 16.4 5.0 1.8 3.1 153.0 253.2 406.2 Total segment assets 1,415.2 848.9 193.7 191.7 180.9 62.3 2,892.7 264.2 3,156.9 Liabilities Total segment liabilities (366.1) (422.1) (95.1) (41.0) (0.6) (2.9) (927.8) (599.9) (1,527.7) Footnotes: 1. Investment property under development, as identified in Note 17A(ii) is allocated into a segment based on the current expected future use. 2. Prior periods have been re-presented on a basis consistent with the presentation adopted at 31 December 2016. Such re-presentation was undertaken to remove intercompany transactions. 3. Within current assets the ‘Corporate’ category comprises primarily cash and cash equivalents and within total segment assets, the ‘Corporate’ categtory comprises primarily cash and cash equivalents and derivative financial assets. Within total segment liabilities the ‘Corporate’ category comprises primarily the unsecured borrowings and derivative financial liabilities. Intercompany transactions have been removed from the calculation of segment assets and liabilities. Notes to the consolidated financial statements For the year ended 31 December 2016 continued Kennedy Wilson Europe Real Estate Plc Annual Report and Accounts 2016 102
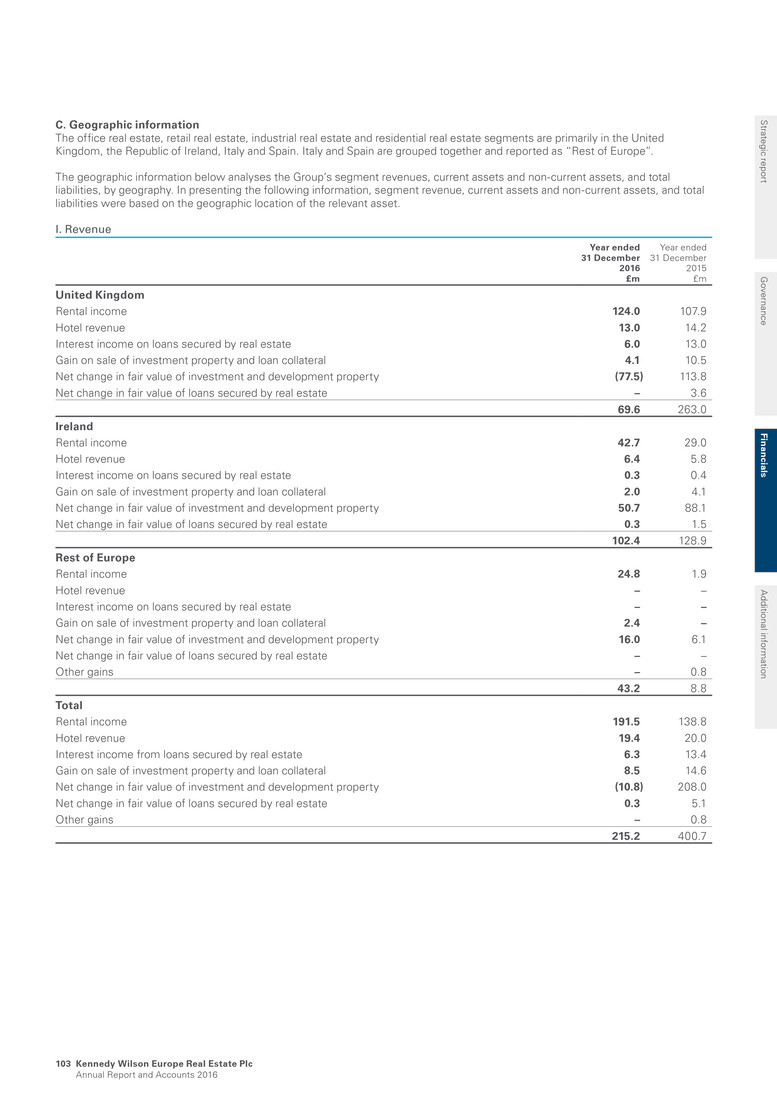
C. Geographic information The office real estate, retail real estate, industrial real estate and residential real estate segments are primarily in the United Kingdom, the Republic of Ireland, Italy and Spain. Italy and Spain are grouped together and reported as “Rest of Europe”. The geographic information below analyses the Group’s segment revenues, current assets and non-current assets, and total liabilities, by geography. In presenting the following information, segment revenue, current assets and non-current assets, and total liabilities were based on the geographic location of the relevant asset. I. Revenue Year ended 31 December 2016 £m Year ended 31 December 2015 £m United Kingdom Rental income 124.0 107.9 Hotel revenue 13.0 14.2 Interest income on loans secured by real estate 6.0 13.0 Gain on sale of investment property and loan collateral 4.1 10.5 Net change in fair value of investment and development property (77.5) 113.8 Net change in fair value of loans secured by real estate – 3.6 69.6 263.0 Ireland Rental income 42.7 29.0 Hotel revenue 6.4 5.8 Interest income on loans secured by real estate 0.3 0.4 Gain on sale of investment property and loan collateral 2.0 4.1 Net change in fair value of investment and development property 50.7 88.1 Net change in fair value of loans secured by real estate 0.3 1.5 102.4 128.9 Rest of Europe Rental income 24.8 1.9 Hotel revenue – – Interest income on loans secured by real estate – – Gain on sale of investment property and loan collateral 2.4 – Net change in fair value of investment and development property 16.0 6.1 Net change in fair value of loans secured by real estate – – Other gains – 0.8 43.2 8.8 Total Rental income 191.5 138.8 Hotel revenue 19.4 20.0 Interest income from loans secured by real estate 6.3 13.4 Gain on sale of investment property and loan collateral 8.5 14.6 Net change in fair value of investment and development property (10.8) 208.0 Net change in fair value of loans secured by real estate 0.3 5.1 Other gains – 0.8 215.2 400.7 Strategic report G overnance Fin an cials A dditional inform ation Kennedy Wilson Europe Real Estate Plc Annual Report and Accounts 2016 103

II. Current assets 31 December 2016 £m 31 December 2015 £m United Kingdom 142.8 126.6 Ireland 15.2 18.2 Rest of Europe 45.4 12.1 203.4 156.9 Corporate1 345.3 249.3 548.7 406.2 III. Non-current assets 31 December 2016 £m 31 December 2015 £m United Kingdom 1,563.4 1,767.9 Ireland 899.8 672.9 Rest of Europe 355.8 300.2 2,819.0 2,741.0 Corporate1 0.1 9.7 2,819.1 2,750.7 IV. Total liabilities2 31 December 2016 £m 31 December 2015 Re-presented £m United Kingdom 502.0 672.6 Ireland 216.3 244.4 Rest of Europe 85.4 8.4 803.7 925.4 Corporate1 1,028.2 602.3 1,831.9 1,527.7 Footnote: 1. Within current and non-current assets, the ‘Corporate’ category comprises primarily cash and cash equivalents and derivative financial assets. Within total liabilities the ‘Corporate’ category comprises primarily the unsecured borrowings and derivative financial liabilities. Intercompany transactions have been removed from the calculation of segment assets and liabilities. 2. Prior periods have been re-presented on a basis consistent with the presentation adopted at 31 December 2016. Such re-presentation was undertaken to remove intercompany transactions. 7. Rental income The accounting policy applicable to rental income is set out in Note 3D(i). Year ended 31 December 2016 £m Year ended 31 December 2015 £m Rental income 166.3 121.9 Service charge income 20.6 14.6 Other property related income 4.6 2.3 191.5 138.8 Included within Other property related income is turnover rent in the amount of £0.4 million (year ended 31 December 2015: £0.1 million). In addition, the Group received surrender premia totalling £1.4 million (year ended 31 December 2015: £1.3 million). Notes to the consolidated financial statements For the year ended 31 December 2016 continued Kennedy Wilson Europe Real Estate Plc Annual Report and Accounts 2016 104
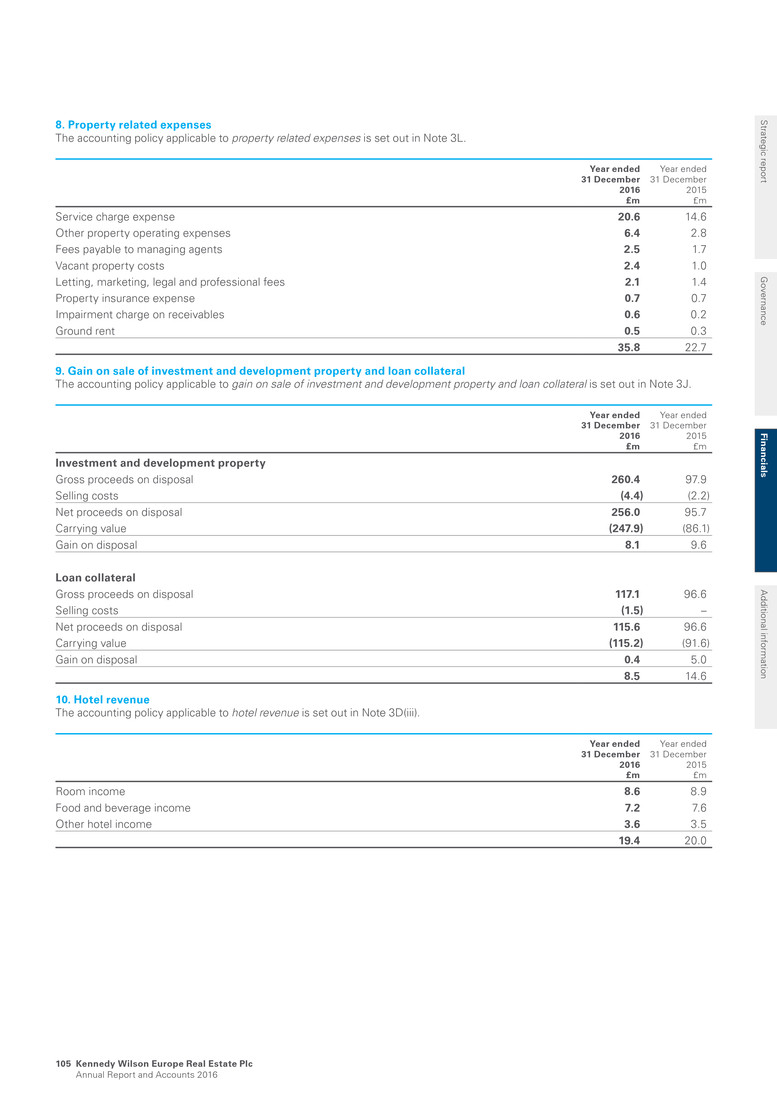
8. Property related expenses The accounting policy applicable to property related expenses is set out in Note 3L. Year ended 31 December 2016 £m Year ended 31 December 2015 £m Service charge expense 20.6 14.6 Other property operating expenses 6.4 2.8 Fees payable to managing agents 2.5 1.7 Vacant property costs 2.4 1.0 Letting, marketing, legal and professional fees 2.1 1.4 Property insurance expense 0.7 0.7 Impairment charge on receivables 0.6 0.2 Ground rent 0.5 0.3 35.8 22.7 9. Gain on sale of investment and development property and loan collateral The accounting policy applicable to gain on sale of investment and development property and loan collateral is set out in Note 3J. Year ended 31 December 2016 £m Year ended 31 December 2015 £m Investment and development property Gross proceeds on disposal 260.4 97.9 Selling costs (4.4) (2.2) Net proceeds on disposal 256.0 95.7 Carrying value (247.9) (86.1) Gain on disposal 8.1 9.6 Loan collateral Gross proceeds on disposal 117.1 96.6 Selling costs (1.5) – Net proceeds on disposal 115.6 96.6 Carrying value (115.2) (91.6) Gain on disposal 0.4 5.0 8.5 14.6 10. Hotel revenue The accounting policy applicable to hotel revenue is set out in Note 3D(iii). Year ended 31 December 2016 £m Year ended 31 December 2015 £m Room income 8.6 8.9 Food and beverage income 7.2 7.6 Other hotel income 3.6 3.5 19.4 20.0 Strategic report G overnance Fin an cials A dditional inform ation Kennedy Wilson Europe Real Estate Plc Annual Report and Accounts 2016 105

11. Hotel cost of sales The accounting policy applicable to hotel cost of sales is set out in Note 3L. Year ended 31 December 2016 £m Year ended 31 December 2015 £m Wages and salaries 7.0 6.2 Consumables (Note 20) 2.4 2.4 Depreciation (Note 19) 3.2 2.2 Other costs 3.7 3.6 16.3 14.4 12. Administrative expenses The accounting policy applicable to administrative expenses is set out in Note 3L. Year ended 31 December 2016 £m Year ended 31 December 2015 £m Consultancy and other advisory fees 8.2 6.9 General expenses 4.4 5.1 Employee benefits 1.6 0.6 Legal fees 1.1 0.8 Audit and related fees (Note 39) 0.7 0.5 Directors’ fees (Note 31B(i)(a)) 0.3 0.3 Acquisition related expenditure 0.1 1.7 16.4 15.9 Included in the above table are costs associated with the hotel segment as follows: Year ended 31 December 2016 £m Year ended 31 December 2015 £m Hotel administrative costs General expenses 1.7 2.6 Employee benefit 1.6 0.6 Consultancy and other advisory fees 1.5 1.8 4.8 5.0 13. Finance income The accounting policies applicable to finance income are set out in Note 3D(ii) and Note 3F. Year ended 31 December 2016 £m Year ended 31 December 2015 £m Interest income from loans secured by real estate 6.3 13.4 Interest income from cash and cash equivalents 0.6 0.6 6.9 14.0 Notes to the consolidated financial statements For the year ended 31 December 2016 continued Kennedy Wilson Europe Real Estate Plc Annual Report and Accounts 2016 106

14. Finance costs The accounting policies applicable to finance costs are set out in Note 3G and Note 3P(iii)(b). Year ended 31 December 2016 £m Year ended 31 December 2015 £m Interest on secured borrowings 21.4 21.6 Interest on unsecured €550.0 million 3.25% note 13.6 3.0 Interest on standalone unsecured £500.0 million 3.95% bond 13.1 3.4 Amortisation of loan arrangement fees 5.5 3.4 Time value movement of foreign exchange zero premium options 1.0 2.3 Commitment fee and interest charge on revolving credit facility 1.4 1.1 Bond discount amortisation, net of amortisation of bond premia 0.7 0.3 Fair value movement on derivative financial instruments 0.9 0.8 Foreign currency (gain)/loss (0.1) 0.6 Bank fees and other costs 0.2 0.3 57.7 36.8 15. Taxation The accounting policy applicable to taxation is set out in Note 3H. A. Company The Company is tax resident in Jersey. Jersey has a corporate tax rate of zero under schedule D of the Income Tax (Jersey) Law 1961 as amended, so the Company is not subject to tax in Jersey on its income or gains and is not subject to United Kingdom or other jurisdiction corporation tax on any dividend or interest income it receives. No charge to Jersey taxation will arise on capital gains. B. Group The Directors conduct the affairs of the Group such that the management and control of the Group is exercised in Jersey and that, except as noted below, the Group does not carry on a trade in the United Kingdom or any other jurisdiction. The Group is liable to foreign tax on activities in its overseas subsidiaries. Outside of Jersey, the Group has subsidiaries and funds in Luxembourg, the Republic of Ireland, Isle of Man, Italy, Spain and the United Kingdom and investment and development property located in the United Kingdom, the Republic of Ireland, Italy and Spain. Luxembourg has a corporate tax rate of 29.22% on worldwide income including capital gains. However, the Group’s future tax liability is expected to be mitigated by the Luxembourg participation exemption and debt financing. The Group’s investment property located in Italy is held through a closed-end real estate alternative investment fund named Olimpia Investment Fund, wholly-owned by the Company and managed by Savills Investment Management Sgr Spa. Olimpia Investment Fund is exempt from Italian tax on income and gains. The Group’s investment and development property located in the Republic of Ireland are held through two Irish Qualifying Investor Alternative Investment Funds. During the year these funds were exempt from any direct Irish taxation on income and gains. The Group’s investment in St Andrew’s Bay Development Limited, a company domiciled in Scotland and which owns the Fairmont St Andrews Hotel, and the Group’s investment in KW Pioneer Point UK OpCo Limited, a company domiciled in the United Kingdom and which owns the operations of Pioneer Point, are subject to United Kingdom corporate tax at a rate of 20% (expected to reduce to 19% on 1 April 2017). The Group is subject to corporate income tax at 25% on taxable profits generated within its Spanish subsidiaries. The Group is subject to United Kingdom income tax at 20% on rental income arising on the investment properties, after deduction of allowable debt financing and allowable expenses. The treatment of such costs and expenses is estimated in the overall tax liability for the Group and requires judgement and assumptions regarding their deductibility. The directors have considered comparable market evidence and practice in determining the extent to which such items are allowable. Taxation is currently calculated at a weighted average rate applicable to the relevant Group undertakings of 21.5% (year ended 31 December 2015: 20%). Strategic report G overnance Fin an cials A dditional inform ation Kennedy Wilson Europe Real Estate Plc Annual Report and Accounts 2016 107
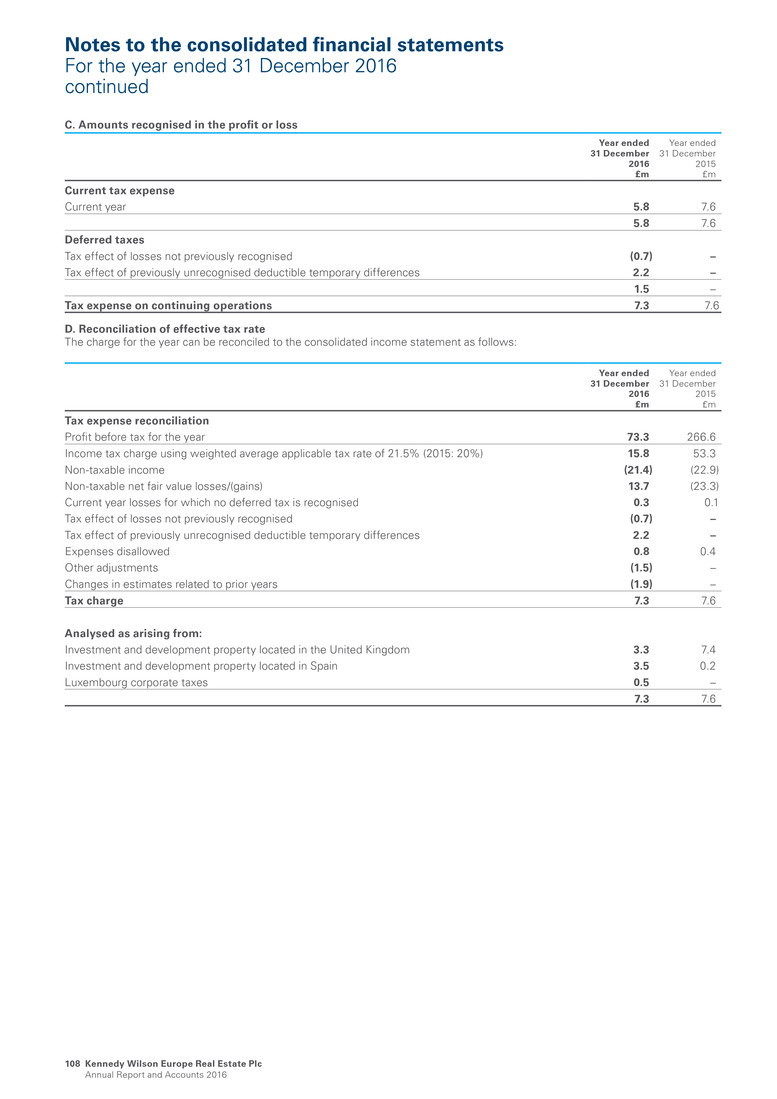
C. Amounts recognised in the profit or loss Year ended 31 December 2016 £m Year ended 31 December 2015 £m Current tax expense Current year 5.8 7.6 5.8 7.6 Deferred taxes Tax effect of losses not previously recognised (0.7) – Tax effect of previously unrecognised deductible temporary differences 2.2 – 1.5 – Tax expense on continuing operations 7.3 7.6 D. Reconciliation of effective tax rate The charge for the year can be reconciled to the consolidated income statement as follows: Year ended 31 December 2016 £m Year ended 31 December 2015 £m Tax expense reconciliation Profit before tax for the year 73.3 266.6 Income tax charge using weighted average applicable tax rate of 21.5% (2015: 20%) 15.8 53.3 Non-taxable income (21.4) (22.9) Non-taxable net fair value losses/(gains) 13.7 (23.3) Current year losses for which no deferred tax is recognised 0.3 0.1 Tax effect of losses not previously recognised (0.7) – Tax effect of previously unrecognised deductible temporary differences 2.2 – Expenses disallowed 0.8 0.4 Other adjustments (1.5) – Changes in estimates related to prior years (1.9) – Tax charge 7.3 7.6 Analysed as arising from: Investment and development property located in the United Kingdom 3.3 7.4 Investment and development property located in Spain 3.5 0.2 Luxembourg corporate taxes 0.5 – 7.3 7.6 Notes to the consolidated financial statements For the year ended 31 December 2016 continued Kennedy Wilson Europe Real Estate Plc Annual Report and Accounts 2016 108
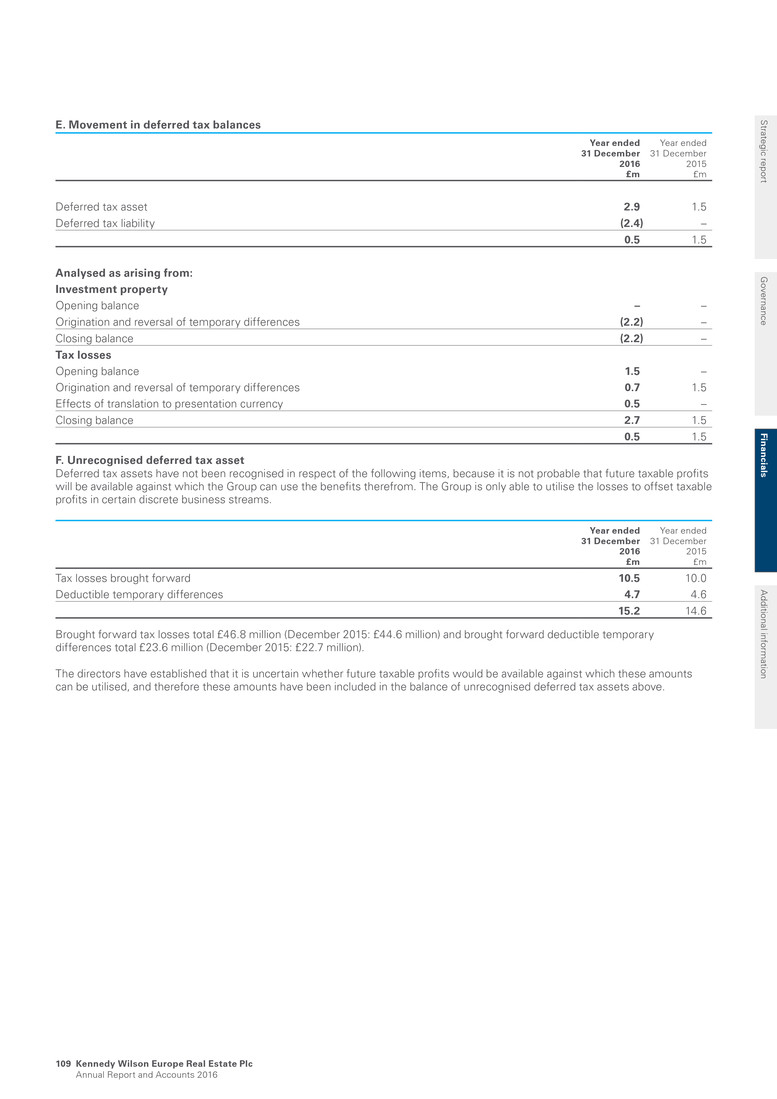
E. Movement in deferred tax balances Year ended 31 December 2016 £m Year ended 31 December 2015 £m Deferred tax asset 2.9 1.5 Deferred tax liability (2.4) – 0.5 1.5 Analysed as arising from: Investment property Opening balance – – Origination and reversal of temporary differences (2.2) – Closing balance (2.2) – Tax losses Opening balance 1.5 – Origination and reversal of temporary differences 0.7 1.5 Effects of translation to presentation currency 0.5 – Closing balance 2.7 1.5 0.5 1.5 F. Unrecognised deferred tax asset Deferred tax assets have not been recognised in respect of the following items, because it is not probable that future taxable profits will be available against which the Group can use the benefits therefrom. The Group is only able to utilise the losses to offset taxable profits in certain discrete business streams. Year ended 31 December 2016 £m Year ended 31 December 2015 £m Tax losses brought forward 10.5 10.0 Deductible temporary differences 4.7 4.6 15.2 14.6 Brought forward tax losses total £46.8 million (December 2015: £44.6 million) and brought forward deductible temporary differences total £23.6 million (December 2015: £22.7 million). The directors have established that it is uncertain whether future taxable profits would be available against which these amounts can be utilised, and therefore these amounts have been included in the balance of unrecognised deferred tax assets above. Strategic report G overnance Fin an cials A dditional inform ation Kennedy Wilson Europe Real Estate Plc Annual Report and Accounts 2016 109

16. Earnings, net asset value per share and EPRA metrics Basic earnings per share is calculated by dividing the consolidated profit attributable to ordinary shareholders of the Company by the weighted average number of ordinary shares outstanding for the year and adjusting for shares to be issued in part settlement of the investment management fee for the quarter ended 31 December 2016, if any. Basic net asset value (‘NAV’) per share is calculated by dividing net assets in the consolidated balance sheet attributable to ordinary shareholders of the Company by the number of ordinary shares outstanding at 31 December 2016. A. Basic, diluted, EPRA earnings and Adjusted earnings per share reconciliation Year ended 31 December 2016 Year ended 31 December 2015 £m p1 £m p1 Profit for the year after taxation 66.0 49.1 259.0 191.0 Adjusted for: Net change in fair value of investment and development property (Note 17) 10.8 8.0 (208.0) (153.4) Net change in the fair value of loans secured by real estate (Note 18) (0.3) (0.2) (5.1) (3.8) Deferred taxes in respect of EPRA adjustments 3.0 2.2 – – Gain on sale of investment and development property and loan collateral (Note 9) and other gains (8.5) (6.3) (15.4) (11.3) Taxes on gains on disposal 0.9 0.7 – – Fair value loss on interest rate caps (Note 14) 0.9 0.7 0.8 0.6 Debt close out costs 0.2 0.2 – – Time value of foreign exchange zero premium options (Note 14) 1.0 0.8 2.3 1.6 Acquisition related expenditure (Note 12) 0.1 – 1.7 1.3 EPRA earnings 74.1 55.2 35.3 26.0 Group adjustments: Performance fee – – 29.7 21.9 Adjusted earnings 74.1 55.2 65.0 47.9 Weighted average number of ordinary shares (Note 28B) 134,364,625 135,613,838 Footnote: 1. Per share amount. The European Public Real Estate Association (‘EPRA’) issued Best Practices Recommendations, most recently in December 2014. The EPRA earnings are presented to provide what the Company believes is a more appropriate assessment of the operational income accruing to the Group’s activities. Hence, the Company adjusts basic earnings for income and costs which are not of a recurrent nature or which may be more capital in nature. In addition, the Group has made additional adjustments to EPRA earnings in order to remove other non-trading items not considered by EPRA in its Best Practice Recommendations, in order to present an “Adjusted earnings” figure. Notes to the consolidated financial statements For the year ended 31 December 2016 continued Kennedy Wilson Europe Real Estate Plc Annual Report and Accounts 2016 110
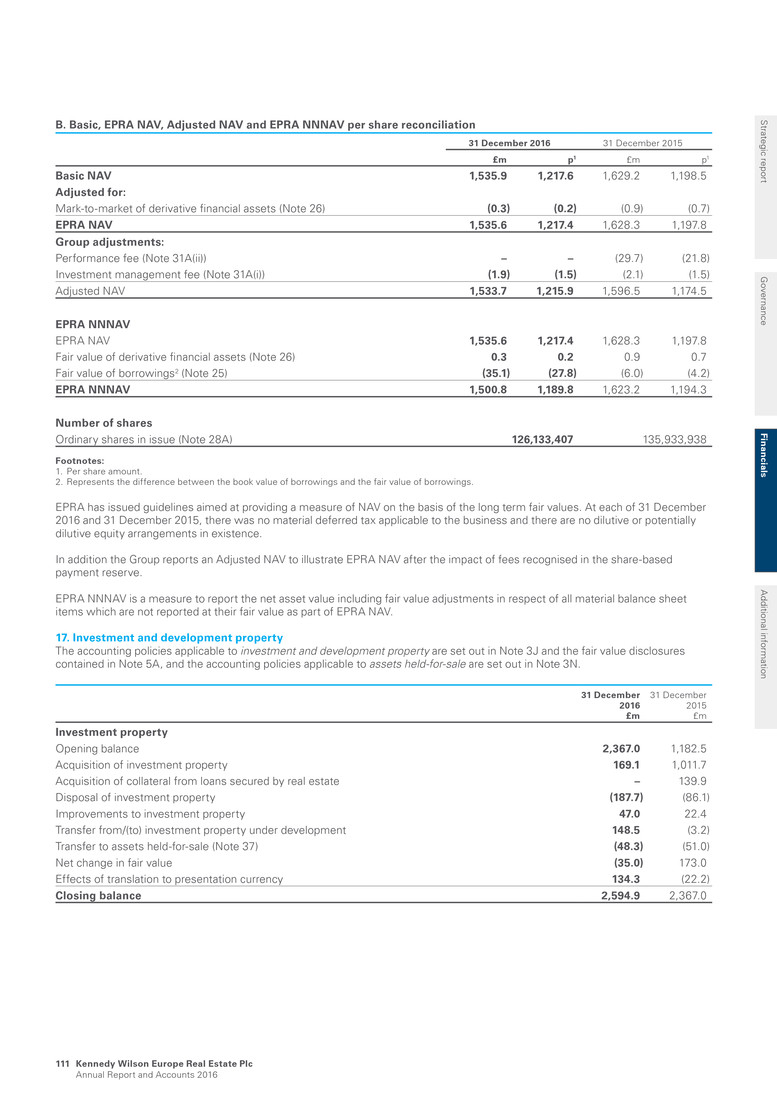
B. Basic, EPRA NAV, Adjusted NAV and EPRA NNNAV per share reconciliation 31 December 2016 31 December 2015 £m p1 £m p1 Basic NAV 1,535.9 1,217.6 1,629.2 1,198.5 Adjusted for: Mark-to-market of derivative financial assets (Note 26) (0.3) (0.2) (0.9) (0.7) EPRA NAV 1,535.6 1,217.4 1,628.3 1,197.8 Group adjustments: Performance fee (Note 31A(ii)) – – (29.7) (21.8) Investment management fee (Note 31A(i)) (1.9) (1.5) (2.1) (1.5) Adjusted NAV 1,533.7 1,215.9 1,596.5 1,174.5 EPRA NNNAV EPRA NAV 1,535.6 1,217.4 1,628.3 1,197.8 Fair value of derivative financial assets (Note 26) 0.3 0.2 0.9 0.7 Fair value of borrowings2 (Note 25) (35.1) (27.8) (6.0) (4.2) EPRA NNNAV 1,500.8 1,189.8 1,623.2 1,194.3 Number of shares Ordinary shares in issue (Note 28A) 126,133,407 135,933,938 Footnotes: 1. Per share amount. 2. Represents the difference between the book value of borrowings and the fair value of borrowings. EPRA has issued guidelines aimed at providing a measure of NAV on the basis of the long term fair values. At each of 31 December 2016 and 31 December 2015, there was no material deferred tax applicable to the business and there are no dilutive or potentially dilutive equity arrangements in existence. In addition the Group reports an Adjusted NAV to illustrate EPRA NAV after the impact of fees recognised in the share-based payment reserve. EPRA NNNAV is a measure to report the net asset value including fair value adjustments in respect of all material balance sheet items which are not reported at their fair value as part of EPRA NAV. 17. Investment and development property The accounting policies applicable to investment and development property are set out in Note 3J and the fair value disclosures contained in Note 5A, and the accounting policies applicable to assets held-for-sale are set out in Note 3N. 31 December 2016 £m 31 December 2015 £m Investment property Opening balance 2,367.0 1,182.5 Acquisition of investment property 169.1 1,011.7 Acquisition of collateral from loans secured by real estate – 139.9 Disposal of investment property (187.7) (86.1) Improvements to investment property 47.0 22.4 Transfer from/(to) investment property under development 148.5 (3.2) Transfer to assets held-for-sale (Note 37) (48.3) (51.0) Net change in fair value (35.0) 173.0 Effects of translation to presentation currency 134.3 (22.2) Closing balance 2,594.9 2,367.0 Strategic report G overnance Fin an cials A dditional inform ation Kennedy Wilson Europe Real Estate Plc Annual Report and Accounts 2016 111

31 December 2016 £m 31 December 2015 £m Investment property under development Opening balance 133.2 35.8 Acquisition of investment property under development 20.1 28.8 Disposal of investment property under development (9.0) – Development expenditure 47.6 31.8 Transfer from/(to) investment property (148.5) 3.2 Transfer to assets held-for-sale (Note 37) (11.1) – Net change in fair value 24.2 35.0 Effects of translation to presentation currency 23.9 (1.4) Closing balance 80.4 133.2 Disclosed as: Carrying value of investment and development property 2,675.3 2,500.2 Assets held-for-sale (Note 37) 59.4 51.0 Adjustment in respect of straight line rent (Note 21)1 6.9 3.1 Fair value of investment and development property 2,741.6 2,554.3 Footnote: 1. Included as a component of the “Rent and other receivables” balance in the consolidated balance sheet. The historical cost of investment properties acquired during the year, inclusive of acquisition costs, is £169.1 million (year ended 31 December 2015: £1,011.7 million). The total expenditure incurred to acquire investment properties under development during the year is £20.1 million (year ended 31 December 2015: £28.8 million). Acquisition costs which comprise primarily stamp duty, legal services and other directly attributable costs arising from the transactions, amounted to £4.8 million (year ended 31 December 2015: £34.5 million). The net fair value loss of £10.8 million (December 2015: net fair value gain £208.0 million) recognised in respect of investment and development property has been recognised in the consolidated income statement. Long term leasehold values included within investment properties amount to £355.8 million (December 2015: £401.7 million). The leasehold investment properties have lease terms ranging between 125 and 999 years (December 2015: 125 to 999 years). All other properties are freehold. At 31 December 2016, the Group was contractually committed to £8.8 million (December 2015: £66.1 million) of future expenditure for the purchase, construction, development and enhancement of investment and development property. See further details in Note 35A. The Group complies with IAS 40 Investment Properties. A. Valuation process The Group utilises the staff of the Investment Manager and certain of its affiliates (the ‘Investment Manager Group’) who hold relevant internationally recognised professional qualifications and are experienced in valuing the types of properties in the applicable locations. The valuations are based on: • Information provided by the Investment Manager Group including rents, lease terms, revenue and capital expenditure. Such information is derived from the Investment Manager Group’s financial and property systems and is subject to the Group’s overall control environment, and • Valuation models used by the external valuers, including market related assumptions based on their professional judgement and market observation The Investment Manager reviews the valuations arrived at by the external valuers. This review includes a discussion with the Board and separately with the external valuers on the assumptions used, the process and methodology undertaken and a review of the data considered by the external valuers. The Board determines the Group’s valuation policies and procedures for property valuation. Notes to the consolidated financial statements For the year ended 31 December 2016 continued Kennedy Wilson Europe Real Estate Plc Annual Report and Accounts 2016 112

The Board decides which external valuer to appoint to be responsible for the external valuations of the Group’s properties. Selection criteria include market knowledge, reputation, independence and whether professional standards are maintained. The Board decides after discussions with the Group’s external valuers and the Investment Manager: • Whether a property’s fair value can be reliably determined • Which valuation method should be applied for each property • The assumptions made for unobservable inputs used in the valuation method for investment property (the major unobservable inputs are estimated rent per square foot/square metre/unit, estimated rental value and equivalent yield), and • The assumptions made for unobservable inputs used in the valuation method for investment property under development (the major unobservable inputs are, as appropriate to each development asset, build cost per square foot/square metre, net initial yield, sales value per square foot/square metre and price per acre) The fair value of the Group’s investment and development property at 31 December 2016 has been arrived at on the basis of a valuation carried out at that date by our external valuers. CBRE valued all investment and development properties, except for the Italian portfolio which was valued by Colliers Real Estate Services Italia S.r.l. con socio unico (together, the ‘Valuers’). The valuations performed by the Valuers, conform to IFRS 13 Fair Value Measurement, the Valuation Standards of the Royal Institution of Chartered Surveyors Professional Standards 2014 (the ‘RICS Red Book’) and with the International Valuation Board’s International Valuation Standards, and were arrived at by reference to market comparables for similar properties. The Valuers submit and present summary reports to the Group’s Audit Committee. The Valuers are independent and external to the Group and the Investment Manager. Valuations are performed bi-annually and are performed consistently across all properties in the Group’s portfolio. The valuation dates are 30 June and 31 December, and a valuation is normally conducted regardless of the date of acquisition. This includes a physical inspection of all properties, at least once a year. In line with IFRS 13 all investment properties are valued on the basis of their highest and best use. When considering the highest and best use a valuer will consider, on a property by property basis, its actual and potential uses which are physically, legally and financially viable. Where the highest and best use differs from the existing use, the valuer will consider the cost and likelihood of achieving and implementing this change in arriving at its valuation. Annual valuation fees are calculated as a fixed percentage of the value of the investment and development property, as agreed between the Group and the Valuers. The Valuers have advised us that the fees earned by each of them from the Group are less than 5% of their total revenue in any year. In addition to the valuation work, CBRE has carried out agency and professional services on behalf of the Group since inception. The Group, consistent with EPRA’s guidance, consider that all of its investment and development property falls within Level 3 of the fair value hierarchy, as defined by IFRS 13 (as discussed in Note 5A). The valuations have been prepared on the basis of Market Value which is defined in the RICS Valuation Standards as: “The estimated amount for which a property should exchange on the date of valuation between a willing buyer and a willing seller in an arm’s length transaction after proper marketing wherein the parties had acted knowledgeably, prudently and without compulsion.” Market Value as defined in the RICS Valuation Standards is the equivalent of fair value under IFRS. (i). Investment property To determine the value of investment property, the income approach is used. This involves applying market derived capitalisation yields to current and market derived future income streams with appropriate adjustments for income voids arising from vacancies, or rent-free periods. These capitalisation yields and future income streams are derived from comparable property and leasing transactions and are considered to be key inputs in the valuation. Other factors that are taken into account include the tenure of the property, tenancy details, planning, building and environmental factors that might affect the property. The comparison methodology is used for residential properties whereby the fair value is calculated using data from recent market transactions. The following tables set out the valuation techniques and the key unobservable inputs used in the valuation of the Group’s investment property. Strategic report G overnance Fin an cials A dditional inform ation Kennedy Wilson Europe Real Estate Plc Annual Report and Accounts 2016 113
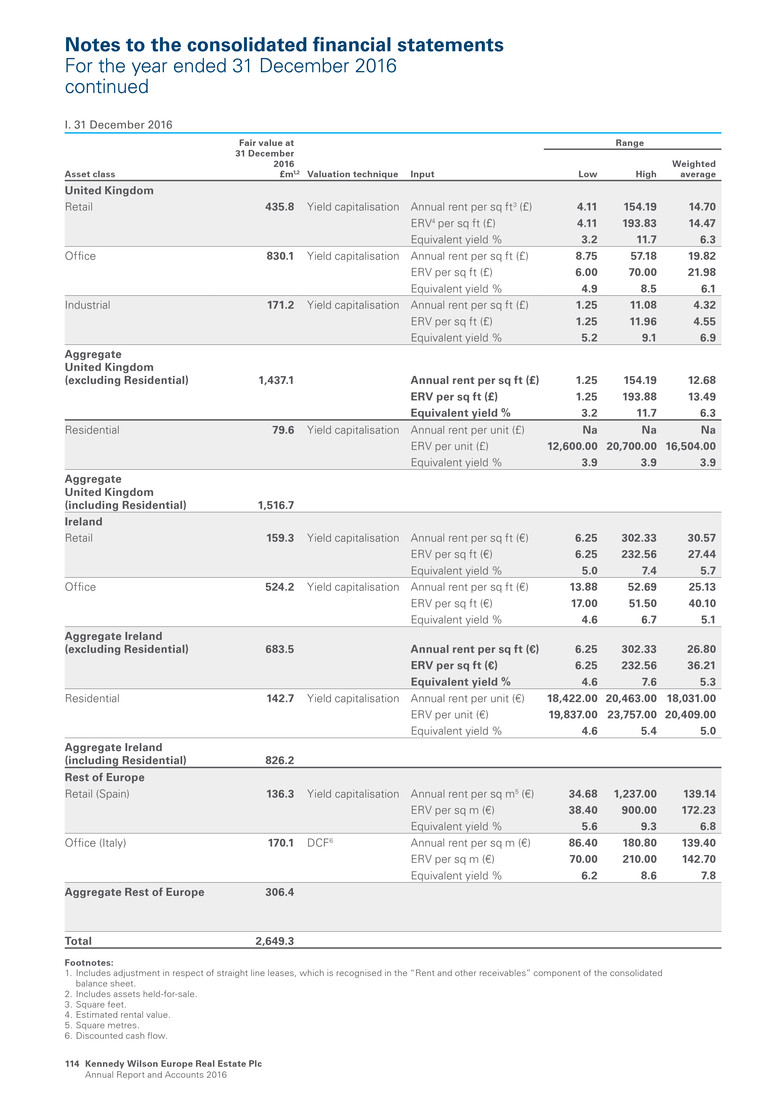
I. 31 December 2016 Asset class Fair value at 31 December 2016 £m1,2 Valuation technique Input Range Low High Weighted average United Kingdom Retail 435.8 Yield capitalisation Annual rent per sq ft3 (£) 4.11 154.19 14.70 ERV4 per sq ft (£) 4.11 193.83 14.47 Equivalent yield % 3.2 11.7 6.3 Office 830.1 Yield capitalisation Annual rent per sq ft (£) 8.75 57.18 19.82 ERV per sq ft (£) 6.00 70.00 21.98 Equivalent yield % 4.9 8.5 6.1 Industrial 171.2 Yield capitalisation Annual rent per sq ft (£) 1.25 11.08 4.32 ERV per sq ft (£) 1.25 11.96 4.55 Equivalent yield % 5.2 9.1 6.9 Aggregate United Kingdom (excluding Residential) 1,437.1 Annual rent per sq ft (£) 1.25 154.19 12.68 ERV per sq ft (£) 1.25 193.88 13.49 Equivalent yield % 3.2 11.7 6.3 Residential 79.6 Yield capitalisation Annual rent per unit (£) Na Na Na ERV per unit (£) 12,600.00 20,700.00 16,504.00 Equivalent yield % 3.9 3.9 3.9 Aggregate United Kingdom (including Residential) 1,516.7 Ireland Retail 159.3 Yield capitalisation Annual rent per sq ft (€) 6.25 302.33 30.57 ERV per sq ft (€) 6.25 232.56 27.44 Equivalent yield % 5.0 7.4 5.7 Office 524.2 Yield capitalisation Annual rent per sq ft (€) 13.88 52.69 25.13 ERV per sq ft (€) 17.00 51.50 40.10 Equivalent yield % 4.6 6.7 5.1 Aggregate Ireland (excluding Residential) 683.5 Annual rent per sq ft (€) 6.25 302.33 26.80 ERV per sq ft (€) 6.25 232.56 36.21 Equivalent yield % 4.6 7.6 5.3 Residential 142.7 Yield capitalisation Annual rent per unit (€) 18,422.00 20,463.00 18,031.00 ERV per unit (€) 19,837.00 23,757.00 20,409.00 Equivalent yield % 4.6 5.4 5.0 Aggregate Ireland (including Residential) 826.2 Rest of Europe Retail (Spain) 136.3 Yield capitalisation Annual rent per sq m5 (€) 34.68 1,237.00 139.14 ERV per sq m (€) 38.40 900.00 172.23 Equivalent yield % 5.6 9.3 6.8 Office (Italy) 170.1 DCF6 Annual rent per sq m (€) 86.40 180.80 139.40 ERV per sq m (€) 70.00 210.00 142.70 Equivalent yield % 6.2 8.6 7.8 Aggregate Rest of Europe 306.4 Total 2,649.3 Footnotes: 1. Includes adjustment in respect of straight line leases, which is recognised in the “Rent and other receivables” component of the consolidated balance sheet. 2. Includes assets held-for-sale. 3. Square feet. 4. Estimated rental value. 5. Square metres. 6. Discounted cash flow. Notes to the consolidated financial statements For the year ended 31 December 2016 continued Kennedy Wilson Europe Real Estate Plc Annual Report and Accounts 2016 114

II. 31 December 2015 Asset class Fair value at 31 December 2015 £m1,2 Valuation technique Input Range Low High Weighted average United Kingdom Retail 538.4 Yield capitalisation Annual rent per sq ft3 (£) 2.78 154.19 14.27 ERV4 per sq ft (£) 3.50 171.98 14.05 Equivalent yield % 3.3 11.8 6.3 Office 842.4 Yield capitalisation Annual rent per sq ft (£) 5.99 52.50 20.22 ERV per sq ft (£) 6.00 70.00 22.14 Equivalent yield % 4.0 12.0 5.9 Industrial 179.4 Yield capitalisation Annual rent per sq ft (£) 1.25 10.58 4.43 ERV per sq ft (£) 1.25 11.52 4.53 Equivalent yield % 4.5 10.0 6.4 Aggregate United Kingdom (excluding Residential) 1,560.2 Annual rent per sq ft (£) 1.25 154.19 12.89 ERV per sq ft (£) 1.25 171.98 13.51 Equivalent yield % 3.3 12.0 6.1 Residential 66.4 Yield capitalisation Annual rent per unit (£) Na Na Na ERV per unit (£) 12,600.00 20,700.00 16,504.00 Equivalent yield % 4.0 4.0 4.0 Aggregate United Kingdom (including Residential) 1,626.6 Ireland Retail 153.2 Yield capitalisation Annual rent per sq ft (€) 6.25 302.33 30.21 ERV per sq ft (€) 5.00 302.33 26.77 Equivalent yield % 3.8 7.9 5.7 Office 306.3 Yield capitalisation Annual rent per sq ft (€) 15.43 50.85 34.90 ERV per sq ft (€) 15.50 50.00 40.07 Equivalent yield % 4.6 8.0 5.0 Aggregate Ireland (excluding Residential) 459.5 Annual rent per sq ft (€) 6.25 302.33 32.97 ERV per sq ft (€) 5.00 302.33 34.60 Equivalent yield % 3.8 8.0 5.3 Residential 76.7 Yield capitalisation Annual rent per unit (€) 17,837.00 24,450.00 18,919.00 ERV per unit (€) 18,667.00 29,250.00 19,977.00 Equivalent yield % 4.7 5.8 4.9 Aggregate Ireland (including Residential) 536.2 Rest of Europe Retail (Spain) 116.7 Yield capitalisation Annual rent per sq m5 (€) 30.95 1,237.00 140.32 ERV per sq m (€) 39.00 660.03 166.97 Equivalent yield % 5.4 9.5 7.0 Office (Italy) 141.6 DCF6 Annual rent per sq m (€) 86.40 180.80 139.40 ERV per sq m (€) 60.00 200.00 130.60 Equivalent yield % 6.2 9.1 7.6 Aggregate Rest of Europe 258.3 Total 2,421.1 Footnotes: 1. lncludes adjustment in respect of straight line leases, which is recognised in the “Rent and other receivables” component of the consolidated balance sheet. 2. Includes assets held-for-sale. 3. Square feet. 4. Estimated rental value. 5. Square metres. 6. Discounted cash flow. Strategic report G overnance Fin an cials A dditional inform ation Kennedy Wilson Europe Real Estate Plc Annual Report and Accounts 2016 115
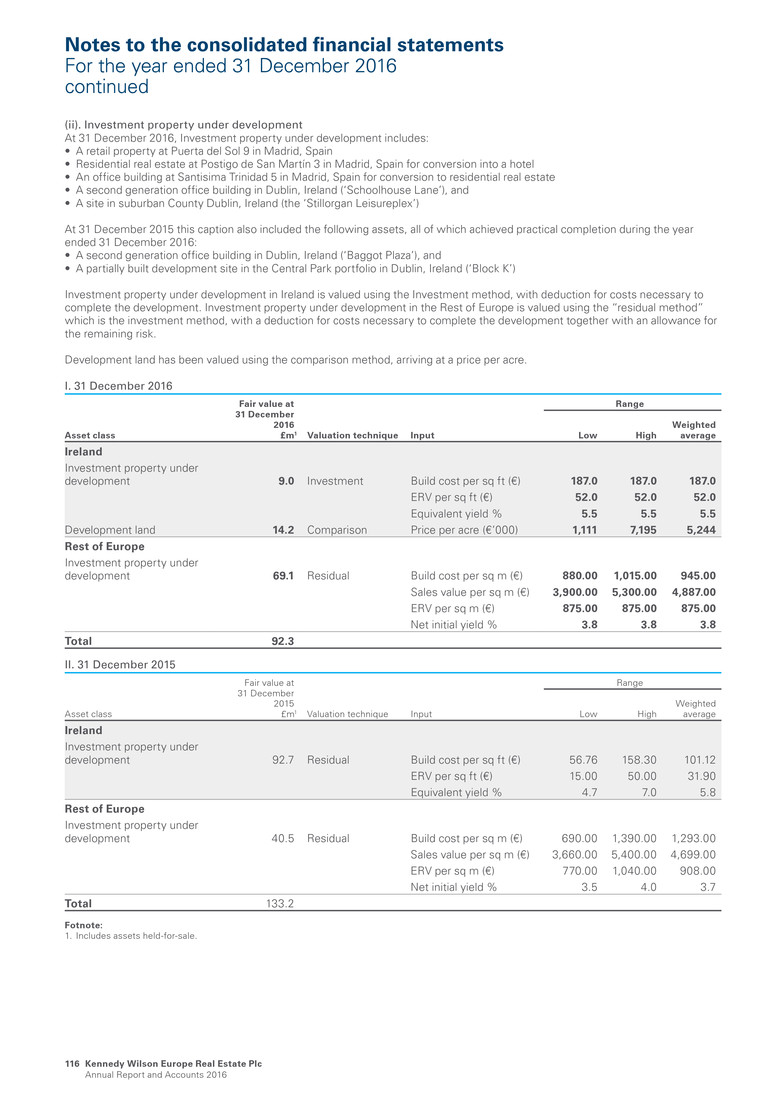
(ii). Investment property under development At 31 December 2016, Investment property under development includes: • A retail property at Puerta del Sol 9 in Madrid, Spain • Residential real estate at Postigo de San Martín 3 in Madrid, Spain for conversion into a hotel • An office building at Santisima Trinidad 5 in Madrid, Spain for conversion to residential real estate • A second generation office building in Dublin, Ireland (‘Schoolhouse Lane’), and • A site in suburban County Dublin, Ireland (the ‘Stillorgan Leisureplex’) At 31 December 2015 this caption also included the following assets, all of which achieved practical completion during the year ended 31 December 2016: • A second generation office building in Dublin, Ireland (‘Baggot Plaza’), and • A partially built development site in the Central Park portfolio in Dublin, Ireland (‘Block K’) Investment property under development in Ireland is valued using the Investment method, with deduction for costs necessary to complete the development. Investment property under development in the Rest of Europe is valued using the “residual method” which is the investment method, with a deduction for costs necessary to complete the development together with an allowance for the remaining risk. Development land has been valued using the comparison method, arriving at a price per acre. I. 31 December 2016 Asset class Fair value at 31 December 2016 £m1 Valuation technique Input Range Low High Weighted average Ireland Investment property under development 9.0 Investment Build cost per sq ft (€) 187.0 187.0 187.0 ERV per sq ft (€) 52.0 52.0 52.0 Equivalent yield % 5.5 5.5 5.5 Development land 14.2 Comparison Price per acre (€’000) 1,111 7,195 5,244 Rest of Europe Investment property under development 69.1 Residual Build cost per sq m (€) 880.00 1,015.00 945.00 Sales value per sq m (€) 3,900.00 5,300.00 4,887.00 ERV per sq m (€) 875.00 875.00 875.00 Net initial yield % 3.8 3.8 3.8 Total 92.3 II. 31 December 2015 Asset class Fair value at 31 December 2015 £m1 Valuation technique Input Range Low High Weighted average Ireland Investment property under development 92.7 Residual Build cost per sq ft (€) 56.76 158.30 101.12 ERV per sq ft (€) 15.00 50.00 31.90 Equivalent yield % 4.7 7.0 5.8 Rest of Europe Investment property under development 40.5 Residual Build cost per sq m (€) 690.00 1,390.00 1,293.00 Sales value per sq m (€) 3,660.00 5,400.00 4,699.00 ERV per sq m (€) 770.00 1,040.00 908.00 Net initial yield % 3.5 4.0 3.7 Total 133.2 Fotnote: 1. Includes assets held-for-sale. Notes to the consolidated financial statements For the year ended 31 December 2016 continued Kennedy Wilson Europe Real Estate Plc Annual Report and Accounts 2016 116
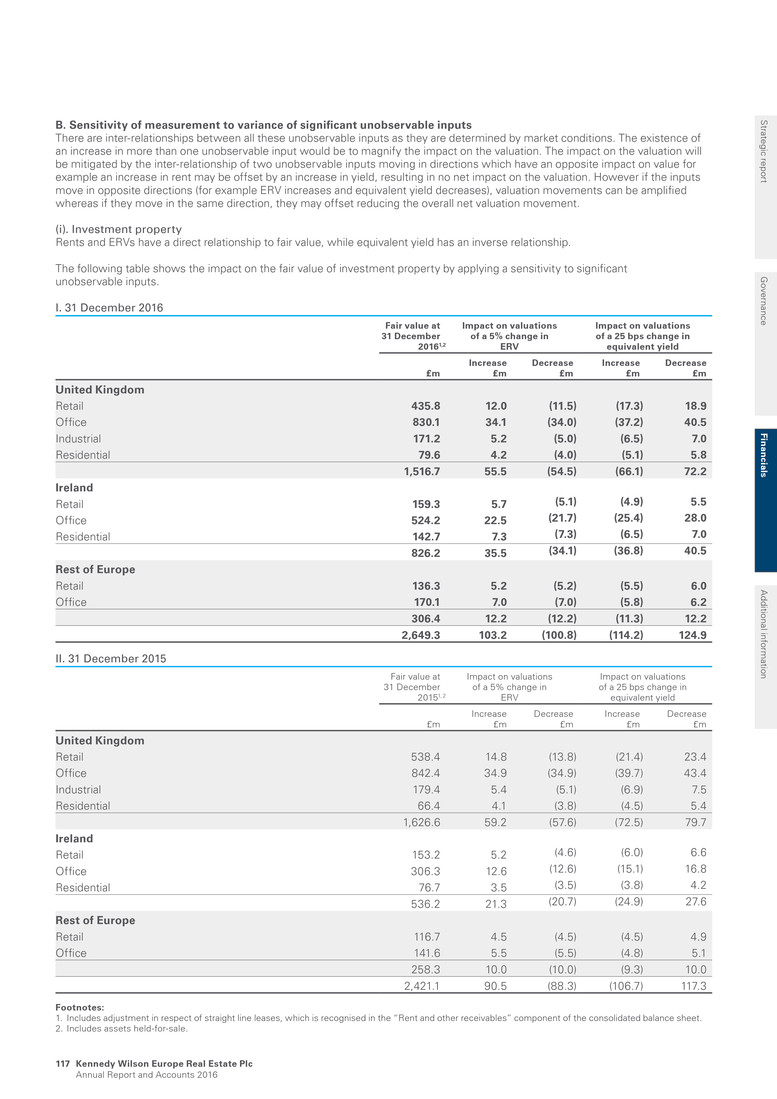
B. Sensitivity of measurement to variance of significant unobservable inputs There are inter-relationships between all these unobservable inputs as they are determined by market conditions. The existence of an increase in more than one unobservable input would be to magnify the impact on the valuation. The impact on the valuation will be mitigated by the inter-relationship of two unobservable inputs moving in directions which have an opposite impact on value for example an increase in rent may be offset by an increase in yield, resulting in no net impact on the valuation. However if the inputs move in opposite directions (for example ERV increases and equivalent yield decreases), valuation movements can be amplified whereas if they move in the same direction, they may offset reducing the overall net valuation movement. (i). Investment property Rents and ERVs have a direct relationship to fair value, while equivalent yield has an inverse relationship. The following table shows the impact on the fair value of investment property by applying a sensitivity to significant unobservable inputs. I. 31 December 2016 Fair value at 31 December 20161,2 Impact on valuations of a 5% change in ERV Impact on valuations of a 25 bps change in equivalent yield £m Increase £m Decrease £m Increase £m Decrease £m United Kingdom Retail 435.8 12.0 (11.5) (17.3) 18.9 Office 830.1 34.1 (34.0) (37.2) 40.5 Industrial 171.2 5.2 (5.0) (6.5) 7.0 Residential 79.6 4.2 (4.0) (5.1) 5.8 1,516.7 55.5 (54.5) (66.1) 72.2 Ireland Retail 159.3 5.7 (5.1) (4.9) 5.5 Office 524.2 22.5 (21.7) (25.4) 28.0 Residential 142.7 7.3 (7.3) (6.5) 7.0 826.2 35.5 (34.1) (36.8) 40.5 Rest of Europe Retail 136.3 5.2 (5.2) (5.5) 6.0 Office 170.1 7.0 (7.0) (5.8) 6.2 306.4 12.2 (12.2) (11.3) 12.2 2,649.3 103.2 (100.8) (114.2) 124.9 II. 31 December 2015 Fair value at 31 December 20151, 2 Impact on valuations of a 5% change in ERV Impact on valuations of a 25 bps change in equivalent yield £m Increase £m Decrease £m Increase £m Decrease £m United Kingdom Retail 538.4 14.8 (13.8) (21.4) 23.4 Office 842.4 34.9 (34.9) (39.7) 43.4 Industrial 179.4 5.4 (5.1) (6.9) 7.5 Residential 66.4 4.1 (3.8) (4.5) 5.4 1,626.6 59.2 (57.6) (72.5) 79.7 Ireland Retail 153.2 5.2 (4.6) (6.0) 6.6 Office 306.3 12.6 (12.6) (15.1) 16.8 Residential 76.7 3.5 (3.5) (3.8) 4.2 536.2 21.3 (20.7) (24.9) 27.6 Rest of Europe Retail 116.7 4.5 (4.5) (4.5) 4.9 Office 141.6 5.5 (5.5) (4.8) 5.1 258.3 10.0 (10.0) (9.3) 10.0 2,421.1 90.5 (88.3) (106.7) 117.3 Footnotes: 1. Includes adjustment in respect of straight line leases, which is recognised in the “Rent and other receivables” component of the consolidated balance sheet. 2. Includes assets held-for-sale. Strategic report G overnance Fin an cials A dditional inform ation Kennedy Wilson Europe Real Estate Plc Annual Report and Accounts 2016 117
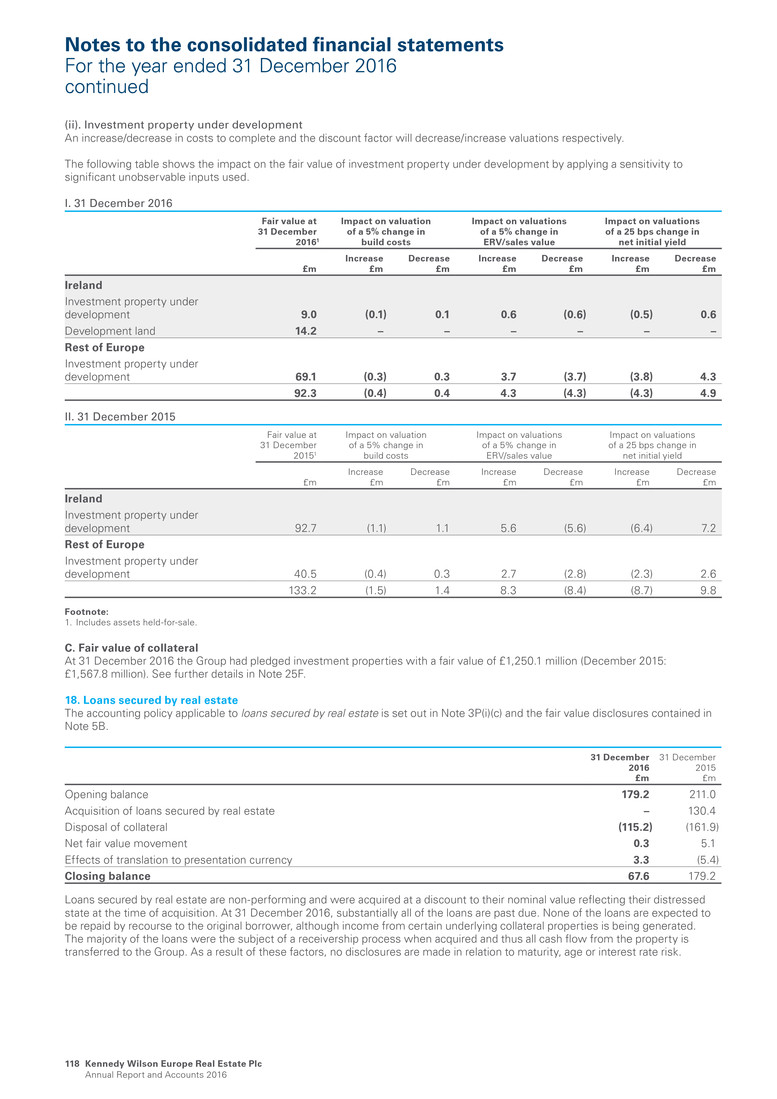
(ii). Investment property under development An increase/decrease in costs to complete and the discount factor will decrease/increase valuations respectively. The following table shows the impact on the fair value of investment property under development by applying a sensitivity to significant unobservable inputs used. I. 31 December 2016 Fair value at 31 December 20161 Impact on valuation of a 5% change in build costs Impact on valuations of a 5% change in ERV/sales value Impact on valuations of a 25 bps change in net initial yield £m Increase £m Decrease £m Increase £m Decrease £m Increase £m Decrease £m Ireland Investment property under development 9.0 (0.1) 0.1 0.6 (0.6) (0.5) 0.6 Development land 14.2 – – – – – – Rest of Europe Investment property under development 69.1 (0.3) 0.3 3.7 (3.7) (3.8) 4.3 92.3 (0.4) 0.4 4.3 (4.3) (4.3) 4.9 II. 31 December 2015 Fair value at 31 December 20151 Impact on valuation of a 5% change in build costs Impact on valuations of a 5% change in ERV/sales value Impact on valuations of a 25 bps change in net initial yield £m Increase £m Decrease £m Increase £m Decrease £m Increase £m Decrease £m Ireland Investment property under development 92.7 (1.1) 1.1 5.6 (5.6) (6.4) 7.2 Rest of Europe Investment property under development 40.5 (0.4) 0.3 2.7 (2.8) (2.3) 2.6 133.2 (1.5) 1.4 8.3 (8.4) (8.7) 9.8 Footnote: 1. Includes assets held-for-sale. C. Fair value of collateral At 31 December 2016 the Group had pledged investment properties with a fair value of £1,250.1 million (December 2015: £1,567.8 million). See further details in Note 25F. 18. Loans secured by real estate The accounting policy applicable to loans secured by real estate is set out in Note 3P(i)(c) and the fair value disclosures contained in Note 5B. 31 December 2016 £m 31 December 2015 £m Opening balance 179.2 211.0 Acquisition of loans secured by real estate – 130.4 Disposal of collateral (115.2) (161.9) Net fair value movement 0.3 5.1 Effects of translation to presentation currency 3.3 (5.4) Closing balance 67.6 179.2 Loans secured by real estate are non-performing and were acquired at a discount to their nominal value reflecting their distressed state at the time of acquisition. At 31 December 2016, substantially all of the loans are past due. None of the loans are expected to be repaid by recourse to the original borrower, although income from certain underlying collateral properties is being generated. The majority of the loans were the subject of a receivership process when acquired and thus all cash flow from the property is transferred to the Group. As a result of these factors, no disclosures are made in relation to maturity, age or interest rate risk. Notes to the consolidated financial statements For the year ended 31 December 2016 continued Kennedy Wilson Europe Real Estate Plc Annual Report and Accounts 2016 118
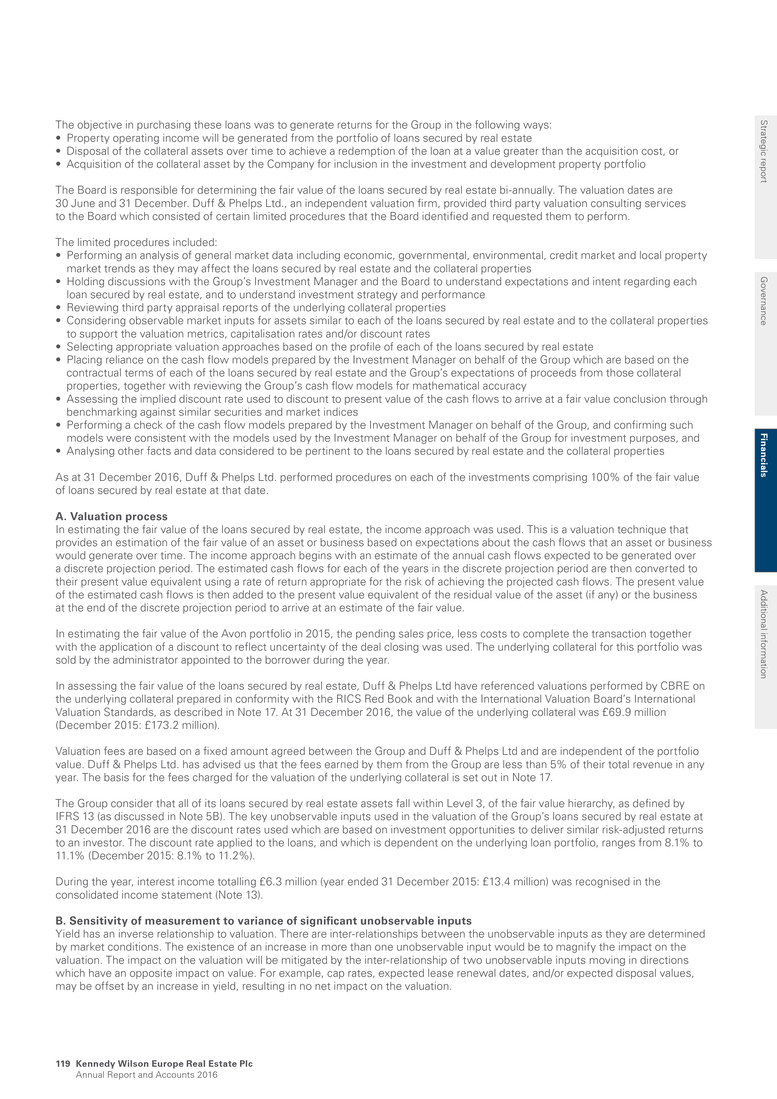
The objective in purchasing these loans was to generate returns for the Group in the following ways: • Property operating income will be generated from the portfolio of loans secured by real estate • Disposal of the collateral assets over time to achieve a redemption of the loan at a value greater than the acquisition cost, or • Acquisition of the collateral asset by the Company for inclusion in the investment and development property portfolio The Board is responsible for determining the fair value of the loans secured by real estate bi-annually. The valuation dates are 30 June and 31 December. Duff & Phelps Ltd., an independent valuation firm, provided third party valuation consulting services to the Board which consisted of certain limited procedures that the Board identified and requested them to perform. The limited procedures included: • Performing an analysis of general market data including economic, governmental, environmental, credit market and local property market trends as they may affect the loans secured by real estate and the collateral properties • Holding discussions with the Group’s Investment Manager and the Board to understand expectations and intent regarding each loan secured by real estate, and to understand investment strategy and performance • Reviewing third party appraisal reports of the underlying collateral properties • Considering observable market inputs for assets similar to each of the loans secured by real estate and to the collateral properties to support the valuation metrics, capitalisation rates and/or discount rates • Selecting appropriate valuation approaches based on the profile of each of the loans secured by real estate • Placing reliance on the cash flow models prepared by the Investment Manager on behalf of the Group which are based on the contractual terms of each of the loans secured by real estate and the Group’s expectations of proceeds from those collateral properties, together with reviewing the Group’s cash flow models for mathematical accuracy • Assessing the implied discount rate used to discount to present value of the cash flows to arrive at a fair value conclusion through benchmarking against similar securities and market indices • Performing a check of the cash flow models prepared by the Investment Manager on behalf of the Group, and confirming such models were consistent with the models used by the Investment Manager on behalf of the Group for investment purposes, and • Analysing other facts and data considered to be pertinent to the loans secured by real estate and the collateral properties As at 31 December 2016, Duff & Phelps Ltd. performed procedures on each of the investments comprising 100% of the fair value of loans secured by real estate at that date. A. Valuation process In estimating the fair value of the loans secured by real estate, the income approach was used. This is a valuation technique that provides an estimation of the fair value of an asset or business based on expectations about the cash flows that an asset or business would generate over time. The income approach begins with an estimate of the annual cash flows expected to be generated over a discrete projection period. The estimated cash flows for each of the years in the discrete projection period are then converted to their present value equivalent using a rate of return appropriate for the risk of achieving the projected cash flows. The present value of the estimated cash flows is then added to the present value equivalent of the residual value of the asset (if any) or the business at the end of the discrete projection period to arrive at an estimate of the fair value. In estimating the fair value of the Avon portfolio in 2015, the pending sales price, less costs to complete the transaction together with the application of a discount to reflect uncertainty of the deal closing was used. The underlying collateral for this portfolio was sold by the administrator appointed to the borrower during the year. In assessing the fair value of the loans secured by real estate, Duff & Phelps Ltd have referenced valuations performed by CBRE on the underlying collateral prepared in conformity with the RICS Red Book and with the International Valuation Board’s International Valuation Standards, as described in Note 17. At 31 December 2016, the value of the underlying collateral was £69.9 million (December 2015: £173.2 million). Valuation fees are based on a fixed amount agreed between the Group and Duff & Phelps Ltd and are independent of the portfolio value. Duff & Phelps Ltd. has advised us that the fees earned by them from the Group are less than 5% of their total revenue in any year. The basis for the fees charged for the valuation of the underlying collateral is set out in Note 17. The Group consider that all of its loans secured by real estate assets fall within Level 3, of the fair value hierarchy, as defined by IFRS 13 (as discussed in Note 5B). The key unobservable inputs used in the valuation of the Group’s loans secured by real estate at 31 December 2016 are the discount rates used which are based on investment opportunities to deliver similar risk-adjusted returns to an investor. The discount rate applied to the loans, and which is dependent on the underlying loan portfolio, ranges from 8.1% to 11.1% (December 2015: 8.1% to 11.2%). During the year, interest income totalling £6.3 million (year ended 31 December 2015: £13.4 million) was recognised in the consolidated income statement (Note 13). B. Sensitivity of measurement to variance of significant unobservable inputs Yield has an inverse relationship to valuation. There are inter-relationships between the unobservable inputs as they are determined by market conditions. The existence of an increase in more than one unobservable input would be to magnify the impact on the valuation. The impact on the valuation will be mitigated by the inter-relationship of two unobservable inputs moving in directions which have an opposite impact on value. For example, cap rates, expected lease renewal dates, and/or expected disposal values, may be offset by an increase in yield, resulting in no net impact on the valuation. Strategic report G overnance Fin an cials A dditional inform ation Kennedy Wilson Europe Real Estate Plc Annual Report and Accounts 2016 119

I. 31 December 2016 Fair value 31 December 2016 Impact on valuations of 100 bps change in discount rate £m Increase £m Decrease £m United Kingdom 44.4 (0.3) 0.3 Ireland 23.2 (1.1) 1.1 67.6 (1.4) 1.4 II. 31 December 2015 Fair value 31 December 2015 Impact on valuations of 100 bps change in discount rate £m Increase £m Decrease £m United Kingdom 157.3 (0.3) 0.3 Ireland 21.9 (1.0) 1.1 179.2 (1.3) 1.4 19. Property, plant and equipment The accounting policy applicable to property, plant and equipment is set out in Note 3K and the fair value disclosures set out in Note 5C. A. Reconciliation of carrying amount Land and buildings £m Plant and equipment £m Fixtures and fittings £m Other £m Total £m Cost Balance at 1 January 2015 55.2 1.6 2.9 0.2 59.9 Additions 2.8 0.1 0.9 0.2 4.0 Disposals – (0.1) – (0.1) (0.2) Revaluation of land and buildings (2.6) – – – (2.6) Effects of translation to presentation currency (0.8) – – – (0.8) Balance at 31 December 2015 54.6 1.6 3.8 0.3 60.3 Additions 9.6 0.2 0.4 – 10.2 Transfer on completion of work in progress 0.3 – – (0.3) – Revaluation of land and buildings 0.3 – – – 0.3 Effects of translation to presentation currency 3.5 0.3 – – 3.8 Balance at 31 December 2016 68.3 2.1 4.2 – 74.6 Accumulated depreciation Balance at 1 January 2015 – (0.1) (0.1) – (0.2) Charge for the year (1.3) (0.2) (0.7) – (2.2) Revaluation of land and buildings 1.3 – – – 1.3 Balance at 31 December 2015 – (0.3) (0.8) – (1.1) Charge for the year (1.6) (0.5) (1.1) – (3.2) Write-offs – – 1.3 – 1.3 Revaluation of land and buildings 1.6 – – – 1.6 Effects of translation to presentation currency – (0.1) (0.1) – (0.2) Balance at 31 December 2016 – (0.9) (0.7) – (1.6) Carrying amounts At 31 December 2015 54.6 1.3 3.0 0.3 59.2 At 31 December 2016 68.3 1.2 3.5 – 73.0 There are no restrictions on title and no property, plant and equipment has been pledged as security. Notes to the consolidated financial statements For the year ended 31 December 2016 continued Kennedy Wilson Europe Real Estate Plc Annual Report and Accounts 2016 120

B. Valuation process The Board determines the Group’s valuation policies and procedures for the valuation of property, plant and equipment. The Board decides which external valuer to appoint to be responsible for the external valuations of the Group’s property, plant and equipment, which represents its hotel assets. Selection criteria include market knowledge, reputation, independence and whether professional standards are maintained. The Board decides after discussions with the Group’s external valuers, CBRE, and the Investment Manager: • Whether a property’s fair value can be reliably determined • Which valuation method should be applied for each asset – at 31 December 2016, the discounted cash flow methodology was applied using the projected net earnings capitalised with a market capitalisation rate and discount rate, and • The assumptions made for unobservable inputs used in the valuation method (the major unobservable inputs are estimated hotel net operating income, occupancy rate, discount rate, exit yield and average daily rate (‘ADR’)) Annual valuation fees are calculated as a fixed percentage of the value of property, plant and equipment, as agreed between the Group and the valuer. The valuer has advised us that the fees earned by them from the Group are less than 5% of their total revenue in any year. The Group, consistent with EPRA’s guidance, consider that all of its property, plant and equipment falls within Level 3 of the fair value hierarchy, as defined by IFRS 13 (as discussed in Note 5C). The table below summarises the key unobservable inputs used in the valuation of the Group’s property, plant and equipment. I. 31 December 2016 Asset class Fair value at 31 December 2016 £m Inputs1 United Kingdom Ireland United Kingdom 41.2 Net operating income £4.0m €2.4m Ireland 31.8 Occupancy % 74.0 68.0 Discount rate % 8.8 9.0 Exit yield % 6.8 7.0 ADR £162.36 €115.00 Total 73.0 Stabilised year 2021 2018 II. 31 December 2015 Asset class Fair value at 31 December 2015 £m Inputs1 United Kingdom Ireland United Kingdom 36.9 Net operating income £3.5m €2.8m Ireland 22.3 Occupancy % 72.0 72.0 Discount rate % 9.0 9.0 Exit yield % 6.5 7.0 ADR £155.64 €108.12 Total 59.2 Stabilised year 2020 2018 Footnote: 1. Inputs are presented in connection with a stabilised year. There were no changes in valuation techniques during the year. C. Sensitivity of measurement to variance of significant unobservable inputs There are inter-relationships between all these unobservable inputs as they are determined by market conditions. The existence of an increase in more than one unobservable input would be to magnify the impact on the valuation. The impact on the valuation will be mitigated by the inter-relationship of two unobservable inputs moving in directions which have an opposite impact on value. For example, an increase in hotel net operating income may be offset by an increase in exit yield, resulting in no net impact on the valuation. However, if the inputs move in opposite directions (for example ADR increases and exit yield decreases), valuation movements can be amplified whereas if they move in the same direction, they may offset reducing the overall net valuation movement. Strategic report G overnance Fin an cials A dditional inform ation Kennedy Wilson Europe Real Estate Plc Annual Report and Accounts 2016 121
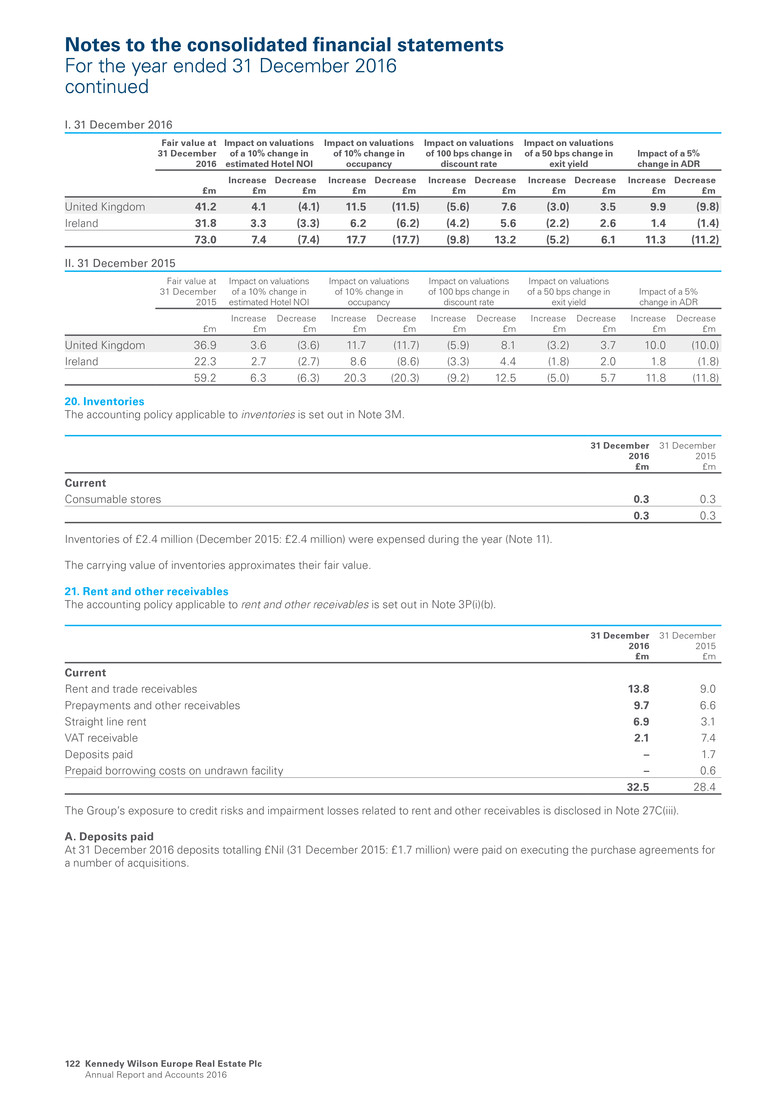
I. 31 December 2016 Fair value at 31 December 2016 Impact on valuations of a 10% change in estimated Hotel NOI Impact on valuations of 10% change in occupancy Impact on valuations of 100 bps change in discount rate Impact on valuations of a 50 bps change in exit yield Impact of a 5% change in ADR £m Increase £m Decrease £m Increase £m Decrease £m Increase £m Decrease £m Increase £m Decrease £m Increase £m Decrease £m United Kingdom 41.2 4.1 (4.1) 11.5 (11.5) (5.6) 7.6 (3.0) 3.5 9.9 (9.8) Ireland 31.8 3.3 (3.3) 6.2 (6.2) (4.2) 5.6 (2.2) 2.6 1.4 (1.4) 73.0 7.4 (7.4) 17.7 (17.7) (9.8) 13.2 (5.2) 6.1 11.3 (11.2) II. 31 December 2015 Fair value at 31 December 2015 Impact on valuations of a 10% change in estimated Hotel NOI Impact on valuations of 10% change in occupancy Impact on valuations of 100 bps change in discount rate Impact on valuations of a 50 bps change in exit yield Impact of a 5% change in ADR £m Increase £m Decrease £m Increase £m Decrease £m Increase £m Decrease £m Increase £m Decrease £m Increase £m Decrease £m United Kingdom 36.9 3.6 (3.6) 11.7 (11.7) (5.9) 8.1 (3.2) 3.7 10.0 (10.0) Ireland 22.3 2.7 (2.7) 8.6 (8.6) (3.3) 4.4 (1.8) 2.0 1.8 (1.8) 59.2 6.3 (6.3) 20.3 (20.3) (9.2) 12.5 (5.0) 5.7 11.8 (11.8) 20. Inventories The accounting policy applicable to inventories is set out in Note 3M. 31 December 2016 £m 31 December 2015 £m Current Consumable stores 0.3 0.3 0.3 0.3 Inventories of £2.4 million (December 2015: £2.4 million) were expensed during the year (Note 11). The carrying value of inventories approximates their fair value. 21. Rent and other receivables The accounting policy applicable to rent and other receivables is set out in Note 3P(i)(b). 31 December 2016 £m 31 December 2015 £m Current Rent and trade receivables 13.8 9.0 Prepayments and other receivables 9.7 6.6 Straight line rent 6.9 3.1 VAT receivable 2.1 7.4 Deposits paid – 1.7 Prepaid borrowing costs on undrawn facility – 0.6 32.5 28.4 The Group’s exposure to credit risks and impairment losses related to rent and other receivables is disclosed in Note 27C(iii). A. Deposits paid At 31 December 2016 deposits totalling £Nil (31 December 2015: £1.7 million) were paid on executing the purchase agreements for a number of acquisitions. Notes to the consolidated financial statements For the year ended 31 December 2016 continued Kennedy Wilson Europe Real Estate Plc Annual Report and Accounts 2016 122
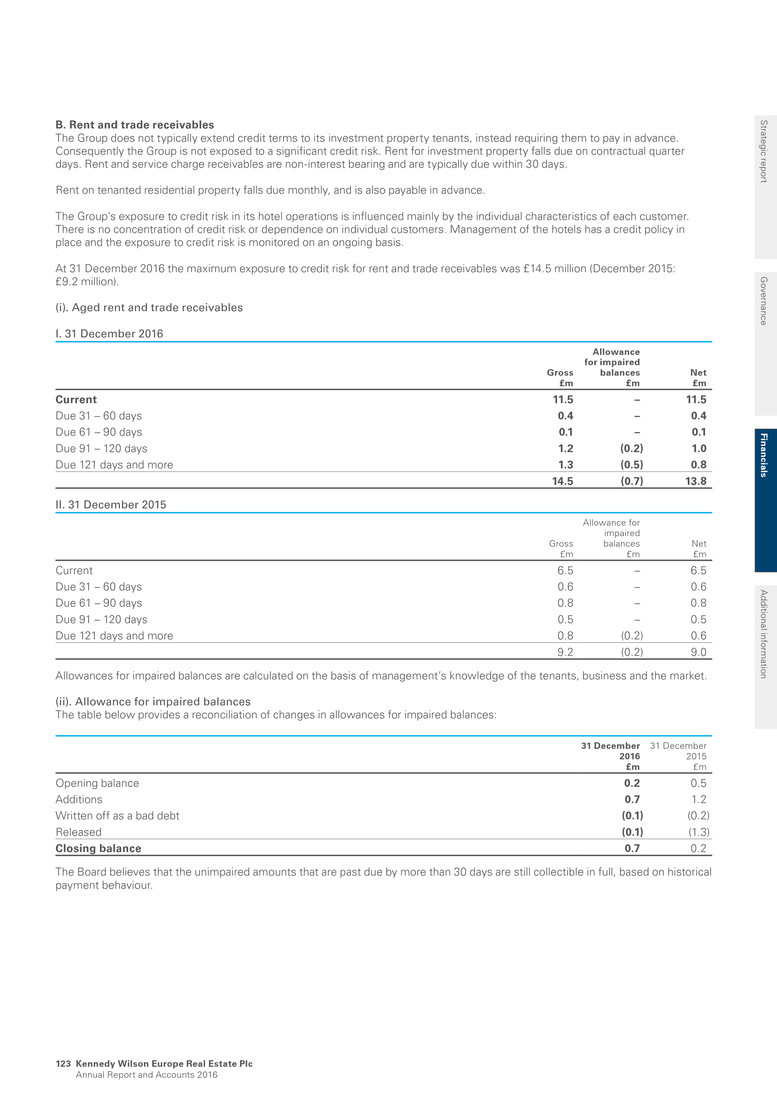
B. Rent and trade receivables The Group does not typically extend credit terms to its investment property tenants, instead requiring them to pay in advance. Consequently the Group is not exposed to a significant credit risk. Rent for investment property falls due on contractual quarter days. Rent and service charge receivables are non-interest bearing and are typically due within 30 days. Rent on tenanted residential property falls due monthly, and is also payable in advance. The Group’s exposure to credit risk in its hotel operations is influenced mainly by the individual characteristics of each customer. There is no concentration of credit risk or dependence on individual customers. Management of the hotels has a credit policy in place and the exposure to credit risk is monitored on an ongoing basis. At 31 December 2016 the maximum exposure to credit risk for rent and trade receivables was £14.5 million (December 2015: £9.2 million). (i). Aged rent and trade receivables I. 31 December 2016 Gross £m Allowance for impaired balances £m Net £m Current 11.5 – 11.5 Due 31 – 60 days 0.4 – 0.4 Due 61 – 90 days 0.1 – 0.1 Due 91 – 120 days 1.2 (0.2) 1.0 Due 121 days and more 1.3 (0.5) 0.8 14.5 (0.7) 13.8 II. 31 December 2015 Gross £m Allowance for impaired balances £m Net £m Current 6.5 – 6.5 Due 31 – 60 days 0.6 – 0.6 Due 61 – 90 days 0.8 – 0.8 Due 91 – 120 days 0.5 – 0.5 Due 121 days and more 0.8 (0.2) 0.6 9.2 (0.2) 9.0 Allowances for impaired balances are calculated on the basis of management’s knowledge of the tenants, business and the market. (ii). Allowance for impaired balances The table below provides a reconciliation of changes in allowances for impaired balances: 31 December 2016 £m 31 December 2015 £m Opening balance 0.2 0.5 Additions 0.7 1.2 Written off as a bad debt (0.1) (0.2) Released (0.1) (1.3) Closing balance 0.7 0.2 The Board believes that the unimpaired amounts that are past due by more than 30 days are still collectible in full, based on historical payment behaviour. Strategic report G overnance Fin an cials A dditional inform ation Kennedy Wilson Europe Real Estate Plc Annual Report and Accounts 2016 123
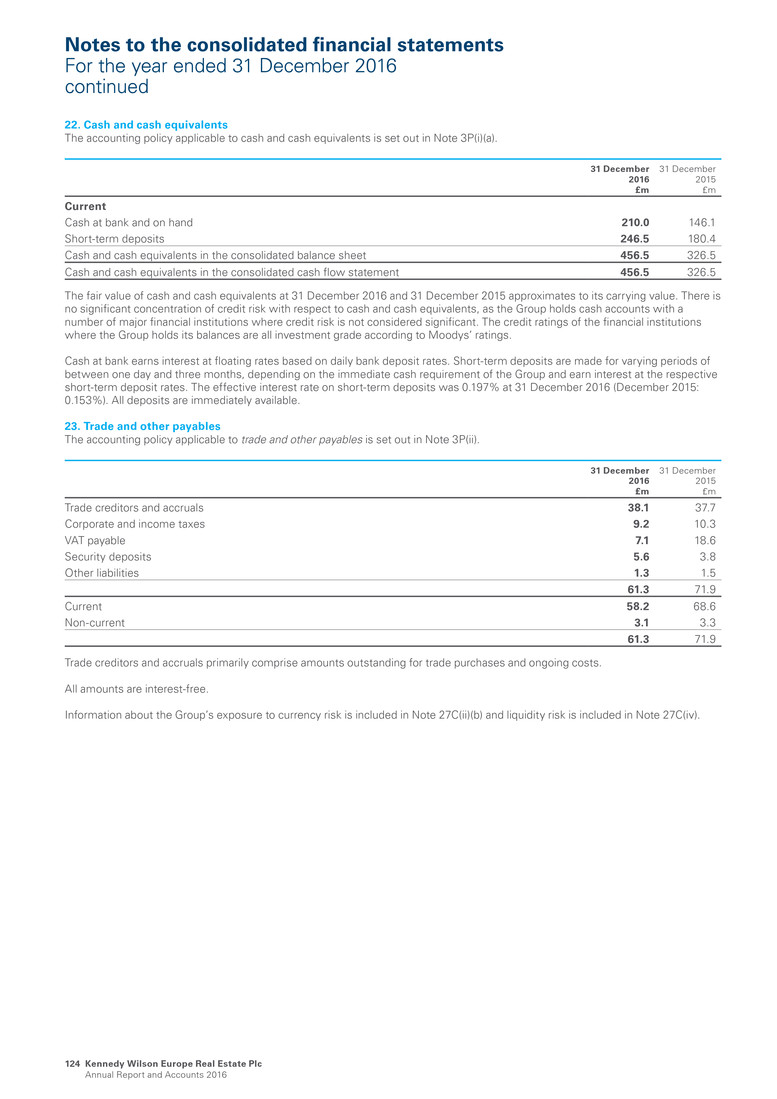
22. Cash and cash equivalents The accounting policy applicable to cash and cash equivalents is set out in Note 3P(i)(a). 31 December 2016 £m 31 December 2015 £m Current Cash at bank and on hand 210.0 146.1 Short-term deposits 246.5 180.4 Cash and cash equivalents in the consolidated balance sheet 456.5 326.5 Cash and cash equivalents in the consolidated cash flow statement 456.5 326.5 The fair value of cash and cash equivalents at 31 December 2016 and 31 December 2015 approximates to its carrying value. There is no significant concentration of credit risk with respect to cash and cash equivalents, as the Group holds cash accounts with a number of major financial institutions where credit risk is not considered significant. The credit ratings of the financial institutions where the Group holds its balances are all investment grade according to Moodys’ ratings. Cash at bank earns interest at floating rates based on daily bank deposit rates. Short-term deposits are made for varying periods of between one day and three months, depending on the immediate cash requirement of the Group and earn interest at the respective short-term deposit rates. The effective interest rate on short-term deposits was 0.197% at 31 December 2016 (December 2015: 0.153%). All deposits are immediately available. 23. Trade and other payables The accounting policy applicable to trade and other payables is set out in Note 3P(ii). 31 December 2016 £m 31 December 2015 £m Trade creditors and accruals 38.1 37.7 Corporate and income taxes 9.2 10.3 VAT payable 7.1 18.6 Security deposits 5.6 3.8 Other liabilities 1.3 1.5 61.3 71.9 Current 58.2 68.6 Non-current 3.1 3.3 61.3 71.9 Trade creditors and accruals primarily comprise amounts outstanding for trade purchases and ongoing costs. All amounts are interest-free. Information about the Group’s exposure to currency risk is included in Note 27C(ii)(b) and liquidity risk is included in Note 27C(iv). Notes to the consolidated financial statements For the year ended 31 December 2016 continued Kennedy Wilson Europe Real Estate Plc Annual Report and Accounts 2016 124
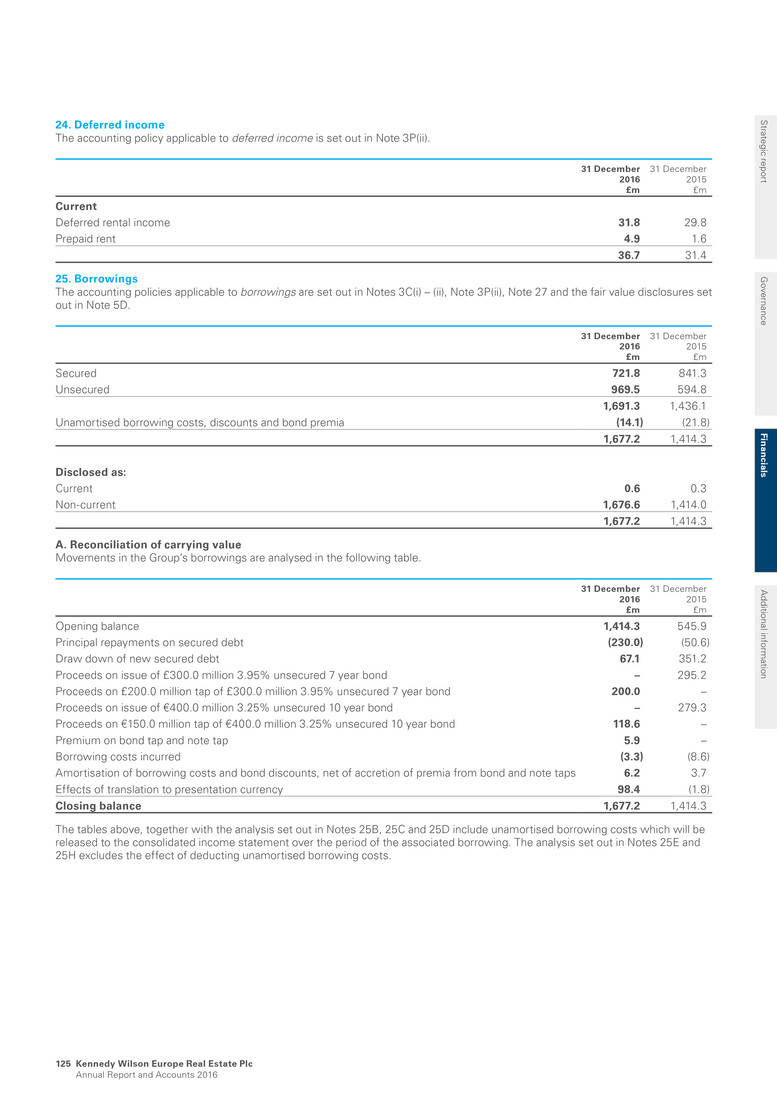
24. Deferred income The accounting policy applicable to deferred income is set out in Note 3P(ii). 31 December 2016 £m 31 December 2015 £m Current Deferred rental income 31.8 29.8 Prepaid rent 4.9 1.6 36.7 31.4 25. Borrowings The accounting policies applicable to borrowings are set out in Notes 3C(i) – (ii), Note 3P(ii), Note 27 and the fair value disclosures set out in Note 5D. 31 December 2016 £m 31 December 2015 £m Secured 721.8 841.3 Unsecured 969.5 594.8 1,691.3 1,436.1 Unamortised borrowing costs, discounts and bond premia (14.1) (21.8) 1,677.2 1,414.3 Disclosed as: Current 0.6 0.3 Non-current 1,676.6 1,414.0 1,677.2 1,414.3 A. Reconciliation of carrying value Movements in the Group’s borrowings are analysed in the following table. 31 December 2016 £m 31 December 2015 £m Opening balance 1,414.3 545.9 Principal repayments on secured debt (230.0) (50.6) Draw down of new secured debt 67.1 351.2 Proceeds on issue of £300.0 million 3.95% unsecured 7 year bond – 295.2 Proceeds on £200.0 million tap of £300.0 million 3.95% unsecured 7 year bond 200.0 – Proceeds on issue of €400.0 million 3.25% unsecured 10 year bond – 279.3 Proceeds on €150.0 million tap of €400.0 million 3.25% unsecured 10 year bond 118.6 – Premium on bond tap and note tap 5.9 – Borrowing costs incurred (3.3) (8.6) Amortisation of borrowing costs and bond discounts, net of accretion of premia from bond and note taps 6.2 3.7 Effects of translation to presentation currency 98.4 (1.8) Closing balance 1,677.2 1,414.3 The tables above, together with the analysis set out in Notes 25B, 25C and 25D include unamortised borrowing costs which will be released to the consolidated income statement over the period of the associated borrowing. The analysis set out in Notes 25E and 25H excludes the effect of deducting unamortised borrowing costs. Strategic report G overnance Fin an cials A dditional inform ation Kennedy Wilson Europe Real Estate Plc Annual Report and Accounts 2016 125
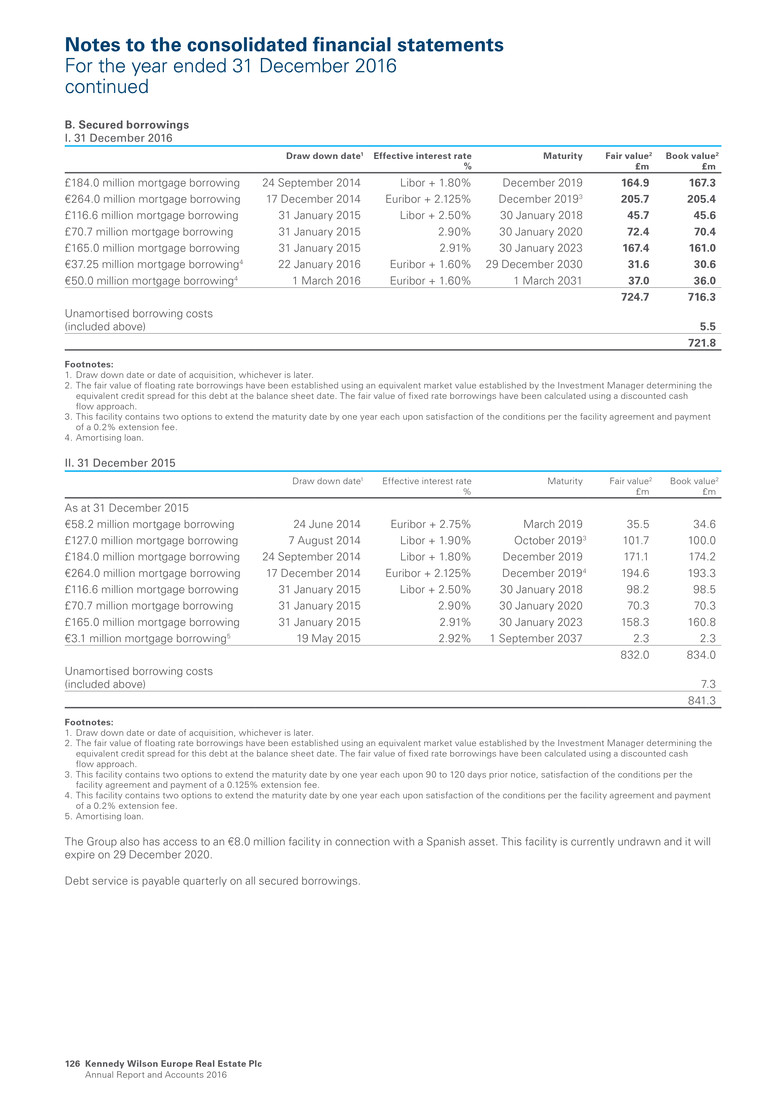
B. Secured borrowings I. 31 December 2016 Draw down date1 Effective interest rate % Maturity Fair value2 £m Book value2 £m £184.0 million mortgage borrowing 24 September 2014 Libor + 1.80% December 2019 164.9 167.3 €264.0 million mortgage borrowing 17 December 2014 Euribor + 2.125% December 20193 205.7 205.4 £116.6 million mortgage borrowing 31 January 2015 Libor + 2.50% 30 January 2018 45.7 45.6 £70.7 million mortgage borrowing 31 January 2015 2.90% 30 January 2020 72.4 70.4 £165.0 million mortgage borrowing 31 January 2015 2.91% 30 January 2023 167.4 161.0 €37.25 million mortgage borrowing4 22 January 2016 Euribor + 1.60% 29 December 2030 31.6 30.6 €50.0 million mortgage borrowing4 1 March 2016 Euribor + 1.60% 1 March 2031 37.0 36.0 724.7 716.3 Unamortised borrowing costs (included above) 5.5 721.8 Footnotes: 1. Draw down date or date of acquisition, whichever is later. 2. The fair value of floating rate borrowings have been established using an equivalent market value established by the Investment Manager determining the equivalent credit spread for this debt at the balance sheet date. The fair value of fixed rate borrowings have been calculated using a discounted cash flow approach. 3. This facility contains two options to extend the maturity date by one year each upon satisfaction of the conditions per the facility agreement and payment of a 0.2% extension fee. 4. Amortising loan. II. 31 December 2015 Draw down date1 Effective interest rate % Maturity Fair value2 £m Book value2 £m As at 31 December 2015 €58.2 million mortgage borrowing 24 June 2014 Euribor + 2.75% March 2019 35.5 34.6 £127.0 million mortgage borrowing 7 August 2014 Libor + 1.90% October 20193 101.7 100.0 £184.0 million mortgage borrowing 24 September 2014 Libor + 1.80% December 2019 171.1 174.2 €264.0 million mortgage borrowing 17 December 2014 Euribor + 2.125% December 20194 194.6 193.3 £116.6 million mortgage borrowing 31 January 2015 Libor + 2.50% 30 January 2018 98.2 98.5 £70.7 million mortgage borrowing 31 January 2015 2.90% 30 January 2020 70.3 70.3 £165.0 million mortgage borrowing 31 January 2015 2.91% 30 January 2023 158.3 160.8 €3.1 million mortgage borrowing5 19 May 2015 2.92% 1 September 2037 2.3 2.3 832.0 834.0 Unamortised borrowing costs (included above) 7.3 841.3 Footnotes: 1. Draw down date or date of acquisition, whichever is later. 2. The fair value of floating rate borrowings have been established using an equivalent market value established by the Investment Manager determining the equivalent credit spread for this debt at the balance sheet date. The fair value of fixed rate borrowings have been calculated using a discounted cash flow approach. 3. This facility contains two options to extend the maturity date by one year each upon 90 to 120 days prior notice, satisfaction of the conditions per the facility agreement and payment of a 0.125% extension fee. 4. This facility contains two options to extend the maturity date by one year each upon satisfaction of the conditions per the facility agreement and payment of a 0.2% extension fee. 5. Amortising loan. The Group also has access to an €8.0 million facility in connection with a Spanish asset. This facility is currently undrawn and it will expire on 29 December 2020. Debt service is payable quarterly on all secured borrowings. Notes to the consolidated financial statements For the year ended 31 December 2016 continued Kennedy Wilson Europe Real Estate Plc Annual Report and Accounts 2016 126
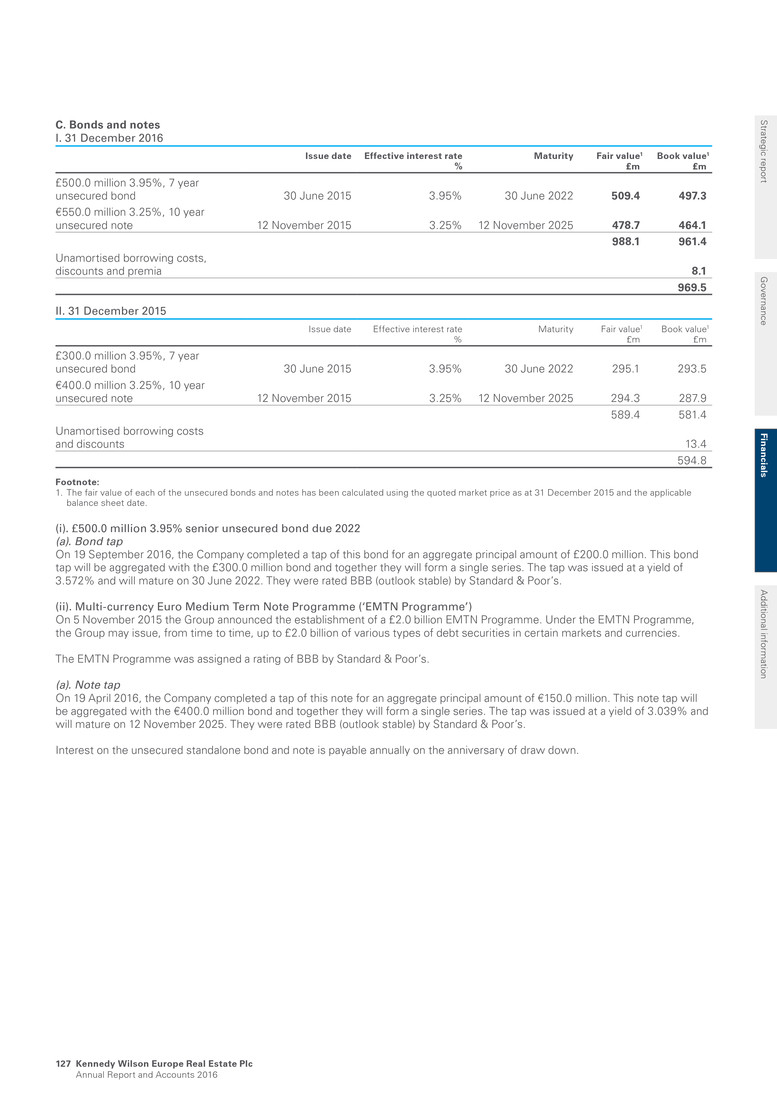
C. Bonds and notes I. 31 December 2016 Issue date Effective interest rate % Maturity Fair value1 £m Book value1 £m £500.0 million 3.95%, 7 year unsecured bond 30 June 2015 3.95% 30 June 2022 509.4 497.3 €550.0 million 3.25%, 10 year unsecured note 12 November 2015 3.25% 12 November 2025 478.7 464.1 988.1 961.4 Unamortised borrowing costs, discounts and premia 8.1 969.5 II. 31 December 2015 Issue date Effective interest rate % Maturity Fair value1 £m Book value1 £m £300.0 million 3.95%, 7 year unsecured bond 30 June 2015 3.95% 30 June 2022 295.1 293.5 €400.0 million 3.25%, 10 year unsecured note 12 November 2015 3.25% 12 November 2025 294.3 287.9 589.4 581.4 Unamortised borrowing costs and discounts 13.4 594.8 Footnote: 1. The fair value of each of the unsecured bonds and notes has been calculated using the quoted market price as at 31 December 2015 and the applicable balance sheet date. (i). £500.0 million 3.95% senior unsecured bond due 2022 (a). Bond tap On 19 September 2016, the Company completed a tap of this bond for an aggregate principal amount of £200.0 million. This bond tap will be aggregated with the £300.0 million bond and together they will form a single series. The tap was issued at a yield of 3.572% and will mature on 30 June 2022. They were rated BBB (outlook stable) by Standard & Poor’s. (ii). Multi-currency Euro Medium Term Note Programme (‘EMTN Programme’) On 5 November 2015 the Group announced the establishment of a £2.0 billion EMTN Programme. Under the EMTN Programme, the Group may issue, from time to time, up to £2.0 billion of various types of debt securities in certain markets and currencies. The EMTN Programme was assigned a rating of BBB by Standard & Poor’s. (a). Note tap On 19 April 2016, the Company completed a tap of this note for an aggregate principal amount of €150.0 million. This note tap will be aggregated with the €400.0 million bond and together they will form a single series. The tap was issued at a yield of 3.039% and will mature on 12 November 2025. They were rated BBB (outlook stable) by Standard & Poor’s. Interest on the unsecured standalone bond and note is payable annually on the anniversary of draw down. Strategic report G overnance Fin an cials A dditional inform ation Kennedy Wilson Europe Real Estate Plc Annual Report and Accounts 2016 127
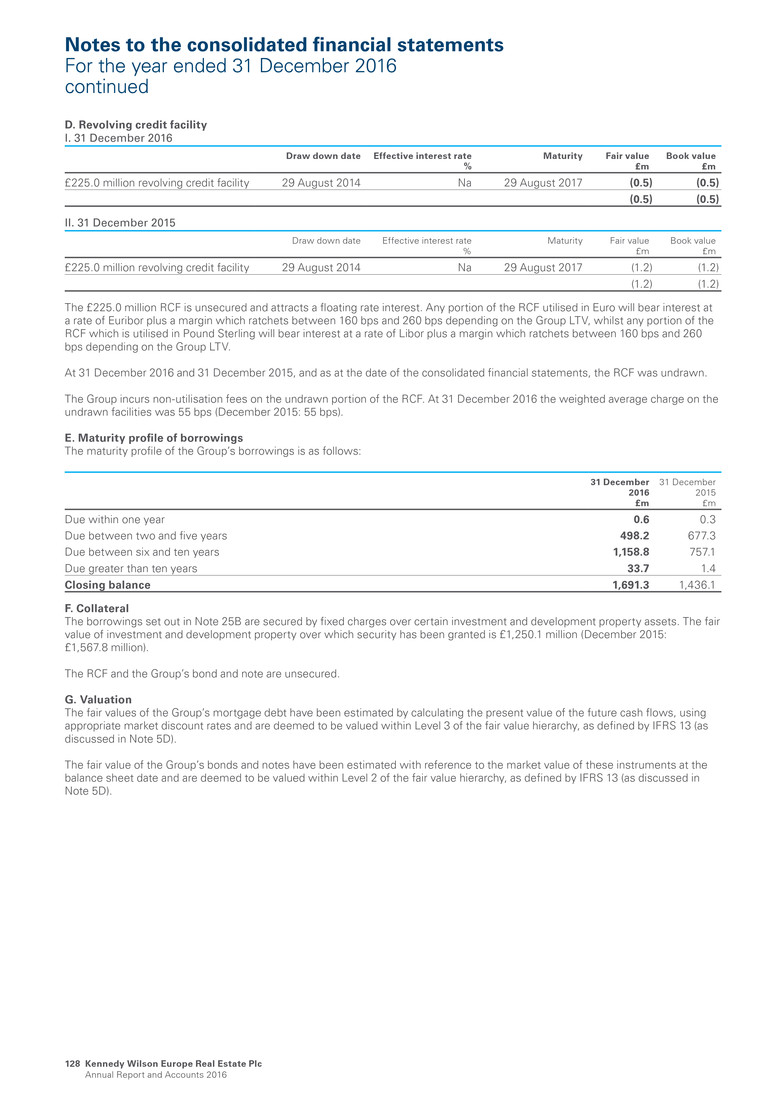
D. Revolving credit facility I. 31 December 2016 Draw down date Effective interest rate % Maturity Fair value £m Book value £m £225.0 million revolving credit facility 29 August 2014 Na 29 August 2017 (0.5) (0.5) (0.5) (0.5) II. 31 December 2015 Draw down date Effective interest rate % Maturity Fair value £m Book value £m £225.0 million revolving credit facility 29 August 2014 Na 29 August 2017 (1.2) (1.2) (1.2) (1.2) The £225.0 million RCF is unsecured and attracts a floating rate interest. Any portion of the RCF utilised in Euro will bear interest at a rate of Euribor plus a margin which ratchets between 160 bps and 260 bps depending on the Group LTV, whilst any portion of the RCF which is utilised in Pound Sterling will bear interest at a rate of Libor plus a margin which ratchets between 160 bps and 260 bps depending on the Group LTV. At 31 December 2016 and 31 December 2015, and as at the date of the consolidated financial statements, the RCF was undrawn. The Group incurs non-utilisation fees on the undrawn portion of the RCF. At 31 December 2016 the weighted average charge on the undrawn facilities was 55 bps (December 2015: 55 bps). E. Maturity profile of borrowings The maturity profile of the Group’s borrowings is as follows: 31 December 2016 £m 31 December 2015 £m Due within one year 0.6 0.3 Due between two and five years 498.2 677.3 Due between six and ten years 1,158.8 757.1 Due greater than ten years 33.7 1.4 Closing balance 1,691.3 1,436.1 F. Collateral The borrowings set out in Note 25B are secured by fixed charges over certain investment and development property assets. The fair value of investment and development property over which security has been granted is £1,250.1 million (December 2015: £1,567.8 million). The RCF and the Group’s bond and note are unsecured. G. Valuation The fair values of the Group’s mortgage debt have been estimated by calculating the present value of the future cash flows, using appropriate market discount rates and are deemed to be valued within Level 3 of the fair value hierarchy, as defined by IFRS 13 (as discussed in Note 5D). The fair value of the Group’s bonds and notes have been estimated with reference to the market value of these instruments at the balance sheet date and are deemed to be valued within Level 2 of the fair value hierarchy, as defined by IFRS 13 (as discussed in Note 5D). Notes to the consolidated financial statements For the year ended 31 December 2016 continued Kennedy Wilson Europe Real Estate Plc Annual Report and Accounts 2016 128
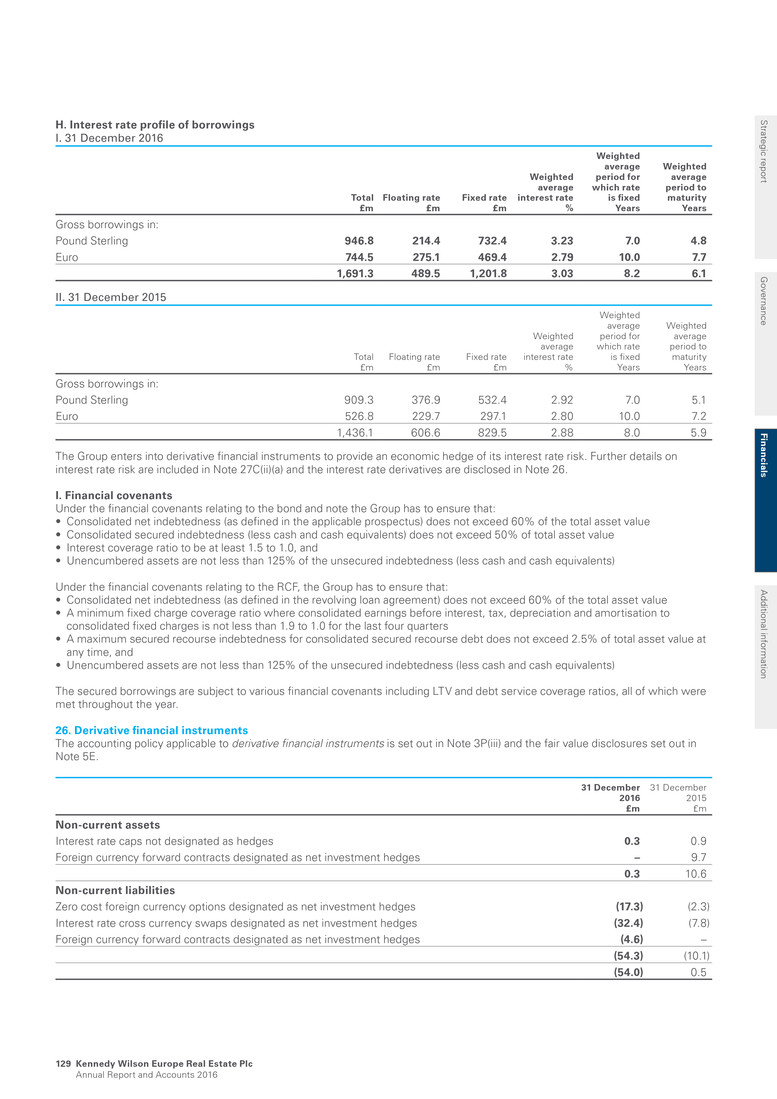
H. Interest rate profile of borrowings I. 31 December 2016 Total £m Floating rate £m Fixed rate £m Weighted average interest rate % Weighted average period for which rate is fixed Years Weighted average period to maturity Years Gross borrowings in: Pound Sterling 946.8 214.4 732.4 3.23 7.0 4.8 Euro 744.5 275.1 469.4 2.79 10.0 7.7 1,691.3 489.5 1,201.8 3.03 8.2 6.1 II. 31 December 2015 Total £m Floating rate £m Fixed rate £m Weighted average interest rate % Weighted average period for which rate is fixed Years Weighted average period to maturity Years Gross borrowings in: Pound Sterling 909.3 376.9 532.4 2.92 7.0 5.1 Euro 526.8 229.7 297.1 2.80 10.0 7.2 1,436.1 606.6 829.5 2.88 8.0 5.9 The Group enters into derivative financial instruments to provide an economic hedge of its interest rate risk. Further details on interest rate risk are included in Note 27C(ii)(a) and the interest rate derivatives are disclosed in Note 26. I. Financial covenants Under the financial covenants relating to the bond and note the Group has to ensure that: • Consolidated net indebtedness (as defined in the applicable prospectus) does not exceed 60% of the total asset value • Consolidated secured indebtedness (less cash and cash equivalents) does not exceed 50% of total asset value • Interest coverage ratio to be at least 1.5 to 1.0, and • Unencumbered assets are not less than 125% of the unsecured indebtedness (less cash and cash equivalents) Under the financial covenants relating to the RCF, the Group has to ensure that: • Consolidated net indebtedness (as defined in the revolving loan agreement) does not exceed 60% of the total asset value • A minimum fixed charge coverage ratio where consolidated earnings before interest, tax, depreciation and amortisation to consolidated fixed charges is not less than 1.9 to 1.0 for the last four quarters • A maximum secured recourse indebtedness for consolidated secured recourse debt does not exceed 2.5% of total asset value at any time, and • Unencumbered assets are not less than 125% of the unsecured indebtedness (less cash and cash equivalents) The secured borrowings are subject to various financial covenants including LTV and debt service coverage ratios, all of which were met throughout the year. 26. Derivative financial instruments The accounting policy applicable to derivative financial instruments is set out in Note 3P(iii) and the fair value disclosures set out in Note 5E. 31 December 2016 £m 31 December 2015 £m Non-current assets Interest rate caps not designated as hedges 0.3 0.9 Foreign currency forward contracts designated as net investment hedges – 9.7 0.3 10.6 Non-current liabilities Zero cost foreign currency options designated as net investment hedges (17.3) (2.3) Interest rate cross currency swaps designated as net investment hedges (32.4) (7.8) Foreign currency forward contracts designated as net investment hedges (4.6) – (54.3) (10.1) (54.0) 0.5 Strategic report G overnance Fin an cials A dditional inform ation Kennedy Wilson Europe Real Estate Plc Annual Report and Accounts 2016 129
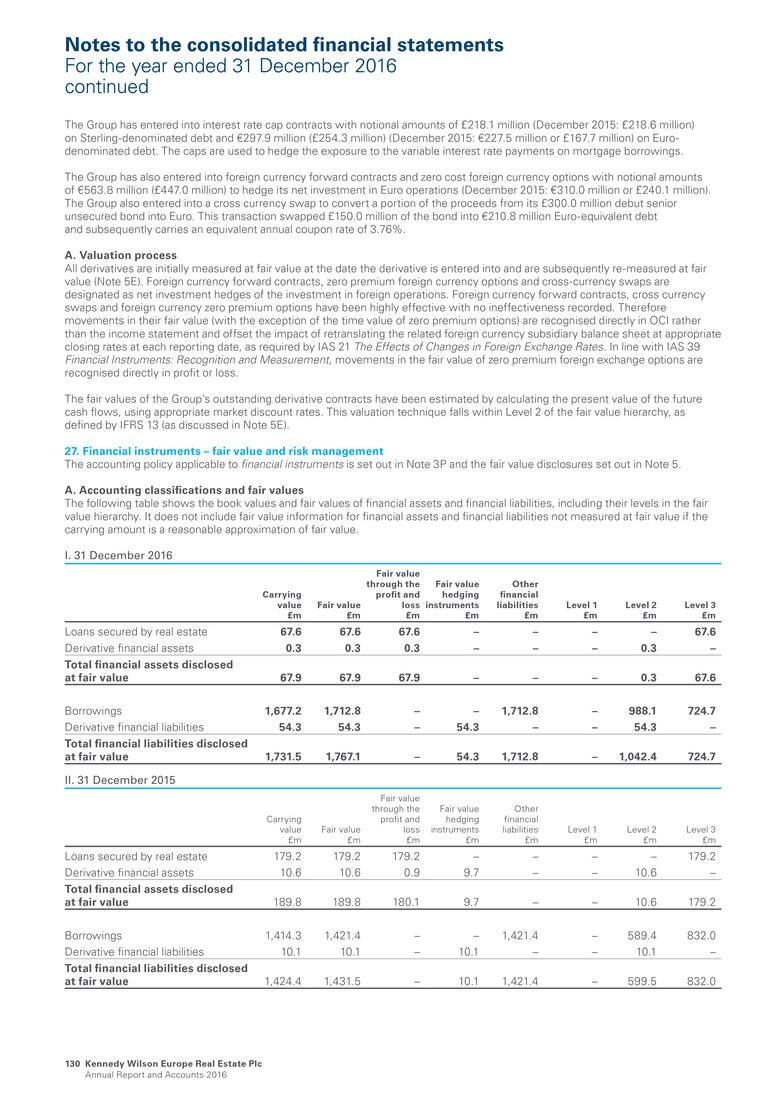
The Group has entered into interest rate cap contracts with notional amounts of £218.1 million (December 2015: £218.6 million) on Sterling-denominated debt and €297.9 million (£254.3 million) (December 2015: €227.5 million or £167.7 million) on Euro- denominated debt. The caps are used to hedge the exposure to the variable interest rate payments on mortgage borrowings. The Group has also entered into foreign currency forward contracts and zero cost foreign currency options with notional amounts of €563.8 million (£447.0 million) to hedge its net investment in Euro operations (December 2015: €310.0 million or £240.1 million). The Group also entered into a cross currency swap to convert a portion of the proceeds from its £300.0 million debut senior unsecured bond into Euro. This transaction swapped £150.0 million of the bond into €210.8 million Euro-equivalent debt and subsequently carries an equivalent annual coupon rate of 3.76%. A. Valuation process All derivatives are initially measured at fair value at the date the derivative is entered into and are subsequently re-measured at fair value (Note 5E). Foreign currency forward contracts, zero premium foreign currency options and cross-currency swaps are designated as net investment hedges of the investment in foreign operations. Foreign currency forward contracts, cross currency swaps and foreign currency zero premium options have been highly effective with no ineffectiveness recorded. Therefore movements in their fair value (with the exception of the time value of zero premium options) are recognised directly in OCI rather than the income statement and offset the impact of retranslating the related foreign currency subsidiary balance sheet at appropriate closing rates at each reporting date, as required by IAS 21 The Effects of Changes in Foreign Exchange Rates. In line with IAS 39 Financial Instruments: Recognition and Measurement, movements in the fair value of zero premium foreign exchange options are recognised directly in profit or loss. The fair values of the Group’s outstanding derivative contracts have been estimated by calculating the present value of the future cash flows, using appropriate market discount rates. This valuation technique falls within Level 2 of the fair value hierarchy, as defined by IFRS 13 (as discussed in Note 5E). 27. Financial instruments – fair value and risk management The accounting policy applicable to financial instruments is set out in Note 3P and the fair value disclosures set out in Note 5. A. Accounting classifications and fair values The following table shows the book values and fair values of financial assets and financial liabilities, including their levels in the fair value hierarchy. It does not include fair value information for financial assets and financial liabilities not measured at fair value if the carrying amount is a reasonable approximation of fair value. I. 31 December 2016 Carrying value £m Fair value £m Fair value through the profit and loss £m Fair value hedging instruments £m Other financial liabilities £m Level 1 £m Level 2 £m Level 3 £m Loans secured by real estate 67.6 67.6 67.6 – – – – 67.6 Derivative financial assets 0.3 0.3 0.3 – – – 0.3 – Total financial assets disclosed at fair value 67.9 67.9 67.9 – – – 0.3 67.6 Borrowings 1,677.2 1,712.8 – – 1,712.8 – 988.1 724.7 Derivative financial liabilities 54.3 54.3 – 54.3 – – 54.3 – Total financial liabilities disclosed at fair value 1,731.5 1,767.1 – 54.3 1,712.8 – 1,042.4 724.7 II. 31 December 2015 Carrying value £m Fair value £m Fair value through the profit and loss £m Fair value hedging instruments £m Other financial liabilities £m Level 1 £m Level 2 £m Level 3 £m Loans secured by real estate 179.2 179.2 179.2 – – – – 179.2 Derivative financial assets 10.6 10.6 0.9 9.7 – – 10.6 – Total financial assets disclosed at fair value 189.8 189.8 180.1 9.7 – – 10.6 179.2 Borrowings 1,414.3 1,421.4 – – 1,421.4 – 589.4 832.0 Derivative financial liabilities 10.1 10.1 – 10.1 – – 10.1 – Total financial liabilities disclosed at fair value 1,424.4 1,431.5 – 10.1 1,421.4 – 599.5 832.0 Notes to the consolidated financial statements For the year ended 31 December 2016 continued Kennedy Wilson Europe Real Estate Plc Annual Report and Accounts 2016 130
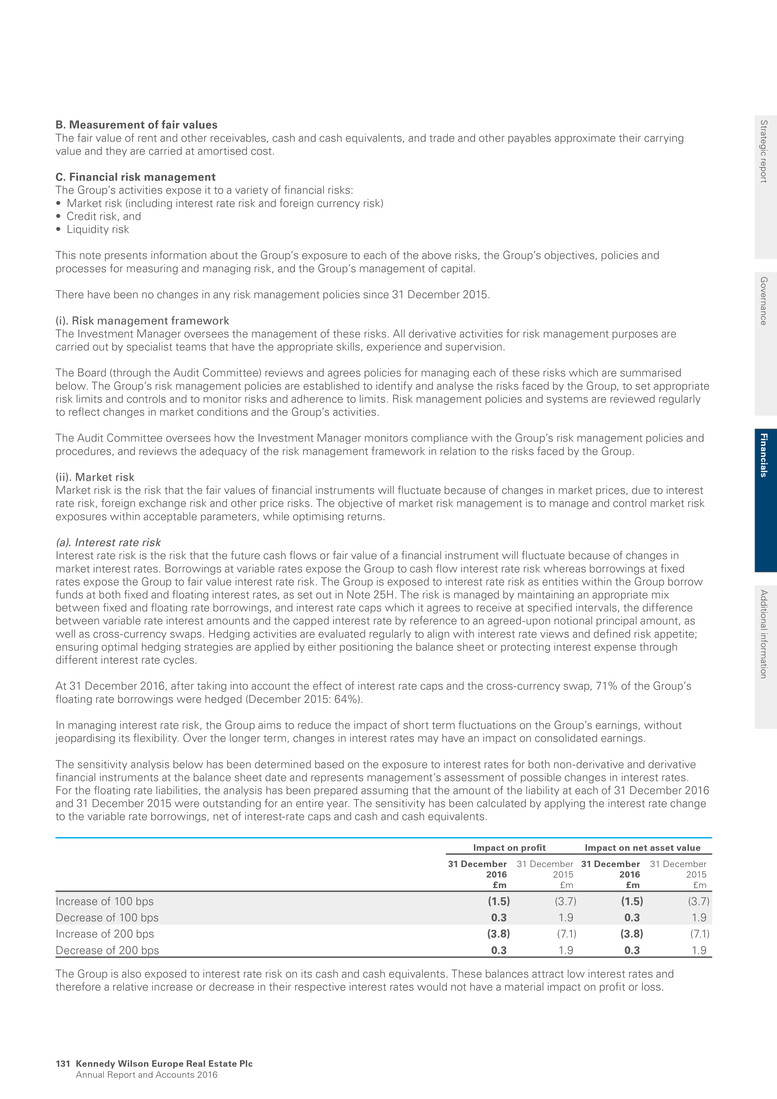
B. Measurement of fair values The fair value of rent and other receivables, cash and cash equivalents, and trade and other payables approximate their carrying value and they are carried at amortised cost. C. Financial risk management The Group’s activities expose it to a variety of financial risks: • Market risk (including interest rate risk and foreign currency risk) • Credit risk, and • Liquidity risk This note presents information about the Group’s exposure to each of the above risks, the Group’s objectives, policies and processes for measuring and managing risk, and the Group’s management of capital. There have been no changes in any risk management policies since 31 December 2015. (i). Risk management framework The Investment Manager oversees the management of these risks. All derivative activities for risk management purposes are carried out by specialist teams that have the appropriate skills, experience and supervision. The Board (through the Audit Committee) reviews and agrees policies for managing each of these risks which are summarised below. The Group’s risk management policies are established to identify and analyse the risks faced by the Group, to set appropriate risk limits and controls and to monitor risks and adherence to limits. Risk management policies and systems are reviewed regularly to reflect changes in market conditions and the Group’s activities. The Audit Committee oversees how the Investment Manager monitors compliance with the Group’s risk management policies and procedures, and reviews the adequacy of the risk management framework in relation to the risks faced by the Group. (ii). Market risk Market risk is the risk that the fair values of financial instruments will fluctuate because of changes in market prices, due to interest rate risk, foreign exchange risk and other price risks. The objective of market risk management is to manage and control market risk exposures within acceptable parameters, while optimising returns. (a). Interest rate risk Interest rate risk is the risk that the future cash flows or fair value of a financial instrument will fluctuate because of changes in market interest rates. Borrowings at variable rates expose the Group to cash flow interest rate risk whereas borrowings at fixed rates expose the Group to fair value interest rate risk. The Group is exposed to interest rate risk as entities within the Group borrow funds at both fixed and floating interest rates, as set out in Note 25H. The risk is managed by maintaining an appropriate mix between fixed and floating rate borrowings, and interest rate caps which it agrees to receive at specified intervals, the difference between variable rate interest amounts and the capped interest rate by reference to an agreed-upon notional principal amount, as well as cross-currency swaps. Hedging activities are evaluated regularly to align with interest rate views and defined risk appetite; ensuring optimal hedging strategies are applied by either positioning the balance sheet or protecting interest expense through different interest rate cycles. At 31 December 2016, after taking into account the effect of interest rate caps and the cross-currency swap, 71% of the Group’s floating rate borrowings were hedged (December 2015: 64%). In managing interest rate risk, the Group aims to reduce the impact of short term fluctuations on the Group’s earnings, without jeopardising its flexibility. Over the longer term, changes in interest rates may have an impact on consolidated earnings. The sensitivity analysis below has been determined based on the exposure to interest rates for both non-derivative and derivative financial instruments at the balance sheet date and represents management’s assessment of possible changes in interest rates. For the floating rate liabilities, the analysis has been prepared assuming that the amount of the liability at each of 31 December 2016 and 31 December 2015 were outstanding for an entire year. The sensitivity has been calculated by applying the interest rate change to the variable rate borrowings, net of interest-rate caps and cash and cash equivalents. Impact on profit Impact on net asset value 31 December 2016 £m 31 December 2015 £m 31 December 2016 £m 31 December 2015 £m Increase of 100 bps (1.5) (3.7) (1.5) (3.7) Decrease of 100 bps 0.3 1.9 0.3 1.9 Increase of 200 bps (3.8) (7.1) (3.8) (7.1) Decrease of 200 bps 0.3 1.9 0.3 1.9 The Group is also exposed to interest rate risk on its cash and cash equivalents. These balances attract low interest rates and therefore a relative increase or decrease in their respective interest rates would not have a material impact on profit or loss. Strategic report G overnance Fin an cials A dditional inform ation Kennedy Wilson Europe Real Estate Plc Annual Report and Accounts 2016 131
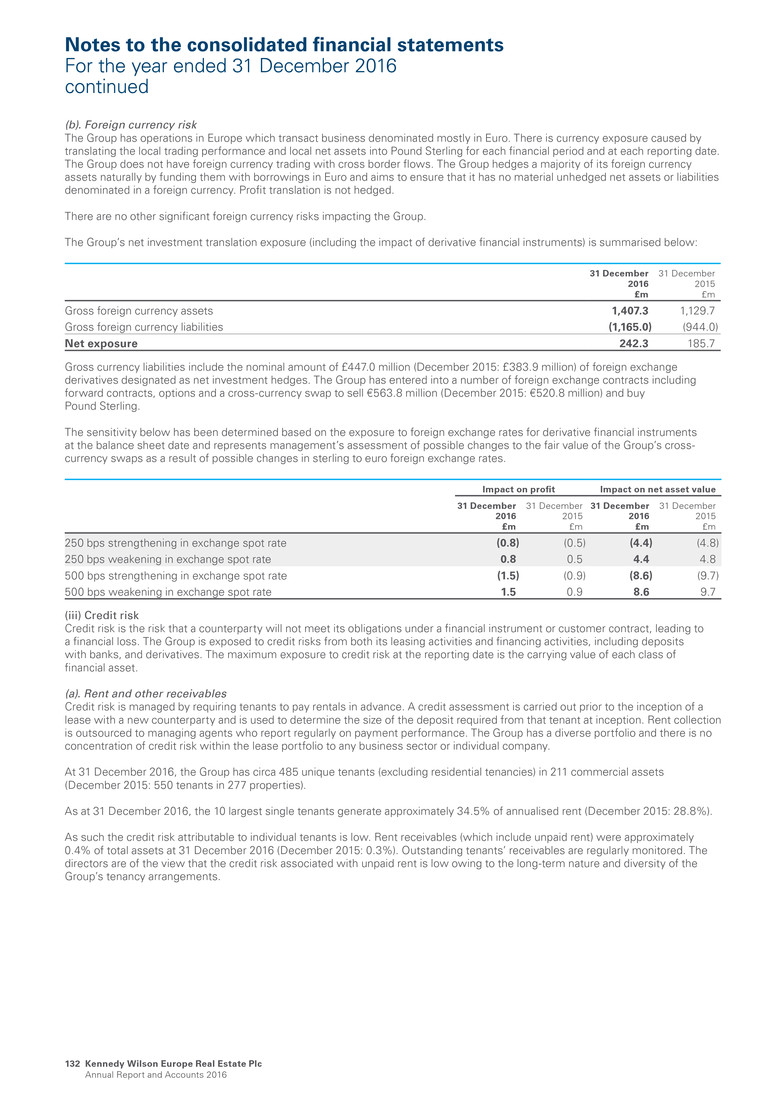
(b). Foreign currency risk The Group has operations in Europe which transact business denominated mostly in Euro. There is currency exposure caused by translating the local trading performance and local net assets into Pound Sterling for each financial period and at each reporting date. The Group does not have foreign currency trading with cross border flows. The Group hedges a majority of its foreign currency assets naturally by funding them with borrowings in Euro and aims to ensure that it has no material unhedged net assets or liabilities denominated in a foreign currency. Profit translation is not hedged. There are no other significant foreign currency risks impacting the Group. The Group’s net investment translation exposure (including the impact of derivative financial instruments) is summarised below: 31 December 2016 £m 31 December 2015 £m Gross foreign currency assets 1,407.3 1,129.7 Gross foreign currency liabilities (1,165.0) (944.0) Net exposure 242.3 185.7 Gross currency liabilities include the nominal amount of £447.0 million (December 2015: £383.9 million) of foreign exchange derivatives designated as net investment hedges. The Group has entered into a number of foreign exchange contracts including forward contracts, options and a cross-currency swap to sell €563.8 million (December 2015: €520.8 million) and buy Pound Sterling. The sensitivity below has been determined based on the exposure to foreign exchange rates for derivative financial instruments at the balance sheet date and represents management’s assessment of possible changes to the fair value of the Group’s cross- currency swaps as a result of possible changes in sterling to euro foreign exchange rates. Impact on profit Impact on net asset value 31 December 2016 £m 31 December 2015 £m 31 December 2016 £m 31 December 2015 £m 250 bps strengthening in exchange spot rate (0.8) (0.5) (4.4) (4.8) 250 bps weakening in exchange spot rate 0.8 0.5 4.4 4.8 500 bps strengthening in exchange spot rate (1.5) (0.9) (8.6) (9.7) 500 bps weakening in exchange spot rate 1.5 0.9 8.6 9.7 (iii) Credit risk Credit risk is the risk that a counterparty will not meet its obligations under a financial instrument or customer contract, leading to a financial loss. The Group is exposed to credit risks from both its leasing activities and financing activities, including deposits with banks, and derivatives. The maximum exposure to credit risk at the reporting date is the carrying value of each class of financial asset. (a). Rent and other receivables Credit risk is managed by requiring tenants to pay rentals in advance. A credit assessment is carried out prior to the inception of a lease with a new counterparty and is used to determine the size of the deposit required from that tenant at inception. Rent collection is outsourced to managing agents who report regularly on payment performance. The Group has a diverse portfolio and there is no concentration of credit risk within the lease portfolio to any business sector or individual company. At 31 December 2016, the Group has circa 485 unique tenants (excluding residential tenancies) in 211 commercial assets (December 2015: 550 tenants in 277 properties). As at 31 December 2016, the 10 largest single tenants generate approximately 34.5% of annualised rent (December 2015: 28.8%). As such the credit risk attributable to individual tenants is low. Rent receivables (which include unpaid rent) were approximately 0.4% of total assets at 31 December 2016 (December 2015: 0.3%). Outstanding tenants’ receivables are regularly monitored. The directors are of the view that the credit risk associated with unpaid rent is low owing to the long-term nature and diversity of the Group’s tenancy arrangements. Notes to the consolidated financial statements For the year ended 31 December 2016 continued Kennedy Wilson Europe Real Estate Plc Annual Report and Accounts 2016 132
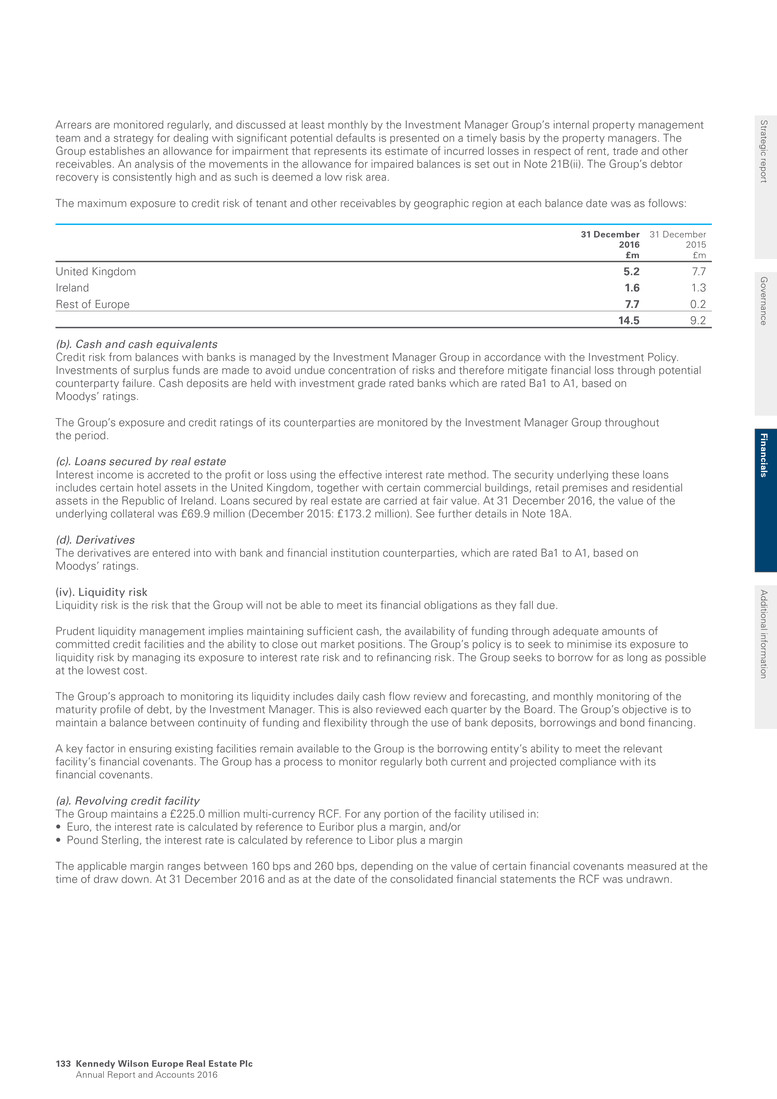
Arrears are monitored regularly, and discussed at least monthly by the Investment Manager Group’s internal property management team and a strategy for dealing with significant potential defaults is presented on a timely basis by the property managers. The Group establishes an allowance for impairment that represents its estimate of incurred losses in respect of rent, trade and other receivables. An analysis of the movements in the allowance for impaired balances is set out in Note 21B(ii). The Group’s debtor recovery is consistently high and as such is deemed a low risk area. The maximum exposure to credit risk of tenant and other receivables by geographic region at each balance date was as follows: 31 December 2016 £m 31 December 2015 £m United Kingdom 5.2 7.7 Ireland 1.6 1.3 Rest of Europe 7.7 0.2 14.5 9.2 (b). Cash and cash equivalents Credit risk from balances with banks is managed by the Investment Manager Group in accordance with the Investment Policy. Investments of surplus funds are made to avoid undue concentration of risks and therefore mitigate financial loss through potential counterparty failure. Cash deposits are held with investment grade rated banks which are rated Ba1 to A1, based on Moodys’ ratings. The Group’s exposure and credit ratings of its counterparties are monitored by the Investment Manager Group throughout the period. (c). Loans secured by real estate Interest income is accreted to the profit or loss using the effective interest rate method. The security underlying these loans includes certain hotel assets in the United Kingdom, together with certain commercial buildings, retail premises and residential assets in the Republic of Ireland. Loans secured by real estate are carried at fair value. At 31 December 2016, the value of the underlying collateral was £69.9 million (December 2015: £173.2 million). See further details in Note 18A. (d). Derivatives The derivatives are entered into with bank and financial institution counterparties, which are rated Ba1 to A1, based on Moodys’ ratings. (iv). Liquidity risk Liquidity risk is the risk that the Group will not be able to meet its financial obligations as they fall due. Prudent liquidity management implies maintaining sufficient cash, the availability of funding through adequate amounts of committed credit facilities and the ability to close out market positions. The Group’s policy is to seek to minimise its exposure to liquidity risk by managing its exposure to interest rate risk and to refinancing risk. The Group seeks to borrow for as long as possible at the lowest cost. The Group’s approach to monitoring its liquidity includes daily cash flow review and forecasting, and monthly monitoring of the maturity profile of debt, by the Investment Manager. This is also reviewed each quarter by the Board. The Group’s objective is to maintain a balance between continuity of funding and flexibility through the use of bank deposits, borrowings and bond financing. A key factor in ensuring existing facilities remain available to the Group is the borrowing entity’s ability to meet the relevant facility’s financial covenants. The Group has a process to monitor regularly both current and projected compliance with its financial covenants. (a). Revolving credit facility The Group maintains a £225.0 million multi-currency RCF. For any portion of the facility utilised in: • Euro, the interest rate is calculated by reference to Euribor plus a margin, and/or • Pound Sterling, the interest rate is calculated by reference to Libor plus a margin The applicable margin ranges between 160 bps and 260 bps, depending on the value of certain financial covenants measured at the time of draw down. At 31 December 2016 and as at the date of the consolidated financial statements the RCF was undrawn. Strategic report G overnance Fin an cials A dditional inform ation Kennedy Wilson Europe Real Estate Plc Annual Report and Accounts 2016 133
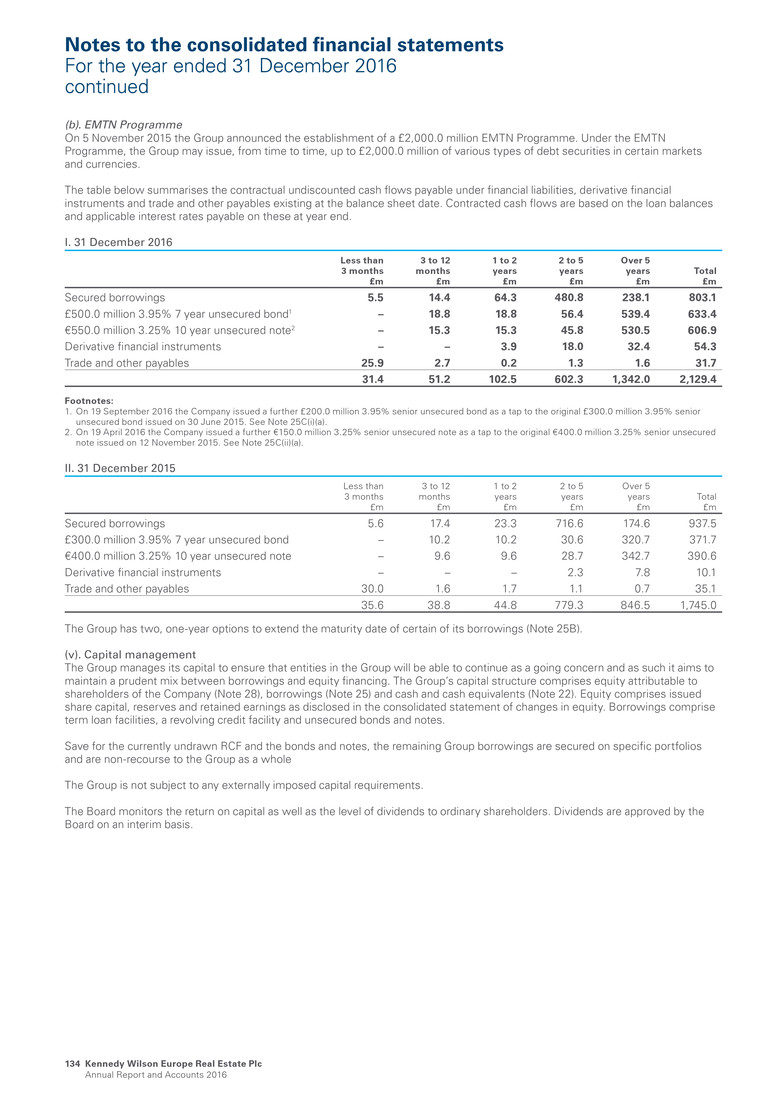
(b). EMTN Programme On 5 November 2015 the Group announced the establishment of a £2,000.0 million EMTN Programme. Under the EMTN Programme, the Group may issue, from time to time, up to £2,000.0 million of various types of debt securities in certain markets and currencies. The table below summarises the contractual undiscounted cash flows payable under financial liabilities, derivative financial instruments and trade and other payables existing at the balance sheet date. Contracted cash flows are based on the loan balances and applicable interest rates payable on these at year end. I. 31 December 2016 Less than 3 months £m 3 to 12 months £m 1 to 2 years £m 2 to 5 years £m Over 5 years £m Total £m Secured borrowings 5.5 14.4 64.3 480.8 238.1 803.1 £500.0 million 3.95% 7 year unsecured bond1 – 18.8 18.8 56.4 539.4 633.4 €550.0 million 3.25% 10 year unsecured note2 – 15.3 15.3 45.8 530.5 606.9 Derivative financial instruments – – 3.9 18.0 32.4 54.3 Trade and other payables 25.9 2.7 0.2 1.3 1.6 31.7 31.4 51.2 102.5 602.3 1,342.0 2,129.4 Footnotes: 1. On 19 September 2016 the Company issued a further £200.0 million 3.95% senior unsecured bond as a tap to the original £300.0 million 3.95% senior unsecured bond issued on 30 June 2015. See Note 25C(i)(a). 2. On 19 April 2016 the Company issued a further €150.0 million 3.25% senior unsecured note as a tap to the original €400.0 million 3.25% senior unsecured note issued on 12 November 2015. See Note 25C(ii)(a). II. 31 December 2015 Less than 3 months £m 3 to 12 months £m 1 to 2 years £m 2 to 5 years £m Over 5 years £m Total £m Secured borrowings 5.6 17.4 23.3 716.6 174.6 937.5 £300.0 million 3.95% 7 year unsecured bond – 10.2 10.2 30.6 320.7 371.7 €400.0 million 3.25% 10 year unsecured note – 9.6 9.6 28.7 342.7 390.6 Derivative financial instruments – – – 2.3 7.8 10.1 Trade and other payables 30.0 1.6 1.7 1.1 0.7 35.1 35.6 38.8 44.8 779.3 846.5 1,745.0 The Group has two, one-year options to extend the maturity date of certain of its borrowings (Note 25B). (v). Capital management The Group manages its capital to ensure that entities in the Group will be able to continue as a going concern and as such it aims to maintain a prudent mix between borrowings and equity financing. The Group’s capital structure comprises equity attributable to shareholders of the Company (Note 28), borrowings (Note 25) and cash and cash equivalents (Note 22). Equity comprises issued share capital, reserves and retained earnings as disclosed in the consolidated statement of changes in equity. Borrowings comprise term loan facilities, a revolving credit facility and unsecured bonds and notes. Save for the currently undrawn RCF and the bonds and notes, the remaining Group borrowings are secured on specific portfolios and are non-recourse to the Group as a whole The Group is not subject to any externally imposed capital requirements. The Board monitors the return on capital as well as the level of dividends to ordinary shareholders. Dividends are approved by the Board on an interim basis. Notes to the consolidated financial statements For the year ended 31 December 2016 continued Kennedy Wilson Europe Real Estate Plc Annual Report and Accounts 2016 134
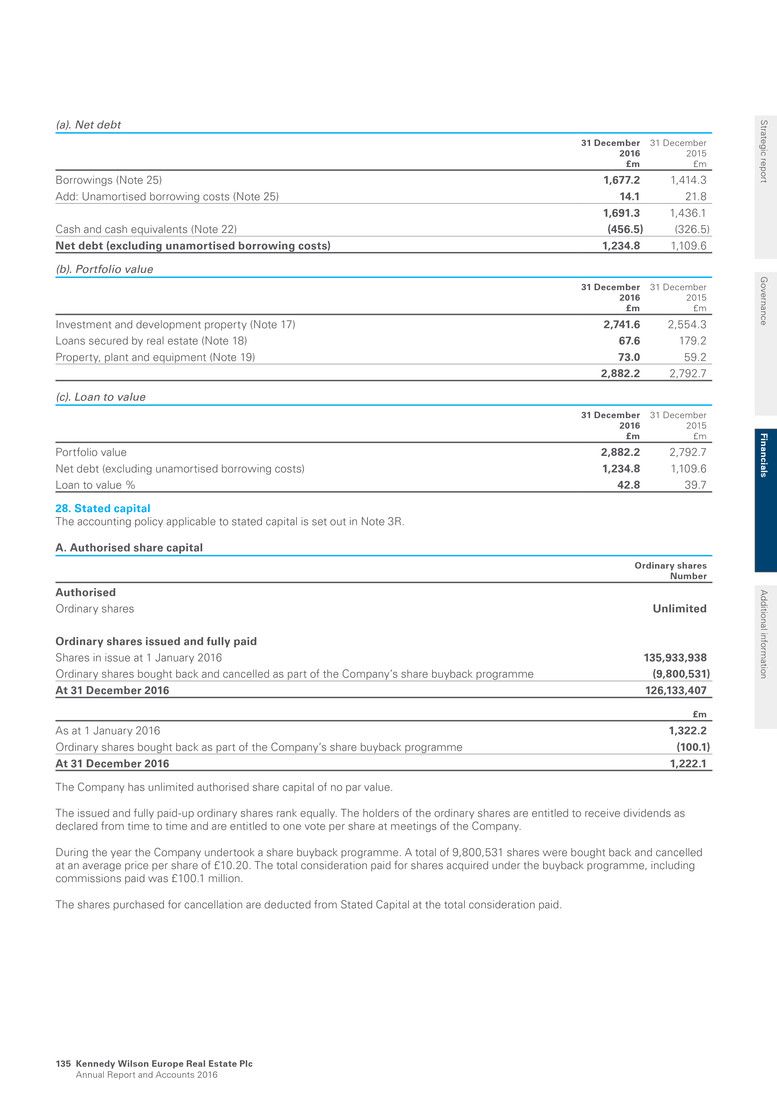
(a). Net debt 31 December 2016 £m 31 December 2015 £m Borrowings (Note 25) 1,677.2 1,414.3 Add: Unamortised borrowing costs (Note 25) 14.1 21.8 1,691.3 1,436.1 Cash and cash equivalents (Note 22) (456.5) (326.5) Net debt (excluding unamortised borrowing costs) 1,234.8 1,109.6 (b). Portfolio value 31 December 2016 £m 31 December 2015 £m Investment and development property (Note 17) 2,741.6 2,554.3 Loans secured by real estate (Note 18) 67.6 179.2 Property, plant and equipment (Note 19) 73.0 59.2 2,882.2 2,792.7 (c). Loan to value 31 December 2016 £m 31 December 2015 £m Portfolio value 2,882.2 2,792.7 Net debt (excluding unamortised borrowing costs) 1,234.8 1,109.6 Loan to value % 42.8 39.7 28. Stated capital The accounting policy applicable to stated capital is set out in Note 3R. A. Authorised share capital Ordinary shares Number Authorised Ordinary shares Unlimited Ordinary shares issued and fully paid Shares in issue at 1 January 2016 135,933,938 Ordinary shares bought back and cancelled as part of the Company’s share buyback programme (9,800,531) At 31 December 2016 126,133,407 £m As at 1 January 2016 1,322.2 Ordinary shares bought back as part of the Company’s share buyback programme (100.1) At 31 December 2016 1,222.1 The Company has unlimited authorised share capital of no par value. The issued and fully paid-up ordinary shares rank equally. The holders of the ordinary shares are entitled to receive dividends as declared from time to time and are entitled to one vote per share at meetings of the Company. During the year the Company undertook a share buyback programme. A total of 9,800,531 shares were bought back and cancelled at an average price per share of £10.20. The total consideration paid for shares acquired under the buyback programme, including commissions paid was £100.1 million. The shares purchased for cancellation are deducted from Stated Capital at the total consideration paid. Strategic report G overnance Fin an cials A dditional inform ation Kennedy Wilson Europe Real Estate Plc Annual Report and Accounts 2016 135
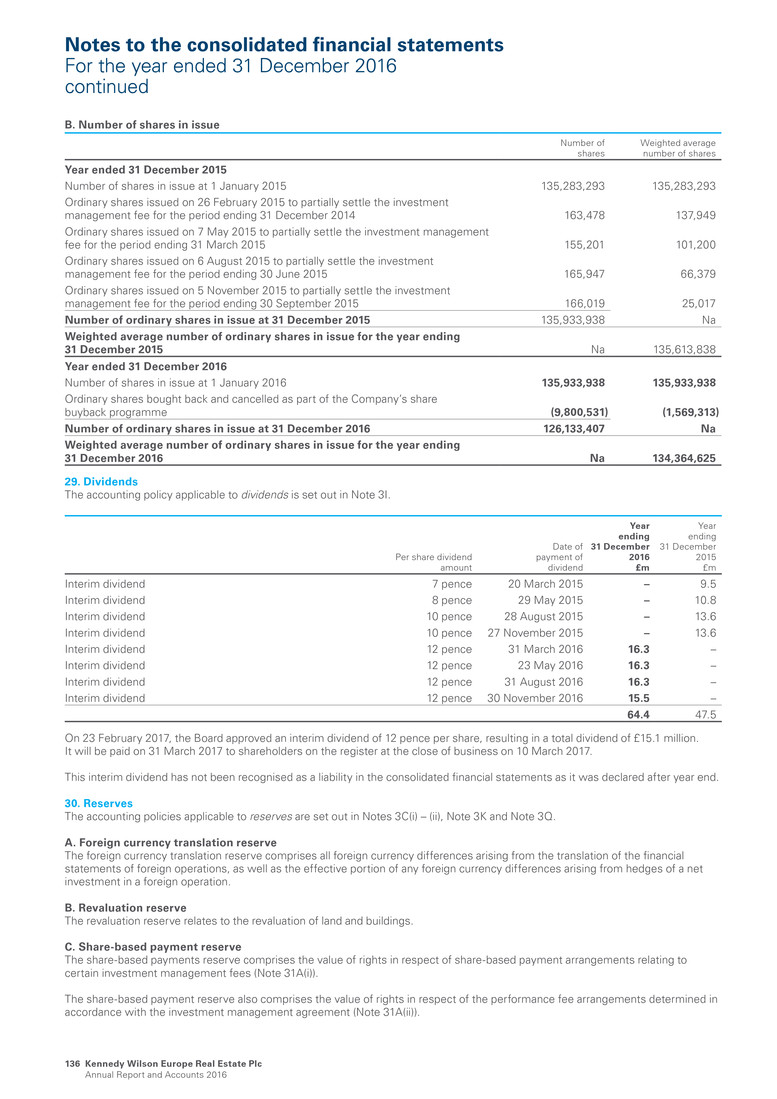
B. Number of shares in issue Number of shares Weighted average number of shares Year ended 31 December 2015 Number of shares in issue at 1 January 2015 135,283,293 135,283,293 Ordinary shares issued on 26 February 2015 to partially settle the investment management fee for the period ending 31 December 2014 163,478 137,949 Ordinary shares issued on 7 May 2015 to partially settle the investment management fee for the period ending 31 March 2015 155,201 101,200 Ordinary shares issued on 6 August 2015 to partially settle the investment management fee for the period ending 30 June 2015 165,947 66,379 Ordinary shares issued on 5 November 2015 to partially settle the investment management fee for the period ending 30 September 2015 166,019 25,017 Number of ordinary shares in issue at 31 December 2015 135,933,938 Na Weighted average number of ordinary shares in issue for the year ending 31 December 2015 Na 135,613,838 Year ended 31 December 2016 Number of shares in issue at 1 January 2016 135,933,938 135,933,938 Ordinary shares bought back and cancelled as part of the Company’s share buyback programme (9,800,531) (1,569,313) Number of ordinary shares in issue at 31 December 2016 126,133,407 Na Weighted average number of ordinary shares in issue for the year ending 31 December 2016 Na 134,364,625 29. Dividends The accounting policy applicable to dividends is set out in Note 3I. Per share dividend amount Date of payment of dividend Year ending 31 December 2016 £m Year ending 31 December 2015 £m Interim dividend 7 pence 20 March 2015 – 9.5 Interim dividend 8 pence 29 May 2015 – 10.8 Interim dividend 10 pence 28 August 2015 – 13.6 Interim dividend 10 pence 27 November 2015 – 13.6 Interim dividend 12 pence 31 March 2016 16.3 – Interim dividend 12 pence 23 May 2016 16.3 – Interim dividend 12 pence 31 August 2016 16.3 – Interim dividend 12 pence 30 November 2016 15.5 – 64.4 47.5 On 23 February 2017, the Board approved an interim dividend of 12 pence per share, resulting in a total dividend of £15.1 million. It will be paid on 31 March 2017 to shareholders on the register at the close of business on 10 March 2017. This interim dividend has not been recognised as a liability in the consolidated financial statements as it was declared after year end. 30. Reserves The accounting policies applicable to reserves are set out in Notes 3C(i) – (ii), Note 3K and Note 3Q. A. Foreign currency translation reserve The foreign currency translation reserve comprises all foreign currency differences arising from the translation of the financial statements of foreign operations, as well as the effective portion of any foreign currency differences arising from hedges of a net investment in a foreign operation. B. Revaluation reserve The revaluation reserve relates to the revaluation of land and buildings. C. Share-based payment reserve The share-based payments reserve comprises the value of rights in respect of share-based payment arrangements relating to certain investment management fees (Note 31A(i)). The share-based payment reserve also comprises the value of rights in respect of the performance fee arrangements determined in accordance with the investment management agreement (Note 31A(ii)). Notes to the consolidated financial statements For the year ended 31 December 2016 continued Kennedy Wilson Europe Real Estate Plc Annual Report and Accounts 2016 136
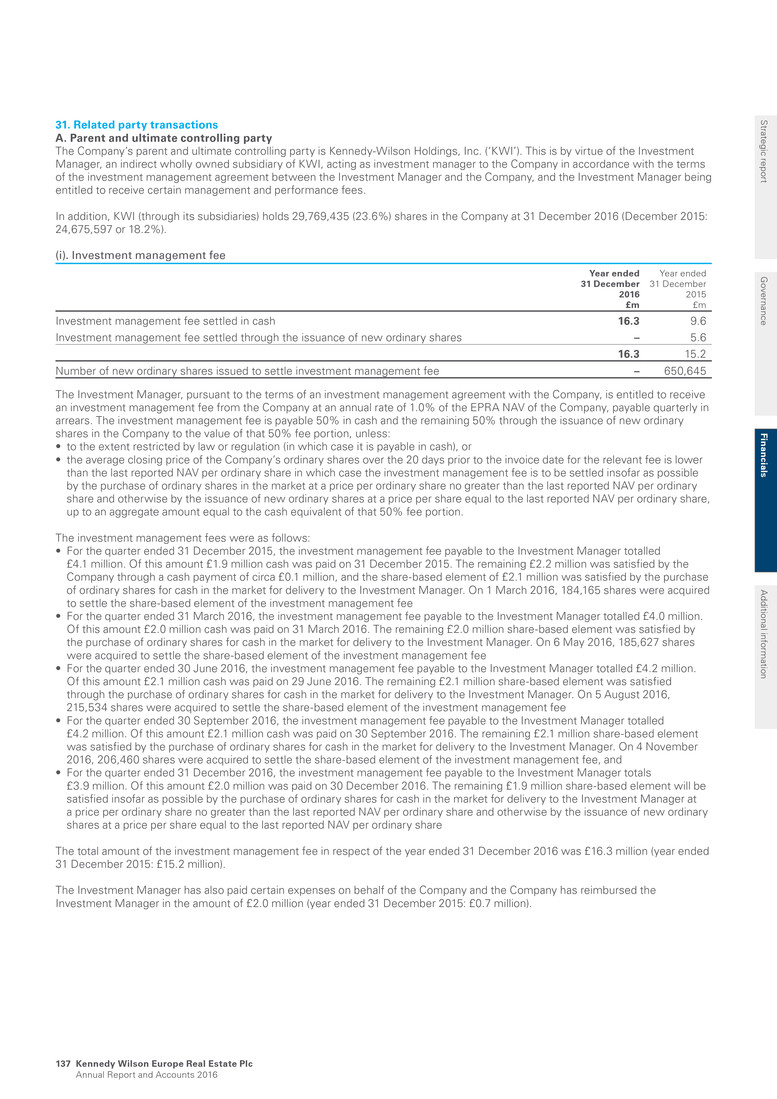
31. Related party transactions A. Parent and ultimate controlling party The Company’s parent and ultimate controlling party is Kennedy-Wilson Holdings, Inc. (‘KWI’). This is by virtue of the Investment Manager, an indirect wholly owned subsidiary of KWI, acting as investment manager to the Company in accordance with the terms of the investment management agreement between the Investment Manager and the Company, and the Investment Manager being entitled to receive certain management and performance fees. In addition, KWI (through its subsidiaries) holds 29,769,435 (23.6%) shares in the Company at 31 December 2016 (December 2015: 24,675,597 or 18.2%). (i). Investment management fee Year ended 31 December 2016 £m Year ended 31 December 2015 £m Investment management fee settled in cash 16.3 9.6 Investment management fee settled through the issuance of new ordinary shares – 5.6 16.3 15.2 Number of new ordinary shares issued to settle investment management fee – 650,645 The Investment Manager, pursuant to the terms of an investment management agreement with the Company, is entitled to receive an investment management fee from the Company at an annual rate of 1.0% of the EPRA NAV of the Company, payable quarterly in arrears. The investment management fee is payable 50% in cash and the remaining 50% through the issuance of new ordinary shares in the Company to the value of that 50% fee portion, unless: • to the extent restricted by law or regulation (in which case it is payable in cash), or • the average closing price of the Company’s ordinary shares over the 20 days prior to the invoice date for the relevant fee is lower than the last reported NAV per ordinary share in which case the investment management fee is to be settled insofar as possible by the purchase of ordinary shares in the market at a price per ordinary share no greater than the last reported NAV per ordinary share and otherwise by the issuance of new ordinary shares at a price per share equal to the last reported NAV per ordinary share, up to an aggregate amount equal to the cash equivalent of that 50% fee portion. The investment management fees were as follows: • For the quarter ended 31 December 2015, the investment management fee payable to the Investment Manager totalled £4.1 million. Of this amount £1.9 million cash was paid on 31 December 2015. The remaining £2.2 million was satisfied by the Company through a cash payment of circa £0.1 million, and the share-based element of £2.1 million was satisfied by the purchase of ordinary shares for cash in the market for delivery to the Investment Manager. On 1 March 2016, 184,165 shares were acquired to settle the share-based element of the investment management fee • For the quarter ended 31 March 2016, the investment management fee payable to the Investment Manager totalled £4.0 million. Of this amount £2.0 million cash was paid on 31 March 2016. The remaining £2.0 million share-based element was satisfied by the purchase of ordinary shares for cash in the market for delivery to the Investment Manager. On 6 May 2016, 185,627 shares were acquired to settle the share-based element of the investment management fee • For the quarter ended 30 June 2016, the investment management fee payable to the Investment Manager totalled £4.2 million. Of this amount £2.1 million cash was paid on 29 June 2016. The remaining £2.1 million share-based element was satisfied through the purchase of ordinary shares for cash in the market for delivery to the Investment Manager. On 5 August 2016, 215,534 shares were acquired to settle the share-based element of the investment management fee • For the quarter ended 30 September 2016, the investment management fee payable to the Investment Manager totalled £4.2 million. Of this amount £2.1 million cash was paid on 30 September 2016. The remaining £2.1 million share-based element was satisfied by the purchase of ordinary shares for cash in the market for delivery to the Investment Manager. On 4 November 2016, 206,460 shares were acquired to settle the share-based element of the investment management fee, and • For the quarter ended 31 December 2016, the investment management fee payable to the Investment Manager totals £3.9 million. Of this amount £2.0 million was paid on 30 December 2016. The remaining £1.9 million share-based element will be satisfied insofar as possible by the purchase of ordinary shares for cash in the market for delivery to the Investment Manager at a price per ordinary share no greater than the last reported NAV per ordinary share and otherwise by the issuance of new ordinary shares at a price per share equal to the last reported NAV per ordinary share The total amount of the investment management fee in respect of the year ended 31 December 2016 was £16.3 million (year ended 31 December 2015: £15.2 million). The Investment Manager has also paid certain expenses on behalf of the Company and the Company has reimbursed the Investment Manager in the amount of £2.0 million (year ended 31 December 2015: £0.7 million). Strategic report G overnance Fin an cials A dditional inform ation Kennedy Wilson Europe Real Estate Plc Annual Report and Accounts 2016 137

(ii). Performance fee Year ended 31 December 2016 £m Year ended 31 December 2015 £m Performance fee – 29.7 The Investment Manager, pursuant to the terms of an investment management agreement with the Company, is entitled to receive a performance fee. It is a form of remuneration used to reward the Investment Manager for generating returns to shareholders. Since the average closing share price of the Company’s ordinary shares for the twenty days immediately prior to the invoice date for the 2015 performance fee was below the last reported NAV per share the 2015 performance fee was settled by the purchase of ordinary shares in the market for the cash equivalent amount of the performance fee being £29.7 million. On 1 March 2016, 2,684,102 shares were acquired to settle the performance fee. Since the performance fee threshold has not been reached during the year ended 31 December 2016, no performance fee is payable for this year. The return to shareholders in an accounting period is the increase in the EPRA NAV per ordinary share plus the total dividends and other distributions that are declared in the accounting period (adjusted to exclude the effects of any issuance of ordinary shares during that accounting period) (“Shareholder Return”). The performance fee is calculated annually on a per ordinary share basis as 20% of the lesser of performance above two hurdles, as follows: • The excess of Shareholder Return over a 10% annual hurdle rate. The annual return hurdle resets annually to 10% of the sum of the previous accounting period’s EPRA NAV per ordinary share, and • The excess of the year end EPRA NAV per ordinary share (which is adjusted to include total dividends declared or other distributions in the accounting period and adjusted to exclude the effects of any issuance of ordinary shares during that accounting period) over the relevant high water mark. The relevant high water mark in each accounting period is the greater of – The closing EPRA NAV per ordinary share achieved in the reference period (which is the most recent accounting period in which a performance fee was payable) adjusted for total dividends or other distributions paid per ordinary share and adjusted to exclude the effects of any issue of ordinary shares during the reference period, and – The gross opening NAV (being the gross cash and non-cash proceeds of the initial issue) plus further cash and non-cash issues of ordinary shares (excluding any issues of ordinary shares in part settlement of the investment management fee or the performance fee), calculated on a per ordinary share basis as at the end of the accounting period in respect of which the performance fee is calculated The performance fee is payable either through the issuance of new ordinary shares in the Company to the value of the performance fee or by the purchase of shares in the market at a price no greater than the last reported NAV per ordinary share for delivery to the Investment Manager for an aggregate amount equal to the cash equivalent value of the performance fee. To the extent that payment of the performance fee in ordinary shares is restricted by law or regulation, it is payable in cash. Where the average closing price of the Company’s ordinary shares over the twenty days prior to the payment date for the performance fee is higher than the last reported NAV per ordinary share, the performance fee is settled through the issue of new ordinary shares, the number of which is determined by dividing the cash equivalent amount of the performance fee by the average closing share price for the twenty days immediately prior to the invoice date for the performance fee. In this circumstance, it is accounted for as a charge against income but as it is settled in shares it has no impact on the net assets of the Group. Where the average closing price of the Company’s ordinary shares over the twenty days prior to the payment date for the performance fee is below the last reported NAV per ordinary share, the performance fee is settled insofar as possible by applying an amount equal to the cash equivalent amount of the performance fee to the purchase of ordinary shares for cash in the market at a price per ordinary share no greater than the last reported NAV per ordinary share for delivery to the Investment Manager and otherwise by the issuance of new ordinary shares at a price per share equal to the last reported NAV per ordinary share. The ordinary shares delivered pursuant to the performance fee arrangements are subject to a lock-up period as follows: • One-third will be subject to a lock-up period of 12 months from the date of receipt of the ordinary shares • One-third will be subject to a lock-up period of 24 months from the date of receipt of the ordinary shares, and • One-third will be subject to a lock-up period of 36 months from the date of receipt of the ordinary shares Notes to the consolidated financial statements For the year ended 31 December 2016 continued Kennedy Wilson Europe Real Estate Plc Annual Report and Accounts 2016 138

B. Transactions with key management personnel (i). Amounts paid to key management personnel (a). Directors’ fees The Directors of the Company received total fees for the year as follows: Year ended 31 December 2016 £ Year ended 31 December 2015 £ Charlotte Valeur 145,000 145,000 William McMorrow – – Mark McNicholas 100,000 100,000 Simon Radford 100,000 100,000 Mary Ricks – – 345,000 345,000 Pursuant to the terms of the investment management agreement between the Investment Manager and the Company, each of William McMorrow and Mary Ricks has waived his/her fees as Directors of the Company. (b). Investment management fee The Investment Manager is considered to be included within the definition of key management personnel. The total Investment Management fee for the year ended 31 December 2016 is £16.3 million (year ended 31 December 2015: £15.2 million), details of which are set out in Note 31A(i). (c). Performance fee The Investment Manager, as noted above, is considered to be included within the definition of key management personnel. The total performance fee which the Investment Manager is entitled to for the year ended 31 December 2016 is £Nil (year ended 31 December 2015: £29.7 million), details of which are set out in Note 31A(ii). (d). Total amounts payable The total amount paid to key management personnel is: Year ended 31 December 2016 £m Year ended 31 December 2015 £m Investment management fee 16.3 15.2 Directors’ fees 0.3 0.3 Dividends earned by directors on shareholdings in the Company 0.2 0.1 Costs reimbursed 2.0 0.7 Performance fee – 29.7 18.8 46.0 (ii). Interests in share capital of the Company The directors’ interests in the shares of the Company are detailed below: 31 December 2016 Number of shares 31 December 2015 Number of shares Charlotte Valeur – – William McMorrow 200,149 80,916 Mark McNicholas – – Simon Radford 12,500 – Mary Ricks 280,149 120,916 492,798 201,832 Strategic report G overnance Fin an cials A dditional inform ation Kennedy Wilson Europe Real Estate Plc Annual Report and Accounts 2016 139
Included in the shareholding noted above are 119,233 restricted share units which were awarded on 1 March 2016 to each of William McMorrow and Mary Ricks. Such restricted share units were granted in respect of the shares awarded to the Investment Manager in satisfaction of the Performance Fee for the year ended 31 December 2015. The restricted share units will vest, subject to continuous service, in equal tranches over a period of three years with the first vesting to occur in March 2017 and thereafter in March 2018 and March 2019. Each restricted share unit that vests shall represent the right to receive payment of one ordinary share. There has been no other change in the Directors’ interests in the shares of the Company between 31 December 2016 and the date of the consolidated financial statements. Dividends paid on ordinary shares in the Company held by directors totalled approximately £0.2 million during the year ended 31 December 2016 (year ended 31 December 2015: £0.1 million). C. Other related parties There were no transactions with other related parties. 32. Share-based payments The accounting policy applicable to share-based payment arrangements is set out in Note 3Q. At 31 December 2016, the Group had the following share-based payment arrangements: A. Part-settlement of Investment Management fee As described in Note 31A(i), the Investment Manager is entitled to receive, pursuant to the terms of an investment management agreement with the Company, a management fee from the Company at an annual rate of 1.0% of the EPRA NAV of the Company, payable quarterly in arrears. The investment management fee is payable 50% in cash and the remaining 50% through the issuance of ordinary shares in the Company. In accordance with the investment management agreement, the fair value price for the shares issued to settle the portion of the investment management fee which is payable 50% in shares, is the average closing share price for the twenty days immediately prior to the issue date of those shares. For the year ended 31 December 2016, the Investment Management fee payable to the Investment Manager totals £16.3 million, which will be paid in cash (year ended 31 December 2015: £15.2 million of which £9.6 million was paid in cash and £5.6 million was settled through the issuance of new ordinary shares). B. Performance fee As described in Note 31A(ii), the Company will pay an annual performance fee calculated with reference to total shareholder return. The fee is the lesser of 20% of a) the excess over an annualised annual return hurdle of 10% or b) the excess of year end EPRA NAV per ordinary share over the relevant High Water Mark (being the closing EPRA NAV per Ordinary Share). Notes to the consolidated financial statements For the year ended 31 December 2016 continued Kennedy Wilson Europe Real Estate Plc Annual Report and Accounts 2016 140

33. Group entities The accounting policy applicable to group entities is set out in Note 3A(i). Except where indicated the following are indirect subsidiaries of the Company. All the Company’s direct and indirect interests are in ordinary shares. Except as noted, all are wholly owned property investment companies and are included in the consolidated financial statements. Incorporated and registered in Jersey Bizet Limited Jupiter Argyle Ltd Jupiter Friars Ltd Jupiter Holdco Ltd Jupiter Hull Limited Jupiter Marathon Ltd Jupiter Pennine Ltd Jupiter Rubislaw Ltd Jupiter Seafield Ltd Jupiter Showroom Ltd Jupiter Tradeco Ltd Jupiter Trident Ltd KW Artemis UK Properties HoldCo Ltd KW BPR Ltd KW Dukes Park Limited KW High Street Retail B Ltd KW Industrial B Ltd KW Industrial SPV 1 Ltd KW Industrial SPV 2 Ltd KW Ipswich Limited KW Office Limited KW Office SPV 1 Ltd (formerly KW Dionysus Ltd) KW Office SPV 2 Ltd (formerly KW Agamemnon Ltd) KW Office SPV 3 Ltd KW MH Limited KW Niobe Ltd KW Regional Office B Ltd KW Retail SPV 1 Ltd KW Retail SPV 2 Ltd (formerly Crumbie Ltd) KW Retail Warehouse SPV 1 Ltd KW Ringway Limited KW Trade Co Ltd (formerly Bengal Ltd) KW UK Assets Holdco Ltd* KWVF Tiger Ltd KW Towers Limited Nessun Limited Scarlatti Limited Triviata Limited Gatsby Aberdeen Limited Gatsby Capital 1 Limited Gatsby Capital 2 Limited Gatsby Capital 3 Limited Gatsby Chatham Limited Gatsby Croydon Limited Gatsby GIR Limited Gatsby GR Limited Gatsby Grocery Limited Gatsby Industrial Limited Gatsby INV 1 Limited Gatsby Middlewich Limited Gatsby PFS Limited Gatsby PH Limited Gatsby Retail Limited Gatsby Saltash Limited KW Gatsby Limited KW Italy Investments Holdco Limited* KW Olimpia Holdco Limited SEO Bartley Wood Limited SEO Bracknell Limited SEO Farnborough Limited SEO Finance Limited SEO Harlow Limited SEO Langley Limited SEO Maidenhead Limited SEO Reading Limited SEO Stockley Limited SEO Watford Limited KW Pioneer Point Limited Incorporated and registered in Republic of Ireland Cavalli Investments ICAV KW Investment Funds ICAV KW Portmarnock Ops Ltd Incorporated and registered in Luxembourg KW Lux FinanceCo S.à.r.l.* KW Real Estate Lux S.à.r.l.* KW Investment Lux S.à.r.l.* KW Investment One Lux S.à.r.l. KW Investment Two Lux S.à.r.l. KW Investment Three Lux S.à.r.l. KW Investment Four Lux S.à.r.l. KW Investment Five Lux S.à.r.l. KW Investment Six Lux S.à.r.l. KW Investment Eight Lux S.à.r.l. KW Investment Nine Lux S.à.r.l. KW Investment Ten Lux S.à.r.l. KW Investment Eleven Lux S.à.r.l. KW Investment Twelve Lux S.à.r.l. Incorporated and registered in England or Scotland St Andrews Bay Development Ltd KW Pioneer Point UK OpCo Limited Incorporated and registered in Spain Alemina Investments, S.L.** KW Spanish Holdco, SL KW LMG Propco 1, SL KW New Propco 1, SL KW Sol Propco, SL KW Sol Propco 2, SL KW Velazquez Propco1, SL KW Velazquez Propco 2, SL Leterana Servicios Y Gestiones, SL** Parque Comercial Guadalhorce, SL Incorporated and registered in the Isle of Man Kish One Limited * Directly owned ** 90% owned by the Group 34. Subsequent events A. Investment management fee On 23 February 2017 the Company approved the payment of the investment management fee of £3.9 million (for the quarter ended 31 December 2016), payable to the Investment Manager. See further details in Note 31A(i). 35. Capital commitments and contingencies A. Capital expenditure commitments At 31 December 2016 the estimated amount of authorised and contracted commitments which have not been provided for in respect of future purchases, construction and redevelopment of investment property totals £8.8 million. The estimated amount of authorised but uncontracted expenditure totals £6.7 million (December 2015: £66.1 million contracted and £14.9 million uncontracted). Strategic report G overnance Fin an cials A dditional inform ation Kennedy Wilson Europe Real Estate Plc Annual Report and Accounts 2016 141

36. Operating lease arrangements The Group has determined that all tenant leases are operating leases within the meaning of IAS 17. The Group earns rental income by leasing its investment properties to tenants under non-cancellable operating leases. Typically, single let properties are leased on terms where the tenant is responsible for repair, insurance and running costs while multi-let properties are leased on terms which include recovery of a share of service charge expenditure and insurance. The Group also let tenancies on terms which include a turnover based element of £0.4 million (year ended 31 December 2015: £0.1 million). At the reporting date, the Group had contracted with tenants to receive the following future minimum lease payments: 31 December 2016 £m 31 December 2015 £m Not later than one year 137.6 135.2 Later than one year but not more than five years 423.5 413.4 Later than five years but not more than ten years 242.4 257.1 803.5 805.7 In the United Kingdom and the Republic of Ireland standard commercial leases vary considerably between markets and locations, but are typically for a term of five to 15 years at market rent with provisions to review every five years. The weighted average unexpired lease term on commercial property at 31 December 2016 based on the lease expiry date was 8.9 years (December 2015: 9.2 years). Residential property is typically leased for periods of one year or less. Minimum lease rentals from residential property are not included in the table above. The largest single tenant at year end accounted for £11.8 million or 7.7% of the annualised rental income at 31 December 2016 (December 2015: £10.2 million or 6.7% of annualised rental income). Unoccupied property expressed as a percentage of estimated total rental value was 5.4% at 31 December 2016 (December 2015: 4.0%). 37. Assets held-for-sale The accounting policy applicable to assets held-for-sale is set out in Note 3N. Details of the accounting policies applicable to investment and development property are set out in Note 3J, whilst fair value disclosures are set out in Note 5A, as well as Note 17. The Group has identified certain of its investment properties as held-for-sale in accordance with IFRS 5. The carrying value of such assets was £59.4 million (December 2015: £51.0 million) at the balance sheet date. 38. Employee benefit expense The accounting policy applicable to employee benefit expense is set out in Note 3E. Year ended 31 December 2016 £m Year ended 31 December 2015 £m Aggregate remuneration of employees comprises: Wages and salaries 7.6 6.1 Social security costs 0.7 0.5 Other pension costs 0.1 0.1 Other employment cost 0.2 0.1 8.6 6.8 Average number of employees 386 377 Details of Directors’ emoluments are set out in Note 31B. All employees are employed by subsidiaries of the Group predominantly within the hotel operations segment. Notes to the consolidated financial statements For the year ended 31 December 2016 continued Kennedy Wilson Europe Real Estate Plc Annual Report and Accounts 2016 142
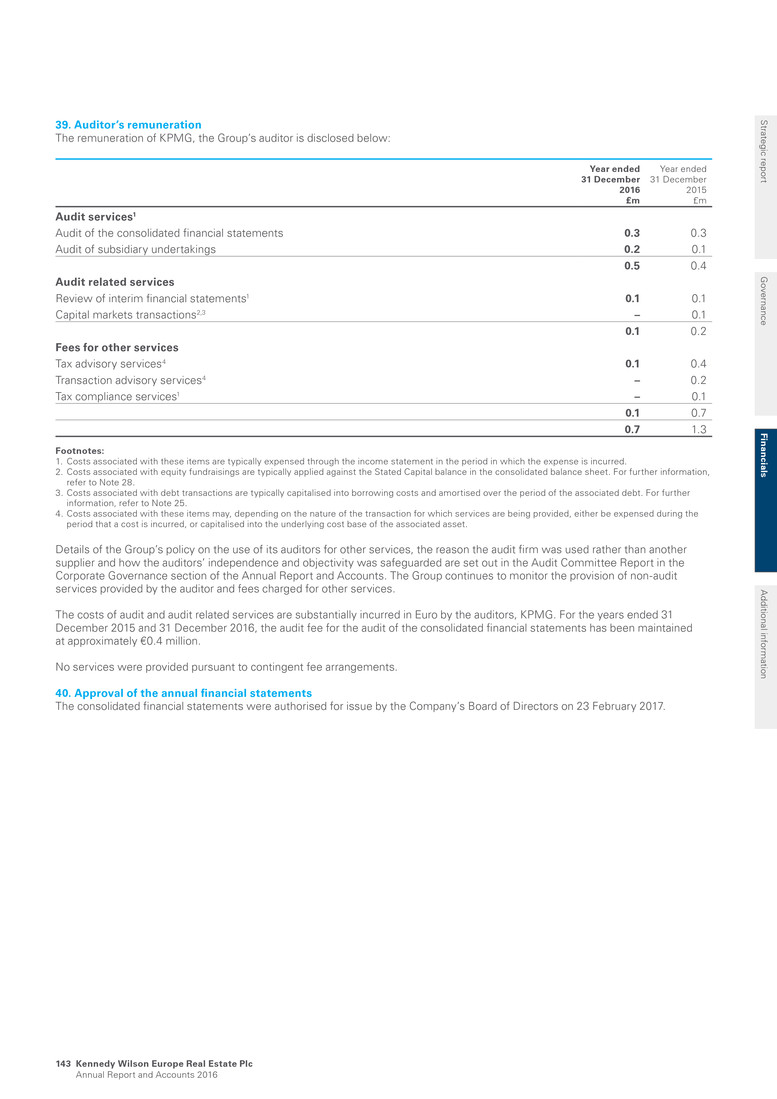
39. Auditor’s remuneration The remuneration of KPMG, the Group’s auditor is disclosed below: Year ended 31 December 2016 £m Year ended 31 December 2015 £m Audit services1 Audit of the consolidated financial statements 0.3 0.3 Audit of subsidiary undertakings 0.2 0.1 0.5 0.4 Audit related services Review of interim financial statements1 0.1 0.1 Capital markets transactions2,3 – 0.1 0.1 0.2 Fees for other services Tax advisory services4 0.1 0.4 Transaction advisory services4 – 0.2 Tax compliance services1 – 0.1 0.1 0.7 0.7 1.3 Footnotes: 1. Costs associated with these items are typically expensed through the income statement in the period in which the expense is incurred. 2. Costs associated with equity fundraisings are typically applied against the Stated Capital balance in the consolidated balance sheet. For further information, refer to Note 28. 3. Costs associated with debt transactions are typically capitalised into borrowing costs and amortised over the period of the associated debt. For further information, refer to Note 25. 4. Costs associated with these items may, depending on the nature of the transaction for which services are being provided, either be expensed during the period that a cost is incurred, or capitalised into the underlying cost base of the associated asset. Details of the Group’s policy on the use of its auditors for other services, the reason the audit firm was used rather than another supplier and how the auditors’ independence and objectivity was safeguarded are set out in the Audit Committee Report in the Corporate Governance section of the Annual Report and Accounts. The Group continues to monitor the provision of non-audit services provided by the auditor and fees charged for other services. The costs of audit and audit related services are substantially incurred in Euro by the auditors, KPMG. For the years ended 31 December 2015 and 31 December 2016, the audit fee for the audit of the consolidated financial statements has been maintained at approximately €0.4 million. No services were provided pursuant to contingent fee arrangements. 40. Approval of the annual financial statements The consolidated financial statements were authorised for issue by the Company’s Board of Directors on 23 February 2017. Strategic report G overnance Fin an cials A dditional inform ation Kennedy Wilson Europe Real Estate Plc Annual Report and Accounts 2016 143
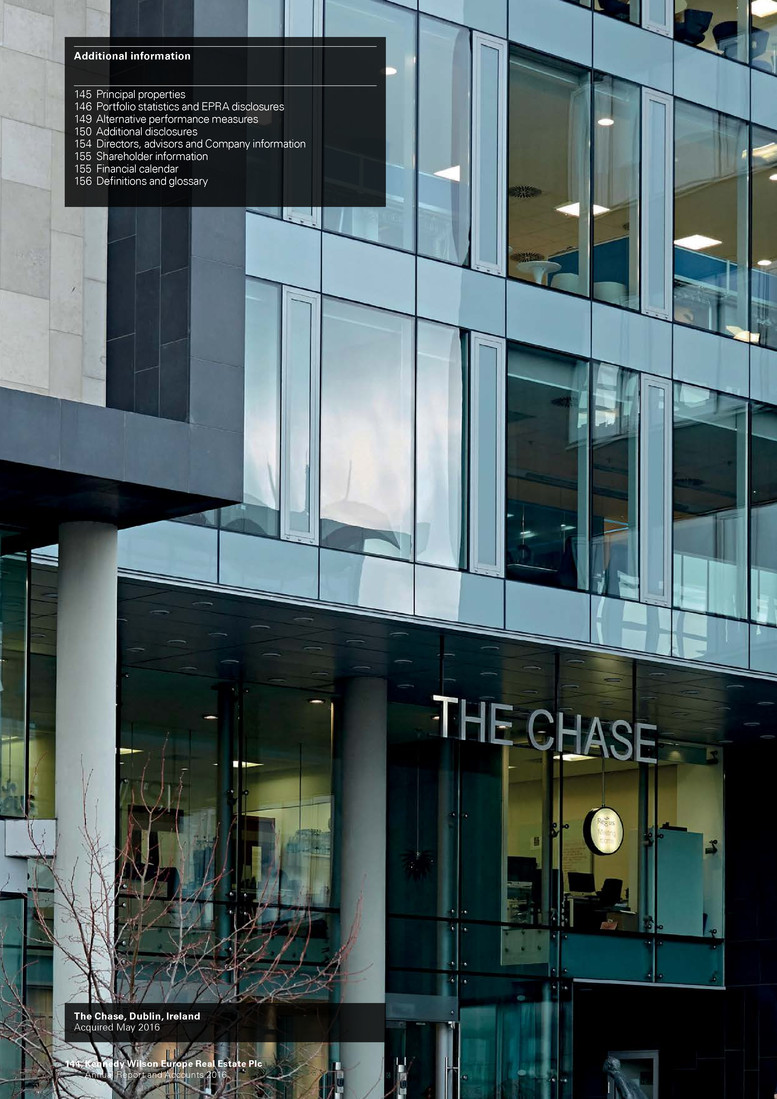
Additional information 145 Principal properties 146 Portfolio statistics and EPRA disclosures 149 Alternative performance measures 150 Additional disclosures 154 Directors, advisors and Company information 155 Shareholder information 155 Financial calendar 156 Definitions and glossary The Chase, Dublin, Ireland Acquired May 2016 144 Kennedy Wilson Europe Real Estate Plc Annual Report and Accounts 2016
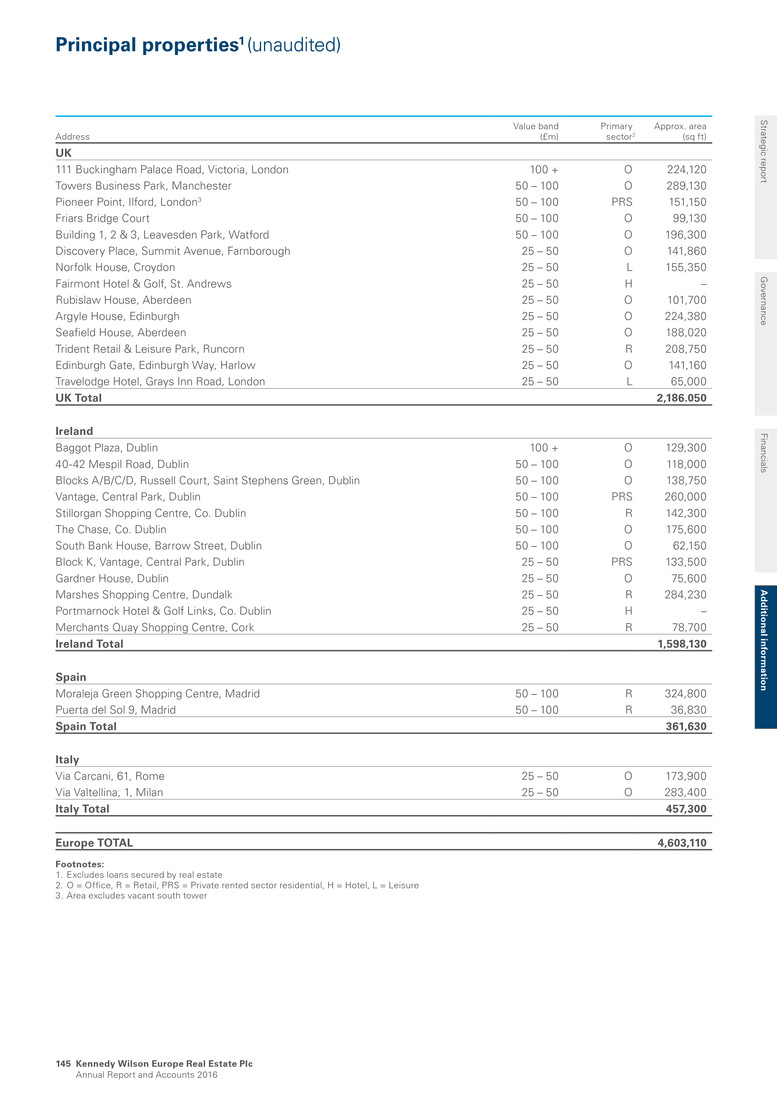
Principal properties1 (unaudited) Address Value band (£m) Primary sector2 Approx. area (sq ft) UK 111 Buckingham Palace Road, Victoria, London 100 + O 224,120 Towers Business Park, Manchester 50 – 100 O 289,130 Pioneer Point, Ilford, London3 50 – 100 PRS 151,150 Friars Bridge Court 50 – 100 O 99,130 Building 1, 2 & 3, Leavesden Park, Watford 50 – 100 O 196,300 Discovery Place, Summit Avenue, Farnborough 25 – 50 O 141,860 Norfolk House, Croydon 25 – 50 L 155,350 Fairmont Hotel & Golf, St. Andrews 25 – 50 H – Rubislaw House, Aberdeen 25 – 50 O 101,700 Argyle House, Edinburgh 25 – 50 O 224,380 Seafield House, Aberdeen 25 – 50 O 188,020 Trident Retail & Leisure Park, Runcorn 25 – 50 R 208,750 Edinburgh Gate, Edinburgh Way, Harlow 25 – 50 O 141,160 Travelodge Hotel, Grays Inn Road, London 25 – 50 L 65,000 UK Total 2,186.050 Ireland Baggot Plaza, Dublin 100 + O 129,300 40-42 Mespil Road, Dublin 50 – 100 O 118,000 Blocks A/B/C/D, Russell Court, Saint Stephens Green, Dublin 50 – 100 O 138,750 Vantage, Central Park, Dublin 50 – 100 PRS 260,000 Stillorgan Shopping Centre, Co. Dublin 50 – 100 R 142,300 The Chase, Co. Dublin 50 – 100 O 175,600 South Bank House, Barrow Street, Dublin 50 – 100 O 62,150 Block K, Vantage, Central Park, Dublin 25 – 50 PRS 133,500 Gardner House, Dublin 25 – 50 O 75,600 Marshes Shopping Centre, Dundalk 25 – 50 R 284,230 Portmarnock Hotel & Golf Links, Co. Dublin 25 – 50 H – Merchants Quay Shopping Centre, Cork 25 – 50 R 78,700 Ireland Total 1,598,130 Spain Moraleja Green Shopping Centre, Madrid 50 – 100 R 324,800 Puerta del Sol 9, Madrid 50 – 100 R 36,830 Spain Total 361,630 Italy Via Carcani, 61, Rome 25 – 50 O 173,900 Via Valtellina, 1, Milan 25 – 50 O 283,400 Italy Total 457,300 Europe TOTAL 4,603,110 Footnotes: 1. Excludes loans secured by real estate 2. O = Office, R = Retail, PRS = Private rented sector residential, H = Hotel, L = Leisure 3. Area excludes vacant south tower Strategic report G overnance Financials A d d itio n al in fo rm atio n Kennedy Wilson Europe Real Estate Plc Annual Report and Accounts 2016 145

Portfolio statistics and EPRA disclosures (unaudited) UK portfolio summary Sector Area (m sq ft) No. of assets Portfolio value1 (£m) Ann TU NOI2 (£m) EPRA TU NIY3 (%) Acq’n YOC (%) WAULT4 (years) EPRA vacancy5 (%) Office 2.7 30 830.1 54.2 6.1 6.8 4.3 3.6 Retail 1.8 98 346.8 23.8 6.4 6.9 8.1 2.4 Industrial 2.8 26 171.2 12.1 6.6 7.4 6.4 4.0 Leisure 0.4 7 89.0 5.2 5.5 6.6 12.8 2.7 Residential 0.2 1 79.6 1.5 1.7 2.9 – 17.8 Property Total 7.9 162 1,516.7 96.8 6.0 6.7 6.0 3.7 Development – – – – – – – – Hotel – 1 41.2 0.9 2.0 5.8 – – Loans – 7 44.4 5.5 11.7 9.6 – – Total/average 7.9 170 1,602.3 103.2 6.0 6.8 6.0 3.7 Irish portfolio summary Sector Area (m sq ft) No. of assets Portfolio value1 (£m) Ann TU NOI2 (£m) EPRA TU NIY3 (%) Acq’n YOC (%) WAULT4 (years) EPRA vacancy5 (%) Office 0.8 13 519.1 23.6 4.3 5.9 10.2 5.8 Retail 0.5 4 151.7 9.6 6.0 6.5 16.3 2.0 Industrial – – – – – – – – Leisure 0.0 1 3.2 0.2 5.1 6.9 16.5 – Residential 0.5 3 153.0 6.1 3.8 4.0 – 11.66 Property Total 1.8 21 827.0 39.5 4.6 5.8 11.9 7.5 Development7 – 2 22.4 – – – – – Hotel – 1 31.8 1.1 3.3 5.1 – – Loans – 3 23.2 1.1 4.5 4.0 – – Total/average 1.8 27 904.4 41.7 4.5 5.7 11.9 7.5 Spanish portfolio summary Sector Area (m sq ft) No. of assets Portfolio value1 (£m) Ann TU NOI2 (£m) EPRA TU NIY3 (%) Acq’n YOC (%) WAULT4 (years) EPRA vacancy5 (%) Retail 0.8 15 136.3 8.6 6.1 6.7 2.8 16.9 Development7 – 2 69.1 – – – – – Total/average 0.8 17 205.4 8.6 6.1 6.7 2.8 16.9 Italian portfolio summary Sector Area (m sq ft) No. of assets Portfolio value1 (£m) Ann TU NOI2 (£m) EPRA TU NIY3 (%) Acq’n YOC (%) WAULT4 (years) EPRA vacancy5 (%) Office 1.1 9 170.1 10.2 5.8 6.3 6.0 – Total/average 1.1 9 170.1 10.2 5.8 6.3 6.0 – Kennedy Wilson Europe Real Estate Plc Annual Report and Accounts 2016 146
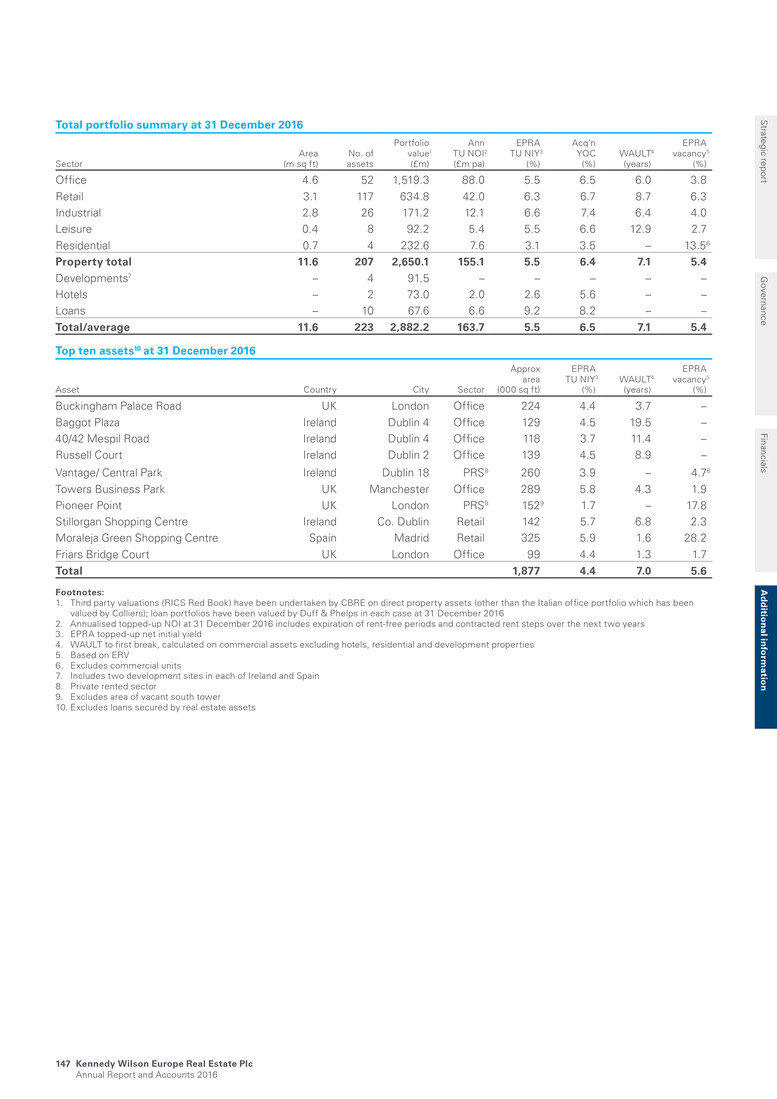
Total portfolio summary at 31 December 2016 Sector Area (m sq ft) No. of assets Portfolio value1 (£m) Ann TU NOI2 (£m pa) EPRA TU NIY3 (%) Acq’n YOC (%) WAULT4 (years) EPRA vacancy5 (%) Office 4.6 52 1,519.3 88.0 5.5 6.5 6.0 3.8 Retail 3.1 117 634.8 42.0 6.3 6.7 8.7 6.3 Industrial 2.8 26 171.2 12.1 6.6 7.4 6.4 4.0 Leisure 0.4 8 92.2 5.4 5.5 6.6 12.9 2.7 Residential 0.7 4 232.6 7.6 3.1 3.5 – 13.56 Property total 11.6 207 2,650.1 155.1 5.5 6.4 7.1 5.4 Developments7 – 4 91.5 – – – – – Hotels – 2 73.0 2.0 2.6 5.6 – – Loans – 10 67.6 6.6 9.2 8.2 – – Total/average 11.6 223 2,882.2 163.7 5.5 6.5 7.1 5.4 Top ten assets10 at 31 December 2016 Asset Country City Sector Approx area (000 sq ft) EPRA TU NIY3 (%) WAULT4 (years) EPRA vacancy5 (%) Buckingham Palace Road UK London Office 224 4.4 3.7 – Baggot Plaza Ireland Dublin 4 Office 129 4.5 19.5 – 40/42 Mespil Road Ireland Dublin 4 Office 118 3.7 11.4 – Russell Court Ireland Dublin 2 Office 139 4.5 8.9 – Vantage/ Central Park Ireland Dublin 18 PRS8 260 3.9 – 4.76 Towers Business Park UK Manchester Office 289 5.8 4.3 1.9 Pioneer Point UK London PRS8 1529 1.7 – 17.8 Stillorgan Shopping Centre Ireland Co. Dublin Retail 142 5.7 6.8 2.3 Moraleja Green Shopping Centre Spain Madrid Retail 325 5.9 1.6 28.2 Friars Bridge Court UK London Office 99 4.4 1.3 1.7 Total 1,877 4.4 7.0 5.6 Footnotes: 1. Third party valuations (RICS Red Book) have been undertaken by CBRE on direct property assets (other than the Italian office portfolio which has been valued by Colliers); loan portfolios have been valued by Duff & Phelps in each case at 31 December 2016 2. Annualised topped-up NOI at 31 December 2016 includes expiration of rent-free periods and contracted rent steps over the next two years 3. EPRA topped-up net initial yield 4. WAULT to first break, calculated on commercial assets excluding hotels, residential and development properties 5. Based on ERV 6. Excludes commercial units 7. Includes two development sites in each of Ireland and Spain 8. Private rented sector 9. Excludes area of vacant south tower 10. Excludes loans secured by real estate assets Strategic report G overnance Financials A d d itio n al in fo rm atio n Kennedy Wilson Europe Real Estate Plc Annual Report and Accounts 2016 147
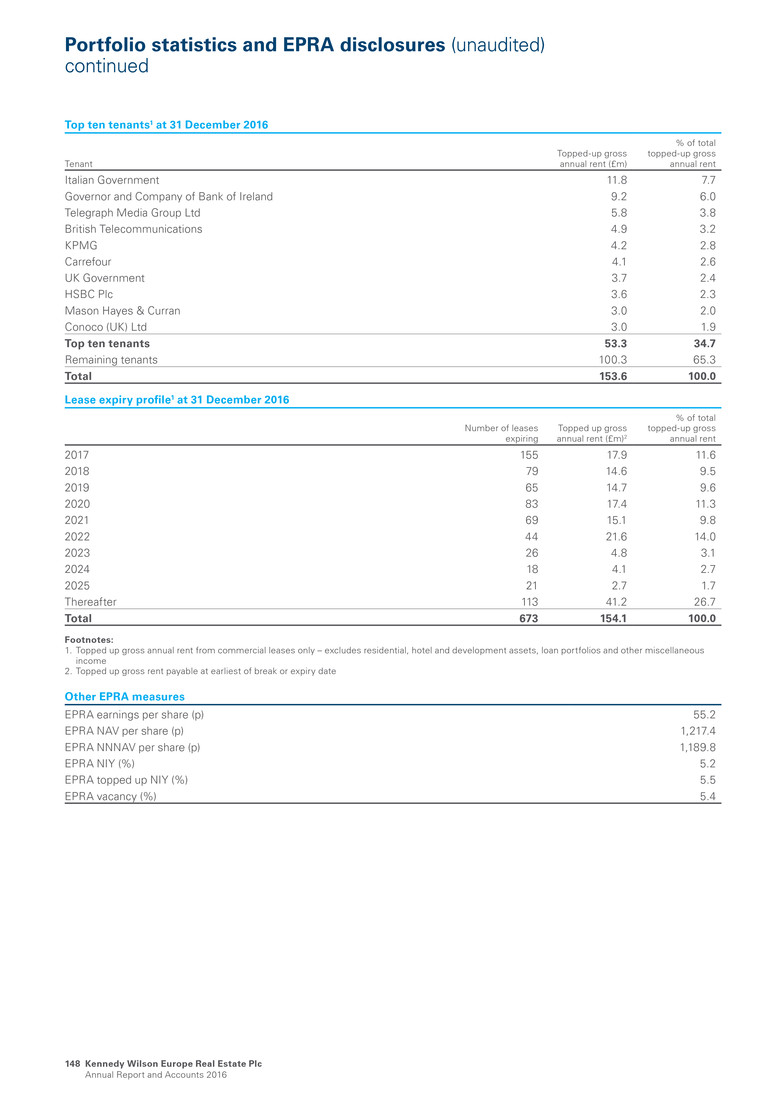
Top ten tenants1 at 31 December 2016 Tenant Topped-up gross annual rent (£m) % of total topped-up gross annual rent Italian Government 11.8 7.7 Governor and Company of Bank of Ireland 9.2 6.0 Telegraph Media Group Ltd 5.8 3.8 British Telecommunications 4.9 3.2 KPMG 4.2 2.8 Carrefour 4.1 2.6 UK Government 3.7 2.4 HSBC Plc 3.6 2.3 Mason Hayes & Curran 3.0 2.0 Conoco (UK) Ltd 3.0 1.9 Top ten tenants 53.3 34.7 Remaining tenants 100.3 65.3 Total 153.6 100.0 Lease expiry profile1 at 31 December 2016 Number of leases expiring Topped up gross annual rent (£m)2 % of total topped-up gross annual rent 2017 155 17.9 11.6 2018 79 14.6 9.5 2019 65 14.7 9.6 2020 83 17.4 11.3 2021 69 15.1 9.8 2022 44 21.6 14.0 2023 26 4.8 3.1 2024 18 4.1 2.7 2025 21 2.7 1.7 Thereafter 113 41.2 26.7 Total 673 154.1 100.0 Footnotes: 1. Topped up gross annual rent from commercial leases only – excludes residential, hotel and development assets, loan portfolios and other miscellaneous income 2. Topped up gross rent payable at earliest of break or expiry date Other EPRA measures EPRA earnings per share (p) 55.2 EPRA NAV per share (p) 1,217.4 EPRA NNNAV per share (p) 1,189.8 EPRA NIY (%) 5.2 EPRA topped up NIY (%) 5.5 EPRA vacancy (%) 5.4 Portfolio statistics and EPRA disclosures (unaudited) continued Kennedy Wilson Europe Real Estate Plc Annual Report and Accounts 2016 148

Alternative Performance Measures The Company considers the following metrics to constitute Alternative Performance Measures as defined in the European Securities and Markets Authority’s Guidelines on Alternative Performance Measures. Reconciliations are made by reference to the consolidated financial statements, in each case as at, and for the period ending on, the date as of which the relevant Alternative Performance Measure is provided. Comparative information for applicable prior period is also provided in the relevant reconciliation referred to below. EPRA NAV Definition: IFRS net asset value adjusted to include properties and other investment interests at fair value and to exclude certain items not expected to be crystallised in normal circumstances such as fair value of financial derivatives. Rationale: Inclusion suggested by the EPRA Best Practice Recommendations and this is a metric which is commonly reported by investment property entities. Certain forms of remuneration paid by the Company to the Investment Manager are calculated by reference to the EPRA NAV per share (as defined below). Such remuneration is set out in Note 31A(i) of the consolidated financial statements. Reconciliations: The reconciliation as at 31 December 2016 and 31 December 2015 is presented in Note 16B to the consolidated financial statements. EPRA NAV per share Definition: EPRA NAV (as defined above) divided by the number of shares in issue at the relevant reporting date. Rationale: Inclusion suggested by the EPRA Best Practice Recommendations and this is a metric which is commonly reported by investment property entities. Certain forms of remuneration paid by the Company to the Investment Manager are calculated by reference to the EPRA NAV per share. Such remuneration is set out in Note 31A(i) of the consolidated financial statements. Reconciliations: The reconciliation as at 31 December 2016 and 31 December 2015 is presented in Note 16B to the consolidated financial statements. Adjusted NAV Definition: EPRA NAV (as defined above) adjusted by deducting any management fee and performance fee accounted for in the share-based payment reserve. Rationale: Reflects the impact that the settlement of the management fee and/or performance fee paid to the Investment Manager would have had on the EPRA NAV, but for the required accounting treatment of such fee being included in the share- based payment reserve. Reconciliations: The reconciliation as at 31 December 2016 and 31 December 2015 is presented in Note 16B to the consolidated financial statements. Adjusted NAV per share Definition: Adjusted NAV (as defined above) divided by the number of shares in issue at the relevant reporting date. Rationale: Provides investors with a per share metric after adjusting for the treatment of the management fee and performance fee paid to the Investment Manager. Reconciliations: The reconciliation as at 31 December 2016 and 31 December 2015 is presented in Note 16B to the consolidated financial statements. EPRA Earnings Definition: Profit after taxation excluding investment and development property revaluations, gains or losses on disposal, changes in the fair value of financial instruments and associated close-out costs and related taxation. Rationale: Inclusion suggested by the EPRA Best Practice Recommendations and this is a metric which is commonly reported by investment property entities. Reconciliations: The reconciliation for the years ended 31 December 2016 and 31 December 2015 is presented in Note 16A to the consolidated financial statements. EPRA Earnings per share Definition: EPRA Earnings (as defined above) divided by the weighted average number of shares in issue in the relevant period. Rationale: Inclusion suggested by the EPRA Best Practice Recommendations and this is a metric which is commonly reported by investment property entities. Reconciliations: The reconciliation for the years ended 31 December 2016 and 31 December 2015 is presented in Note 16A to the consolidated financial statements. Adjusted Earnings Definition: EPRA Earnings (as defined above) adjusted by adding back the performance fee expense. Rationale: Provides investors with information about the underlying profitability of the Group through the exclusion of an item which is capital in nature, and which is over and above those items specifically excluded for purposes of calculating EPRA Earnings (as defined above). Reconciliations: The reconciliation for the years ended 31 December 2016 and 31 December 2015 is presented in Note 16A to the consolidated financial statements. Adjusted Earnings per share Definition: Adjusted Earnings (as defined above) divided by the weighted average number of shares in issue in the relevant period. Rationale: Provides investors with a per share metric after adjusting for items identified in Adjusted Earnings. Reconciliations: The reconciliation for the years ended 31 December 2016 and 31 December 2015 is presented in Note 16A to the consolidated financial statements. Strategic report G overnance Financials A d d itio n al in fo rm atio n Kennedy Wilson Europe Real Estate Plc Annual Report and Accounts 2016 149
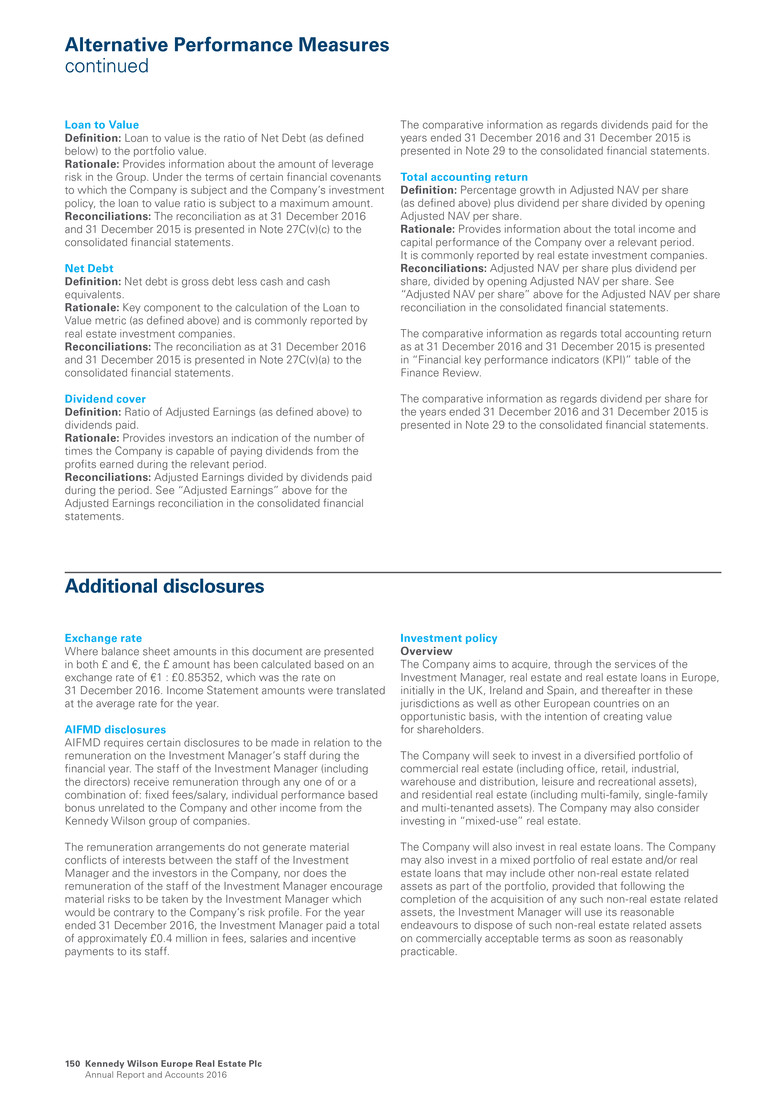
Alternative Performance Measures continued Loan to Value Definition: Loan to value is the ratio of Net Debt (as defined below) to the portfolio value. Rationale: Provides information about the amount of leverage risk in the Group. Under the terms of certain financial covenants to which the Company is subject and the Company’s investment policy, the loan to value ratio is subject to a maximum amount. Reconciliations: The reconciliation as at 31 December 2016 and 31 December 2015 is presented in Note 27C(v)(c) to the consolidated financial statements. Net Debt Definition: Net debt is gross debt less cash and cash equivalents. Rationale: Key component to the calculation of the Loan to Value metric (as defined above) and is commonly reported by real estate investment companies. Reconciliations: The reconciliation as at 31 December 2016 and 31 December 2015 is presented in Note 27C(v)(a) to the consolidated financial statements. Dividend cover Definition: Ratio of Adjusted Earnings (as defined above) to dividends paid. Rationale: Provides investors an indication of the number of times the Company is capable of paying dividends from the profits earned during the relevant period. Reconciliations: Adjusted Earnings divided by dividends paid during the period. See “Adjusted Earnings” above for the Adjusted Earnings reconciliation in the consolidated financial statements. The comparative information as regards dividends paid for the years ended 31 December 2016 and 31 December 2015 is presented in Note 29 to the consolidated financial statements. Total accounting return Definition: Percentage growth in Adjusted NAV per share (as defined above) plus dividend per share divided by opening Adjusted NAV per share. Rationale: Provides information about the total income and capital performance of the Company over a relevant period. It is commonly reported by real estate investment companies. Reconciliations: Adjusted NAV per share plus dividend per share, divided by opening Adjusted NAV per share. See “Adjusted NAV per share” above for the Adjusted NAV per share reconciliation in the consolidated financial statements. The comparative information as regards total accounting return as at 31 December 2016 and 31 December 2015 is presented in “Financial key performance indicators (KPI)” table of the Finance Review. The comparative information as regards dividend per share for the years ended 31 December 2016 and 31 December 2015 is presented in Note 29 to the consolidated financial statements. Exchange rate Where balance sheet amounts in this document are presented in both £ and €, the £ amount has been calculated based on an exchange rate of €1 : £0.85352, which was the rate on 31 December 2016. Income Statement amounts were translated at the average rate for the year. AIFMD disclosures AIFMD requires certain disclosures to be made in relation to the remuneration on the Investment Manager’s staff during the financial year. The staff of the Investment Manager (including the directors) receive remuneration through any one of or a combination of: fixed fees/salary, individual performance based bonus unrelated to the Company and other income from the Kennedy Wilson group of companies. The remuneration arrangements do not generate material conflicts of interests between the staff of the Investment Manager and the investors in the Company, nor does the remuneration of the staff of the Investment Manager encourage material risks to be taken by the Investment Manager which would be contrary to the Company’s risk profile. For the year ended 31 December 2016, the Investment Manager paid a total of approximately £0.4 million in fees, salaries and incentive payments to its staff. Investment policy Overview The Company aims to acquire, through the services of the Investment Manager, real estate and real estate loans in Europe, initially in the UK, Ireland and Spain, and thereafter in these jurisdictions as well as other European countries on an opportunistic basis, with the intention of creating value for shareholders. The Company will seek to invest in a diversified portfolio of commercial real estate (including office, retail, industrial, warehouse and distribution, leisure and recreational assets), and residential real estate (including multi-family, single-family and multi-tenanted assets). The Company may also consider investing in “mixed-use” real estate. The Company will also invest in real estate loans. The Company may also invest in a mixed portfolio of real estate and/or real estate loans that may include other non-real estate related assets as part of the portfolio, provided that following the completion of the acquisition of any such non-real estate related assets, the Investment Manager will use its reasonable endeavours to dispose of such non-real estate related assets on commercially acceptable terms as soon as reasonably practicable. Additional disclosures Kennedy Wilson Europe Real Estate Plc Annual Report and Accounts 2016 150
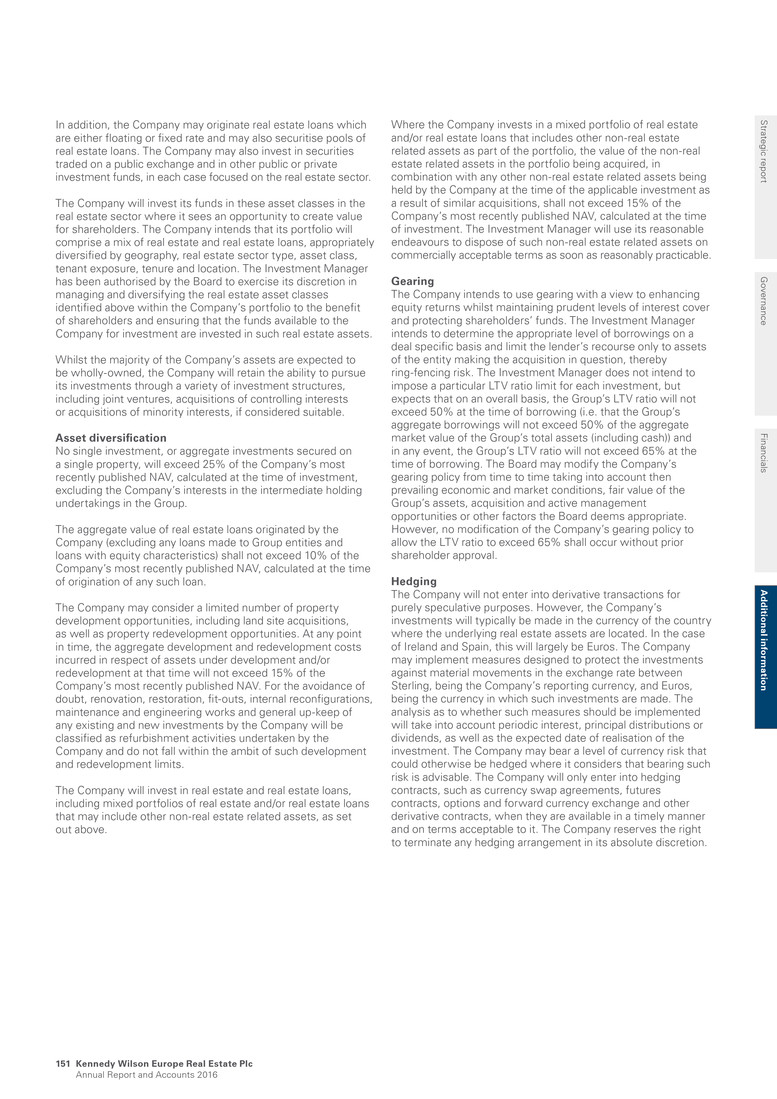
In addition, the Company may originate real estate loans which are either floating or fixed rate and may also securitise pools of real estate loans. The Company may also invest in securities traded on a public exchange and in other public or private investment funds, in each case focused on the real estate sector. The Company will invest its funds in these asset classes in the real estate sector where it sees an opportunity to create value for shareholders. The Company intends that its portfolio will comprise a mix of real estate and real estate loans, appropriately diversified by geography, real estate sector type, asset class, tenant exposure, tenure and location. The Investment Manager has been authorised by the Board to exercise its discretion in managing and diversifying the real estate asset classes identified above within the Company’s portfolio to the benefit of shareholders and ensuring that the funds available to the Company for investment are invested in such real estate assets. Whilst the majority of the Company’s assets are expected to be wholly-owned, the Company will retain the ability to pursue its investments through a variety of investment structures, including joint ventures, acquisitions of controlling interests or acquisitions of minority interests, if considered suitable. Asset diversification No single investment, or aggregate investments secured on a single property, will exceed 25% of the Company’s most recently published NAV, calculated at the time of investment, excluding the Company’s interests in the intermediate holding undertakings in the Group. The aggregate value of real estate loans originated by the Company (excluding any loans made to Group entities and loans with equity characteristics) shall not exceed 10% of the Company’s most recently published NAV, calculated at the time of origination of any such loan. The Company may consider a limited number of property development opportunities, including land site acquisitions, as well as property redevelopment opportunities. At any point in time, the aggregate development and redevelopment costs incurred in respect of assets under development and/or redevelopment at that time will not exceed 15% of the Company’s most recently published NAV. For the avoidance of doubt, renovation, restoration, fit-outs, internal reconfigurations, maintenance and engineering works and general up-keep of any existing and new investments by the Company will be classified as refurbishment activities undertaken by the Company and do not fall within the ambit of such development and redevelopment limits. The Company will invest in real estate and real estate loans, including mixed portfolios of real estate and/or real estate loans that may include other non-real estate related assets, as set out above. Where the Company invests in a mixed portfolio of real estate and/or real estate loans that includes other non-real estate related assets as part of the portfolio, the value of the non-real estate related assets in the portfolio being acquired, in combination with any other non-real estate related assets being held by the Company at the time of the applicable investment as a result of similar acquisitions, shall not exceed 15% of the Company’s most recently published NAV, calculated at the time of investment. The Investment Manager will use its reasonable endeavours to dispose of such non-real estate related assets on commercially acceptable terms as soon as reasonably practicable. Gearing The Company intends to use gearing with a view to enhancing equity returns whilst maintaining prudent levels of interest cover and protecting shareholders’ funds. The Investment Manager intends to determine the appropriate level of borrowings on a deal specific basis and limit the lender’s recourse only to assets of the entity making the acquisition in question, thereby ring-fencing risk. The Investment Manager does not intend to impose a particular LTV ratio limit for each investment, but expects that on an overall basis, the Group’s LTV ratio will not exceed 50% at the time of borrowing (i.e. that the Group’s aggregate borrowings will not exceed 50% of the aggregate market value of the Group’s total assets (including cash)) and in any event, the Group’s LTV ratio will not exceed 65% at the time of borrowing. The Board may modify the Company’s gearing policy from time to time taking into account then prevailing economic and market conditions, fair value of the Group’s assets, acquisition and active management opportunities or other factors the Board deems appropriate. However, no modification of the Company’s gearing policy to allow the LTV ratio to exceed 65% shall occur without prior shareholder approval. Hedging The Company will not enter into derivative transactions for purely speculative purposes. However, the Company’s investments will typically be made in the currency of the country where the underlying real estate assets are located. In the case of Ireland and Spain, this will largely be Euros. The Company may implement measures designed to protect the investments against material movements in the exchange rate between Sterling, being the Company’s reporting currency, and Euros, being the currency in which such investments are made. The analysis as to whether such measures should be implemented will take into account periodic interest, principal distributions or dividends, as well as the expected date of realisation of the investment. The Company may bear a level of currency risk that could otherwise be hedged where it considers that bearing such risk is advisable. The Company will only enter into hedging contracts, such as currency swap agreements, futures contracts, options and forward currency exchange and other derivative contracts, when they are available in a timely manner and on terms acceptable to it. The Company reserves the right to terminate any hedging arrangement in its absolute discretion. Strategic report G overnance Financials A d d itio n al in fo rm atio n Kennedy Wilson Europe Real Estate Plc Annual Report and Accounts 2016 151
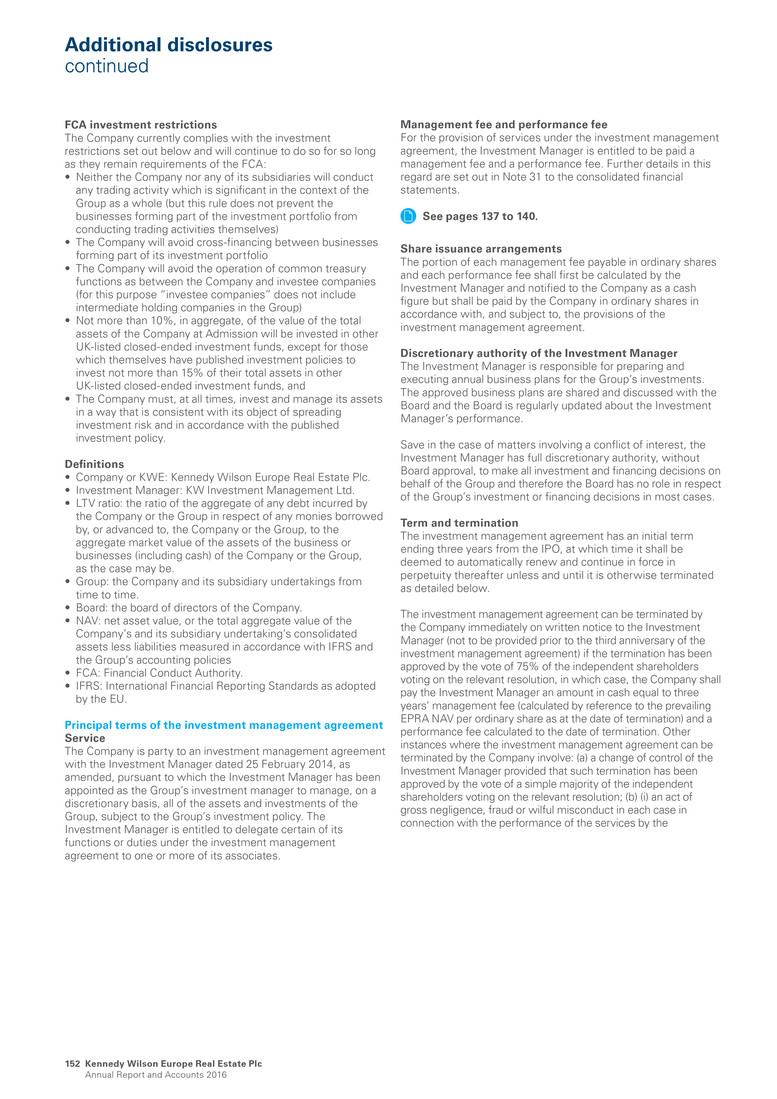
Additional disclosures continued FCA investment restrictions The Company currently complies with the investment restrictions set out below and will continue to do so for so long as they remain requirements of the FCA: • Neither the Company nor any of its subsidiaries will conduct any trading activity which is significant in the context of the Group as a whole (but this rule does not prevent the businesses forming part of the investment portfolio from conducting trading activities themselves) • The Company will avoid cross-financing between businesses forming part of its investment portfolio • The Company will avoid the operation of common treasury functions as between the Company and investee companies (for this purpose “investee companies” does not include intermediate holding companies in the Group) • Not more than 10%, in aggregate, of the value of the total assets of the Company at Admission will be invested in other UK-listed closed-ended investment funds, except for those which themselves have published investment policies to invest not more than 15% of their total assets in other UK-listed closed-ended investment funds, and • The Company must, at all times, invest and manage its assets in a way that is consistent with its object of spreading investment risk and in accordance with the published investment policy. Definitions • Company or KWE: Kennedy Wilson Europe Real Estate Plc. • Investment Manager: KW Investment Management Ltd. • LTV ratio: the ratio of the aggregate of any debt incurred by the Company or the Group in respect of any monies borrowed by, or advanced to, the Company or the Group, to the aggregate market value of the assets of the business or businesses (including cash) of the Company or the Group, as the case may be. • Group: the Company and its subsidiary undertakings from time to time. • Board: the board of directors of the Company. • NAV: net asset value, or the total aggregate value of the Company’s and its subsidiary undertaking’s consolidated assets less liabilities measured in accordance with IFRS and the Group’s accounting policies • FCA: Financial Conduct Authority. • IFRS: International Financial Reporting Standards as adopted by the EU. Principal terms of the investment management agreement Service The Company is party to an investment management agreement with the Investment Manager dated 25 February 2014, as amended, pursuant to which the Investment Manager has been appointed as the Group’s investment manager to manage, on a discretionary basis, all of the assets and investments of the Group, subject to the Group’s investment policy. The Investment Manager is entitled to delegate certain of its functions or duties under the investment management agreement to one or more of its associates. Management fee and performance fee For the provision of services under the investment management agreement, the Investment Manager is entitled to be paid a management fee and a performance fee. Further details in this regard are set out in Note 31 to the consolidated financial statements. See pages 137 to 140. Share issuance arrangements The portion of each management fee payable in ordinary shares and each performance fee shall first be calculated by the Investment Manager and notified to the Company as a cash figure but shall be paid by the Company in ordinary shares in accordance with, and subject to, the provisions of the investment management agreement. Discretionary authority of the Investment Manager The Investment Manager is responsible for preparing and executing annual business plans for the Group’s investments. The approved business plans are shared and discussed with the Board and the Board is regularly updated about the Investment Manager’s performance. Save in the case of matters involving a conflict of interest, the Investment Manager has full discretionary authority, without Board approval, to make all investment and financing decisions on behalf of the Group and therefore the Board has no role in respect of the Group’s investment or financing decisions in most cases. Term and termination The investment management agreement has an initial term ending three years from the IPO, at which time it shall be deemed to automatically renew and continue in force in perpetuity thereafter unless and until it is otherwise terminated as detailed below. The investment management agreement can be terminated by the Company immediately on written notice to the Investment Manager (not to be provided prior to the third anniversary of the investment management agreement) if the termination has been approved by the vote of 75% of the independent shareholders voting on the relevant resolution, in which case, the Company shall pay the Investment Manager an amount in cash equal to three years’ management fee (calculated by reference to the prevailing EPRA NAV per ordinary share as at the date of termination) and a performance fee calculated to the date of termination. Other instances where the investment management agreement can be terminated by the Company involve: (a) a change of control of the Investment Manager provided that such termination has been approved by the vote of a simple majority of the independent shareholders voting on the relevant resolution; (b) (i) an act of gross negligence, fraud or wilful misconduct in each case in connection with the performance of the services by the Kennedy Wilson Europe Real Estate Plc Annual Report and Accounts 2016 152
Investment Manager or (ii) a material breach of the Group’s investment policy, and which in each case is either (A) incapable of remedy, or (B) has not been remedied by the Investment Manager within three months of the Company giving written notice to the Investment Manager specifying such act and requiring that it is remedied; and (c) termination of the investment advisory agreement between the Investment Manager and its investment advisors and its non-replacement by a comparable agreement among the Investment Manager and other members of the KW Group. The investment management agreement can also be terminated by the Investment Manager if the Company is in material breach of any of its material obligations under the investment management agreement (and such breach is not due to the acts or omissions of the Investment Manager), which breach either (i) is incapable of remedy or (ii) has not been remedied to the reasonable satisfaction of the Investment Manager within three months of the Investment Manager giving written notice to the Company specifying the breach, and in which case the Investment Manager will be entitled to payment of an amount in cash equal to three years’ management fee (calculated by reference to the prevailing EPRA NAV per ordinary share as at the date of termination) and a performance fee in cash calculated to the date of termination. Other instances of termination by the Investment Manager include a change of control in the Company; if the Board acquires or disposes (but not if the independent Directors determine to proceed with an acquisition or disposal pursuant to the conflicts of interest policy) of an investment except on the advice of the Investment Manager; if the Board raises new equity or distributes any income or capital of any member of the Group without the consent of the Investment Manager, such consent not to be unreasonably withheld or delayed; or if the Company makes a material change to the Group’s investment policy without the Investment Manager’s prior consent, in which case the Investment Manager will be entitled to payment of an amount in cash equal to three years’ management fee (calculated by reference to the prevailing EPRA NAV per ordinary share as at the date of termination) and a performance fee in cash calculated to the date of termination. The investment management agreement can be terminated by any party if the other party becomes insolvent, appoints an administrator or receiver or passes a resolution for winding up (otherwise than for the purpose of a bona fide scheme for solvent amalgamation or reconstruction). In the event of termination of the investment management agreement in accordance with its terms, the Investment Manager shall be entitled to all fees and other amounts payable to it pursuant to the investment management agreement up to the date of termination, including any management fee or performance fee which shall be calculated on a pro rata basis to the date of termination. Strategic report G overnance Financials A d d itio n al in fo rm atio n Kennedy Wilson Europe Real Estate Plc Annual Report and Accounts 2016 153

Directors, advisors and Company information Directors Kennedy Wilson Europe Real Estate Plc Charlotte Valeur (Chair) William McMorrow Mark McNicholas Simon Radford Mary Ricks Investment Manager KW Investment Management Ltd Directors of the Investment Manager: Mary Ricks Mark Hodgson Andrew McNulty Peter Collins Registered office Kennedy Wilson Europe Real Estate Plc 47 Esplanade St Helier Jersey JE1 0BD Channel Islands Corporate broker J.P Morgan Securities plc 25 Bank Street Canary Wharf London E14 5JP United Kingdom Principal legal advisors Allen & Overy LLP (as to English law) One Bishop’s Square London E1 6AD United Kingdom Carey Olsen (as to Jersey law) 47 Esplanade St Helier Jersey JE1 0BD Channel Islands Independent valuers in the UK, Ireland, Spain and Italy Direct real estate portfolios CBRE Ltd Henrietta House Henrietta Place London W1G 0NB United Kingdom CBRE Ltd 3rd Floor, Connaught House 1 Burlington Road Dublin 4 Ireland Colliers Real Estate Services Italia S.r.l. con socio unico Via Durini-2 20122 Milan Italy Loan portfolios Duff & Phelps Ltd The Shard 32 London Bridge Street London SE1 9SG United Kingdom Auditor KPMG 1 Stokes Place St Stephen’s Green, Dublin 2 Ireland Administrator and Secretary Crestbridge Fund Administrators Ltd 47 Esplanade St Helier Jersey JE1 0BD Channel Islands Registrar Computershare Investor Services (Jersey) Ltd Queensway House Hilgrove Street St Helier JE1 1ES Channel Islands Financial public relations FTI Consulting 200 Aldersgate Aldersgate Street London EC1A 4HD United Kingdom Kennedy Wilson Europe Real Estate Plc Annual Report and Accounts 2016 154

Shareholder information Group website You can access our website at www.kennedywilson.eu to find the current share price, read the latest news in the investors section and read the Annual Report and Accounts. Registrars Administrative enquiries about the holding of Kennedy Wilson Europe Real Estate Plc shares should be directed to: Computershare Investor Services (Jersey) Queensway House Hilgrove Street St Helier JE1 1ES JERSEY Channel Islands Tel: +44 (0) 870 707 4040 A textphone facility for shareholders with hearing difficulties is available by telephoning 0870 702 0005. Dividends Shareholders who wish to have dividends paid directly into a bank account rather than by cheque to their registered address can complete a mandate form. To set up a dividend mandate, or change your existing mandated details, please contact the Company’s registrar, Computershare on the number provided on this page. Change of address Communications with shareholders are mailed to the addresses held on the share register. In the event of any change of address or other amendment, please notify the Company’s registrar under the signature of the registered holder. Shareholders may also register and manage their shares through Computershare’s shareholder portal – www.investorcentre.co.uk. Investment Manager The Company is advised by KW Investment Management Ltd, which is incorporated as a company limited by shares in Jersey and is wholly- owned and controlled (indirectly) by Kennedy Wilson. The Investment Manager is authorised and regulated by the Jersey Financial Services Commission under the Financial Services (Jersey) Law 1998, as amended, as an investment manager. KW Investment Management Ltd is also an Alternative Investment Fund Manager (AIFM) for the purposes of the Jersey Financial Services Commission’s (JFSC) AIFMD (The Alternate Investment Fund Managers Directive) related regulations and complies with the JFSC’s Codes of Practice for Alternative Investment Funds and AIF Services Business. Annual General Meeting The Annual General Meeting (AGM) of Kennedy Wilson Europe Real Estate Plc will be held at 10.00 am on 26 April 2017 at the offices of Allen & Overy LLP, One Bishops Square, London E1 6AD. Shareholder profile This table sets out an analysis of the shareholder profile of the Company at 7 March 2017 Shares by size of holdings No. of holders % Shares % Kennedy-Wilson Holdings, Inc 1 0.5 29,829,730 23.7 10 million + 2 1.0 27,493,041 21.8 5-10 million 3 1.5 16,309,365 12.9 1-5 million 13 6.4 28,469,570 22.6 Less than 1 million1 183 90.6 24,031,701 19.1 Total 202 100.0 126,133,407 100.00 Footnote: 1. Includes 3,429,427 shares unknown Financial calendar 2017 Publication of Annual Report and Accounts and posting of AGM Notice 23 March First interim dividend payment date 31 March Last date for receipt of proxy forms for AGM 24 April (10.00 am) Annual General Meeting 26 April (10.00 am) Strategic report G overnance Financials A d d itio n al in fo rm atio n Kennedy Wilson Europe Real Estate Plc Annual Report and Accounts 2016 155
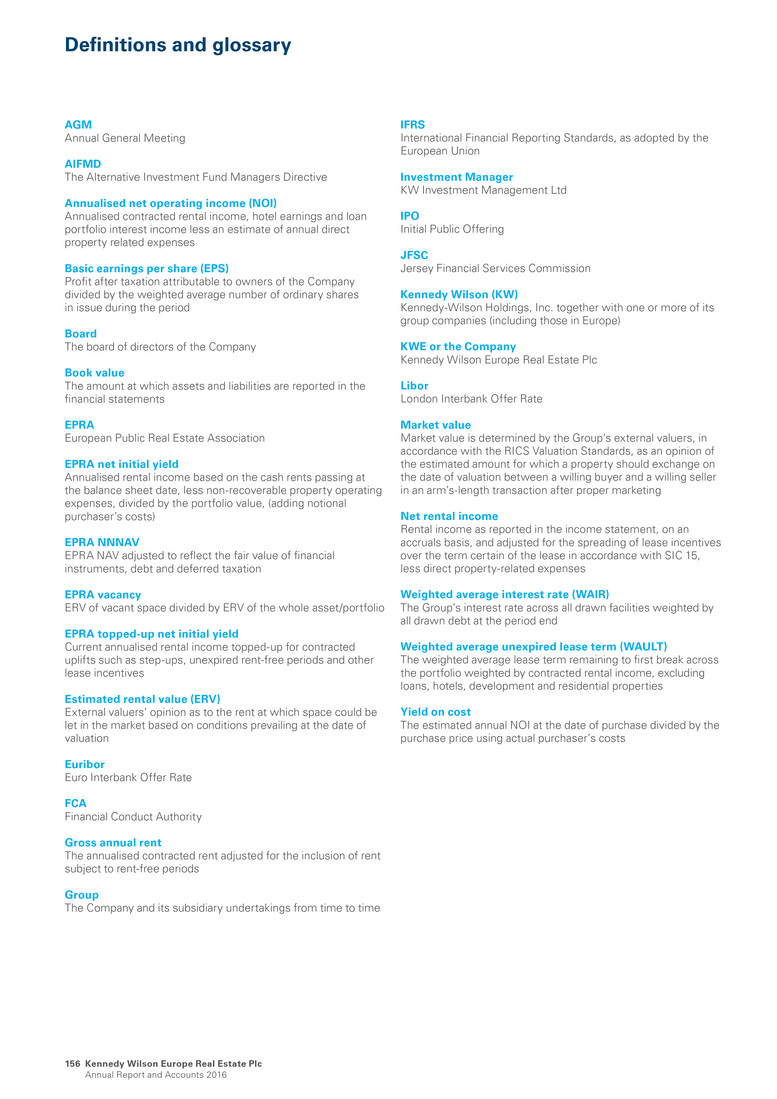
Definitions and glossary AGM Annual General Meeting AIFMD The Alternative Investment Fund Managers Directive Annualised net operating income (NOI) Annualised contracted rental income, hotel earnings and loan portfolio interest income less an estimate of annual direct property related expenses Basic earnings per share (EPS) Profit after taxation attributable to owners of the Company divided by the weighted average number of ordinary shares in issue during the period Board The board of directors of the Company Book value The amount at which assets and liabilities are reported in the financial statements EPRA European Public Real Estate Association EPRA net initial yield Annualised rental income based on the cash rents passing at the balance sheet date, less non-recoverable property operating expenses, divided by the portfolio value, (adding notional purchaser’s costs) EPRA NNNAV EPRA NAV adjusted to reflect the fair value of financial instruments, debt and deferred taxation EPRA vacancy ERV of vacant space divided by ERV of the whole asset/portfolio EPRA topped-up net initial yield Current annualised rental income topped-up for contracted uplifts such as step-ups, unexpired rent-free periods and other lease incentives Estimated rental value (ERV) External valuers’ opinion as to the rent at which space could be let in the market based on conditions prevailing at the date of valuation Euribor Euro Interbank Offer Rate FCA Financial Conduct Authority Gross annual rent The annualised contracted rent adjusted for the inclusion of rent subject to rent-free periods Group The Company and its subsidiary undertakings from time to time IFRS International Financial Reporting Standards, as adopted by the European Union Investment Manager KW Investment Management Ltd IPO Initial Public Offering JFSC Jersey Financial Services Commission Kennedy Wilson (KW) Kennedy-Wilson Holdings, Inc. together with one or more of its group companies (including those in Europe) KWE or the Company Kennedy Wilson Europe Real Estate Plc Libor London Interbank Offer Rate Market value Market value is determined by the Group’s external valuers, in accordance with the RICS Valuation Standards, as an opinion of the estimated amount for which a property should exchange on the date of valuation between a willing buyer and a willing seller in an arm’s-length transaction after proper marketing Net rental income Rental income as reported in the income statement, on an accruals basis, and adjusted for the spreading of lease incentives over the term certain of the lease in accordance with SIC 15, less direct property-related expenses Weighted average interest rate (WAIR) The Group’s interest rate across all drawn facilities weighted by all drawn debt at the period end Weighted average unexpired lease term (WAULT) The weighted average lease term remaining to first break across the portfolio weighted by contracted rental income, excluding loans, hotels, development and residential properties Yield on cost The estimated annual NOI at the date of purchase divided by the purchase price using actual purchaser’s costs Kennedy Wilson Europe Real Estate Plc Annual Report and Accounts 2016 156

About KWE Kennedy Wilson Europe Real Estate Plc is an LSE listed property company that invests in real estate across the UK, Ireland, Spain and Italy. It aims to generate superior shareholder returns by unlocking value of under-resourced real estate across its target geographies. Its existing portfolio is primarily invested across office and retail in the UK and Ireland, weighted towards London, the South East and Dublin. Go to www.kennedywilson.eu About KW Kennedy Wilson Europe Real Estate Plc is externally managed by a wholly-owned Jersey incorporated subsidiary of Kennedy- Wilson Holdings, Inc. Kennedy-Wilson Holdings, Inc. (NYSE:KW) is a global real estate investment company. KW owns, operates, and invests in real estate both on its own and through its investment management platform. KW focuses on multifamily and commercial properties located in the Western U.S., UK, Ireland, Spain, Italy and Japan. To complement KW’s investment business, it also provides real estate services primarily to financial services clients. Go to www.kennedywilson.com Registered address for KWE and Investment Manager 47 Esplanade St Helier Jersey JE1 0BD Channel Islands +44 1534 835 722 Kennedy Wilson Europe offices United Kingdom 50 Grosvenor Hill London, W1K 3QT United Kingdom +44 20 7734 3993 Ireland 33 Sir John Rogerson’s Quay Dublin 2 Ireland +353 1 649 4220 Spain C/Fernando El Santo, 17 3˚ Izq. Madrid, 28010 Spain +34 91 737 2540 Jersey 29 Broad Street St Helier Jersey JE2 3RR Channel Islands +44 1534 859 442 Forward looking statements This Annual Report and Accounts has been prepared for, and only for, the members of Kennedy Wilson Europe Real Estate Plc (the Company), as a body, and no other persons. The Company, its directors, employees, agents or advisors do not accept or assume responsibility to any other person to whom this document is shown or into whose hands it may come and any such responsibility or liability is expressly disclaimed. This Annual Report and Accounts may contain certain forward-looking statements with respect to the Company and its subsidiaries (together, the Group), and the Group’s financial condition, results of operations, business, future plans and strategies, anticipated events or trends, and similar matters, that are not historical facts. Such forward-looking statements involve known and unknown risks, uncertainties and other factors, which may cause the actual results of operations, performance or achievements of the Group or industry results to be materially different from any future results, performance or achievements expressed or implied by such forward-looking statements. These forward-looking statements reflect information and knowledge available at the date of preparation of this Annual Report and Accounts. The Company undertakes no obligation to release publicly any revisions or updates to these forward-looking statements to reflect future events, circumstances, unanticipated events, new information or otherwise except as required by law or any appropriate regulatory authority. Past performance is not a guide to future performance and nothing in this Annual Report and Accounts should be construed as a profit forecast. Persons needing advice should consult an independent financial advisor. Printed by Park Communications on FSC® certified paper. Park is an EMAS certified company and its Environmental Management System is certified to ISO 14001. Designed and produced by Gather +44 (0)20 7610 6140 www.gather.london

Kennedy W ilson Europe R eal Estate Plc / A nnual R eport and A ccounts 2016 www.kennedywilson.eu


