Half-year results For the period ended 30 June 2017 Dark Blue R=23 G=67 B=110 Medium Blue R=125 G=151 B=174 Light Blue R=162 G=187 B=210 Pale Blue R=234 G=234 B=240 Medium Dark Blue R=76 G=87 B=123 Turquoise R=0 G=157 B=224 Dark Grey R=55 G=55 B=55 Light Grey R=164 G=163 B=166 Purple R=151 G=154 B=104 Light Purple R=216 G=187 B=202 Bright Green R=54 G=154 B=55 Mid Green R=134 G=181 B=108 Light Green R=206 G=222 B=192 4 August 2017
Kennedy Wilson Europe Real Estate Plc / Half-year results 2017 1 Agenda Dark Blue R=23 G=67 B=110 Medium Blue R=125 G=151 B=174 Light Blue R=162 G=187 B=210 Pale Blue R=234 G=234 B=240 Medium Dark Blue R=76 G=87 B=123 Turquoise R=0 G=157 B=224 Dark Grey R=55 G=55 B=55 Light Grey R=164 G=163 B=166 Purple R=151 G=154 B=104 Light Purple R=216 G=187 B=202 Bright Green R=54 G=154 B=55 Mid Green R=134 G=181 B=108 Light Green R=206 G=222 B=192 Overview Financial review Portfolio review Summary Mary Ricks Fraser Kennedy Peter Collins Mary Ricks Agenda

Kennedy Wilson Europe Real Estate Plc / Half-year results 2017 2 Overview Mary Ricks, CEO Overview Dark Blue R=23 G=67 B=110 Medium Blue R=125 G=151 B=174 Light Blue R=162 G=187 B=210 Pale Blue R=234 G=234 B=240 Medium Dark Blue R=76 G=87 B=123 Turquoise R=0 G=157 B=224 Dark Grey R=55 G=55 B=55 Light Grey R=164 G=163 B=166 Purple R=151 G=154 B=104 Light Purple R=216 G=187 B=202 Bright Green R=54 G=154 B=55 Mid Green R=134 G=181 B=108 Light Green R=206 G=222 B=192
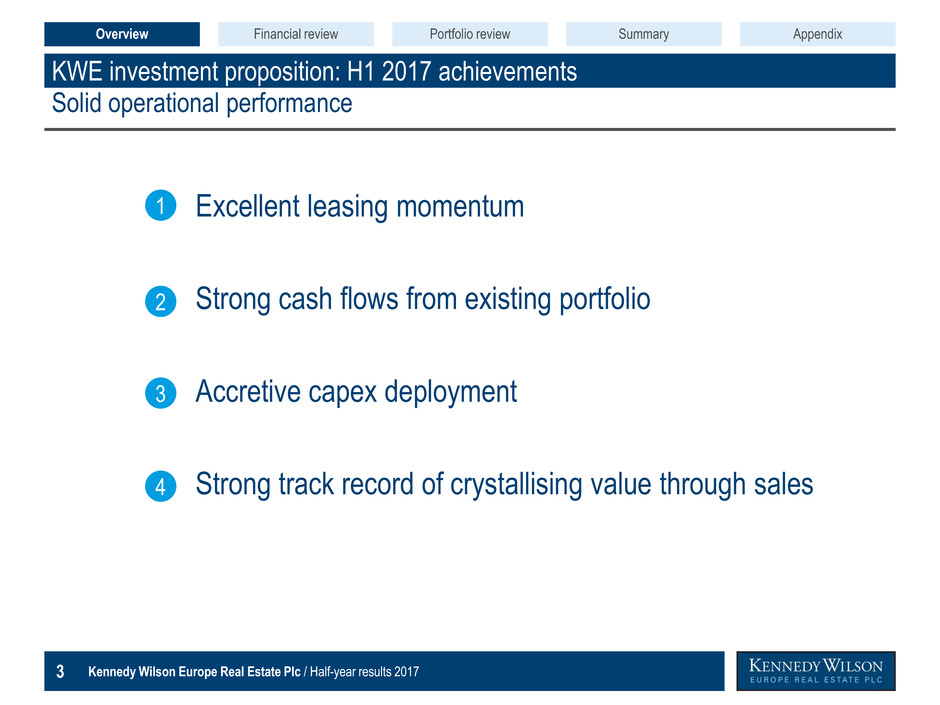
Kennedy Wilson Europe Real Estate Plc / Half-year results 2017 3 KWE investment proposition: H1 2017 achievements Dark Blue R=23 G=67 B=110 Medium Blue R=125 G=151 B=174 Light Blue R=162 G=187 B=210 Pale Blue R=234 G=234 B=240 Medium Dark Blue R=76 G=87 B=123 Turquoise R=0 G=157 B=224 Dark Grey R=55 G=55 B=55 Light Grey R=164 G=163 B=166 Purple R=151 G=154 B=104 Light Purple R=216 G=187 B=202 Bright Green R=54 G=154 B=55 Mid Green R=134 G=181 B=108 Light Green R=206 G=222 B=192 Overview Financial review Portfolio review Appendix Summary Solid operational performance Excellent leasing momentum Strong cash flows from existing portfolio Accretive capex deployment Strong track record of crystallising value through sales 1 2 3 4
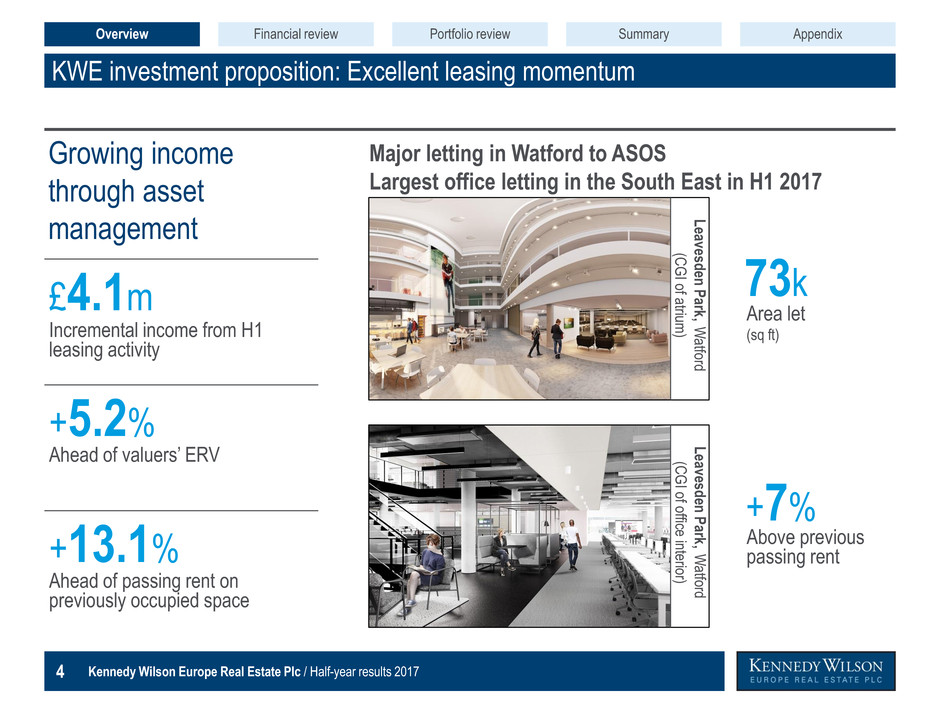
Kennedy Wilson Europe Real Estate Plc / Half-year results 2017 4 +5.2% KWE investment proposition: Excellent leasing momentum Incremental income from H1 leasing activity £4.1m Growing income through asset management Ahead of passing rent on previously occupied space +13.1% Ahead of valuers’ ERV Dark Blue R=23 G=67 B=110 Medium Blue R=125 G=151 B=174 Light Blue R=162 G=187 B=210 Pale Blue R=234 G=234 B=240 Medium Dark Blue R=76 G=87 B=123 Turquoise R=0 G=157 B=224 Dark Grey R=55 G=55 B=55 Light Grey R=164 G=163 B=166 Purple R=151 G=154 B=104 Light Purple R=216 G=187 B=202 Bright Green R=54 G=154 B=55 Mid Green R=134 G=181 B=108 Light Green R=206 G=222 B=192 Overview Financial review Portfolio review Appendix Summary Above previous passing rent +7% Area let (sq ft) 73k Major letting in Watford to ASOS Largest office letting in the South East in H1 2017 Le avesden P ark, W atford (C G I of atrium ) Le avesden P ark, W atford (C G I of offic e in terior)
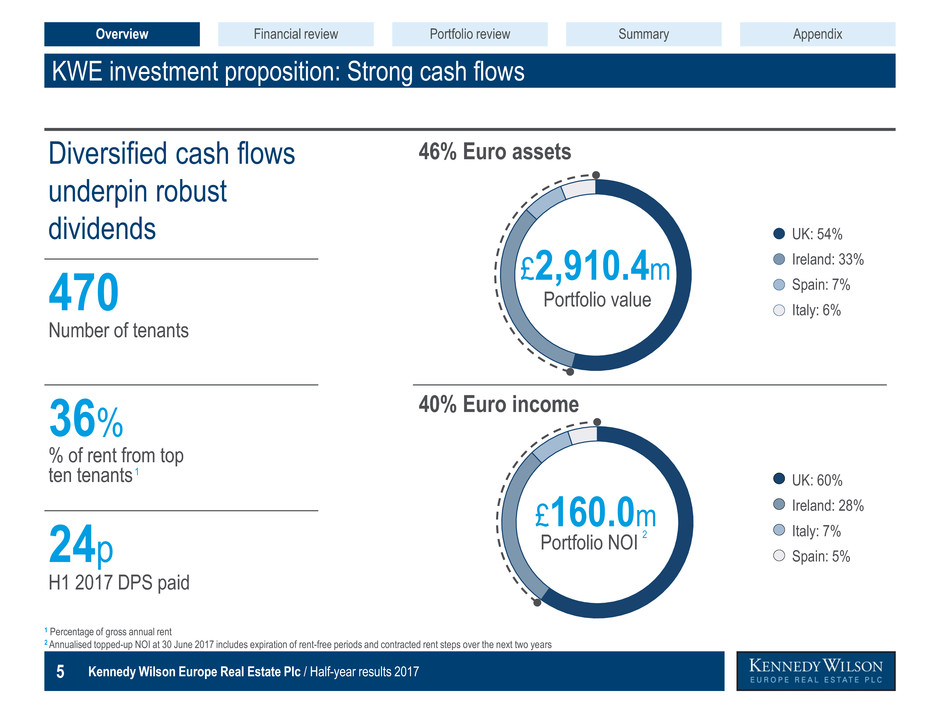
Kennedy Wilson Europe Real Estate Plc / Half-year results 2017 5 24p 470 36% % of rent from top ten tenants KWE investment proposition: Strong cash flows Diversified cash flows underpin robust dividends Number of tenants H1 2017 DPS paid Dark Blue R=23 G=67 B=110 Medium Blue R=125 G=151 B=174 Light Blue R=162 G=187 B=210 Pale Blue R=234 G=234 B=240 Medium Dark Blue R=76 G=87 B=123 Turquoise R=0 G=157 B=224 Dark Grey R=55 G=55 B=55 Light Grey R=164 G=163 B=166 Purple R=151 G=154 B=104 Light Purple R=216 G=187 B=202 Bright Green R=54 G=154 B=55 Mid Green R=134 G=181 B=108 Light Green R=206 G=222 B=192 Overview Financial review Portfolio review Appendix Summary 1 1 Percentage of gross annual rent 2 Annualised topped-up NOI at 30 June 2017 includes expiration of rent-free periods and contracted rent steps over the next two years 46% Euro assets Portfolio value £2,910.4m UK: 54% Ireland: 33% Spain: 7% Italy: 6% Portfolio NOI £160.0m 2 UK: 60% Ireland: 28% Italy: 7% Spain: 5% 40% Euro income
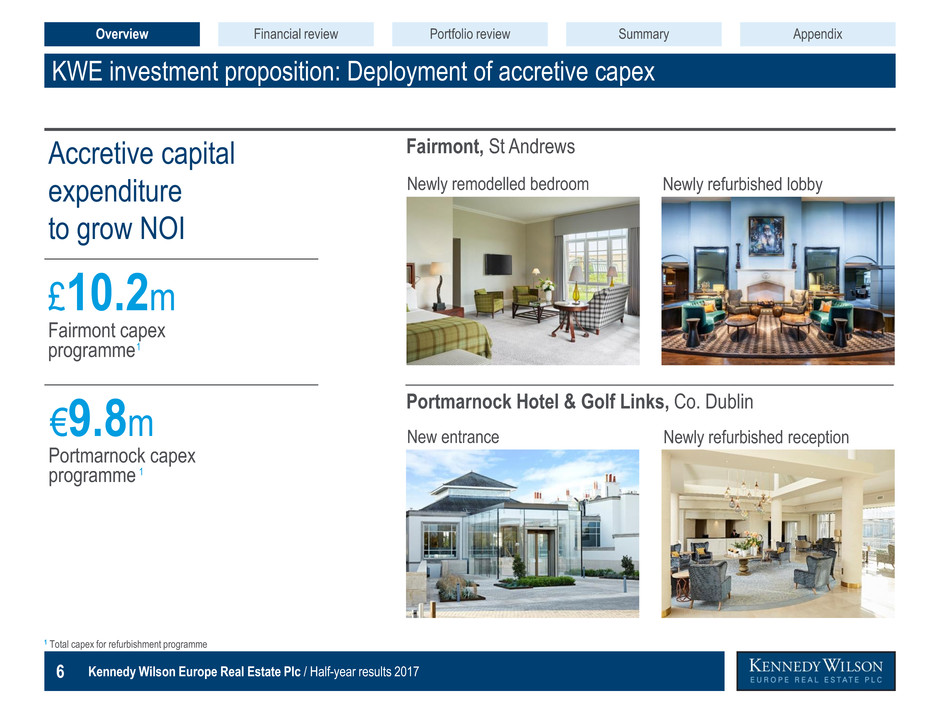
Kennedy Wilson Europe Real Estate Plc / Half-year results 2017 6 €9.8m Portmarnock capex programme £10.2m Fairmont capex programme KWE investment proposition: Deployment of accretive capex Accretive capital expenditure to grow NOI Dark Blue R=23 G=67 B=110 Medium Blue R=125 G=151 B=174 Light Blue R=162 G=187 B=210 Pale Blue R=234 G=234 B=240 Medium Dark Blue R=76 G=87 B=123 Turquoise R=0 G=157 B=224 Dark Grey R=55 G=55 B=55 Light Grey R=164 G=163 B=166 Purple R=151 G=154 B=104 Light Purple R=216 G=187 B=202 Bright Green R=54 G=154 B=55 Mid Green R=134 G=181 B=108 Light Green R=206 G=222 B=192 Overview Financial review Portfolio review Appendix Summary Fairmont, St Andrews Portmarnock Hotel & Golf Links, Co. Dublin Newly remodelled bedroom Newly refurbished lobby New entrance Newly refurbished reception 1 Total capex for refurbishment programme 1 1
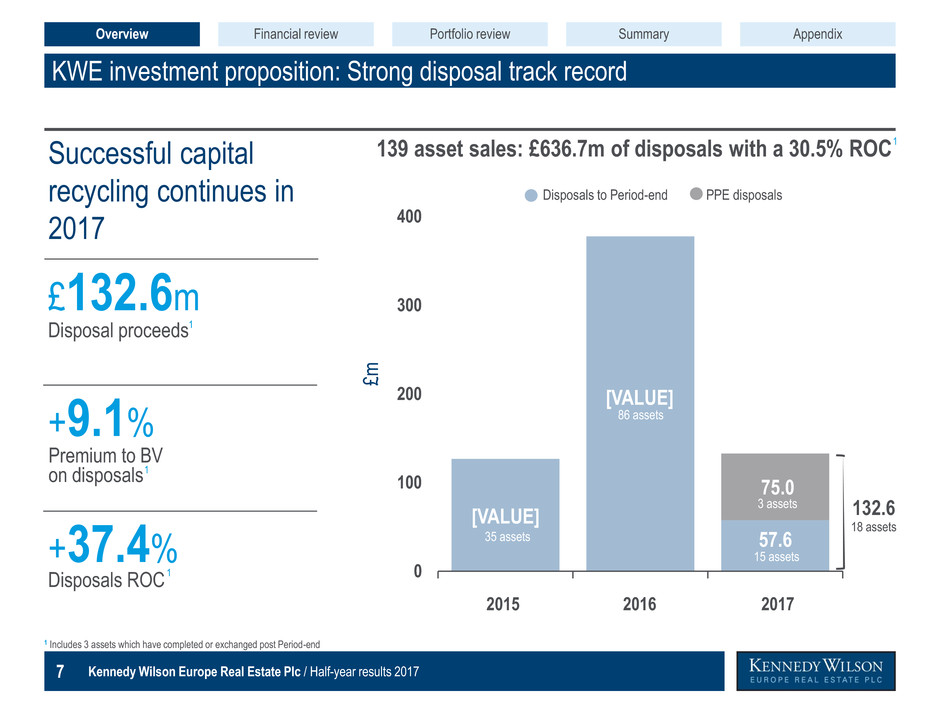
Kennedy Wilson Europe Real Estate Plc / Half-year results 2017 7 Disposals ROC Premium to BV on disposals [VALUE] [VALUE] 57.6 75.0 0 100 200 300 400 KWE investment proposition: Strong disposal track record Successful capital recycling continues in 2017 Disposal proceeds Dark Blue R=23 G=67 B=110 Medium Blue R=125 G=151 B=174 Light Blue R=162 G=187 B=210 Pale Blue R=234 G=234 B=240 Medium Dark Blue R=76 G=87 B=123 Turquoise R=0 G=157 B=224 Dark Grey R=55 G=55 B=55 Light Grey R=164 G=163 B=166 Purple R=151 G=154 B=104 Light Purple R=216 G=187 B=202 Bright Green R=54 G=154 B=55 Mid Green R=134 G=181 B=108 Light Green R=206 G=222 B=192 £132.6m Overview Financial review Portfolio review Appendix Summary £m 2016 2015 2017 139 asset sales: £636.7m of disposals with a 30.5% ROC 86 assets 35 assets 15 assets 3 assets 1 Includes 3 assets which have completed or exchanged post Period-end 1 19 assets PPE disposals Disposals to Period-end 1 1 +9.1% +37.4% 18 assets 132.6 1
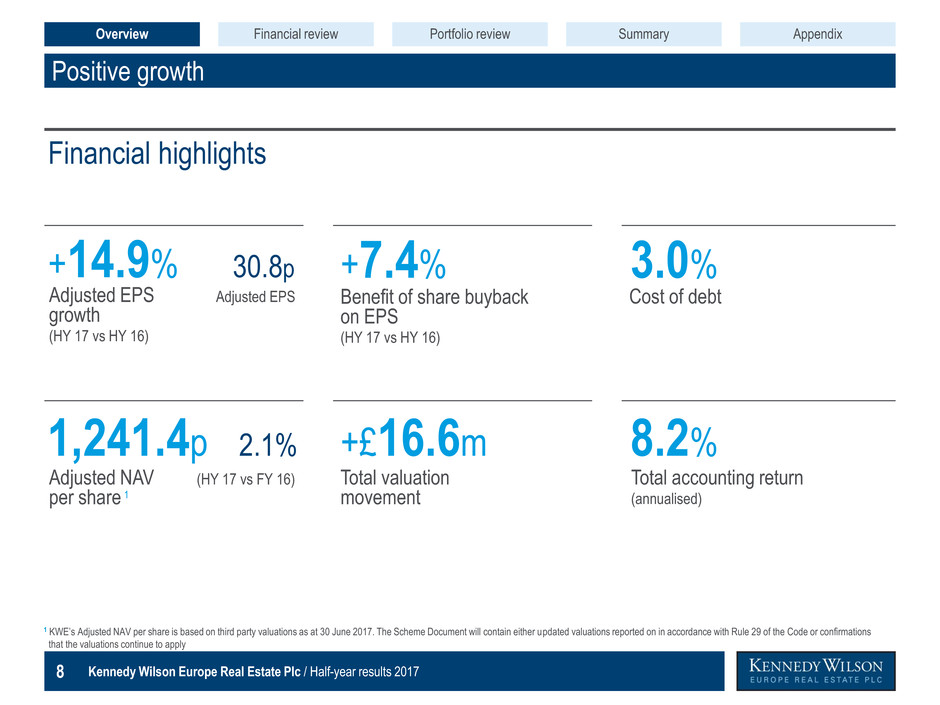
Kennedy Wilson Europe Real Estate Plc / Half-year results 2017 8 Positive growth Financial highlights Dark Blue R=23 G=67 B=110 Medium Blue R=125 G=151 B=174 Light Blue R=162 G=187 B=210 Pale Blue R=234 G=234 B=240 Medium Dark Blue R=76 G=87 B=123 Turquoise R=0 G=157 B=224 Dark Grey R=55 G=55 B=55 Light Grey R=164 G=163 B=166 Purple R=151 G=154 B=104 Light Purple R=216 G=187 B=202 Bright Green R=54 G=154 B=55 Mid Green R=134 G=181 B=108 Light Green R=206 G=222 B=192 Overview Financial review Portfolio review Appendix Summary Adjusted NAV (HY 17 vs FY 16) per share 1,241.4p 2.1% Benefit of share buyback on EPS (HY 17 vs HY 16) +7.4% Total accounting return (annualised) 8.2% Total valuation movement +£16.6m Adjusted EPS Adjusted EPS growth (HY 17 vs HY 16) +14.9% 30.8p Cost of debt 3.0% 1 1 KWE’s Adjusted NAV per share is based on third party valuations as at 30 June 2017. The Scheme Document will contain either updated valuations reported on in accordance with Rule 29 of the Code or confirmations that the valuations continue to apply
Kennedy Wilson Europe Real Estate Plc / Half-year results 2017 9 Financial review Fraser Kennedy, Head of Finance Overview Dark Blue R=23 G=67 B=110 Medium Blue R=125 G=151 B=174 Light Blue R=162 G=187 B=210 Pale Blue R=234 G=234 B=240 Medium Dark Blue R=76 G=87 B=123 Turquoise R=0 G=157 B=224 Dark Grey R=55 G=55 B=55 Light Grey R=164 G=163 B=166 Purple R=151 G=154 B=104 Light Purple R=216 G=187 B=202 Bright Green R=54 G=154 B=55 Mid Green R=134 G=181 B=108 Light Green R=206 G=222 B=192
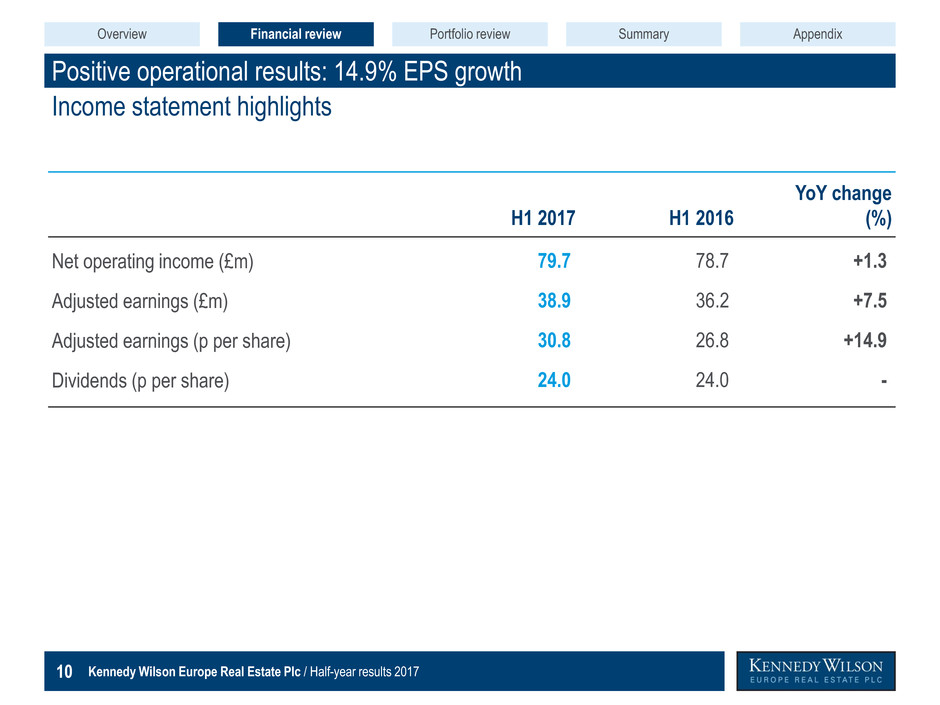
Kennedy Wilson Europe Real Estate Plc / Half-year results 2017 10 Positive operational results: 14.9% EPS growth Income statement highlights Dark Blue R=23 G=67 B=110 Medium Blue R=125 G=151 B=174 Light Blue R=162 G=187 B=210 Pale Blue R=234 G=234 B=240 Medium Dark Blue R=76 G=87 B=123 Turquoise R=0 G=157 B=224 Dark Grey R=55 G=55 B=55 Light Grey R=164 G=163 B=166 Purple R=151 G=154 B=104 Light Purple R=216 G=187 B=202 Bright Green R=54 G=154 B=55 Mid Green R=134 G=181 B=108 Light Green R=206 G=222 B=192 H1 2017 H1 2016 YoY change (%) Net operating income (£m) 79.7 78.7 +1.3 Adjusted earnings (£m) 38.9 36.2 +7.5 Adjusted earnings (p per share) 30.8 26.8 +14.9 Dividends (p per share) 24.0 24.0 - Overview Financial review Portfolio review Appendix Summary
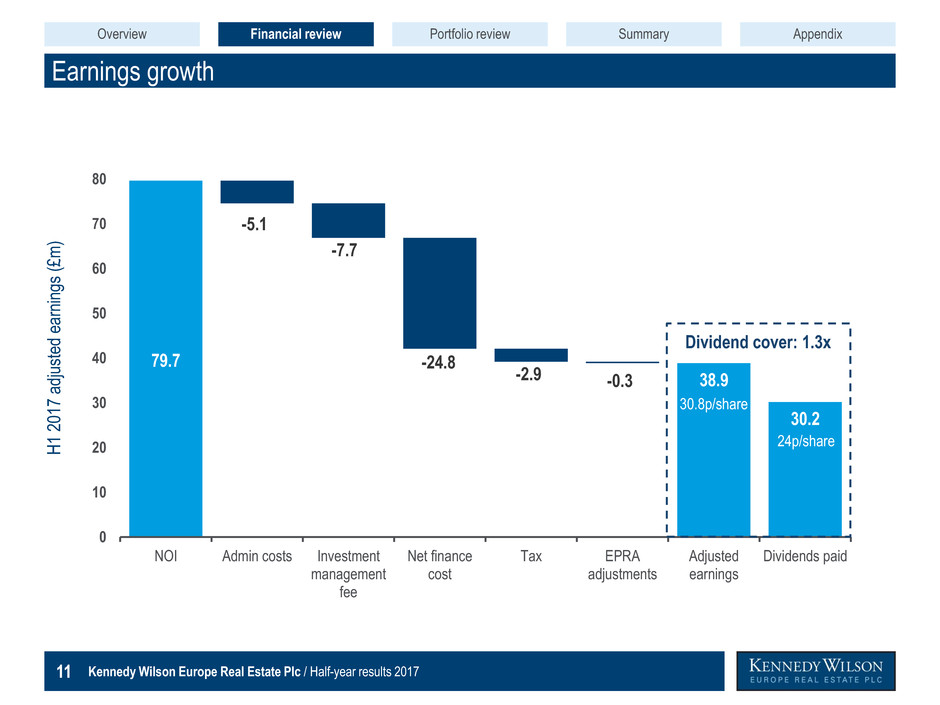
Kennedy Wilson Europe Real Estate Plc / Half-year results 2017 11 Earnings growth Dark Blue R=23 G=67 B=110 Medium Blue R=125 G=151 B=174 Light Blue R=162 G=187 B=210 Pale Blue R=234 G=234 B=240 Medium Dark Blue R=76 G=87 B=123 Turquoise R=0 G=157 B=224 Dark Grey R=55 G=55 B=55 Light Grey R=164 G=163 B=166 Purple R=151 G=154 B=104 Light Purple R=216 G=187 B=202 Bright Green R=54 G=154 B=55 Mid Green R=134 G=181 B=108 Light Green R=206 G=222 B=192 H 1 2 01 7 ad ju st ed e arn in gs (£m ) 79.7 38.9 30.2 -5.1 -7.7 -24.8 -2.9 -0.3 0 10 20 30 40 50 60 70 80 NOI Admin costs Investment management fee Net finance cost Tax EPRA adjustments Adjusted earnings Dividends paid Dividend cover: 1.3x 24p/share Overview Financial review Portfolio review Appendix Summary 30.8p/share
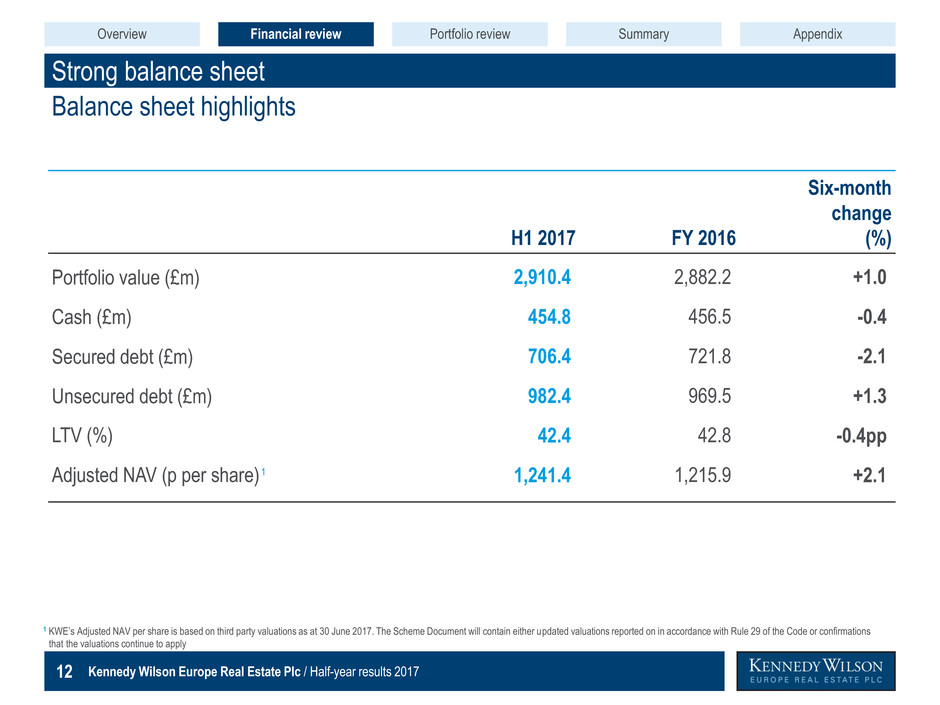
Kennedy Wilson Europe Real Estate Plc / Half-year results 2017 12 Strong balance sheet Balance sheet highlights Dark Blue R=23 G=67 B=110 Medium Blue R=125 G=151 B=174 Light Blue R=162 G=187 B=210 Pale Blue R=234 G=234 B=240 Medium Dark Blue R=76 G=87 B=123 Turquoise R=0 G=157 B=224 Dark Grey R=55 G=55 B=55 Light Grey R=164 G=163 B=166 Purple R=151 G=154 B=104 Light Purple R=216 G=187 B=202 Bright Green R=54 G=154 B=55 Mid Green R=134 G=181 B=108 Light Green R=206 G=222 B=192 H1 2017 FY 2016 Six-month change (%) Portfolio value (£m) 2,910.4 2,882.2 +1.0 Cash (£m) 454.8 456.5 -0.4 Secured debt (£m) 706.4 721.8 -2.1 Unsecured debt (£m) 982.4 969.5 +1.3 LTV (%) 42.4 42.8 -0.4pp Adjusted NAV (p per share) 1,241.4 1,215.9 +2.1 Overview Financial review Portfolio review Appendix Summary 1 1 KWE’s Adjusted NAV per share is based on third party valuations as at 30 June 2017. The Scheme Document will contain either updated valuations reported on in accordance with Rule 29 of the Code or confirmations iiithat the valuations continue to apply
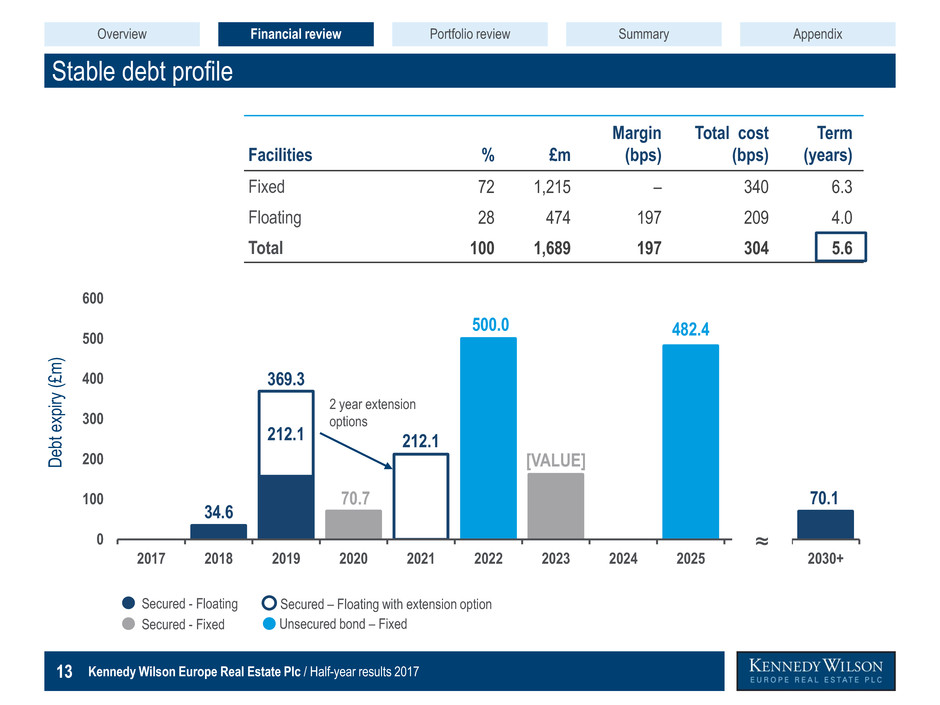
Kennedy Wilson Europe Real Estate Plc / Half-year results 2017 13 34.6 369.3 70.7 212.1 500.0 [VALUE] 482.4 212.1 70.1 0 100 200 300 400 500 600 2017 2018 2019 2020 2021 2022 2023 2024 2025 2030+ Stable debt profile Dark Blue R=23 G=67 B=110 Medium Blue R=125 G=151 B=174 Light Blue R=162 G=187 B=210 Pale Blue R=234 G=234 B=240 Medium Dark Blue R=76 G=87 B=123 Turquoise R=0 G=157 B=224 Dark Grey R=55 G=55 B=55 Light Grey R=164 G=163 B=166 Purple R=151 G=154 B=104 Light Purple R=216 G=187 B=202 Bright Green R=54 G=154 B=55 Mid Green R=134 G=181 B=108 Light Green R=206 G=222 B=192 D eb t e xp iry (£m ) Facilities % £m Margin (bps) Total cost (bps) Term (years) Fixed 72 1,215 – 340 6.3 Floating 28 474 197 209 4.0 Total 100 1,689 197 304 5.6 Unsecured bond – Fixed Secured - Floating Secured - Fixed Secured – Floating with extension option 2 year extension options ≈ Overview Financial review Portfolio review Appendix Summary

Kennedy Wilson Europe Real Estate Plc / Half-year results 2017 14 Portfolio review Peter Collins, COO Overview Dark Blue R=23 G=67 B=110 Medium Blue R=125 G=151 B=174 Light Blue R=162 G=187 B=210 Pale Blue R=234 G=234 B=240 Medium Dark Blue R=76 G=87 B=123 Turquoise R=0 G=157 B=224 Dark Grey R=55 G=55 B=55 Light Grey R=164 G=163 B=166 Purple R=151 G=154 B=104 Light Purple R=216 G=187 B=202 Bright Green R=54 G=154 B=55 Mid Green R=134 G=181 B=108 Light Green R=206 G=222 B=192
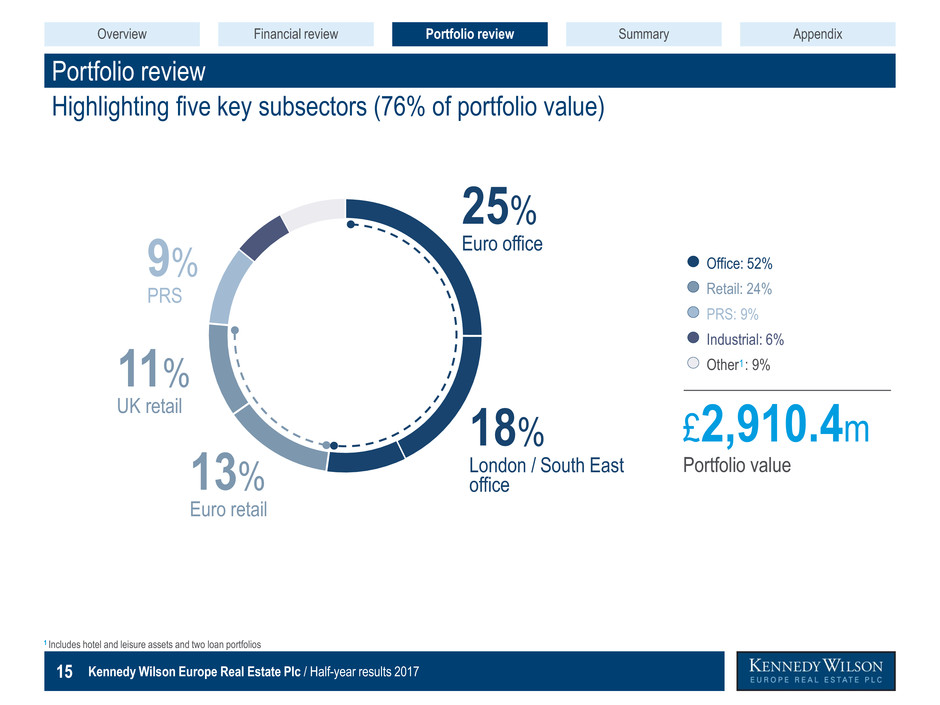
Kennedy Wilson Europe Real Estate Plc / Half-year results 2017 15 Portfolio review Dark Blue R=23 G=67 B=110 Medium Blue R=125 G=151 B=174 Light Blue R=162 G=187 B=210 Pale Blue R=234 G=234 B=240 Medium Dark Blue R=76 G=87 B=123 Turquoise R=0 G=157 B=224 Dark Grey R=55 G=55 B=55 Light Grey R=164 G=163 B=166 Purple R=151 G=154 B=104 Light Purple R=216 G=187 B=202 Bright Green R=54 G=154 B=55 Mid Green R=134 G=181 B=108 Light Green R=206 G=222 B=192 1 Includes hotel and leisure assets and two loan portfolios Office: 52% Retail: 24% PRS: 9% Industrial: 6% Other : 9% 1 Highlighting five key subsectors (76% of portfolio value) Overview Financial review Portfolio review Appendix Summary Euro office 25% London / South East office 18% Euro retail 13% UK retail 11% PRS 9% £2,910.4m Portfolio value
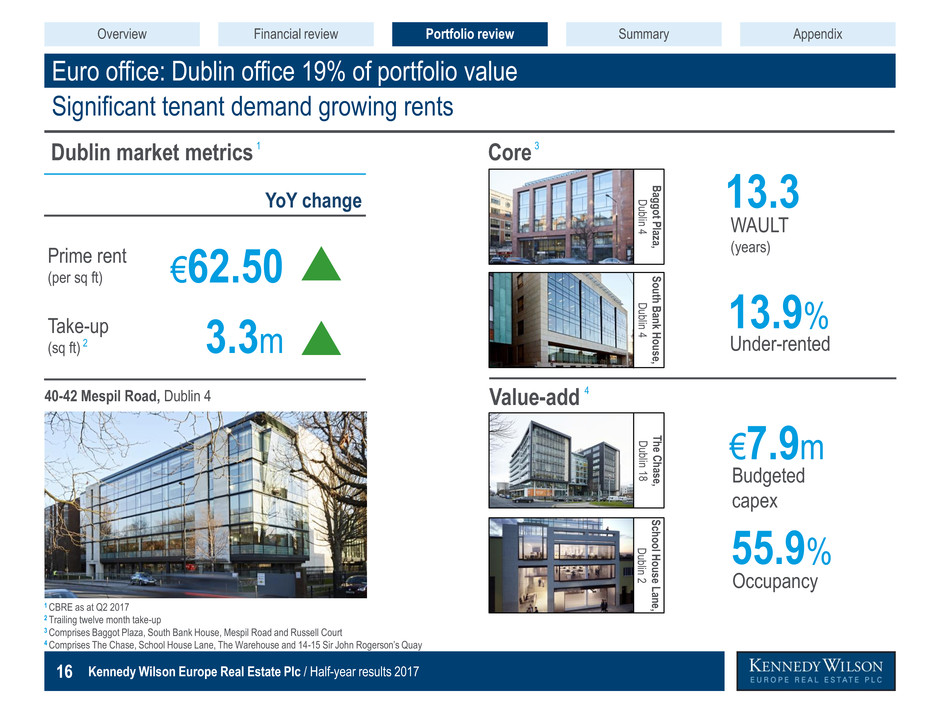
Kennedy Wilson Europe Real Estate Plc / Half-year results 2017 16 Euro office: Dublin office 19% of portfolio value Dark Blue R=23 G=67 B=110 Medium Blue R=125 G=151 B=174 Light Blue R=162 G=187 B=210 Pale Blue R=234 G=234 B=240 Medium Dark Blue R=76 G=87 B=123 Turquoise R=0 G=157 B=224 Dark Grey R=55 G=55 B=55 Light Grey R=164 G=163 B=166 Purple R=151 G=154 B=104 Light Purple R=216 G=187 B=202 Bright Green R=54 G=154 B=55 Mid Green R=134 G=181 B=108 Light Green R=206 G=222 B=192 Significant tenant demand growing rents 40-42 Mespil Road, Dublin 4 1 CBRE as at Q2 2017 2 Trailing twelve month take-up 3 Comprises Baggot Plaza, South Bank House, Mespil Road and Russell Court 4 Comprises The Chase, School House Lane, The Warehouse and 14-15 Sir John Rogerson’s Quay 2 Core Value-add Budgeted capex €7.9m Occupancy 55.9% Overview Financial review Portfolio review Appendix Summary Under-rented 13.9% 13.3 WAULT (years) B ag g o t P laza , D ublin 4 S o u th B ank H o u se, D ublin 4 T h e C h ase, D ublin 18 S ch o o l H o u se L ane , D ublin 2 Dublin market metrics 1 3 4 YoY change Prime rent (per sq ft) Take-up (sq ft) €62.50 3.3m
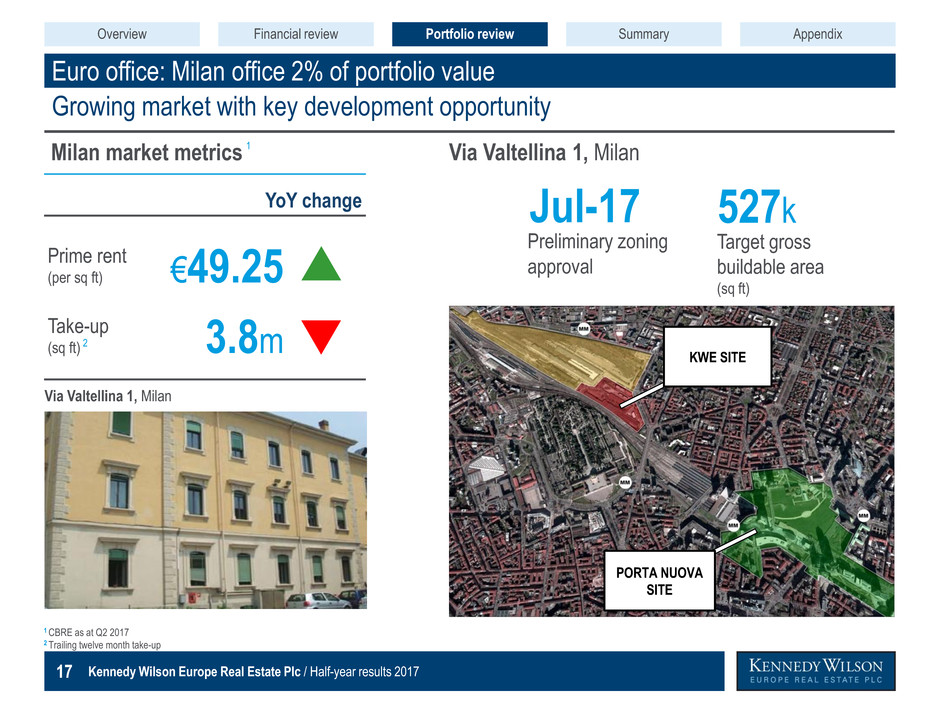
Kennedy Wilson Europe Real Estate Plc / Half-year results 2017 17 YoY change Prime rent (per sq ft) Take-up (sq ft) Euro office: Milan office 2% of portfolio value Dark Blue R=23 G=67 B=110 Medium Blue R=125 G=151 B=174 Light Blue R=162 G=187 B=210 Pale Blue R=234 G=234 B=240 Medium Dark Blue R=76 G=87 B=123 Turquoise R=0 G=157 B=224 Dark Grey R=55 G=55 B=55 Light Grey R=164 G=163 B=166 Purple R=151 G=154 B=104 Light Purple R=216 G=187 B=202 Bright Green R=54 G=154 B=55 Mid Green R=134 G=181 B=108 Light Green R=206 G=222 B=192 Growing market with key development opportunity 1 CBRE as at Q2 2017 2 Trailing twelve month take-up 2 Via Valtellina 1, Milan Overview Financial review Portfolio review Appendix Summary Milan market metrics 1 527k Target gross buildable area (sq ft) Preliminary zoning approval Jul-17 Via Valtellina 1, Milan KWE SITE PORTA NUOVA SITE €49.25 3.8m
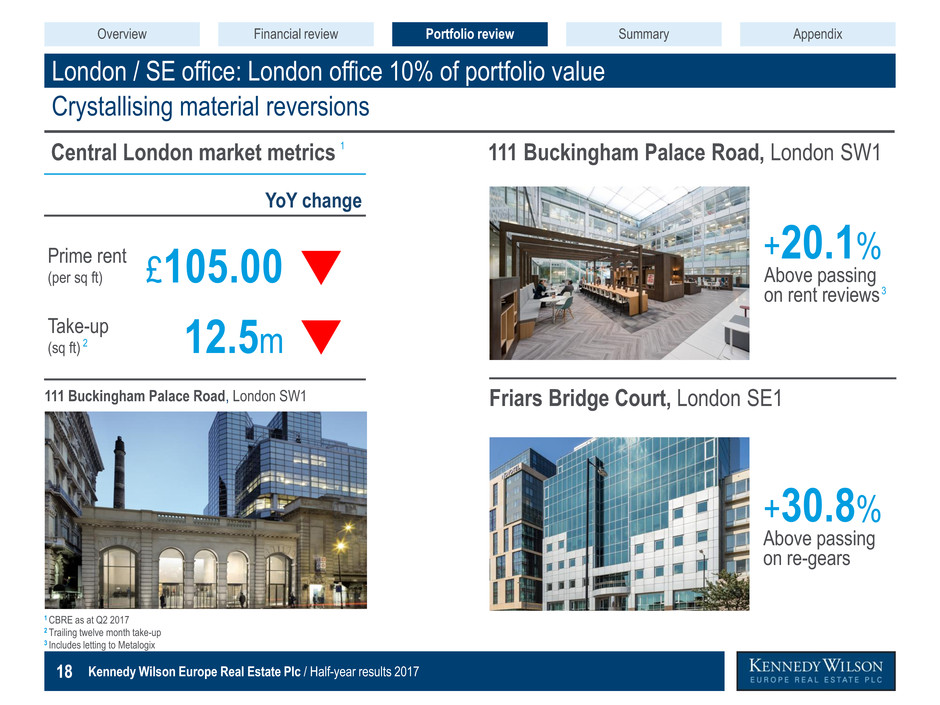
Kennedy Wilson Europe Real Estate Plc / Half-year results 2017 18 1 CBRE as at Q2 2017 2 Trailing twelve month take-up 3 Includes letting to Metalogix London / SE office: London office 10% of portfolio value Dark Blue R=23 G=67 B=110 Medium Blue R=125 G=151 B=174 Light Blue R=162 G=187 B=210 Pale Blue R=234 G=234 B=240 Medium Dark Blue R=76 G=87 B=123 Turquoise R=0 G=157 B=224 Dark Grey R=55 G=55 B=55 Light Grey R=164 G=163 B=166 Purple R=151 G=154 B=104 Light Purple R=216 G=187 B=202 Bright Green R=54 G=154 B=55 Mid Green R=134 G=181 B=108 Light Green R=206 G=222 B=192 Crystallising material reversions 111 Buckingham Palace Road, London SW1 Friars Bridge Court, London SE1 Overview Financial review Portfolio review Appendix Summary Above passing on re-gears +30.8% Above passing on rent reviews +20.1% 3 YoY change Prime rent (per sq ft) Take-up (sq ft) 2 Central London market metrics 1 111 Buckingham Palace Road, London SW1 £105.00 12.5m

Kennedy Wilson Europe Real Estate Plc / Half-year results 2017 19 YoY change Prime rent (per sq ft) Take-up (sq ft) London / SE office: SE office 8% of portfolio value Dark Blue R=23 G=67 B=110 Medium Blue R=125 G=151 B=174 Light Blue R=162 G=187 B=210 Pale Blue R=234 G=234 B=240 Medium Dark Blue R=76 G=87 B=123 Turquoise R=0 G=157 B=224 Dark Grey R=55 G=55 B=55 Light Grey R=164 G=163 B=166 Purple R=151 G=154 B=104 Light Purple R=216 G=187 B=202 Bright Green R=54 G=154 B=55 Mid Green R=134 G=181 B=108 Light Green R=206 G=222 B=192 Competitively positioned in key office market 1 Knight Frank as at Q2 2017. Prime rent based on Maidenhead 2 Trailing twelve month take-up 3 South East office leasing transactions from acquisition to 30 June 2017 2 Overview Financial review Portfolio review Appendix Summary South East market metrics 1 Stockley Park, Heathrow The Horizon Centre, Epsom Discovery Place, Farnborough Axis One, Langley Area of leasing transactions (sq ft) 278k 3 Average rent (per sq ft) £19.50 Leavesden Park, Watford £39.00 3.3m
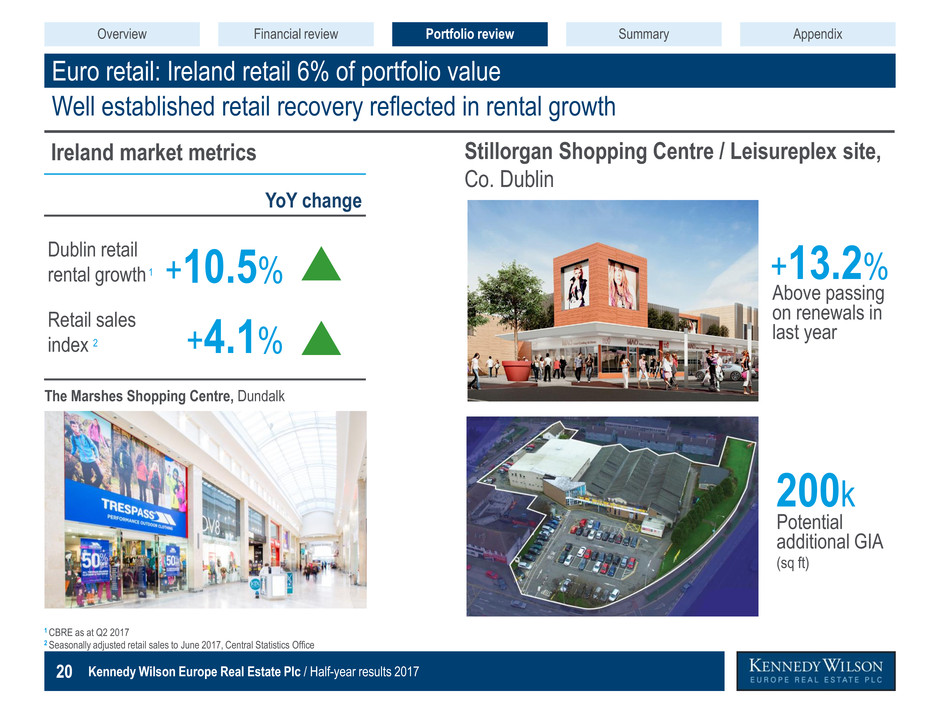
Kennedy Wilson Europe Real Estate Plc / Half-year results 2017 20 YoY change Dublin retail rental growth Retail sales index Euro retail: Ireland retail 6% of portfolio value Dark Blue R=23 G=67 B=110 Medium Blue R=125 G=151 B=174 Light Blue R=162 G=187 B=210 Pale Blue R=234 G=234 B=240 Medium Dark Blue R=76 G=87 B=123 Turquoise R=0 G=157 B=224 Dark Grey R=55 G=55 B=55 Light Grey R=164 G=163 B=166 Purple R=151 G=154 B=104 Light Purple R=216 G=187 B=202 Bright Green R=54 G=154 B=55 Mid Green R=134 G=181 B=108 Light Green R=206 G=222 B=192 Well established retail recovery reflected in rental growth 1 CBRE as at Q2 2017 2 Seasonally adjusted retail sales to June 2017, Central Statistics Office 2 Stillorgan Shopping Centre / Leisureplex site, Co. Dublin Overview Financial review Portfolio review Appendix Summary Ireland market metrics 1 +13.2% Above passing on renewals in last year 200k Potential additional GIA (sq ft) The Marshes Shopping Centre, Dundalk +10.5% +4.1%
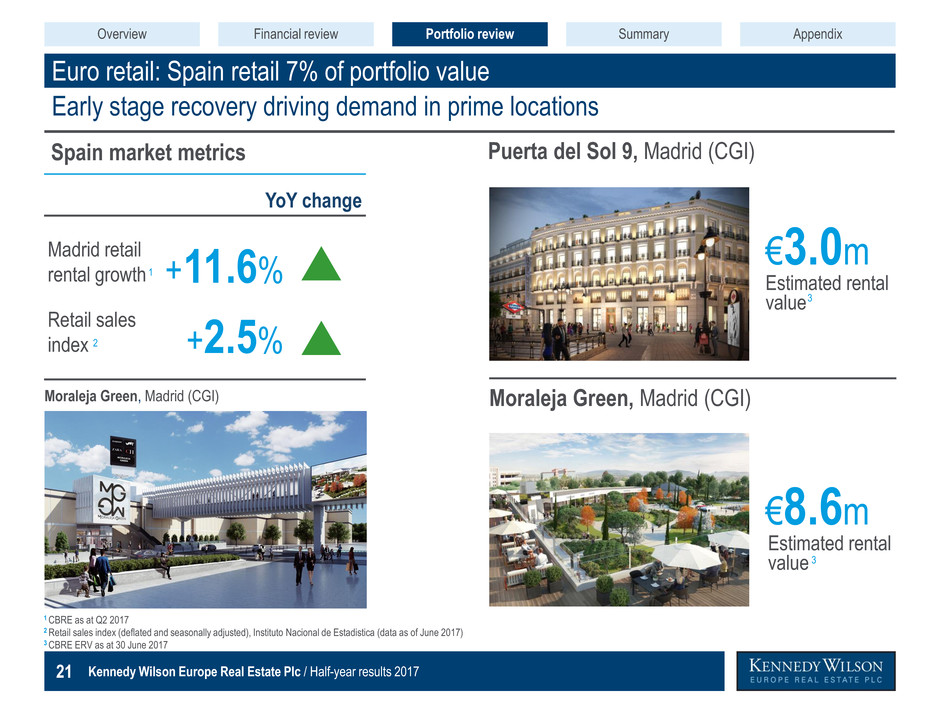
Kennedy Wilson Europe Real Estate Plc / Half-year results 2017 21 Euro retail: Spain retail 7% of portfolio value Dark Blue R=23 G=67 B=110 Medium Blue R=125 G=151 B=174 Light Blue R=162 G=187 B=210 Pale Blue R=234 G=234 B=240 Medium Dark Blue R=76 G=87 B=123 Turquoise R=0 G=157 B=224 Dark Grey R=55 G=55 B=55 Light Grey R=164 G=163 B=166 Purple R=151 G=154 B=104 Light Purple R=216 G=187 B=202 Bright Green R=54 G=154 B=55 Mid Green R=134 G=181 B=108 Light Green R=206 G=222 B=192 Early stage recovery driving demand in prime locations 1 CBRE as at Q2 2017 2 Retail sales index (deflated and seasonally adjusted), Instituto Nacional de Estadistica (data as of June 2017) 3 CBRE ERV as at 30 June 2017 2 Overview Financial review Portfolio review Appendix Summary Spain market metrics 1 Puerta del Sol 9, Madrid (CGI) Moraleja Green, Madrid (CGI) Estimated rental value €3.0m Estimated rental value €8.6m Moraleja Green, Madrid (CGI) 3 3 YoY change Madrid retail rental growth Retail sales index +11.6% +2.5%
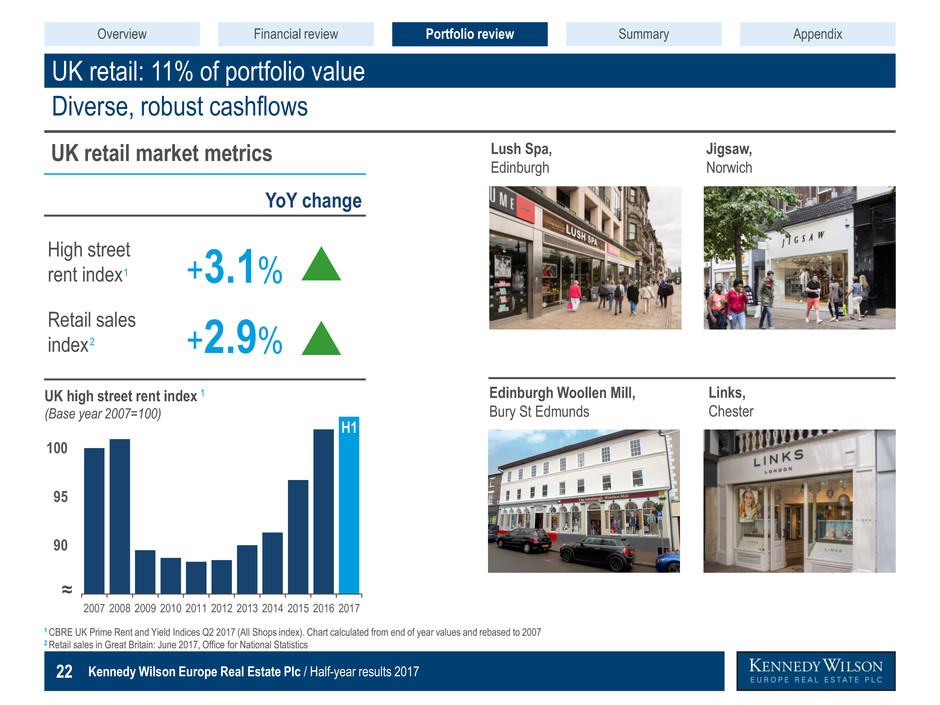
Kennedy Wilson Europe Real Estate Plc / Half-year results 2017 22 UK retail: 11% of portfolio value Dark Blue R=23 G=67 B=110 Medium Blue R=125 G=151 B=174 Light Blue R=162 G=187 B=210 Pale Blue R=234 G=234 B=240 Medium Dark Blue R=76 G=87 B=123 Turquoise R=0 G=157 B=224 Dark Grey R=55 G=55 B=55 Light Grey R=164 G=163 B=166 Purple R=151 G=154 B=104 Light Purple R=216 G=187 B=202 Bright Green R=54 G=154 B=55 Mid Green R=134 G=181 B=108 Light Green R=206 G=222 B=192 UK retail market metrics Diverse, robust cashflows 1 CBRE UK Prime Rent and Yield Indices Q2 2017 (All Shops index). Chart calculated from end of year values and rebased to 2007 2 Retail sales in Great Britain: June 2017, Office for National Statistics 85 90 95 100 2007 2008 2009 2010 2011 2012 2013 2014 2015 2016 2017 ≈ 1 H1 Lush Spa, Edinburgh Jigsaw, Norwich Edinburgh Woollen Mill, Bury St Edmunds Links, Chester Overview Financial review Portfolio review Appendix Summary 1 2 UK high street rent index (Base year 2007=100) YoY change High street rent index Retail sales index +3.1% +2.9%
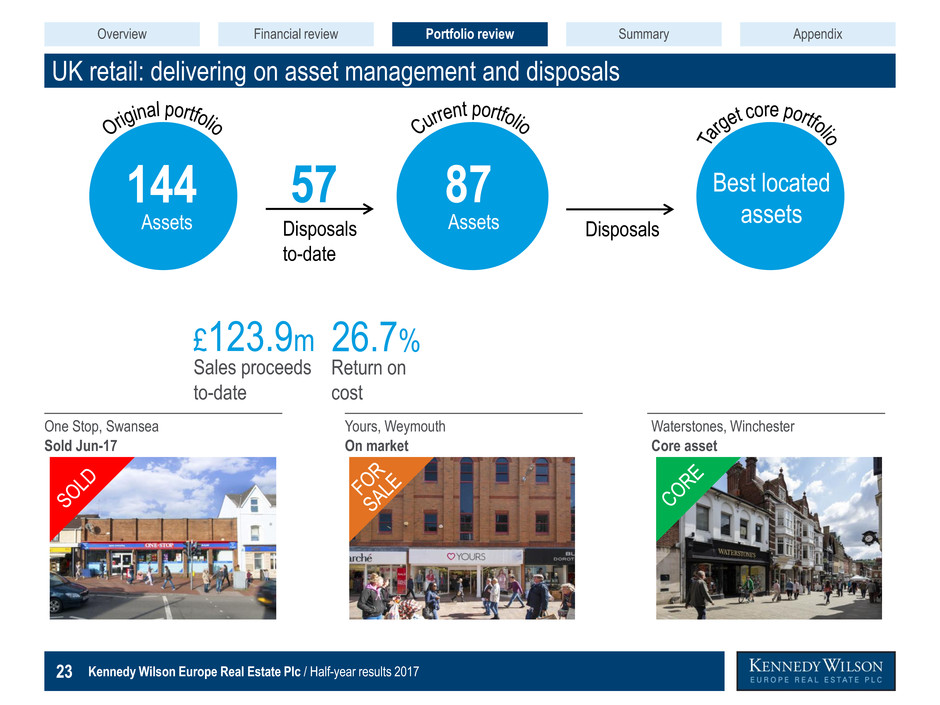
Kennedy Wilson Europe Real Estate Plc / Half-year results 2017 23 UK retail: delivering on asset management and disposals Dark Blue R=23 G=67 B=110 Medium Blue R=125 G=151 B=174 Light Blue R=162 G=187 B=210 Pale Blue R=234 G=234 B=240 Medium Dark Blue R=76 G=87 B=123 Turquoise R=0 G=157 B=224 Dark Grey R=55 G=55 B=55 Light Grey R=164 G=163 B=166 Purple R=151 G=154 B=104 Light Purple R=216 G=187 B=202 Bright Green R=54 G=154 B=55 Mid Green R=134 G=181 B=108 Light Green R=206 G=222 B=192 Assets 144 Best located assets One Stop, Swansea Sold Jun-17 57 Disposals to-date Disposals Yours, Weymouth On market Waterstones, Winchester Core asset Overview Financial review Portfolio review Appendix Summary Assets 87 Return on cost Sales proceeds to-date £123.9m 26.7%
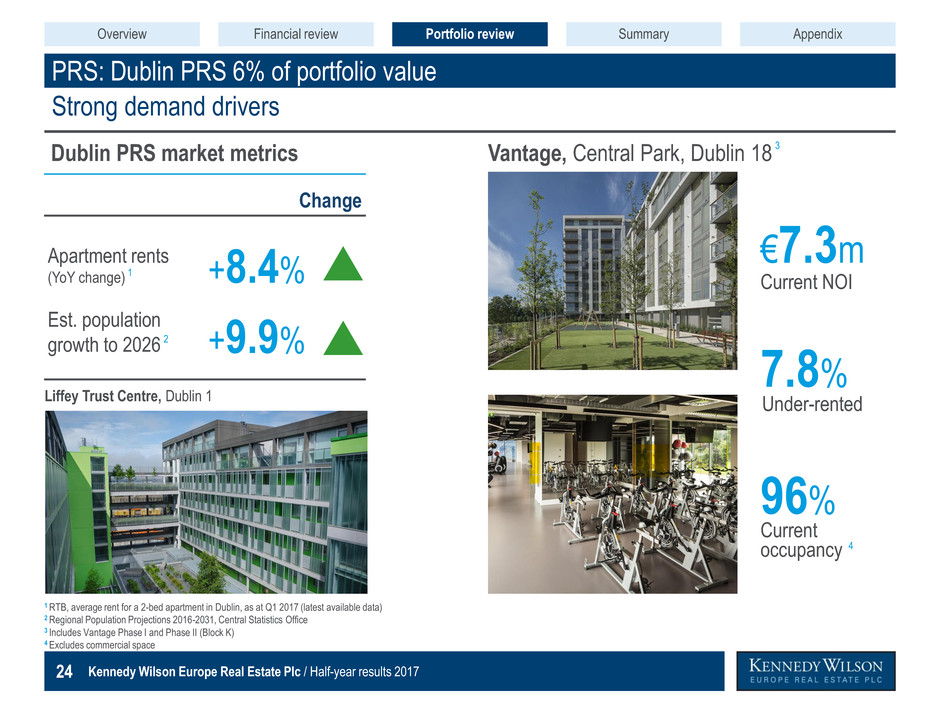
Kennedy Wilson Europe Real Estate Plc / Half-year results 2017 24 Change Apartment rents (YoY change) Est. population growth to 2026 PRS: Dublin PRS 6% of portfolio value Dark Blue R=23 G=67 B=110 Medium Blue R=125 G=151 B=174 Light Blue R=162 G=187 B=210 Pale Blue R=234 G=234 B=240 Medium Dark Blue R=76 G=87 B=123 Turquoise R=0 G=157 B=224 Dark Grey R=55 G=55 B=55 Light Grey R=164 G=163 B=166 Purple R=151 G=154 B=104 Light Purple R=216 G=187 B=202 Bright Green R=54 G=154 B=55 Mid Green R=134 G=181 B=108 Light Green R=206 G=222 B=192 Dublin PRS market metrics Strong demand drivers 1 RTB, average rent for a 2-bed apartment in Dublin, as at Q1 2017 (latest available data) 2 Regional Population Projections 2016-2031, Central Statistics Office 3 Includes Vantage Phase I and Phase II (Block K) 4 Excludes commercial space Under-rented 7.8% Current NOI €7.3m Current occupancy 96% 4 Overview Financial review Portfolio review Appendix Summary 1 2 Vantage, Central Park, Dublin 18 3 Liffey Trust Centre, Dublin 1 +8.4% +9.9%
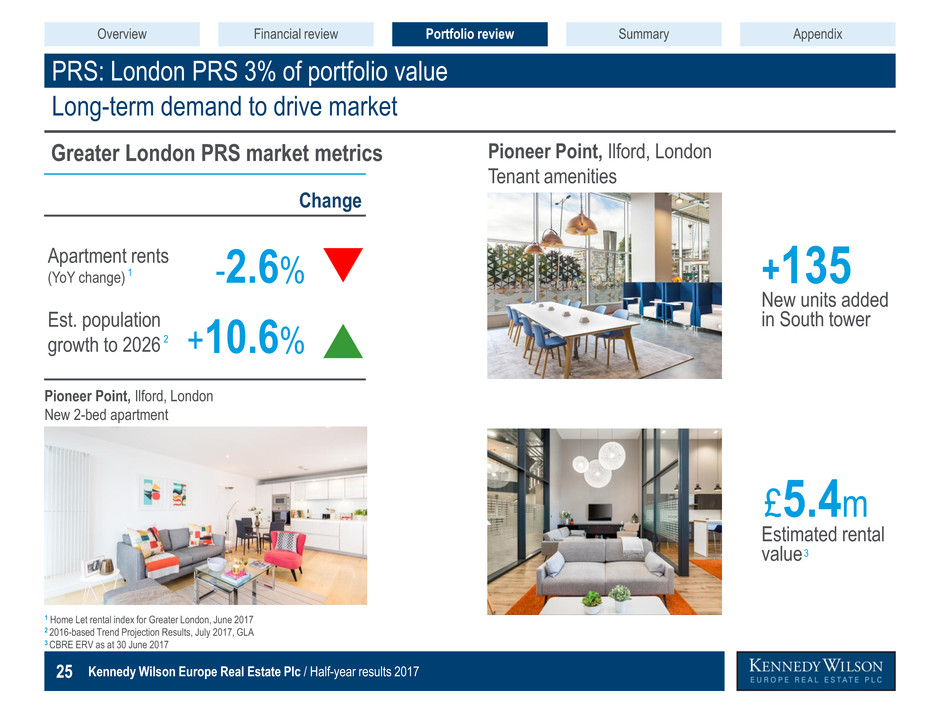
Kennedy Wilson Europe Real Estate Plc / Half-year results 2017 25 Change Apartment rents (YoY change) Est. population growth to 2026 PRS: London PRS 3% of portfolio value Dark Blue R=23 G=67 B=110 Medium Blue R=125 G=151 B=174 Light Blue R=162 G=187 B=210 Pale Blue R=234 G=234 B=240 Medium Dark Blue R=76 G=87 B=123 Turquoise R=0 G=157 B=224 Dark Grey R=55 G=55 B=55 Light Grey R=164 G=163 B=166 Purple R=151 G=154 B=104 Light Purple R=216 G=187 B=202 Bright Green R=54 G=154 B=55 Mid Green R=134 G=181 B=108 Light Green R=206 G=222 B=192 Greater London PRS market metrics Long-term demand to drive market 1 Home Let rental index for Greater London, June 2017 2 2016-based Trend Projection Results, July 2017, GLA 3 CBRE ERV as at 30 June 2017 Overview Financial review Portfolio review Appendix Summary 1 Pioneer Point, Ilford, London Tenant amenities Estimated rental value £5.4m New units added in South tower +135 Pioneer Point, Ilford, London New 2-bed apartment 3 2 -2.6% +10.6%
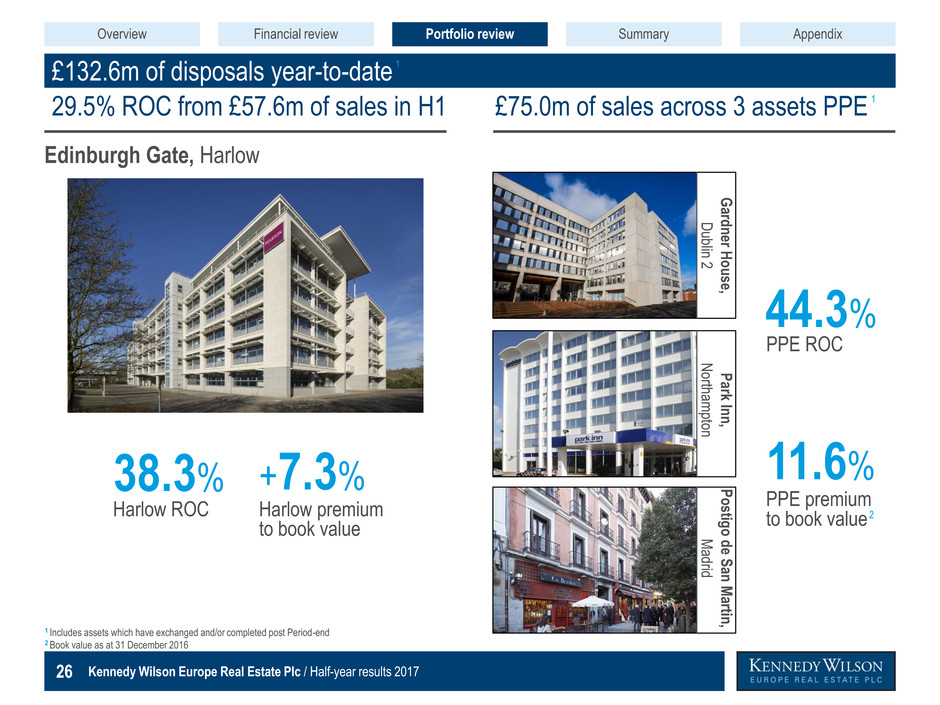
Kennedy Wilson Europe Real Estate Plc / Half-year results 2017 26 £132.6m of disposals year-to-date Dark Blue R=23 G=67 B=110 Medium Blue R=125 G=151 B=174 Light Blue R=162 G=187 B=210 Pale Blue R=234 G=234 B=240 Medium Dark Blue R=76 G=87 B=123 Turquoise R=0 G=157 B=224 Dark Grey R=55 G=55 B=55 Light Grey R=164 G=163 B=166 Purple R=151 G=154 B=104 Light Purple R=216 G=187 B=202 Bright Green R=54 G=154 B=55 Mid Green R=134 G=181 B=108 Light Green R=206 G=222 B=192 Harlow ROC 38.3% Harlow premium to book value +7.3% Overview Financial review Portfolio review Appendix Summary 1 Includes assets which have exchanged and/or completed post Period-end 2 Book value as at 31 December 2016 Edinburgh Gate, Harlow G ardn er H o us e, Du blin 2 P ark Inn , Nort ham pton P ostigo d e S an Ma rtin , M adrid PPE ROC 44.3% PPE premium to book value 11.6% 2 29.5% ROC from £57.6m of sales in H1 £75.0m of sales across 3 assets PPE 1 1

Kennedy Wilson Europe Real Estate Plc / Half-year results 2017 27 Summary Mary Ricks, CEO Overview Dark Blue R=23 G=67 B=110 Medium Blue R=125 G=151 B=174 Light Blue R=162 G=187 B=210 Pale Blue R=234 G=234 B=240 Medium Dark Blue R=76 G=87 B=123 Turquoise R=0 G=157 B=224 Dark Grey R=55 G=55 B=55 Light Grey R=164 G=163 B=166 Purple R=151 G=154 B=104 Light Purple R=216 G=187 B=202 Bright Green R=54 G=154 B=55 Mid Green R=134 G=181 B=108 Light Green R=206 G=222 B=192
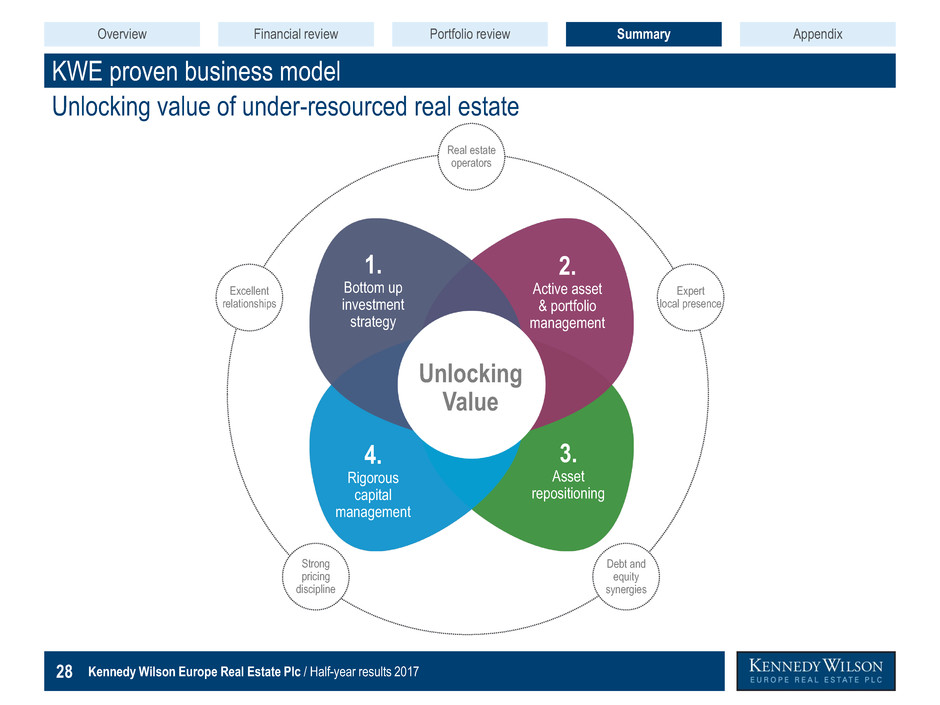
Kennedy Wilson Europe Real Estate Plc / Half-year results 2017 28 KWE proven business model Unlocking value of under-resourced real estate Dark Blue R=23 G=67 B=110 Medium Blue R=125 G=151 B=174 Light Blue R=162 G=187 B=210 Pale Blue R=234 G=234 B=240 Medium Dark Blue R=76 G=87 B=123 Turquoise R=0 G=157 B=224 Dark Grey R=55 G=55 B=55 Light Grey R=164 G=163 B=166 Purple R=151 G=154 B=104 Light Purple R=216 G=187 B=202 Bright Green R=54 G=154 B=55 Mid Green R=134 G=181 B=108 Light Green R=206 G=222 B=192 Unlocking Value 1. Bottom up investment strategy 2. Active asset & portfolio management 4. Rigorous capital management 3. Asset repositioning Real estate operators Expert local presence Strong pricing discipline Debt and equity synergies Excellent relationships Overview Financial review Portfolio review Appendix Summary
Kennedy Wilson Europe Real Estate Plc / Half-year results 2017 29 Capitalising on our proven business model Dark Blue R=23 G=67 B=110 Medium Blue R=125 G=151 B=174 Light Blue R=162 G=187 B=210 Pale Blue R=234 G=234 B=240 Medium Dark Blue R=76 G=87 B=123 Turquoise R=0 G=157 B=224 Dark Grey R=55 G=55 B=55 Light Grey R=164 G=163 B=166 Purple R=151 G=154 B=104 Light Purple R=216 G=187 B=202 Bright Green R=54 G=154 B=55 Mid Green R=134 G=181 B=108 Light Green R=206 G=222 B=192 Thank you Overview Financial review Portfolio review Appendix Summary
Kennedy Wilson Europe Real Estate Plc / Half-year results 2017 30 Appendix Overview Dark Blue R=23 G=67 B=110 Medium Blue R=125 G=151 B=174 Light Blue R=162 G=187 B=210 Pale Blue R=234 G=234 B=240 Medium Dark Blue R=76 G=87 B=123 Turquoise R=0 G=157 B=224 Dark Grey R=55 G=55 B=55 Light Grey R=164 G=163 B=166 Purple R=151 G=154 B=104 Light Purple R=216 G=187 B=202 Bright Green R=54 G=154 B=55 Mid Green R=134 G=181 B=108 Light Green R=206 G=222 B=192
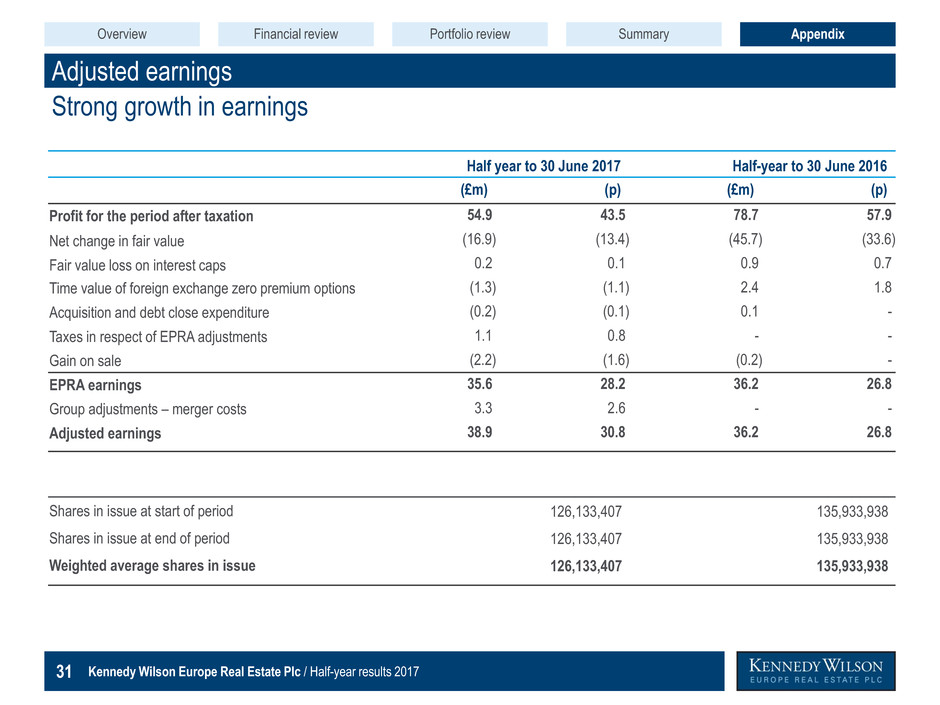
Kennedy Wilson Europe Real Estate Plc / Half-year results 2017 31 Adjusted earnings Strong growth in earnings Dark Blue R=23 G=67 B=110 Medium Blue R=125 G=151 B=174 Light Blue R=162 G=187 B=210 Pale Blue R=234 G=234 B=240 Medium Dark Blue R=76 G=87 B=123 Turquoise R=0 G=157 B=224 Dark Grey R=55 G=55 B=55 Light Grey R=164 G=163 B=166 Purple R=151 G=154 B=104 Light Purple R=216 G=187 B=202 Bright Green R=54 G=154 B=55 Mid Green R=134 G=181 B=108 Light Green R=206 G=222 B=192 Half year to 30 June 2017 Half-year to 30 June 2016 (£m) (p) (£m) (p) Profit for the period after taxation 54.9 43.5 78.7 57.9 Net change in fair value (16.9) (13.4) (45.7) (33.6) Fair value loss on interest caps 0.2 0.1 0.9 0.7 Time value of foreign exchange zero premium options (1.3) (1.1) 2.4 1.8 Acquisition and debt close expenditure (0.2) (0.1) 0.1 - Taxes in respect of EPRA adjustments 1.1 0.8 - - Gain on sale (2.2) (1.6) (0.2) - EPRA earnings 35.6 28.2 36.2 26.8 Group adjustments – merger costs 3.3 2.6 - - Adjusted earnings 38.9 30.8 36.2 26.8 Shares in issue at start of period 126,133,407 135,933,938 Shares in issue at end of period 126,133,407 135,933,938 Weighted average shares in issue 126,133,407 135,933,938 Overview Financial review Portfolio review Appendix Summary
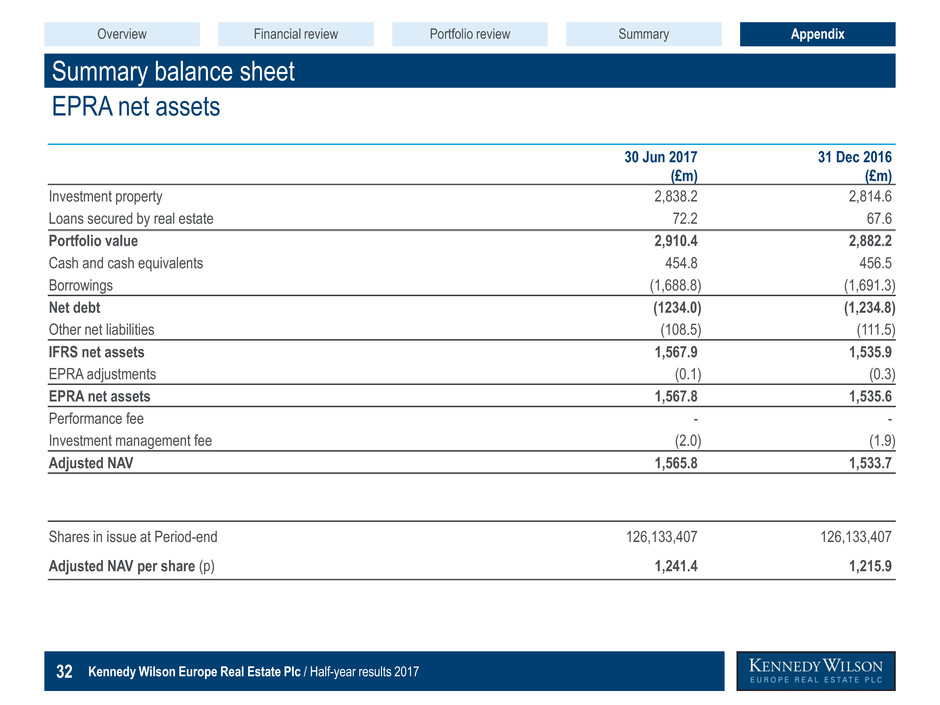
Kennedy Wilson Europe Real Estate Plc / Half-year results 2017 32 Summary balance sheet EPRA net assets Dark Blue R=23 G=67 B=110 Medium Blue R=125 G=151 B=174 Light Blue R=162 G=187 B=210 Pale Blue R=234 G=234 B=240 Medium Dark Blue R=76 G=87 B=123 Turquoise R=0 G=157 B=224 Dark Grey R=55 G=55 B=55 Light Grey R=164 G=163 B=166 Purple R=151 G=154 B=104 Light Purple R=216 G=187 B=202 Bright Green R=54 G=154 B=55 Mid Green R=134 G=181 B=108 Light Green R=206 G=222 B=192 30 Jun 2017 (£m) 31 Dec 2016 (£m) Investment property 2,838.2 2,814.6 Loans secured by real estate 72.2 67.6 Portfolio value 2,910.4 2,882.2 Cash and cash equivalents 454.8 456.5 Borrowings (1,688.8) (1,691.3) Net debt (1234.0) (1,234.8) Other net liabilities (108.5) (111.5) IFRS net assets 1,567.9 1,535.9 EPRA adjustments (0.1) (0.3) EPRA net assets 1,567.8 1,535.6 Performance fee - - Investment management fee (2.0) (1.9) Adjusted NAV 1,565.8 1,533.7 Shares in issue at Period-end 126,133,407 126,133,407 Adjusted NAV per share (p) 1,241.4 1,215.9 Overview Financial review Portfolio review Appendix Summary
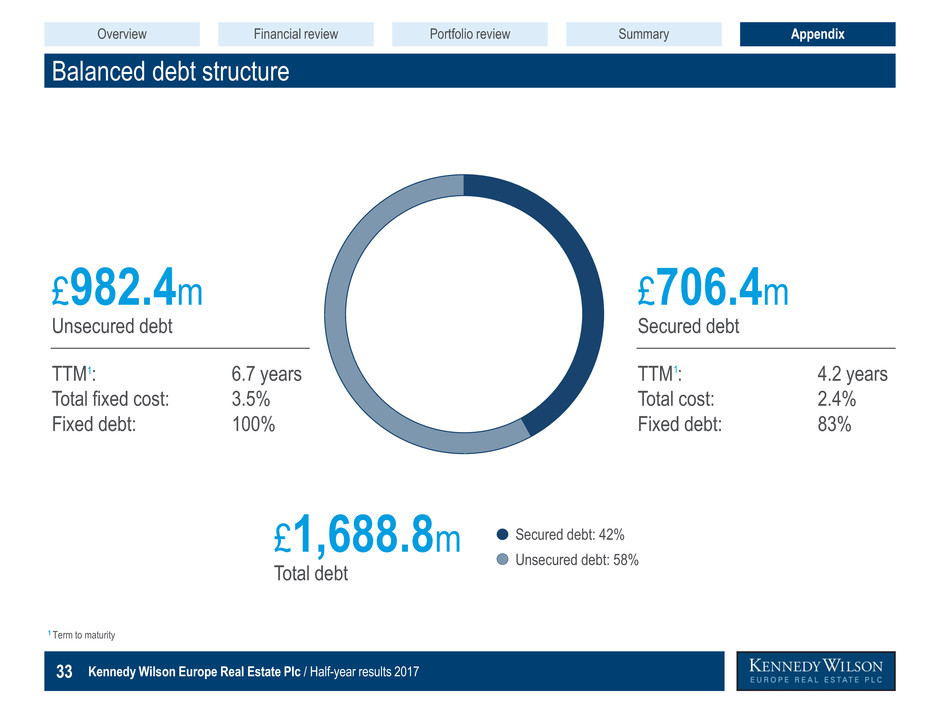
Kennedy Wilson Europe Real Estate Plc / Half-year results 2017 33 Balanced debt structure Dark Blue R=23 G=67 B=110 Medium Blue R=125 G=151 B=174 Light Blue R=162 G=187 B=210 Pale Blue R=234 G=234 B=240 Medium Dark Blue R=76 G=87 B=123 Turquoise R=0 G=157 B=224 Dark Grey R=55 G=55 B=55 Light Grey R=164 G=163 B=166 Purple R=151 G=154 B=104 Light Purple R=216 G=187 B=202 Bright Green R=54 G=154 B=55 Mid Green R=134 G=181 B=108 Light Green R=206 G=222 B=192 1 Term to maturity Secured debt: 42% Unsecured debt: 58% Unsecured debt £982.4m Secured debt £706.4m TTM : Total fixed cost: Fixed debt: TTM : Total cost: Fixed debt: 6.7 years 3.5% 100% 4.2 years 2.4% 83% Total debt £1,688.8m Overview Financial review Portfolio review Appendix Summary 1 1
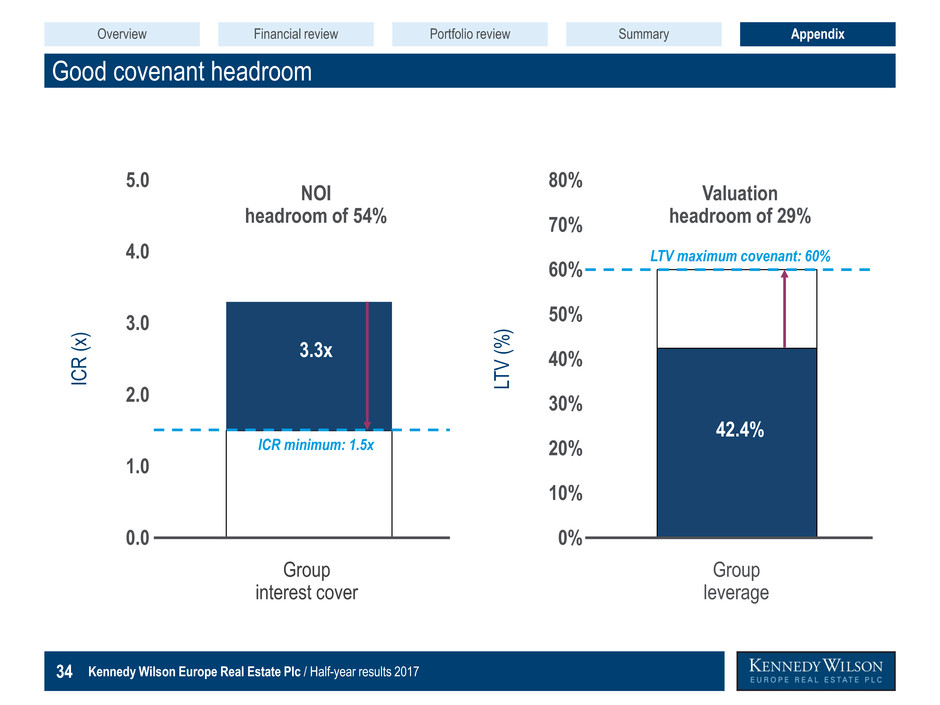
Kennedy Wilson Europe Real Estate Plc / Half-year results 2017 34 Good covenant headroom Dark Blue R=23 G=67 B=110 Medium Blue R=125 G=151 B=174 Light Blue R=162 G=187 B=210 Pale Blue R=234 G=234 B=240 Medium Dark Blue R=76 G=87 B=123 Turquoise R=0 G=157 B=224 Dark Grey R=55 G=55 B=55 Light Grey R=164 G=163 B=166 Purple R=151 G=154 B=104 Light Purple R=216 G=187 B=202 Bright Green R=54 G=154 B=55 Mid Green R=134 G=181 B=108 Light Green R=206 G=222 B=192 0% 10% 20% 30% 40% 50% 60% 70% 80% 0.0 1.0 2.0 3.0 4.0 5.0 ICR (x ) Group interest cover NOI headroom of 54% ICR minimum: 1.5x 3.3x LT V ( % ) Group leverage Valuation headroom of 29% LTV maximum covenant: 60% 42.4% Overview Financial review Portfolio review Appendix Summary
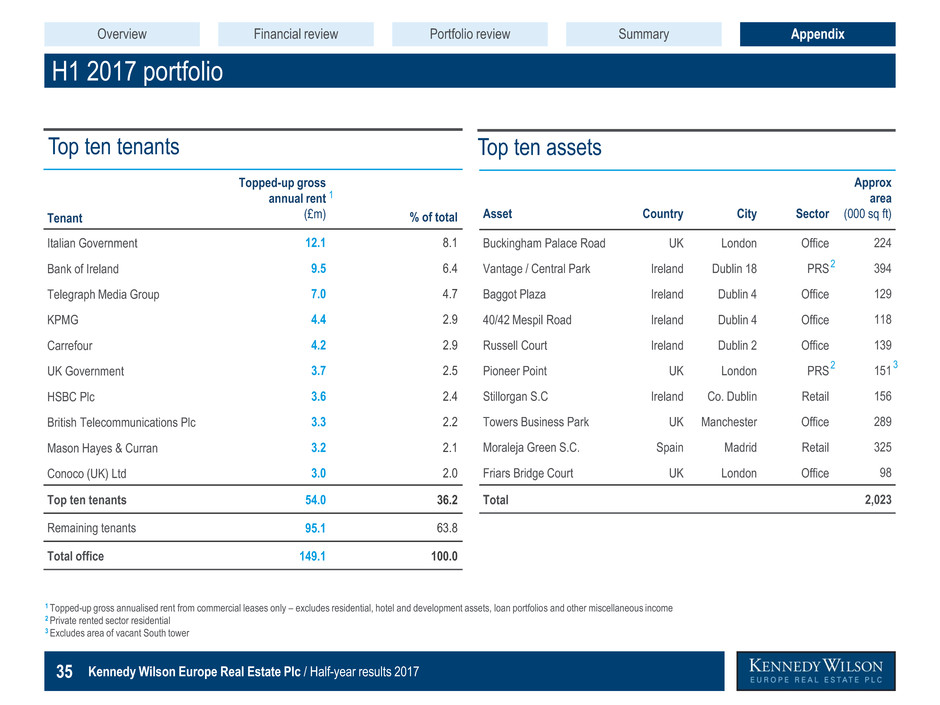
Kennedy Wilson Europe Real Estate Plc / Half-year results 2017 35 H1 2017 portfolio Dark Blue R=23 G=67 B=110 Medium Blue R=125 G=151 B=174 Light Blue R=162 G=187 B=210 Pale Blue R=234 G=234 B=240 Medium Dark Blue R=76 G=87 B=123 Turquoise R=0 G=157 B=224 Dark Grey R=55 G=55 B=55 Light Grey R=164 G=163 B=166 Purple R=151 G=154 B=104 Light Purple R=216 G=187 B=202 Bright Green R=54 G=154 B=55 Mid Green R=134 G=181 B=108 Light Green R=206 G=222 B=192 Tenant Topped-up gross annual rent (£m) % of total Italian Government 12.1 8.1 Bank of Ireland 9.5 6.4 Telegraph Media Group 7.0 4.7 KPMG 4.4 2.9 Carrefour 4.2 2.9 UK Government 3.7 2.5 HSBC Plc 3.6 2.4 British Telecommunications Plc 3.3 2.2 Mason Hayes & Curran 3.2 2.1 Conoco (UK) Ltd 3.0 2.0 Top ten tenants 54.0 36.2 Remaining tenants 95.1 63.8 Total office 149.1 100.0 Top ten tenants Top ten assets Asset Country City Sector Approx area (000 sq ft) Buckingham Palace Road UK London Office 224 Vantage / Central Park Ireland Dublin 18 PRS 394 Baggot Plaza Ireland Dublin 4 Office 129 40/42 Mespil Road Ireland Dublin 4 Office 118 Russell Court Ireland Dublin 2 Office 139 Pioneer Point UK London PRS 151 Stillorgan S.C Ireland Co. Dublin Retail 156 Towers Business Park UK Manchester Office 289 Moraleja Green S.C. Spain Madrid Retail 325 Friars Bridge Court UK London Office 98 Total 2,023 1 Topped-up gross annualised rent from commercial leases only – excludes residential, hotel and development assets, loan portfolios and other miscellaneous income 2 Private rented sector residential 3 Excludes area of vacant South tower 1 2 2 3 Overview Financial review Portfolio review Appendix Summary
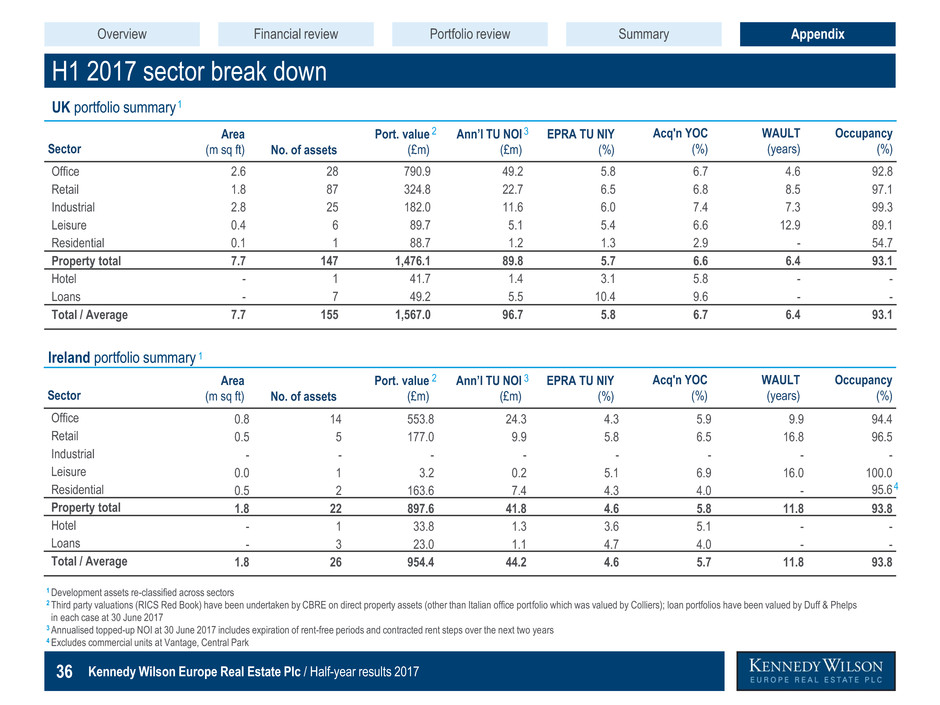
Kennedy Wilson Europe Real Estate Plc / Half-year results 2017 36 H1 2017 sector break down Dark Blue R=23 G=67 B=110 Medium Blue R=125 G=151 B=174 Light Blue R=162 G=187 B=210 Pale Blue R=234 G=234 B=240 Medium Dark Blue R=76 G=87 B=123 Turquoise R=0 G=157 B=224 Dark Grey R=55 G=55 B=55 Light Grey R=164 G=163 B=166 Purple R=151 G=154 B=104 Light Purple R=216 G=187 B=202 Bright Green R=54 G=154 B=55 Mid Green R=134 G=181 B=108 Light Green R=206 G=222 B=192 Sector Area (m sq ft) No. of assets Port. value (£m) Ann’l TU NOI (£m) EPRA TU NIY (%) Acq'n YOC (%) WAULT (years) Occupancy (%) Office 2.6 28 790.9 49.2 5.8 6.7 4.6 92.8 Retail 1.8 87 324.8 22.7 6.5 6.8 8.5 97.1 Industrial 2.8 25 182.0 11.6 6.0 7.4 7.3 99.3 Leisure 0.4 6 89.7 5.1 5.4 6.6 12.9 89.1 Residential 0.1 1 88.7 1.2 1.3 2.9 - 54.7 Property total 7.7 147 1,476.1 89.8 5.7 6.6 6.4 93.1 Hotel - 1 41.7 1.4 3.1 5.8 - - Loans - 7 49.2 5.5 10.4 9.6 - - Total / Average 7.7 155 1,567.0 96.7 5.8 6.7 6.4 93.1 UK portfolio summary Sector Area (m sq ft) No. of assets Port. value (£m) Ann’l TU NOI (£m) EPRA TU NIY (%) Acq'n YOC (%) WAULT (years) Occupancy (%) Office 0.8 14 553.8 24.3 4.3 5.9 9.9 94.4 Retail 0.5 5 177.0 9.9 5.8 6.5 16.8 96.5 Industrial - - - - - - - - Leisure 0.0 1 3.2 0.2 5.1 6.9 16.0 100.0 Residential 0.5 2 163.6 7.4 4.3 4.0 - 95.6 Property total 1.8 22 897.6 41.8 4.6 5.8 11.8 93.8 Hotel - 1 33.8 1.3 3.6 5.1 - - Loans - 3 23.0 1.1 4.7 4.0 - - Total / Average 1.8 26 954.4 44.2 4.6 5.7 11.8 93.8 Ireland portfolio summary 1 Development assets re-classified across sectors 2 Third party valuations (RICS Red Book) have been undertaken by CBRE on direct property assets (other than Italian office portfolio which was valued by Colliers); loan portfolios have been valued by Duff & Phelps 2 in each case at 30 June 2017 3 Annualised topped-up NOI at 30 June 2017 includes expiration of rent-free periods and contracted rent steps over the next two years 4 Excludes commercial units at Vantage, Central Park 2 3 2 3 4 Overview Financial review Portfolio review Appendix Summary 1 1
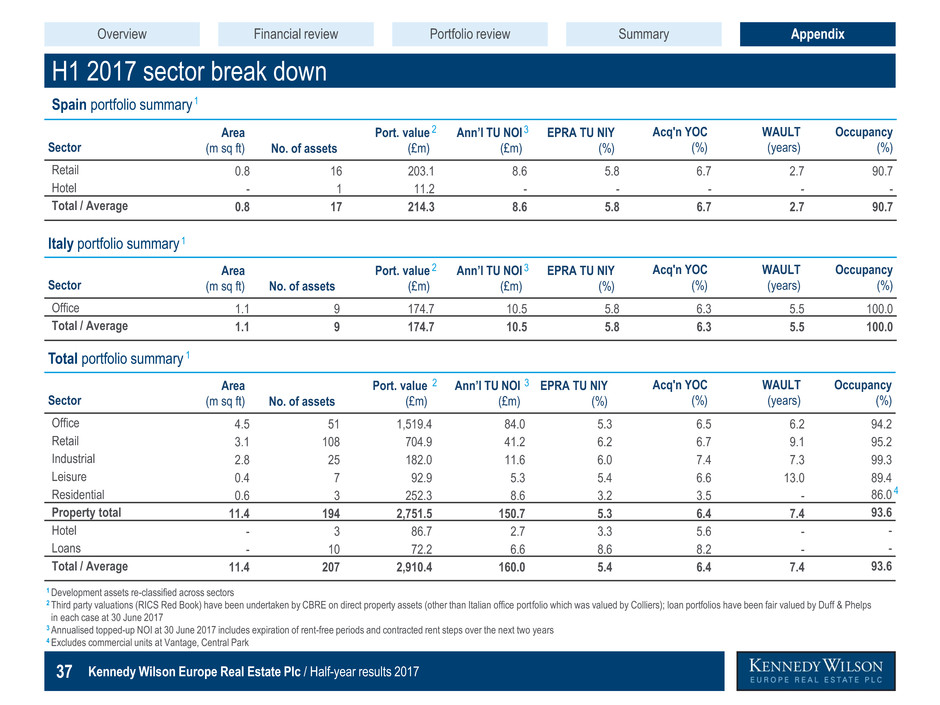
Kennedy Wilson Europe Real Estate Plc / Half-year results 2017 37 H1 2017 sector break down Dark Blue R=23 G=67 B=110 Medium Blue R=125 G=151 B=174 Light Blue R=162 G=187 B=210 Pale Blue R=234 G=234 B=240 Medium Dark Blue R=76 G=87 B=123 Turquoise R=0 G=157 B=224 Dark Grey R=55 G=55 B=55 Light Grey R=164 G=163 B=166 Purple R=151 G=154 B=104 Light Purple R=216 G=187 B=202 Bright Green R=54 G=154 B=55 Mid Green R=134 G=181 B=108 Light Green R=206 G=222 B=192 Sector Area (m sq ft) No. of assets Port. value (£m) Ann’l TU NOI (£m) EPRA TU NIY (%) Acq'n YOC (%) WAULT (years) Occupancy (%) Retail 0.8 16 203.1 8.6 5.8 6.7 2.7 90.7 Hotel - 1 11.2 - - - - - Total / Average 0.8 17 214.3 8.6 5.8 6.7 2.7 90.7 Spain portfolio summary Sector Area (m sq ft) No. of assets Port. value (£m) Ann’l TU NOI (£m) EPRA TU NIY (%) Acq'n YOC (%) WAULT (years) Occupancy (%) Office 4.5 51 1,519.4 84.0 5.3 6.5 6.2 94.2 Retail 3.1 108 704.9 41.2 6.2 6.7 9.1 95.2 Industrial 2.8 25 182.0 11.6 6.0 7.4 7.3 99.3 Leisure 0.4 7 92.9 5.3 5.4 6.6 13.0 89.4 Residential 0.6 3 252.3 8.6 3.2 3.5 - 86.0 Property total 11.4 194 2,751.5 150.7 5.3 6.4 7.4 93.6 Hotel - 3 86.7 2.7 3.3 5.6 - - Loans - 10 72.2 6.6 8.6 8.2 - - Total / Average 11.4 207 2,910.4 160.0 5.4 6.4 7.4 93.6 Total portfolio summary Sector Area (m sq ft) No. of assets Port. value (£m) Ann’l TU NOI (£m) EPRA TU NIY (%) Acq'n YOC (%) WAULT (years) Occupancy (%) Office 1.1 9 174.7 10.5 5.8 6.3 5.5 100.0 Total / Average 1.1 9 174.7 10.5 5.8 6.3 5.5 100.0 Italy portfolio summary 1 Development assets re-classified across sectors 2 Third party valuations (RICS Red Book) have been undertaken by CBRE on direct property assets (other than Italian office portfolio which was valued by Colliers); loan portfolios have been fair valued by Duff & Phelps 2 in each case at 30 June 2017 3 Annualised topped-up NOI at 30 June 2017 includes expiration of rent-free periods and contracted rent steps over the next two years 4 Excludes commercial units at Vantage, Central Park 2 3 2 3 2 3 4 Overview Financial review Portfolio review Appendix Summary 1 1 1
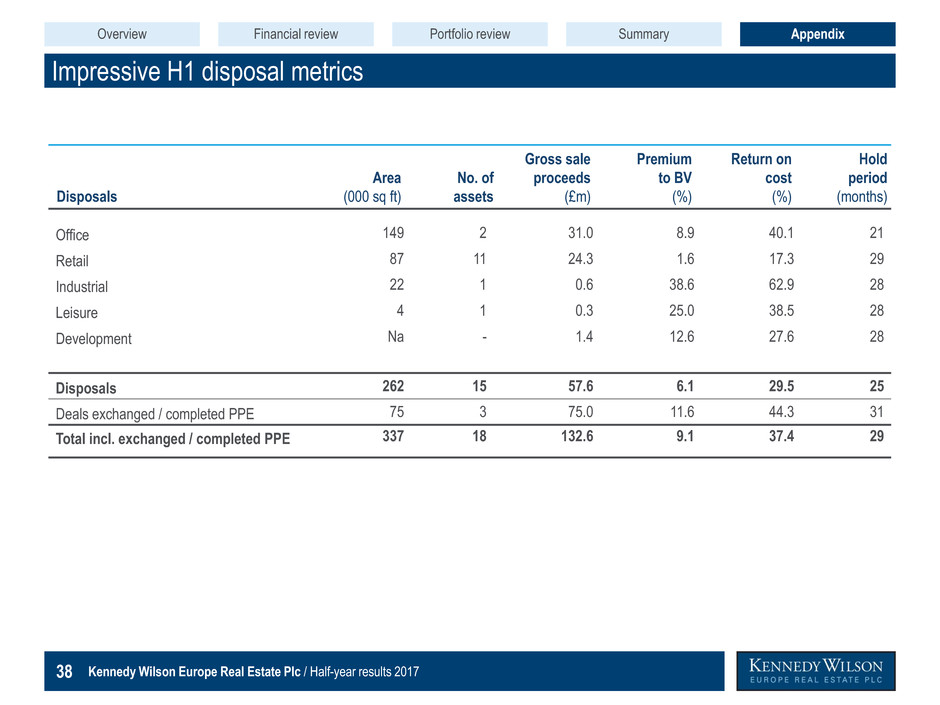
Kennedy Wilson Europe Real Estate Plc / Half-year results 2017 38 Impressive H1 disposal metrics Dark Blue R=23 G=67 B=110 Medium Blue R=125 G=151 B=174 Light Blue R=162 G=187 B=210 Pale Blue R=234 G=234 B=240 Medium Dark Blue R=76 G=87 B=123 Turquoise R=0 G=157 B=224 Dark Grey R=55 G=55 B=55 Light Grey R=164 G=163 B=166 Purple R=151 G=154 B=104 Light Purple R=216 G=187 B=202 Bright Green R=54 G=154 B=55 Mid Green R=134 G=181 B=108 Light Green R=206 G=222 B=192 Disposals Area (000 sq ft) No. of assets Gross sale proceeds (£m) Premium to BV (%) Return on cost (%) Hold period (months) Office 149 2 31.0 8.9 40.1 21 Retail 87 11 24.3 1.6 17.3 29 Industrial 22 1 0.6 38.6 62.9 28 Leisure 4 1 0.3 25.0 38.5 28 Development Na - 1.4 12.6 27.6 28 Disposals 262 15 57.6 6.1 29.5 25 Deals exchanged / completed PPE 75 3 75.0 11.6 44.3 31 Total incl. exchanged / completed PPE 337 18 132.6 9.1 37.4 29 Overview Financial review Portfolio review Appendix Summary
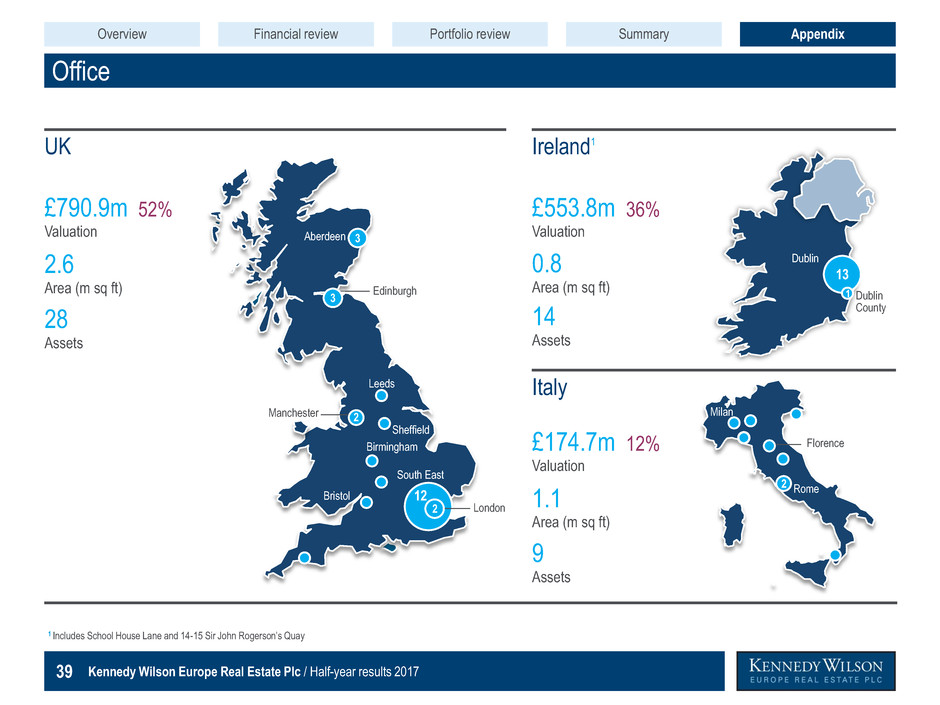
Kennedy Wilson Europe Real Estate Plc / Half-year results 2017 39 Office Dark Blue R=23 G=67 B=110 Medium Blue R=125 G=151 B=174 Light Blue R=162 G=187 B=210 Pale Blue R=234 G=234 B=240 Medium Dark Blue R=76 G=87 B=123 Turquoise R=0 G=157 B=224 Dark Grey R=55 G=55 B=55 Light Grey R=164 G=163 B=166 Purple R=151 G=154 B=104 Light Purple R=216 G=187 B=202 Bright Green R=54 G=154 B=55 Mid Green R=134 G=181 B=108 Light Green R=206 G=222 B=192 1 Includes School House Lane and 14-15 Sir John Rogerson’s Quay 13 Dublin Rome Milan Florence 3 Aberdeen Edinburgh Manchester Leeds Sheffield Birmingham Bristol London 12 2 South East £174.7m 12% Valuation 1.1 Area (m sq ft) 9 Assets £553.8m 36% Valuation 0.8 Area (m sq ft) 14 Assets £790.9m 52% Valuation 2.6 Area (m sq ft) 28 Assets 2 2 Dublin County 1 UK Ireland Italy 1 3 Overview Financial review Portfolio review Appendix Summary
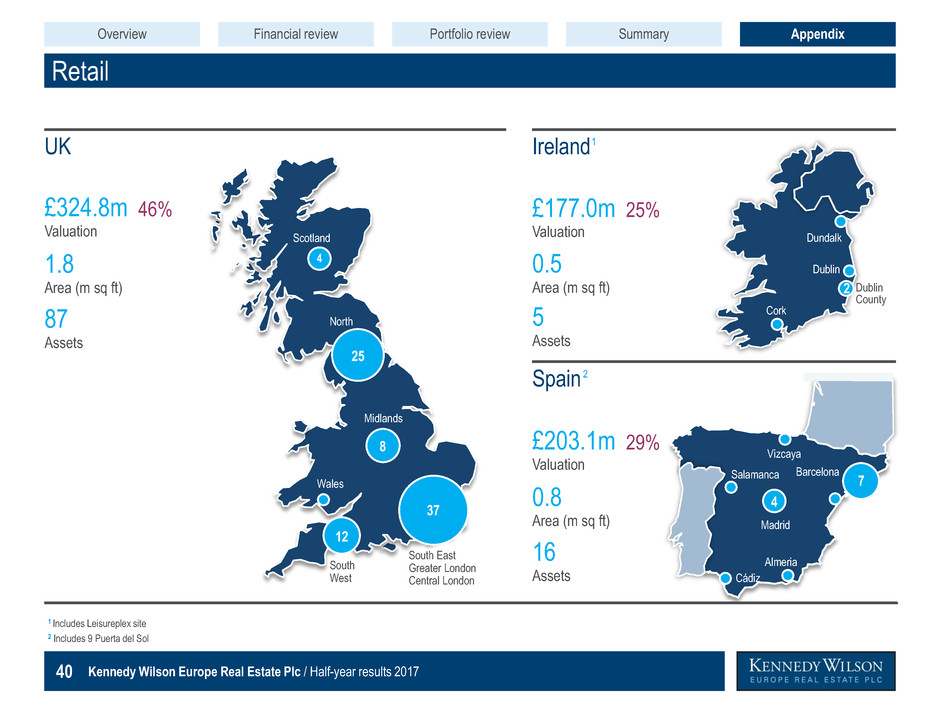
Kennedy Wilson Europe Real Estate Plc / Half-year results 2017 40 Retail Dark Blue R=23 G=67 B=110 Medium Blue R=125 G=151 B=174 Light Blue R=162 G=187 B=210 Pale Blue R=234 G=234 B=240 Medium Dark Blue R=76 G=87 B=123 Turquoise R=0 G=157 B=224 Dark Grey R=55 G=55 B=55 Light Grey R=164 G=163 B=166 Purple R=151 G=154 B=104 Light Purple R=216 G=187 B=202 Bright Green R=54 G=154 B=55 Mid Green R=134 G=181 B=108 Light Green R=206 G=222 B=192 1 Includes Leisureplex site 2 Includes 9 Puerta del Sol £203.1m 29% Valuation 0.8 Area (m sq ft) 16 Assets £177.0m 25% Valuation 0.5 Area (m sq ft) 5 Assets £324.8m 46% Valuation 1.8 Area (m sq ft) 87 Assets 4 Scotland Wales 12 South West 8 Midlands 37 25 North South East Greater London Central London Almeria Cádiz Salamanca Madrid 4 Vizcaya 7 Barcelona Cork Dundalk Dublin Dublin County 2 UK Ireland Spain 1 2 Overview Financial review Portfolio review Appendix Summary
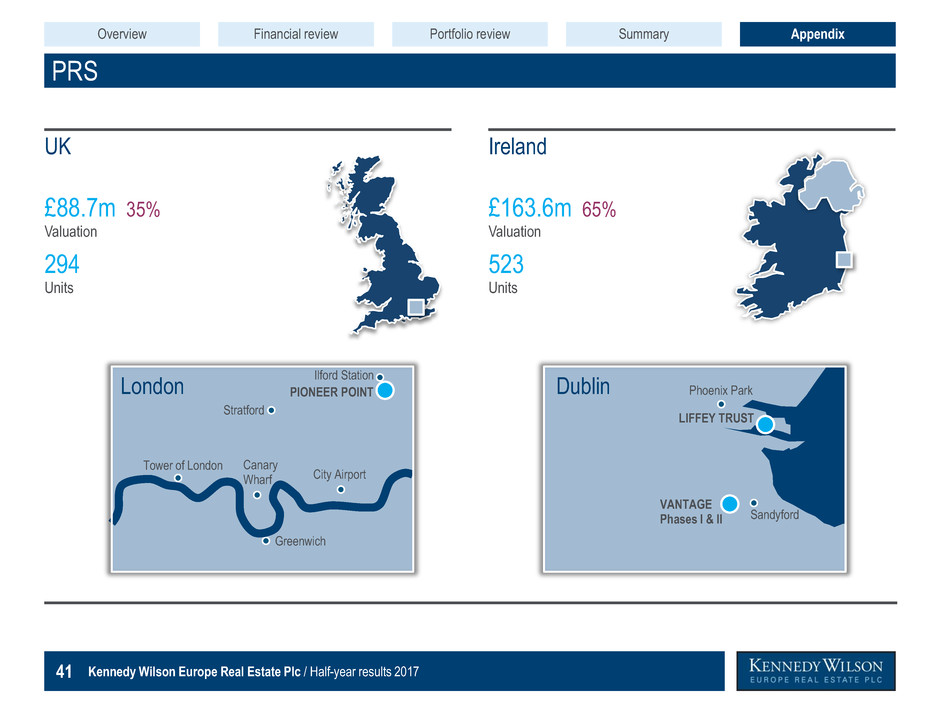
Kennedy Wilson Europe Real Estate Plc / Half-year results 2017 41 PRS Dark Blue R=23 G=67 B=110 Medium Blue R=125 G=151 B=174 Light Blue R=162 G=187 B=210 Pale Blue R=234 G=234 B=240 Medium Dark Blue R=76 G=87 B=123 Turquoise R=0 G=157 B=224 Dark Grey R=55 G=55 B=55 Light Grey R=164 G=163 B=166 Purple R=151 G=154 B=104 Light Purple R=216 G=187 B=202 Bright Green R=54 G=154 B=55 Mid Green R=134 G=181 B=108 Light Green R=206 G=222 B=192 Stratford Canary Wharf City Airport Greenwich Tower of London PIONEER POINT £88.7m 35% Valuation London £163.6m 65% Valuation 523 Units 294 Units Dublin VANTAGE Phases I & II LIFFEY TRUST Phoenix Park Sandyford Ilford Station UK Ireland Overview Financial review Portfolio review Appendix Summary
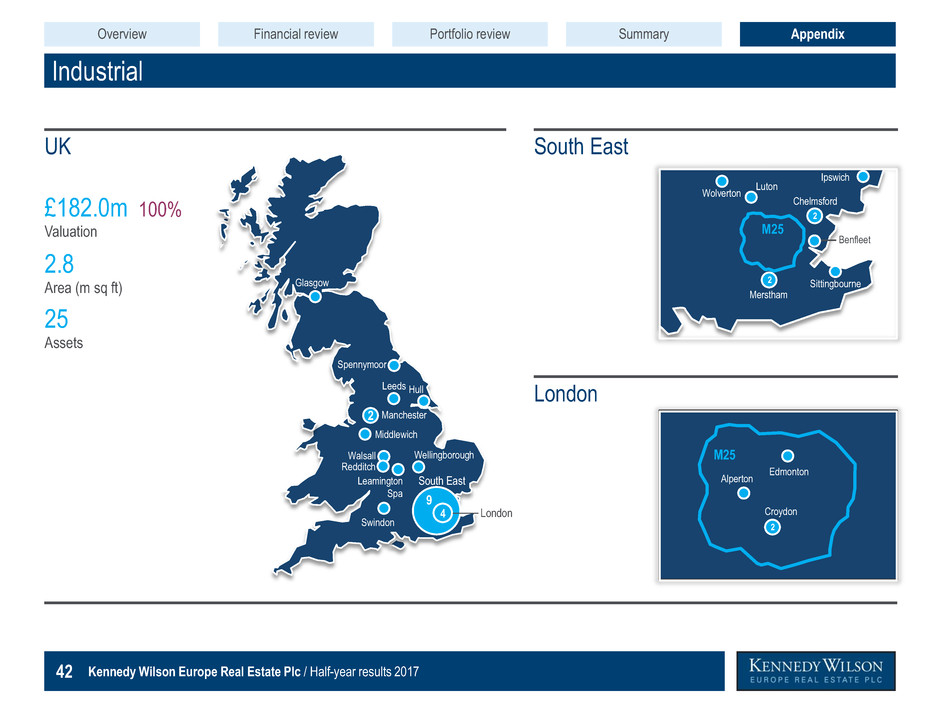
Kennedy Wilson Europe Real Estate Plc / Half-year results 2017 42 Industrial Dark Blue R=23 G=67 B=110 Medium Blue R=125 G=151 B=174 Light Blue R=162 G=187 B=210 Pale Blue R=234 G=234 B=240 Medium Dark Blue R=76 G=87 B=123 Turquoise R=0 G=157 B=224 Dark Grey R=55 G=55 B=55 Light Grey R=164 G=163 B=166 Purple R=151 G=154 B=104 Light Purple R=216 G=187 B=202 Bright Green R=54 G=154 B=55 Mid Green R=134 G=181 B=108 Light Green R=206 G=222 B=192 Glasgow Manchester 2 Leeds Walsall Middlewich Wellingborough Swindon London 9 4 South East £182.0m 100% Valuation 2.8 Area (m sq ft) 25 Assets M25 Merstham Sittingbourne Chelmsford Luton Wolverton Ipswich Benfleet 2 Edmonton Croydon Alperton M25 2 2 UK South East London Hull Spennymoor Leamington Spa Redditch Overview Financial review Portfolio review Appendix Summary
Kennedy Wilson Europe Real Estate Plc / Half-year results 2017 43 Disclaimer Dark Blue R=23 G=67 B=110 Medium Blue R=125 G=151 B=174 Light Blue R=162 G=187 B=210 Pale Blue R=234 G=234 B=240 Medium Dark Blue R=76 G=87 B=123 Turquoise R=0 G=157 B=224 Dark Grey R=55 G=55 B=55 Light Grey R=164 G=163 B=166 Purple R=151 G=154 B=104 Light Purple R=216 G=187 B=202 Bright Green R=54 G=154 B=55 Mid Green R=134 G=181 B=108 Light Green R=206 G=222 B=192 This presentation is being provided to you for information purposes only. This presentation does not constitute an offering of securities or otherwise constitute an offer or invitation or inducement to any person to underwrite, subscribe for or otherwise acquire or dispose of securities in Kennedy Wilson Europe Real Estate Plc (“KWE”, and together with its subsidiaries, the “PLC Group”). KWE has not been, and will not be, registered under the US Investment Company Act of 1940, as amended. KWE's assets are managed by KW Investment Management Ltd (the “Investment Manager”), an indirect wholly owned subsidiary of Kennedy-Wilson Holdings, Inc. This presentation may not be reproduced in any form, further distributed or passed on, directly or indirectly, to any other person, or published, in whole or in part, for any purpose. Certain statements in this presentation are forward-looking statements which are based on the PLC Group's expectations, intentions and projections regarding its future performance, anticipated events or trends and other matters that are not historical facts. These statements are not guarantees of future performance and are subject to known and unknown risks, uncertainties and other factors that could cause actual results to differ materially from those expressed or implied by such forward-looking statements. Factors that would cause actual results or events to differ from current expectations, intentions or projections might include, amongst other things, changes in property prices, changes in equity markets, political risks, changes to regulations affecting the PLC Group's activities and delays in obtaining or failure to obtain any required regulatory approval. Given these risks and uncertainties, readers should not place undue reliance on forward-looking statements. Forward-looking statements speak only as of the date of such statements and, except as required by applicable law, no member of the PLC Group undertakes any obligation to update or revise publicly any forward- looking statements, whether as a result of new information, future events or otherwise. Past performance is no guide to future performance and persons needing advice should consult an independent financial adviser. Nothing in this presentation should be construed as a profit forecast. The information in this presentation, which does not purport to be comprehensive, has not been verified by the PLC Group or any other person. No representation or warranty, express or implied, is or will be given by any member of the PLC Group or its directors, officers, employees or advisers or any other person as to the accuracy or completeness of the presentation or any projections, targets, estimates, forecasts or opinions contained therein and, so far as permitted by law, no responsibility or liability is accepted for the accuracy or sufficiency thereof, or for any errors, omissions or miss- statements, negligent or otherwise, relating thereto. In particular, but without limitation, (subject as aforesaid) no representation or warranty, express or implied, is given as to the achievement or reasonableness of, and no reliance should be placed on any projections, targets, estimates or forecasts and nothing in this presentation is or should be relied on as a promise or representation as to the future. Accordingly, (subject as aforesaid), no member of the PLC Group, nor any of its directors, officers, employees or advisers, nor any other person, shall be liable for any direct, indirect or consequential loss or damage suffered by any person as a result of relying on any statement in or omission from the presentation or any other written or oral communication with the recipient or its advisers in connection with the presentation and (save in the case of fraudulent misrepresentation or wilful non-disclosure) any such liability is expressly disclaimed. The market data in the presentation has been sourced from third parties and has been so identified. In furnishing this presentation, the PLC Group does not undertake any obligation to provide any additional information or to update this presentation or to correct any inaccuracies that may become apparent. All property valuations in this presentation at 30 June 2017 have been undertaken by third party external valuers under RICS Red Book. CBRE have valued the direct property assets (other than the Italian office portfolio which was valued by Colliers) and the loan portfolios have been valued by Duff & Phelps, in each case at 30 June 2017. Unless stated otherwise, information presented “to date” is information as at 3 August 2017 or for the period from 1 July 2017 to 3 August 2017, and any PPE information presented under “PPE” is information for the period from 1 July 2017 to 3 August 2017. Unless stated otherwise, where balance sheet amounts in this presentation are presented in both £ and €, the £ amount has been calculated based on an exchange rate of €1:£0.87710, which was the rate on 30 June 2017. Income Statement amounts were translated at the average rate for the period. Certain figures included in this presentation have been rounded to the nearest whole number. Overview Financial review Portfolio review Appendix Summary


