Exhibit 99.2

First Quarter 2013 Earnings Presentation May 1, 2013 msci.com
Forward‐Looking Statements and Other Information Forward‐Looking Statements – Safe Harbor Statements This presentation may contain forward‐looking statements within the meaning of the Private Securities Litigation Reform Act of 1995. You should not place undue reliance on forward‐looking statements because they involve known and unknown forward risks, uncertainties and other factors that are, in some cases, beyond our control and that could materially affect actual results, levels of activity, performance or achievements. For a discussion of risk and uncertainties that could materially affect actual results, levels of activity, performance or achievements, please see the Company’s Annual Report on Form 10‐K for the fiscal year ended December 31, 2012 and its other reports filed with the SEC. The forward‐looking statements included in this presentation represent the Company’s view as of the date of the presentation. The Company assumes no obligation to publicly update or revise these forward‐looking statements for any reason, whether as a result of new information, future events, or otherwise. Other Information Percentage changes and totals in this presentation may not sum due to rounding. Percentage changes are referenced to the comparable period in 2012, unless otherwise noted noted. Total sales equals recurring subscription sales and non‐recurring sales. Definitions of run rate and retention rate provided on page 14. msci.com 2
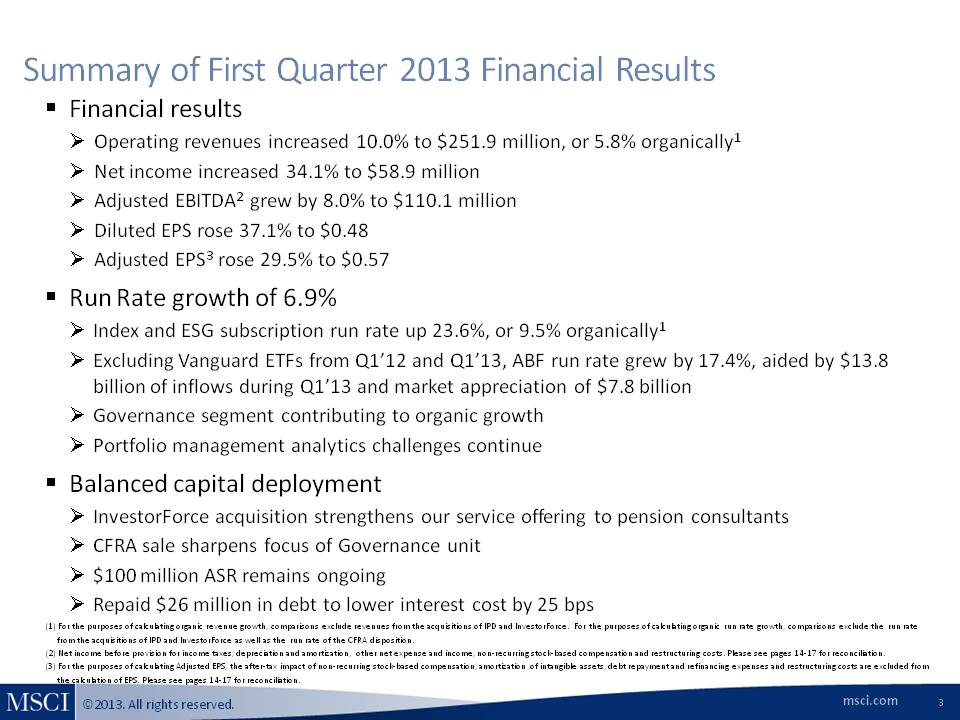
Summary of First Quarter 2013 Financial Results Financial results Operating revenues increased 10.0% to $251.9 million, or 5.8% organically1 Net income increased 34.1% to $58.9 million Adjusted EBITDA2 grew EBITDA by 8.0% to $110.1 million Diluted EPS rose 37.1% to $0.48 Adjusted EPS3 rose 29.5% to $0.57 Run Rate growth of 6.9% Index and ESG subscription run rate up 23.6%, or 9.5% organically1 Excluding Vanguard ETFs from Q1’12 and Q1’13, ABF run rate grew by 17.4%, aided by $13.8 billion of inflows during Q1’13 and market appreciation of $7.8 billion Governance segment contributing to organic growth Portfolio management analytics challenges continue Balanced capital deployment InvestorForce acquisition strengthens our service offering to pension consultants CFRA sale sharpens focus of Governance unit $100 million ASR remains ongoing Repaid $26 million in debt to lower interest cost by 25 bps (1) For the purposes of calculating organic revenue growth, comparisons exclude revenues from the acquisitions of IPD and InvestorForce. For the purposes of calculating organic run rate growth, comparisons exclude the run rate from the acquisitions of IPD and InvestorForce as well as the run rate of the CFRA disposition. (2) Net income before provision for income taxes, depreciation and amortization, other net expense and income, non‐recurring stock‐based compensation and restructuring costs. Please see pages 14‐17 for reconciliation. (3) For the purposes of calculating Adjusted EPS, the after‐tax impact of non‐recurring stock‐based compensation, amortization of intangible assets, debt repayment and refinancing expenses and restructuring costs are excluded from the calculation of EPS. Please see pages 14‐17 for reconciliation. msci.com 3
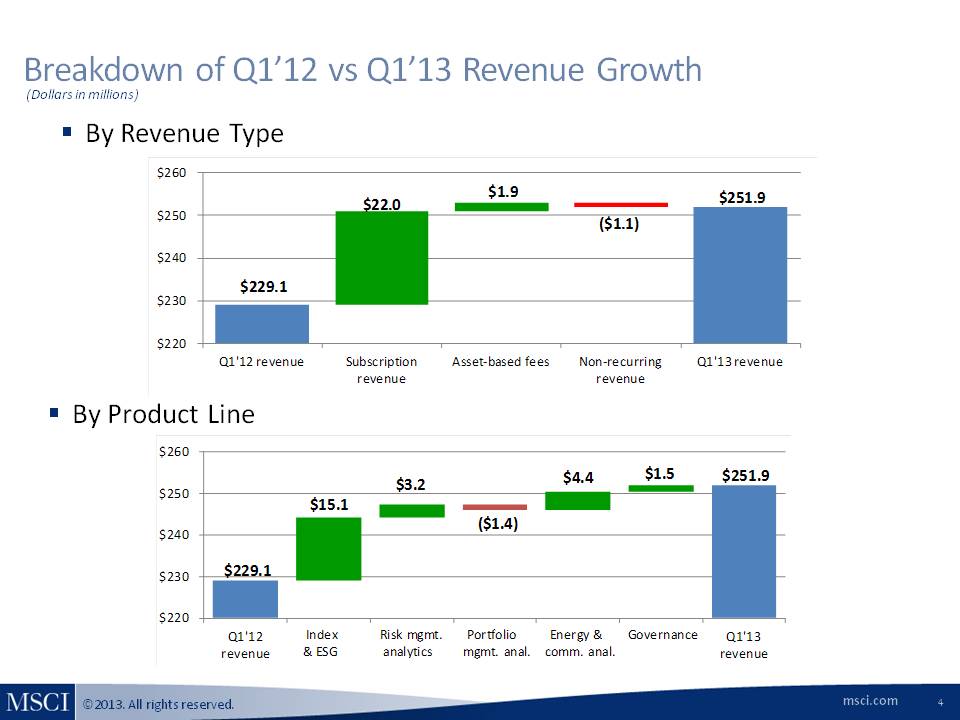
Breakdown of Q1’12 vs Q1’13 Revenue Growth (Dollars in millions) By Revenue Type $229.1 $22.0 $1.9 ($1.1) $251.9 Q1'12 revenue Subscription revenue Asset‐based fees Non‐recurring revenue Q1'13 revenue By Product Line $229.1 $15.1 $3.2 ($1.4) $4.4 $1.5 $251.9 Q1'12 revenue Index & ESG Risk mgmt. analytics Portfolio mgmt. anal. Energy & comm. anal. Governance Q1'13 revenue msci.com 4

Summary of First Quarter 2013 Operating Results (Dollars in millions) MSCI Total Run Rate $982 $134 $848 $919 $137 $782 ABF RR Growth: ‐2 % Subscription RR Growth: 8 % Q1'12 Q1'13 Subscription ABF Run rate (RR) grew YoY by 7% to $982 million Subscription run rate grew by 8%, or 3% organically Asset‐based fee (ABF) run rate declined YoY due to loss of Vanguard Currency changes ($7.5 million headwind) had a modest impact on subscription growth rate Total sales of $40 million, down 7% Recurring subscription sales of $31 million down 8% from Q1’12 Continued benefit from strong retention rates Total Sales and Retention Q1'12 Q1'13 Diff. Rec Sub Sales $ 34 $ 31 $ ‐8% Non‐Rec. Sales $ 9 $ 9 $ ‐4% Total Sales $ 43 $ 40 $ ‐7% Aggregate Retention 93% 92% ‐1% msci.com 5
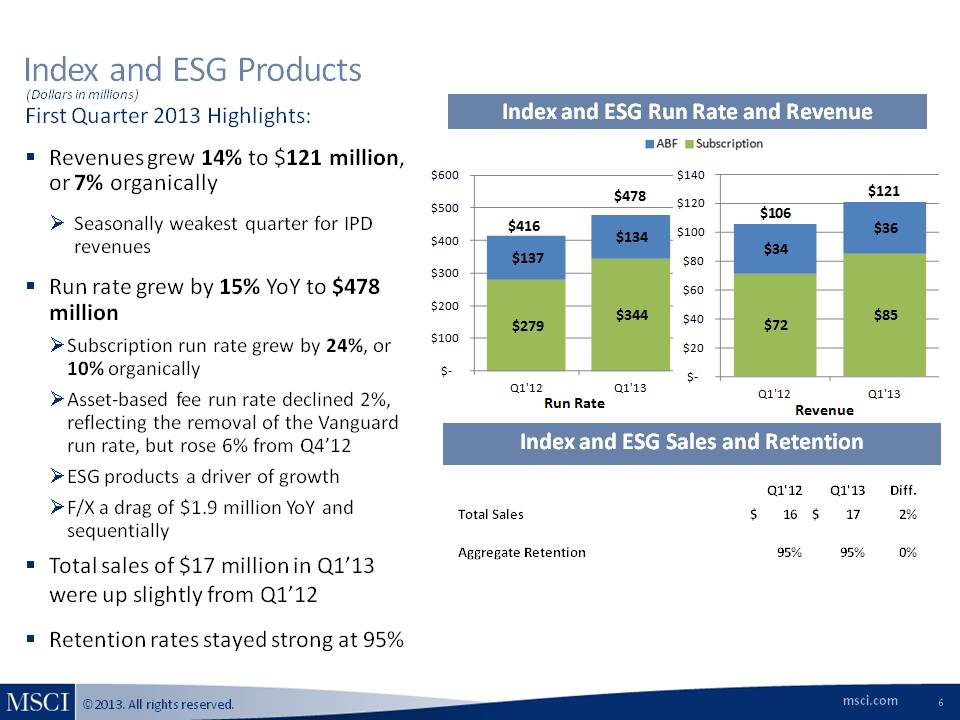
Index and ESG Products (Dollars in millions) First Quarter 2013 Highlights: Revenues grew 14% to $121 million, or 7% organically Seasonally weakest quarter for IPD revenues Run rate grew by 15% YoY to $478 million Subscription run rate grew by 24%, or 10% organically Asset‐based fee run rate declined 2%, reflecting the removal of the Vanguard run rate, but rose 6% from Q4’12 ESG products a driver of growth F/X a drag of $1.9 million YoY and sequentially Total sales of $17 million in Q1’13 were up slightly from Q1’12 Retention rates stayed strong at 95% Index and ESG Run Rate and Revenue ABF Subscription $416 $137 $279 $478 $134 $344 Q1'12 Q1'13 Run Rate $106 $34 $72 $121 $36 $85 Q1'12 Q1'13 Revenue Index and ESG Sales and Retention Q1'12 Q1'13 Diff. Total Sales $ 16 $ 17 $ 2% Aggregate Retention 95% 95% 0% msci.com 6
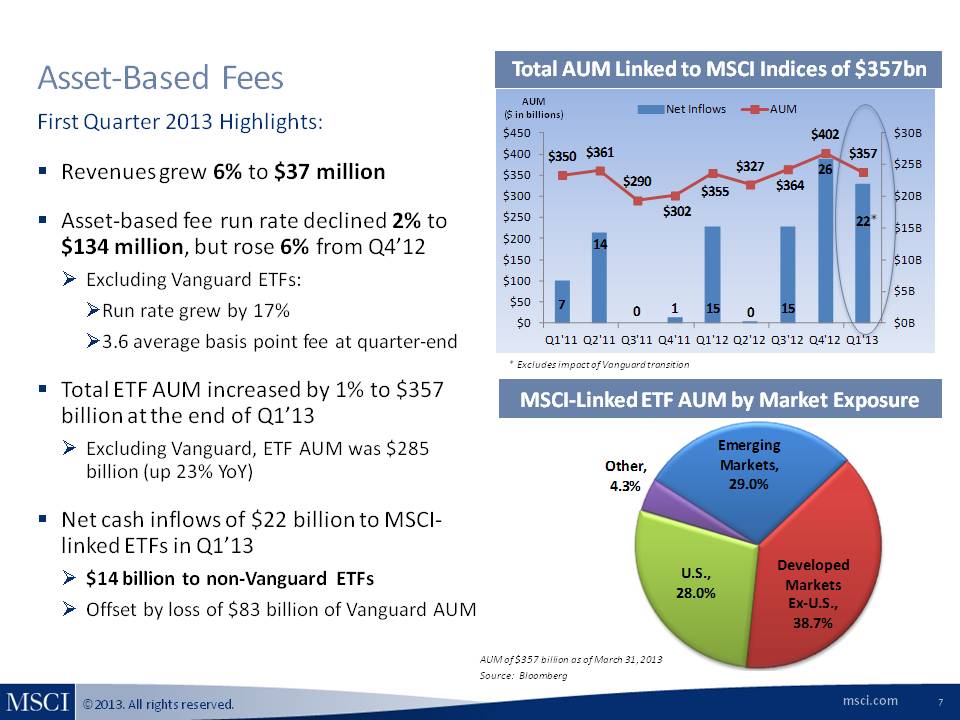
Asset‐Based Fees First Quarter 2013 Highlights: Revenues grew 6% to $37 million Asset‐based fee run rate declined 2% to $134 million, but rose 6% from Q4’12 Excluding Vanguard ETFs: Run rate grew by 17% 3.6 average basis point fee at quarter‐end Total ETF AUM increased by 1% to $357 billion at the end of Q1’13 Excluding Vanguard, ETF AUM was $285 billion (up 23% YoY) Net cash inflows of $22 billion to MSCI-linked ETFs in Q1’13 $14 billion to non‐Vanguard ETFs Offset by loss of $83 billion of Vanguard AUM Total AUM Linked to MSCI Indices of $357bn AUM ($ in billions) Net Inflows AUM $350 $361 $290 $302 $355 $327 $364 $402 $357 Q1'11 Q2'11 Q3'11 Q4'11 Q1'12 Q2'12 Q3'12 Q4'12 Q1'13 * Excludes impact of Vanguard transition MSCI‐Linked ETF AUM by Market Exposure Emerging Markets, 29.0% Other, 4.3% Developed Markets Ex‐U.S., 38.7% U.S., 28.0% AUM of $357 billion as of March 31, 2013 Source: Bloomberg msci.com 7

Risk Management Analytics (Dollars in millions) First Quarter 2013 Highlights: Revenues grew by 5% to $67 million, or 3% organically Run rate grew by 6% YoY to $275 million, or 3% organically Total sales of $11 million in Q1’13 Uptick in sales in Europe offset by weakness in other regions Business trends stable in Q1’13 Retention rates in Q1’13 stable at 94% InvestorForce integration underway New product introductions include upgrades to BarraOne and InvestorForce as well as enhanced performance attribution tools Risk Management Analytics Run Rate and Revenue $258 $275 Q1'12 Q1'13 $64 $67 Run Rate Revenues Risk Management Analytics Sales and Retention Q1'12 Q1'13 Diff. Total Sales $ 11 $ 11 $ 1% Aggregate Retention 94% 94% 0% msci.com 8
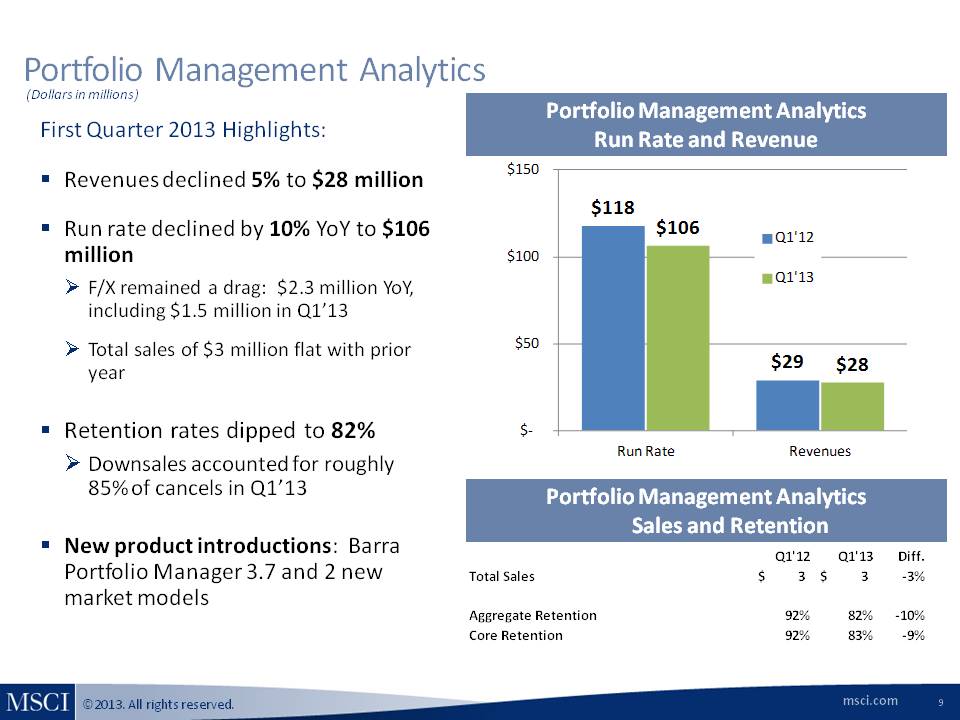
Portfolio Management Analytics (Dollars in millions) First Quarter 2013 Highlights: Revenues declined 5% to $28 million Run rate declined by 10% YoY to $106 million F/X remained a drag: $2.3 million YoY, including $1.5 million in Q1’13 Total sales of $3 million flat with prior year Retention rates dipped to 82% Downsales accounted for roughly 85% of cancels in Q1’13 New product introductions: Barra Portfolio Manager 3.7 and 2 new market models Portfolio Management Analytics Run Rate and Revenue $118 $106 Q1'12 Q1'13 $29 $28 Run Rate Revenues Portfolio Management Analytics Sales and Retention Q1'12 Q1'13 Diff. Total Sales $ 3 $ 3 ‐3% Aggregate Retention 92% 82% -10% Core Retention 92% 83% ‐9% msci.com 9
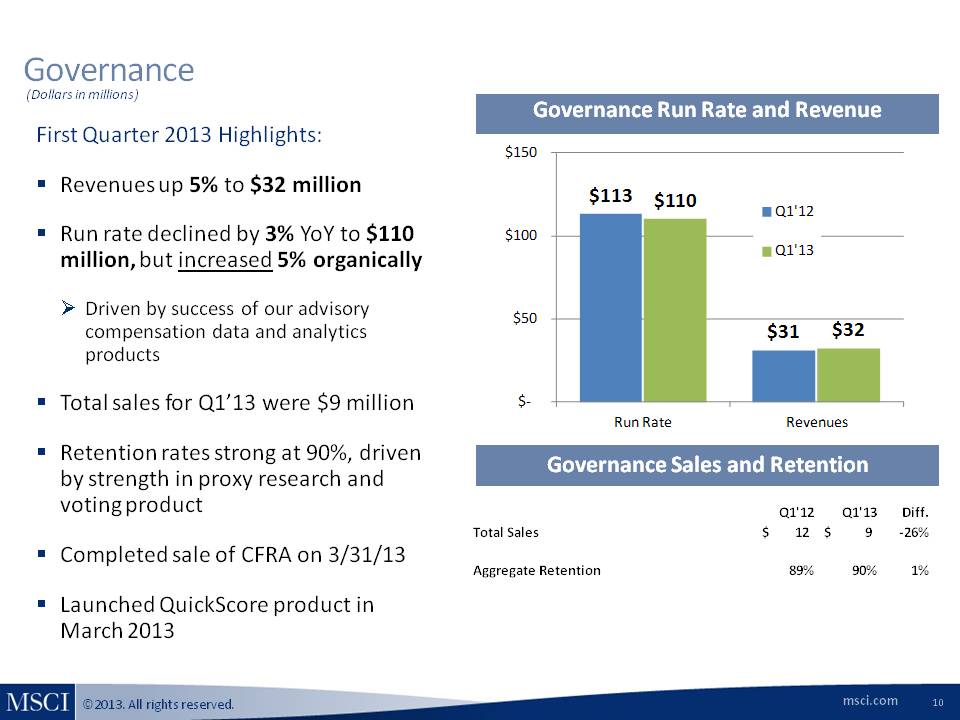
Governance (Dollars in millions) First Quarter 2013 Highlights: Revenues up 5% to $32 million Run rate declined by 3% YoY to $110 million, but increased 5% organically Driven by success of our advisory compensation data and analytics products Total sales for Q1’13 were $9 million Retention rates strong at 90%, driven by strength in proxy research and voting product Completed sale of CFRA on 3/31/13 Launched QuickScore product in March 2013 Governance Run Rate and Revenue $113 $110 Q1'12 Q1'13 $31 $32 Run Rate Revenues Governance Sales and Retention Q1’12 Q1’13 Diff. Total Sales $ 12 $ 9 ‐26% Aggregate Retention 89% 90% 1% msci.com 10
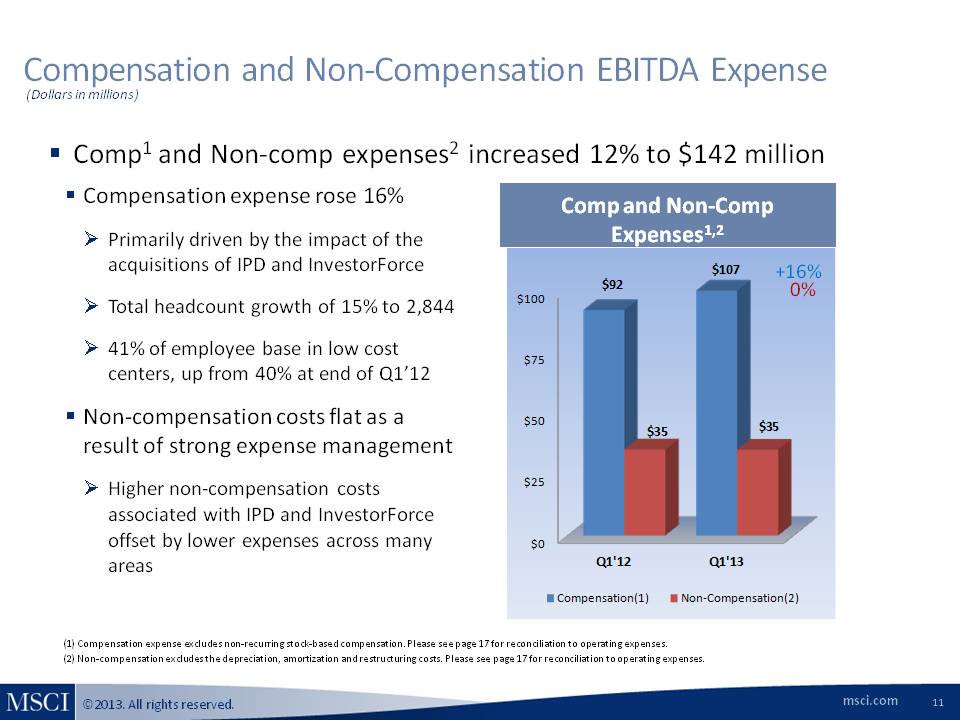
Compensation and Non‐Compensation EBITDA Expense (Dollars in millions) Comp1 and Non‐comp expenses2 increased 12% to $142 million Compensation expense rose 16% Primarily driven by the impact of the acquisitions of IPD and InvestorForce Total headcount growth of 15% to 2,844 41% of employee base in low cost centers, up from 40% at end of Q1’12 Non‐compensation costs flat as a result of strong expense management Higher non‐compensation costs associated with IPD and InvestorForce offset by lower expenses across many areas Comp and Non‐Comp Expenses1,2 $92 $107 +16% 0% $35 $35 Q1'12 Q1'13 Compensation(1) Non‐Compensation(2) (1) Compensation expense excludes non‐recurring stock‐based compensation. Please see page 17 for reconciliation to operating expenses. (2) Non‐compensation excludes the depreciation, amortization and restructuring costs. Please see page 17 for reconciliation to operating expenses. msci.com 11
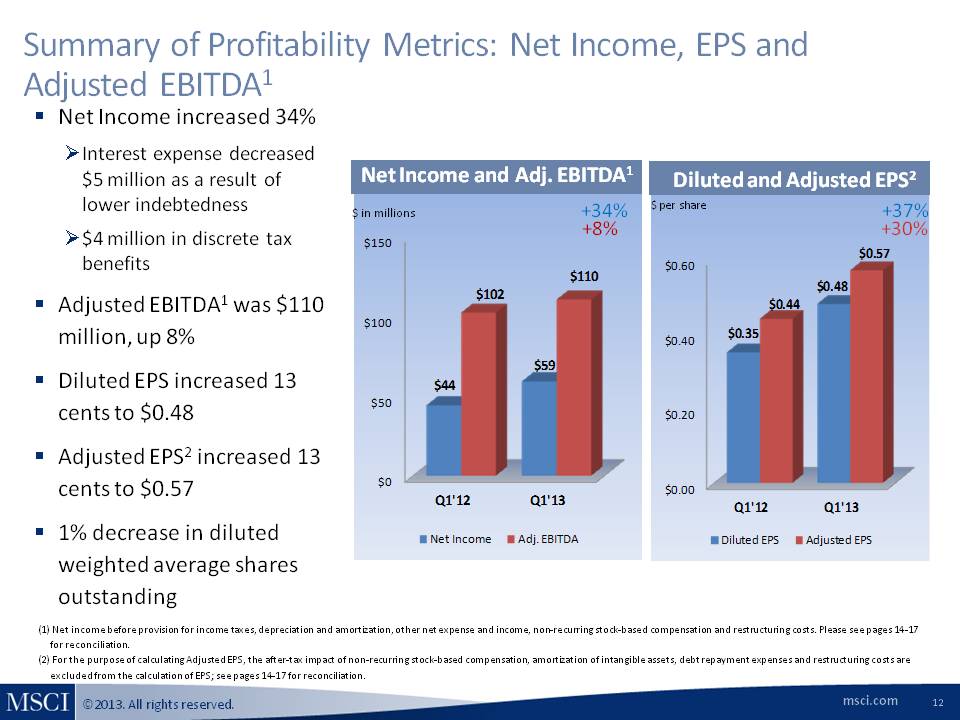
Summary of Profitability Metrics: Net Income, EPS and Adjusted EBITDA1 Net Income increased 34% Interest expense decreased $5 million as a result of lower indebtedness $4 million in discrete tax benefits Adjusted EBITDA1 was $110 million, up 8% Diluted EPS increased 13 cents to $0.48 Adjusted EPS2 increased 13 cents to $0.57 1% decrease in diluted weighted average shares outstanding Net Income and Adj. EBITDA1 $ in millions +34% +8% $44 $102 $59 $110 Q1'12 Q1'13 Net Income Adj. EBITDA Diluted and Adjusted EPS2 $ per share +37% +30% $0.35 $0.44 $0.48 $0.57 Q1'12 Q1'13 Diluted EPS Adjusted EPS (1) Net income before provision for income taxes, depreciation and amortization, other net expense and income, non‐recurring stock‐based compensation and restructuring costs. Please see pages 14‐17 for reconciliation. (2) For the purpose of calculating Adjusted EPS, the after‐tax impact of non‐recurring stock‐based compensation, amortization of intangible assets, debt repayment expenses and restructuring costs are excluded from the calculation of EPS; see pages 14‐17 for reconciliation. msci.com 12
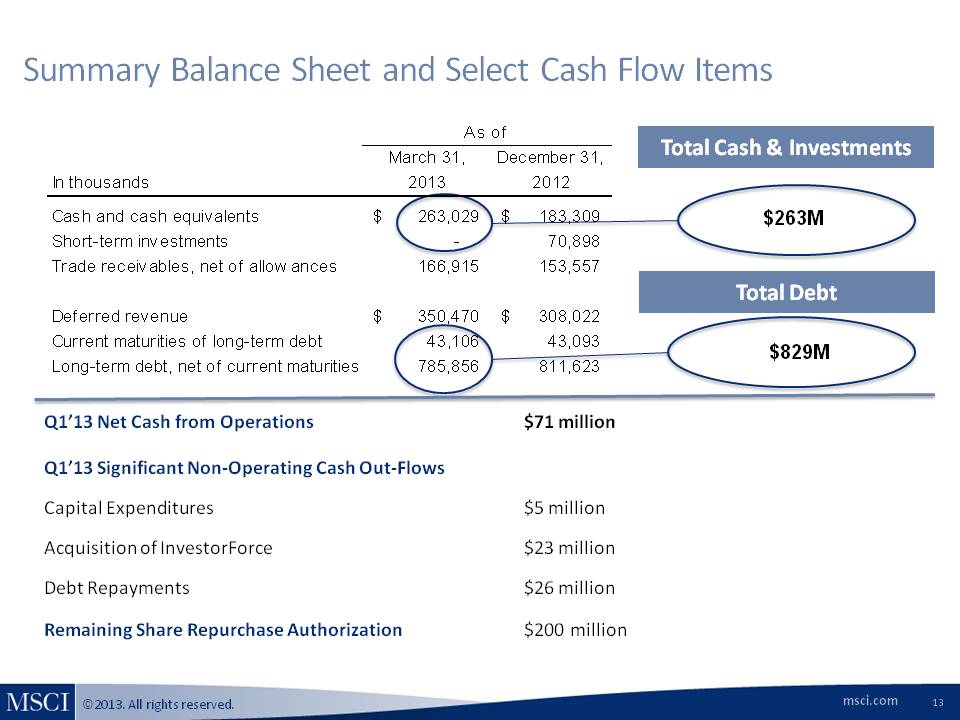
Summary Balance Sheet and Select Cash Flow Items Total Cash & Investments $263M Total Debt $829M In thousands As of March 31, 2013 December 31, 2012 Cash and cash equivalents $ 263,029 $ 183,309 Short-term investments - 70,898 Trade receivables, net of allowances 166,915 153,557 Deferred revenue $ 350,470 $ 308,022 Current maturities of long-term debt 43,106 43,093 Long-term debt, net of current maturities 785,856 811,623 Q1’13 Net Cash from Operations $71 million Q1’13 Significant Non‐Operating Cash Out‐Flows Capital Expenditures $5 million Acquisition of InvestorForce $23 million Debt Repayments $26 million Remaining Share Repurchase Authorization $200 million msci.com 13
Use of Non‐GAAP Financial Measures and Operating Metrics MSCI has presented supplemental non‐GAAP financial measures as part of this presentation. A reconciliation is provided that reconciles each non‐GAAP financial measure with the most comparable GAAP measure. The presentation of non‐GAAP financial measures should not be considered as alternative measures for the most directly comparable GAAP financial measures. These measures are used by management to monitor the financial performance of the business, inform business decision making and forecast future results. Adjusted EBITDA is defined as net income before provision for income taxes, other net expense and income, depreciation and amortization, non‐recurring stock‐based compensation expense and restructuring costs. Adjusted Net Income and Adjusted EPS are defined as net income and EPS, respectively, before provision for non‐recurring stock‐based compensation expenses, amortization of intangible assets, restructuring costs and the accelerated amortization or write off of deferred financing and debt discount costs as a result of debt repayment (debt repayment and refinancing expenses), as well as for any related tax effects. We believe that adjustments related to restructuring costs and debt repayment and refinancing expenses are useful to management and investors because it allows for an evaluation of MSCI’s underlying operating performance. Additionally, we believe that adjusting for non‐recurring stock‐based compensation expenses, debt repayment and refinancing expenses and depreciation and amortization may help investors compare our performance to that of other companies in our industry as we do not believe that other companies in our industry have as significant a portion of their operating expenses represented by these items. We believe that the non‐GAAP financial measures presented in this presentation facilitate meaningful period‐to‐period comparisons and provide a baseline for the evaluation of future results. Adjusted EBITDA, Adjusted Net Income and Adjusted EPS are not defined in the same manner by all companies and may not be comparable to other similarly titled measures of other companies. The run rate at a particular point in time represents the forward‐looking revenues for the next 12 months from all subscriptions and investment product licenses we currently provide to our clients under renewable contracts assuming all contracts that come up for renewal are renewed and assuming then-current currency exchange rates. For any license where fees are linked to an investment product’s assets or trading volume, the run rate calculation reflects an annualization of the most recent periodic fee earned under such license or subscription. The run rate does not include fees associated with “one‐time” and other non‐recurring transactions. In addition, we remove from the run rate the fees associated with any subscription or investment product license agreement with respect to which we have received a notice of termination or non‐renewal during the period and we have determined that such notice evidences the client's final decision to terminate or not renew the applicable subscription or agreement, even though the notice is not effective until a later date of primarily adjusted estimates for non‐recurring sales date. The run rate for IPD Group Limited was approximated using the trailing 12 months of revenues primarily adjusted for estimates for non-recurring sales, new sales and cancellations. The quarterly Aggregate Retention Rates are calculated by annualizing the cancellations for which we have received a notice of termination or non‐renewal during the quarter and we have determined that such notice evidences the client’s final decision to terminate or not renew the applicable subscription or agreement, even though such notice is not effective until a later date. This annualized cancellation figure is then divided by the subscription run rate at the beginning of the year to calculate a cancellation rate. This cancellation rate is then subtracted from 100% to derive the annualized Retention Rate for the quarter. The Aggregate Retention Rate is computed on a product‐by‐product basis. Therefore, if a client reduces the number of products to which it subscribes or switches between our products, we treat it as a cancellation. In addition, we treat any reduction in fees resulting from renegotiated contracts as a cancellation in the calculation to the extent of the reduction. For the calculation of the Core Retention Rate the same methodology is used except the amount of cancellations in the quarter is reduced by the amount of product swaps. msci.com 14
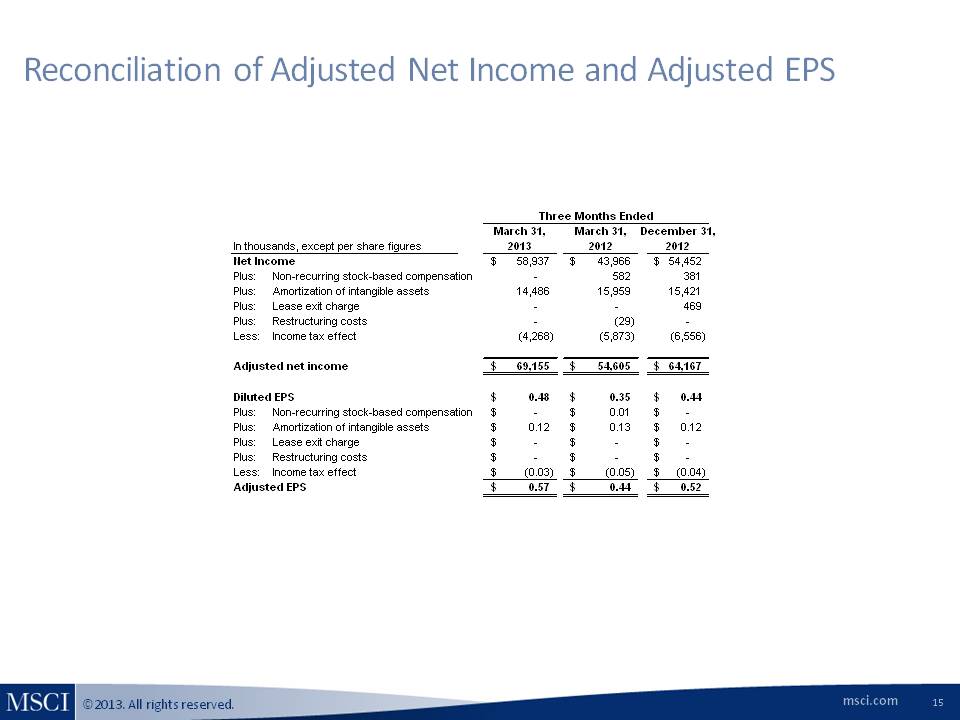
Reconciliation of Adjusted Net Income and Adjusted EPS Three Months Ended March 31, 2013 March 31, 2013 December 31, 2012 In thousands, except per share figures Net Income $ 58,937 $ 43,966 $ 54,452 Plus: Non-recurring stock-based compensation - 582 381 Plus: Amortization of intangible assets 14,486 15,959 15,421 Plus: Lease exit charge - - 469 Plus: Restructuring costs - (29) - Less: Income tax effect (4,268) (5,873) (6,556) Adjusted net income $ 69,155 $ 54,605 $ 64,167 Diluted EPS $ 0.48 $ 0.35 $ 0.44 Plus: Non-recurring stock-based compensation - $ 0.01 – Plus: Amortization of intangible assets $ 0.12 $ 0.13 $ 0.12 Plus: Lease exit charge $ - $ - $ - Plus: Restructuring costs $ - $ - $ - Less: Income tax effect $ (0.03) $ (0.05) $ (0.04) Adjusted EPS $ 0.57 $ 0.44 $ 0.52 msci.com 15
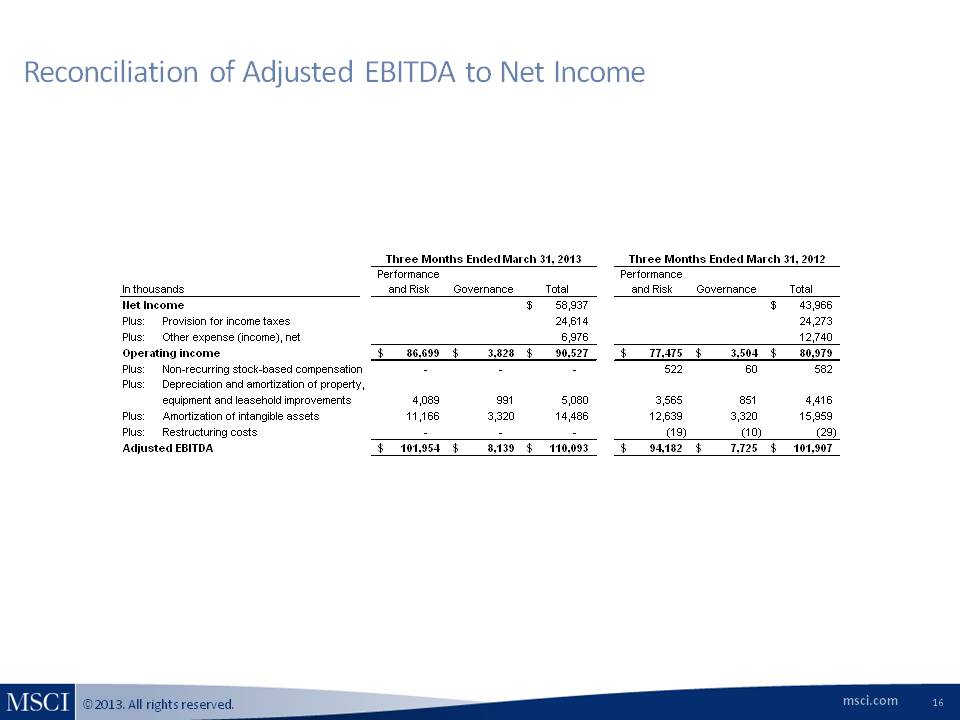
Reconciliation of Adjusted EBITDA to Net Income Three Months Ended March 31, 2013 Three Months Ended March 31, 2012 In thousands Performance and Risk Governance Total Performance and Risk Governance Total Net Income $ 58,937 $ 43,966 Plus: Provision for income taxes 24,614 24,273 Plus: Other expense (income), net 6,976 12,740 Operating income $ 86,699 $ 3,828 $ 90,527 $ 77,475 $ 3,504 $ 80,979 Plus: Non-recurring stock-based compensation - - - 522 60 582 Plus: Depreciation and amortization of property, equipment and leasehold improvements 4,089 991 5,080 3,565 851 4,416 Plus: Amortization of intangible assets 11,166 3,320 14,486 12,639 3,320 15,959 Plus: Restructuring costs - - - (19) (10) (29) Adjusted EBITDA $ 101,954 $ 8,139 $ 110,093 $ 94,182 $ 7,725 $ 101,907 msci.com 16
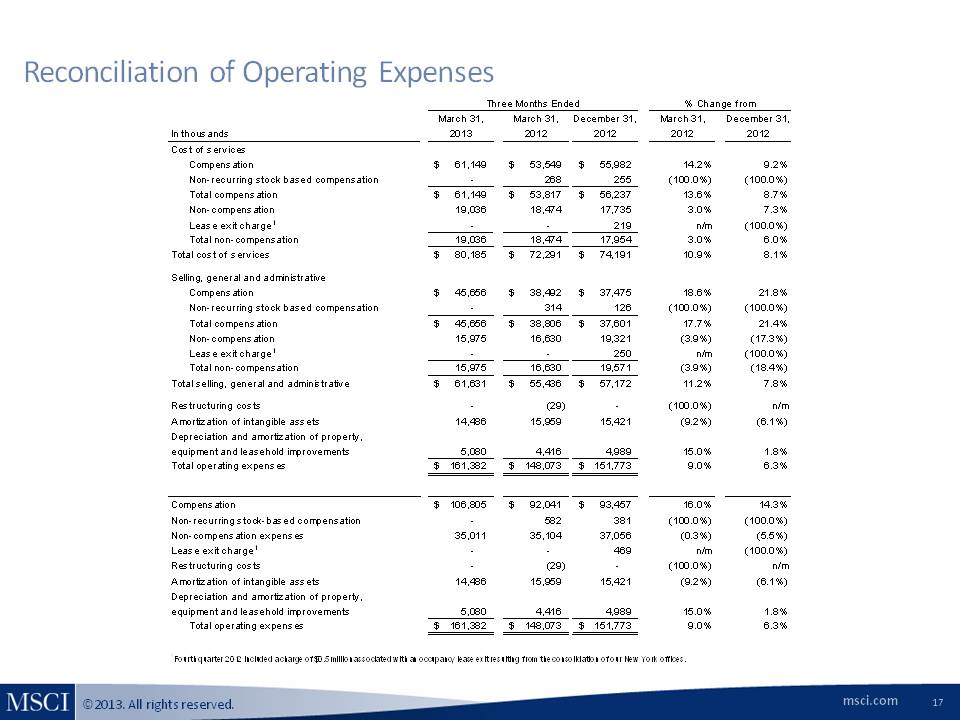
Reconciliation of Operating Expenses Three Months Ended % Change from March 31, 2013 March 31, 2012 December 31, 2012 March 31, 2012 December 31, 2012 In thousands Cost of services Compensation $ 61,149 $ 53,549 $ 55,982 14.2% 9.2% Non-recurring stock based compensation - 268 255 (100.0%) (100.0%) Total compensation $ 61,149 $ 53,817 $ 56,237 13.6% 8.7% Non-compensation 19,036 18,474 17,735 3.0% 7.3% Lease exit charge1 - - 219 n/m (100.0%) Total non-compensation 19,036 18,474 17,954 3.0% 6.0% Total cost of services $ 80,185 $ 72,291 $ 74,191 10.9% 8.1% Selling, general and administrative Compensation $ 45,656 $ 38,492 $ 37,475 18.6% 21.8% Non-recurring stock based compensation - 314 126 (100.0%) (100.0%) Total compensation $ 45,656 $ 38,806 $ 37,601 17.7% 21.4% Non-compensation 15,975 16,630 19,321 (3.9%) (17.3%) Lease exit charge1 - - 250 n/m (100.0%) Total non-compensation 15,975 16,630 19,571 (3.9%) (18.4%) Total selling, general and administrative $ 61,631 $ 55,436 $ 57,172 11.2% 7.8% Restructuring costs - (29) - (100.0%) n/m Amortization of intangible assets 14,486 15,959 15,421 (9.2%) (6.1%) Depreciation and amortization of property, equipment and leasehold improvements 5,080 4,416 4,989 15.0% 1.8% Total operating expenses $ 161,382 $ 148,073 $ 151,773 9.0% 6.3% Compensation $ 106,805 $ 92,041 $ 93,457 16.0% 14.3% Non-recurring stock-based compensation - 582 381 (100.0%) (100.0%) Non-compensation expenses 35,011 35,104 37,056 (0.3%) (5.5%) Lease exit charge1 - - 469 n/m (100.0%) Restructuring costs - (29) - (100.0%) n/m Amortization of intangible assets 14,486 15,959 15,421 (9.2%) (6.1%) Depreciation and amortization of property, equipment and leasehold improvements 5,080 4,416 4,989 15.0% 1.8% Total operating expenses $ 161,382 $ 148,073 $ 151,773 9.0% 6.3% 1Fourth quarter 2012 included a charge of $0.5 million associated with an occupancy lease exit resulting from the consolidation of our New York offices. msci.com 17