Exhibit 99.2
Third Quarter 2013 Earnings Presentation October 31, 2013
Forward‐Looking Statements and Other Information Forward‐Looking Statements – Safe Harbor Statements This presentation may contain forward‐looking statements within the meaning of the Private Securities Litigation Reform Act of 1995. You should not place undue reliance on forward‐looking statements because they involve known and unknown risks, uncertainties and other factors that are, in some cases, beyond our control and that could materially affect actual results, levels of activity, performance or achievements. For a discussion of risk and uncertainties that could materially affect actual results, levels of activity, performance or achievements, please see the Company’s Annual Report on Form 10‐K for the fiscal year ended December 31, 2012 and its other reports filed with the SEC. Any forward‐looking statements included in this presentation reflect the Company’s view as of the date of the presentation. The Company assumes no obligation to publicly update or revise these forward‐looking statements for any reason, whether as a result of new information, future events, or otherwise, except as required by law. Other Information Percentage changes and totals in this presentation may not sum due to rounding. Percentage changes are referenced to the comparable period in 2012, unless otherwise noted. Total sales include recurring subscription sales and non‐recurring sales. Definitions of Run Rate and Retention Rate provided on page 14. 2
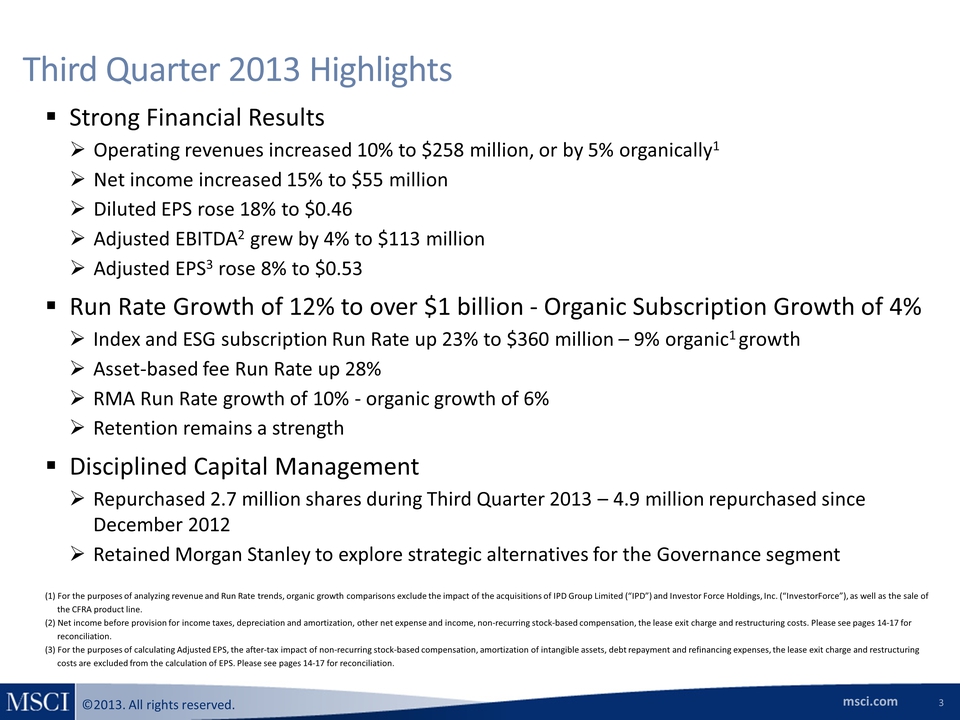
Third Quarter 2013 Highlights Strong Financial Results Operating revenues increased 10% to $258 million, or by 5% organically1 Net income increased 15% to $55 million Diluted EPS rose 18% to $0.46 Adjusted EBITDA2 grew by 4% to $113 million Adjusted EPS3 rose 8% to $0.53 Run Rate Growth of 12% to over $1 billion ‐ Organic Subscription Growth of 4% Index and ESG subscription Run Rate up 23% to $360 million – 9% organic1 growth Asset‐based fee Run Rate up 28% RMA Run Rate growth of 10% ‐ organic growth of 6% Retention remains a strength Disciplined Capital Management Repurchased 2.7 million shares during Third Quarter 2013 – 4.9 million repurchased since December 2012 Retained Morgan Stanley to explore strategic alternatives for the Governance segment (1) For the purposes of analyzing revenue and Run Rate trends, organic growth comparisons exclude the impact of the acquisitions of IPD Group Limited (“IPD”) and Investor Force Holdings, Inc. (“InvestorForce”), as well as the sale of the CFRA product line. (2) Net income before provision for income taxes, depreciation and amortization, other net expense and income, non‐recurring stock‐based compensation, the lease exit charge and restructuring costs. Please see pages 14‐17 for reconciliation. (3) For the purposes of calculating Adjusted EPS, the after‐tax impact of non‐recurring stock‐based compensation, amortization of intangible assets, debt repayment and refinancing expenses, the lease exit charge and restructuring costs are excluded from the calculation of EPS. Please see pages 14‐17 for reconciliation. 3
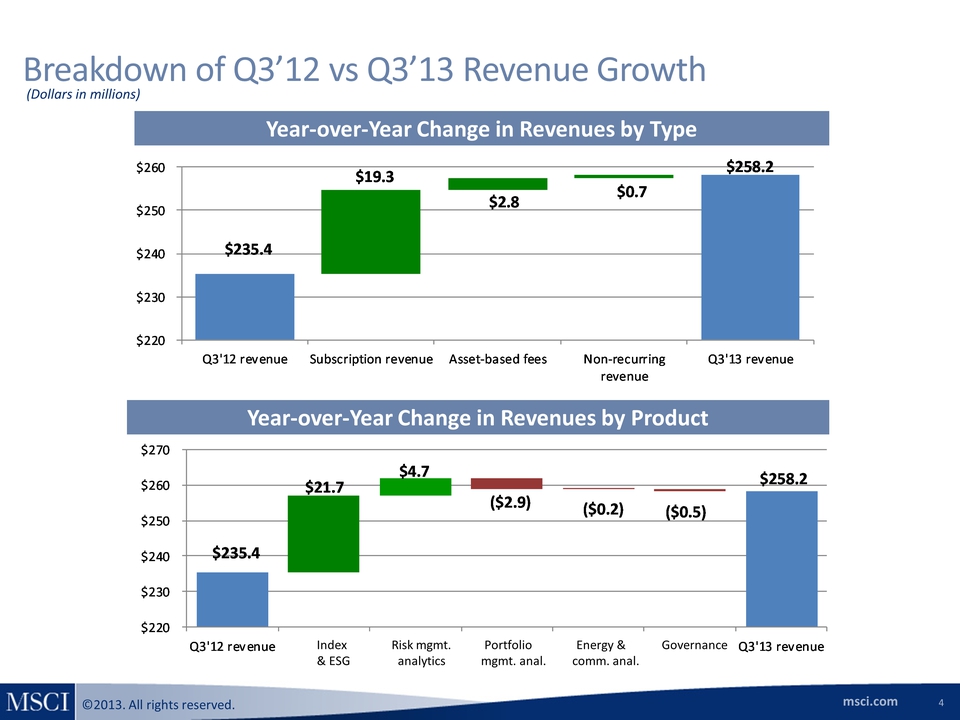
Breakdown of Q3’12 vs Q3’13 Revenue Growth (Dollars in millions) Year‐over‐Year Change in Revenues by Type $235.4 $19.3 $2.8 $0.7 $258.2 $220 $230 $240 $250 $260 Q3'12 revenue Subscription revenue Asset‐based fees Non‐recurring revenue Q3'13 revenue Year‐over‐Year Change in Revenues by Product $235.4 $21.7 $4.7 ($2.9) ($0.2) ($0.5) $258.2 $220 $230 $240 $250 $260 $270 Q3'12 revenue Index & ESG Risk mgmt. analytics Portfolio mgmt. anal. Energy & comm. anal. Governance Q3'13 revenue 4
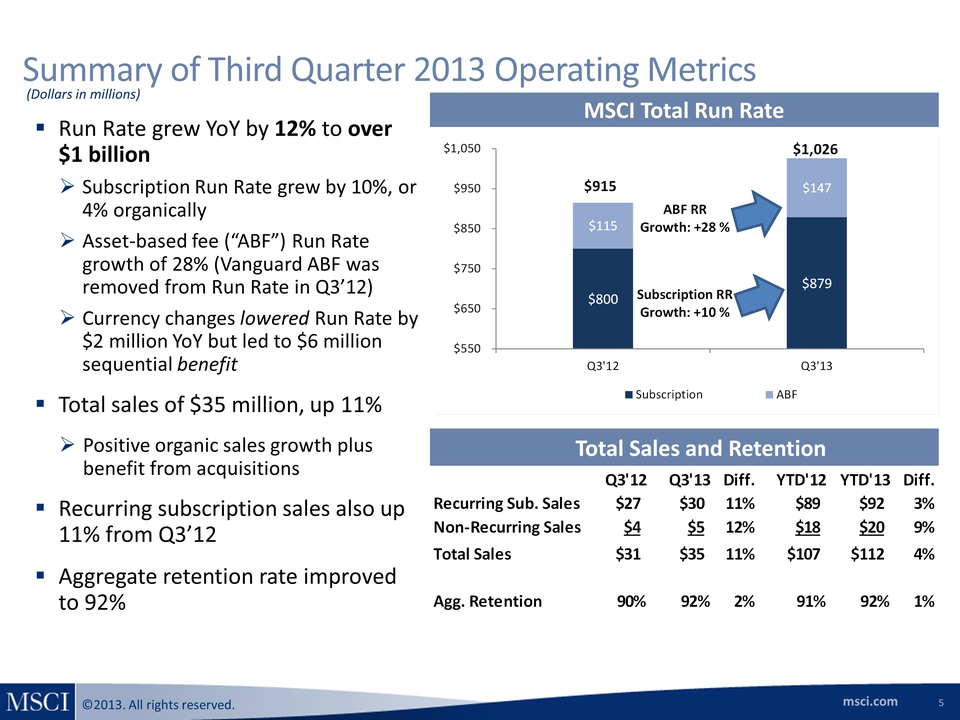
Summary of Third Quarter 2013 Operating Metrics (Dollars in millions) MSCI Total Run Rate $800 $115 $915 $879 $147 $1,026 ABF Growth: +28 % Subscription Growth: +10 % Subscription ABF Q3'12 Q3'13 $550 $650 $750 $850 $950 $1,050 Run Rate grew YoY by 12% to over $1 billion Subscription Run Rate grew by 10%, or 4% organically Asset‐based fee (“ABF”) Run Rate growth of 28% (Vanguard ABF was removed from Run Rate in Q3’12) Currency changes lowered Run Rate by $2 million YoY but led to $6 million sequential benefit Total sales of $35 million, up 11% Positive organic sales growth plus benefit from acquisitions Recurring subscription sales also up 11% from Q3’12 Aggregate retention rate improved to 92% Total Sales and Retention Q3'12 Q3'13 Diff. YTD'12 YTD'13 Diff. Recurring Sub. Sales $27 $30 11% $89 $92 3% Non‐Recurring Sales $4 $5 12% $18 $20 9% Total Sales $31 $35 14% $107 $112 4% Agg. Retention 90% 92% 2% 91% 92% 1% 5
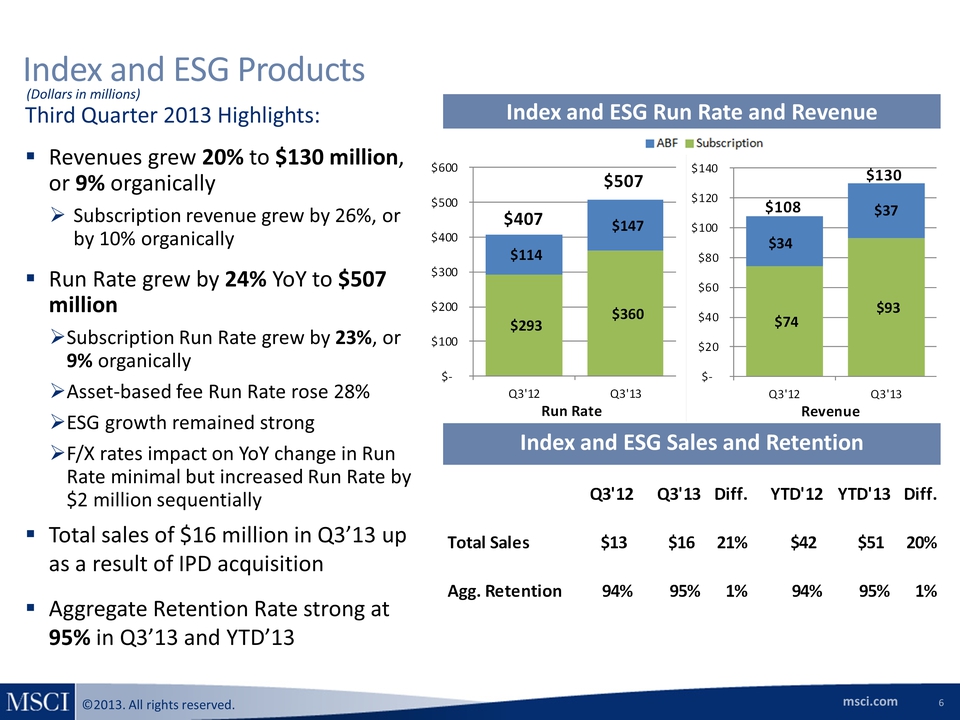
Index and ESG Products (Dollars in millions) Third Quarter 2013 Highlights: Revenues grew 20% to $130 million, or 9% organically Subscription revenue grew by 26%, or by 10% organically Run Rate grew by 24% YoY to $507 million Subscription Run Rate grew by 23%, or 9% organically Asset‐based fee Run Rate rose 28% ESG growth remained strong F/X rates impact on YoY change in Run Rate minimal but increased Run Rate by $2 million sequentially Total sales of $16 million in Q3’13 up as a result of IPD acquisition Aggregate Retention Rate strong at 95% in Q3’13 and YTD’13 Index and ESG Run Rate and Revenue ABF Subscription $293 $114 $407 $360 $147 $507 $‐ $100 $200 $300 $400 $500 $600 Q3'12 Q3'13 Run Rate $74 $34 $108 $93 $37 $130 $‐ $20 $40 $60 $80 $100 $120 $140 Q3'12 Q3'13 Revenue Index and ESG Sales and Retention Q3'12 Q3'13 Diff. YTD'12 YTD'13 Diff. Total Sales $13 $16 21% $42 $51 20% Agg. Retention 94% 95% 1% 94% 95% 1% 6
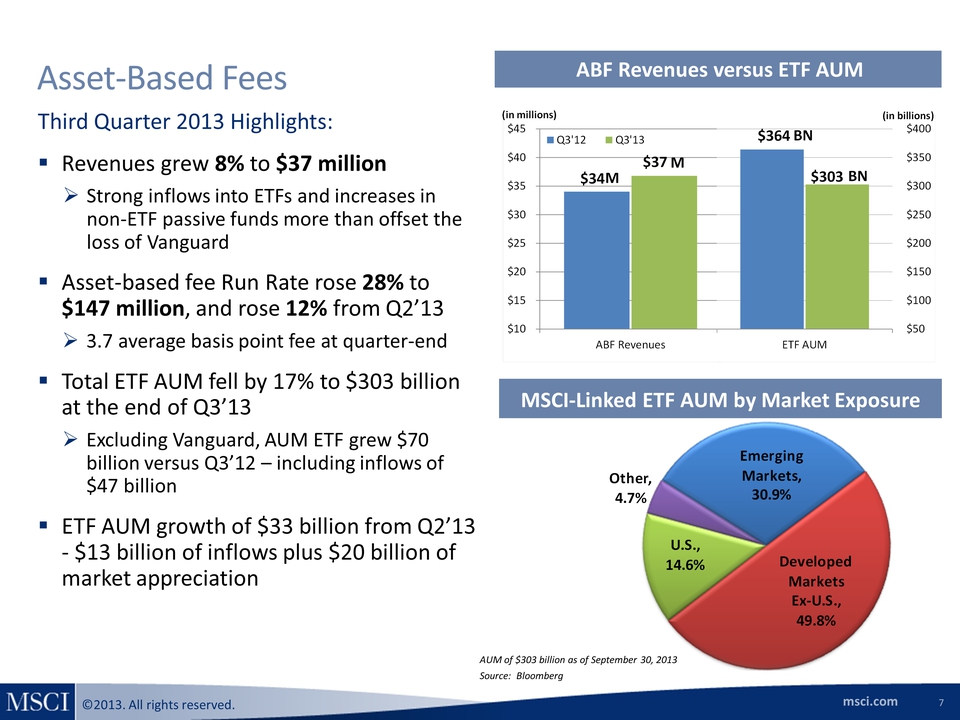
Asset‐Based Fees Third Quarter 2013 Highlights: Revenues grew 8% to $37 million Strong inflows into ETFs and increases in non‐ETF passive funds more than offset the loss of Vanguard Asset‐based fee Run Rate rose 28% to $147 million, and rose 12% from Q2’13 3.7 average basis point fee at quarter‐end Total ETF AUM fell by 17% to $303 billion at the end of Q3’13 Excluding Vanguard, AUM ETF grew $70 billion versus Q3’12 – including inflows of $47 billion ETF AUM growth of $33 billion from Q2’13 ‐ $13 billion of inflows plus $20 billion of market appreciation ABF Revenues versus ETF AUM (in millions) (in billions) Q3'12 Q3'13 $34 M $37 M $364 BN $303 BN $50 $100 $150 $200 $250 $300 $350 $400 $45 $40 $35 $30 $25 $20 $15 $10 MSCI‐Linked ETF AUM by Market Exposure Other 4.7% Emerging Markets 30.9% U.S., 14.6% Developed Markets Ex-U.S., 49.8% AUM of $303 billion as of September 30, 2013 Source: Bloomberg 7
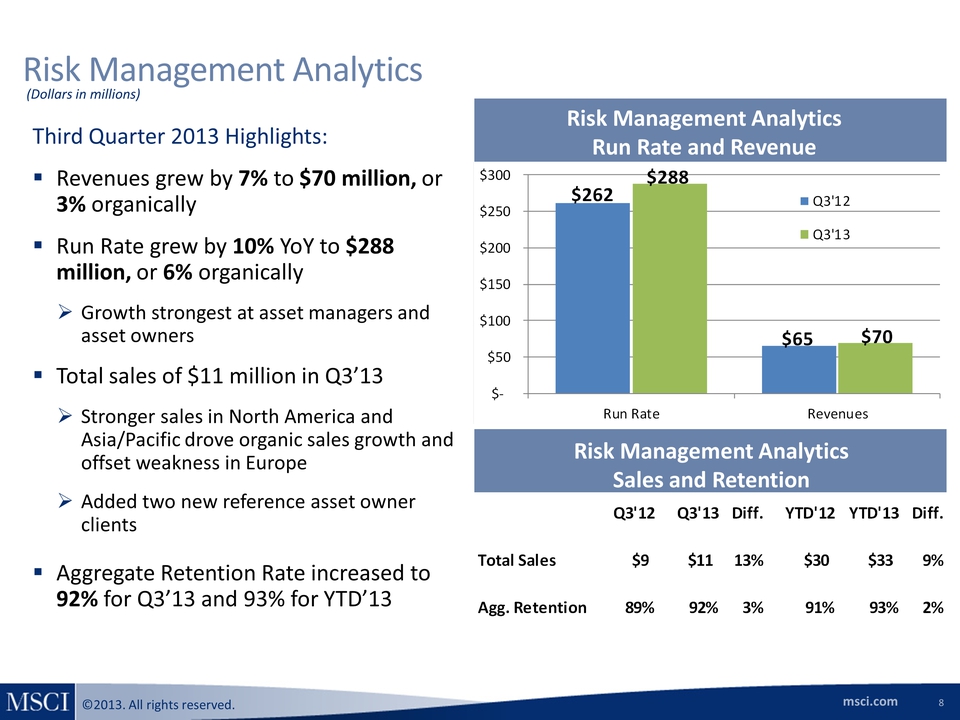
Risk Management Analytics (Dollars in millions) Third Quarter 2013 Highlights: Revenues grew by 7% to $70 million, or 3% organically Run Rate grew by 10% YoY to $288 million, or 6% organically Growth strongest at asset managers and asset owners Total sales of $11 million in Q3’13 Stronger sales in North America and Asia/Pacific drove organic sales growth and offset weakness in Europe Added two new reference asset owner clients Aggregate Retention Rate increased to 92% for Q3’13 and 93% for YTD’13 Risk Management Analytics Run Rate and Revenue $262 $288 $65 $70 $‐ $50 $100 $150 $200 $250 $300 Q3'12 Q3'13 Run Rate Revenues Risk Management Analytics Sales and Retention Q3'12 Q3'13 Diff. YTD'12 YTD'13 Diff. Total Sales $9 $11 13% $30 $33 9% Agg. Retention 89% 92% 3% 91% 93% 2% 8
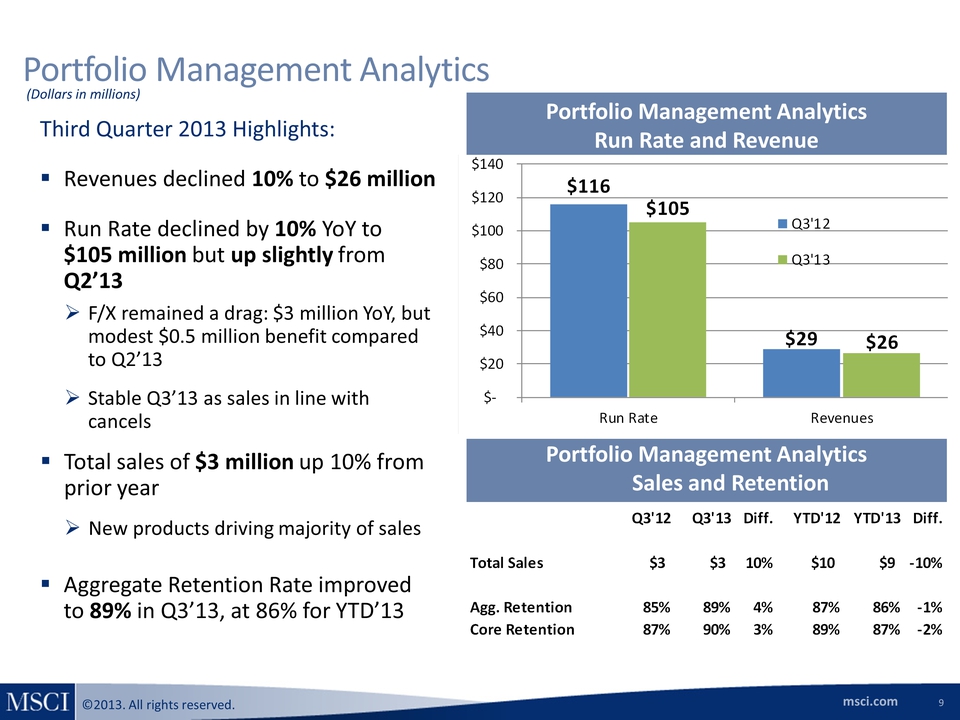
Portfolio Management Analytics (Dollars in millions) Third Quarter 2013 Highlights: Revenues declined 10% to $26 million Run Rate declined by 10% YoY to $105 million but up slightly from Q2’13 F/X remained a drag: $3 million YoY, but modest $0.5 million benefit compared to Q2’13 Stable Q3’13 as sales in line with cancels Total sales of $3 million up 10% from prior year New products driving majority of sales Aggregate Retention Rate improved to 89% in Q3’13, at 86% for YTD’13 Portfolio Management Analytics Run Rate and Revenue $116 $105 $29 $26 $‐ $20 $40 $60 $80 $100 $120 $140 Q3'12 Q3'13 Run Rate Revenues Portfolio Management Analytics Sales and Retention Q3'12 Q3'13 Diff. YTD'12 YTD'13 Diff. Total Sales $3 $3 10% $10 $9 ‐10% Agg. Retention 85% 89% 4% 87% 86% ‐1% Core Retention 87% 90% 3% 89% 87% ‐2% 9
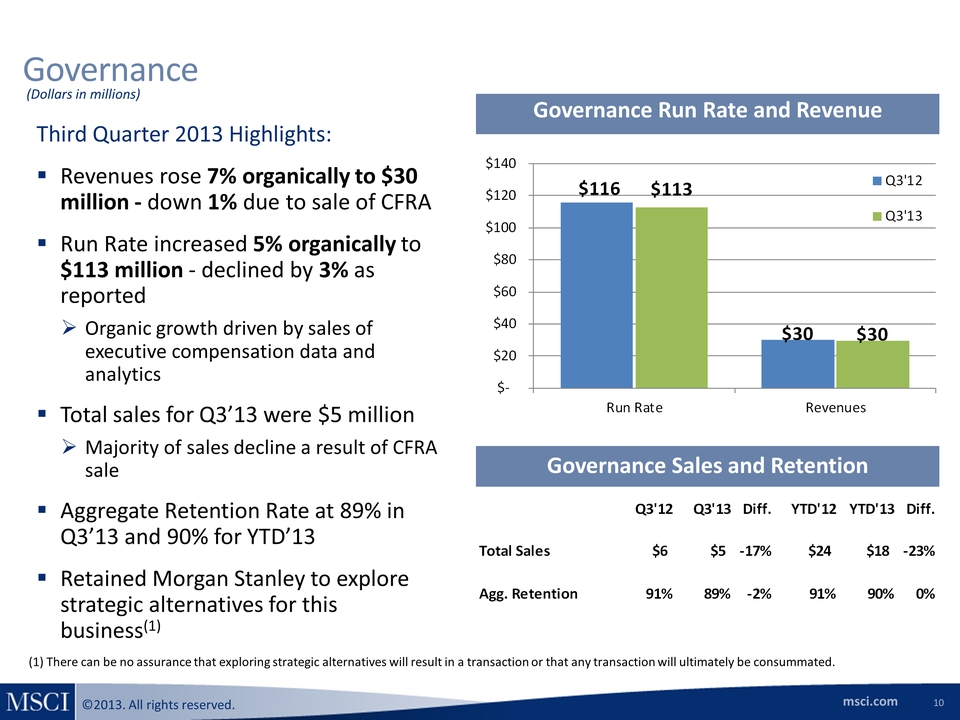
Governance (Dollars in millions) Third Quarter 2013 Highlights: Revenues rose 7% organically to $30 million ‐ down 1% due to sale of CFRA Run Rate increased 5% organically to $113 million ‐ declined by 3% as reported Organic growth driven by sales of advisory compensation data and analytics Total sales for Q3’13 were $5 million Majority of sales decline a result of CFRA sale Aggregate Retention Rate at 89% in Q3’13 and 90% for YTD’13 Retained Morgan Stanley to explore strategic alternatives for this business(1) Governance Run Rate and Revenue $116 $113 $30 $30 $‐ $20 $40 $60 $80 $100 $120 $140 Q3'12 Q3'13 Run Rate Revenues Governance Sales and Retention Q3'12 Q3'13 Diff. YTD'12 YTD'13 Diff. Total Sales $6 $5 ‐17% $24 $18 ‐23% Agg. Retention 91% 89% ‐2% 91% 90% 0% (1) There can be no assurance that exploring strategic alternatives will result in a transaction or that any transaction will ultimately be consummated. 10
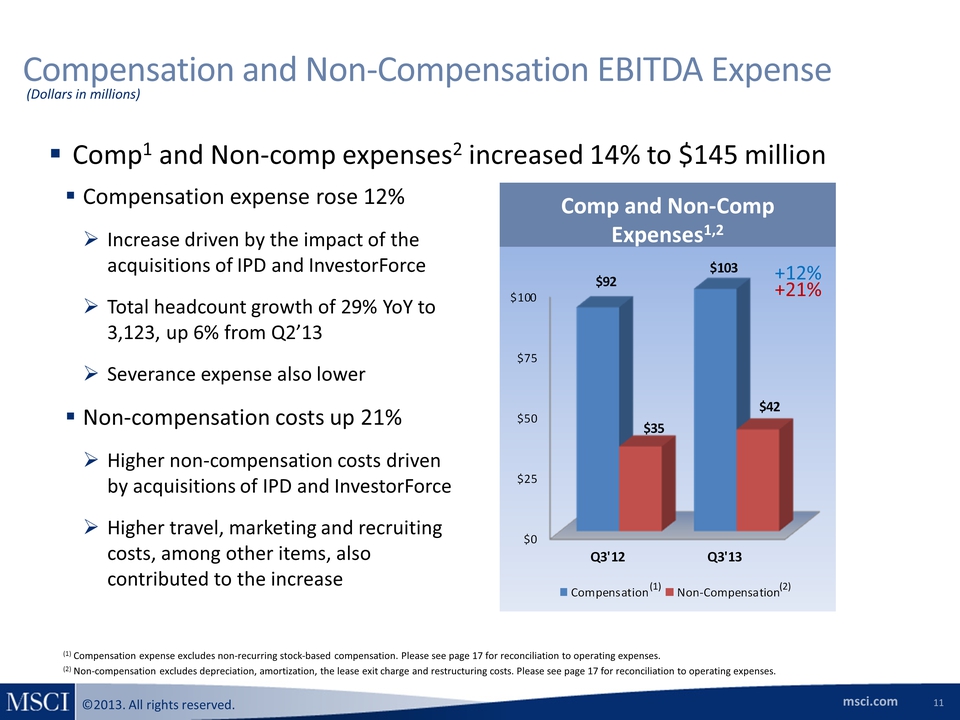
Compensation and Non‐Compensation EBITDA Expense (Dollars in millions) Comp1 and Non‐comp expenses2 increased 14% to $145 million Compensation expense rose 12% Increase driven by the impact of the acquisitions of IPD and InvestorForce Total headcount growth of 29% YoY to 3,123, up 6% from Q2’13 Severance expense also lower Non‐compensation costs up 21% Higher non‐compensation costs driven by acquisitions of IPD and InvestorForce Higher travel, marketing and recruiting costs, among other items, also contributed to the increase Comp and Non‐Comp Expenses1,2 $0 $25 $50 $75 $100 +12% +21% $92 $103 $35 $42 Q3’12 Q3’13 Compensation(1) Non-Compensation(2) (1) Compensation expense excludes non‐recurring stock‐based compensation. Please see page 17 for reconciliation to operating expenses. (2) Non‐compensation excludes depreciation, amortization, the lease exit charge and restructuring costs. Please see page 17 for reconciliation to operating expenses. 11
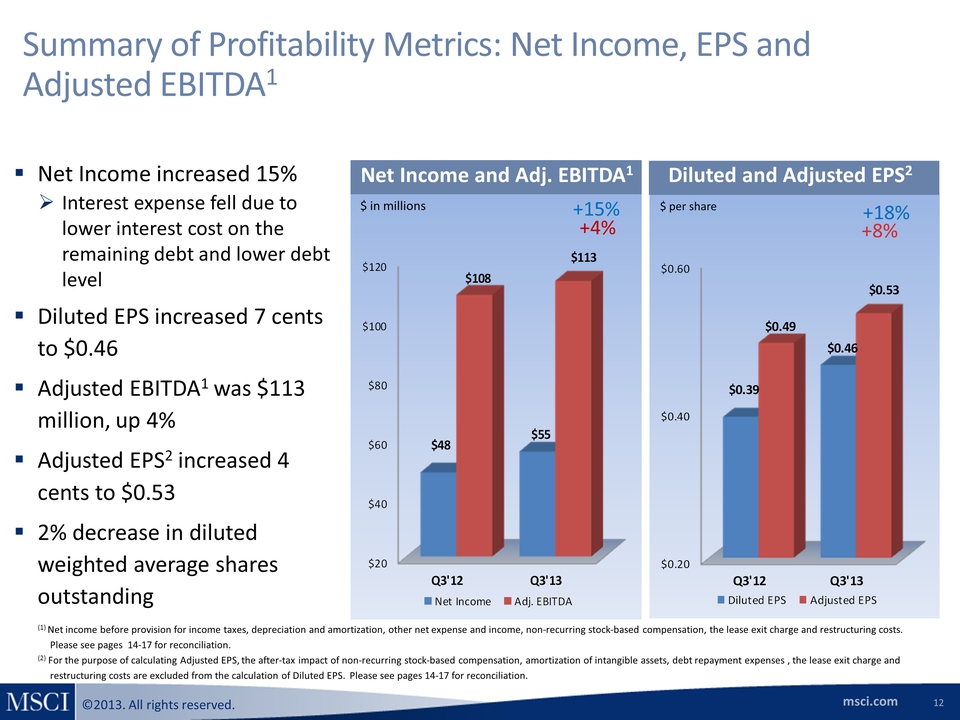
Summary of Profitability Metrics: Net Income, EPS and Adjusted EBITDA1 Net Income increased 15% Interest expense fell due to lower interest cost on the remaining debt and lower debt level Diluted EPS increased 7 cents to $0.46 Adjusted EBITDA1 was $113 million, up 4% Adjusted EPS2 increased 4 cents to $0.53 2% decrease in diluted weighted average shares outstanding Net Income and Adj. EBITDA1 Diluted and Adjusted EPS2 $ in millions +15% +4% $ per share +18% +8% $20 $40 $60 $80 $100 $120 $48 $108 $55 $113 Q3’12 Q3’13 Net Income Adj. EBITDA $0.20 $0.40 $0.60 $0.39 $0.49 $0.46 $0.53 Q3’12 Q3’13 Diluted EPS Adjusted EPS (1) Net income before provision for income taxes, depreciation and amortization, other net expense and income, non‐recurring stock‐based compensation, the lease exit charge and restructuring costs. Please see pages 14‐17 for reconciliation. (2) For the purpose of calculating Adjusted EPS, the after‐tax impact of non‐recurring stock‐based compensation, amortization of intangible assets, debt repayment expenses , the lease exit charge and restructuring costs are excluded from the calculation of Diluted EPS. Please see pages 14‐17 for reconciliation.12
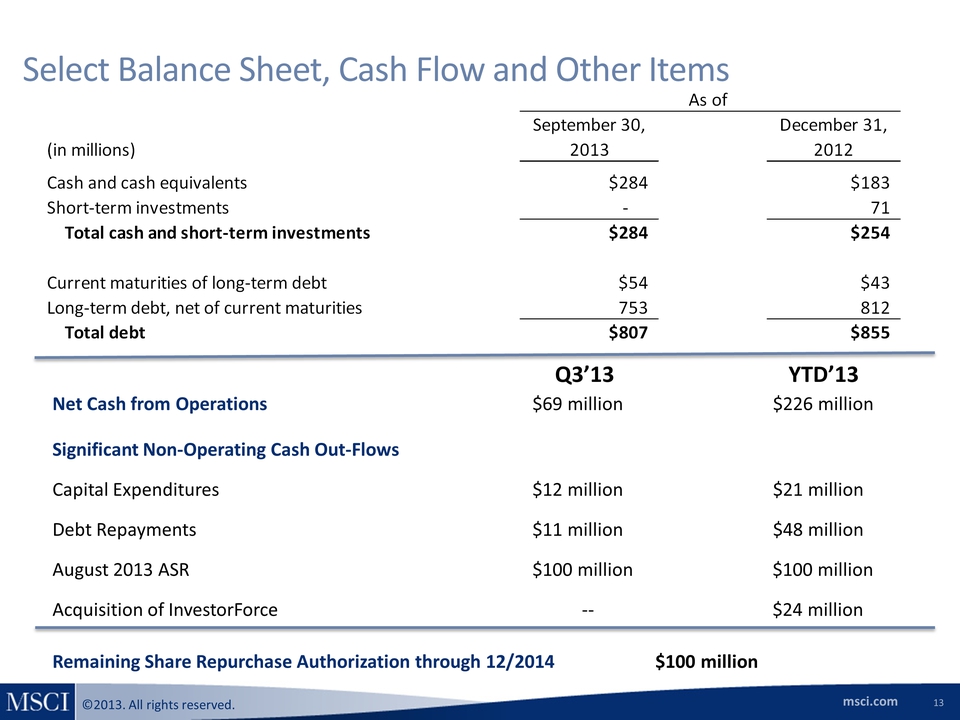
Select Balance Sheet, Cash Flow and Other Items As of September 30, December 31, (in millions) 2013 2012 Cash and cash equivalents $284 $183 Short‐term investments ‐ 71 Total cash and short‐term investments $284 $254 Current maturities of long‐term debt $54 $43 Long‐term debt, net of current maturities 753 812 Total debt $807 $855 Q3’13 YTD’13 Net Cash from Operations $69 million $226 million Significant Non‐Operating Cash Out‐Flows Capital Expenditures $12 million $21 million Debt Repayments $11 million $48 million August 2013 ASR $100 million $100 million Acquisition of InvestorForce ‐‐ $24 million Remaining Share Repurchase Authorization through 12/2014 $100 million 13
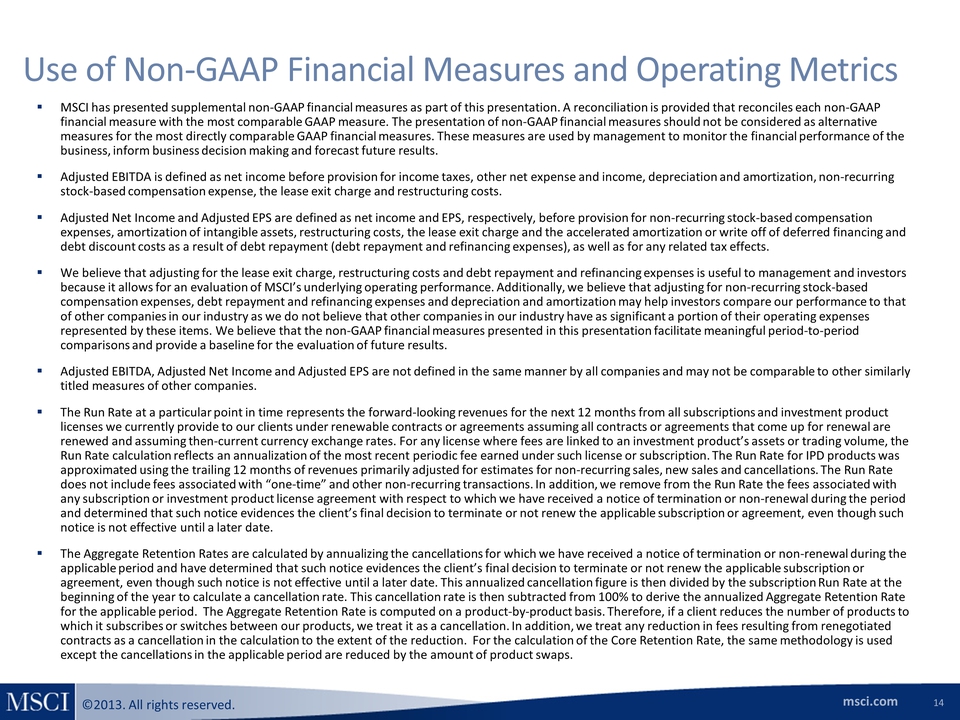
Use of Non‐GAAP Financial Measures and Operating Metrics MSCI has presented supplemental non‐GAAP financial measures as part of this presentation. A reconciliation is provided that reconciles each non‐GAAP financial measure with the most comparable GAAP measure. The presentation of non‐GAAP financial measures should not be considered as alternative measures for the most directly comparable GAAP financial measures. These measures are used by management to monitor the financial performance of the business, inform business decision making and forecast future results. Adjusted EBITDA is defined as net income before provision for income taxes, other net expense and income, depreciation and amortization, non‐recurring stock‐based compensation expense, the lease exit charge and restructuring costs. Adjusted Net Income and Adjusted EPS are defined as net income and EPS, respectively, before provision for non‐recurring stock‐based compensation expenses, amortization of intangible assets, restructuring costs, the lease exit charge and the accelerated amortization or write off of deferred financing and debt discount costs as a result of debt repayment (debt repayment and refinancing expenses), as well as for any related tax effects. We believe that adjusting for the lease exit charge, restructuring costs and debt repayment and refinancing expenses is useful to management and investors because it allows for an evaluation of MSCI’s underlying operating performance. Additionally, we believe that adjusting for non‐recurring stock‐based compensation expenses, debt repayment and refinancing expenses and depreciation and amortization may help investors compare our performance to that of other companies in our industry as we do not believe that other companies in our industry have as significant a portion of their operating expenses represented by these items. We believe that the non‐GAAP financial measures presented in this presentation facilitate meaningful period‐to‐period comparisons and provide a baseline for the evaluation of future results. Adjusted EBITDA, Adjusted Net Income and Adjusted EPS are not defined in the same manner by all companies and may not be comparable to other similarly titled measures of other companies. The Run Rate at a particular point in time represents the forward‐looking revenues for the next 12 months from all subscriptions and investment product licenses we currently provide to our clients under renewable contracts or agreements assuming all contracts or agreements that come up for renewal are renewed and assuming then‐current currency exchange rates. For any license where fees are linked to an investment product’s assets or trading volume, the Run Rate calculation reflects an annualization of the most recent periodic fee earned under such license or subscription. The Run Rate for IPD products was approximated using the trailing 12 months of revenues primarily adjusted for estimates for non‐recurring sales, new sales and cancellations. The Run Rate does not include fees associated with “one‐time” and other non‐recurring transactions. In addition, we remove from the Run Rate the fees associated with any subscription or investment product license agreement with respect to which we have received a notice of termination or non‐renewal during the period and determined that such notice evidences the client’s final decision to terminate or not renew the applicable subscription or agreement, even though such notice is not effective until a later date. The Aggregate Retention Rates are calculated by annualizing the cancellations for which we have received a notice of termination or non‐renewal during the applicable period and have determined that such notice evidences the client’s final decision to terminate or not renew the applicable subscription or agreement, even though such notice is not effective until a later date. This annualized cancellation figure is then divided by the subscription Run Rate at the beginning of the year to calculate a cancellation rate. This cancellation rate is then subtracted from 100% to derive the annualized Aggregate Retention Rate for the applicable period. The Aggregate Retention Rate is computed on a product‐by‐product basis. Therefore, if a client reduces the number of products to which it subscribes or switches between our products, we treat it as a cancellation. In addition, we treat any reduction in fees resulting from renegotiated contracts as a cancellation in the calculation to the extent of the reduction. For the calculation of the Core Retention Rate, the same methodology is used except the cancellations in the applicable period are reduced by the amount of product swaps. 14

Reconciliation of Adjusted Net Income and Adjusted EPS Three Months Ended Nine Months Ended September 30, September 30, June 30, September 30, September 30, In thousands, except per share data 2013 2012 2013 2013 2012 Net Income $ 55,310 $ 48,274 $ 61,053 $ 175,300 $ 129,786 Plus: Non-recurring stock-based compensation - 626 - - 1,400 Plus: Amortization of intangible assets 14,448 15,959 14,509 43,443 47,877 Plus: Debt repayment and refinancing expenses - - - - 20,639 Plus: Lease exit charge - 3,327 (365) (365) 3,327 Plus: Restructuring costs - - - - (51) Less: Income tax effect (5,172) (7,280) (4,711) (14,151) (25,954) Adjusted net income $ 64,586 $ 60,906 $ 70,486 $ 204,227 $ 177,024 Diluted EPS $ 0.46 $ 0.39 $ 0.50 $ 1.44 $ 1.05 Plus: Non-recurring stock-based compensation - 0.01 - - 0.01 Plus: Amortization of intangible assets 0.12 0.13 0.12 0.36 0.39 Plus: Debt repayment and refinancing expenses - - - - 0.17 Plus: Lease exit charge - 0.03 - - 0.03 Plus: Restructuring costs - - - - - Less: Income tax effect (0.05) (0.07) (0.04) (0.12) (0.22) Adjusted EPS $ 0.53 $ 0.49 $ 0.58 $ 1.68 $ 1.43 15
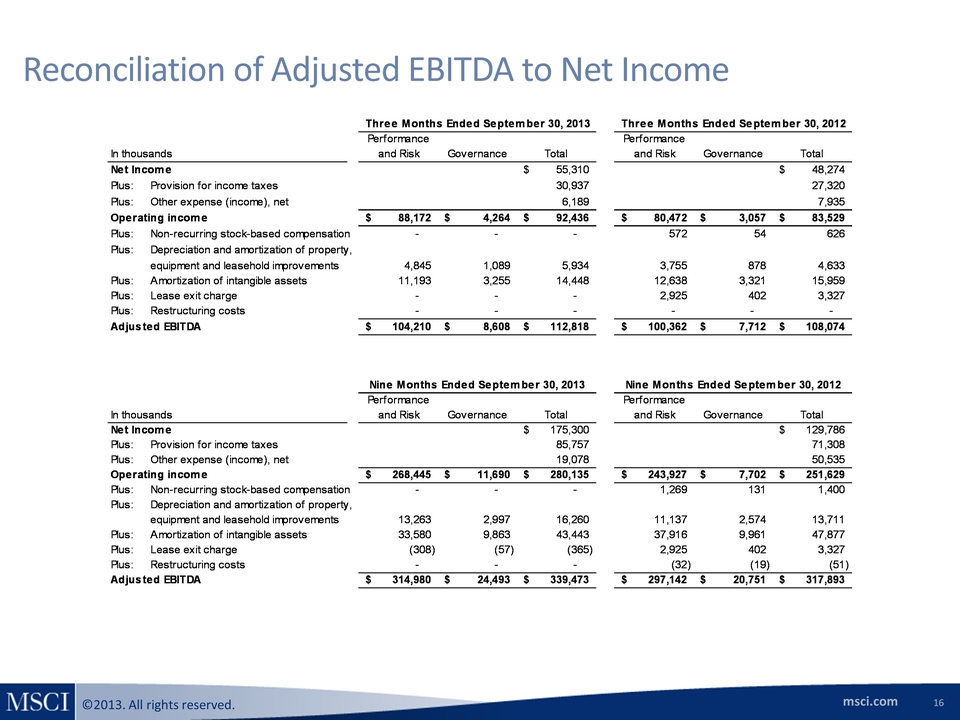
Reconciliation of Adjusted EBITDA to Net Income Three Months Ended September 30, 2013 Three Months Ended September 30, 2012 In thousands Performance and Risk Governance Total Performance and Risk Governance Total Net Income $ 55,310 $ 48,274 Plus: Provision for income taxes 30,937 27,320 Plus: Other expense (income), net 6,189 7,935 Operating income $ 88,172 $ 4,264 $ 92,436 $ 80,472 $ 3,057 $ 83,529 Plus: Non-recurring stock-based compensation - - - 572 54 626 Plus: Depreciation and amortization of property, equipment and leasehold improvements 4,845 1,089 5,934 3,755 878 4,633 Plus: Amortization of intangible assets 11,193 3,255 14,448 12,638 3,321 15,959 Plus: Lease exit charge - - - 2,925 402 3,327 Plus: Restructuring costs - - - - - - Adjusted EBITDA $ 104,210 $ 8,608 $ 112,818 $ 100,362 $ 7,712 $ 108,074 Nine Months Ended September 30, 2013 Nine Months Ended September 30, 2012 In thousands Performance and Risk Governance Total Performance and Risk Governance Total Net Income $ 175,300 $ 129,786 Plus: Provision for income taxes 85,757 71,308 Plus: Other expense (income), net 19,078 50,535 Operating income $ 268,445 $ 11,690 $ 280,135 $ 243,927 $ 7,702 $ 251,629 Plus: Non-recurring stock-based compensation - - - 1,269 131 1,400 Plus: Depreciation and amortization of property, equipment and leasehold improvements 13,263 2,997 16,260 11,137 2,574 13,711 Plus: Amortization of intangible assets 33,580 9,863 43,443 37,916 9,961 47,877 Plus: Lease exit charge (308) (57) (365) 2,925 402 3,327 Plus: Restructuring costs - - - (32) (19) (51) Adjusted EBITDA $ 314,980 $ 24,493 $ 339,473 $ 297,142 $ 20,751 $ 317,893 16
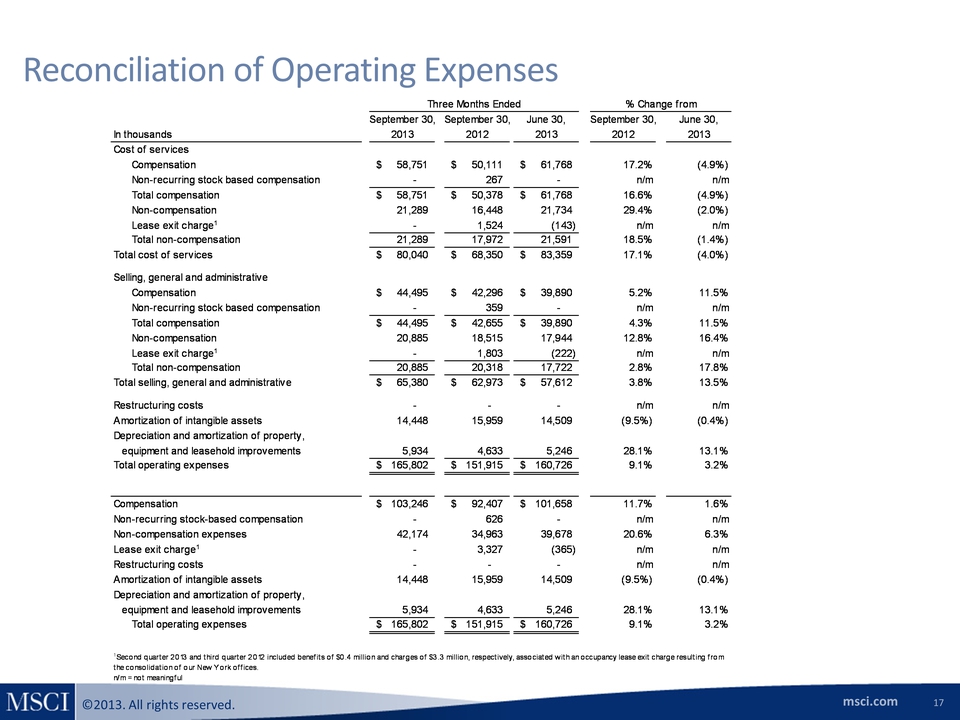
Reconciliation of Operating Expenses Three Months Ended % Change from September 30, September 30, June 30, September 30, June 30, In thousands 2013 2012 2013 2012 2013 Cost of services Compensation $ 58,751 $ 50,111 $ 61,768 $ 17.2% (4.9%) Non-recurring stock based compensation - 267 - n/m n/m Total compensation $ 58,751 $ 50,378 $ 61,768 $ 16.6% (4.9%) Non-compensation 21,289 16,448 21,734 29.4% (2.0%) Lease exit charge1 - 1,524 (143) n/m n/m Total non-compensation 21,289 17,972 21,591 18.5% (1.4%) Total cost of services $ 80,040 $ 68,350 $ 83,359 $ 17.1% (4.0%) Selling, general and administrative Compensation $ 44,495 $ 42,296 $ 39,890 $ 5.2% 11.5% Non-recurring stock based compensation - 359 - n/m n/m Total compensation $ 44,495 $ 42,655 $ 39,890 $ 4.3% 11.5% Non-compensation 20,885 18,515 17,944 12.8% 16.4% Lease exit charge1 - 1,803 (222) n/m n/m Total non-compensation 20,885 20,318 17,722 2.8% 17.8% Total selling, general and administrative $65,380 $ 62,973 $ 57,612 $ 3.8% 13.5% Restructuring costs - - - n/m n/m Amortization of intangible assets 14,448 15,959 14,509 (9.5%) (0.4%) Depreciation and amortization of property, equipment and leasehold improvements 5,934 4,633 5,246 28.1% 13.1% Total operating expenses $ 165,802 $ 151,915 $ 160,726 $ 9.1% 3.2% Compensation $ 103,246 $ 92,407 $ 101,658 $ 11.7% 1.6% Non-recurring stock-based compensation - 626 - n/m n/m Non-compensation expenses 42,174 34,963 39,678 20.6% 6.3% Lease exit charge1 - 3,327 (365) n/m n/m Restructuring costs - - - n/m n/m Amortization of intangible assets 14,448 15,959 14,509 (9.5%) (0.4%) Depreciation and amortization of property, equipment and leasehold improvements 5,934 4,633 5,246 28.1% 13.1% Total operating expenses $ 165,802 $ 151,915 $ 160,726 $ 9.1% 3.2% 1Second quarter 2013 and third quarter 2012 included benefits of $0.4 million and charges of $3.3 million, respectively, associated with an occupancy lease exit charge resulting from the consolidation of our New York offices. n/m = not meaningful 17