Exhibit 99.2
2014 MSCI Inc. All rights reserved. msci.com msci.com Second Quarter 2014 Earnings Presentation July 31, 2014
2014 MSCI Inc. All rights reserved. msci.com 2 msci.com Forward-Looking Statements and Other Information Forward-Looking Statements – Safe Harbor Statements This presentation may contain forward-looking statements within the meaning of the Private Securities Litigation Reform Act of 1995. You should not place undue reliance on forwardlooking statements because they involve known and unknown risks, uncertainties and other factors that are, in some cases, beyond our control and that could materially affect actual results, levels of activity, performance or achievements. For a discussion of risks and uncertainties that could materially affect actual results, levels of activity, performance or achievements, please see the Company’s Annual Report on Form 10-K for the fiscal year ended December 31, 2013 and its other reports filed with the SEC. Any forward-looking statements included in this presentation reflect the Company’s view as of the date of the presentation. The Company assumes no obligation to publicly update or revise these forward-looking statements for any reason, whether as a result of new information, future events, or otherwise, except as required by law. Other Information Percentage changes and totals in this presentation may not sum due to rounding. Percentage changes are referenced to the comparable period in 2013, unless otherwise noted. Total sales include recurring subscription sales and non-recurring sales. Definitions of Run Rate and Retention Rate provided on page 15. Due to the Institutional Shareholder Services Inc. sale, results of our former Governance business are now reflected as discontinued operations in the financial statements of MSCI in the current quarter and for prior periods. The operating metrics for prior periods have also been updated to exclude the Governance business.We have historically reported the financial results and operating metrics for Energy an Commodity products on a standalone basis. Beginning with Q1’14, these results and metrics have been included in the risk management and analytics products. Prior periods have been updated accordingly.2
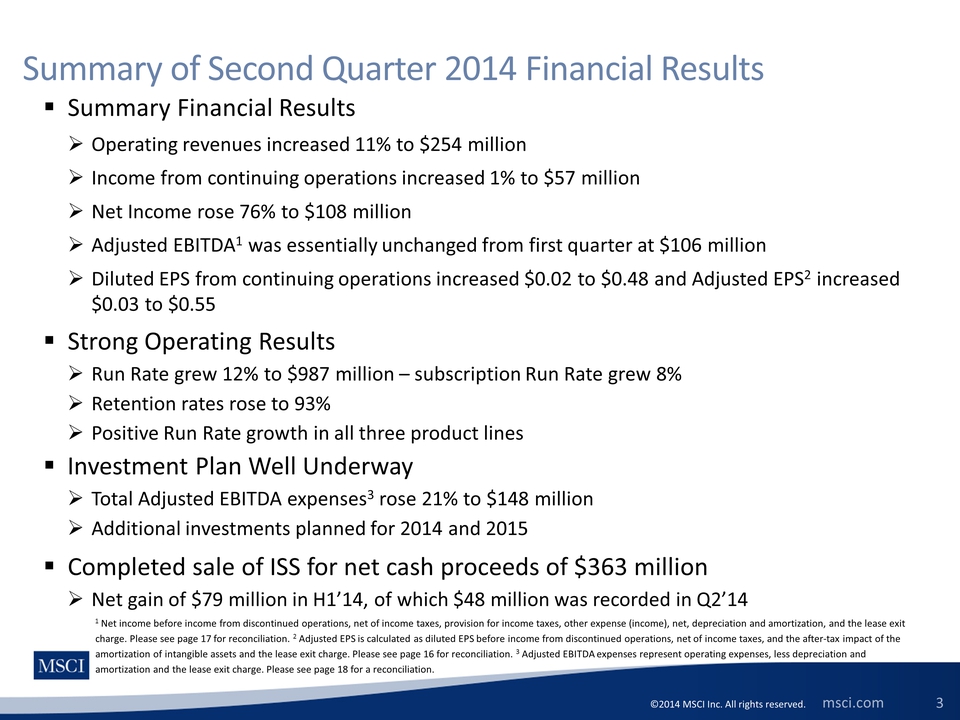
2014 MSCI Inc. All rights reserved. msci.com Summary of Second Quarter 2014 Financial Results Summary Financial Results Operating revenues increased 11% to $254 million Income from continuing operations increased 1% to $57 million Net Income rose 76% to $108 million Adjusted EBITDA1 was essentially unchanged from first quarter at $106 million Diluted EPS from continuing operations increased $0.02 to $0.48 and Adjusted EPS2 increased $0.03 to $0.55 Strong Operating Results Run Rate grew 12% to $987 million – subscription Run Rate grew 8% Retention rates rose to 93% Positive Run Rate growth in all three product lines Investment Plan Well Underway Total Adjusted EBITDA expenses3 rose 21% to $148 million Additional investments planned for 2014 and 2015 Completed sale of ISS for net cash proceeds of $363 million Net gain of $79 million in H1’14, of which $48 million was recorded in Q2’14 1 Net income before income from discontinued operations, net of income taxes, provision for income taxes, other expense (income), net, depreciation and amortization, and the lease exit charge. Please see page 17 for reconciliation. 2 Adjusted EPS is calculated as diluted EPS before income from discontinued operations, net of income taxes, and the after-tax impact of the amortization of intangible assets and the lease exit charge. Please see page 16 for reconciliation. 3 Adjusted EBITDA expenses represent operating expenses, less depreciation and amortization and the lease exit charge. Please see page 18 for a reconciliation. 3
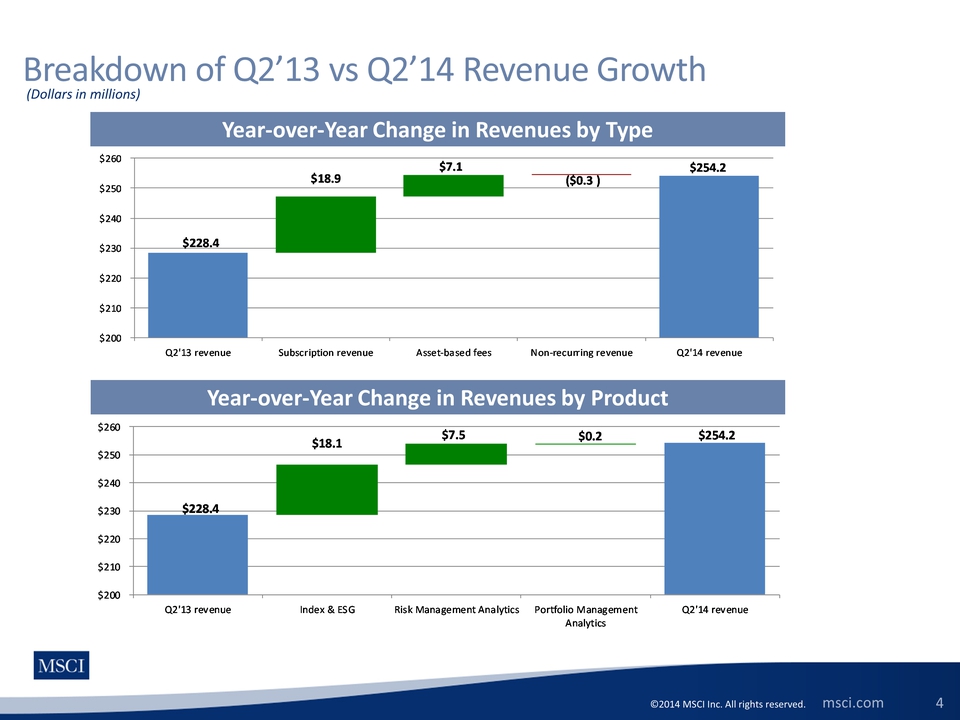
2014 MSCI Inc. All rights reserved. msci.com 4 Breakdown of Q2’13 vs Q2’14 Revenue Growth (Dollars in millions) Year-over-Year Change in Revenues by Type Year-over-Year Change in Revenues by Product $228.4 $254.2 $18.9 $7.1 ($0.3 ) $200 $210 $220 $230 $240 $250 $260 Q2'13 revenue Subscription revenue Asset-based fees Non-recurring revenue Q2'14 revenue $228.4 $254.2 $18.1 $7.5 $0.2 $200 $210 $220 $230 $240 $250 $260 Q2'13 revenue Index & ESG Risk Management Analytics Portfolio Management Analytics Q2'14 revenue 4
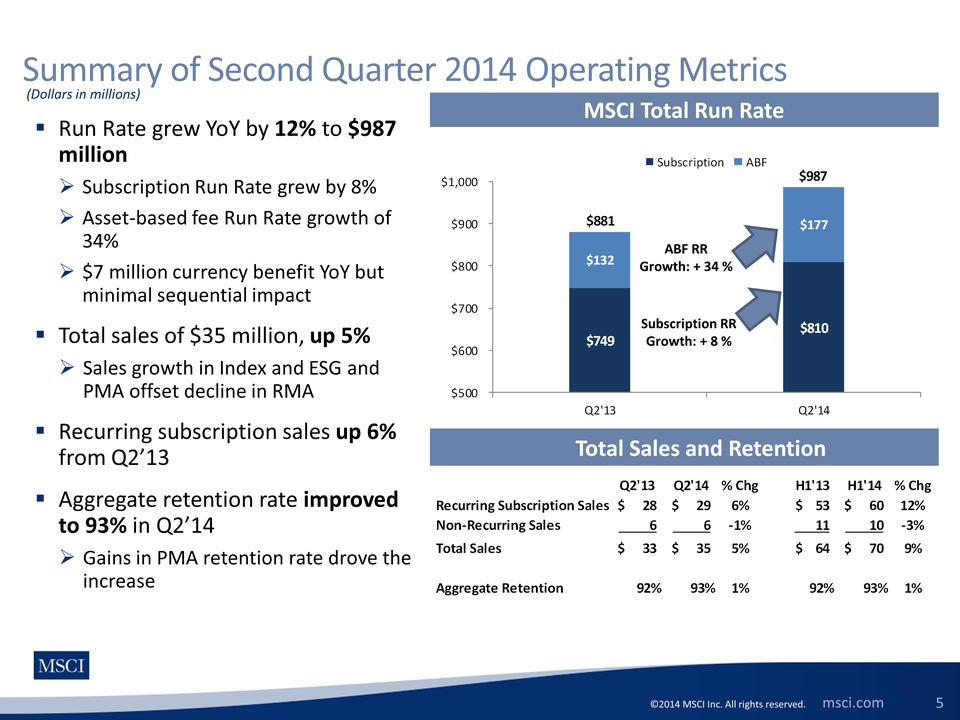
2014 MSCI Inc. All rights reserved. msci.com 5 Summary of Second Quarter 2014 Operating Metrics MSCI Total Run Rate Total Sales and Retention Run Rate grew YoY by 12% to $987 million Subscription Run Rate grew by 8% Asset-based fee Run Rate growth of 34% $7 million currency benefit YoY but minimal sequential impact Total sales of $35 million, up 5% Sales growth in Index and ESG and PMA offset decline in RMA Recurring subscription sales up 6% from Q2’13 Aggregate retention rate improved to 93% in Q2’14 Gains in PMA retention rate drove the increase (Dollars in millions) $749 $810 $132 $177 $881 $987 $500 $600 $700 $800 $900 $1,000 Q2'13 Q2'14 Subscription ABF Subscription RR Growth: + 8 % ABF RR Growth: + 34 % Q2'13 Q2'14 % Chg H1'13 H1'14 % Chg Recurring Subscription Sales 28 $ 29 $ 6% 53 $ 60 $ 12% Non-Recurring Sales 6 6 -1% 11 10 -3% Total Sales 33 $ 35 $ 5% 64 $ 70 $ 9% Aggregate Retention 92% 93% 1% 92% 93% 1% 5
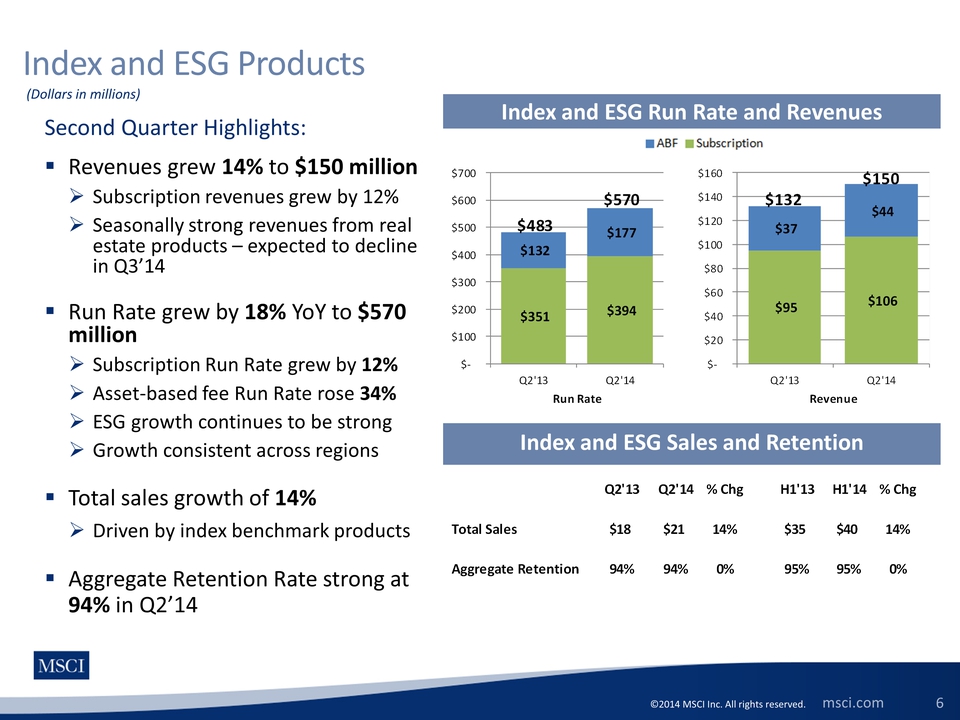
2014 MSCI Inc. All rights reserved. msci.com 6 Index and ESG Run Rate and Revenues Second Quarter Highlights: Revenues grew 14% to $150 million Subscription revenues grew by 12% Seasonally strong revenues from realestate products – expected to decline in Q3’14 Run Rate grew by 18% YoY to $570 million Subscription Run Rate grew by 12% Asset-based fee Run Rate rose 34% ESG growth continues to be strong Growth consistent across regions Total sales growth of 14% Driven by index benchmark products Aggregate Retention Rate strong at 94% in Q2’14 Index and ESG Sales and Retention (Dollars in millions) Index and ESG Products Q2'13 Q2'14 % Chg H1'13 H1'14 % Chg Total Sales $18 $21 14% $35 $40 14% Aggregate Retention 94% 94% 0% 95% 95% 0% $351 $394 $132 $177 $483 $570 $- $100 $200 $300 $400 $500 $600 $700 Q2'13 Q2'14 Run Rate $95 $106 $37 $44 $132 $150 $- $20 $40 $60 $80 $100 $120 $140 $160 Q2'13 Q2'14 Revenue 6
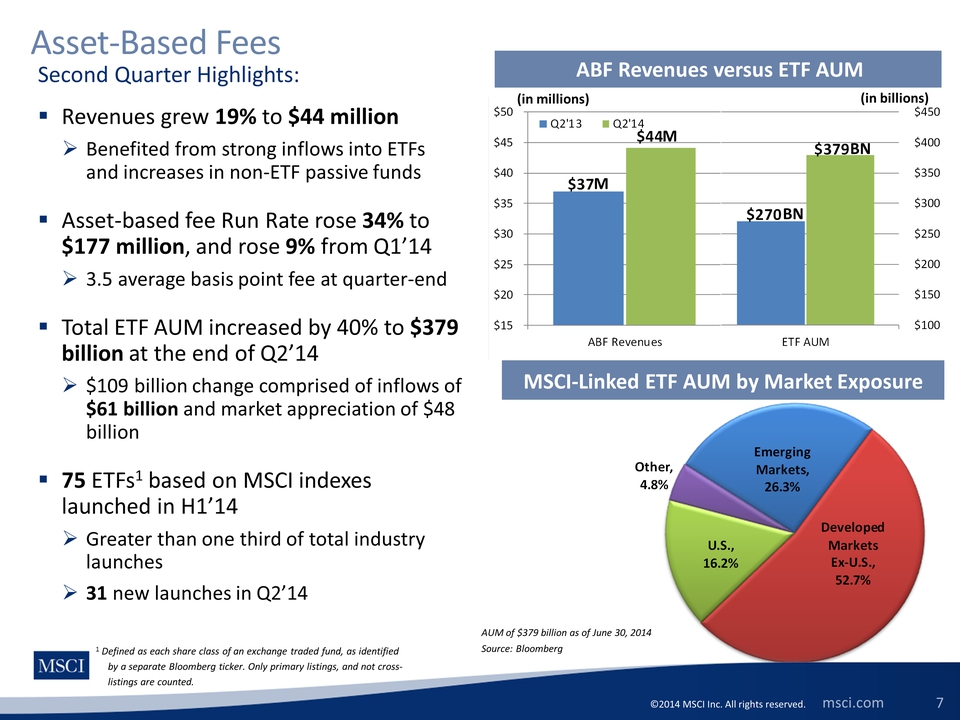
2014 MSCI Inc. All rights reserved. msci.com 7 Asset-Based Fees ABF Revenues versus ETF AUM MSCI-Linked ETF AUM by Market Exposure Second Quarter Highlights: Revenues grew 19% to $44 million Benefited from strong inflows into ETFs and increases in non-ETF passive funds Asset-based fee Run Rate rose 34% to $177 million, and rose 9% from Q1’14 3.5 average basis point fee at quarter-end Total ETF AUM increased by 40% to $379 billion at the end of Q2’14 $109 billion change comprised of inflows of $61 billion and market appreciation of $48 billion 75 ETFs1 based on MSCI indexes launched in H1’14 Greater than one third of total industry launches 31 new launches in Q2’14 AUM of $379 billion as of June 30, 2014 Source: Bloomberg $270 $379 $100 $150 $200 $250 $300 $350 $400 $450 ETF AUM M M BN $37 $44 $15 $20 $25 $30 $35 $40 $45 $50 ABF Revenues Q2'13 Q2'14 BN (in millions) (in billions) M 1 Defined as each share class of an exchange traded fund, as identified by a separate Bloomberg ticker. Only primary listings, and not crosslistings are counted. 7
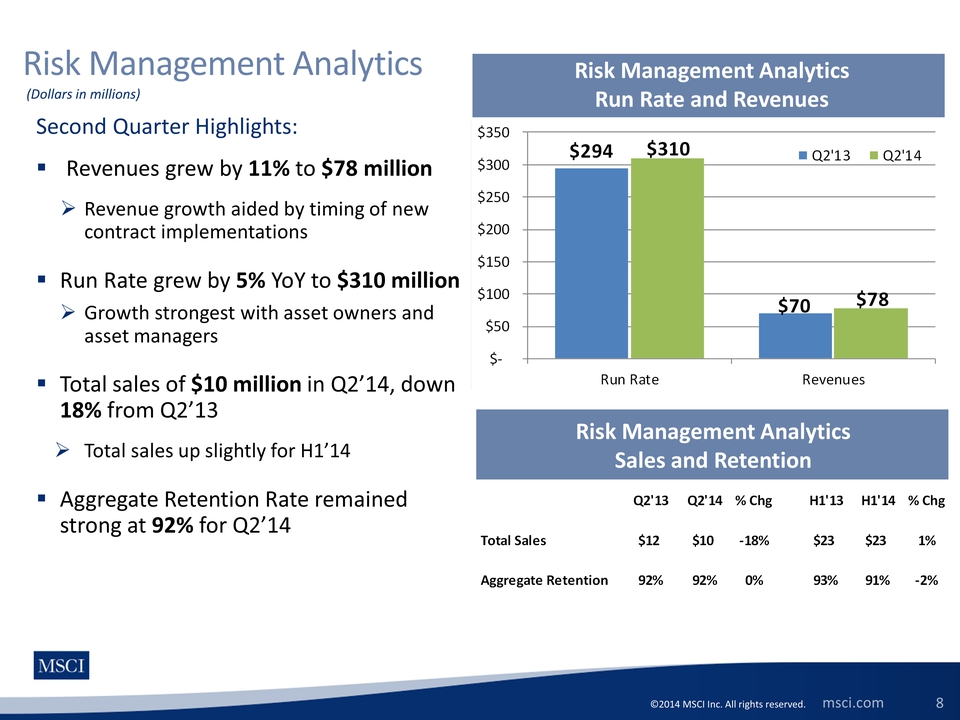
2014 MSCI Inc. All rights reserved. msci.com 8 Risk Management Analytics Risk Management Analytics Run Rate and Revenues Second Quarter Highlights: Revenues grew by 11% to $78 million Revenue growth aided by timing of newcontract implementations Run Rate grew by 5% YoY to $310 million Growth strongest with asset owners and asset managers Total sales of $10 million in Q2’14, down 18% from Q2’13 Total sales up slightly for H1’14 Aggregate Retention Rate remained strong at 92% for Q2’14 Risk Management Analytics Sales and Retention (Dollars in millions) $294 $70 $310 $78 $- $50 $100 $150 $200 $250 $300 $350 Run Rate Revenues Q2'13 Q2'14 Q2'13 Q2'14 % Chg H1'13 H1'14 % Chg Total Sales $12 $10 -18% $23 $23 1% Aggregate Retention 92% 92% 0% 93% 91% -2% 8
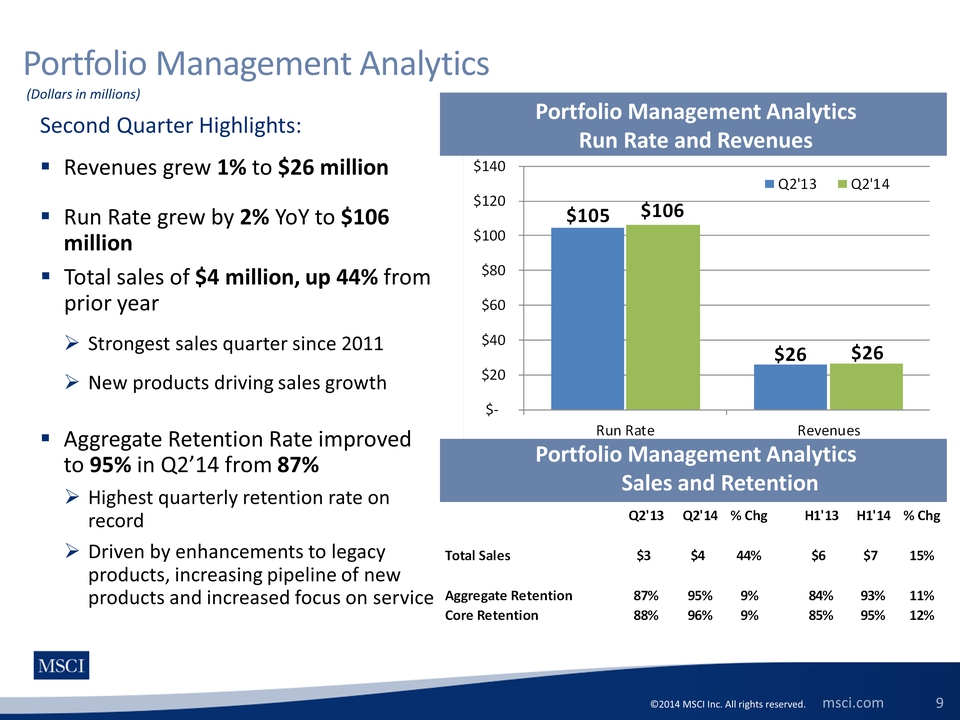
2014 MSCI Inc. All rights reserved. msci.com $105 $26 $106 $26 $- $20 $40 $60 $80 $100 $120 $140 Run Rate Revenues Q2'13 Q2'14 9 Portfolio Management Analytics Portfolio Management Analytics Run Rate and Revenues Second Quarter Highlights: Revenues grew 1% to $26 million Run Rate grew by 2% YoY to $106 million Total sales of $4 million, up 44% from prior year Strongest sales quarter since 2011 New products driving sales growth Aggregate Retention Rate improved to 95% in Q2’14 from 87% Highest quarterly retention rate on record Driven by enhancements to legacy products, increasing pipeline of new products and increased focus on service Portfolio Management Analytics Sales and Retention (Dollars in millions) Q2'13 Q2'14 % Chg H1'13 H1'14 % Chg Total Sales $3 $4 44% $6 $7 15% Aggregate Retention 87% 95% 9% 84% 93% 11% Core Retention 88% 96% 9% 85% 95% 12% 9
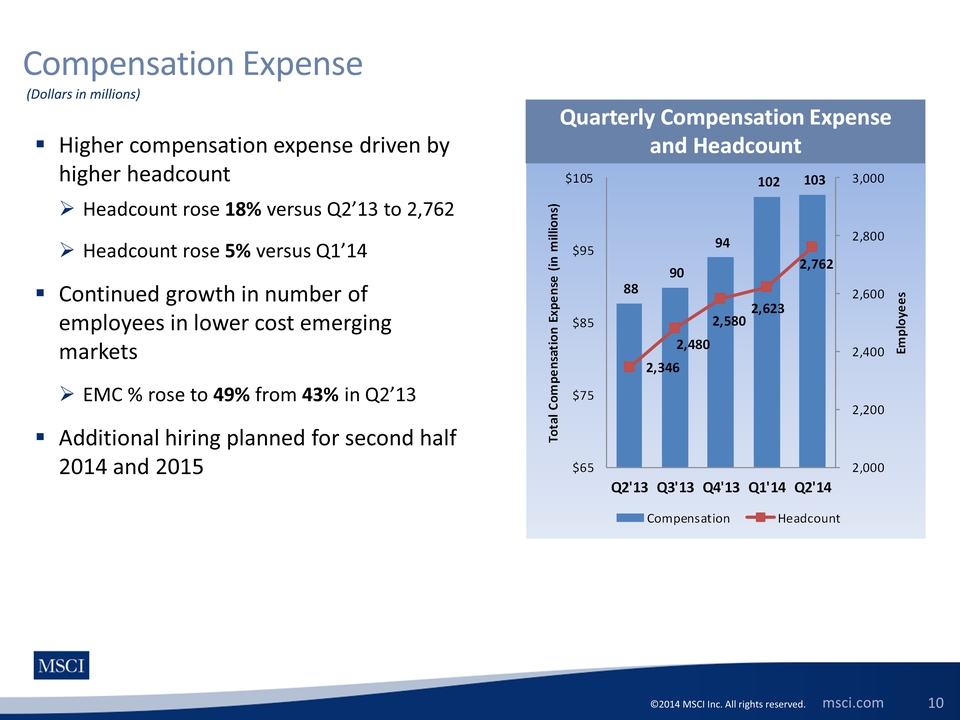
2014 MSCI Inc. All rights reserved. msci.com 10 Compensation Expense (Dollars in millions) Higher compensation expense driven by higher headcount Headcount rose 18% versus Q2’13 to 2,762 Headcount rose 5% versus Q1’14 Continued growth in number of employees in lower cost emerging markets EMC % rose to 49% from 43% in Q2’13 Additional hiring planned for second half 2014 and 2015 88 90 94 102 103 2,346 2,480 2,580 2,623 2,762 2,000 2,200 2,400 2,600 2,800 3,000 $65 $75 $85 $95 $105 Q2'13 Q3'13 Q4'13 Q1'14 Q2'14 Employees Total Compensation Expense (in millions) Compensation Headcount Quarterly Compensation Expense and Headcount 10
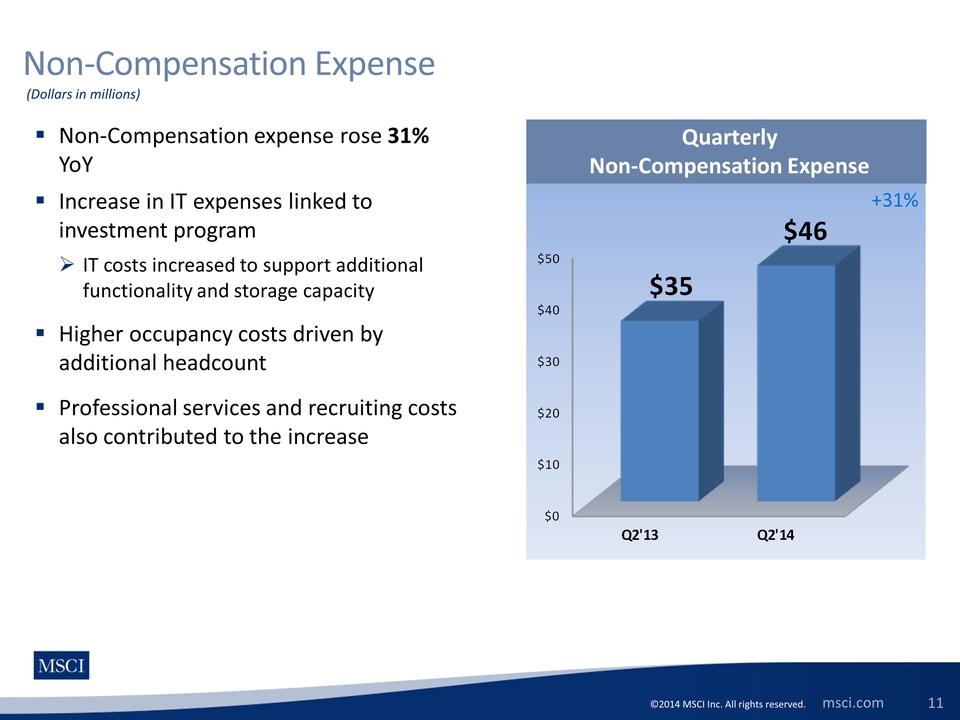
2014 MSCI Inc. All rights reserved. msci.com 11 Non-Compensation Expense (Dollars in millions) Non-Compensation expense rose 31% YoY Increase in IT expenses linked to investment program IT costs increased to support additional functionality and storage capacity Higher occupancy costs driven by additional headcount Professional services and recruiting costs also contributed to the increase Quarterly Non-Compensation Expense +31% 11
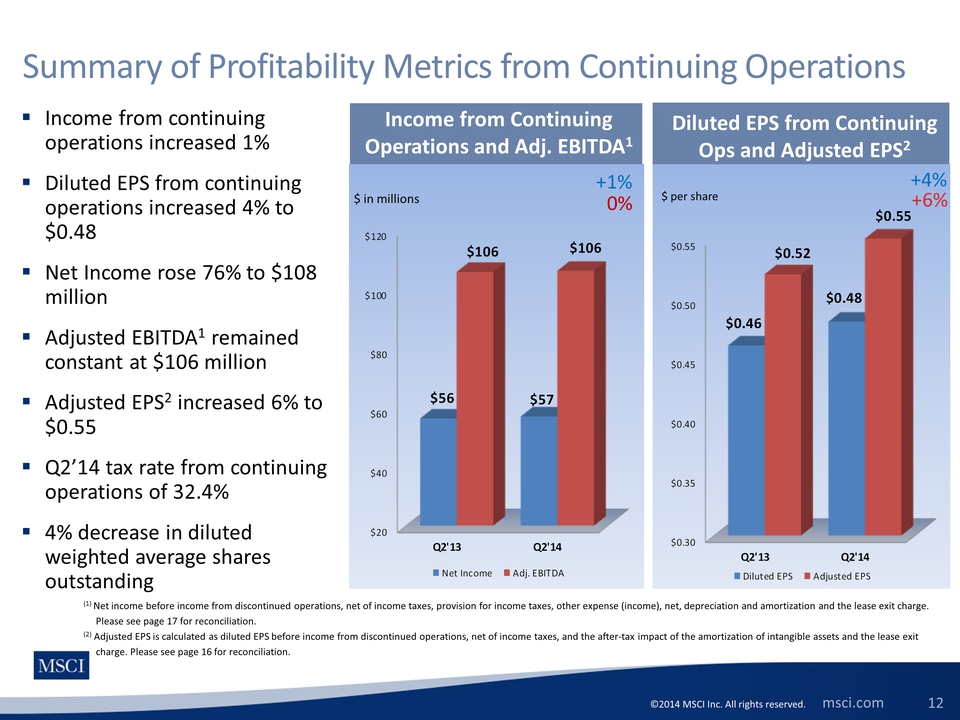
2014 MSCI Inc. All rights reserved. msci.com 12 Income from continuing operations increased 1% Diluted EPS from continuing operations increased 4% to $0.48 Net Income rose 76% to $108 million Adjusted EBITDA1 remainedconstant at $106 million Adjusted EPS2 increased 6% to $0.55 Q2’14 tax rate from continuing operations of 32.4% 4% decrease in diluted weighted average shares outstanding Summary of Profitability Metrics from Continuing Operations (1) Net income before income from discontinued operations, net of income taxes, provision for income taxes, other expense (income), net, depreciation and amortization, and the lease exit charge. Please see page 17 for reconciliation. (2) Adjusted EPS is calculated as diluted EPS before income from discontinued operations, net of income taxes, and the after-tax impact of the provision for amortization of intangible assets, and the lease exit charge. Please see page 16 for reconciliation. $ per share +4 +6% Diluted EPS from Continuing Ops and Adjusted EPS2 Income from Continuing Operations and Adj. EBITDA1 0% $ in millions +1% 12
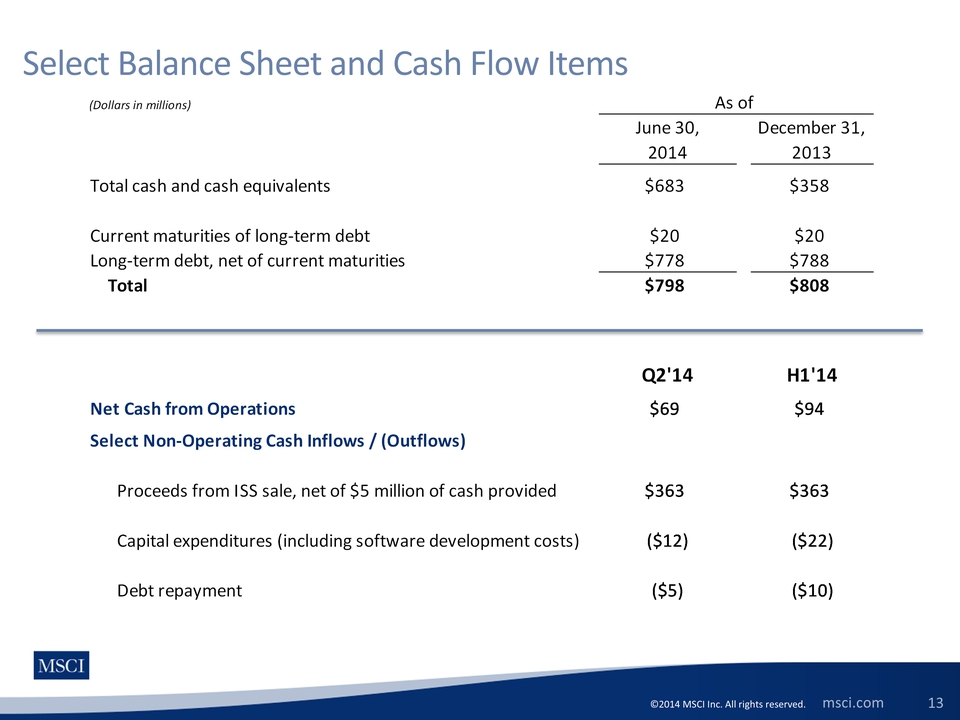
2014 MSCI Inc. All rights reserved. msci.com (Dollars in millions) June 30, 2014 December 31, 2013 Total cash and cash equivalents $683 $358 Current maturities of long-term debt $20 $20 Long-term debt, net of current maturities $778 $788 Total $798 $808 Q2'14 H1'14 Net Cash from Operations $69 $94 Select Non-Operating Cash Out-Flows Proceeds from ISS sale, net of $5 million of cash provided $363 $363 Capital expenditures (including software development costs) $12 $22 Debt repayment $5 $10 As of 13 Select Balance Sheet and Cash Flow Items 13
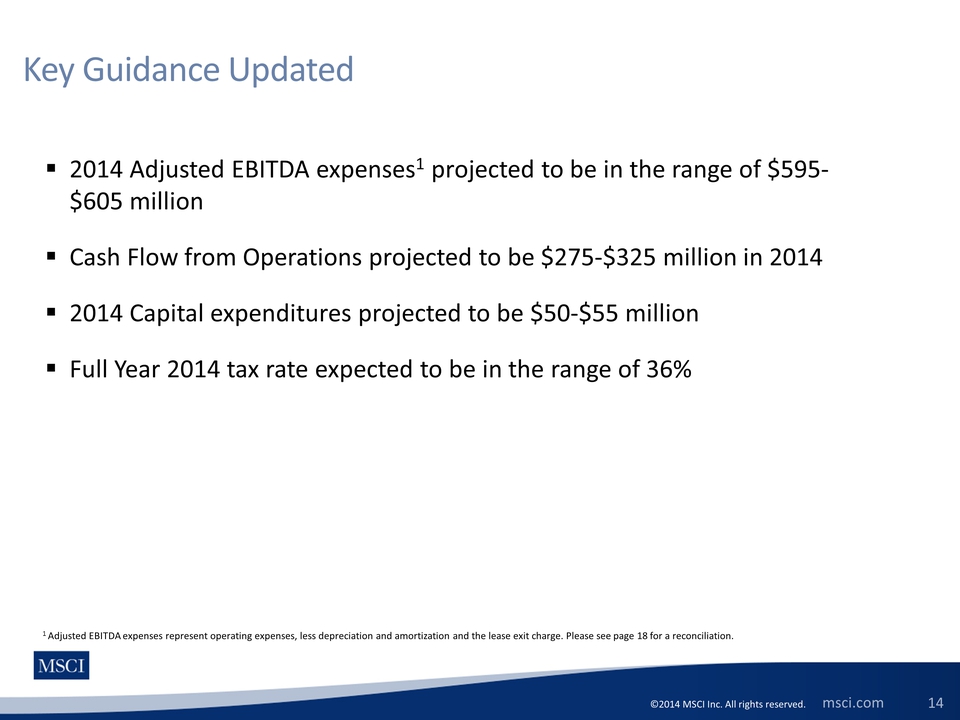
2014 MSCI Inc. All rights reserved. msci.com Key Guidance Updated 14 2014 Adjusted EBITDA expenses1 projected to be in the range of $595- $605 million Cash Flow from Operations projected to be $275-$325 million in 2014 2014 Capital expenditures projected to be $50-$55 million Full Year 2014 tax rate expected to be in the range of 36%1 Adjusted EBITDA expenses represent operating expenses, less depreciation and amortization and the lease exit charge. Please see page 18 for a reconciliation.
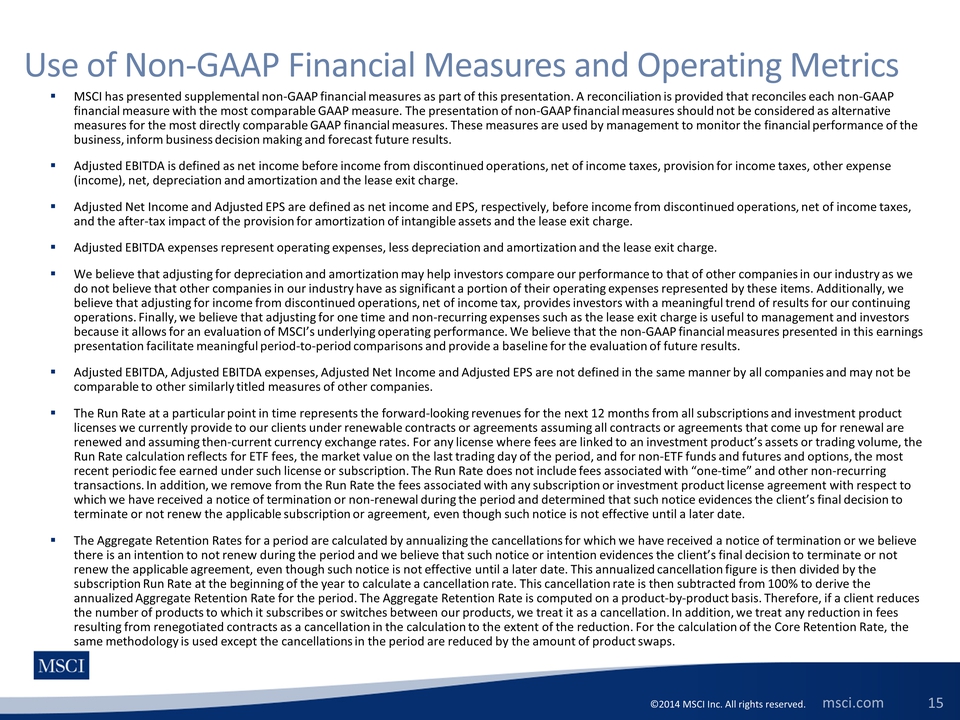
2014 MSCI Inc. All rights reserved. msci.com 15 Use of Non-GAAP Financial Measures and Operating Metrics MSCI has presented supplemental non-GAAP financial measures as part of this presentation. A reconciliation is provided that reconciles each non-GAAP financial measure with the most comparable GAAP measure. The presentation of non-GAAP financial measures should not be considered as alternative measures for the most directly comparable GAAP financial measures. These measures are used by management to monitor the financial performance of the business, inform business decision making and forecast future results. Adjusted EBITDA is defined as net income before income from discontinued operations, net of income taxes, provision for income taxes, other expense (income), net, depreciation and amortization and the lease exit charge. Adjusted Net Income and Adjusted EPS are defined as net income and EPS, respectively, before income from discontinued operations, net of income taxes, and the after-tax impact of the provision for amortization of intangible assets and the lease exit charge. Adjusted EBITDA expenses represent operating expenses, less depreciation and amortization and the lease exit charge. We believe that adjusting for depreciation and amortization may help investors compare our performance to that of other companies in our industry as we do not believe that other companies in our industry have as significant a portion of their operating expenses represented by these items. Additionally, we believe that adjusting for income from discontinued operations, net of income tax, provides investors with a meaningful trend of results for our continuing operations. Finally, we believe that adjusting for one time and non-recurring expenses such as the lease exit charge is useful to management and investors because it allows for an evaluation of MSCI’s underlying operating performance. We believe that the non-GAAP financial measures presented in this earnings presentation facilitate meaningful period-to-period comparisons and provide a baseline for the evaluation of future results. Adjusted EBITDA, Adjusted EBITDA expenses, Adjusted Net Income and Adjusted EPS are not defined in the same manner by all companies and may not be comparable to other similarly titled measures of other companies. The Run Rate at a particular point in time represents the forward-looking revenues for the next 12 months from all subscriptions and investment product licenses we currently provide to our clients under renewable contracts or agreements assuming all contracts or agreements that come up for renewal are renewed and assuming then-current currency exchange rates. For any license where fees are linked to an investment product’s assets or trading volume, the Run Rate calculation reflects for ETF fees, the market value on the last trading day of the period, and for non-ETF funds and futures and options, the most recent periodic fee earned under such license or subscription. The Run Rate does not include fees associated with “one-time” and other non-recurring transactions. In addition, we remove from the Run Rate the fees associated with any subscription or investment product license agreement with respect to which we have received a notice of termination or non-renewal during the period and determined that such notice evidences the client’s final decision to terminate or not renew the applicable subscription or agreement, even though such notice is not effective until a later date. The Aggregate Retention Rates for a period are calculated by annualizing the cancellations for which we have received a notice of termination or we believe there is an intention to not renew during the period and we believe that such notice or intention evidences the client’s final decision to terminate or not renew the applicable agreement, even though such notice is not effective until a later date. This annualized cancellation figure is then divided by the subscription Run Rate at the beginning of the year to calculate a cancellation rate. This cancellation rate is then subtracted from 100% to derive the annualized Aggregate Retention Rate for the period. The Aggregate Retention Rate is computed on a product-by-product basis. Therefore, if a client reduces the number of products to which it subscribes or switches between our products, we treat it as a cancellation. In addition, we treat any reduction in fees resulting from renegotiated contracts as a cancellation in the calculation to the extent of the reduction. For the calculation of the Core Retention Rate, the same methodology is used except the cancellations in the period are reduced by the amount of product swaps. 15
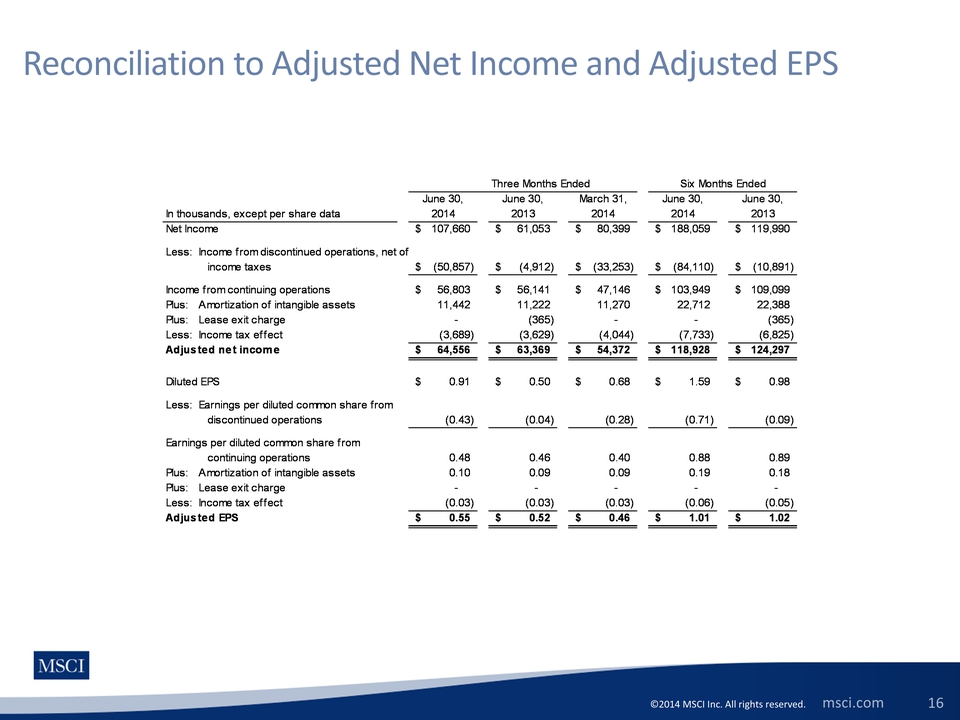
2014 MSCI Inc. All rights reserved. msci.com 16 Reconciliation to Adjusted Net Income and Adjusted EPS Three Months Ended Six Months Ended June 30, June 30, March 31, June 30, June 30, In thousands, except per share data 2014 2013 2014 2014 2013 Net Income 107,660 $ 61,053 $ 80,399 $ 188,059 $ 119,990 $ Less: Income from discontinued operations, net of income taxes (50,857) $ (4,912) $ (33,253) $ (84,110) $ (10,891) $ Income from continuing operations 56,803 $ 56,141 $ 47,146 $ 103,949 $ 109,099 $ Plus: Amortization of intangible assets 11,442 11,222 11,270 22,712 22,388 Plus: Lease exit charge - (365) - - (365) Less: Income tax effect (3,689) (3,629) (4,044) (7,733) (6,825) Adjusted net income 64,556 $ 63,369 $ 54,372 $ 118,928 $ 124,297 $ Diluted EPS 0.91 $ 0.50 $ 0.68 $ 1.59 $ 0.98 $ Less: Earnings per diluted common share from discontinued operations (0.43) (0.04) (0.28) (0.71) (0.09) Earnings per diluted common share from continuing operations 0.48 0.46 0.40 0.88 0.89 Plus: Amortization of intangible assets 0.10 0.09 0.09 0.19 0.18 Plus: Lease exit charge Less: Income tax effect (0.03) (0.03) (0.03) (0.06) (0.05) Adjusted EPS 0.55 $ 0.52 $ 0.46 $ 1.01 $ 1.02 $ 16
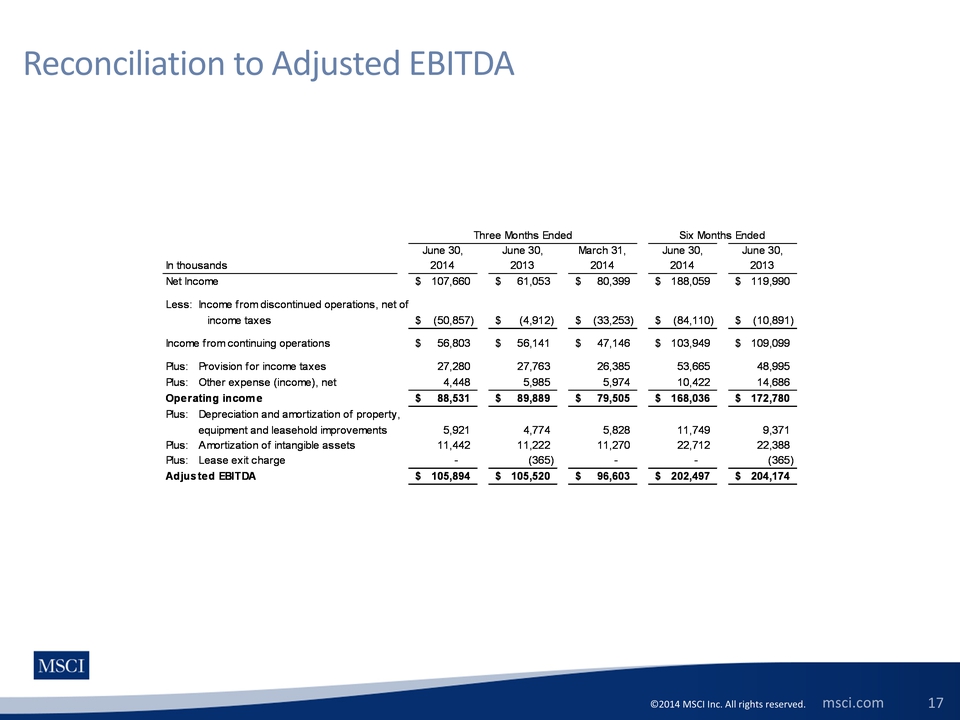
2014 MSCI Inc. All rights reserved. msci.com 17 Reconciliation to Adjusted EBITDA June 30, June 30, March 31, June 30, June 30, In thousands 2014 2013 2014 2014 2013 Net Income 107,660 $ 61,053 $ 80,399 $ 188,059 $ 119,990 $ Less: Income from discontinued operations, net of income taxes (50,857) $ (4,912) $ (33,253) $ (84,110) $ (10,891) $ Income from continuing operations 56,803 $ 56,141 $ 47,146 $ 103,949 $ 109,099 $ Plus: Provision for income taxes 27,280 27,763 26,385 53,665 48,995 Plus: Other expense (income), net 4,448 5,985 5,974 10,422 14,686 Operating income 88,531 $ 89,889 $ 79,505 $ 168,036 $ 172,780 $ Plus: Depreciation and amortization of property, equipment and leasehold improvements 5,921 4,774 5,828 11,749 9,371 Plus: Amortization of intangible assets 11,442 11,222 11,270 22,712 22,388 Plus: Lease exit charge - (365) - - (365) Adjusted EBITDA 105,894 $ 105,520 $ 96,603 $ 202,497 $ 204,174 $ Three Months Ended Six Months Ended 17
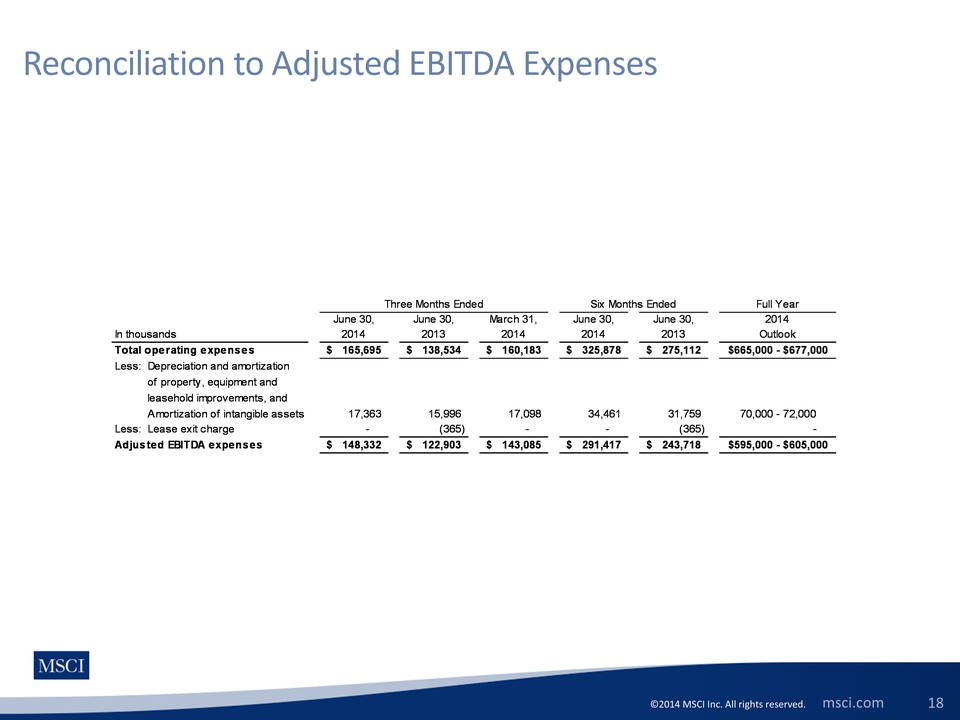
2014 MSCI Inc. All rights reserved. msci.com 18 Reconciliation to Adjusted EBITDA Expenses Full Year June 30, June 30, March 31, June 30, June 30, 2014 In thousands 2014 2013 2014 2014 2013 Outlook Total operating expenses 165,695 $ 138,534 $ 160,183 $ 325,878 $ 275,112 $ $665,000 - $677,000 Less: Depreciation and amortization of property, equipment and leasehold improvements, and Amortization of intangible assets 17,363 15,996 17,098 34,461 31,759 70,000 - 72,000 Less: Lease exit charge - (365) (365) - Adjusted EBITDA expenses 148,332 $ 122,903 $ 143,085 $ 291,417 $ 243,718 $ $595,000 - $605,000 Three Months Ended Six Months Ended 18