Exhibit 99.1

SolarCity Third Quarter 2015 Shareholder Letter
Record 256 MW Installed for a Cumulative Total of 1.7 GW
Revenue up 95% Year-over-Year
$239 Million of Economic Value Creation in Q3
Cost per Watt Achieves New Record Low of $2.84
2016 Guidance for 1.25 GW Installed and Positive Cash Flow by Q4
October 29, 2015
Dear Fellow Shareholders:
In the third quarter of 2015, SolarCity reached two major milestones. First, we officially launched our international expansion with our first installations in Mexico. Second, we became the first solar company to reach 1 GW in annualized distributed solar installations in the U.S.—and likely the world. During the quarter, we installed 256 MW of distributed solar at what we believe is an industry-leading, record low cost of $2.84 per Watt, and generated incremental Economic Value Creation of $239 million for our equity shareholders. Ending the quarter with 1.6 GW of Energy Contracts cumulatively installed and energy production at record levels, our contracted portfolio of installed solar energy systems generated $112 million in PowerCo Available Cash over the trailing twelve months, or $171 million excluding tax equity distributions. Moreover, we entered into the final quarter of 2015 with quarterly installations at a pace of ~280 MW plus a backlog stretching well into 2016.

-1-
PowerCo Platform Growing Rapidly
| · | PowerCo Available Cash: $112 million over trailing twelve months |
| · | TTM Energy Production: 1.5 Terawatt-Hour (TWh), up 75% year-over-year |
| · | Cumulative MW Installed: 1,674 MW, up 86% year-over-year |
| · | Cumulative Customers: 298,030, up 77% year-over-year |
| · | Estimated Nominal Contracted Payments Remaining: $8.9 billion, up 115% year-over-year |
| · | Net Retained Value: $3.3 Billion, or approximately $33 per basic share |
As we introduced in our Q2 2015 shareholder letter, our DevCo growth engine books new customers and installs thousands of new systems every week, and our PowerCo portfolio of contracted solar installations generates a steady stream of energy, revenue, and cash flow over the estimated 30-year useful lives of our systems. DevCo represents growth and investment and PowerCo represents the long-term return on that investment.
Over the twelve months through September 30, 2015, PowerCo’s installed portfolio produced 1.5 Terawatt-Hour (TWh) of energy, up 75% year-over-year, and achieved a record 6.6 GWh day in July. Average FICO scores for PowerCo’s residential customers as of the end of the quarter exceeded 750. More importantly, customer payment performance across the portfolio was not only strong but superior to other consumer asset classes. Energy production and maintenance expenses are also both coming in better than initially forecast.
We introduced a new metric in Q2, PowerCo Available Cash (PAC), which represents the net cash flows generated by PowerCo’s contracted and installed solar system portfolio. PowerCo Operating Cash Flow – before distributions to tax equity partners and the payment of interest and debt—was $215 million over the trailing twelve months through September 30, 2015. PowerCo Available Cash, after distributions to tax equity partners and the payment of interest and debt, was $112 million. Because PAC represents the underlying cash flow generation of our contracted installations, annualized PAC should grow along with new MW Deployed. However, trailing twelve months PAC in Q3 2015 declined quarter-over-quarter due primarily to two factors largely related to the timing of financing payments. First, many of our main interest and debt repayments occur every six months rather than every quarter, which, combined with an increase in PowerCo debt over the last 12 months, led to a $10 million increase in debt service as compared to the year ago quarter. Second, payments from financing partners for certain of our lease pass-through funds also occur every six months, resulting in an $8 million decline vs. the prior period. Combined, Q3 2015 PAC was impacted by $18 million owing to the timing of certain financing payments, and our normalized PAC continues to growth on a year-over-year basis.
DevCo Crosses Annualized Run Rate of 1 GW in Installations in 3Q
| · | MW Installed: Record 256 MW, up 86% year-over-year; residential up 69% year-over-year |
| · | MW Booked: 345 MW, up 50% year-over-year |
| · | Net Increase in Nominal Contracted Payments Remaining: $1.2 billion, up 47% year-over-year |
| · | DevCo Cost: $2.84 per Watt, down (2%) year-over-year |
| · | Unlevered IRR: 12% forecast from Q3 2015 installations based on all-in costs including SG&A |
| · | Economic Value Creation: $239 Million forecast from our incremental Q3 2015 installations |
-2-
| |

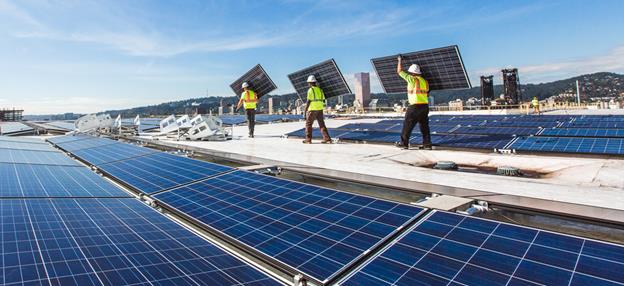
| PowerCo represents steady-state cash flow, and DevCo represents the engine that drives the growth in PowerCo’s contracted and installed assets. In the third quarter of 2015, DevCo delivered record throughput in distributed solar installations with 256 MW Installed, the equivalent to an annualized rate over 1 GW. Not only did this translate into growth of 86% year-over-year but it represented growth of 35% as compared to the prior quarter. Q3 2015 MW Installed was below guidance by 4 MW, or approximately a day and a half’s worth of installations. California remained our No. 1 state, and the East Coast continued to be our second most important geographical area with approximately one-third of total MW Installed and growth of 112% year-over-year. Exiting the quarter with over 90 facilities supporting thousands of installers, sales, and service personnel across the country, we have built what we believe to be the largest and most efficient rooftop installation operation in the world. Our top crews—Ramses, Sigma, and Oceanus—deserve particular recognition. |
Continuing to set the stage for our growth in 2016, our sales activity outpaced our installations by a wide margin with 345 MW Booked and 35,535 new net Customers added in the quarter. This represented a decline compared to the 395 MW Booked in Q2 2015 owing in part to the implementation of a new cancellation policy. Previously, we automatically cancelled uninstalled contracts that had been inactive for 120 days. We have updated the inactive policy to 90 days for two reasons: (1) as an efficiency measure, so that our customer account management team’s processes will be focused on our active customers, and (2) to better align the metric with our quarterly reporting period. This impacted MW Booked by ~35 MW, and if we had maintained our prior cancellation policy, we would have booked 380 MW, up 65% year-over-year. Bookings are tracking very well for Q4 and we expect to be at or near our Q2 high again.
Our Estimated Nominal Contracted Payments Remaining—an approximation of the revenue our lease/PPA/loan customers are expected to generate over the remaining life of their Energy Contracts—increased by a net $1.2 billion in the period. We view the increase in Estimated Nominal Contracted Payments Remaining as a better measure of our new sales activity than reported revenue, which is recognized per GAAP over the life of the 20 – 30 year terms of our lease, PPA, and loan contracts.
| |
Total Cost per Watt in the third quarter of 2015 declined to a new record low of $2.84 per Watt. Aided by greater scale and efficiencies in residential, our blended installation cost declined (12%) year-over-year and (10%) quarter-over-quarter to $1.92 per Watt. This represents a new record not only for SolarCity but most likely for the industry as well. Though only $0.02/W away from our 2017 installation cost goal, we expect continued improvement from here. Notably, our commercial installation costs are currently higher than our residential, and as we scale up our vertically-integrated commercial installations, we expect to achieve new lows soon. Sales costs increased quarter-over-quarter to $0.64 per Watt in part due to continued investment in sales as well as a ~$0.03 per Watt increase from the one-time change in our cancellation policy discussed above. We expect our sales costs to decrease in Q4 2015 and into 2016. G&A costs were $0.27 per Watt, rising 29% year-over-year largely on investment in our steady state infrastructure | 
|
-3-
and IT support systems. That investment is nearing completion and we expect to level out and improve on a $/Watt basis going forward. R&D costs rose to $17.7 million primarily due to investments in our module, cell, battery and software initiatives. Cost management is a focus for all departments and we are committed to lowering our costs even further in 2016. Reconciliation of our cost per Watt to our GAAP financial statements is available on the investor relations section of our website (at investors.solarcity.com).
A representation of the total value created by PowerCo and DevCo in the quarterly period, Economic Value Creation (EVC) is the incremental net present value created for our equity shareholders from our Q3 2015 deployments after debt. Driven largely by the increase in MW Deployed and lower costs, our Q3 2015 forecast for EVC grew 22% quarter-over-quarter to $239 million, or $1.21/W for a year-to-date total through the first three quarters of 2015 of $582 million, or $1.15 per Watt. The Unlevered IRR on our Q3 2015 deployments is forecast at 12%.
C&I Takes Big Step Forward with International Launch and Significant U.S. Growth
Though commercial & industrial (C&I) solar accounts for a relatively smaller share of our volumes at 15-20%, we have maintained our leadership position as the No. 1 C&I installer in the United States in the first half of 2015. Since the start of 2014, we accounted for 8% of the total C&I solar MW installed in the country through the most recent data available as of the end of Q2 2015 from GTM Research/SEIA.
In Q3 2015, our C&I business stepped it up even further with 53 MW Installed, up over 202% year-over-year. The growth was largely driven by greater traction among both Fortune 500 investment grade companies, as well as municipal customers such as the Temecula Valley Unified School District. In addition, we installed our first few MW following the launch of our solar service offering in Mexico. Looking ahead, the launch of our new small-to-medium sized business (SMB) PACE product offering in August has expanded our addressable market. Not only do we expect SMB bookings to grow considerably in Q4 2015 and Q1 2016 but NPV economics are extremely attractive with PPA prices closer to residential within a range of $0.11-0.16 kWh.
In addition, we made major progress in further refining our operations by deploying more C&I systems through our own vertically-integrated installation crews this quarter. Though the practice still represents a small portion of our overall volumes and is currently limited to certain California markets, the use of our own C&I crews led to a reduction in installation cost/Watt of over 20%, as compared to comparable C&I installations outsourced through subcontractors this quarter. We expect further cost efficiencies with this approach and view this as a competitive advantage. Finally, uptake of our DemandLogic C&I energy storage solution continues to increase. In Q3, we executed a PPA with the Kauai Island Utility Cooperative
-4-
(KIUC) for the world’s first dispatchable solar and storage system. This project will provide reliable, controllable, renewable energy day and night at a cost competitive with the current cost of generation. We believe this project is a testament to the future of power generation and are incredibly excited to deploy this system in 2016. With solar energy offsetting C&I customers’ $/kWh energy costs and storage minimizing their $/kW capacity charges, DemandLogic’s solar plus storage combination truly offers a unique, symbiotic benefit to our customers and the grid. As more businesses recognize the low-risk savings our solar and storage services offer, we expect DemandLogic to serve as a primary differentiator of the SolarCity C&I value proposition and provide further fuel for C&I growth in the years ahead.
High Quality Assets Afford a Diverse and Lower Risk Financing Structure
Our focus on a diverse pool of long-term, high quality rooftop assets has allowed us to enjoy a financing structure that is different from the vast majority of solar companies. Our approach is particularly differentiated from the various YieldCos that tend to have few very large and complex projects that we believe are harder to underwrite and have different risk profiles and capital requirements. Our capital structure utilizes a higher mix of tax equity funding and low cost, flexible aggregation debt to finance the initial installations, and longer term we use the asset-backed securitization (ABS) market to refinance the aggregation debt to increase both the maturity and the dollar amount of the financing.
We believe the tax equity market is less volatile than the broader capital markets as it is driven more by tax appetite than risk premiums. In addition, it provides us with visibility into future financing because of the attractive after-tax returns associated with the high quality assets. We have agreements with 20 tax equity partners to date comprised of various large financial and corporate institutions and plan on adding three to five new partners in 2016. We have the next seven months of required tax equity capacity already under commitment and expect to have the majority of our 2016 needs committed by the end of this year.
Our aggregation facility for our leases and PPAs is a syndicated facility comprised of five major institutions. It is a revolving facility, which is low cost and is very flexible. The current amount available to draw is approximately $332 million and will be increased to support the size of the growing business. Similarly, for our MyPower loan product, we have a dedicated aggregation facility with a large financial institution that is a revolving facility, which is also low cost and flexible. The current available amounts to draw are approximately $77 million, and we expect to increase this capacity to support the size and growth of the MyPower product. As we secure longer-term debt in the ABS markets, we expect to use a portion of the proceeds to pay down the aggregation and MyPower facilities to allow for further recycling of the available capacity.
We have used the ABS market as the main source to provide the final portion of our low-cost financing. We completed the industry’s first solar ABS in Q4 2013, and with our fourth and latest ABS issued in August we now have successfully securitized our two main financing structures--with investment grade ratings for the underlying portfolios of assets—a testament to the high quality solar customers and assets that we are known for. This is a major accomplishment for not only SolarCity but the solar industry. Consistent with our previously stated strategy, we expect to continue to issue new securitizations of solar assets, including our new MyPower loan contracts. We are engaged in the rating agency process for our next securitization transaction, and expect to be back in the market when we obtain the rating.
We currently have solar assets totaling $669M in our Financing Receivables eligible to move into aggregation and/or ABS facilities over the next few quarters.
-5-

The current dislocations in the solar financing markets have had limited impacts on SolarCity’s funding due to our differentiated assets and financing structure. Though the risk-free rate will inevitably rise, we expect distributed solar’s risk premiums to continue to compress and secure a balanced cost of capital.
Winning the Policy Battle to Combat Anti-Competitive Measures Trying to Stop Distributed Solar
The solar industry also made significant progress on the policy front over the last few months. Despite the continued efforts of some utility groups to undermine the economics of distributed solar, regulators rejected proposals to introduce fixed charges unfairly penalizing distributed solar customers in Colorado, New Mexico, Minnesota, and Kansas. Net metering caps were increased in New Jersey and New York, and the Nevada Public Utilities Commission extended its net metering program until year-end, when it will approve a net metering successor tariff that is under development. In addition, in Arizona, SRP’s motion to dismiss our lawsuit was denied when the Arizona federal court agreed with our legal theory that SRP cannot violate the antitrust laws with impunity, and must answer in court for the unfair and anticompetitive penalties it is imposing on solar customers. Finally, in Hawaii, which is a unique case given its double-digit penetration of rooftop solar and high electricity prices, the Hawaii PUC issued a decision that effectively ended net metering for new customers. This was a rare setback for distributed solar that we believe violated due process requirements and subsequently was challenged in Hawaii state court. While disappointing, the Hawaii PUC decision will provide a solar tariff with rapid interconnection approvals that encourages a solar plus storage solution, and we expect to develop a competitive response.
Most important are the NEM 2.0 policy discussions in California, where we continue to expect a favorable outcome for distributed solar. Our view is based not only on the fact that net metering is an effective and successful policy because rooftop solar’s benefits outweigh its revenue shift impact, but also because state law (AB 327) requires that the uncapped net metering successor tariff developed by the California PUC “ensure[s] customer-sited renewable distributed generation continues to grow sustainably.” In turn, while we believe the proposals submitted by California’s three largest investor-owned utilities are overreaching and designed to disrupt distributed solar in the state, we believe the California PUC ultimately will not approve extreme changes that would conflict with the statutory mandate and undermine rooftop solar, one of the state’s fastest growing industries and a major source of job creation across California.
Q3 2015 GAAP Operating Results
-6-
For Q3 2015, our GAAP results were in line with the guidance we provided at the end of last quarter after adjusting for one-time items. GAAP revenue increased 95% year-over-year to the high end of our guidance at $113.9 million, driven by increased installations and high system performance in our seasonally strong Q3. GAAP gross margin was 22% and was impacted by a non-cash impact of $17.8 million due to the MyPower warranty which is recorded at the time of sale. Adjusting for this non-cash adjustment, solar energy system sale gross margin would have been 14% and consolidated gross margin 38%. Total operating expenses of $216.4 million were within the range of our guidance and included $27.3 million of non-cash stock-based compensation and amortization of intangibles. In Q3, Other Expenses were impacted by a $12.3 million non-cash fair value impact for a hedge, which we do not include in our guidance given the unpredictability in forecasting. Excluding the $17.8 million MyPower warranty and the $12.3 million loss on hedges, Non-GAAP EPS loss was ($2.10).
Q4 2015 Guidance
Based on our monthly installation run rate exiting the quarter and the growth in residential capacity we have already experienced in October, we are estimating installations of 280 to 300 MW in the fourth quarter. This would represent year-over-year growth of 58%-69% and would translate into full-year 2015 installations of 878-898 MW. This is below the low end of our prior annual guidance as we are cognizant of the inherent uncertainty in the record amount of commercial installations we have planned in December, particularly in light of potential weather-related disruptions and the holiday season.
For Q4 2015 GAAP revenue guidance, we expect Operating Lease and Solar Energy Systems Incentive Revenue of $70 million – $76 million, up 48% year-over-year at the midpoint, though representing the typical seasonal quarter-over-quarter decline as we head into the fall months. Solar Energy System and Component Sale Revenue is expected to range between $30 million and $32 million.
Operating Lease and Solar Energy Systems Incentive Gross Margin is expected to range between 30% - 32% (or 35% - 37% excluding the impact of approximately $4 million in amortization of intangibles). We expect Operating Expenses of $245 million – $260 million (including between $30 million and $32 million in non-cash amortization of intangibles and stock compensation expense). In turn, Non-GAAP Loss Per Share (before Income (Loss) Attributable to Noncontrolling Interests and Redeemable Noncontrolling Interests)* is expected to range between ($2.60) – ($2.75).

2016 Focus and Guidance
Going forward we are focusing our strategy on cost reductions and cash flow. Though we expect our deployments to grow in 2016 we are not targeting the same growth rates that have gotten us to our current scale going forward. Specifically it is our goal to achieve positive cash flow by 2016 year-end and be in solid shape prior to the planned ITC expiration in 2017. We expect to continue to lead the industry in MW
-7-
Installed with the lowest costs and strong returns, and we expect GAAP operating lease revenues to grow in excess of 70% year-over-year in 2016. In turn, we will be even more selective in the markets and projects we enter into. As such, we are introducing preliminary 2016 guidance of 1.25 GW Installed, representing a healthy year-over-year growth of approximately 41% as compared to the midpoint of our 2015 guidance. We also expect to announce meaningful reductions to our 2017 cost targets by our next earnings call. By continuing to increase our already industry-leading cost advantage, we expect to generate greater cash flow and position ourselves for continued growth that is less susceptible to competitive or regulatory developments than that of any other provider in the category.
To 1 GW and Beyond
This last quarter, we crossed a significant milestone in surpassing 1 GW in annualized installations. That’s over 100 times more than we installed in 2008 when we introduced solar leases and PPAs for the first time, and almost as much residential and commercial solar as was installed in the entire United States in 2011. Representing approximately 160,000 households at our average residential system size of 6 kW, SolarCity now adds the production equivalent of a medium-sized power plant to the grid each year.
We have no plans to stop here. SolarCity currently provides more solar energy systems to Americans than its next several dozen competitors combined. We fully expect that in the coming years we will deliver more solar electricity to customers than any other provider in the world.
We can’t express enough gratitude for the diligence, drive, and dutiful sacrifice of all our employees, their families, our partners, customers, and passionate supporters without which we would simply not be where we are today.
| | |

| | 
|
Lyndon Rive, CEO | | Brad Buss, CFO |
-8-
* Non-GAAP Earnings per Share (EPS) Before Noncontrolling Interests
While GAAP EPS is based upon net income (loss) attributable to common stockholders, we also report non-GAAP EPS based upon net income (loss). The only difference between GAAP EPS and non-GAAP EPS is the sole line item net income (loss) attributable to non-controlling interests and redeemable noncontrolling interests.
Under GAAP accounting, we report net income (loss) attributable to noncontrolling interests and redeemable noncontrolling interests to reflect generally our joint venture fund investors’ allocable share in the results of these joint venture financing funds. Income (loss) attributable to noncontrolling interests and redeemable noncontrolling interests is calculated based generally on the hypothetical liquidation at book value, or HLBV method, which assumes that the joint venture funds are liquidated at the reporting date, even though liquidation may or may not ever occur. Additionally the returns that will be allocated to the investors over the expected terms of the funds may differ significantly from the amounts calculated under the HLBV method. Accordingly, we also report non-GAAP EPS based on earnings before net income (loss) attributable to noncontrolling interests and redeemable noncontrolling interests per share, which we view as a better measure of our operating performance.
According to this definition, non-GAAP earnings before noncontrolling interests and redeemable noncontrolling interests per share was ($2.41).
See below for a reconciliation of GAAP EPS to non-GAAP EPS.
Earnings Conference Call
We will hold a conference call today at 2:00 pm Pacific to discuss our third quarter 2015 financial results and outlook for fourth quarter 2015 and beyond. A live webcast of the call may be accessed over the Internet at the “Events and Presentations” link of the Investor Relations section of our website at http://investors.solarcity.com/events.cfm.
Participants should follow the instructions provided on the website to download and install the necessary audio applications in advance of the call. In addition, the earnings presentation slides will be available on our Investor Relations site by 2:00 pm Pacific. The conference call can be accessed live over the phone by dialing 1-877-407-0784, or for international callers, 1-201-689-8560. A replay will be available two hours after the call and can be accessed by dialing 1-877-870-5176, or for international callers, 1-858-384-5517. The passcode is 13621937. The replay will be available until November 5, 2015.
About SolarCity
SolarCity® (Nasdaq:SCTY) provides clean energy. The company has disrupted the century-old energy industry by providing renewable electricity directly to homeowners, businesses and government organizations for less than they spend on utility bills. SolarCity gives customers control of their energy costs to protect them from rising rates. The company makes solar energy easy by taking care of everything from design and permitting to monitoring and maintenance. SolarCity currently serves 19 states. Visit the company online at www.solarcity.com and follow the company on Facebook & Twitter.
Forward Looking Statements
This shareholder letter contains forward-looking statements that involve risks and uncertainties, including statements regarding SolarCity’s customer and market growth opportunities; SolarCity’s operational growth and expansion, including international expansion plans; financial strategies for cash generation and increasing shareholder value; the deployment and installation of megawatts, including estimated Q4 2015 megawatt deployments and installations; future bookings; our beliefs as to future installation efficiencies; GAAP revenue, gross margin, operating expenses and non-GAAP EPS for Q4 2015; Estimated Nominal Contracted Payments Remaining; forecasted Net Retained Value, Economic Value Creation and Unlevered IRR of Q3 2015 megawatts deployed, including related assumptions; cash flows and PowerCo Available Cash forecast; projections related to decreases in cost per Watt, including Q4 2015 and 2016 sales costs and our projections related to cost reductions associated with the vertical integration of C&I installations; our liquidity and; forecasted access to capital, including assumptions
-9-
related to the terms of future financing (including risk premiums and interest rates), the sufficiency of committed available financing and the terms and frequency of future securities offerings (including securitization offerings); the amount of megawatts that can be deployed based on committed available financing; the success of our product development efforts and customer preferences, including our SMB PACE, Demand Logic and other products; expected future GAAP and non-GAAP operating results; ; our expectations as to future regulatory and policy outcomes affecting our industry and assumptions relating to the foregoing.
Forward-looking statements should not be read as a guarantee of future performance or results, and will not necessarily be accurate indications of the times at, or by, which such performance or results will be achieved, if at all. Forward-looking statements are subject to risks and uncertainties that could cause actual performance or results to differ materially from those expressed in or suggested by the forward-looking statements. In order to meet our projections, we will need to expand our workforce and increase our installation efficiency. Additional key risks and uncertainties include the effect of electric utility industry regulations, net metering and related policies, the availability and amount of rebates, tax credits and other financial incentives, the level of demand for our solar energy systems, the availability of a sufficient, timely, and cost-effective supply of solar panels and balance of system components, our ability to successfully integrate acquired businesses, operations and personnel; our ability to achieve manufacturing economies of scale and associated cost reductions, our expectations regarding the Riverbend agreement and the development and construction of the Riverbend facility, including expected capital and operating expenses and the performance of our manufacturing operations; the effects of future tariffs and other trade barriers, changes in federal tax treatment, the availability and amount of financing from fund investors, the retail price of utility-generated electricity or the availability of alternative energy sources, risks associated with SolarCity’s rapid growth, risks associated with international expansion, the success of our product development efforts and customer preferences, risks that consumers who have executed energy contracts included in reported nominal contracted payments remaining and backlog may seek to cancel those contracts, assumptions as to retained value under energy contracts and contract renewal rates and terms, assumptions as to leveraged retained value and MyPower retained value, including applicable net present values, performance-based incentives, and other rebates, credits and expenses, SolarCity’s limited operating history, particularly as a new public company, changes in strategic planning decisions by management or reallocation of internal resources, completion of preparation of financial statements and general market, political, economic and business conditions. You should read the section entitled “Risk Factors” in our most recent Quarterly Report on Form 10-Q and subsequent Current Reports on Form 8-K, which have been filed with the Securities and Exchange Commission, which identify certain of these and additional risks and uncertainties. We do not undertake any obligation to publicly update or revise any forward-looking statement, whether as a result of new information, future developments or otherwise, except as otherwise required by law.
-10-
SolarCity Corporation
Consolidated Statements of Operations
(In Thousands, Except per Share Values)
| | Three Months Ended September 30, | |
| | 2014 | | | 2015 | |
Revenue: | | | | | | | | |
Operating leases and solar energy systems incentives | | $ | 52,178 | | | $ | 85,059 | |
Solar energy systems and components sales | | | 6,165 | | | | 28,798 | |
Total revenue | | | 58,343 | | | | 113,857 | |
Cost of revenue: | | | | | | | | |
Operating leases and solar energy systems incentives | | | 25,728 | | | | 46,015 | |
Solar energy systems and components sales | | | 6,640 | | | | 42,554 | |
Total cost of revenue | | | 32,368 | | | | 88,569 | |
Gross profit | | | 25,975 | | | | 25,288 | |
Operating expenses: | | | | | | | | |
Sales and marketing | | | 56,472 | | | | 129,284 | |
General and administrative | | | 39,608 | | | | 69,423 | |
Research and development | | | 4,235 | | | | 17,652 | |
Total operating expenses | | | 100,315 | | | | 216,359 | |
Loss from operations | | | (74,340 | ) | | | (191,071 | ) |
Interest expense - net | | | 16,321 | | | | 25,862 | |
Other expense - net | | | 2,961 | | | | 16,851 | |
Loss before income taxes | | | (93,622 | ) | | | (233,784 | ) |
Income tax benefit (provision) | | | 23,506 | | | | (482 | ) |
Net loss | | | (70,116 | ) | | | (234,266 | ) |
Net loss attributable to noncontrolling interests and redeemable noncontrolling interests | | | (89,352 | ) | | | (215,193 | ) |
Net loss attributable to stockholders | | $ | 19,236 | | | $ | (19,073 | ) |
Net loss attributable to common stockholders | | | | | | | | |
Basic | | $ | 19,236 | | | $ | (19,073 | ) |
Diluted | | $ | 19,236 | | | $ | (19,073 | ) |
Net loss per share attributable to common stockholders | | | | | | | | |
Basic | | $ | 0.21 | | | $ | (0.20 | ) |
Diluted | | $ | 0.19 | | | $ | (0.20 | ) |
Weighted-average shares used to compute net loss per share attributable to common stockholders | | | | | | | | |
Basic | | | 93,324 | | | | 97,385 | |
Diluted | | | 99,380 | | | | 97,385 | |
-11-
SolarCity Corporation
Consolidated Balance Sheets
(In Thousands)
| | December 31, | | | September 30, | |
| | 2014 | | | 2015 | |
Assets | | | | | | | | |
Current assets: | | | | | | | | |
Cash and cash equivalents | | $ | 504,383 | | | $ | 372,750 | |
Short-term investments | | | 138,311 | | | | 45,616 | |
Restricted cash | | | 20,875 | | | | 20,312 | |
Accounts receivable - net | | | 22,708 | | | | 38,572 | |
Rebates receivable - net | | | 30,021 | | | | 15,044 | |
Inventories | | | 217,223 | | | | 309,190 | |
Deferred income tax asset | | | 13,149 | | | | 30,500 | |
Prepaid expenses and other current assets | | | 55,729 | | | | 103,624 | |
Total current assets | | | 1,002,399 | | | | 935,608 | |
Solar energy systems, leased and to be leased - net | | | 2,796,796 | | | | 3,869,719 | |
Property, plant and equipment - net | | | 75,464 | | | | 243,843 | |
Build-to-suit lease asset under construction | | | 26,450 | | | | 238,050 | |
Goodwill and intangible assets - net | | | 539,557 | | | | 527,418 | |
MyPower customer notes receivable, net of current portion | | | 34,544 | | | | 362,840 | |
MyPower deferred costs | | | 13,147 | | | | 162,810 | |
Other assets | | | 97,854 | | | | 172,055 | |
Total assets | | $ | 4,586,211 | | | $ | 6,512,343 | |
-12-
SolarCity Corporation
Consolidated Balance Sheets
(In Thousands)
(Continued)
| | December 31, | | | September 30, | |
| | 2014 | | | 2015 | |
Liabilities and equity | | | | | | | | |
Current liabilities: | | | | | | | | |
Accounts payable | | $ | 237,809 | | | $ | 296,196 | |
Distributions payable to noncontrolling interests and redeemable noncontrolling interests | | | 8,552 | | | | 12,336 | |
Current portion of deferred U.S. Treasury grant income | | | 15,330 | | | | 15,336 | |
Accrued and other current liabilities | | | 152,408 | | | | 242,434 | |
Customer deposits | | | 10,560 | | | | 5,095 | |
Current portion of deferred revenue | | | 86,238 | | | | 100,381 | |
Current portion of long-term debt | | | 11,781 | | | | 44,471 | |
Current portion of solar bonds | | | 820 | | | | 10,797 | |
Current portion of solar bonds issued to related parties | | | 330 | | | | 165,340 | |
Current portion of solar asset-backed notes | | | 13,574 | | | | 14,259 | |
Current portion of financing obligation | | | 29,689 | | | | 31,690 | |
Total current liabilities | | | 567,091 | | | | 938,335 | |
Deferred revenue, net of current portion | | | 557,408 | | | | 885,726 | |
Long-term debt, net of current portion | | | 287,621 | | | | 833,154 | |
Solar bonds, net of current portion | | | 2,793 | | | | 34,533 | |
Convertible senior notes | | | 796,000 | | | | 796,000 | |
Solar asset-backed notes, net of current portion | | | 304,393 | | | | 410,779 | |
Long-term deferred tax liability | | | 13,194 | | | | 32,298 | |
Financing obligation, net of current portion | | | 73,379 | | | | 64,211 | |
Deferred U.S. Treasury grant income, net of current portion | | | 397,486 | | | | 386,121 | |
Build-to-suit lease liability | | | 26,450 | | | | 238,050 | |
Other liabilities and deferred credits | | | 218,024 | | | | 271,594 | |
Total liabilities | | | 3,243,839 | | | | 4,890,801 | |
| | | | | | | | |
Redeemable noncontrolling interests in subsidiaries | | | 186,788 | | | | 313,302 | |
Stockholders' equity: | | | | | | | | |
Common stock | | | 10 | | | | 10 | |
Additional paid-in capital | | | 1,003,992 | | | | 1,136,121 | |
Accumulated deficit | | | (258,360 | ) | | | (321,318 | ) |
Total stockholders' equity | | | 745,642 | | | | 814,813 | |
Noncontrolling interests in subsidiaries | | | 409,942 | | | | 493,427 | |
Total equity | | | 1,155,584 | | | | 1,308,240 | |
Total liabilities and equity | | $ | 4,586,211 | | | $ | 6,512,343 | |
-13-
SolarCity Corporation
Consolidated Statements of Cash Flows
(In Thousands)
| Three Months Ended September 30, | |
| 2014 | | | 2015 | |
Operating activities: | | | | | | | |
Net loss | $ | (70,116 | ) | | $ | (234,266 | ) |
Adjustments to reconcile net loss to net cash used in operating activities: | | | | | | | |
Depreciation and amortization | | 26,620 | | | | 43,671 | |
Non cash interest and other expense | | 2,800 | | | | 5,021 | |
Stock-based compensation, net of amounts capitalized | | 16,769 | | | | 24,878 | |
Loss on extinguishment of long-term debt | | 1,504 | | | | 1,093 | |
Deferred income taxes | | (23,703 | ) | | | (108 | ) |
Reduction in lease pass-through financing obligation | | (13,366 | ) | | | (12,982 | ) |
Loss on disposal of property, plant and equipment and construction in progress | | — | | | | (37 | ) |
Changes in operating assets and liabilities: | | | | | | | |
Restricted cash | | 1,044 | | | | (25,313 | ) |
Accounts receivable | | (21 | ) | | | (4,098 | ) |
Rebates receivable | | (1,494 | ) | | | 5,339 | |
Inventories | | (33,827 | ) | | | (29,295 | ) |
Prepaid expenses and other current assets | | 1,546 | | | | (26,539 | ) |
MyPower deferred costs | | — | | | | (56,064 | ) |
Other assets | | (6,891 | ) | | | 6,118 | |
Accounts payable | | 60,362 | | | | 16,908 | |
Accrued and other liabilities | | (9,771 | ) | | | 69,339 | |
Customer deposits | | 1,101 | | | | (186 | ) |
Deferred revenue | | 24,905 | | | | 2,120 | |
Net cash used in operating activities | | (22,538 | ) | | | (214,401 | ) |
Investing activities: | | | | | | | |
Payments for the cost of solar energy systems, leased and to be leased | | (343,417 | ) | | | (469,850 | ) |
Purchase of property, plant and equipment | | (5,810 | ) | | | (45,719 | ) |
Purchases of short-term investments | | (46,543 | ) | | | - | |
Proceeds from sales and maturities of short-term investments | | 9,600 | | | | 21,918 | |
Acquisition of business, net of cash acquired | | 1,874 | | | | (9,509 | ) |
Investment in promissory notes receivable and other investments | | (4,750 | ) | | | (1,189 | ) |
Net cash used in investing activities | | (389,046 | ) | | | (504,349 | ) |
-14-
SolarCity Corporation
Consolidated Statements of Cash Flows
(In Thousands)
(Continued)
| Three Months Ended September 30, | |
| 2014 | | | 2015 | |
Financing activities: | | | | | | | |
Investment fund financings, bank and other borrowings: | | | | | | | |
Borrowings under long-term debt | | 57,155 | | | | 327,015 | |
Repayments of long-term debt | | (194,437 | ) | | | (77,363 | ) |
Proceeds from issuance of solar bonds | | — | | | | 9,100 | |
Proceeds from issuance of solar asset-backed notes | | 196,116 | | | | 119,790 | |
Repayments of borrowings under solar asset-backed notes | | (1,775 | ) | | | (6,504 | ) |
Payment of deferred purchase consideration | | — | | | | (1,249 | ) |
Net proceeds from financing obligation | | 11,123 | | | | 5,804 | |
Repayment of capital lease obligations | | (771 | ) | | | (1,866 | ) |
Proceeds from investment by noncontrolling interests and redeemable noncontrolling interests in subsidiaries | | 211,965 | | | | 325,982 | |
Distributions paid to noncontrolling interests and redeemable noncontrolling interests in subsidiaries | | (16,721 | ) | | | (33,579 | ) |
Proceeds from U.S. Treasury grants | | (18 | ) | | | — | |
Net cash provided by financing activities before equity issuances | | 262,637 | | | | 667,130 | |
Equity and convertible notes issuances: | | | | | | | |
Proceeds from issuance of convertible notes | | 488,713 | | | | — | |
Purchased of capped call options | | (57,600 | ) | | | — | |
Proceeds from exercise of stock options | | 9,089 | | | | 2,950 | |
Net cash provided by equity issuances | | 440,202 | | | | 2,950 | |
Net cash provided by financing activities | | 702,839 | | | | 670,080 | |
Net decrease in cash and cash equivalents | | 291,255 | | | | (48,670 | ) |
Cash and cash equivalents, beginning of period | | 405,261 | | | | 421,420 | |
Cash and cash equivalents, end of period | $ | 696,516 | | | $ | 372,750 | |
-15-
Operating Activity Metrics:
| | | | | | Increase | | | | | | | Cumulative | |
| | Q3 2014 | | | Q2 2015 | | | Q3 2015 | | | as of 9/30/2015 | |
MW deployed | | | 137 | | | | 177 | | | | 205 | | | | 1,594 | |
MW installed | | | 137 | | | | 189 | | | | 256 | | | | 1,674 | |
MW installed - residential | | | 120 | | | | 168 | | | | 203 | | | | 1,299 | |
MW installed - commercial | | | 17 | | | | 21 | | | | 53 | | | | 375 | |
Customers | | | 27,305 | | | | 44,900 | | | | 35,535 | | | | 298,030 | |
Energy contracts | | | 27,116 | | | | 45,165 | | | | 36,401 | | | | 288,992 | |
Estimated nominal contracted payments remaining ($M) | | $ | 803 | | | $ | 1,566 | | | $ | 1,184 | | | $ | 8,856 | |
Stock-Based Compensation Expense:
| | Three Months Ended September 30, | |
in thousands | | 2014 | | | 2015 | |
Cost of revenue | | $ | 302 | | | $ | 489 | |
Sales and marketing | | $ | 3,968 | | | $ | 7,048 | |
General and administrative | | $ | 10,725 | | | $ | 13,305 | |
Research and development | | $ | 1,756 | | | $ | 3,866 | |
Reconciliation from GAAP Operating Expenses to Non-GAAP Operating Expenses in Q3 2015:
in thousands | | | |
GAAP operating expenses | $ | 216,359 | |
- Stock-based compensation expense | | (24,219 | ) |
- Amortization of intangibles | | (3,105 | ) |
= Non-GAAP operating expenses | $ | 189,035 | |
Reconciliation from GAAP EPS to Non-GAAP EPS in Q3 2015:
| | | | | | GAAP Net Loss | | | | | |
| | Reconciliation from | | | Attributable to Noncontrolling | | | | | |
| | GAAP EPS | | | Interests and Redeemable | | | Non-GAAP | |
in thousands except per share amounts | | to Non-GAAP EPS | | | Noncontrolling Interests | | | Net Loss | |
Net loss | | $ | (19,073 | ) | | $ | (215,193 | ) | | $ | (234,266 | ) |
/ Weighted-average common shares outstanding | | | 97,385 | | | | 97,385 | | | | 97,385 | |
= Net loss per share | | $ | (0.20 | ) | | $ | (2.21 | ) | | $ | (2.41 | ) |
-16-
Non-GAAP EPS Adjusted for Items not Included in Guidance:
in thousands except per share amounts | | | | | | | | |
Non-GAAP net loss | | | | | | $ | (234,266 | ) |
Items not included in guidance due to unpredictability: | | | | | | | | |
- Accelerated MyPower warranty expense | | | | | | | 17,755 | |
- Changes in fair value of interest rate swaps | | | | | | | 12,253 | |
Adjusted non-GAAP net loss | | | | | | $ | (204,258 | ) |
/ Weighted-average common shares outstanding | | | | | | | 97,385 | |
= Adjusted Non-GAAP net loss per share | | | | | | $ | (2.10 | ) |
Reconciliation from GAAP Operating Lease Revenue to PowerCo Available Cash in Q3 2015:
| | Quarter Ended | |
in thousands | | December 31, 2014 | | | March 31, 2015 | | | June 30, 2015 | | | September 30, 2015 | |
Revenues: | | | | | | | | | | | | | | | | |
Operating leases and solar energy systems incentives | | $ | 49,205 | | | $ | 54,771 | | | $ | 78,282 | | | $ | 85,373 | |
MyPower and other long term contracts | | | 233 | | | | 1,372 | | | | 8,509 | | | | 9,499 | |
Total revenues associated with long term contracts | | | 49,438 | | | | 56,143 | | | | 86,791 | | | | 94,872 | |
Cost of revenues and operating expenses | | | 23,660 | | | | 27,983 | | | | 34,854 | | | | 57,296 | |
Interest and other expense, net | | | 13,617 | | | | 11,768 | | | | 13,218 | | | | 28,889 | |
| | | 12,161 | | | | 16,392 | | | | 38,719 | | | | 8,687 | |
Working capital changes and other adjustments: | | | | | | | | | | | | | | | | |
Depreciation and amortization, other non cash items and changes in customer and other receivables, accruals and other deferred credits associated with long term contracts | | | 20,245 | | | | 28,212 | | | | 10,224 | | | | 47,643 | |
Periodic receipts from investors under lease pass-through fund arrangements | | | 14,439 | | | | 4,780 | | | | 10,994 | | | | 2,035 | |
Net cash provided by operating activities of long term contractual arrangements prior to debt service | | | 46,845 | | | | 49,384 | | | | 59,937 | | | | 58,365 | |
| | | | | | | | | | | | | | | | |
Less: | | | | | | | | | | | | | | | | |
Distributions to noncontrolling interests from the operations of the PowerCo | | | (9,871 | ) | | | (12,091 | ) | | | (13,666 | ) | | | (23,086 | ) |
Servicing of principal on debt collateralized by PowerCo assets | | | (5,600 | ) | | | — | | | | — | | | | — | |
Servicing of principal on solar asset backed notes collateralized by PowerCo assets | | | (1,969 | ) | | | (5,817 | ) | | | (1,539 | ) | | | (6,503 | ) |
Servicing of interest on debt collateralized by PowerCo assets | | | (2,468 | ) | | | (6,792 | ) | | | (3,566 | ) | | | (9,378 | ) |
PowerCo Available Cash for the period | | $ | 26,937 | | | $ | 24,684 | | | $ | 41,166 | | | $ | 19,398 | |
-17-
Retained Value Sensitivities:
The following tables provide quantitative sensitivity analyses of our estimates of Retained Value Under Energy Contract, Retained Value Renewal, Retained Value, and Retained Value per Watt as of September 30, 2015 on our and alternate assumptions.
| | | | Gross Retained Value Forecast ($M) | | | | | | | Gross Retained Value Forecast ($/Watt) | |
| | | | | | | | | | | | | | | | | | | | | | | | | | | | | | |
| | | | Discount Rate | | | | | | | Discount Rate | |
| | | | | 4% | | | | 6% | | | | 8% | | | | | | | | 4% | | | | 6% | | | | 8% | |
| | 70 | % | | 5,169 | | | | 4,063 | | | | 3,281 | | | | | 70 | % | 2.11 | | | 1.66 | | | 1.34 | |
Renewal | | 80 | % | | 5,409 | | | | 4,220 | | | | 3,388 | | | Renewal | | 80 | % | 2.21 | | | 1.72 | | | 1.38 | |
Rate | | 90 | % | | 5,649 | | | | 4,373 | | | | 3,484 | | | Rate | | 90 | % | | 2.30 | | | | 1.78 | | | 1.42 | |
| | 100 | % | | 5,889 | | | | 4,528 | | | | 3,856 | | | | | 100 | % | | 2.40 | | | 1.85 | | | 1.46 | |
| | | | | | | | | | | | | | | | | | | | | | | | | | | | | | |
| | | | | | | | | | | | | | | | | | | | | | | | | | | | | | |
| | | | | | | | | | | | | | | | | | | | | | | | | | | | | | |
| | | | Retained Value Under Contract ($M) | | | | | | | PPA/Lease Renewal Gross Retained Value ($M) | |
| | | | (PPA/Lease Energy Contract Gross Retained Value and MyPower Gross Retained Value) | | | | | | | | |
| | | | | | | | | | | | | | | | | | | | | | | | | | | | | | |
| | | | Discount Rate | | | | | | | Discount Rate | |
| | | | | 4% | | | | 6% | | | | 8% | | | | | | | | 4% | | | | 6% | | | | 8% | |
| | 70 | % | | 4,000 | | | | 3,316 | | | | 2,796 | | | | | 70 | % | | 1,169 | | | 747 | | | 485 | |
Renewal | | 80 | % | | 4,000 | | | | 3,316 | | | | 2,796 | | | Renewal | | 80 | % | | 1,409 | | | 904 | | | 592 | |
Rate | | 90 | % | | 4,000 | | | | 3,316 | | | | 2,796 | | | Rate | | 90 | % | | 1,649 | | | | 1,057 | | | 688 | |
| | 100 | % | | 4,000 | | | | 3,316 | | | | 2,796 | | | | | 100 | % | | 1,889 | | | | 1,212 | | | 790 | |
-18-
Definitions:
“Backlog” represents the aggregate megawatt capacity of solar energy systems not yet deployed as of the date specified pursuant to Energy Contracts and contracts for solar energy system direct sales executed as of such date.
“Customers” includes all residential, commercial and government buildings where we have installed or contracted to install a solar energy system, or performed or contracted to perform an energy efficiency evaluation or other energy efficiency services.
“Energy Contracts” includes all residential, commercial and government leases and power purchase agreements and consumer loan agreements pursuant to which consumers use or will use energy generated by a solar energy system that we have installed or contracted to install. For landlord-tenant structures in which we contract with the landlord or development company, we include each residence as an individual contract. For commercial customers with multiple locations, each location is deemed a contract if we maintain a separate contract for that location.
“Economic Value Creation” forecast represents our estimate of the 30-year net present value at a discount rate of 6% of the incremental PowerCo Project Available Cash Forecast from the MW Deployed during the applicable period under Energy Contracts. All estimates are before financing transaction costs. “PowerCo Available Cash Forecast” represents (i) Gross Project Cash Flow Forecast, less the sum of (ii) Year One Net Project Investment, (iii) Tax Equity Lease/PPA Distributions, and (iv) debt service on our Forecasted Non-Recourse Debt.
“Year One Net Project Investment” represents our estimate of the required net cash investment of the MW Deployed during the applicable period under Energy Contracts. It is based on (a) the total implied Year One upfront cost of the MW Deployed during the applicable period under Energy Contracts based on our total Cost per Watt reported in the applicable period, and is net of the sum of (b) upfront state rebates and customer prepayments, (c) total expected investment from our tax equity fund investors in the associated lease and PPA Energy Contracts based on agreements already in place, and (d) Forecasted Non-Recourse Debt.
“Gross Project Cash Flow Forecast” represents our estimate of the total project cash flows before financing forecast from the MW Deployed during the applicable period under Energy Contracts over the 30 year expected lives of the systems. This includes (a) cash payments forecast from our customers over the remaining term of such Energy Contracts, (b) estimated performance-based incentives allocated to us over the life of the Energy Contract, and (c) the associated solar renewable energy certificates (SRECs) allocated to us that have been sold under contract (typically representing 5 years of a total potential term of 15 years), and are net of (d) estimated operations and maintenance, insurance, administrative and inverter replacement costs. Operations and maintenance, insurance, and administrative costs reflect our operating expenses in our funds, or are estimated at $0.021 per Watt and assumed to grow at a 2.5% inflation rate per year, and inverter replacement unit costs are estimated to decline at a (2.5%) rate per year. Energy production is estimated to degrade at 0.5% per year. For our MyPower Energy Contracts, we use the expected cash flows over the full term of the 30-year contract, and for lease and PPA Energy Contracts with terms less than 30 years, we assume the contracts are renewed at a contract price equal to 90% of the contractual price in effect at expiration of the initial term through the remainder of the expected 30-year system life.
“Tax Equity Lease/PPA Distributions” are based on the terms of the agreements we have in place with our tax equity investment partners for the MW Deployed in the applicable period under lease and PPA Energy Contracts. We do not use tax equity investment for our MyPower product. For tax equity investment in our lease and PPA Energy Contracts, our investment partners share in a portion of the Gross Project Cash Flow received over the term of the agreement. Our estimate is not inclusive of any potential buy-out of our tax equity partners’ interests in the project after their minimum rate of return is achieved.
“PowerCo Unlevered Project Cash Flow” forecast represents Gross Project Cash Flow Forecast less Tax Equity Lease/PPA Distributions and is before the servicing of Forecasted Non-Recourse Debt.
“Forecasted Non-Recourse Debt” is estimated based on the forecasted terms of the long-term non-recourse debt we expect to issue collateralized by the MW Deployed during the applicable period under Energy Contracts. We forecast a 73% advance rate on the contracted Gross Project Cash Flow Forecast for our lease and PPA Energy Contracts using a 6% discount rate and a 75% advance rate on the contracted Gross Project Cash Flow Forecast for our MyPower loans using a 6% discount rate based on the terms of the current outstanding facility we use to fund that product. We further assume a 4.5% interest rate, implying principal amortization over ~ 20 years.
“Financing Receivables” represents our forecast of the additional non-recourse debt financing we estimate we have the capacity to issue through collateralizing our Energy Contracts available for non-recourse debt financing. For our MyPower Energy Contracts, we assume total leverage of $2.65 per Watt based on our existing outstanding facility to fund this product. For our lease and PPA Energy Contracts, we assume total leverage of $1.05 per Watt for (as compared to our three prior solar asset-backed loan issuances at $1.24 per Watt, $1.48 per Watt, and $1.71 per Watt).
“Gross Retained Value” forecast represents our estimate of the 30-year net present value at a discount rate of 6% of the unlevered cash flows remaining from all of our Energy Contracts after tax equity distributions but before any additional project or other debt issued to develop and install the systems. It represents the sum of (1) “PPA/Lease Energy Contract Gross Retained Value,” (2) “PPA/Lease Renewal Gross Retained Value,” and (3) “MyPower Gross Retained Value.”
“PPA/Lease Energy Contract Gross Retained Value” forecast represents our estimate of the net present value at a discount rate of 6% of the unlevered net cash flows forecast from all of our lease and PPA Energy Contracts (excluding MyPower consumer loan energy contracts) over the remaining contracted term. This includes for each lease and PPA Energy Contract (a) the Nominal Contracted Payments Remaining, (b) estimated performance-based incentives allocated to us over the term of the Energy Contract, and (c) the associated SRECs allocated to us that have been sold under contract (typically representing 5 years of a total potential term of 15 years), and is net of (d) amounts we are obligated to distribute to our fund investors, (e) upfront rebates, (f) depreciation, and (g) estimated operations and maintenance, insurance, administrative and inverter replacement costs. Operations and maintenance, insurance, and administrative costs reflect our operating expenses in our funds, or are estimated at $0.021 per Watt and assumed to grow at a 2.5% inflation rate per year, and inverter replacement unit costs are estimated to decline at a (2.5%) rate per year. Energy production is estimated to degrade at 0.5% per year. This metric includes all lease and PPA Energy Contracts for solar energy systems deployed and in Backlog.
“PPA/Lease Renewal Gross Retained Value” forecast represents our estimate of the net present value at a discount rate of 6% of the additional customer cash payments we would receive upon renewal of all lease and PPA Energy Contracts (excluding MyPower consumer loan agreements) through a total term of 30 years at a price equal to 90% of the contractual price in effect at expiration of the initial term, escalating at the same rate per year as set in the original lease and PPA Energy Contracts, and is net of estimated operations and maintenance, insurance, administrative and inverter replacement costs. Operations and maintenance, insurance, and administrative costs and energy production degradation rates are based on the same assumptions as in PPA/Lease Energy Contract Gross Retained Value. This metric includes all lease and PPA Energy Contracts for solar energy systems deployed and in Backlog. We assume renewal due to
-19-
both (1) a longer life expectancy of the equipment used in our solar energy systems (typically 30 years or more) vs. our lease and PPA contract terms (typically 20 years) and (2) our assumption utility retail rates continue to increase at their historic pace and our expectation that the price of our energy contracts will continue to represent an economic incentive for our customers to renew their contracts.
“MyPower Gross Retained Value” forecast represents our estimate of the net present value at a discount rate of 6% the unlevered net cash flows forecast from all of our MyPower consumer loan Energy Contracts (excluding lease and PPA Energy Contracts) over the remaining contracted term. This includes for each of our MyPower consumer loan agreements (a) the Nominal Contracted Payments Remaining, (b) estimated performance-based incentives allocated to us over the life of the Energy Contract, (c) and the associated SRECs allocated to us that have been sold under contract (typically representing 5 years of a total potential term of 15 years), and is net of (d) upfront rebates, (e) depreciation, and (f) estimated operations and maintenance, insurance, administrative and inverter replacement costs. Operations and maintenance, insurance, and administrative costs and energy production degradation rates are based on the same assumptions as in PPA/Lease Gross Retained Value. This metric includes all MyPower consumer loan Energy Contracts for solar energy systems deployed and in Backlog.
“Gross Retained Value per Watt” is computed by dividing Gross Retained Value as of such date by the sum of total MWs deployed under Energy Contracts as of such date plus MWs booked under Energy Contracts as of such date but not yet deployed
“MW” or “megawatts” represents the DC nameplate megawatt production capacity.
“MW Booked” represents the aggregate megawatt production capacity of solar energy systems pursuant to customer contracts signed (with no contingencies remaining) during the applicable period net of cancellations during the applicable period. This metric includes solar energy systems booked under Energy Contracts as well as for solar energy system direct sales.
“MW Deployed” represents the megawatt production capacity of solar energy systems that have had all required building department inspections completed during the applicable period. This metric includes solar energy systems deployed under Energy Contracts as well as for solar energy system direct sales.
“MW Installed” represents the megawatt production capacity of solar energy systems, for which (i) all solar panels, inverters, mounting and racking hardware, and system wiring have been installed, (ii) the system inverter is connected and a successful DC string test has been completed confirming the production capacity of the system, and (iii) the system is capable of being grid connected (including pending a utility disconnect procedure), the latest of which is completed during the applicable period. This metric includes solar energy systems deployed under Energy Contracts as well as for solar energy system direct sales. In each case in-period completion of the above criteria may be demonstrated by written verification by each of the Chief Financial Officer and the Chief Operating Officer (which may include written sub-certifications).
“Net Retained Value” forecast represents Gross Retained Value less (i) net debt outstanding as of the applicable period end and (ii) forecasted net cash costs to deploy backlog as of such date. “Net debt” represents the aggregate amounts outstanding under all non-convertible debt facilities, including all solar asset-backed loans, aggregation and MyPower facilities, Solar Bonds, other corporate debt, and our revolving credit facility as of the applicable period end, net of available cash and cash equivalents as of the applicable period end, and excludes outstanding convertible notes which we assume will be settled in equity. “Forecasted Net Cash Costs to Deploy Backlog” represents our estimate of the cash required to complete deployment of systems under Energy Contracts in backlog as of the applicable period end; it assumes the installation cost of the most recent period net of the expected tax equity investment from those deployments and no cancellations, and is net of the amount outstanding under our revolving credit facility as of the applicable period end, which we have assumed for this purpose to have been drawn down to fund initial sales costs and working capital to develop our backlog to date. This excludes incremental G&A and any potential future sales costs related to such MW.
“Nominal Contracted Payments Remaining” represents our estimate of the sum of cash payments that are customers are obligated to pay us under our Energy Contracts over the remaining term of such contracts. This metric includes Energy Contracts for solar energy systems deployed and in Backlog. As an example, if a customer is 2 years into her 20 year contract, then 18 years of contract payments remain. As an additional example, if a customer chose to pre-pay her Energy Contract, then it is included in estimated Nominal Contracted Payments Remaining only while it is in Backlog as the pre-payment has not been received. Payments for direct sales are not included.
“PowerCo Available Cash” represents the net cash flows associated solely with our Power Business, which generates a predictable long-term cash flow stream from our Energy Contracts and the underlying solar energy systems that have cumulatively been deployed through the applicable period. It excludes the net cash flows associated with our Development Business, which is dedicated to investing in and financing new solar energy systems to grow our Power Business, and thus excludes (a) installation costs, (b) sales costs, and (c) G&A costs incurred through the applicable period. PowerCo Available Cash represents our core cash flow generation assuming no additional development of new customer installations, though if PowerCo were actually to separate from DevCo it would likely retain some portion of the G&A costs. PowerCo Available Cash is calculated as (1) total cash payments from all Energy Contracts installed through the applicable period, including PBIs and SRECs less the sum of (2) operations and maintenance, insurance, administrative and inverter replacement cash costs, (3) tax equity cash distributions, and (4) interest and principal repayment debt service on all non-convertible debt including solar asset-backed loans, aggregation facilities, revolving credit facilities, and Solar Bonds.
“Undeployed Tax Equity Financing Capacity” represents a forecast of the amount of MW that can be deployed based on committed available tax equity financing for Energy Contracts.
“Unlevered IRR” represents our forecast of the internal rate of return (IRR) we expect to receive on our Unlevered Year One Investment for MW Deployed during the applicable period under Energy Contracts based on PowerCo Unlevered Project Cash Flow, and “Unlevered Project IRR” represents our forecast of the IRR we expect to receive on our investment solely in installation and sales costs yet excluding G&A expenses. “Unlevered Year One Investment” represents Year One Net Project Investment, less total expected investment from our tax equity fund investors in our lease and PPA Energy Contracts.
-20-
| | |
Investor Contact | Aaron Chew
investors@solarcity.com 650-963-5920 | |
-21-