 Investor Presentation October 2015 Financial Information as of June 30, 2015 unless otherwise noted First Guaranty Bancshares, Inc. Free Writing Prospectus Filed Pursuant to Rule 433 Registration Statement No. 333-199602 |
 Offering Disclosures 1 This presentation has been prepared by First Guaranty Bancshares, Inc. (the “Company”) solely for informational purposes based on its own information, as well as information from public sources. This presentation has been prepared to assist interested parties in making their own evaluation of the Company and does not purport to contain all of the information that may be relevant. In all cases, interested parties should conduct their own investigation and analysis of the Company. This presentation is not an offer to sell securities, nor is it a solicitation of an offer to buy securities in any locality, state, country or other jurisdiction where such distribution, publication, availability or use would be contrary to law or regulation or which would require any registration or licensing within such jurisdiction. Neither the Securities and Exchange Commission (the “SEC”) nor any other regulatory body has approved or disapproved of the securities of the Company or passed upon the accuracy or adequacy of this presentation. Any representation to the contrary is a criminal offense. Except as otherwise indicated, this presentation speaks as of the date hereof. The delivery of this presentation shall not, under any circumstances, create any implication there has been no change in the affairs of the Company after the date hereof. This presentation includes industry and market data that we obtained from periodic industry publications, third-party studies and surveys. Industry publications and surveys generally state that the information contained therein has been obtained from sources believed to be reliable. Although we believe the industry and market data to be reliable as of the date of this presentation, this information could prove to be inaccurate. Industry and market data could be wrong because of the method by which sources obtained their data and because information cannot always be verified with complete certainty due to the limits on the availability and reliability of raw data, the voluntary nature of the data gathering process and other limitations and uncertainties. In addition, we do not know all of the assumptions regarding general economic conditions or growth that were used in preparing the forecasts from the sources relied upon or cited herein. This presentation contains financial information determined by methods other than in accordance with accounting principles generally accepted in the United States of America (“GAAP”). Management uses these “non-GAAP” measures in its analysis of our performance. Management believes that these non-GAAP financial measures allows for better comparability with prior periods, as well as with peers in the industry who provide a similar presentation, and provide a greater understanding of our ongoing operations. These disclosures should not be viewed as a substitute for operating results determined in accordance with GAAP, nor are they necessarily comparable to non- GAAP performance measures that may be presented by other companies. A reconciliation of the non-GAAP measures used in this presentation to the most directly comparable GAAP measures is provided in the Appendix to this presentation. The Company has filed a registration statement (including a prospectus) with the SEC for the offering to which this communication relates. Before you invest, you should read the prospectus in that registration statement and other documents the Company has filed with the SEC for more complete information about the Company and this offering. You may get these documents for free by visiting EDGAR on the SEC website at www.sec.gov. Alternatively, the Company, any underwriter or any dealer participating in the offering will arrange to send you the prospectus if you request it by calling Sandler O’Neill + Partners, L.P. toll-free 1- 866-805-4128 or by emailing syndicate@sandleroneill.com. |
 Forward Looking Statements 2 These slides and the accompanying oral presentation contain forward-looking statements, which can be identified by the use of words such as “estimate,” “project,” “believe,” “intend,” “anticipate,” “assume,” “plan,” “seek,” “expect,” “will,” “may,” “should,” “indicate,” “would,” “believe,” “contemplate,” “continue,” “target” and words of similar meaning. These forward-looking statements include, but are not limited to: – statements of our goals, intentions and expectations; – statements regarding our business plans, prospects, growth and operating strategies; – statements regarding the asset quality of our loan and investment portfolios; and – estimates of our risks and future costs and benefits. These forward-looking statements are based on our current beliefs and expectations and are inherently subject to significant business, economic and competitive uncertainties and contingencies, many of which are beyond our control. In addition, these forward-looking statements are subject to assumptions with respect to future business strategies and decisions that are subject to change. We are under no duty to and do not take any obligation to update any forward-looking statements after the date of this presentation. The following factors, among others, could cause actual results to differ materially from the anticipated results or other expectations expressed in the forward-looking statements: – our ability to manage our operations under the current economic conditions nationally and in our market area; – adverse changes in the financial industry, securities, credit and national local real estate markets (including real estate values); – risks related to a high concentration of loans secured by real estate located in our market area; – the impact of any potential strategic transactions; – our ability to enter new markets successfully and capitalize on growth opportunities; – significant increases in our loan losses, including as a result of our inability to resolve classified and non-performing assets or reduce risks associated with our loans, and management’s assumptions in determining the adequacy of the allowance for loan losses; – credit risks of lending activities, including changes in the level and trend of loan delinquencies and write-offs and in our allowance for loan losses and provision for loan losses; – competition among depository and other financial institutions; – our success in increasing our commercial real estate and commercial and industrial lending; |
 Forward Looking Statements (cont’d) 3 – our ability to attract and maintain deposits and our success in introducing new financial products; – our ability to improve our asset quality even as we increase our commercial real estate and commercial and industrial lending; – changes in interest rates generally, including changes in the relative differences between short-term and long-term interest rates and in deposit interest rates, that may affect our net interest margin and funding sources; – fluctuations in the demand for loans; – technological changes that may be more difficult or expensive than expected; – changes in consumer spending, borrowing and savings habits; – declines in the yield on our assets resulting from the current low interest rate environment; – changes in laws or government regulations or policies affecting financial institutions, including the Dodd-Frank Act and the JOBS Act, which could result in, among other things, increased deposit insurance premiums and assessments, capital requirements, regulatory fees and compliance costs, particularly the new capital regulations, and the resources we have available to address such changes; – changes in accounting policies and practices, as may be adopted by the bank regulatory agencies, the Financial Accounting Standards Board, the Securities and Exchange Commission or the Public Company Accounting Oversight Board; – changes in our compensation and benefit plans, and our ability to retain key members of our senior management team and to address staffing needs in response to product demand or to implement our strategic plans; – loan delinquencies and changes in the underlying cash flows of our borrowers; – the impairment of our investment securities; – our ability to control costs and expenses, particularly those associated with operating as a publicly traded company; – the failure or security breaches of computer systems on which we depend; – the ability of key third-party service providers to perform their obligations to us; and – other economic, competitive, governmental, regulatory and operational factors affecting our operations. Because of these and a wide variety of other uncertainties, many of which are beyond our control, our actual future results may be materially different from the results indicated by these forward-looking statements. |
 Terms of Proposed Offering Issuer: First Guaranty Bancshares, Inc. Offering Size: 750,000 shares Offering Structure: 100% Primary Overallotment: 15% Lock-Up: 180 days Proposed Exchange / Ticker: NASDAQ / “FGBI” Use of Proceeds: To support growth in the Bank’s loan portfolio, including the possibility of making larger loans due to our increased legal lending limit, to finance potential strategic acquisitions and for other general corporate purposes. We may also use a portion of the proceeds of the offering to redeem a portion of our Series C SBLF Preferred Stock by December 31, 2015, subject to regulatory approval. Sole Bookrunner: Sandler O’Neill + Partners, L.P. 4 |
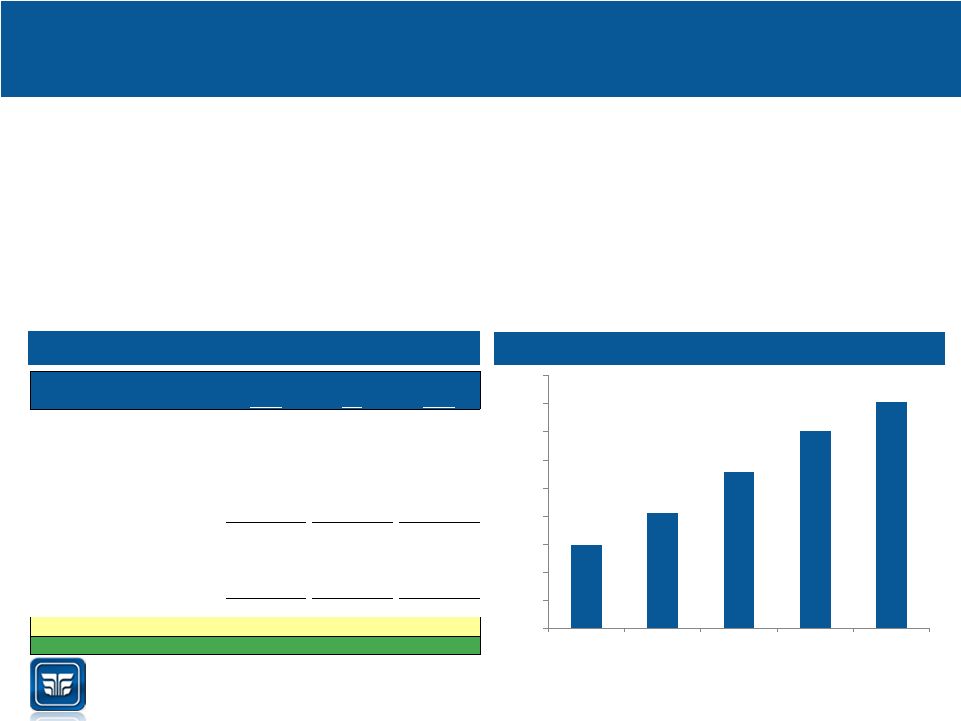
 Summary Financial Overview 5 • Headquartered in Hammond, LA and originally founded in Amite, LA in 1934 • Operates 21 banking facilities primarily located in the Hammond, Baton Rouge, Lafayette, and Shreveport-Bossier City MSAs • 2015Q2 TBV / share of $16.35, YTD EPS of $1.12 and 2015Q2 annualized dividend of $0.64 per share Overview Metric Value Total Assets $1.51 billion Total Gross Loans $810 million Total Deposits $1.35 billion Tangible Common Equity $103 million YTD EPS $1.12 YTD ROAA¹ 0.95% YTD ROATCE¹ 14.10% YTD Efficiency Ratio 56.69% Leverage Ratio 9.32% Total RBC Ratio 13.94% 6.82% Financial Highlights (June 30, 2015) (1) Annualized Source: Company filings Tangible Common Equity / Tangible Assets |
 Investment Highlights 6 • Strong and improving financial performance – YTD ROAA of 0.95%¹ – YTD ROATCE of 14.10%¹ – YTD efficiency ratio of 56.69% – Net interest margin has expanded from 2.92% for the fiscal year 2013 to 3.18% for 2015YTD • History of growth • EPS has increased 33% from $0.84 in the first half of 2014 to $1.12 in the first half of 2015 • FY EPS grew 28% year-over-year from $1.34 in 2013 to $1.72 in 2014 – Pre-tax, pre-provision ROAA increased 27% from 1.24% June YTD 2014 to 1.57% YTD 2015 – Improved the loan-to deposit ratio by 27% from 47.5% of deposits at year-end 2011 to 60.1% of deposits at Q2’15 (1) Annualized Source: Company filings, metrics as of June 30, 2015 th 5 largest independent bank in Louisiana out of 133 banks, with a 81 year-old history |
 Investment Highlights 7 5 largest independent bank in Louisiana out of 133 banks, with a 81 year-old history • Substantial opportunity to improve profitability and continue growth – Loans/deposits currently stand at only 60.1%, with investment securities and cash comprising 44.3% of the total assets – First Guaranty’s weighted average MSA projected population growth rate (2015 – 2020) is 17% higher than the national average, and First Guaranty’s weighted average MSA household income is 31% higher than the projected national average over this same time period – Less than 2% of deposit share in large and desirable Louisiana cities including Baton Rouge, Lafayette and Shreveport provide significant opportunities • Management team & board with significant “skin in the game” and history of creating shareholder value – Insider ownership of 40% – 88 consecutive quarters of dividends paid and 89 announced as of the second quarter of 2015 – A total of $54.6MM in dividends have been paid through 6/30/2015 – First Guaranty’s Chairman Marshall Reynolds has a long history of running profitable banks and creating shareholder value through organic growth, strategic acquisitions, and partnering with larger banking organizations • Since March 1993 when current Chairman Marshall Reynolds recapitalized First Guaranty, book value per share has compounded at a 10.9% CAGR while First Guaranty has paid out dividends of $54.6 million Source: Company filings, metrics as of June 30, 2015 th |
  History 8 1934 1993 1999 2001 2007 2009 2009 2010 2015 First Guaranty Bank founded in Amite, LA Investor group led by Marshall T Reynolds invests $3.6M as part of a recapitalization Announces acquisition of First Southwest Bank Announces acquisition of Woodlands Bancorp, Inc. Announces acquisition of Homestead Bancorp, Inc. First Guaranty Bancshares Inc. formed Bank surpasses the $1.0B total asset mark Alton Lewis becomes CEO Announces acquisition of Greensburg Bancshares, Inc. Paid 88 consecutive quarterly dividend as of 2015Q2 • Modern history begins in 1993 with the recapitalization of First Guaranty by a group of investors led by Marshall T. Reynolds Overview Corporate Timeline (1) Source: Company filings, excludes the impact of stock splits and stock dividends (2) Book value per share as of March 31, 1993 post-recapitalization 2002 In April Alton Lewis becomes a Director of the Bank th Dollars in millions Snapshot (Then and Now) Metrics 1993 Q2'15 CAGR Total Assets: $158.8 $1,512.7 11.1% Net Loans: $103.5 $800.9 10.0% Book Value Per Share¹: $3.70² $37.18 10.9% Branches 6 21 |
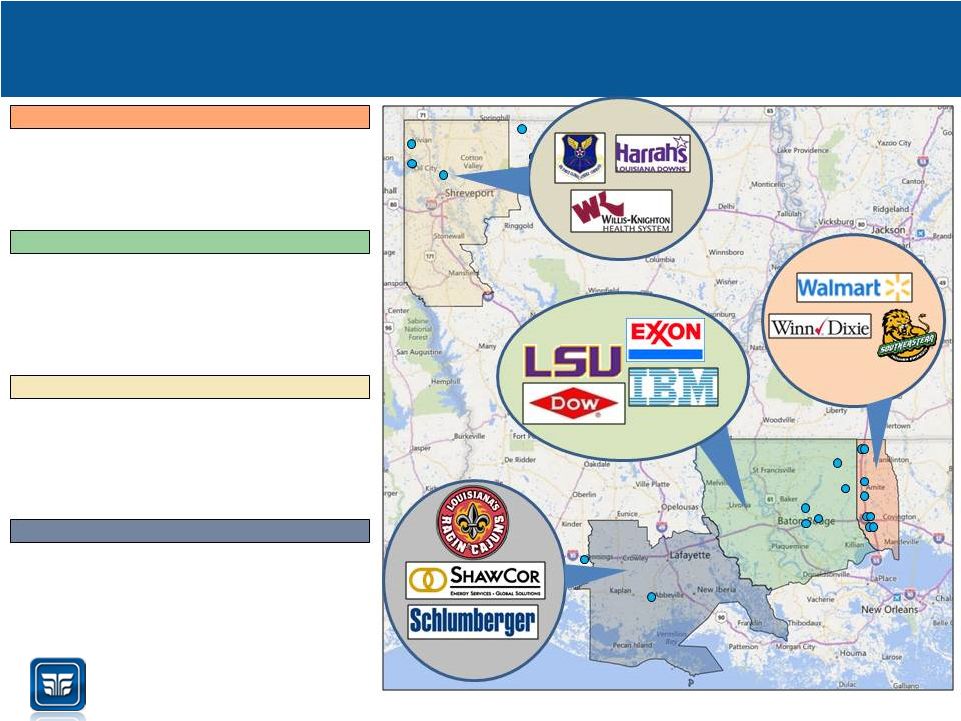 Market Opportunity 9 Shreveport MSA Lafayette MSA Baton Rouge MSA Hammond MSA • Lafayette is the third largest city by population and deposits in Louisiana • Home of University of Louisiana-Lafayette (enrollment ~17,000) • Healthcare, government, retail, and mining are the top employing industries in the area • 2015-2020 projected income growth of 9.98% • Baton Rouge is the second largest city by both population and deposits in Louisiana • Hub of the Southeast petro chemical industry • Political hub of the state of Louisiana – State government is the largest employer • Home of Louisiana State University (enrollment ~30,000) • 2015-2020 projected income growth of 10.57% Sources: SNL Financial, First Guaranty management, North Louisiana Economic Partnership • Major transportation hub • Distribution hub for Wal-Mart and Winn Dixie • Home of Southeastern Louisiana University (enrollment ~15,000) • 2015-2020 projected population growth of 5.04% • 2015-2020 projected income growth of 6.58% • Diversified economy; employment services, government, education, and wholesale / retail trade • Barksdale Air Force Base is largest employer with 10,284 employees • Contains Las Vegas-style gaming industry • 2015-2020 projected income growth of 14.23% • $47,259 2015 median household income |
  Attractive Demographics and Presence 10 2016-2021 Projected Population Growth by MSA Market Share Leader in Hammond, LA 2015 Rank Institution (ST) 2015 Number of Branches 2015 Total Deposits in Market ($000) 2015 Total Market Share (%) 1 First Guaranty Bancshares Inc. (LA) 8 640,361 36.39 2 First NBC Bank Holding Co. (LA) 4 261,884 14.88 3 Hancock Holding Co. (MS) 6 210,988 11.99 4 FPB Financial Corp. (LA) 4 179,117 10.18 5 Regions Financial Corp. (AL) 4 151,155 8.59 6 Capital One Financial Corp. (VA) 2 81,742 4.65 7 JPMorgan Chase & Co. (NY) 2 72,149 4.10 8 First Trust Corp. (LA) 2 61,106 3.47 9 Investar Holding Corp. (LA) 1 52,287 2.97 10 Fidelity Bank (LA) 2 16,977 0.96 Total For Institutions In Market 39 1,759,774 2016-2021 Household Net Income Growth by MSA 5.09% 3.31% 4.41% 1.12% 4.04% 3.69% 0.00% 1.00% 2.00% 3.00% 4.00% 5.00% 6.00% Hammond MSA Baton Rouge MSA Lafayette MSA Shreveport MSA WA FGBI MSA Nationwide 7.34% 10.81% 11.77% 4.20% 8.03% 7.77% 0.00% 2.00% 4.00% 6.00% 8.00% 10.00% 12.00% 14.00% Hammond MSA Baton Rouge MSA Lafayette MSA Shreveport MSA WA FGBI MSA Nationwide 3.4% Above Nat. Avg. 9.5% Above Nat. Avg. Source: SNL Financial |
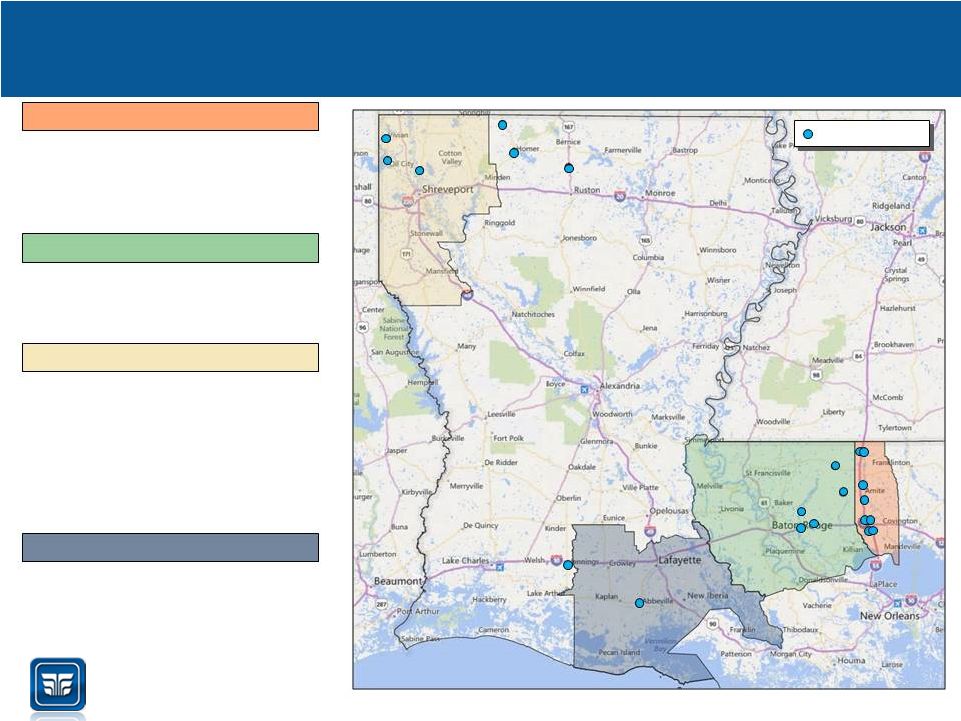 Branch Footprint 11 Shreveport MSA Lafayette MSA Baton Rouge MSA Hammond MSA • 3 offices • 2.2% deposit market share (Ranked #13)¹ • Bossier and Caddo Parishes are primary focus • Approval received to build branch in Bossier County • 5 offices • 1.3% deposit market share (Ranked #8)¹ • 8 offices (including headquarters) • 36.4% deposit market share (Ranked #1)¹ • Includes all of Tangipahoa Parish • 1 office • 1.3% deposit market share (Ranked #16)¹ (1) Market share data as June 30, 2015 Source: SNL Financial, Federal Deposit Insurance Corporation First Guaranty (21) |
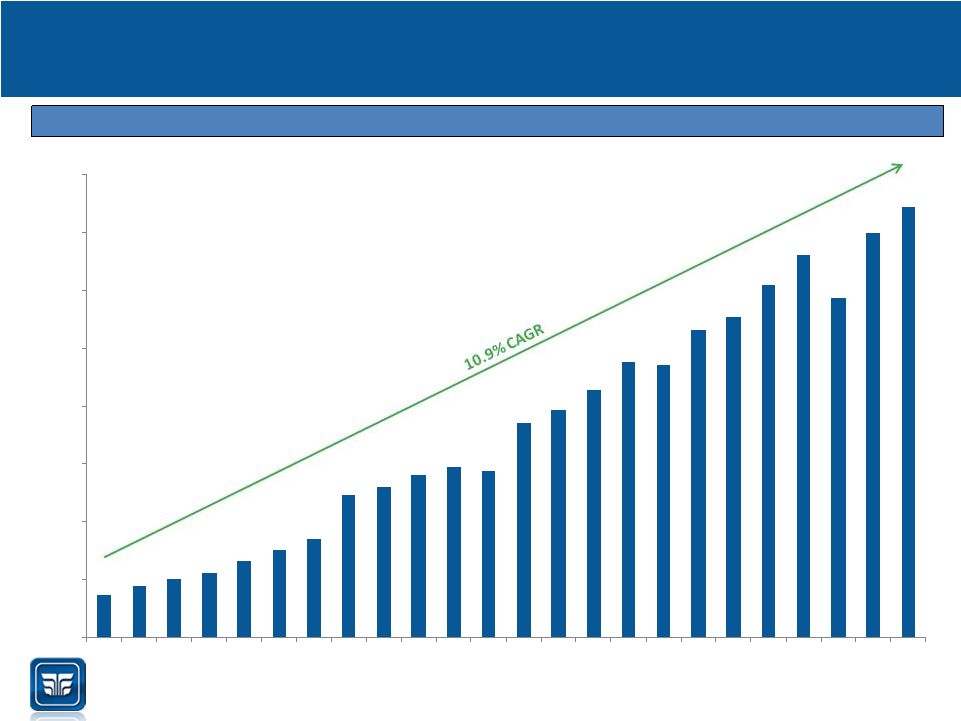 Historical BV/Share Growth Excluding the Impact of Stock Splits and Stock Dividends 12 (1) Estimated book value per share as of March 31, 1993 post-recapitalization Note: 2015 book value per share as of June 30 Source: Company filings, excludes the impact of stock splits and stock dividends Historical Book Value/Share Growth $3.70 $37.18 $0.00 $5.00 $10.00 $15.00 $20.00 $25.00 $30.00 $35.00 $40.00 1993¹ 1993 1994 1995 1996 1997 1998 1999 2000 2001 2002 2003 2004 2005 2006 2007 2008 2009 2010 2011 2012 2013 2014 2015 |
 Management Team 13 • Chairman of the Bank since 1996 and the Company since inception in 2007 • ~40 years of Banking experience • CEO of Champion Industries, Inc. (printing) • Serves as Chairman of Premier Financial Bancorp, Inc. (West Virginia) and as Director of Citizens Deposit Bank & Trust (West Virginia) and Summit State Bank (California) Marshall T. Reynolds Chairman of the Board • Appointed to current role of CEO in 2009 • Also serves as Vice Chairman of the Bank • Has been a director since April 2002 • Previously served as Director of the Bank from June of 1988 to July of 1993 • Partner of the law firm of Cashe, Lewis, Coudrain & Sandage and its predecessor from January 1980 to September 2009 Alton B. Lewis Vice Chairman, President, and CEO • Joined the Bank in 2003 • During his eleven years with the Company, has held positions in commercial lending and credit, including chief credit officer • Previously a financial analyst with Livingston & Jefferson • CFA charterholder Eric J. Dosch Chief Financial Officer • Joined the Bank in 2010 • Responsibilities include Information Technology, Information Security, Alternative Products Support, Deposit Operations, and Operations • Mr. Stark has 33 years of experience in Community/Commercial Banking • That experience includes Management of Operations, Data Processing, Facilities, Credit, Loan Review, and Internal Audit Richard A. Stark Chief Operating Officer • Joined the Bank in 2006 • Worked in accounting for 2 years prior to joining the Bank as a credit analyst • Rose through the ranks to become Chief Credit Officer in 2015 Randy S. Vicknair Chief Credit Officer • Joined the Bank in October of 2015 • 30 years of experience in Credit Administration and Commercial Banking • LCM Capital Partners from 2010 until joining First Guaranty in October, 2015. Focused on providing turnaround management services to financial organizations with an emphasis on problem loan resolution • Prior to 2010 Huntington National Bank, Bank One and Bank of America Mike Cross Chief Lending Officer |
  Insider Shareholder Base 14 Note: Asterisk indicate percentages under 0.1% (1) Includes 3,300 shares owned by Purple Cap, LLC, over which Mr. Reynolds has shared voting and investment power. Also includes 4,546 shares owned by Champion Leasing Corp., 5,166 shares owned by The Harrah & Reynolds Corporation, 17,040 shares owned by M. T. Reynolds Irrevocable Trust and 1,400 shares as custodian for his grandchildren, over all of which Mr. Reynolds has sole voting and investment power. Also includes 9,532 shares owned by Mr. Reynolds’s wife who exercises sole voting and investment powers over such shares. Does not include 105,200 shares beneficially owned by Mr. Reynolds’ son, Jack Reynolds, and 338,011 shares beneficially owned by Mr. Reynolds’ son, Douglas V. Reynolds. 1,478,755 shares are pledged as security for a loan. (2) Includes 43,098 shares owned by Hood Investments, LLC, 2,904 shares owned by Amite Mini Storage of which Mr. Hood is an affiliate, 4,108 shares owned by minors in which Mr. Hood is custodian, and 15,452 shares owned by WKH Management, Inc. as to which Mr. Hood exercises sole voting and investment power. Also includes 725,919 shares owned by Smith & Hood Investments, LLC of which Mr. Hood is President and Chairman. (3) Includes 41,739 shares owned by Big 4 Investments of which Mr. Smith is President and 725,919 shares owned by Smith & Hood Investments, LLC of which Mr. Smith is a co-owner. (4) Includes 15,457 shares held in IRA for the benefit of Mr. Lewis and 6,272 shares held jointly with his wife. (5) Includes 250 shares owned by minors in which Mr. Dosch is custodian. Also includes 100 shares owned by Mr. Dosch’s spouse. 1,000 shares are pledged to secure a revolving line of credit with another financial institution. (6) Insider Name Age Title Position (#) Percent of Total Shares Outstanding (%) Marshall T. Reynolds¹ 78 Chairman of the Board 1,504,017 23.9 William K. Hood² 64 Director 895,536 14.2 Edgar R. Smith III³ 51 Director 768,712 12.2 Alton B. Lewis Jr. 4 66 Vice Chairman, President & CEO 38,727 0.6 Eric John Dosch 37 Treasurer, Secretary & CFO 6,789 0.1 Glenda Baskin Glover 61 Director 2,000 * Total 2,489,862 39.6 6 5 Total number of shares includes only 725,919 shares with respect to the shares co-owned by Messrs. Hood and Smith through Smith & Hood Investments, LLC. |
 Recent Developments (Sep. 30, 2015) • Balance Sheet – Total assets $1.4B – Gross loans $857M – Investment securities $518M – Total deposits $1.3B – Common equity $109M • Income Statement – Net income of $3.7M to $3.9M or $0.60 per share – Pre-tax gain of $2.2M from the sale of common shares from a converted preferred security • Asset quality – NPAs/Assets of 1.60% – NPLs/Loans of 2.40% – ALLL/Total Loans of 1.15% – The increase in non-performing assets and non-performing loans was primarily due to two commercial real estate loans: (1) a $5.4 million loan secured by a multi-family property; and (2) a $2.9 million loan secured by a multi-family property. Both of these loans were previously classified as either special mention or substandard 15 Note: Unaudited financial metrics estimated for the three months ended September 30, 2015 Source: Company filings |
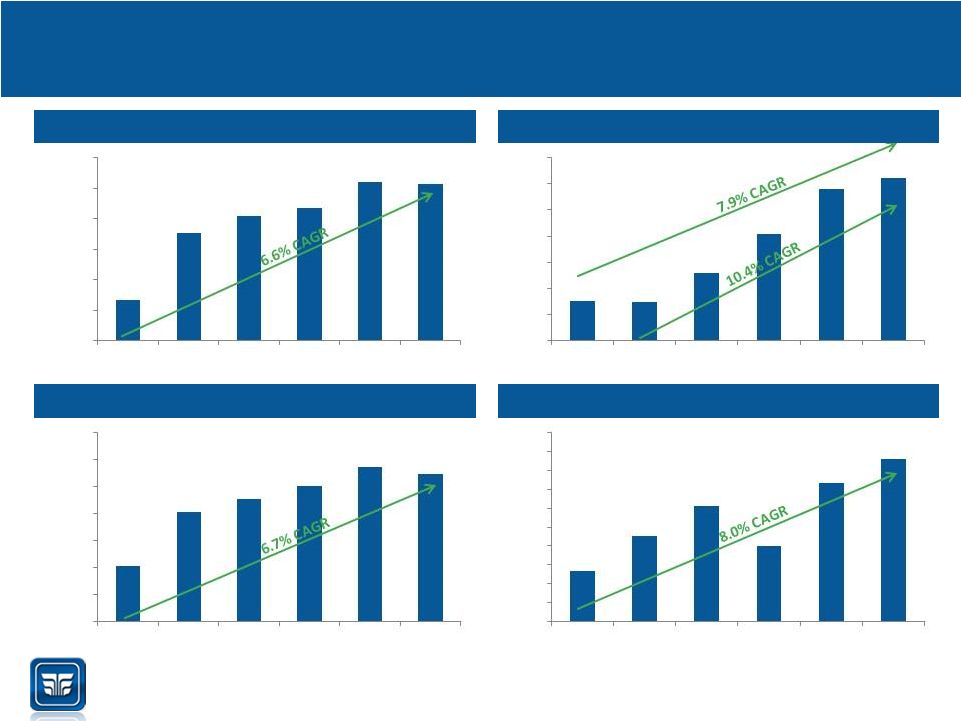 Financial Performance 16 Total Assets ($million) Total Gross Loans ($million) Total Deposits ($million) Tangible Common Equity ($million) Source: Company filings as of June 30, 2015 $1,133 $1,354 $1,407 $1,436 $1,519 $1,513 $1,000 $1,100 $1,200 $1,300 $1,400 $1,500 $1,600 2010 2011 2012 2013 2014 2015Q2 $576 $573 $630 $703 $790 $810 $500 $550 $600 $650 $700 $750 $800 $850 2010 2011 2012 2013 2014 2015Q2 $1,007 $1,207 $1,253 $1,303 $1,372 $1,347 $800 $900 $1,000 $1,100 $1,200 $1,300 $1,400 $1,500 2010 2011 2012 2013 2014 2015Q2 $73 $83 $90 $80 $97 $103 $60 $65 $70 $75 $80 $85 $90 $95 $100 $105 $110 2010 2011 2012 2013 2014 2015Q2 |
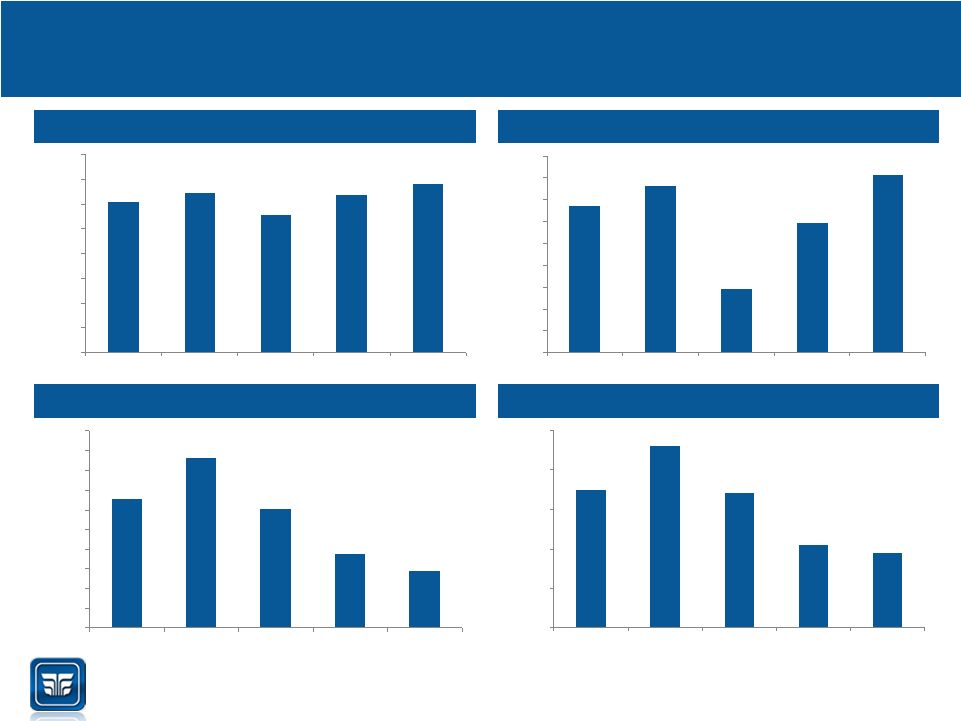
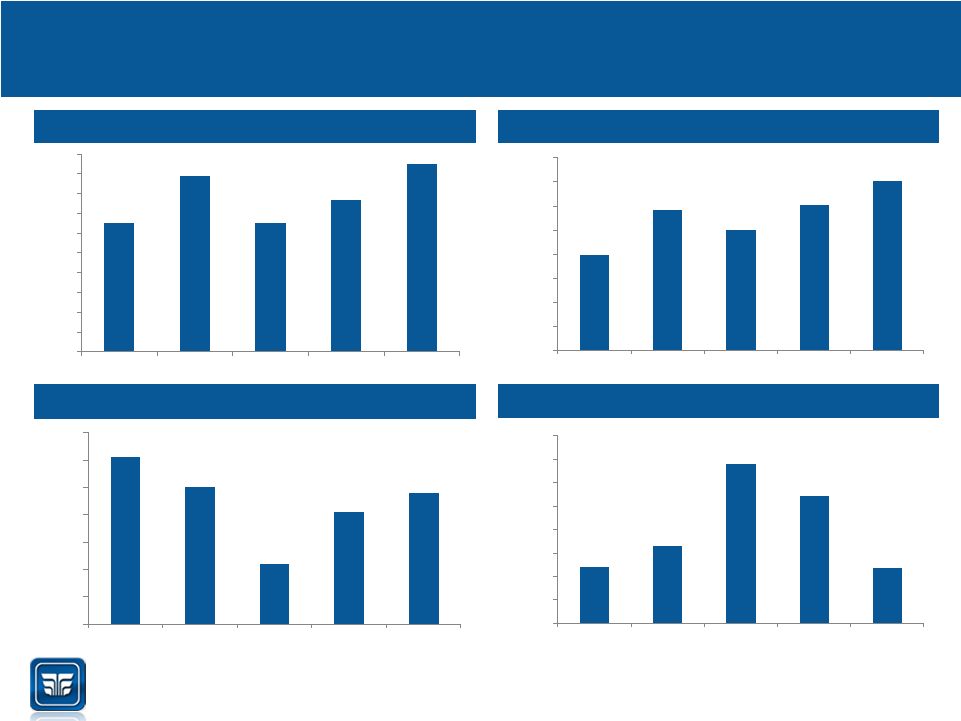 Solid Profitability Metrics 17 ROAA ROATCE Net Interest Margin Efficiency Ratio (1) 2015 numbers are annualized as of June 30, 2015 Source: Company filings 0.65% 0.89% 0.65% 0.77% 0.95% 0.00% 0.10% 0.20% 0.30% 0.40% 0.50% 0.60% 0.70% 0.80% 0.90% 1.00% 2011 2012 2013 2014 2015YTD¹ 7.97% 11.70% 9.99% 12.10% 14.10% 0.00% 2.00% 4.00% 6.00% 8.00% 10.00% 12.00% 14.00% 16.00% 2011 2012 2013 2014 2015YTD¹ 3.31% 3.20% 2.92% 3.11% 3.18% 2.70% 2.80% 2.90% 3.00% 3.10% 3.20% 3.30% 3.40% 2011 2012 2013 2014 2015YTD 56.77% 58.56% 65.61% 62.85% 56.69% 52.00% 54.00% 56.00% 58.00% 60.00% 62.00% 64.00% 66.00% 68.00% 2011 2012 2013 2014 2015YTD |
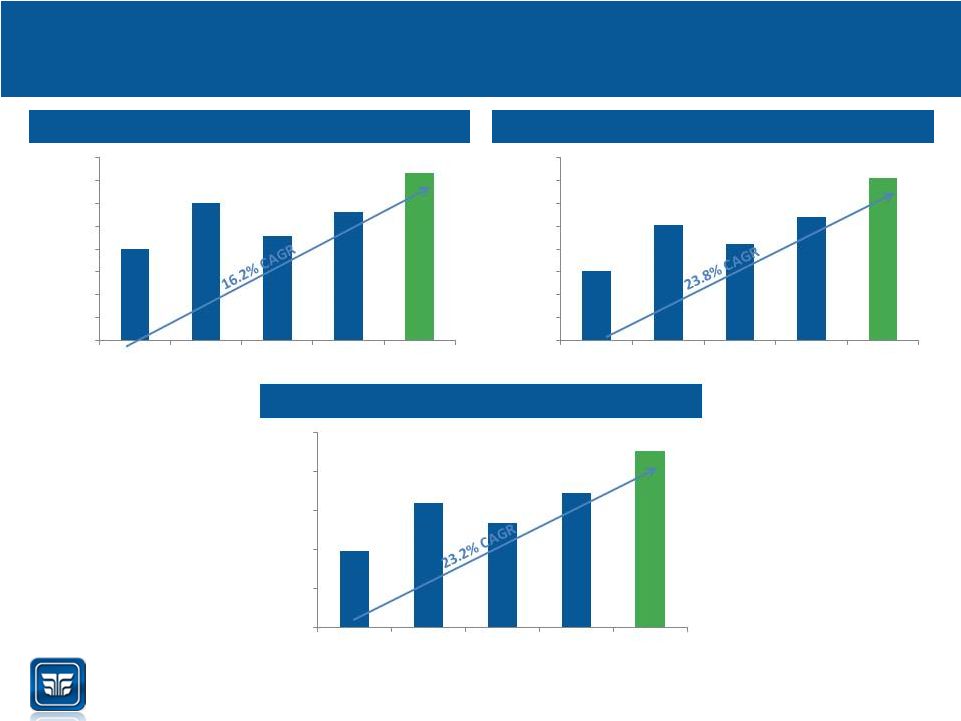 Increasing Earnings Power 18 Net Income ($000) Net Income Available for Common ($000) EPS ($) (1) Note: Green shading indicates annualized metrics as of June 30, 2015 Source: Company filings $8,033 $12,059 $9,146 $11,224 $14,632 $0 $2,000 $4,000 $6,000 $8,000 $10,000 $12,000 $14,000 $16,000 2011 2012 2013 2014 2015YTD¹ $6,057 $10,087 $8,433 $10,830 $14,235 $0 $2,000 $4,000 $6,000 $8,000 $10,000 $12,000 $14,000 $16,000 2011 2012 2013 2014 2015YTD¹ $0.98 $1.60 $1.34 $1.72 $2.26 $0.00 $0.50 $1.00 $1.50 $2.00 $2.50 2011 2012 2013 2014 2015YTD¹ |
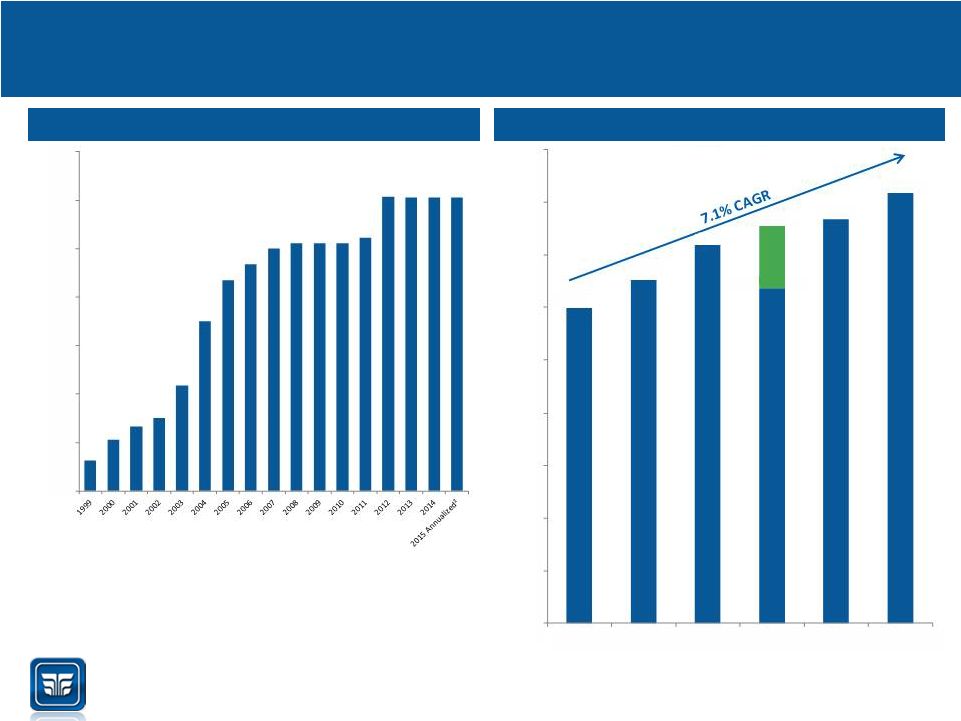 Consistent Dividends… While Increasing TBV 19 (1) Green shading indicates the reversal on the impact of an unrealized OCI mark-to-market loss of $15.2 million (2) Note: As of June 30, 2015 Source: SNL Financial and Company filings Total Annual Dividend History TBV Per Share • 88 consecutive quarters of dividends paid, 89 announced • $0.64 / share dividend per quarter since 2008 • 10% stock dividend declared in February 2012 • $0.64 dividend rate per share held constant which increased dividends to existing shareholders before the 2012 stock dividend • $54.6 million in total dividends paid to common shareholders since 1993 $1,000.00 $1,500.00 $2,000.00 $2,500.00 $3,000.00 $3,500.00 $4,000.00 $4,500.00 $12.01 $13.12 $14.38 $12.72 $15.34 $16.35 $15.13¹ $0.00 $2.00 $4.00 $6.00 $8.00 $10.00 $12.00 $14.00 $16.00 $18.00 2010 2011 2012 2013 2014 2015Q2 |
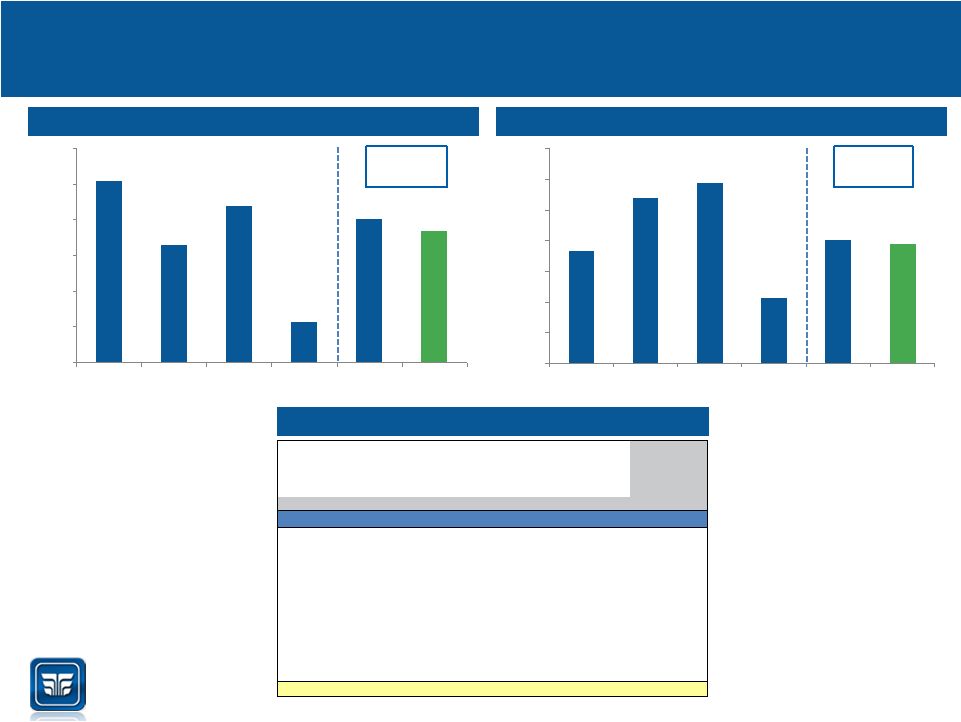
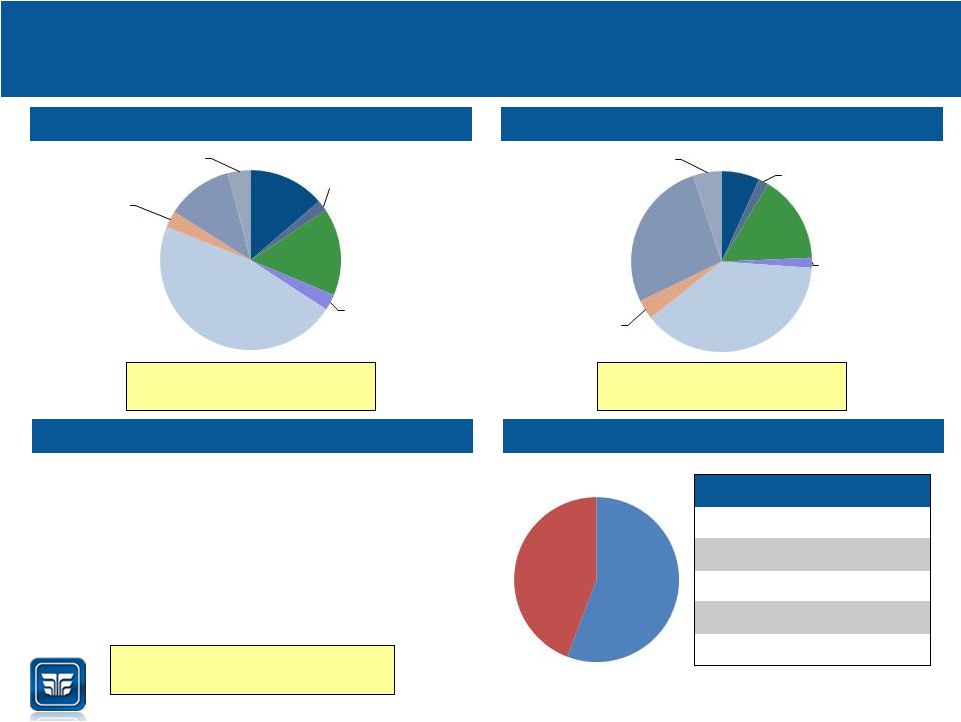 Loan Portfolio 20 Loan Portfolio (12/31/2011) Loan Portfolio (6/30/2015) Total Gross Loans: $573.1 million Yield on Loans: 6.00% Total Gross Loans: $810.4 million Yield on Loans: 5.35% C&D 13.7% Farmland 2.0% 1-4 Family 15.6% Multifamily 2.9% Non-farm non- residential 46.8% Agriculture 3.0% C&I 11.9% Consumer & Other 4.1% Oil & Gas Support and Services (6/30/2015) Non-farm Non-residential CRE Portfolio (6/30/2015) Total O&G-Related Loans: $17.1 million Percent of Gross Loans: 2.1% Non-owner Occupied 56.4% Owner Occupied 43.6% Top CRE Lending Industries Hotel / Motel Retail Industrial & Warehouse Manufacturing Office Buildings Source: SNL Financial, Company filings • Oil & Gas related loans totaled $17.1 million at June 30, 2015 • These loans account for only 2.1% of gross loans • Of First Guaranty’s O&G portfolio, only 6.8% of it is related to O&G extraction • The remaining 93.2% of the portfolio consists of various support activities for mining C&D 6.8% Farmland 1.8% 1-4 Family 15.7% Multifamily 1.8% Non-farm non- residential 38.2% Agricultural 3.5% C&I 27.1% Consumer & Other 5.1% |
 Syndicated Loan Portfolio • First Guaranty developed its syndicated loan program in 2007 • First Guaranty has never experienced a loss in its syndicated loan portfolio • $115.1M or 14.2% of the total gross loan portfolio is comprised of syndicated loans in 20 relationships of which 12 are Shared National Credits¹ • First Guaranty uses this portfolio, through sound credit analysis, to strategically absorb excess liquidity, diversify the loan portfolio, and mitigate interest rate risk • First Guaranty primarily finances middle market companies who need to borrow between $25 million to $75 million • First Guaranty normally pursues loans with senior leverage of 3.0X or less with strong fixed charge coverage ratios • Strong diversity in the industries financed • First Guaranty’s syndicated loan portfolio is a highly efficient business line: – Efficient business model with nominal overhead cost 21 Source: Company filings A Shared National Credit (SNC) is defined as any loan and/or formal loan commitment extended to a borrower by a supervised institution (subject to supervision by one of the federal banking agencies (FBA)), its subsidiaries, and affiliates that totals $20 million or more and (1) is shared by three or more insured institutions under a formal lending agreement or (2) a portion of which is sold to two or more insured institutions, with the purchasing institutions assuming a pro rata share of the credit risk. An agent originates a SNC and administers it for the other lenders. (1) |
 First Guaranty Loan Portfolio Credit Quality 22 (1) Annualized as of June 30, 2015 Source: Company filings NPAs / Assets NCOs / Avg. Loans Loan Loss Reserves / Gross Loans Reserves / NPAs • TDRs at Q2’ 15 totaled only $5.4 million or 0.67% of gross loans 2.13% 1.67% 1.27% 0.99% 1.10% 0.00% 0.50% 1.00% 1.50% 2.00% 2.50% 2011 2012 2013 2014 2015Q2 1.65% 0.45% 0.38% 0.45% 0.15% 0.00% 0.20% 0.40% 0.60% 0.80% 1.00% 1.20% 1.40% 1.60% 1.80% 2011 2012 2013 2014 2015YTD¹ 1.55% 1.64% 1.47% 1.15% 1.17% 0.00% 0.20% 0.40% 0.60% 0.80% 1.00% 1.20% 1.40% 1.60% 1.80% 2011 2012 2013 2014 2015Q2 30.73% 43.94% 56.72% 60.74% 57.36% 0.00% 10.00% 20.00% 30.00% 40.00% 50.00% 60.00% 70.00% 2011 2012 2013 2014 2015Q2 |
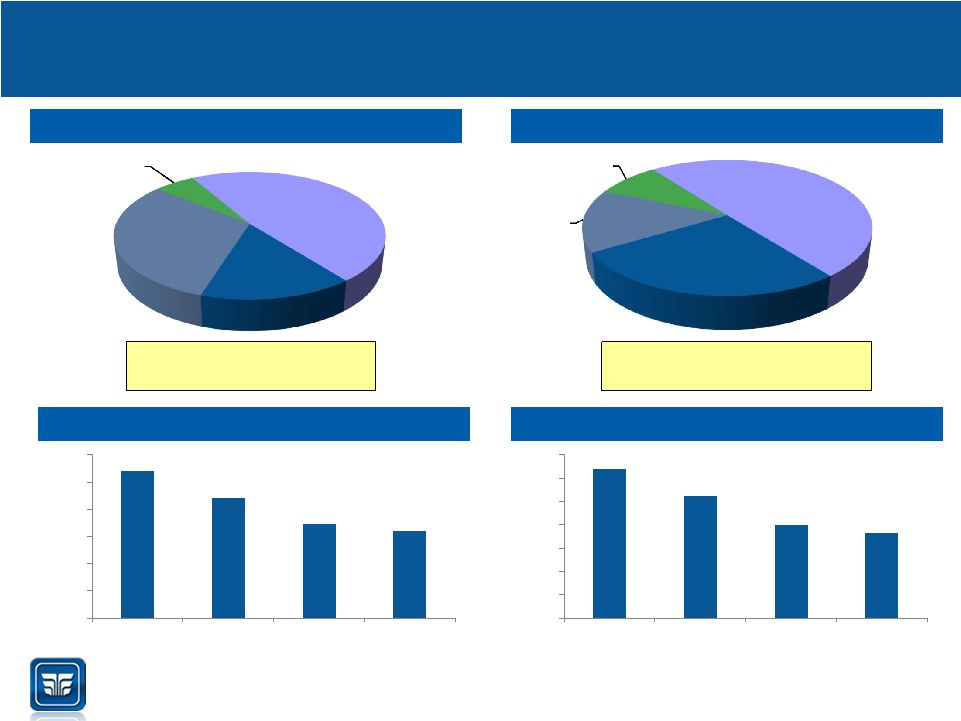 23 Deposit Composition at 6/30/15 Individual and Business Deposits¹ Total Deposits: $1,347.3 million YTD Rate on Deposits: 0.64% Weighted Avg. Rate of Deposits Trend² Total Deposits: $764.4 million YTD Rate on Deposits: 0.73% Weighted Avg. Rate of Individual and Business Deposits Trend² (1) Individual and Business Deposits based on average balances (2) Annualized 2015 numbers Data as of June 30, 2015 Source: Company filings 1.08% 0.88% 0.69% 0.64% 0.00% 0.20% 0.40% 0.60% 0.80% 1.00% 1.20% 2012 2013 2014 2015 YTD 1.28% 1.05% 0.80% 0.73% 0.00% 0.20% 0.40% 0.60% 0.80% 1.00% 1.20% 1.40% 2012 2013 2014 2015 YTD Interest- bearing demand 31.1% Savings 5.7% Noninterest- bearing demand 15.4% Time 47.8% Interest- bearing demand 14.9% Savings 8.5% Noninterest- bearing demand 26.9% Time 49.7% Deposits |
 Public Funds Business Line Overview 24 • First Guaranty has an expertise in managing public funds deposits • First Guaranty has $600 million of public funds deposits outstanding (44.5% of total deposits) at June 30, 2015 • Majority of deposits are under contractual relationships. First Guaranty seeks to be fiscal agent for the public entity and provide multiple services to them. • Highly efficient business model • First Guaranty’s public funds require pledging – Most relationships require pledging of 100% – Pledge can include FHLB letters of credit, which will allow First Guaranty to increase its loans to deposits ratio – Goal is to transition more public funds into a funding source for loans over time as we grow our loan portfolio. • First Guaranty manages liquidity and interest rate risk in this portfolio by – Maintaining average life of the securities portfolio so as to provide flexibility for reinvestment of cash flows Source: Company filings |
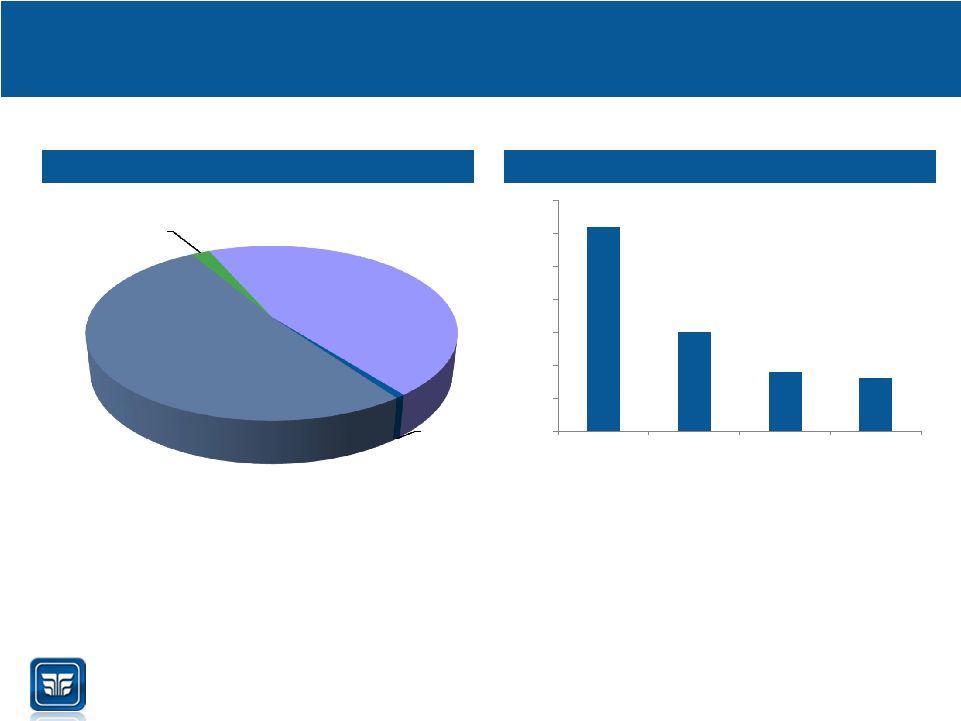 Public Funds 25 Weighted Avg. Rate of Public Funds Deposits Public Funds Deposit Composition 0.75% 0.59% 0.53% 0.52% 0.44% 0.49% 0.54% 0.59% 0.64% 0.69% 0.74% 0.79% 2012 2013 2014 2015 YTD • Weighted average rate of 0.52% vs. 0.73% for non-public funds • Cheaper deposits • More efficient business line Noninterest- bearing demand 0.7% Interest- bearing demand 51.4% Savings 1.9% Time 46.0% Note: Data as of June 30, 2015 – annualized 2015 YTD numbers Source: Company filings |
 Investment Portfolio & Asset/Liability 26 • First Guaranty has been reducing the percentage of securities as a portion of total assets in recent years and concentrating on higher yielding loans • First Guaranty has been actively seeking to reduce the average life of the portfolio to prepare for a rising rate environment – Current duration of the portfolio is expected to be 3.2 years in a flat interest rate environment and 4.4 years in an up 400bps environment¹ Loan / Deposit Improvement Securities Portfolio Detail (1) First Guaranty estimates Source: SNL Financial, Company filings as of June 30, 2015 ($000) Book Unrealized Fair Value G/L Value Available-for-Sale Securities: U.S. Treasuries $ - $ - $ - U.S. Government Agencies 281,825 (2,013) 279,812 Corporate Debt Securities 128,779 2,296 131,075 Mutual Funds / Equities 1,828 2,125 3,953 Municipal Bonds 49,461 (218) 49,243 Subtotal $ 461,893 $ 2,190 $ 464,083 Held-to-Maturity Securities: U.S. Government Agencies $ 131,329 $ (1,708) $ 129,621 Mortgage-backed Securities 53,831 (517) 53,314 Subtotal $ 185,160 $ (2,225) $ 182,935 Total Investment Portfolio $ 647,053 $ (35) $ 647,018 MRQ Yield on Securities 2.15% 47.5% 50.3% 54.0% 57.6% 60.1% 40.0% 42.5% 45.0% 47.5% 50.0% 52.5% 55.0% 57.5% 60.0% 62.5% 2011 2012 2013 2014 2015Q2 |
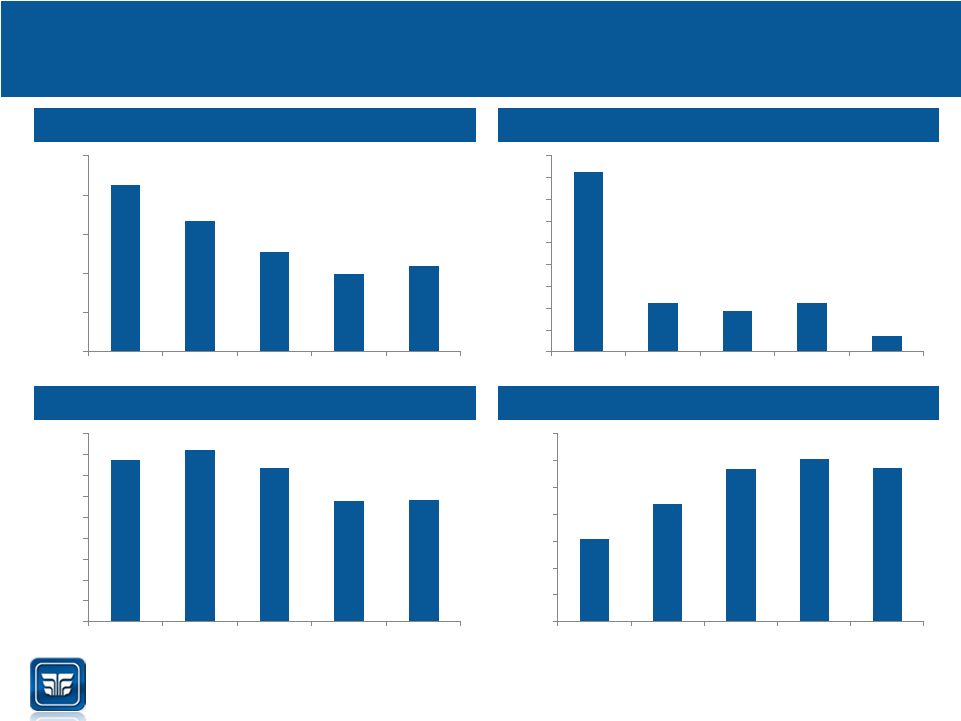
 Capital Ratios 27 TCE / TA Total Equity/ Total Assets Tier 1 Risk-Based Capital Ratio Risk-Based Capital Ratio Source: SNL Financial 6.12% 6.45% 5.59% 6.37% 6.82% 0.00% 1.00% 2.00% 3.00% 4.00% 5.00% 6.00% 7.00% 8.00% 2011 2012 2013 2014 2015Q2 9.35% 9.53% 8.59% 9.19% 9.64% 8.00% 8.20% 8.40% 8.60% 8.80% 9.00% 9.20% 9.40% 9.60% 9.80% 2011 2012 2013 2014 2015Q2 13.71% 14.13% 13.61% 13.16% 12.98% 12.40% 12.60% 12.80% 13.00% 13.20% 13.40% 13.60% 13.80% 14.00% 14.20% 14.40% 2011 2012 2013 2014 2015Q2 14.75% 15.31% 14.71% 14.05% 13.94% 13.00% 13.50% 14.00% 14.50% 15.00% 15.50% 2011 2012 2013 2014 2015Q2 |
 Strategy and Opportunity • Balance sheet is well-positioned for loan growth and margin expansion – Only 60.1% of deposits currently used to fund loans as of June 30, 2015 – Investment portfolio is positioned to efficiently and seamlessly fund loan growth • High quality loan growth is a focus and priority for First Guaranty – Six new lenders have been hired in the past two years – First Guaranty has added a new Chief Lending Officer, which will help extend market share growth throughout our footprint – Continue to expand new equipment leasing business which was put into place in 2014 – Continue our focus on expanding First Guaranty’s USDA , FSA and SBA lending businesses – Credit quality is First Guaranty’s highest priority 28 |
 Strategy and Opportunity (cont’d) • First Guaranty is positioned to operate in the most desirable markets in Louisiana – Operates in major MSAs along interstates I-55, I-12, I-10 and I-20 • Leverage existing branch footprint to increase deposit market share – New loans are being priced to encourage multiple relationships – Expanded cash management services – Two new branches are planned and approved outside of the Hammond market • Focus on Strategic partnerships while continuing to grow core bank – Ongoing M&A evaluation 29 |
 Investing in First Guaranty • 5 largest independent bank in Louisiana out of 133 banks, with a 81 year-old history • Double digit loan growth since 2011 • Earning growth over 20% per year since 2013 • Annualized margin expansion of 5.5% between Q2 ‘13 and Q2 ‘15 • First Guaranty has a long history on TBV growth and has been a consistent dividend payer • Chairman has long history of creating shareholder value, and both he and the board are fully aligned with shareholder interests 30 th |
 Appendix |
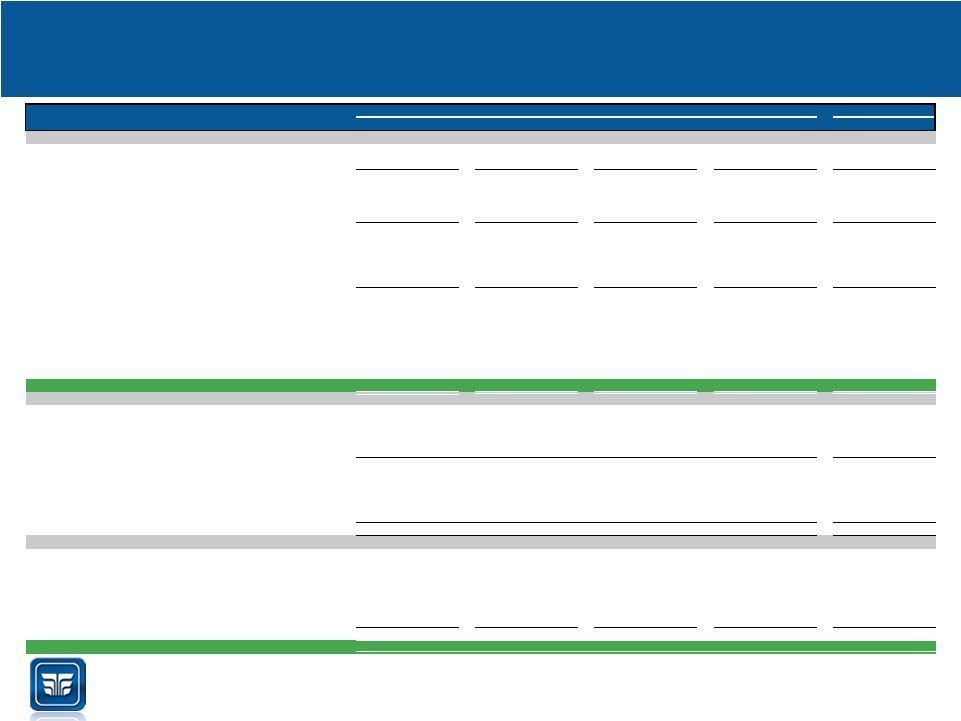 Historical Balance Sheets 32 Source: Company filings (Dollars in thousands) 2011 2012 2013 2014 June 30, 2015 Assets Cash and due from banks 43,812 83,342 60,819 44,365 16,939 Federal funds sold 68,630 2,891 665 210 340 Cash and cash equivalents 112,442 86,233 61,484 44,575 17,279 Interest-earning time deposits with banks 0 747 747 10,247 3,747 Available for sale, at fair value 520,497 600,300 484,211 499,808 464,083 Held to maturity, at cost 112,666 58,943 150,293 141,795 185,160 Investment securities 633,163 659,243 634,504 641,603 649,243 Federal Home Loan Bank stock, at cost 643 1,275 1,835 1,621 1,468 Loans, held for sale 0 557 88 0 0 Loans, net of unearned income 573,100 629,500 703,166 790,321 810,376 Allowance for loan losses 8,879 10,342 10,355 9,105 9,505 Net loans 564,221 619,158 692,811 781,216 800,871 Premises and equipment, net 19,921 19,564 19,612 19,211 20,181 Goodwill 1,999 1,999 1,999 1,999 1,999 Intangible assets, net 2,811 2,413 2,073 1,733 1,562 Other real estate, net 5,709 2,394 3,357 2,198 2,482 Accrued interest receivable 8,128 6,711 6,258 6,384 7,208 Other assets 4,829 7,009 11,673 8,089 6,673 Total Assets 1,353,866 1,407,303 1,436,441 1,518,876 1,512,713 Liabilities Noninterest-bearing demand 167,925 192,232 204,291 207,969 207,742 Interest-bearing demand 289,408 348,870 391,350 432,294 418,662 Savings 57,452 63,062 65,445 74,550 77,354 Time 692,517 648,448 642,013 657,026 643,540 Total Deposits 1,207,302 1,252,612 1,303,099 1,371,839 1,347,298 Short-term borrowings 12,223 14,746 5,788 1,800 13,800 Accrued interest payable 3,509 2,840 2,364 1,997 1,997 Long-term borrowings 3,200 1,100 500 1,455 1,155 Other liabilities 1,030 1,824 1,285 2,202 2,711 Total Liabilities 1,227,264 1,273,122 1,313,036 1,379,293 1,366,961 Equity Preferred Stock 39,435 39,435 39,435 39,435 39,435 Common stock 6,294 6,294 6,294 6,294 6,291 Surplus 39,387 39,387 39,387 39,387 39,387 Treasury 0 -54 -54 -54 0 Retained earnings 37,019 43,071 47,477 54,280 59,275 Accumulated other comprehensive income 4,467 6,048 -9,134 241 1,364 Total Equity 126,602 134,181 123,405 139,583 145,752 Total Liabilities & Shareholder's Equity 1,353,866 1,407,303 1,436,441 1,518,876 1,512,713 At December 31, |
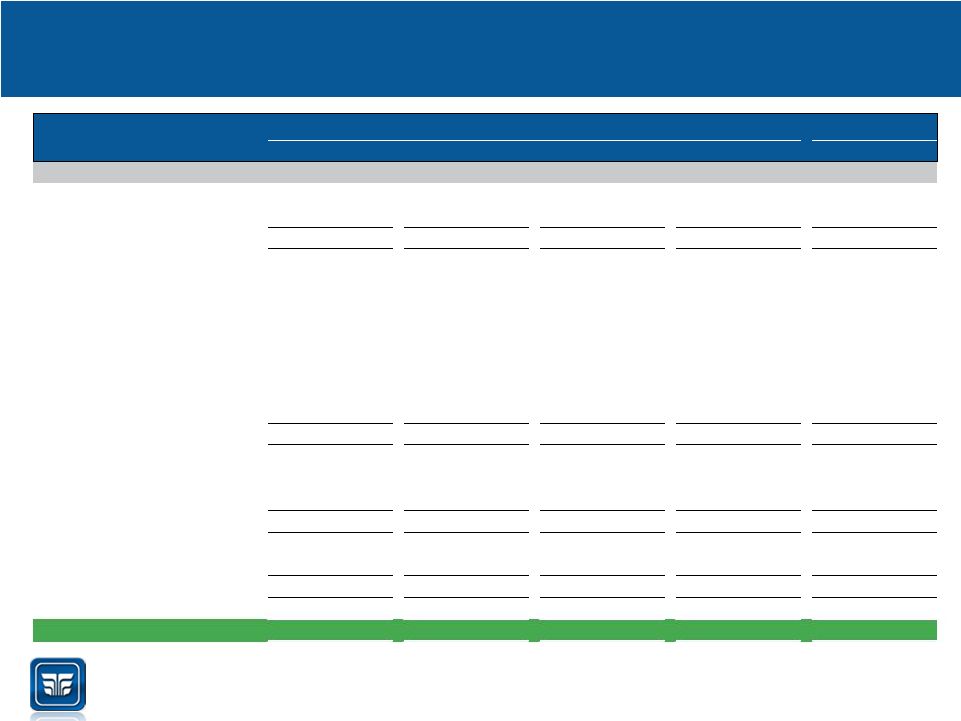 Historical Income Statements 33 (Dollars in thousands) Year Ended December 31, YTD 2011 2012 2013 2014 6/30/15 Income Statement Interest Income 54,609 55,195 50,886 53,297 28,114 Interest Expense 15,118 13,120 11,134 9,202 4,432 Net Interest Income 39,491 42,075 39,752 44,095 23,682 Provision for Loan Losses 10,187 4,134 2,520 1,962 1,010 Service charges, commissions and fees 4,596 4,770 4,640 4,438 2,215 Net gains on securities 3,531 4,868 1,571 295 939 Loss on securities impairment (97) 0 0 0 0 Net gain (loss) on sale of loans 114 (68) (70) (12) 4 Net gain (loss) on sale of assets 1 (109) 0 0 0 Gain on acquisition 1,665 0 0 0 0 Other Noninterest Income 1,463 1,679 1,337 1,456 702 Total Noninterest Income 11,273 11,140 7,478 6,177 3,860 Salaries and employee benefits 12,529 13,668 14,368 15,840 7,905 Occupancy & Equipment 3,473 3,713 3,949 3,928 1,969 Other Expense 12,819 13,780 12,670 11,826 5,739 Total Noninterest Expense 28,821 31,161 30,987 31,594 15,613 Net Income before Taxes 11,756 17,920 13,723 16,716 10,919 Provision for Taxes 3,723 5,861 4,577 5,492 3,663 Net Income 8,033 12,059 9,146 11,224 7,256 Preferred Dividends (1,976) (1,972) (713) (394) (197) Net Income Avail to Common 6,057 10,087 8,433 10,830 7,059 Source: Company filings |
 Reconciliation of Non GAAP Financial Measures 34 Source: Company filings At December 31, YTD June 30, 2011 2012 2013 2014 2015 Tangible common equity Total stockholders' equity $126,602 $134,181 $123,405 $139,583 $145,752 Adjustments: Series C preferred stock (39,435) (39,435) (39,435) (39,435) (39,435) Goodwill (1,999) (1,999) (1,999) (1,999) (1,999) Acquisition intangibles (2,608) (2,257) (1,938) (1,618) (1,458) Tangible common equity $82,560 $90,490 $80,033 $96,531 $102,860 Common shares outstanding 6,294,227 6,291,332 6,291,332 6,291,332 6,291,332 Book value per common share $13.85 $15.06 $13.35 $15.92 $16.90 Tangible book value per common share $13.12 $14.38 $12.72 $15.34 $16.35 Tangible assets Total assets $1,353,866 $1,407,303 $1,436,441 $1,518,876 $1,512,713 Adjustments: Goodwill (1,999) (1,999) (1,999) (1,999) (1,999) Acquisition intangibles (2,608) (2,257) (1,938) (1,618) (1,458) Tangible assets $1,349,259 $1,403,047 $1,432,504 $1,515,259 $1,509,256 Tangible common equity to tangible assets 6.12% 6.45% 5.59% 6.37% 6.82% Total equity to total assets 9.35% 9.53% 8.59% 9.19% 9.64% Return on average tangible common equity Net income $8,033 $12,059 $9,146 $11,224 $7,256 Net income available for common shareholders 6,057 10,087 8,433 10,830 7,059 Adjustments: Amortization of intangible assets and goodwill impairments (tax effected at 35.0%) 185 228 208 208 104 Average tangible common equity 78,362 88,128 86,524 91,187 102,463 Average total equity 108,321 131,991 130,053 134,397 145,433 Return on average tangible common equity 7.97% 11.70% 9.99% 12.10% 14.10% Return on average equity 7.42% 9.14% 7.03% 8.35% 10.06% |