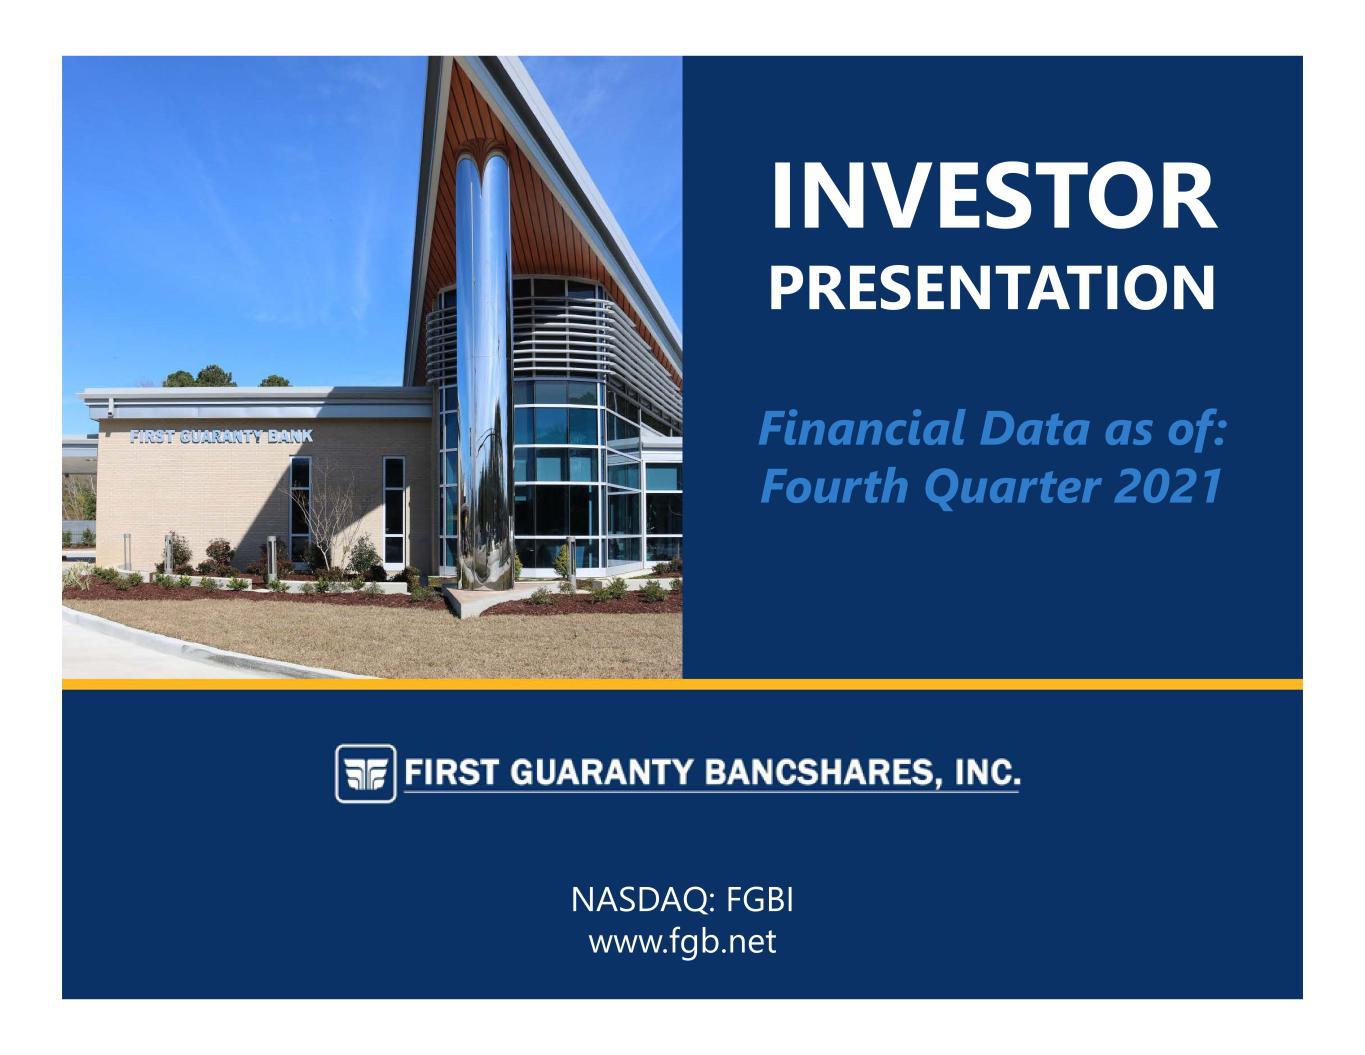
MARCH 2020 DISCUSSION MATERIALS ST RI CT LY C ON FI DE NT IA L Materials Prepared For: [BANK NAME] Financial Institutions Group INVESTOR PRESENTATION Financial Data as of: Fourth Quarter 2021 NASDAQ: FGBI www.fgb.net
2 CERTAIN IMPORTANT INFORMATION CAUTION REGARDING FORWARD LOOKING STATEMENTS This presentation contains forward-looking statements within the meaning of Section 27A of the Securities Act of 1933, as amended, and Section 21E of the Securities Exchange Act of 1934, as amended with respect to the financial condition, liquidity, results of operations, and future performance of our business. These forward-looking statements are intended to be covered by the safe harbor for “forward-looking statements” provided by the Private Securities Litigation Reform Act of 1995. Forward-looking statements are those that are not historical facts. Forward-looking statements include statements with respect to beliefs, plans, objectives, goals, expectations, anticipations, estimates and intentions that are subject to significant risks and uncertainties and are subject to change based on various factors (some of which are beyond our control, particularly with regard to developments related to the novel coronavirus (“COVID-19”)). Forward-looking statements often include the words “believes,” “expects,” “anticipates,” “estimates,” “forecasts,” “intends,” “plans,” “targets,” “potentially,” “probably,” “projects,” “outlook” or similar expressions or future conditional verbs such as “may,” “will,” “should,” “would” and “could.” We caution you that any such forward-looking statements are not guarantees of future performance and are subject to risks, assumptions and uncertainties that are difficult to predict. These forward-looking statements are subject to a number of factors and uncertainties, including, changes in general economic conditions, either nationally or in our market areas, that are worse than expected; the ongoing effects of the COVID-19 pandemic on First Guaranty Bancshares, Inc.’s (the “Company or “FGBI”) operations and financial performance; competition among depository and other financial institutions; inflation and changes in the interest rate environment that reduce our margins or reduce the fair value of financial instruments; adverse changes in the securities markets; changes in laws or government regulations or policies affecting financial institutions, including changes in regulatory fees and capital requirements; our ability to enter new markets successfully and capitalize on growth opportunities; our ability to successfully integrate acquired entities; changes in consumer spending, borrowing and savings habits; changes in accounting policies and practices, as may be adopted by the bank regulatory agencies, the Financial Accounting Standards Board, the Securities and Exchange Commission and the Public Company Accounting Oversight Board; changes in our organization, compensation and benefit plans; changes in our financial condition or results of operations that reduce capital available to pay dividends; increases in our provision for loan losses and changes in the financial condition or future prospects of issuers of securities that we own, which could cause our actual results and experience to differ from the anticipated results and expectations, expressed in such forward-looking statements. We undertake no obligation to publicly update any forward-looking statement, whether as a result of new information, future events or otherwise. Although we believe that the expectations reflected in these forward-looking statements are reasonable as of the date made, actual results may prove to be materially different from the results expressed or implied by the forward-looking statements. NON-GAAP FINANCIAL MEASURES Statements included in this presentation include non-GAAP financial measures and should be read along with the accompanying tables under the section titled “Non-GAAP Reconciliations.” The Company uses non-GAAP financial measures to analyze its performance. Management believes that non-GAAP financial measures provide additional useful information that allows readers to evaluate the ongoing performance of the Company and provide meaningful comparison to its peers. Non-GAAP financial measures should not be considered as an alternative to any measure of performance or financial condition as promulgated under GAAP, and investors should consider the Company’s performance and financial condition as reported under GAAP and all other relevant information when assessing the performance or financial condition of the Company. Non-GAAP financial measures have limitations as analytical tools, and investors should not consider them in isolation or as a substitute for analysis of the results or financial condition as reported under GAAP.
CORPORATE OVERVIEW

5 EXPERIENCED LEADERSHIP Chief Executive Officer & President Chief Executive Officer and President of First Guaranty Bancshares, Inc. since October 2009 Chief Executive Officer of First Guaranty Bank since October 2009 President of First Guaranty Bank since January 2013 Vice Chairman of First Guaranty Bancshares, Inc. and First Guaranty Bank since October 2009 Director of First Guaranty Bancshares Inc. and First Guaranty Bank since 2001 Partner of the law firm of Cashe, Lewis, Coudrain & Sandage and its predecessor from January 1980 to September 2009 Chief Financial Officer Chief Financial Officer of First Guaranty Bank and First Guaranty Bancshares, Inc. since May 2010 Treasurer, Secretary and Principal Accounting Officer at First Guaranty Bancshares, Inc. since 2010 Previous positions held in lending and credit including Chief Credit Officer Prior to association with First Guaranty Bank, he served as an Analyst with Livingston & Jefferson Holds the Chartered Financial Analyst designation and is a graduate of The Graduate School of Banking at Louisiana State University; undergraduate degree from Duke University in 2001 Source: Company documents Mark Ducoing SVP & Chief Deposit Officer Joined FGBI in 2019 Primary focus on lowering cost of deposits; leading to significant progress in improvement of deposit base since his arrival 38 years of banking experience with 15 of those years with Regions Financial Corporation Earned his Bachelor’s degree in Finance from the University of New Orleans Desiree Simmons SVP & Chief Administrative Officer Joined FGBI in 2009 Earned her Bachelor’s degree in Mass Communications from Southeastern Louisiana University 25 years of banking experience 2014 graduate of The Graduate School of Banking at LSU Certified Financial Marketing Professional (CFMP) designation Formerly Series 7 & 63 licensed Alton B. Lewis Jr. Eric J. Dosch
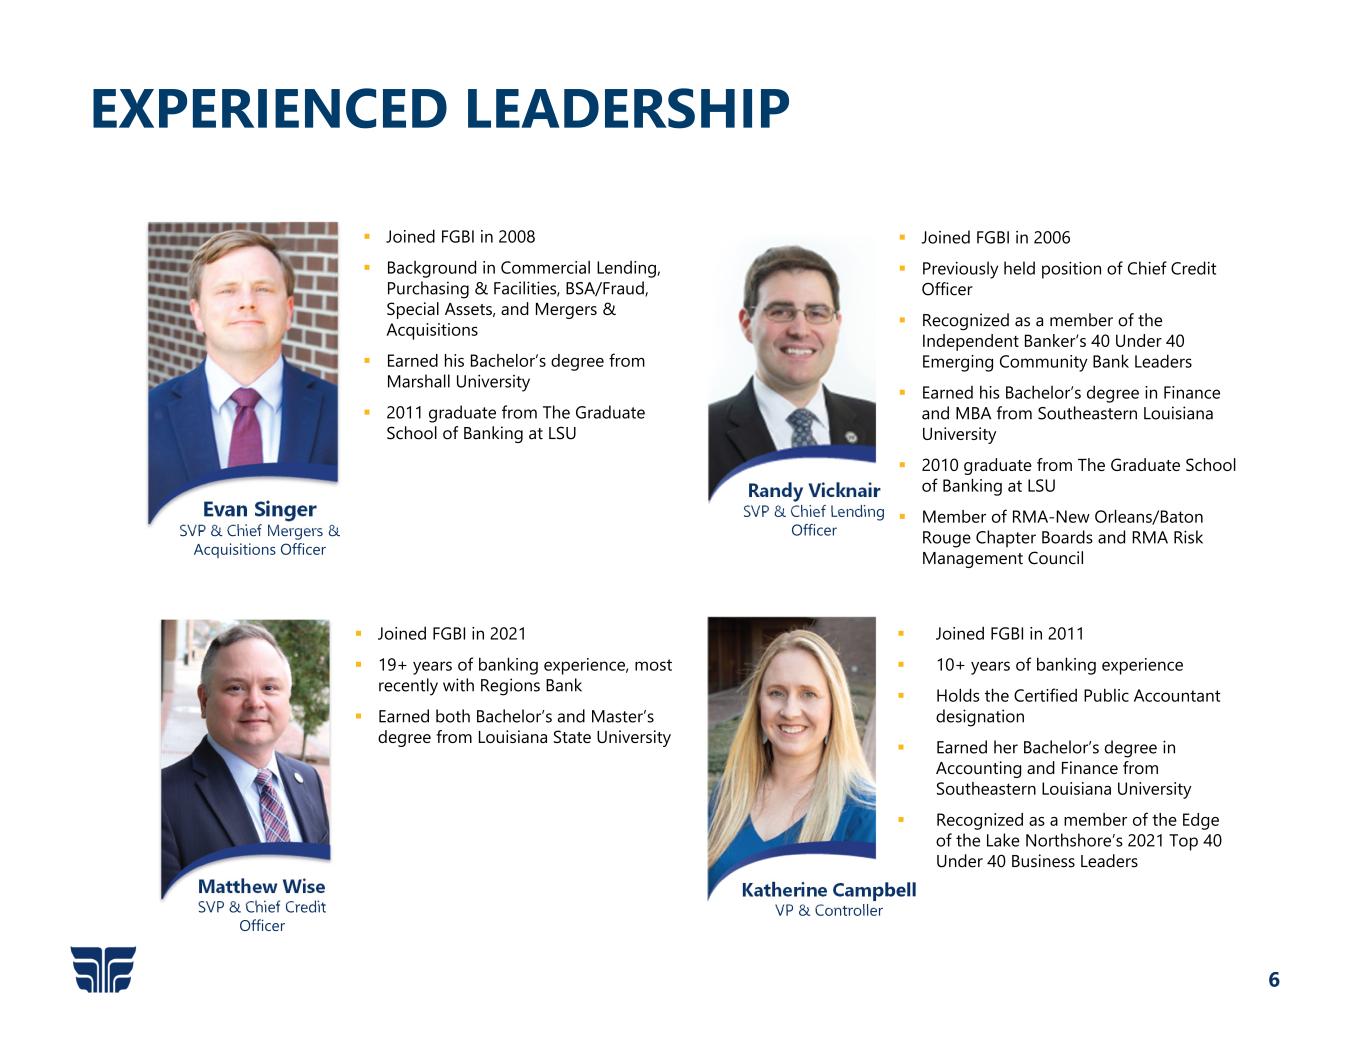
6 Evan Singer SVP & Chief Mergers & Acquisitions Officer Joined FGBI in 2008 Background in Commercial Lending, Purchasing & Facilities, BSA/Fraud, Special Assets, and Mergers & Acquisitions Earned his Bachelor’s degree from Marshall University 2011 graduate from The Graduate School of Banking at LSU EXPERIENCED LEADERSHIP Matthew Wise SVP & Chief Credit Officer Joined FGBI in 2021 19+ years of banking experience, most recently with Regions Bank Earned both Bachelor’s and Master’s degree from Louisiana State University Randy Vicknair SVP & Chief Lending Officer Joined FGBI in 2006 Previously held position of Chief Credit Officer Recognized as a member of the Independent Banker’s 40 Under 40 Emerging Community Bank Leaders Earned his Bachelor’s degree in Finance and MBA from Southeastern Louisiana University 2010 graduate from The Graduate School of Banking at LSU Member of RMA-New Orleans/Baton Rouge Chapter Boards and RMA Risk Management Council Katherine Campbell VP & Controller Joined FGBI in 2011 10+ years of banking experience Holds the Certified Public Accountant designation Earned her Bachelor’s degree in Accounting and Finance from Southeastern Louisiana University Recognized as a member of the Edge of the Lake Northshore’s 2021 Top 40 Under 40 Business Leaders

7 BOARD OF DIRECTORS Source: Company documents MARSHALL T. REYNOLDS Chairman of the Board of Directors Chairman of the Board, Champion Industries WILLIAM K. HOOD President, Hood Automotive Group ALTON B. LEWIS JR. Bio on Experienced Leadership Slide JACK ROSSI CPA, Consultant EDGAR R. SMITH III Chairman and CEO of Smitty’s Supply, Inc. Additional advisory board to provide insight and expertise to essential business interests including: • Oil & Gas Production • Agriculture & Forestry • Wholesale & Retail Expertise Advisory Board Includes: • Thomas D. “Tommy” Crump, Jr. • Carrell G. “Gil” Dowies, III • Dr. Phillip E. Fincher • John D. Gladney, M.D. • Britt L. Synco Holding Company & Bank Directors Additional Bank Directors ANTHONY J. BERNER, JR. Consultant, Gold Star Food Group GLORIA M. DYKES Owner, Dykes Beef Farm PHILLIP E. FINCHER Retired Economics Professor of Louisiana Tech University ROBERT H. GABRIEL President, Gabriel Building Supply Company ANDREW GASAWAY, JR. President, Gasaway-Gasaway-Bankston Architects EDWIN L. HOOVER, JR. President of Encore Development Corporation BRUCE MCANALLY Registered Pharmacist MORGAN S. NALTY Investment Banking Partner at Johnson, Rice & Company LLC JACK M. REYNOLDS Vice President, Pritchard Electric Co. NANCY C. RIBAS Owner, Ribas Holdings LLC and University Motors RICHARD W. SITMAN Board President, Dixie Business Center ANNA A. SMITH Southern University Chairman Emeritus
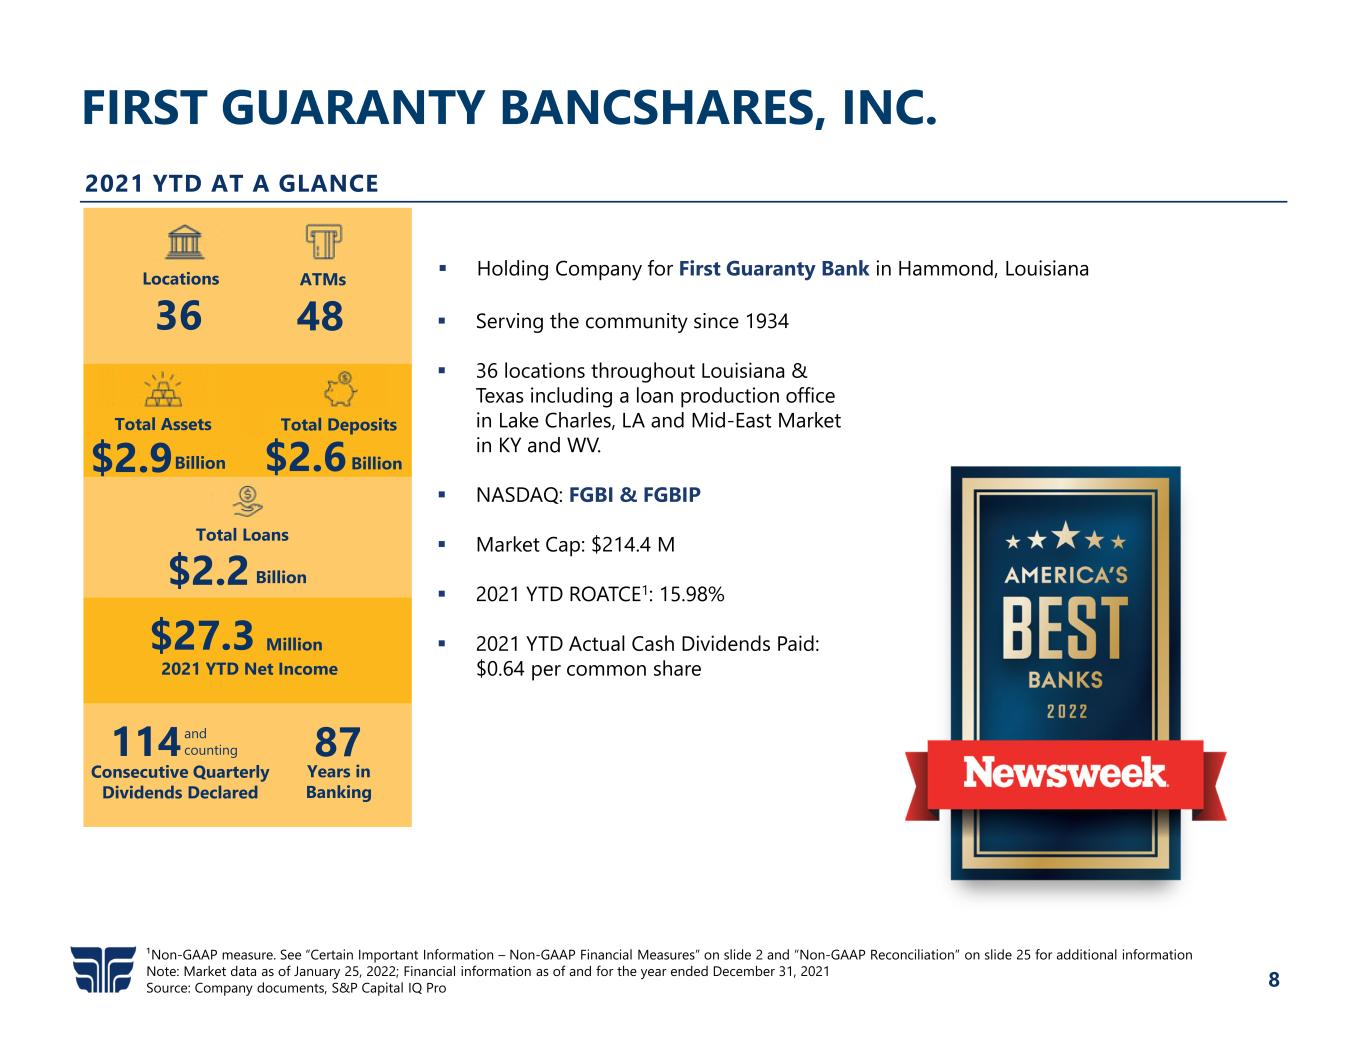
8 FIRST GUARANTY BANCSHARES, INC. ¹Non-GAAP measure. See “Certain Important Information – Non-GAAP Financial Measures” on slide 2 and “Non-GAAP Reconciliation” on slide 25 for additional information Note: Market data as of January 25, 2022; Financial information as of and for the year ended December 31, 2021 Source: Company documents, S&P Capital IQ Pro 2021 YTD AT A GLANCE 114 and counting Consecutive Quarterly Dividends Declared 87 Years in Banking Total Loans Total Assets Total Deposits Locations ATMs 4836 $2.9 $2.6 BillionBillion $2.2 Billion $27.3 Million 2021 YTD Net Income Serving the community since 1934 36 locations throughout Louisiana & Texas including a loan production office in Lake Charles, LA and Mid-East Market in KY and WV. NASDAQ: FGBI & FGBIP Market Cap: $214.4 M 2021 YTD ROATCE1: 15.98% 2021 YTD Actual Cash Dividends Paid: $0.64 per common share Holding Company for First Guaranty Bank in Hammond, Louisiana
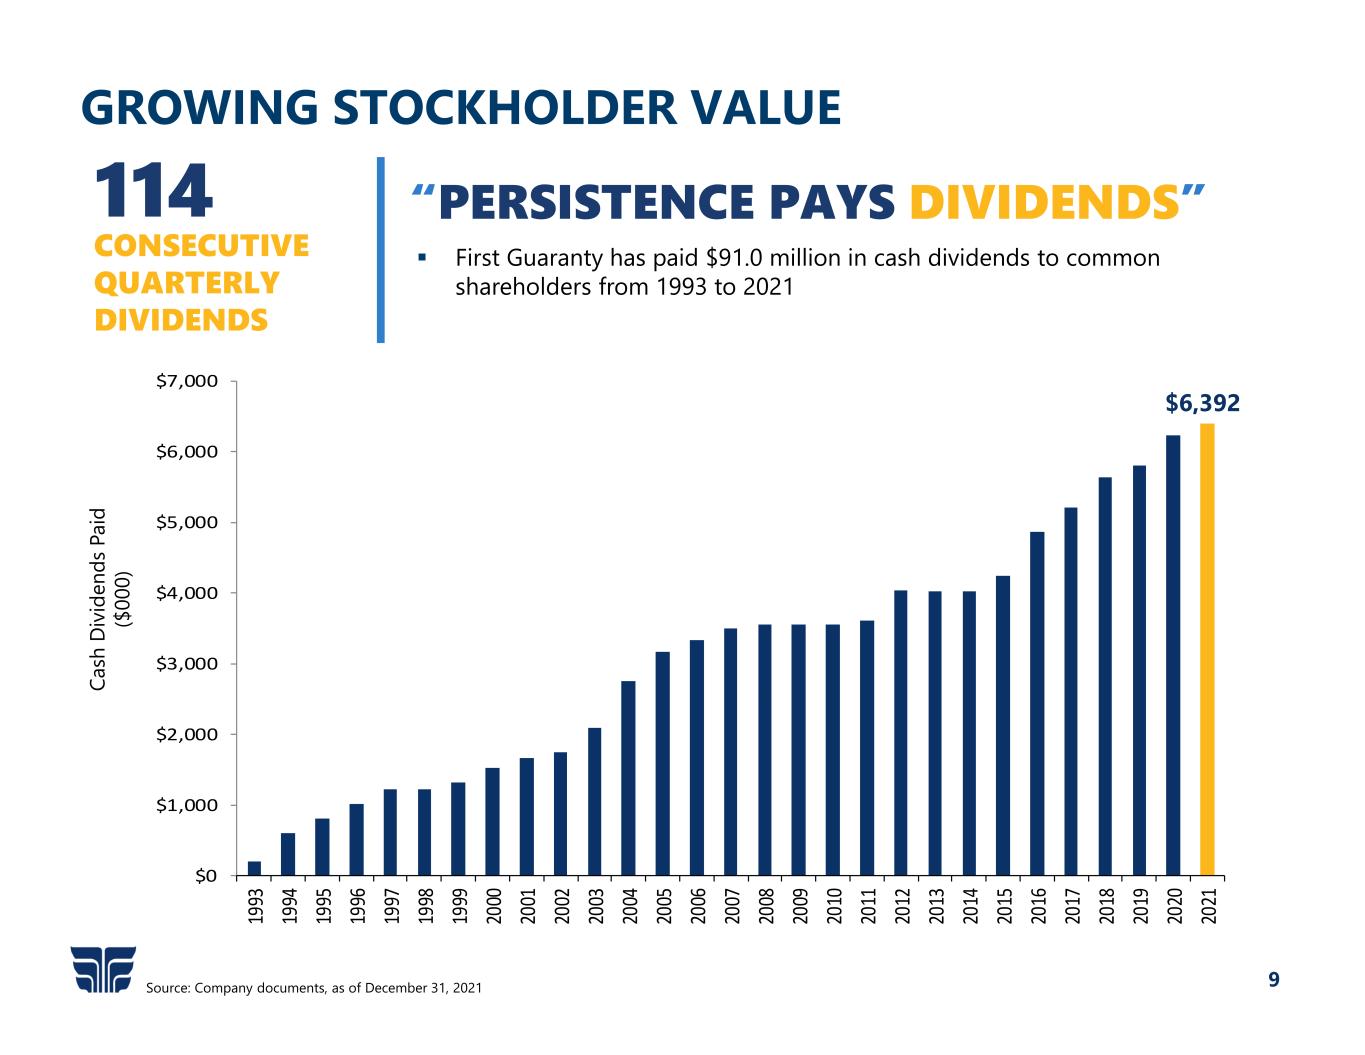
9 $0 $1,000 $2,000 $3,000 $4,000 $5,000 $6,000 $7,000 19 93 19 94 19 95 19 96 19 97 19 98 19 99 20 00 20 01 20 02 20 03 20 04 20 05 20 06 20 07 20 08 20 09 20 10 20 11 20 12 20 13 20 14 20 15 20 16 20 17 20 18 20 19 20 20 20 21 GROWING STOCKHOLDER VALUE Source: Company documents, as of December 31, 2021 114 CONSECUTIVE QUARTERLY DIVIDENDS “PERSISTENCE PAYS DIVIDENDS” First Guaranty has paid $91.0 million in cash dividends to common shareholders from 1993 to 2021 $6,392 Ca sh D iv id en ds P ai d ($ 00 0)
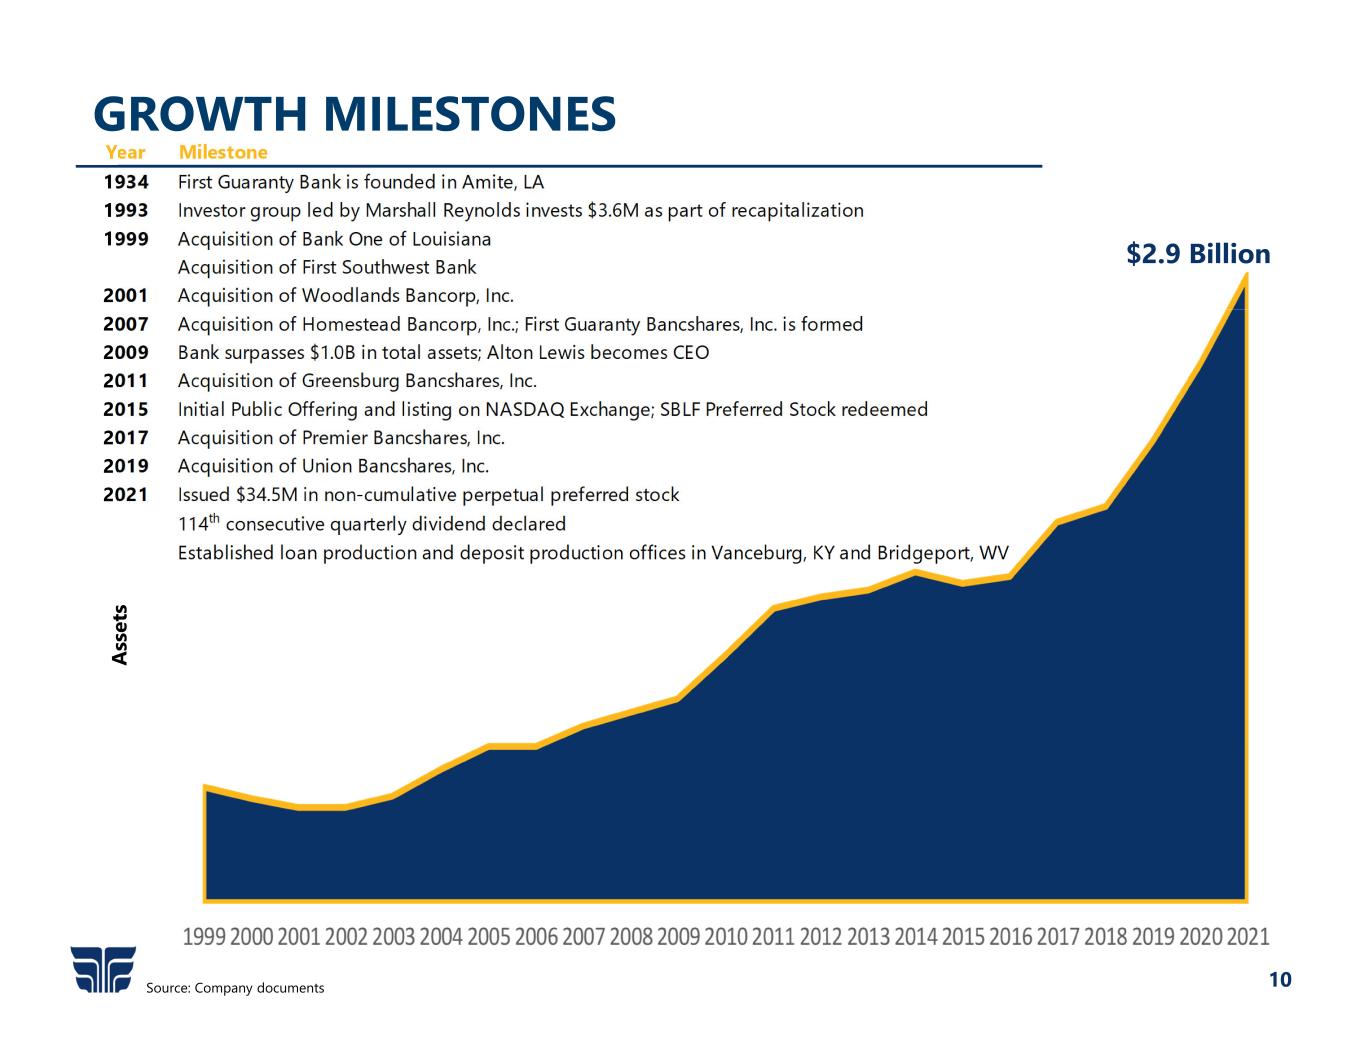
10 Year Milestone 1934 First Guaranty Bank is founded in Amite, LA 1993 Investor group led by Marshall Reynolds invests $3.6M as part of recapitalization 1999 Acquisition of Bank One of Louisiana Acquisition of First Southwest Bank 2001 Acquisition of Woodlands Bancorp, Inc. 2007 Acquisition of Homestead Bancorp, Inc.; First Guaranty Bancshares, Inc. is formed 2009 Bank surpasses $1.0B in total assets; Alton Lewis becomes CEO 2011 Acquisition of Greensburg Bancshares, Inc. 2015 Initial Public Offering and listing on NASDAQ Exchange; SBLF Preferred Stock redeemed 2017 Acquisition of Premier Bancshares, Inc. 2019 Acquisition of Union Bancshares, Inc. 2021 Issued $34.5M in non-cumulative perpetual preferred stock 114th consecutive quarterly dividend declared Established loan production and deposit production offices in Vanceburg, KY and Bridgeport, WV GROWTH MILESTONES Source: Company documents $2.9 Billion A ss et s
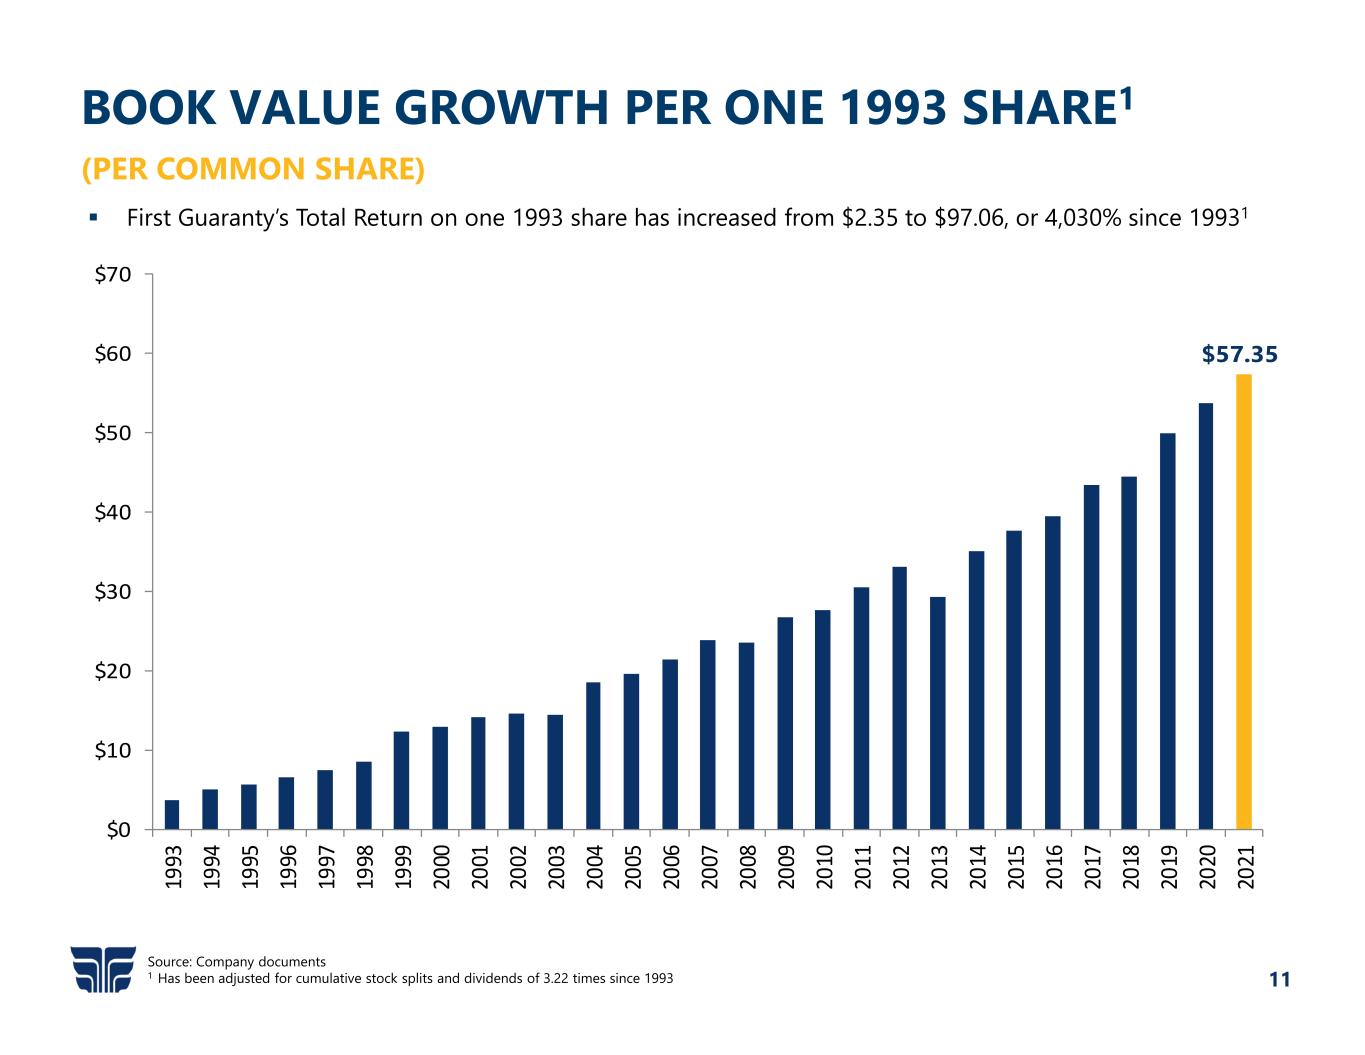
11 BOOK VALUE GROWTH PER ONE 1993 SHARE1 (PER COMMON SHARE) $57.35 $0 $10 $20 $30 $40 $50 $60 $70 19 93 19 94 19 95 19 96 19 97 19 98 19 99 20 00 20 01 20 02 20 03 20 04 20 05 20 06 20 07 20 08 20 09 20 10 20 11 20 12 20 13 20 14 20 15 20 16 20 17 20 18 20 19 20 20 20 21 Source: Company documents 1 Has been adjusted for cumulative stock splits and dividends of 3.22 times since 1993 First Guaranty’s Total Return on one 1993 share has increased from $2.35 to $97.06, or 4,030% since 19931

12 EMBRACING NEW TECHNOLOGIES CardSwap Personal Financial Manager ClickSwitch Biller Direct Autobooks Credit Aware Q2 is a leading software provider that has transformed our customers’ digital financial experience. Our Online Banking platform is so much more than just Online Banking, below are some of the additional capabilities that are part of FGB’s Online Banking experience: COMING SOON… Banker Jr CRM & MCIF
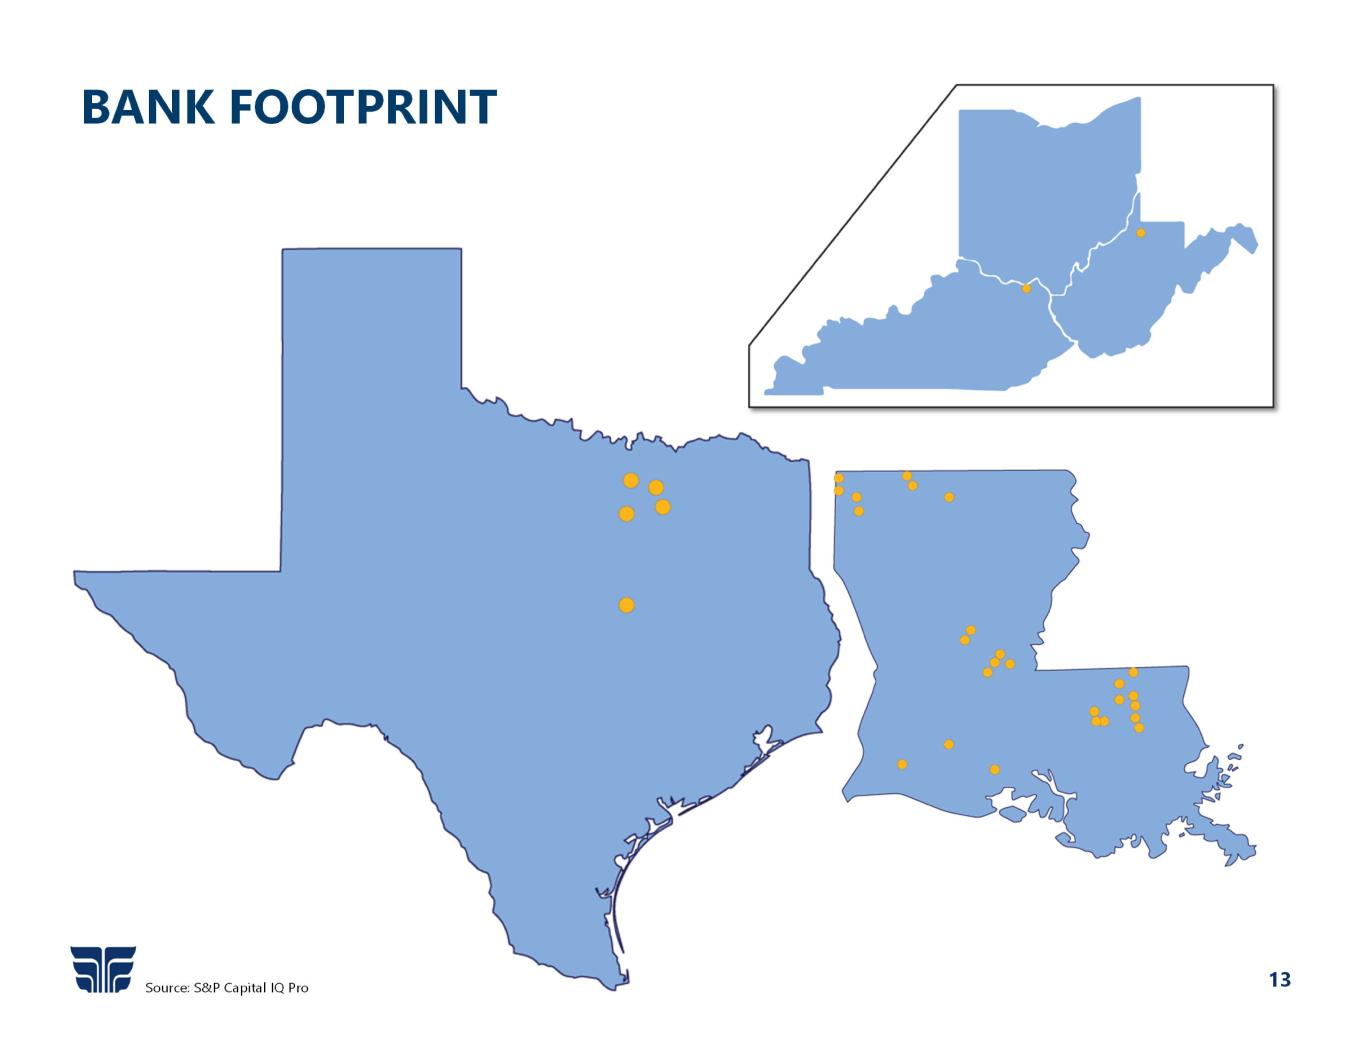
13 BANK FOOTPRINT Source: S&P Capital IQ Pro
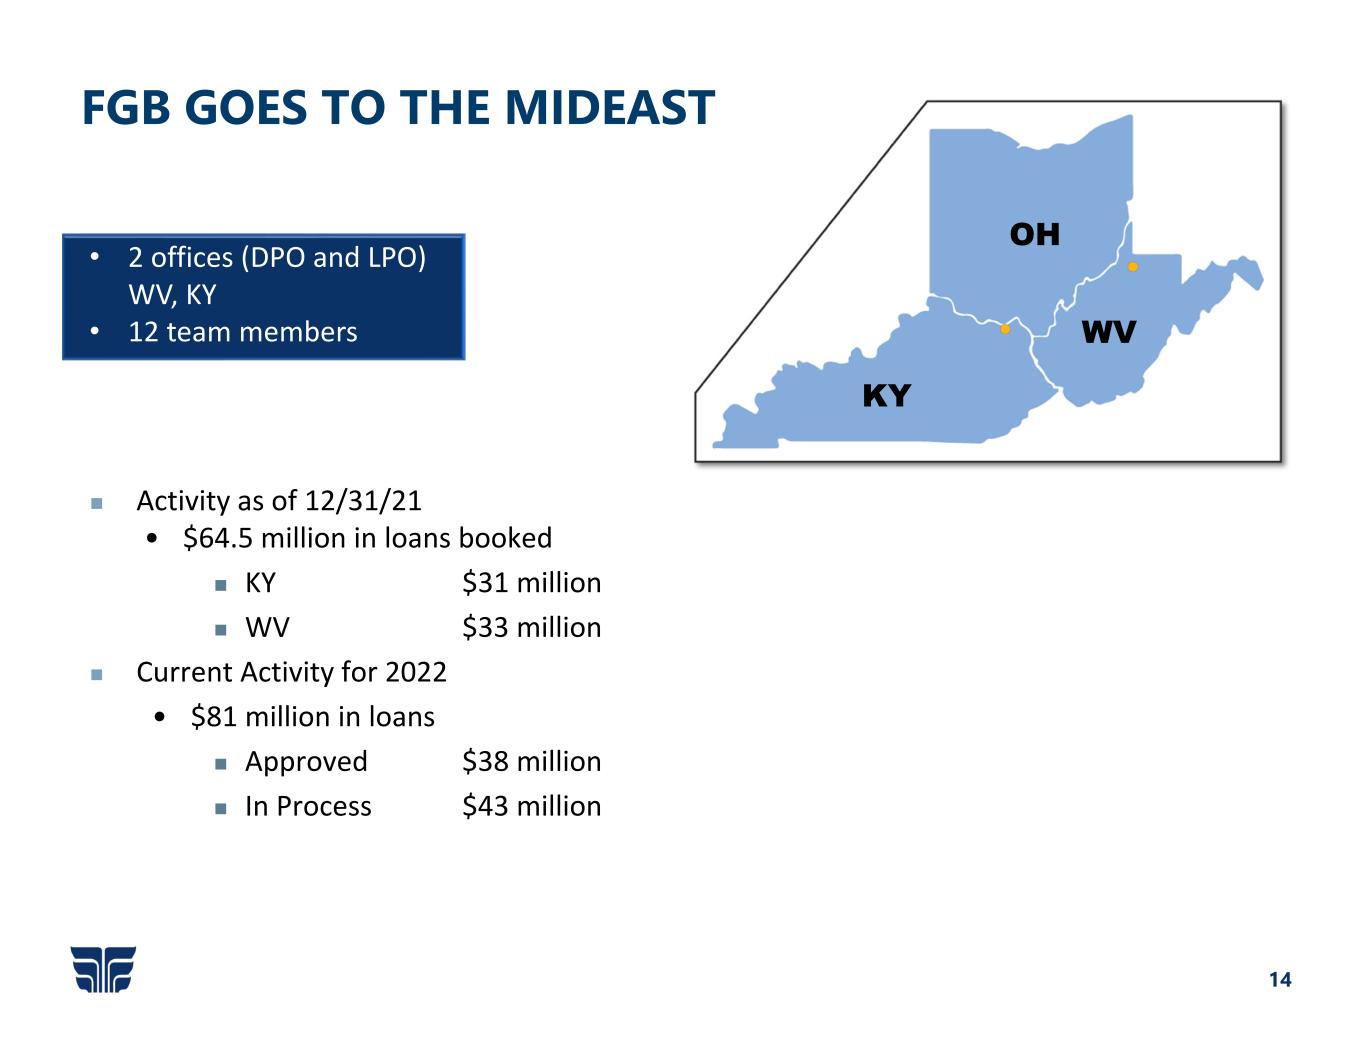
14 Activity as of 12/31/21 • $64.5 million in loans booked KY $31 million WV $33 million Current Activity for 2022 • $81 million in loans Approved $38 million In Process $43 million FGB GOES TO THE MIDEAST OH KY WV • 2 offices (DPO and LPO) WV, KY • 12 team members

FINANCIAL HIGHLIGHTS
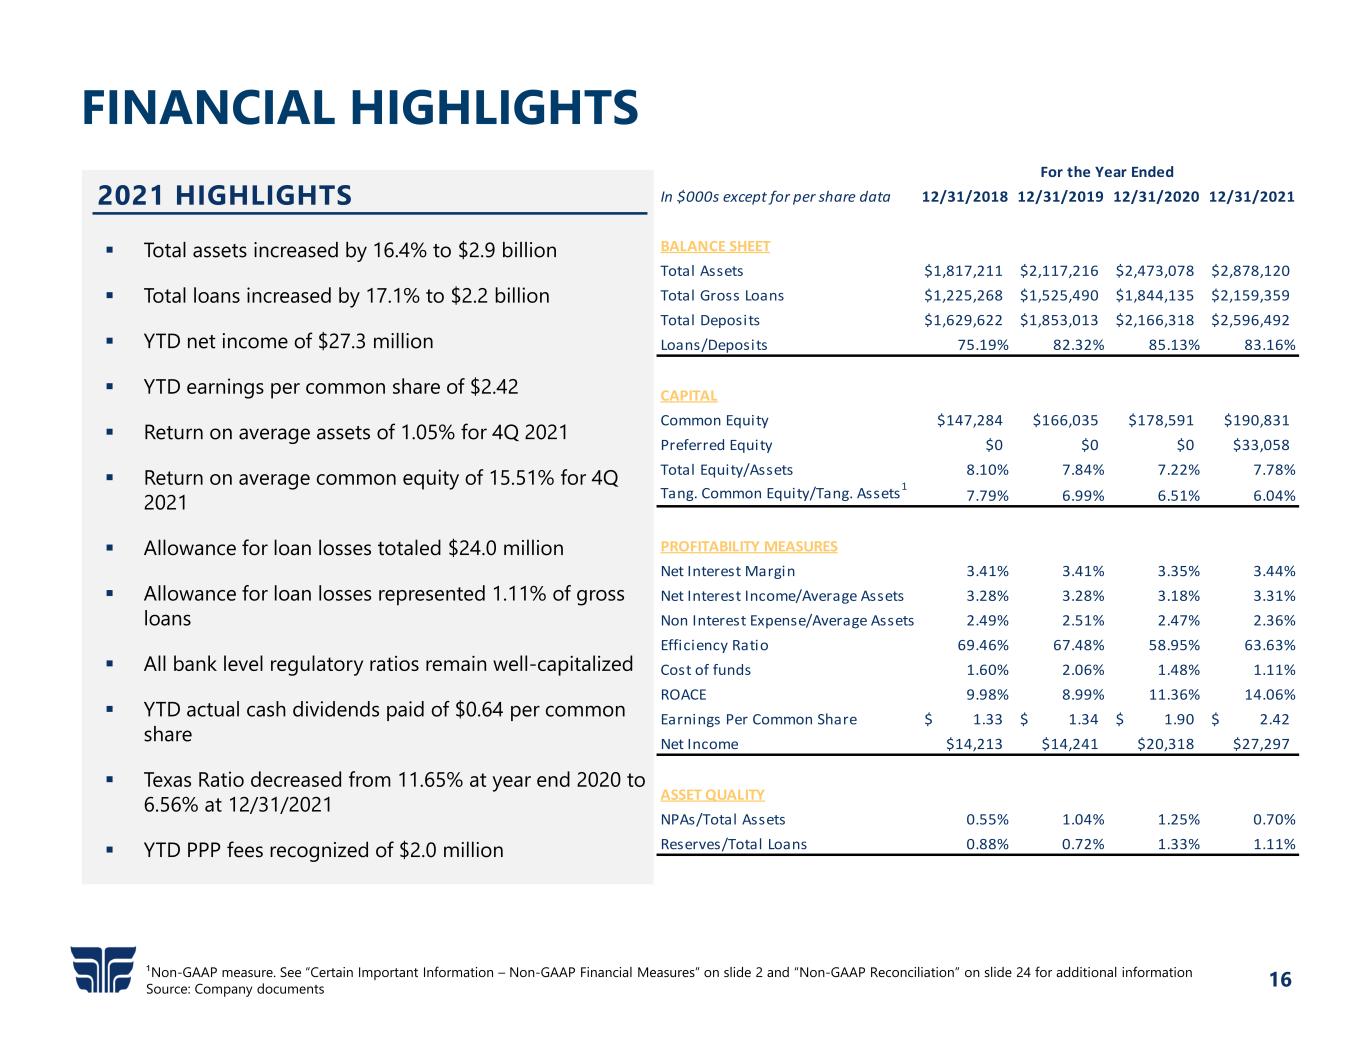
16 FINANCIAL HIGHLIGHTS Total assets increased by 16.4% to $2.9 billion Total loans increased by 17.1% to $2.2 billion YTD net income of $27.3 million YTD earnings per common share of $2.42 Return on average assets of 1.05% for 4Q 2021 Return on average common equity of 15.51% for 4Q 2021 Allowance for loan losses totaled $24.0 million Allowance for loan losses represented 1.11% of gross loans All bank level regulatory ratios remain well-capitalized YTD actual cash dividends paid of $0.64 per common share Texas Ratio decreased from 11.65% at year end 2020 to 6.56% at 12/31/2021 YTD PPP fees recognized of $2.0 million 2021 HIGHLIGHTS ¹Non-GAAP measure. See “Certain Important Information – Non-GAAP Financial Measures” on slide 2 and “Non-GAAP Reconciliation” on slide 24 for additional information Source: Company documents In $000s except for per share data 12/31/2018 12/31/2019 12/31/2020 12/31/2021 BALANCE SHEET Total Assets $1,817,211 $2,117,216 $2,473,078 $2,878,120 Total Gross Loans $1,225,268 $1,525,490 $1,844,135 $2,159,359 Total Deposits $1,629,622 $1,853,013 $2,166,318 $2,596,492 Loans/Deposits 75.19% 82.32% 85.13% 83.16% CAPITAL Common Equity $147,284 $166,035 $178,591 $190,831 Preferred Equity $0 $0 $0 $33,058 Total Equity/Assets 8.10% 7.84% 7.22% 7.78% Tang. Common Equity/Tang. Assets1 7.79% 6.99% 6.51% 6.04% PROFITABILITY MEASURES Net Interest Margin 3.41% 3.41% 3.35% 3.44% Net Interest Income/Average Assets 3.28% 3.28% 3.18% 3.31% Non Interest Expense/Average Assets 2.49% 2.51% 2.47% 2.36% Efficiency Ratio 69.46% 67.48% 58.95% 63.63% Cost of funds 1.60% 2.06% 1.48% 1.11% ROACE 9.98% 8.99% 11.36% 14.06% Earnings Per Common Share 1.33$ 1.34$ 1.90$ 2.42$ Net Income $14,213 $14,241 $20,318 $27,297 ASSET QUALITY NPAs/Total Assets 0.55% 1.04% 1.25% 0.70% Reserves/Total Loans 0.88% 0.72% 1.33% 1.11% For the Year Ended

17 FINANCIAL TRENDS Source: Company documents, as of December 31, 2021 TOTAL ASSETS ($M) TOTAL GROSS LOANS ($M) TOTAL DEPOSITS ($M) LOAN / DEPOSIT RATIO (%)
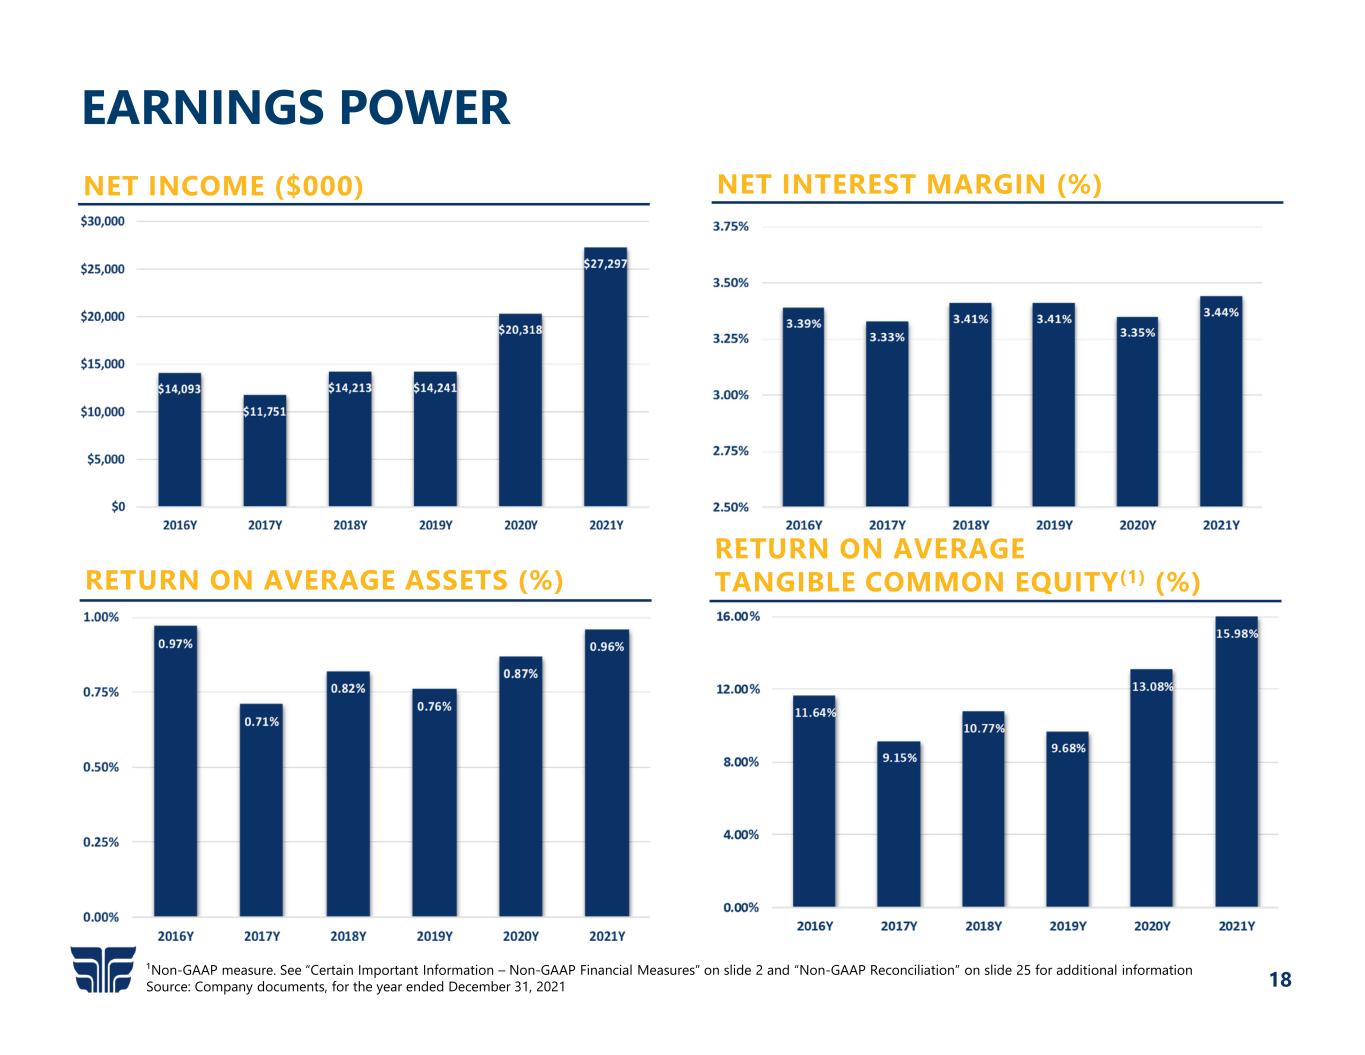
18 EARNINGS POWER ¹Non-GAAP measure. See “Certain Important Information – Non-GAAP Financial Measures” on slide 2 and “Non-GAAP Reconciliation” on slide 25 for additional information Source: Company documents, for the year ended December 31, 2021 RETURN ON AVERAGE TANGIBLE COMMON EQUITY(1) (%) NET INTEREST MARGIN (%) RETURN ON AVERAGE ASSETS (%) NET INCOME ($000)
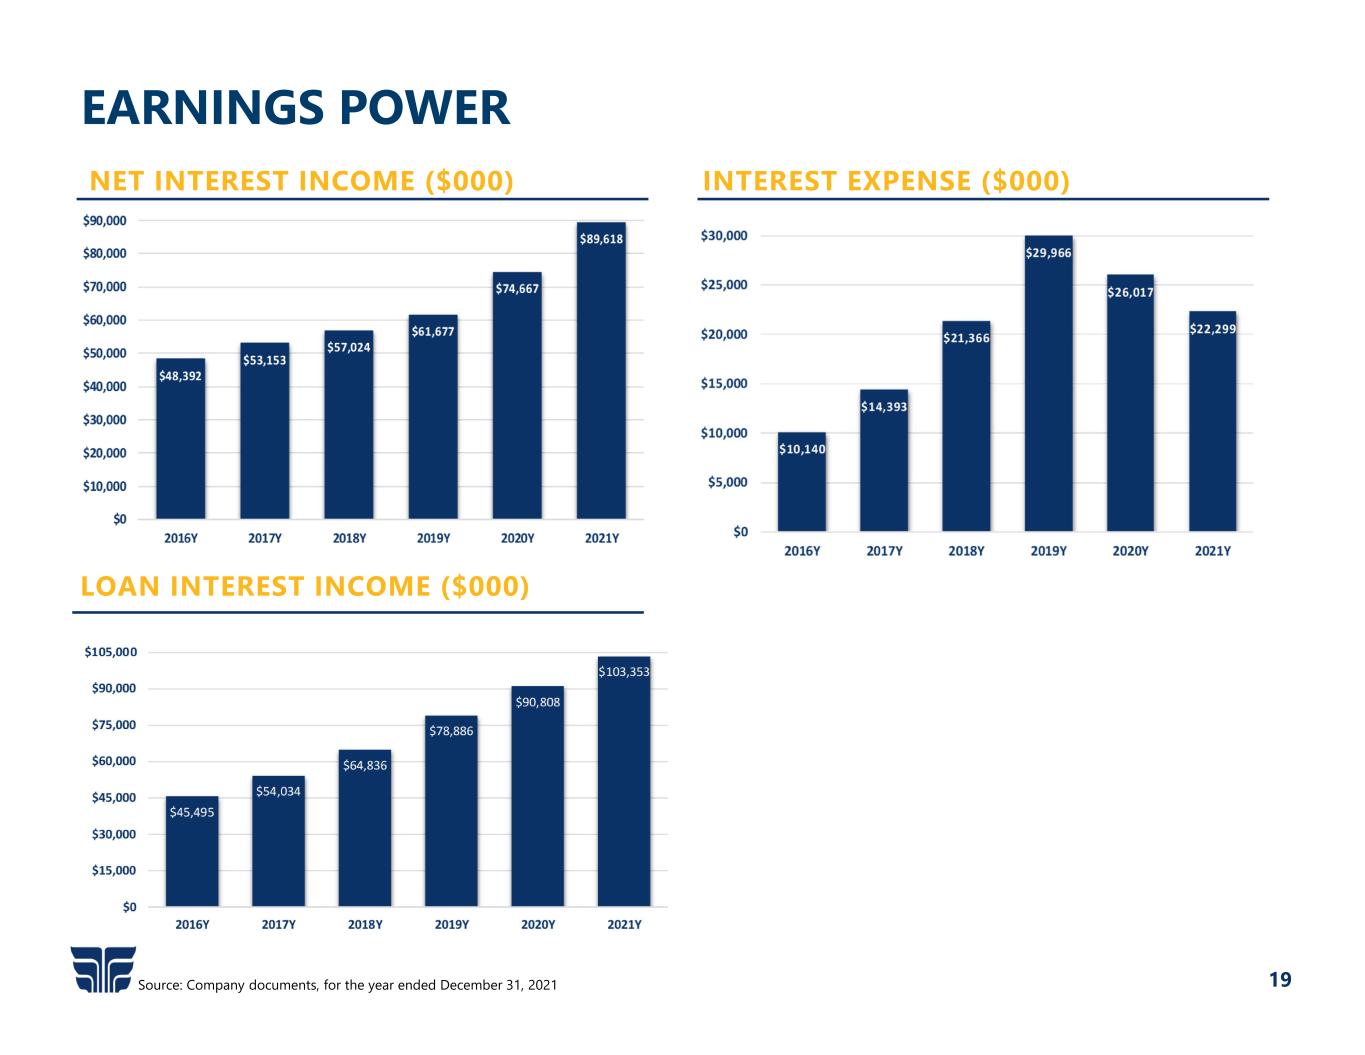
19 EARNINGS POWER NET INTEREST INCOME ($000) INTEREST EXPENSE ($000) Source: Company documents, for the year ended December 31, 2021 LOAN INTEREST INCOME ($000)

20 ($000s) 2016Y 2017Y 2018Y 2019Y 2020Y 2021Y Commercial & Industrial 193,969$ 230,638$ 200,877$ 268,256$ 353,028$ 390,405$ Non‐Farm Non‐Residential 417,014 530,293 586,263 616,536 824,137 886,407 Residential Real Estate 147,661 175,573 215,678 313,608 317,168 354,195 Consumer & Other 63,011 55,185 59,443 108,868 148,783 302,150 Agriculture & Farm 44,921 47,205 41,509 49,451 55,215 58,557 C&D 84,239 112,603 124,644 172,247 150,841 174,334 Total Gross Loans 950,815$ 1,151,497$ 1,228,414$ 1,528,966$ 1,849,172$ 2,166,048$ LESS: Unearned Income 1,894 2,483 3,146 3,476 5,037 6,689 Total Loans 948,921$ 1,149,014$ 1,225,268$ 1,525,490$ 1,844,135$ 2,159,359$ LOAN PORTFOLIO Source: Company documents, as of December 31, 2021 Closed over $1.4 billion in loans • New money $1.0 billion Loan yield of 5.13% YTD 2021 Loan growth of 17.1% during 2021 SBA/USDA lending program represents a significant opportunity for loan growth in Louisiana and Texas • Emphasis on this program has yielded strong results – $53.6 million total SBA/USDA balance as of December 31, 2021 (excluding PPP) • $35.4 million in PPP loans in the loan portfolio as of December 31, 2021 Commercial leases represent 11.8% of the loan portfolio, providing higher yields and shorter average lives than real estate secured loans • Loss rate extremely low Oil & Gas related loans made up approximately 5.2% funded and 2.4% unfunded of the total loan portfolio as of December 31, 2021 • None of the loans are exploration & production related Hotel loans totaled $182.8 million, or 8.5% of the total loan portfolio as of December 31, 2021 • All hotels flagged by major brands HIGHLIGHTS Commercial & Industrial18.0% Non‐Farm Non‐ Residential 40.9% Residential Real Estate 16.4% Consumer & Other 14.0% Agriculture & Farm 2.7% C&D 8.0% LOAN PORTFOLIO COMPOSITION 12/31/21
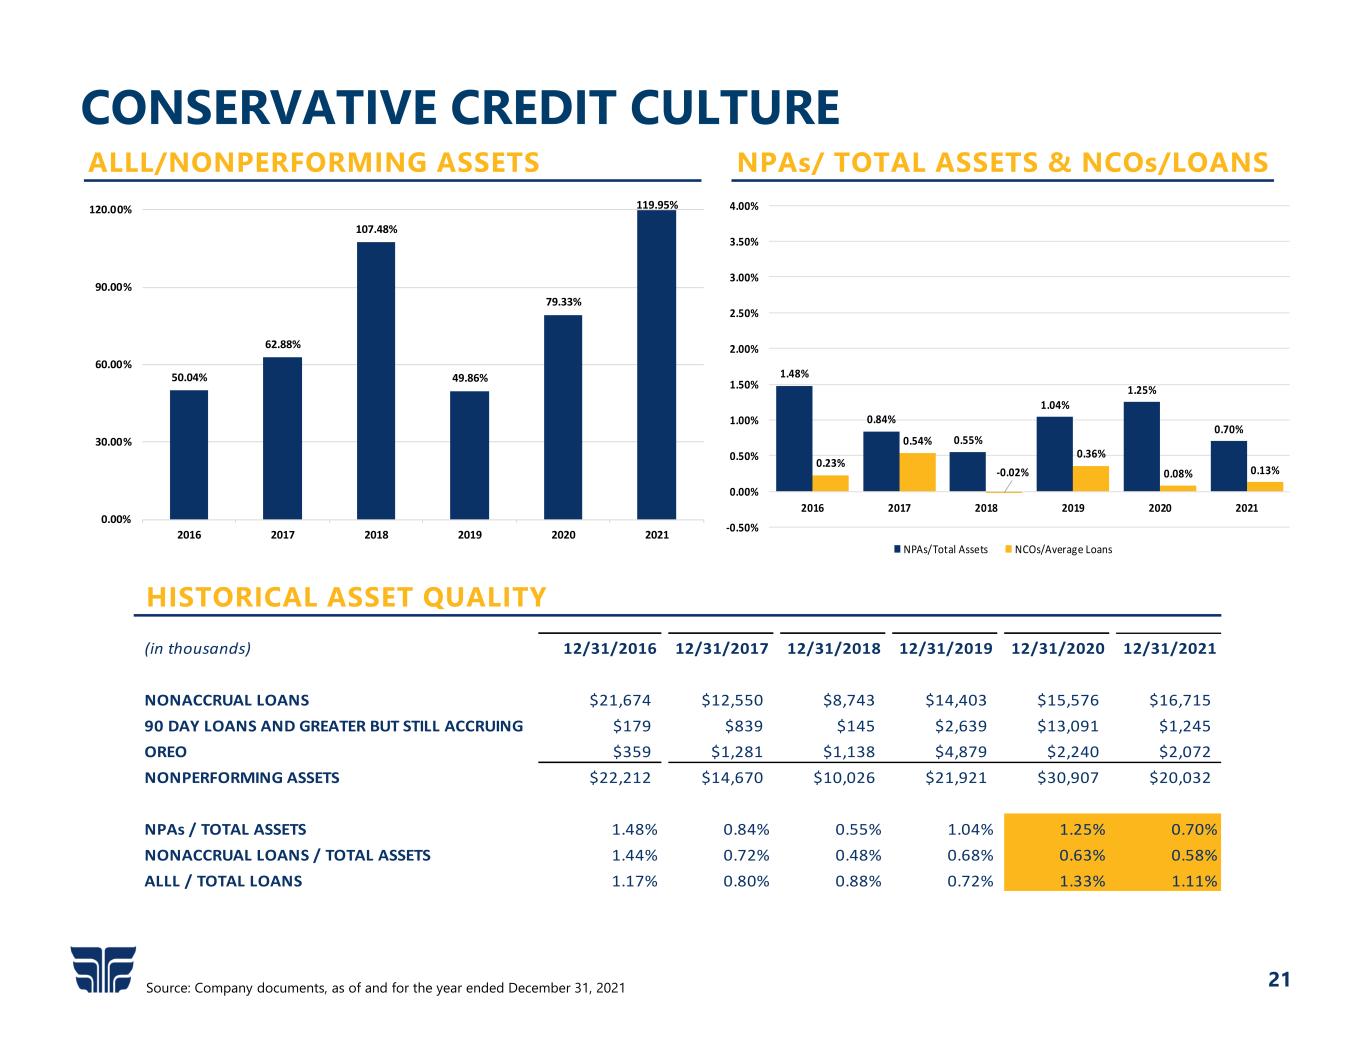
21 CONSERVATIVE CREDIT CULTURE Source: Company documents, as of and for the year ended December 31, 2021 ALLL/NONPERFORMING ASSETS HISTORICAL ASSET QUALITY NPAs/ TOTAL ASSETS & NCOs/LOANS 1.48% 0.84% 0.55% 1.04% 1.25% 0.70% 0.23% 0.54% ‐0.02% 0.36% 0.08% 0.13% ‐0.50% 0.00% 0.50% 1.00% 1.50% 2.00% 2.50% 3.00% 3.50% 4.00% 2016 2017 2018 2019 2020 2021 NPAs/Total Assets NCOs/Average Loans (in thousands) 12/31/2016 12/31/2017 12/31/2018 12/31/2019 12/31/2020 12/31/2021 NONACCRUAL LOANS $21,674 $12,550 $8,743 $14,403 $15,576 $16,715 90 DAY LOANS AND GREATER BUT STILL ACCRUING $179 $839 $145 $2,639 $13,091 $1,245 OREO $359 $1,281 $1,138 $4,879 $2,240 $2,072 NONPERFORMING ASSETS $22,212 $14,670 $10,026 $21,921 $30,907 $20,032 NPAs / TOTAL ASSETS 1.48% 0.84% 0.55% 1.04% 1.25% 0.70% NONACCRUAL LOANS / TOTAL ASSETS 1.44% 0.72% 0.48% 0.68% 0.63% 0.58% ALLL / TOTAL LOANS 1.17% 0.80% 0.88% 0.72% 1.33% 1.11% 50.04% 62.88% 107.48% 49.86% 79.33% 119.95% 0.00% 30.00% 60.00% 90.00% 120.00% 2016 2017 2018 2019 2020 2021
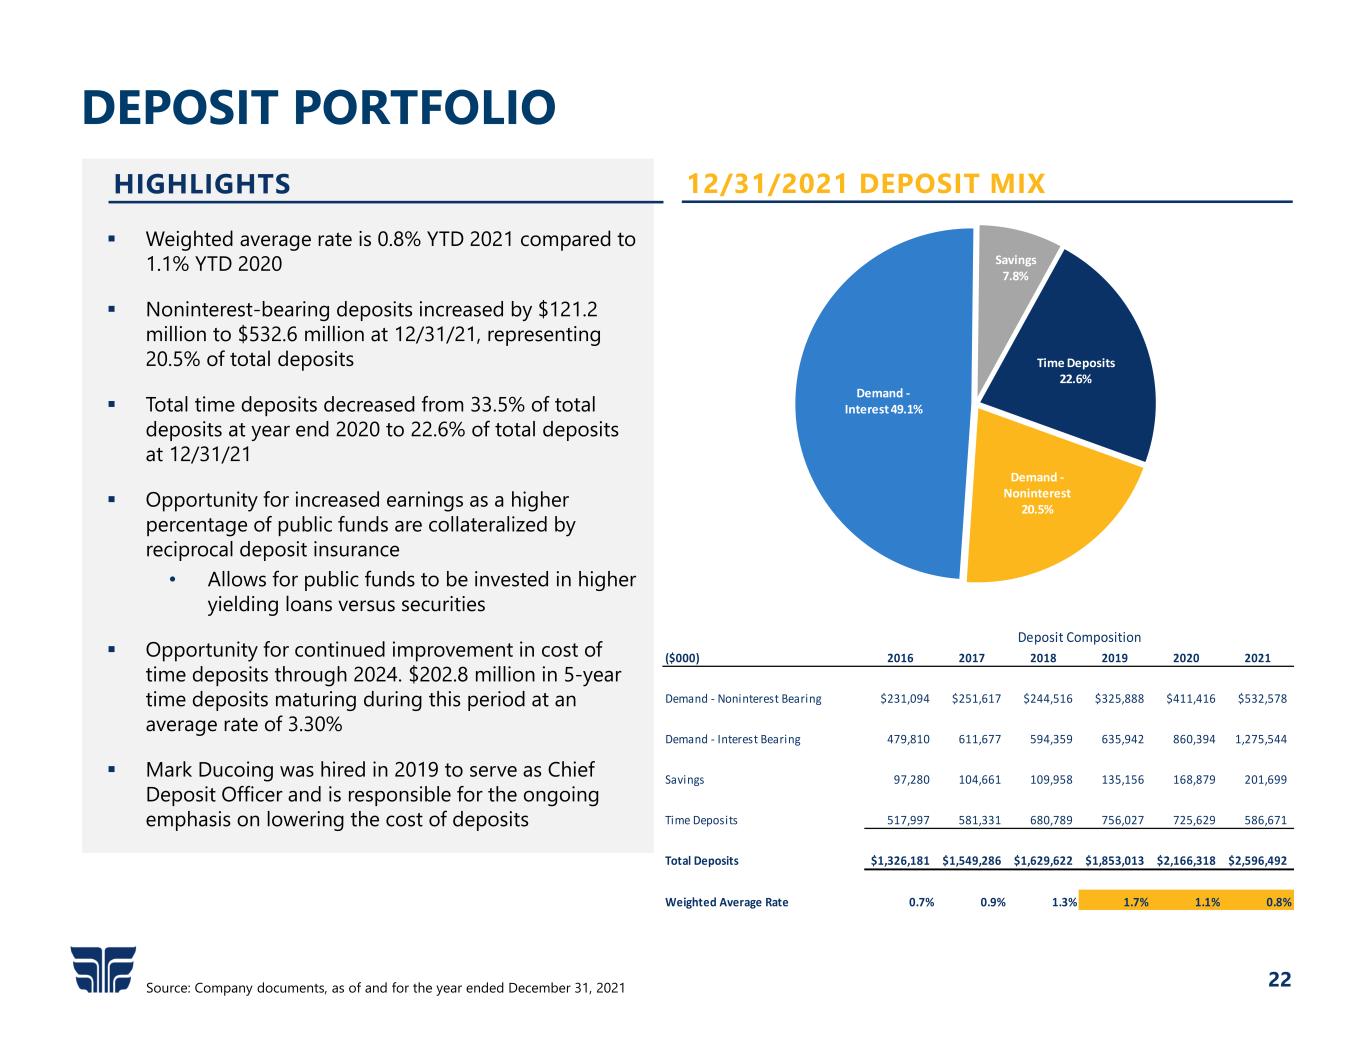
22 HIGHLIGHTS Weighted average rate is 0.8% YTD 2021 compared to 1.1% YTD 2020 Noninterest-bearing deposits increased by $121.2 million to $532.6 million at 12/31/21, representing 20.5% of total deposits Total time deposits decreased from 33.5% of total deposits at year end 2020 to 22.6% of total deposits at 12/31/21 Opportunity for increased earnings as a higher percentage of public funds are collateralized by reciprocal deposit insurance • Allows for public funds to be invested in higher yielding loans versus securities Opportunity for continued improvement in cost of time deposits through 2024. $202.8 million in 5-year time deposits maturing during this period at an average rate of 3.30% Mark Ducoing was hired in 2019 to serve as Chief Deposit Officer and is responsible for the ongoing emphasis on lowering the cost of deposits DEPOSIT PORTFOLIO Source: Company documents, as of and for the year ended December 31, 2021 12/31/2021 DEPOSIT MIX Demand ‐ Noninterest 20.5% Demand ‐ Interest49.1% Savings 7.8% Time Deposits 22.6% ($000) 2016 2017 2018 2019 2020 2021 Demand ‐ Noninterest Bearing $231,094 $251,617 $244,516 $325,888 $411,416 $532,578 Demand ‐ Interest Bearing 479,810 611,677 594,359 635,942 860,394 1,275,544 Savings 97,280 104,661 109,958 135,156 168,879 201,699 Time Deposits 517,997 581,331 680,789 756,027 725,629 586,671 Total Deposits $1,326,181 $1,549,286 $1,629,622 $1,853,013 $2,166,318 $2,596,492 Weighted Average Rate 0.7% 0.9% 1.3% 1.7% 1.1% 0.8% Deposit Composition

BIGGER | STRONGER | MORE PROFITABLE FIRST GUARANTY BANCSHARES, INC.

APPENDIX
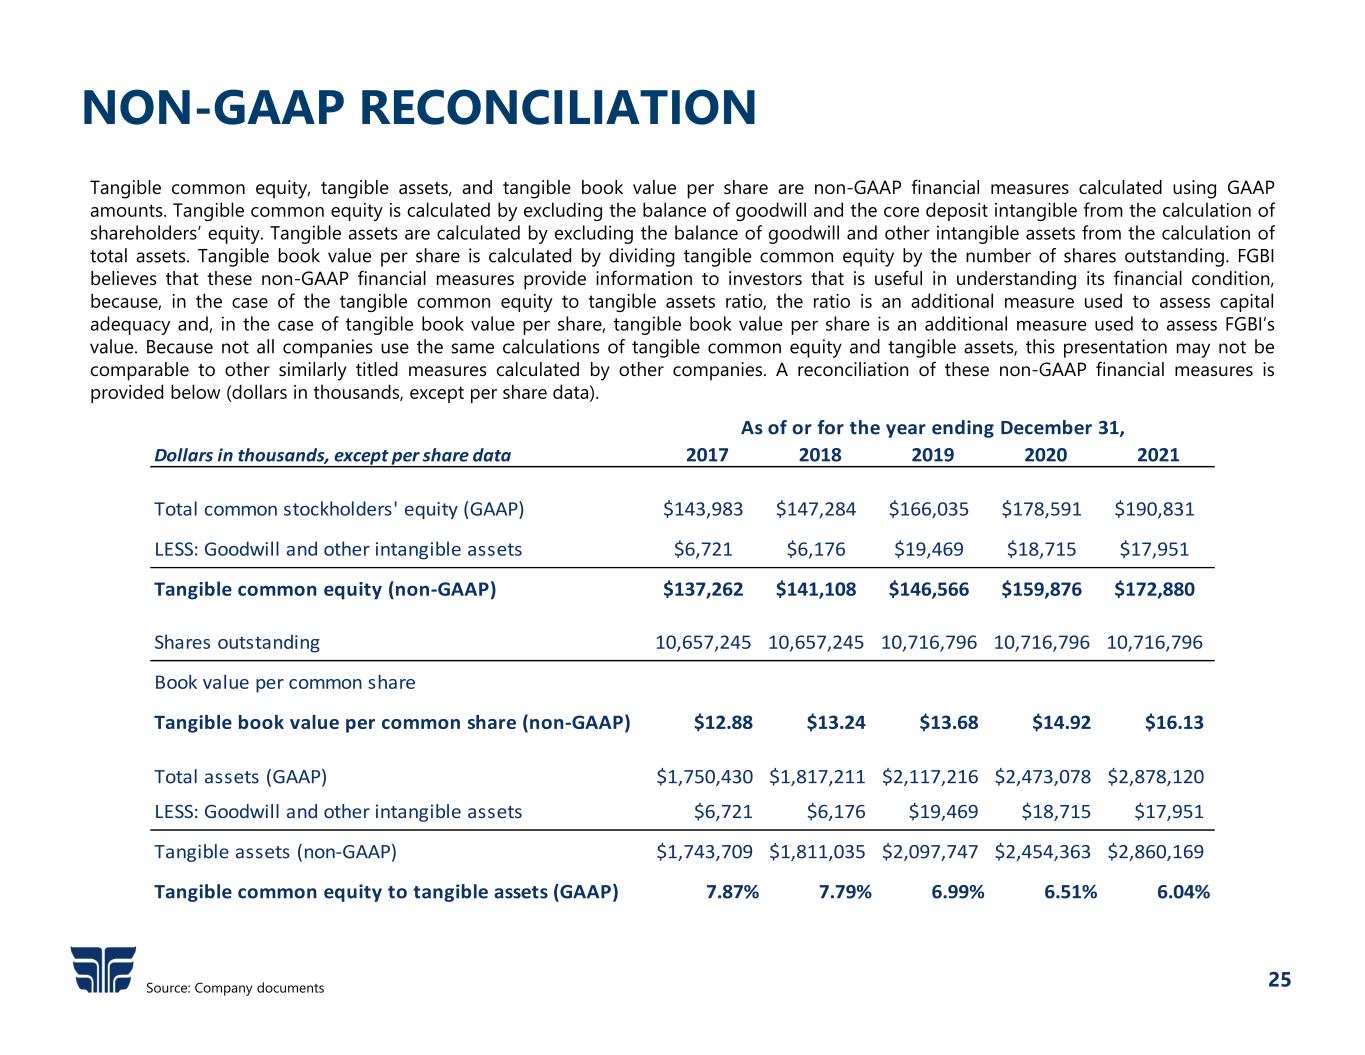
25 NON-GAAP RECONCILIATION Source: Company documents Tangible common equity, tangible assets, and tangible book value per share are non-GAAP financial measures calculated using GAAP amounts. Tangible common equity is calculated by excluding the balance of goodwill and the core deposit intangible from the calculation of shareholders’ equity. Tangible assets are calculated by excluding the balance of goodwill and other intangible assets from the calculation of total assets. Tangible book value per share is calculated by dividing tangible common equity by the number of shares outstanding. FGBI believes that these non-GAAP financial measures provide information to investors that is useful in understanding its financial condition, because, in the case of the tangible common equity to tangible assets ratio, the ratio is an additional measure used to assess capital adequacy and, in the case of tangible book value per share, tangible book value per share is an additional measure used to assess FGBI’s value. Because not all companies use the same calculations of tangible common equity and tangible assets, this presentation may not be comparable to other similarly titled measures calculated by other companies. A reconciliation of these non-GAAP financial measures is provided below (dollars in thousands, except per share data). Dollars in thousands, except per share data 2017 2018 2019 2020 2021 Total common stockholders' equity (GAAP) $143,983 $147,284 $166,035 $178,591 $190,831 LESS: Goodwill and other intangible assets $6,721 $6,176 $19,469 $18,715 $17,951 Tangible common equity (non‐GAAP) $137,262 $141,108 $146,566 $159,876 $172,880 Shares outstanding 10,657,245 10,657,245 10,716,796 10,716,796 10,716,796 Book value per common share Tangible book value per common share (non‐GAAP) $12.88 $13.24 $13.68 $14.92 $16.13 Total assets (GAAP) $1,750,430 $1,817,211 $2,117,216 $2,473,078 $2,878,120 LESS: Goodwill and other intangible assets $6,721 $6,176 $19,469 $18,715 $17,951 Tangible assets (non‐GAAP) $1,743,709 $1,811,035 $2,097,747 $2,454,363 $2,860,169 Tangible common equity to tangible assets (GAAP) 7.87% 7.79% 6.99% 6.51% 6.04% As of or for the year ending December 31,
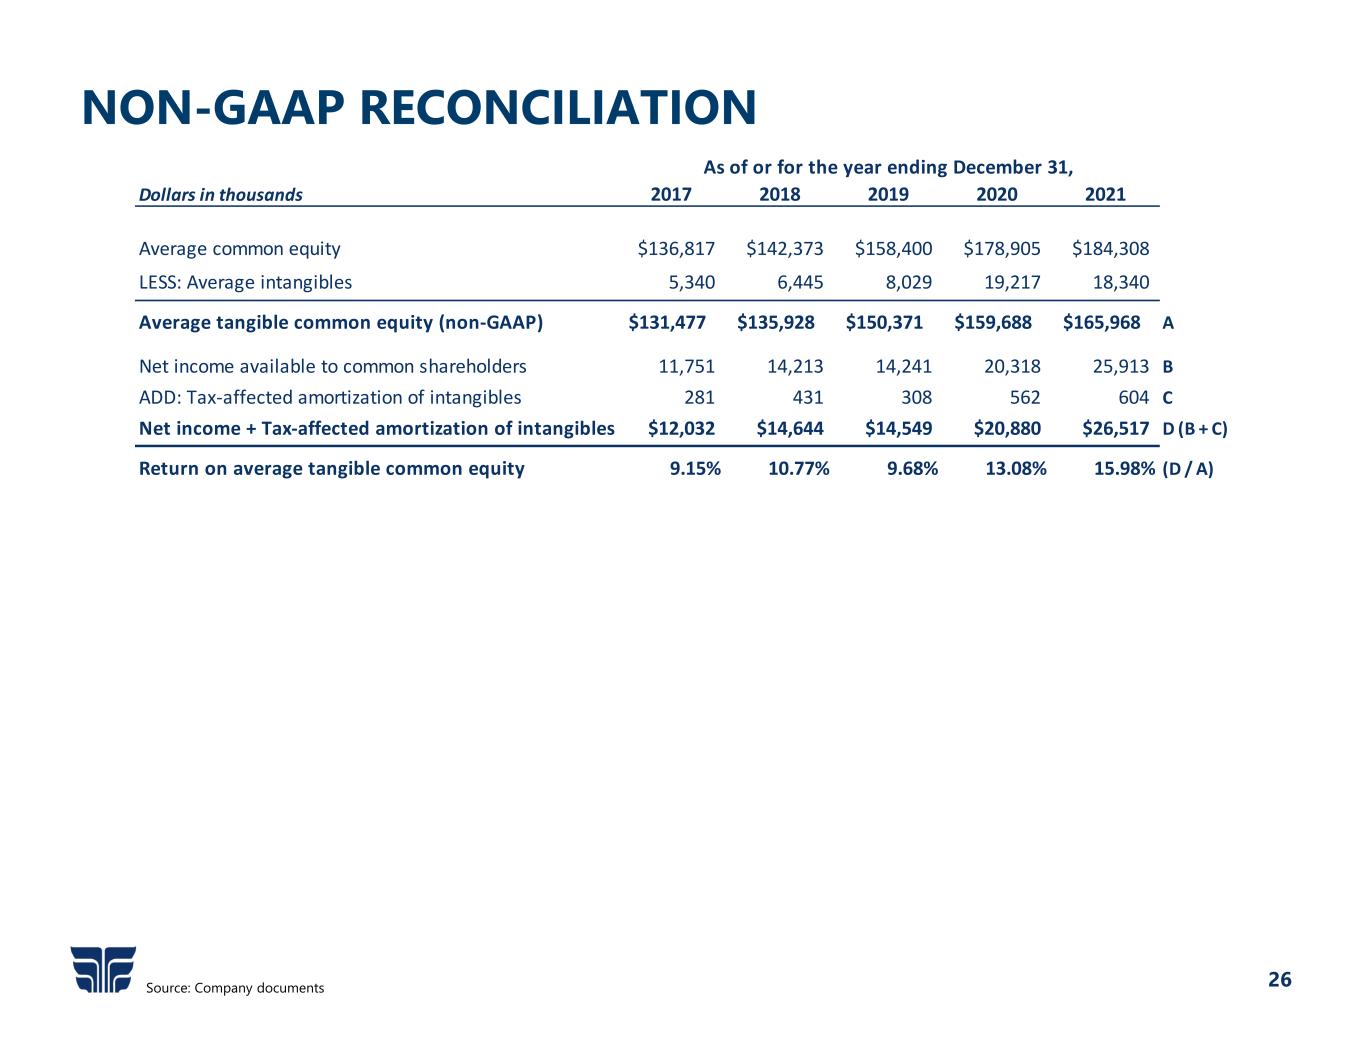
26 NON-GAAP RECONCILIATION Source: Company documents (1) Dollars in thousands 2017 2018 2019 2020 2021 Average common equity $136,817 $142,373 $158,400 $178,905 $184,308 LESS: Average intangibles 5,340 6,445 8,029 19,217 18,340 Average tangible common equity (non‐GAAP) $131,477 $135,928 $150,371 $159,688 $165,968 A Net income available to common shareholders 11,751 14,213 14,241 20,318 25,913 B ADD: Tax‐affected amortization of intangibles 281 431 308 562 604 C Net income + Tax‐affected amortization of intangibles $12,032 $14,644 $14,549 $20,880 $26,517 D (B + C) Return on average tangible common equity 9.15% 10.77% 9.68% 13.08% 15.98% (D / A) As of or for the year ending December 31,


