Washington, D.C. 20549
Form N-CSR is to be used by management investment companies to file reports with the Commission not later than 10 days after the transmission to stockholders of any report that is required to be transmitted to stockholders under Rule 30e-1 under the Investment Company Act of 1940 (17 CFR 270.30e-1). The Commission may use the information provided on Form N-CSR in its regulatory, disclosure review, inspection, and policymaking roles.
A registrant is required to disclose the information specified by Form N-CSR, and the Commission will make this information public. A registrant is not required to respond to the collection of information contained in Form N-CSR unless the Form displays a currently valid Office of Management and Budget (“OMB”) control number. Please direct comments concerning the accuracy of the information collection burden estimate and any suggestions for reducing the burden to Secretary, Securities and Exchange Commission, 450 Fifth Street, NW, Washington, DC 20549-0609. The OMB has reviewed this collection of information under the clearance requirements of 44 U.S.C. § 3507.
The Report to Shareholders is attached herewith.

ADVISORSHARES TRUST
4800 Montgomery Lane
Suite 150
Bethesda, Maryland 20814
www.advisorshares.com
1.877.843.3831
Semi-Annual Report
December 31, 2017
TABLE OF CONTENTS
Letter from the CEO of AdvisorShares Investments, LLC | | 1 |
Shareholder Expense Examples | | 4 |
Schedules of Investments | | |
AdvisorShares Cornerstone Small Cap ETF (SCAP) | | 6 |
AdvisorShares Dorsey Wright ADR ETF (AADR) | | 12 |
AdvisorShares Focused Equity ETF (CWS) | | 15 |
AdvisorShares KIM Korea Equity ETF (KOR) | | 17 |
AdvisorShares Madrona Domestic ETF (FWDD) | | 20 |
AdvisorShares Madrona Global Bond ETF (FWDB) | | 29 |
AdvisorShares Madrona International ETF (FWDI) | | 31 |
AdvisorShares Meidell Tactical Advantage ETF (MATH) | | 34 |
AdvisorShares New Tech and Media ETF (FNG) | | 35 |
AdvisorShares Newfleet Multi-Sector Income ETF (MINC) | | 37 |
AdvisorShares Pacific Asset Enhanced Floating Rate ETF (FLRT) | | 53 |
AdvisorShares Peritus High Yield ETF (HYLD) | | 59 |
AdvisorShares Ranger Equity Bear ETF (HDGE) | | 64 |
AdvisorShares Sage Core Reserves ETF (HOLD) | | 66 |
AdvisorShares STAR Global Buy-Write ETF (VEGA) | | 72 |
AdvisorShares Vice ETF (ACT) | | 73 |
AdvisorShares Wilshire Buyback ETF (TTFS) | | 74 |
Statements of Assets and Liabilities | | 78 |
Statements of Operations | | 82 |
Statements of Changes in Net Assets | | 86 |
Financial Highlights | | 94 |
Notes to Financial Statements | | 108 |
Board Review of Investment Advisory and Sub-Advisory Agreements | | 130 |
Supplemental Information | | 139 |
ADVISORSHARES TRUST
Letter from the CEO of AdvisorShares Investments, LLC
December 31, 2017 (Unaudited)
The past calendar year witnessed continued inflows into the overall ETF space as well as a reversal from the trend of outflows in actively managed mutual funds. However, those trends may seemingly underscore the robust, steady growth that continues annually in the actively managed ETF space. Every year since the inception of the actively managed ETF space, both its fund offerings and total net assets continue to climb higher. Through December 31, 2017, 205 actively managed ETFs traded on U.S. exchanges with total net assets quickly approaching $46 billion. At the end of calendar year 2016, 160 U.S.-listed actively managed ETFs traded with approximately $30 billion in total net assets.
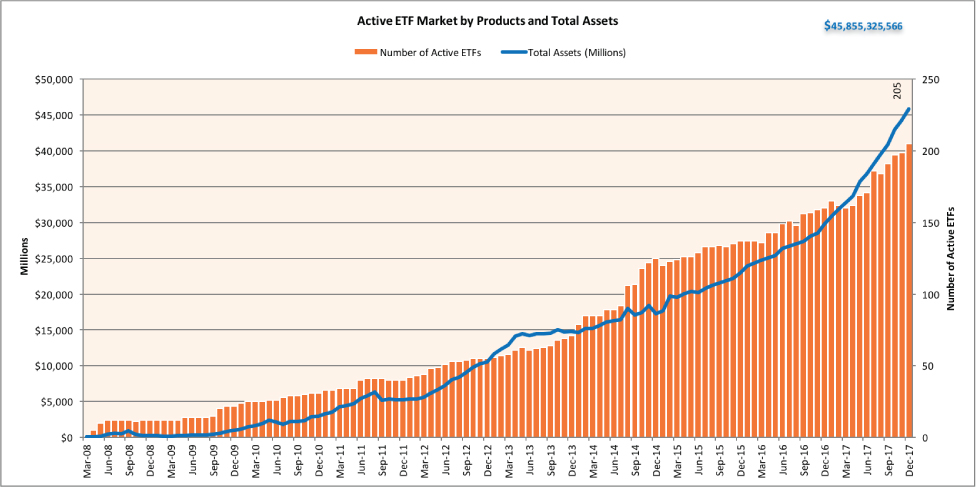
Exhibit 1
As of December 31, 2017 | Source: NYSE Euronext & AdvisorShares
The above chart displays a comprehensive snapshot of the aforementioned growth of the actively managed ETF space. A closer look at the breakdown among the 205 active ETF constituents shows that the average fund age is 2.62 years, the median fund age is 1.74 years, average assets per fund are $223.68 million and the median assets per fund are $45.26 million.
AdvisorShares remains at the forefront of the actively managed ETF space through our innovation and implementation of different investment strategies, as well as continuing to provide educational support for financial advisors and investors on all aspects of actively managed ETFs. We strive to deliver top active portfolio managers through the full transparency, intraday liquidity and remarkable operational and tax efficiencies that an ETF structure can provide. Among notable recent developments, the launch of the AdvisorShares New Tech and Media ETF (Ticker: FNG) in July 2017 certainly stood out. The ETF quickly drew the attention of investors through its unique investment objective to provide narrow and concentrated exposure to the high-performing technology and new media leaders — popularly characterized by the “FANG” stocks acronym representative of the first letters of Facebook, Amazon, Netflix and Google (now Alphabet) — that are driving growth in today’s modern economy. FNG amassed over $50 million in assets in less than six months of trading by the year’s end.
Additionally, the AdvisorShares Vice ETF (Ticker: ACT) launched in mid-December and quickly generated investor interest as the first ‘40 Act Fund to provide concentrated exposure to select companies related to alcohol, cannabis and tobacco. Dan Ahrens, who is also a managing director
1
ADVISORSHARES TRUST
Letter from the CEO of AdvisorShares Investments, LLC (continued)
and the chief operating officer of AdvisorShares, serves as the lead portfolio manager of ACT. Dan possesses extensive experience and a well-established expertise of investing in this area of the equity markets, including during his time as the original portfolio manager of the Vice Fund mutual fund and managing other well-regarded investment strategies.
While new strategies made immediate contributions to our investment line-up, we also closed the AdvisorShares Gartman Gold/Yen ETF (Ticker: GYEN) and the AdvisorShares Gartman Gold/Euro ETF (Ticker: GEUR) during October 2017. While these products delivered on their investment mandate by providing exposure to gold through both the Japanese yen and the euro, a durable investor sentiment didn’t materialize for these types of strategies in the marketplace.
Another noteworthy highlight during the previous six months came from the continued success of the AdvisorShares Dorsey Wright ADR ETF (Ticker: AADR). While compelling stories remain, and others continue to emerge across our actively managed ETF suite, AADR stands out as an industry leader — among both its ETF and mutual fund peers — with a five-star Morningstar rating for its overall, five-year and three-year risk-adjusted performance history. A surge in AADR’s assets under management allowed a significant reduction in its operating expenses as the ETF became more operationally efficient. Fast approaching $170 million in assets at 2017’s end, combined with its distinguished track record, places a spotlight on AADR heading into 2018.
2017 represented a profound year for our company, markets, our country and the world. While the fund industry evolves as well as AdvisorShares as a firm, we remain committed to transparency and providing regular updates regarding our progress to you, our shareholders. We are thankful and tremendously appreciative of your ongoing support and trust. We look forward to a bright path ahead, and wish you good health and prosperity in this new year.
Best regards,
Noah Hamman
CEO, AdvisorShares Investments
An investment in the Funds is subject to risk, including the possible loss of principal amount invested. ADRs are subject to the risk of change in political or economic conditions and exchange rates in foreign countries. Certain funds may participate in leveraged transactions to include selling securities short which creates the risk of magnified capital losses. Under certain market conditions, short sales can increase the volatility and decrease the liquidity of certain securities or positions, and may lower the Fund’s return or result in a loss. There is no guarantee that the individual Funds’ will achieve the stated investment objectives. The risks associated with each Fund include the risks associated with the underlying ETFs, which can result in higher volatility, and are detailed in each Fund’s prospectus and on each Fund’s webpage.
The views in this report were those of the Fund’s CEO as of December 31, 2017 and may not reflect his views on the date that this report is first published or anytime thereafter. These views are intended to assist shareholders in understanding their investments and do not constitute investment advice.
The Morningstar Rating™ for funds, or “star rating,” is calculated for managed products with at least a three-year history. Exchange-traded funds and open-ended mutual funds are considered a single population for comparative purposes. It is calculated based on a Morningstar Risk-Adjusted Return measure that
2
ADVISORSHARES TRUST
Letter from the CEO of AdvisorShares Investments, LLC (continued)
accounts for variation in a managed product’s monthly excess performance, placing more emphasis on downward variations and rewarding consistent performance. The top 10% of products in each product category receive five stars, the next 22.5% receive four stars, the next 35% receive three stars, the next 22.5% receive two stars, and the bottom 10% receive one star. The Overall Morningstar Rating for a managed product is derived from a weighted average of the performance figures associated with its three- and five-year Morningstar Rating metrics. The weights are: 100% three-year rating for 36-59 months of total returns, 60% five-year rating/40% three-year rating for 60-119 months of total returns.
© 2017 Morningstar, Inc. All Rights Reserved. The information contained herein: (1) is proprietary to Morningstar; (2) may not be copied or distributed; and (3) is not warranted to be accurate, complete or timely. Neither Morningstar nor its content providers are responsible for any damages or losses arising from any use of this information. Past performance is no guarantee of future results.
3
ADVISORSHARES TRUST
Shareholder Expense Examples
As a shareholder of the Fund, you incur transaction cost and ongoing costs, including management fees and other Fund expenses. The following example is intended to help you understand your ongoing costs (in dollars and cents) of investing in the Fund and to compare these costs with the ongoing costs of investing in other funds. The examples are based on an initial investment of $1,000 invested at July 1, 2017 and held for the period ended December 31, 2017, unless noted below for Funds not in operations for the full six month period.
Actual Expenses
The first line under each Fund in the table below provides information about actual account values and actual expenses. You may use the information, together with the amount you invested, to estimate the expenses that you incurred over the period. Simply divide your account value by $1,000 (for example, an $8,600 account value divided by $1,000 = 8.6), then multiply the result by the number under the heading entitled “Expenses Paid” to estimate the expenses attributable to your account during this period.
Hypothetical Example for Comparison Purposes
The second line under each Fund in the table provides information about hypothetical account values and hypothetical expenses based on the Fund’s actual expense ratio and an assumed rate of return of 5% per year before expenses, which is not the Fund’s actual return. The hypothetical account values and expenses may not be used to estimate the actual ending account balance or expenses for the period. You may use this information to compare the ongoing costs of investing in the Funds and other ETF funds. To do so, compare this 5% hypothetical example with the 5% hypothetical examples that appear in the shareholder reports of other funds.
Please note that the expenses shown in the table are meant to highlight your ongoing costs only and do not reflect any transactional costs. Therefore, the hypothetical example is useful in comparing ongoing costs only, and will not help you determine the relative total costs of owning different funds.
In addition, if these transactional costs were included, your costs would have been higher.
| | Beginning
Account Value
7/1/2017 | | Ending
Account Value
12/31/2017 | | Annualized
Expense Ratio for the Period | | |
AdvisorShares Cornerstone Small Cap ETF | | | | | | | | | | | | |
Actual | | $ | 1,000.00 | | $ | 1,107.00 | | 0.90 | % | | $ | 4.78 |
Hypothetical (assuming a 5% return before expenses) | | $ | 1,000.00 | | $ | 1,020.67 | | 0.90 | % | | $ | 4.58 |
AdvisorShares Dorsey Wright ADR ETF | | | | | | | | | | | | |
Actual | | $ | 1,000.00 | | $ | 1,263.60 | | 1.17 | % | | $ | 6.68 |
Hypothetical (assuming a 5% return before expenses) | | $ | 1,000.00 | | $ | 1,019.31 | | 1.17 | % | | $ | 5.96 |
AdvisorShares Focused Equity ETF | | | | | | | | | | | | |
Actual | | $ | 1,000.00 | | $ | 1,094.90 | | 0.70 | % | | $ | 3.70 |
Hypothetical (assuming a 5% return before expenses) | | $ | 1,000.00 | | $ | 1,021.68 | | 0.70 | % | | $ | 3.57 |
AdvisorShares KIM Korea Equity ETF | | | | | | | | | | | | |
Actual | | $ | 1,000.00 | | $ | 1,111.30 | | 0.99 | % | | $ | 5.27 |
Hypothetical (assuming a 5% return before expenses) | | $ | 1,000.00 | | $ | 1,020.21 | | 0.99 | % | | $ | 5.04 |
AdvisorShares Madrona Domestic ETF | | | | | | | | | | | | |
Actual | | $ | 1,000.00 | | $ | 1,102.00 | | 1.25 | % | | $ | 6.62 |
Hypothetical (assuming a 5% return before expenses) | | $ | 1,000.00 | | $ | 1,018.90 | | 1.25 | % | | $ | 6.36 |
4
ADVISORSHARES TRUST
Shareholder Expense Examples (continued)
| | Beginning
Account Value
7/1/2017 | | Ending
Account Value
12/31/2017 | | Annualized
Expense Ratio for the Period | | |
AdvisorShares Madrona Global Bond ETF | | | | | | | | | | | | | |
Actual | | $ | 1,000.00 | | $ | 1,024.50 | | 0.95 | % | | $ | 4.85 | |
Hypothetical (assuming a 5% return before expenses) | | $ | 1,000.00 | | $ | 1,020.42 | | 0.95 | % | | $ | 4.84 | |
AdvisorShares Madrona International ETF | | | | | | | | | | | | | |
Actual | | $ | 1,000.00 | | $ | 1,150.20 | | 1.25 | % | | $ | 6.77 | |
Hypothetical (assuming a 5% return before expenses) | | $ | 1,000.00 | | $ | 1,018.90 | | 1.25 | % | | $ | 6.36 | |
AdvisorShares Meidell Tactical Advantage ETF | | | | | | | | | | | | | |
Actual | | $ | 1,000.00 | | $ | 1,109.60 | | 1.35 | % | | $ | 7.18 | |
Hypothetical (assuming a 5% return before expenses) | | $ | 1,000.00 | | $ | 1,018.40 | | 1.35 | % | | $ | 6.87 | |
AdvisorShares New Tech and Media ETF | | | | | | | | | | | | | |
Actual | | $ | 1,000.00 | | $ | 1,071.80 | | 0.85 | % | | $ | 4.17 | (2) |
Hypothetical (assuming a 5% return before expenses) | | $ | 1,000.00 | | $ | 1,020.92 | | 0.85 | % | | $ | 4.33 | |
AdvisorShares Newfleet Multi-Sector Income ETF | | | | | | | | | | | | | |
Actual | | $ | 1,000.00 | | $ | 1,008.40 | | 0.75 | % | | $ | 3.80 | |
Hypothetical (assuming a 5% return before expenses) | | $ | 1,000.00 | | $ | 1,021.42 | | 0.75 | % | | $ | 3.82 | |
AdvisorShares Pacific Asset Enhanced Floating Rate ETF | | | | | | | | | | |
Actual | | $ | 1,000.00 | | $ | 1,010.70 | | 1.10 | % | | $ | 5.57 | |
Hypothetical (assuming a 5% return before expenses) | | $ | 1,000.00 | | $ | 1,019.66 | | 1.10 | % | | $ | 5.60 | |
AdvisorShares Peritus High Yield ETF | | | | | | | | | | | | | |
Actual | | $ | 1,000.00 | | $ | 1,041.00 | | 1.26 | % | | $ | 6.48 | |
Hypothetical (assuming a 5% return before expenses) | | $ | 1,000.00 | | $ | 1,018.85 | | 1.26 | % | | $ | 6.41 | |
AdvisorShares Ranger Equity Bear ETF | | | | | | | | | | | | | |
Actual | | $ | 1,000.00 | | $ | 918.40 | | 1.64 | % | | $ | 7.93 | |
Hypothetical (assuming a 5% return before expenses) | | $ | 1,000.00 | | $ | 1,016.94 | | 1.64 | % | | $ | 8.34 | |
AdvisorShares Sage Core Reserves ETF | | | | | | | | | | | | | |
Actual | | $ | 1,000.00 | | $ | 1,005.80 | | 0.35 | % | | $ | 1.77 | |
Hypothetical (assuming a 5% return before expenses) | | $ | 1,000.00 | | $ | 1,023.44 | | 0.35 | % | | $ | 1.79 | |
AdvisorShares STAR Global Buy-Write ETF | | | | | | | | | | | | | |
Actual | | $ | 1,000.00 | | $ | 1,058.50 | | 1.85 | % | | $ | 9.60 | |
Hypothetical (assuming a 5% return before expenses) | | $ | 1,000.00 | | $ | 1,015.88 | | 1.85 | % | | $ | 9.40 | |
AdvisorShares Vice ETF | | | | | | | | | | | | | |
Actual | | $ | 1,000.00 | | $ | 1,048.00 | | 0.75 | % | | $ | 0.40 | (3) |
Hypothetical (assuming a 5% return before expenses) | | $ | 1,000.00 | | $ | 1,021.42 | | 0.75 | % | | $ | 3.82 | |
AdvisorShares Wilshire Buyback ETF | | | | | | | | | | | | | |
Actual | | $ | 1,000.00 | | $ | 1,082.70 | | 0.90 | % | | $ | 4.72 | |
Hypothetical (assuming a 5% return before expenses) | | $ | 1,000.00 | | $ | 1,020.67 | | 0.90 | % | | $ | 4.58 | |
5
ADVISORSHARES CORNERSTONE SMALL CAP ETF
Schedule of Investments
December 31, 2017 (Unaudited)
| | | | |
COMMON STOCKS — 99.8% | | | | | |
| | | | | |
Aerospace/Defense — 0.5% | | | | | |
Aerovironment, Inc.* | | 405 | | $ | 22,745 |
| | | | | |
Airlines — 1.2% | | | | | |
SkyWest, Inc. | | 1,046 | | | 55,543 |
| | | | | |
Auto Parts & Equipment — 1.1% |
China Yuchai International Ltd. (China) | | 656 | | | 15,744 |
Cooper Tire & Rubber Co.(a) | | 447 | | | 15,801 |
Modine Manufacturing Co.* | | 1,019 | | | 20,584 |
Total Auto Parts & Equipment | | | | | 52,129 |
| | | | | |
Banks — 4.5% | | | | | |
Blue Hills Bancorp, Inc. | | 821 | | | 16,502 |
Central Pacific Financial Corp. | | 566 | | | 16,884 |
CVB Financial Corp. | | 691 | | | 16,280 |
Eagle Bancorp, Inc.* | | 549 | | | 31,787 |
First Bancorp/Southern Pines NC | | 523 | | | 18,467 |
First Commonwealth Financial Corp. | | 1,273 | | | 18,229 |
First Mid-Illinois Bancshares, Inc. | | 426 | | | 16,418 |
Fulton Financial Corp. | | 813 | | | 14,553 |
Heritage Commerce Corp. | | 1,154 | | | 17,679 |
Old Second Bancorp, Inc. | | 1,290 | | | 17,609 |
TriState Capital Holdings, Inc.* | | 1,094 | | | 25,162 |
Total Banks | | | | | 209,570 |
| | | | | |
Beverages — 0.2% | | | | | |
Boston Beer Co., Inc. (The), Class A*(a) | | 59 | | | 11,275 |
| | | | | |
Biotechnology — 0.8% | | | | | |
BioCryst Pharmaceuticals, Inc.*(a) | | 2,002 | | | 9,830 |
Enzo Biochem, Inc.* | | 1,496 | | | 12,192 |
PDL BioPharma, Inc.* | | 6,084 | | | 16,670 |
Total Biotechnology | | | | | 38,692 |
| | | | | |
Building Materials — 0.5% | | | | | |
American Woodmark Corp.* | | 194 | | | 25,269 |
| | | | | |
Chemicals — 1.6% | | | | | |
Balchem Corp. | | 189 | | | 15,233 |
Innospec, Inc. | | 221 | | | 15,602 |
Koppers Holdings, Inc.* | | 364 | | | 18,528 |
Kronos Worldwide, Inc. | | 1,040 | | | 26,801 |
Total Chemicals | | | | | 76,164 |
| | | | | |
Coal — 0.3% | | | | | |
Alliance Holdings GP LP | | 564 | | | 15,110 |
| | | | | |
Commercial Services — 6.6% | | | | | |
ABM Industries, Inc. | | 334 | | | 12,598 |
| | | | |
COMMON STOCKS (continued) |
| | | | | |
Commercial Services (continued) |
Adtalem Global Education, Inc.*(a) | | 280 | | $ | 11,774 |
Care.com, Inc.* | | 914 | | | 16,488 |
Career Education Corp.* | | 1,294 | | | 15,631 |
Deluxe Corp. | | 259 | | | 19,901 |
Green Dot Corp., Class A* | | 496 | | | 29,889 |
HealthEquity, Inc.*(a) | | 372 | | | 17,357 |
Insperity, Inc. | | 776 | | | 44,504 |
K12, Inc.* | | 693 | | | 11,019 |
Kelly Services, Inc., Class A | | 636 | | | 17,344 |
Nutrisystem, Inc.(a) | | 308 | | | 16,201 |
On Assignment, Inc.* | | 307 | | | 19,731 |
Paylocity Holding Corp.* | | 441 | | | 20,798 |
Quad/Graphics, Inc.(a) | | 658 | | | 14,871 |
Textainer Group Holdings Ltd.* | | 1,014 | | | 21,801 |
Weight Watchers International, Inc.* | | 420 | | | 18,598 |
Total Commercial Services | | | | | 308,505 |
| | | | | |
Computers — 3.7% | | | | | |
Carbonite, Inc.*(a) | | 1,071 | | | 26,882 |
Engility Holdings, Inc.* | | 380 | | | 10,781 |
Insight Enterprises, Inc.* | | 451 | | | 17,269 |
Qualys, Inc.* | | 351 | | | 20,832 |
Stratasys Ltd.*(a) | | 699 | | | 13,952 |
Varonis Systems, Inc.* | | 513 | | | 24,906 |
Vocera Communications, Inc.* | | 1,078 | | | 32,577 |
WNS Holdings Ltd. (India)*(b) | | 604 | | | 24,238 |
Total Computers | | | | | 171,437 |
|
Distribution/Wholesale — 1.6% |
G-III Apparel Group Ltd.* | | 663 | | | 24,458 |
Systemax, Inc. | | 888 | | | 29,544 |
Triton International Limited (Bermuda)* | | 489 | | | 18,313 |
Total Distribution/Wholesale | | | | | 72,315 |
| | | | | |
Diversified Financial Services — 0.8% |
Noah Holdings Ltd. (China)*(b) | | 421 | | | 19,484 |
WageWorks, Inc.* | | 318 | | | 19,716 |
Total Diversified Financial Services | | | | | 39,200 |
| | | | | |
Electronics — 4.7% | | | | | |
Applied Optoelectronics, Inc.*(a) | | 293 | | | 11,081 |
Brady Corp., Class A | | 453 | | | 17,169 |
Control4 Corp.* | | 1,100 | | | 32,736 |
CTS Corp. | | 798 | | | 20,548 |
Electro Scientific Industries, Inc.* | | 643 | | | 13,780 |
See accompanying Notes to Financial Statements.
6
ADVISORSHARES CORNERSTONE SMALL CAP ETF
Schedule of Investments (continued)
December 31, 2017 (Unaudited)
| | | | |
COMMON STOCKS (continued) |
| | | | | |
Electronics (continued) | | | | | |
FARO Technologies, Inc.* | | 323 | | $ | 15,181 |
Fitbit, Inc., Class A*(a) | | 3,028 | | | 17,290 |
GoPro, Inc., Class A*(a) | | 1,893 | | | 14,330 |
KEMET Corp.*(a) | | 1,070 | | | 16,114 |
Rogers Corp.* | | 105 | | | 17,002 |
Stoneridge, Inc.* | | 992 | | | 22,677 |
Vishay Intertechnology, Inc. | | 872 | | | 18,094 |
Total Electronics | | | | | 216,002 |
|
Energy – Alternate Sources — 1.1% |
Green Plains, Inc. | | 1,118 | | | 18,838 |
Sunrun, Inc.*(a) | | 2,971 | | | 17,529 |
TPI Composites, Inc.*(a) | | 800 | | | 16,368 |
Total Energy – Alternate Sources | | | | | 52,735 |
| | | | | |
Engineering & Construction — 0.9% |
Argan, Inc. | | 457 | | | 20,565 |
Exponent, Inc. | | 280 | | | 19,908 |
Total Engineering & Construction | | | | | 40,473 |
| | | | | |
Entertainment — 2.0% | | | | | |
Churchill Downs, Inc. | | 140 | | | 32,578 |
Marriott Vacations Worldwide Corp. | | 280 | | | 37,859 |
Penn National Gaming, Inc.* | | 733 | | | 22,965 |
Total Entertainment | | | | | 93,402 |
| | | | | |
Environmental Control — 0.8% |
Casella Waste Systems, Inc., Class A* | | 1,644 | | | 37,845 |
| | | | | |
Food — 1.7% | | | | | |
Fresh Del Monte Produce, Inc. | | 390 | | | 18,591 |
Sanderson Farms, Inc.(a) | | 178 | | | 24,703 |
SpartanNash Co. | | 539 | | | 14,381 |
Sprouts Farmers Market, Inc.* | | 803 | | | 19,553 |
Total Food | | | | | 77,228 |
| | | | | |
Forest Products & Paper — 0.5% |
Resolute Forest Products, Inc.* | | 1,943 | | | 21,470 |
| | | | | |
Hand/Machine Tools — 0.5% |
Kennametal, Inc. | | 496 | | | 24,011 |
| | | | | |
Healthcare – Products — 6.3% |
AngioDynamics, Inc.* | | 914 | | | 15,200 |
Cardiovascular Systems, Inc.* | | 684 | | | 16,204 |
Cutera, Inc.* | | 455 | | | 20,634 |
Halyard Health, Inc.* | | 368 | | | 16,994 |
| | | | |
COMMON STOCKS (continued) |
| | | | | |
Healthcare – Products (continued) |
Inogen, Inc.* | | 270 | | $ | 32,152 |
LeMaitre Vascular, Inc. | | 825 | | | 26,268 |
LivaNova PLC* | | 210 | | | 16,783 |
Luminex Corp. | | 651 | | | 12,825 |
Merit Medical Systems, Inc.* | | 846 | | | 36,547 |
MiMedx Group, Inc.*(a) | | 1,625 | | | 20,491 |
OraSure Technologies, Inc.* | | 1,537 | | | 28,988 |
Penumbra, Inc.*(a) | | 165 | | | 15,526 |
Repligen Corp.*(a) | | 363 | | | 13,170 |
Tactile Systems Technology, Inc.*(a) | | 662 | | | 19,185 |
Total Healthcare – Products | | | | | 290,967 |
| | | | | |
Healthcare – Services — 0.8% | | | | | |
Tivity Health, Inc.*(a) | | 582 | | | 21,272 |
Triple-S Management Corp., Class B (Puerto Rico)* | | 677 | | | 16,824 |
Total Healthcare – Services | | | | | 38,096 |
| | | | | |
Home Furnishings — 0.7% | | | | | |
iRobot Corp.*(a) | | 399 | | | 30,603 |
| | | | | |
Household Products/Wares — 1.5% |
ACCO Brands Corp.* | | 1,208 | | | 14,738 |
Central Garden & Pet Co.*(a) | | 706 | | | 27,477 |
SodaStream International Ltd. (Israel)* | | 409 | | | 28,769 |
Total Household Products/Wares | | | | | 70,984 |
| | | | | |
Insurance — 2.0% | | | | | |
Fanhua, Inc. (China)(a)(b) | | 1,595 | | | 34,484 |
Horace Mann Educators Corp. | | 372 | | | 16,405 |
Kemper Corp. | | 328 | | | 22,599 |
NMI Holdings, Inc., Class A* | | 1,069 | | | 18,173 |
Total Insurance | | | | | 91,661 |
| | | | | |
Internet — 4.2% | | | | | |
Blucora, Inc.* | | 690 | | | 15,249 |
FireEye, Inc.*(a) | | 1,152 | | | 16,358 |
HealthStream, Inc.* | | 687 | | | 15,911 |
Imperva, Inc.* | | 358 | | | 14,213 |
Limelight Networks, Inc.* | | 4,649 | | | 20,502 |
NIC, Inc.(a) | | 1,100 | | | 18,260 |
Q2 Holdings, Inc.* | | 400 | | | 14,740 |
Rapid7, Inc.* | | 1,154 | | | 21,534 |
RingCentral, Inc., Class A* | | 420 | | | 20,328 |
TrueCar, Inc.*(a) | | 764 | | | 8,557 |
VASCO Data Security International, Inc.* | | 1,017 | | | 14,136 |
XO Group, Inc.* | | 877 | | | 16,189 |
Total Internet | | | | | 195,977 |
See accompanying Notes to Financial Statements.
7
ADVISORSHARES CORNERSTONE SMALL CAP ETF
Schedule of Investments (continued)
December 31, 2017 (Unaudited)
| | | | |
COMMON STOCKS (continued) |
| | | | | |
Iron/Steel — 0.5% | | | | | |
Schnitzer Steel Industries, Inc., Class A | | 746 | | $ | 24,991 |
| | | | | |
Leisure Time — 1.9% | | | | | |
Callaway Golf Co.(a) | | 1,116 | | | 15,546 |
Fox Factory Holding Corp.* | | 616 | | | 23,931 |
Johnson Outdoors, Inc., Class A | | 319 | | | 19,807 |
LCI Industries(a) | | 210 | | | 27,300 |
Total Leisure Time | | | | | 86,584 |
| | | | | |
Lodging — 0.8% | | | | | |
Marcus Corp. (The) | | 428 | | | 11,706 |
Monarch Casino & Resort, Inc.* | | 550 | | | 24,651 |
Total Lodging | | | | | 36,357 |
| | | | | |
Machinery – Diversified — 1.4% |
Alamo Group, Inc. | | 221 | | | 24,944 |
Chart Industries, Inc.* | | 458 | | | 21,462 |
Kadant, Inc. | | 165 | | | 16,566 |
Total Machinery – Diversified | | | | | 62,972 |
| | | | | |
Media — 0.6% | | | | | |
New York Times Co. (The), Class A | | 818 | | | 15,133 |
TiVo Corp. | | 822 | | | 12,823 |
Total Media | | | | | 27,956 |
| | | | | |
Mining — 1.3% | | | | | |
Fairmount Santrol Holdings, Inc.*(a) | | 2,345 | | | 12,265 |
Ferroglobe PLC* | | 1,210 | | | 19,602 |
Materion Corp. | | 343 | | | 16,670 |
US Silica Holdings, Inc. | | 372 | | | 12,112 |
Total Mining | | | | | 60,649 |
| | | | | |
Miscellaneous Manufacturing — 2.1% |
EnPro Industries, Inc. | | 212 | | | 19,824 |
Harsco Corp.* | | 1,311 | | | 24,450 |
John Bean Technologies Corp. | | 351 | | | 38,891 |
Sturm Ruger & Co., Inc.(a) | | 211 | | | 11,784 |
Total Miscellaneous Manufacturing | | | | | 94,949 |
| | | | | |
Office Furnishings — 0.4% | | | | | |
Herman Miller, Inc. | | 399 | | | 15,980 |
| | | | | |
Oil & Gas — 3.1% | | | | | |
CVR Energy, Inc.(a) | | 564 | | | 21,003 |
Delek US Holdings, Inc. | | 566 | | | 19,776 |
Denbury Resources, Inc.* | | 10,307 | | | 22,779 |
| | | | |
COMMON STOCKS (continued) |
| | | | | |
Oil & Gas (continued) | | | | | |
Oasis Petroleum, Inc.* | | 1,818 | | $ | 15,289 |
PBF Energy, Inc., Class A(a) | | 556 | | | 19,710 |
PDC Energy, Inc.*(a) | | 266 | | | 13,710 |
Penn Virginia Corp.* | | 305 | | | 11,929 |
QEP Resources, Inc.* | | 1,985 | | | 18,996 |
Total Oil & Gas | | | | | 143,192 |
| | | | | |
Oil & Gas Services — 2.0% | | | | | |
Dril-Quip, Inc.*(a) | | 392 | | | 18,698 |
Exterran Corp.* | | 598 | | | 18,801 |
Matrix Service Co.* | | 1,057 | | | 18,815 |
McDermott International, Inc.* | | 2,668 | | | 17,556 |
TETRA Technologies, Inc.* | | 4,437 | | | 18,946 |
Total Oil & Gas Services | | | | | 92,816 |
| | | | | |
Packaging & Containers — 0.5% |
Greif, Inc., Class A | | 388 | | | 23,505 |
| | | | | |
Pharmaceuticals — 2.7% | | | | | |
Amphastar Pharmaceuticals, Inc.*(a) | | 994 | | | 19,125 |
Anika Therapeutics, Inc.*(a) | | 340 | | | 18,329 |
Corcept Therapeutics, Inc.*(a) | | 1,113 | | | 20,101 |
Diplomat Pharmacy, Inc.*(a) | | 968 | | | 19,428 |
Enanta Pharmaceuticals, Inc.* | | 419 | | | 24,587 |
Heska Corp.*(a) | | 135 | | | 10,828 |
Xencor, Inc.*(a) | | 648 | | | 14,204 |
Total Pharmaceuticals | | | | | 126,602 |
| | | | | |
Pipelines — 0.4% | | | | | |
Summit Midstream Partners LP | | 963 | | | 19,742 |
| | | | | |
Private Equity — 0.2% | | | | | |
Kennedy-Wilson Holdings, Inc. | | 541 | | | 9,386 |
| | | | | |
Real Estate — 0.4% | | | | | |
HFF, Inc., Class A | | 410 | | | 19,942 |
| | | | | |
REITS — 5.5% | | | | | |
Acadia Realty Trust | | 603 | | | 16,498 |
AG Mortgage Investment Trust, Inc. | | 925 | | | 17,584 |
Agree Realty Corp.(a) | | 399 | | | 20,525 |
Chatham Lodging Trust | | 784 | | | 17,844 |
Corporate Office Properties Trust | | 499 | | | 14,571 |
EastGroup Properties, Inc. | | 210 | | | 18,560 |
First Industrial Realty Trust, Inc. | | 568 | | | 17,875 |
iStar, Inc.* | | 1,283 | | | 14,498 |
LaSalle Hotel Properties | | 546 | | | 15,326 |
National Health Investors, Inc. | | 157 | | | 11,835 |
See accompanying Notes to Financial Statements.
8
ADVISORSHARES CORNERSTONE SMALL CAP ETF
Schedule of Investments (continued)
December 31, 2017 (Unaudited)
| | | | |
COMMON STOCKS (continued) |
| | | | | |
REITS (continued) | | | | | |
NexPoint Residential Trust, Inc. | | 590 | | $ | 16,485 |
Potlatch Corp. | | 296 | | | 14,770 |
Ramco-Gershenson Properties Trust | | 662 | | | 9,751 |
Rexford Industrial Realty, Inc. | | 540 | | | 15,746 |
STAG Industrial, Inc. | | 548 | | | 14,977 |
Tier REIT, Inc. | | 865 | | | 17,637 |
Total REITS | | | | | 254,482 |
| | | | | |
Retail — 4.9% | | | | | |
Abercrombie & Fitch Co., Class A | | 1,068 | | | 18,615 |
Barnes & Noble, Inc. | | 2,042 | | | 13,681 |
Bassett Furniture Industries, Inc. | | 441 | | | 16,582 |
Children’s Place, Inc. (The)(a) | | 145 | | | 21,076 |
Conn’s, Inc., 12/31/99*(a) | | 620 | | | 22,041 |
Guess?, Inc. | | 1,291 | | | 21,792 |
Movado Group, Inc.(a) | | 622 | | | 20,028 |
Ollie’s Bargain Outlet Holdings, Inc.*(a) | | 351 | | | 18,691 |
PetMed Express, Inc.(a) | | 398 | | | 18,109 |
Rite Aid Corp.* | | 10,707 | | | 21,093 |
Wingstop, Inc. | | 475 | | | 18,515 |
Zumiez, Inc.*(a) | | 926 | | | 19,284 |
Total Retail | | | | | 229,507 |
| | | | | |
Savings & Loans — 1.6% | | | | | |
Flagstar Bancorp, Inc.*(a) | | 539 | | | 20,170 |
Meridian Bancorp, Inc. | | 892 | | | 18,375 |
Northfield Bancorp, Inc. | | 938 | | | 16,021 |
OceanFirst Financial Corp. | | 740 | | | 19,425 |
Total Savings & Loans | | | | | 73,991 |
| | | | | |
Semiconductors — 5.4% | | | | | |
AXT, Inc.*(a) | | 2,181 | | | 18,975 |
Brooks Automation, Inc. | | 792 | | | 18,889 |
CEVA, Inc.* | | 625 | | | 28,844 |
Cohu, Inc. | | 949 | | | 20,831 |
Diodes, Inc.* | | 605 | | | 17,345 |
FormFactor, Inc.* | | 1,332 | | | 20,846 |
Kulicke & Soffa Industries, Inc. (Singapore)* | | 846 | | | 20,587 |
MaxLinear, Inc.*(a) | | 1,175 | | | 31,044 |
Nanometrics, Inc.* | | 558 | | | 13,905 |
Power Integrations, Inc. | | 247 | | | 18,167 |
| | | | |
COMMON STOCKS (continued) |
| | | | | |
Semiconductors (continued) | | | | | |
Rambus, Inc.* | | 1,260 | | $ | 17,917 |
Ultra Clean Holdings, Inc.*(a) | | 1,070 | | | 24,706 |
Total Semiconductors | | | | | 252,056 |
| | | | | |
Software — 8.6% | | | | | |
2U, Inc.*(a) | | 254 | | | 16,386 |
Actua Corp.* | | 1,267 | | | 19,765 |
Appfolio, Inc., Class A* | | 647 | | | 26,850 |
Apptio, Inc., Class A* | | 793 | | | 18,651 |
Bazaarvoice, Inc.* | | 3,123 | | | 17,020 |
Blackline, Inc.*(a) | | 395 | | | 12,956 |
Callidus Software, Inc.* | | 578 | | | 16,560 |
CyberArk Software Ltd. (Israel)* | | 361 | | | 14,942 |
Ebix, Inc.(a) | | 458 | | | 36,296 |
Everbridge, Inc.* | | 689 | | | 20,477 |
Five9, Inc.* | | 649 | | | 16,147 |
Glu Mobile, Inc.* | | 4,701 | | | 17,112 |
HubSpot, Inc.*(a) | | 247 | | | 21,835 |
MINDBODY, Inc., Class A* | | 857 | | | 26,096 |
New Relic, Inc.* | | 335 | | | 19,353 |
Progress Software Corp. | | 482 | | | 20,519 |
Radware Ltd. (Israel)* | | 837 | | | 16,238 |
Ribbon Communications, Inc.* | | 1,844 | | | 14,254 |
SPS Commerce, Inc.* | | 232 | | | 11,273 |
Twilio, Inc., Class A*(a) | | 525 | | | 12,390 |
Zynga, Inc., Class A* | | 5,972 | | | 23,888 |
Total Software | | | | | 399,008 |
| | | | | |
Telecommunications — 3.1% | | | | | |
A10 Networks, Inc.*(a) | | 2,117 | | | 16,343 |
ADTRAN, Inc. | | 739 | | | 14,300 |
Cincinnati Bell, Inc.* | | 810 | | | 16,888 |
Comtech Telecommunications Corp. | | 1,014 | | | 22,430 |
InterDigital, Inc./Pa | | 240 | | | 18,276 |
Iridium Communications, Inc.*(a) | | 1,267 | | | 14,951 |
NETGEAR, Inc.* | | 343 | | | 20,151 |
Vonage Holdings Corp.* | | 1,781 | | | 18,113 |
Total Telecommunications | | | | | 141,452 |
| | | | | |
Textiles — 0.4% | | | | | |
UniFirst Corp. | | 108 | | | 17,809 |
See accompanying Notes to Financial Statements.
9
ADVISORSHARES CORNERSTONE SMALL CAP ETF
Schedule of Investments (continued)
December 31, 2017 (Unaudited)
| | | | |
COMMON STOCKS (continued) |
| | | | | | |
Transportation — 0.4% | | | | | | |
Echo Global Logistics, Inc.* | | 690 | | $ | 19,320 | |
| | | | | | |
Trucking & Leasing — 0.5% | | | | | | |
GATX Corp.(a) | | 189 | | | 11,748 | |
Greenbrier Cos., Inc. (The)(a) | | 237 | | | 12,632 | |
Total Trucking & Leasing | | | | | 24,380 | |
Total Common Stocks | | | | | | |
(Cost $3,894,880) | | | | | 4,637,036 | |
|
MONEY MARKET FUND — 0.7% |
Invesco STIT – Government & Agency Portfolio, Institutional Class, 1.18%(c) (Cost $31,192) | | 31,192 | | | 31,192 | |
| | | | | | |
REPURCHASE AGREEMENTS — 9.9%(d) |
Citigroup Global Markets, Inc., dated 12/29/17, due 01/02/18, 1.41%, total to be received $250,029, (collateralized by various U.S. Government Agency Obligations, 0.00% – 9.00%, 04/01/18 – 08/20/67, totaling $254,209) | | $ 250,000 | | | 250,000 | |
HSBC Securities USA, Inc., dated 12/29/17, due 01/02/18, 1.36%, total to be received $210,347, (collateralized by various U.S. Government Agency Obligations, 0.00% – 9.13%, 12/31/17 – 05/15/47, totaling $213,521) | | 210,323 | | | 210,323 | |
Total Repurchase Agreements | | | | | | |
(Cost $460,323) | | | | | 460,323 | |
| | | | | | |
Total Investments — 110.4% | | | | | | |
(Cost $4,386,395) | | | | | 5,128,551 | |
| | | | | | |
Liabilities in Excess of Other Assets — (10.4%) | | | | | (483,781 | ) |
Net Assets — 100.0% | | | | $ | 4,644,770 | |
SUMMARY OF SCHEDULE OF INVESTMENTS
| | |
Aerospace/Defense | | 0.5 | % |
Airlines | | 1.2 | |
Auto Parts & Equipment | | 1.1 | |
Banks | | 4.5 | |
Beverages | | 0.2 | |
Biotechnology | | 0.8 | |
Building Materials | | 0.5 | |
Chemicals | | 1.6 | |
Coal | | 0.3 | |
Commercial Services | | 6.6 | |
Computers | | 3.7 | |
Distribution/Wholesale | | 1.6 | |
Diversified Financial Services | | 0.8 | |
Electronics | | 4.7 | |
Energy – Alternate Sources | | 1.1 | |
Engineering & Construction | | 0.9 | |
Entertainment | | 2.0 | |
Environmental Control | | 0.8 | |
Food | | 1.7 | |
Forest Products & Paper | | 0.5 | |
Hand/Machine Tools | | 0.5 | |
Healthcare – Products | | 6.3 | |
Healthcare – Services | | 0.8 | |
Home Furnishings | | 0.7 | |
Household Products/Wares | | 1.5 | |
Insurance | | 2.0 | |
Internet | | 4.2 | |
Iron/Steel | | 0.5 | |
Leisure Time | | 1.9 | |
Lodging | | 0.8 | |
Machinery – Diversified | | 1.4 | |
Media | | 0.6 | |
Mining | | 1.3 | |
Miscellaneous Manufacturing | | 2.1 | |
See accompanying Notes to Financial Statements.
10
ADVISORSHARES CORNERSTONE SMALL CAP ETF
Schedule of Investments (continued)
December 31, 2017 (Unaudited)
SUMMARY OF SCHEDULE OF INVESTMENTS (continued)
| | |
Office Furnishings | | 0.4 | % |
Oil & Gas | | 3.1 | |
Oil & Gas Services | | 2.0 | |
Packaging & Containers | | 0.5 | |
Pharmaceuticals | | 2.7 | |
Pipelines | | 0.4 | |
Private Equity | | 0.2 | |
Real Estate | | 0.4 | |
REITS | | 5.5 | |
Retail | | 4.9 | |
Savings & Loans | | 1.6 | |
Semiconductors | | 5.4 | |
Software | | 8.6 | |
Telecommunications | | 3.1 | |
Textiles | | 0.4 | |
Transportation | | 0.4 | |
Trucking & Leasing | | 0.5 | |
Money Market Fund | | 0.7 | |
Repurchase Agreements | | 9.9 | |
Total Investments | | 110.4 | |
Liabilities in Excess of Other Assets | | (10.4 | ) |
Net Assets | | 100.0 | % |
See accompanying Notes to Financial Statements.
11
ADVISORSHARES DORSEY WRIGHT ADR ETF
Schedule of Investments
December 31, 2017 (Unaudited)
| | | | |
COMMON STOCKS — 98.4% | | | | |
| | | | |
Aerospace/Defense — 1.8% | �� | | | |
Rolls-Royce Holdings PLC (United Kingdom)(a) | | 268,329 | | $ 3,064,317 |
| | | | |
Airlines — 5.4% | | | | |
Copa Holdings SA, Class A (Panama) | | 33,409 | | 4,478,811 |
Latam Airlines Group SA (Chile)(a)(b) | | 328,085 | | 4,560,381 |
Total Airlines | | | | 9,039,192 |
|
Auto Parts & Equipment — 2.2% |
China Yuchai International Ltd. (China) | | 154,043 | | 3,697,032 |
|
Banks — 9.8% | | | | |
Banco Macro SA (Argentina)(a) | | 36,041 | | 4,176,431 |
BNP Paribas SA (France)(a) | | 94,206 | | 3,518,594 |
Grupo Financiero Galicia SA (Argentina)(a) | | 79,937 | | 5,263,852 |
ING Groep NV
(Netherlands)(a)(b) | | 198,839 | | 3,670,568 |
Total Banks | | | | 16,629,445 |
| | | | |
Chemicals — 6.7% | | | | |
Braskem SA (Brazil)(a)(b) | | 163,885 | | 4,303,620 |
Sociedad Quimica y Minera de Chile SA (Chile)(a)(b) | | 117,825 | | 6,995,270 |
Total Chemicals | | | | 11,298,890 |
| | | | |
Commercial Services — 9.5% | | | | |
New Oriental Education & Technology Group, Inc. (China)(a) | | 86,022 | | 8,086,068 |
TAL Education Group (China)(a) | | 266,705 | | 7,923,806 |
Total Commercial Services | | | | 16,009,874 |
| | | | |
Computers — 1.6% | | | | |
Logitech International SA (Switzerland)(b) | | 79,743 | | 2,682,555 |
|
Diversified Financial Services — 2.6% |
KB Financial Group, Inc.
(South Korea)(a) | | 75,116 | | 4,395,037 |
|
Electric — 12.0% | | | | |
Empresa Distribuidora Y Comercializadora Norte (Argentina)*(a)(b) | | 174,849 | | 8,689,995 |
Enel SpA (Italy)(a) | | 509,580 | | 3,113,534 |
Pampa Energia SA (Argentina)*(a)(b) | | 126,398 | | 8,504,058 |
Total Electric | | | | 20,307,587 |
| | | | |
COMMON STOCKS (continued) |
| | | | |
Energy – Alternate Sources — 2.1% |
JinkoSolar Holding Co., Ltd. (China)*(a)(b) | | 148,976 | | $ 3,582,873 |
|
Forest Products & Paper — 2.7% |
Stora Enso OYJ (Finland)(a)(b) | | 284,064 | | 4,482,530 |
|
Healthcare – Products — 2.1% |
Mazor Robotics Ltd.
(Israel)*(a)(b) | | 68,933 | | 3,556,943 |
|
Household Products/Wares — 2.6% |
SodaStream International Ltd. (Israel)*(b) | | 62,111 | | 4,368,888 |
| | | | |
Internet — 8.8% | | | | |
Gravity Co. Ltd. (South Korea)(a) | | 54,473 | | 5,147,698 |
SINA Corp. (China)* | | 47,098 | | 4,724,400 |
Tencent Holdings Ltd.
(China)(a)(b) | | 86,175 | | 4,474,206 |
Weibo Corp. (China)*(a)(b) | | 4,749 | | 491,332 |
Total Internet | | | | 14,837,636 |
| | | | |
Iron/Steel — 2.6% | | | | |
Ternium SA (Luxembourg)(a) | | 139,768 | | 4,415,271 |
| | | | |
Lodging — 5.6% | | | | |
China Lodging Group Ltd. (China)(a) | | 65,568 | | 9,469,986 |
| | | | |
Machinery – Construction & Mining — 2.3% |
Komatsu Ltd. (Japan)(a) | | 107,118 | | 3,880,885 |
| | | | |
Pharmaceuticals — 2.2% | | | | |
Galapagos NV (Belgium)*(a) | | 38,870 | | 3,644,451 |
| | | | |
Real Estate — 2.5% | | | | |
IRSA Inversiones y Representaciones SA (Argentina)(a) | | 141,624 | | 4,192,070 |
| | | | |
Semiconductors — 4.7% | | | | |
Broadcom Ltd. | | 12,220 | | 3,139,318 |
STMicroelectronics NV (Switzerland)(b)(c) | | 216,670 | | 4,732,073 |
Total Semiconductors | | | | 7,871,391 |
| | | | |
Software — 2.2% | | | | |
SAP SE (Germany)(a) | | 33,745 | | 3,791,588 |
| | | | |
Telecommunications — 6.4% | | | | |
America Movil SAB de CV, Class L (Mexico)(a) | | 176,525 | | 3,027,404 |
Telecom Argentina SA (Argentina)(a)(b) | | 116,047 | | 4,250,801 |
See accompanying Notes to Financial Statements.
12
ADVISORSHARES DORSEY WRIGHT ADR ETF
Schedule of Investments (continued)
December 31, 2017 (Unaudited)
| | | | |
COMMON STOCKS (continued) |
|
Telecommunications (continued) |
TIM Participacoes SA (Brazil)(a) | | | 180,548 | | $ | 3,486,382 |
Total Telecommunications | | | | | | 10,764,587 |
Total Common Stocks | | | | | | |
(Cost $141,852,417) | | | | | | 165,983,028 |
|
MONEY MARKET FUNDS — 3.3% |
BlackRock Liquidity Funds FedFund Portfolio, Institutional Class, 1.17%(d)(e) | | | 1,002,000 | | | 1,002,000 |
Invesco Government & Agency Portfolio – Private Investment Class, 0.88%(d) | | | 2,661,863 | | | 2,661,863 |
Morgan Stanley Institutional Liquidity Funds – Government Portfolio, Institutional Class, 1.20%(d)(e) | | | 978,000 | | | 978,000 |
Invesco STIT – Government & Agency Portfolio, Institutional Class, 1.18%(d)(e) | | | 1,009,000 | | | 1,009,000 |
Total Money Market Funds | | | | | | |
(Cost $5,650,863) | | | | | | 5,650,863 |
|
REPURCHASE AGREEMENTS — 11.4%(e) |
Citigroup Global Markets, Inc., dated 12/29/17, due 01/02/18, 1.41%, total to be received $5,187,597, (collateralized by various U.S. Government Agency Obligations, 0.00% – 9.00%, 04/01/18 – 08/20/67, totaling $5,274,309) | | $ | 5,186,988 | | | 5,186,988 |
Daiwa Capital Markets America, dated 12/29/17, due 01/02/18, 1.43%, total to be received $5,187,606, (collateralized by various U.S. Government Agency Obligations, 0.00% – 6.50%, 01/11/18 – 12/01/51, totaling $5,277,305) | | | 5,186,988 | | | 5,186,988 |
HSBC Securities USA, Inc., dated 12/29/17, due 01/02/18, 1.36%, total to be received $3,735,226, (collateralized by various U.S. Government Agency Obligations, 0.00% – 9.13%, 12/31/17 – 05/15/47, totaling $3,791,588) | | | 3,734,803 | | | 3,734,803 |
| | | | |
REPURCHASE AGREEMENTS (continued) |
| | | | | | | |
RBC Dominion Securities, Inc., dated 12/29/17, due 01/02/18, 1.40%, total to be received $5,187,593, (collateralized by various U.S. Government Agency Obligations, 1.88% – 8.88%, 02/15/19 – 12/20/47, totaling $5,274,344) | | $ | 5,186,988 | | $ | 5,186,988 | |
Total Repurchase Agreements | | | | |
(Cost $19,295,767) | | | | | | 19,295,767 | |
| | | | | | | |
Total Investments — 113.1% | | | | | | | |
(Cost $166,799,047) | | | | | | 190,929,658 | |
| | | | | | | |
Liabilities in Excess of Other Assets — (13.1%) | | | | | | (22,159,586 | ) |
Net Assets — 100.0% | | | | | $ | 168,770,072 | |
See accompanying Notes to Financial Statements.
13
ADVISORSHARES DORSEY WRIGHT ADR ETF
Schedule of Investments (continued)
December 31, 2017 (Unaudited)
SUMMARY OF SCHEDULE OF INVESTMENTS
| | |
Aerospace/Defense | | 1.8 | % |
Airlines | | 5.4 | |
Auto Parts & Equipment | | 2.2 | |
Banks | | 9.8 | |
Chemicals | | 6.7 | |
Commercial Services | | 9.5 | |
Computers | | 1.6 | |
Diversified Financial Services | | 2.6 | |
Electric | | 12.0 | |
Energy – Alternate Sources | | 2.1 | |
Forest Products & Paper | | 2.7 | |
Healthcare – Products | | 2.1 | |
Household Products/Wares | | 2.6 | |
Internet | | 8.8 | |
Iron/Steel | | 2.6 | |
Lodging | | 5.6 | |
Machinery – Construction & Mining | | 2.3 | |
Pharmaceuticals | | 2.2 | |
Real Estate | | 2.5 | |
Semiconductors | | 4.7 | |
Software | | 2.2 | |
Telecommunications | | 6.4 | |
Money Market Funds | | 3.3 | |
Repurchase Agreements | | 11.4 | |
Total Investments | | 113.1 | |
Liabilities in Excess of Other Assets | | (13.1 | ) |
Net Assets | | 100.0 | % |
See accompanying Notes to Financial Statements.
14
ADVISORSHARES FOCUSED EQUITY ETF
Schedule of Investments
December 31, 2017 (Unaudited)
| | | | |
COMMON STOCKS — 98.3% | | | | | |
| | | | | |
Banks — 3.9% | | | | | |
Signature Bank* | | 3,782 | | $ | 519,117 |
| | | | | |
Building Materials — 3.9% | | | | | |
Continental Building Products, Inc.* | | 18,373 | | | 517,200 |
| | | | | |
Chemicals — 7.9% | | | | | |
RPM International, Inc. | | 9,952 | | | 521,684 |
Sherwin-Williams Co. (The) | | 1,268 | | | 519,931 |
Total Chemicals | | | | | 1,041,615 |
| | | | | |
Commercial Services — 7.9% | | | | | |
Carriage Services, Inc. | | 20,064 | | | 515,845 |
Moody’s Corp. | | 3,577 | | | 528,001 |
Total Commercial Services | | | | | 1,043,846 |
| | | | | |
Computers — 7.9% | | | | | |
Check Point Software Technologies Ltd. (Israel)* | | 5,081 | | | 526,493 |
Cognizant Technology Solutions Corp., Class A | | 7,324 | | | 520,151 |
Total Computers | | | | | 1,046,644 |
| | | | | |
Diversified Financial Services — 7.9% |
Alliance Data Systems Corp. | | 2,081 | | | 527,492 |
Intercontinental Exchange, Inc. | | 7,449 | | | 525,601 |
Total Diversified Financial Services | | | | | 1,053,093 |
| | | | | |
Food — 11.7% | | | | | |
Hormel Foods Corp. | | 14,201 | | | 516,774 |
Ingredion, Inc. | | 3,717 | | | 519,637 |
JM Smucker Co. (The) | | 4,164 | | | 517,335 |
Total Food | | | | | 1,553,746 |
| | | | | |
Hand/Machine Tools — 3.9% | | | | | |
Snap-on, Inc.(a) | | 2,985 | | | 520,286 |
| | | | | |
Healthcare – Products — 11.8% |
Becton Dickinson and Co. | | 2,435 | | | 521,236 |
Danaher Corp. | | 5,591 | | | 518,956 |
Stryker Corp. | | 3,383 | | | 523,824 |
Total Healthcare – Products | | | | | 1,564,016 |
| | | | | |
Household Products/Wares — 3.9% |
Church & Dwight Co., Inc. | | 10,402 | | | 521,868 |
| | | | | |
Insurance — 7.9% | | | | | |
Aflac, Inc. | | 5,953 | | | 522,554 |
Torchmark Corp. | | 5,757 | | | 522,218 |
Total Insurance | | | | | 1,044,772 |
| | | | |
COMMON STOCKS (continued) |
| | | | | | | |
Machinery – Diversified — 4.0% |
Wabtec Corp.(a) | | | 6,458 | | $ | 525,875 | |
| | | | | | | |
Media — 4.0% | | | | | | | |
FactSet Research Systems, Inc. | | | 2,730 | | | 526,235 | |
| | | | | | | |
Retail — 3.9% | | | | | | | |
Ross Stores, Inc. | | | 6,444 | | | 517,131 | |
| | | | | | | |
Software — 7.8% | | | | | | | |
Cerner Corp.* | | | 7,709 | | | 519,510 | |
Fiserv, Inc.* | | | 3,971 | | | 520,717 | |
Total Software | | | | | | 1,040,227 | |
Total Common Stocks | | | | | | | |
(Cost $11,621,523) | | | | | | 13,035,671 | |
| | | | | | | |
MONEY MARKET FUND — 0.7% |
BlackRock Liquidity Funds Treasury Trust Fund Portfolio, Institutional Class, 1.11%(b)
(Cost $92,643) | | | 92,643 | | | 92,643 | |
|
REPURCHASE AGREEMENTS — 2.7%(c) |
Daiwa Capital Markets America, dated 12/29/17, due 01/02/18, 1.43%, total to be received $250,030, (collateralized by various U.S. Government Agency Obligations, 0.00% – 6.50%, 01/11/18 – 12/01/51, totaling $254,353) | | $ | 250,000 | | | 250,000 | |
RBC Dominion Securities, Inc., dated 12/29/17, due 01/02/18, 1.40%, total to be received $107,213, (collateralized by various U.S. Government Agency Obligations, 1.88% – 8.88%, 02/15/19 – 12/20/47, totaling $109,005) | | | 107,200 | | | 107,200 | |
Total Repurchase Agreements | | | | | | | |
(Cost $357,200) | | | | | | 357,200 | |
| | | | | | | |
Total Investments — 101.7% | | | | | | | |
(Cost $12,071,366) | | | | | | 13,485,514 | |
| | | | | | | |
Liabilities in Excess of Other Assets — (1.7%) | | | | | | (221,627 | ) |
Net Assets — 100.0% | | | | | $ | 13,263,887 | |
See accompanying Notes to Financial Statements.
15
ADVISORSHARES FOCUSED EQUITY ETF
Schedule of Investments (continued)
December 31, 2017 (Unaudited)
SUMMARY OF SCHEDULE OF INVESTMENTS
| | | |
Banks | | 3.9 | % |
Building Materials | | 3.9 | |
Chemicals | | 7.9 | |
Commercial Services | | 7.9 | |
Computers | | 7.9 | |
Diversified Financial Services | | 7.9 | |
Food | | 11.7 | |
Hand/Machine Tools | | 3.9 | |
Healthcare – Products | | 11.8 | |
Household Products/Wares | | 3.9 | |
Insurance | | 7.9 | |
Machinery – Diversified | | 4.0 | |
Media | | 4.0 | |
Retail | | 3.9 | |
Software | | 7.8 | |
Money Market Fund | | 0.7 | |
Repurchase Agreements | | 2.7 | |
Total Investments | | 101.7 | |
Liabilities in Excess of Other Assets | | (1.7 | ) |
Net Assets | | 100.0 | % |
| | | |
See accompanying Notes to Financial Statements.
16
ADVISORSHARES KIM KOREA EQUITY ETF
Schedule of Investments
December 31, 2017 (Unaudited)
| | | | |
COMMON STOCKS — 96.6% | | | | | |
| | | | | |
Advertising — 1.9% | | | | | |
Innocean Worldwide, Inc. (South Korea)* | | 2,948 | | $ | 201,573 |
| | | | | |
Aerospace/Defense — 0.1% | | | | | |
Korea Aerospace Industries Ltd. (South Korea)* | | 290 | | | 12,854 |
| | | | | |
Airlines — 2.2% | | | | | |
Hanjin Kal Corp. (South Korea)* | | 11,967 | | | 204,564 |
Jin Air Co. Ltd. (South Korea)* | | 1,244 | | | 30,794 |
Total Airlines | | | | | 235,358 |
| | | | | |
Apparel — 1.8% | | | | | |
Handsome Co. Ltd.
(South Korea)* | | 6,486 | | | 190,542 |
| | | | | |
Auto Manufacturers — 4.3% | | | | | |
Hyundai Motor Co.
(South Korea) | | 3,109 | | | 453,042 |
| | | | | |
Auto Parts & Equipment — 4.2% |
Hyundai Mobis Co. Ltd.
(South Korea)* | | 1,811 | | | 444,905 |
| | | | | |
Banks — 1.8% | | | | | |
Industrial Bank of Korea
(South Korea) | | 12,047 | | | 185,113 |
| | | | | |
Biotechnology — 1.4% | | | | | |
Hugel, Inc. (South Korea)* | | 58 | | | 30,318 |
Medy-Tox, Inc. (South Korea) | | 61 | | | 27,630 |
Samsung Biologics Co. Ltd. (South Korea)*‡ | | 246 | | | 85,251 |
Total Biotechnology | | | | | 143,199 |
| | | | | |
Chemicals — 4.9% | | | | | |
Ecopro Co. Ltd. (South Korea)* | | 282 | | | 10,378 |
Hansol Chemical Co. Ltd. (South Korea)* | | 627 | | | 42,462 |
LG Chem Ltd. (South Korea) | | 605 | | | 228,878 |
Lotte Chemical Corp.
(South Korea)* | | 649 | | | 223,093 |
Soulbrain Co. Ltd.
(South Korea)* | | 156 | | | 9,836 |
Wonik Materials Co. Ltd. (South Korea)* | | 72 | | | 4,674 |
Total Chemicals | | | | | 519,321 |
| | | | | |
Commercial Services — 0.2% | | | | | |
KGMobilians Co. Ltd.
(South Korea)* | | 2,767 | | | 20,910 |
| | | | | |
Computers — 2.5% | | | | | |
NHN KCP Corp. (South Korea)* | | 715 | | | 11,220 |
Samsung SDS Co. Ltd.
(South Korea)* | | 377 | | | 70,431 |
| | | | |
COMMON STOCKS (continued) |
| | | | | |
Computers (continued) | | | | | |
SK Holdings Co. Ltd.
(South Korea)* | | 687 | | $ | 181,609 |
Total Computers | | | | | 263,260 |
| | | | | |
Cosmetics/Personal Care — 2.7% |
Amorepacific Corp.
(South Korea)* | | 475 | | | 135,106 |
CLIO Cosmetics Co. Ltd. (South Korea)* | | 430 | | | 14,761 |
Cosmax, Inc. (South Korea)* | | 687 | | | 75,082 |
LG Household & Health Care Ltd. (South Korea)* | | 55 | | | 61,085 |
Total Cosmetics/Personal Care | | | | | 286,034 |
| | | | | |
Distribution/Wholesale — 2.0% |
Hanwha Corp. (South Korea)* | | 935 | | | 36,246 |
LG Corp. (South Korea)* | | 2,053 | | | 174,511 |
Total Distribution/Wholesale | | | | | 210,757 |
| | | | | |
Diversified Financial Services — 4.7% |
KB Financial Group, Inc.
(South Korea) | | 4,982 | | | 295,044 |
KIWOOM Securities Co. Ltd. (South Korea)* | | 1,057 | | | 86,491 |
NH Investment & Securities Co. Ltd. (South Korea)* | | 8,775 | | | 113,934 |
Total Diversified Financial Services | | | | | 495,469 |
| | | | | |
Electrical Components & Equipment — 4.1% |
LG Electronics, Inc. (South Korea) | | 2,230 | | | 220,802 |
LS Corp. (South Korea)* | | 3,141 | | | 212,716 |
Total Electrical Components & Equipment | | | | | 433,518 |
| | | | | |
Electronics — 1.1% | | | | | |
L&F Co. Ltd. (South Korea)* | | 266 | | | 10,635 |
Samsung Electro-Mechanics Co. Ltd. (South Korea)* | | 1,111 | | | 103,778 |
Total Electronics | | | | | 114,413 |
| | | | | |
Engineering & Construction — 1.1% |
Daelim Industrial Co. Ltd. (South Korea)* | | 612 | | | 47,105 |
Daewoo Engineering & Construction Co. Ltd. (South Korea)* | | 11,674 | | | 64,556 |
Total Engineering & Construction | | | | | 111,661 |
| | | | | |
Food — 2.5% | | | | | |
CJ CheilJedang Corp.
(South Korea)* | | 627 | | | 214,359 |
Daesang Corp. (South Korea)* | | 825 | | | 21,231 |
NUTRIBIOTECH Co. Ltd. (South Korea)* | | 1,270 | | | 25,980 |
Total Food | | | | | 261,570 |
See accompanying Notes to Financial Statements.
17
ADVISORSHARES KIM KOREA EQUITY ETF
Schedule of Investments (continued)
December 31, 2017 (Unaudited)
| | | | |
COMMON STOCKS (continued) |
|
Gas — 1.4% | | | | | |
Korea Gas Corp. (South Korea)* | | 1,851 | | $ | 73,569 |
SK Chemicals Co. Ltd.
(South Korea)* | | 941 | | | 74,011 |
Total Gas | | | | | 147,580 |
|
Healthcare – Products — 0.2% |
Interojo Co. Ltd. (South Korea) | | 597 | | | 21,665 |
|
Holding Companies – Diversified — 1.0% |
CJ Corp. (South Korea)* | | 621 | | | 105,284 |
|
Home Furnishings — 0.3% | | | | | |
SM Entertainment Co.
(South Korea)* | | 917 | | | 29,723 |
|
Insurance — 1.5% | | | | | |
Samsung Life Insurance Co. Ltd. (South Korea)* | | 1,343 | | | 156,185 |
|
Internet — 8.1% | | | | | |
Kakao Corp. (South Korea)* | | 1,492 | | | 190,933 |
NAVER Corp. (South Korea)* | | 566 | | | 459,969 |
NHN Entertainment Corp. (South Korea)* | | 3,078 | | | 196,661 |
Total Internet | | | | | 847,563 |
|
Iron/Steel — 1.9% | | | | | |
POSCO (South Korea) | | 640 | | | 198,776 |
|
Leisure Time — 0.5% | | | | | |
Hana Tour Service, Inc.
(South Korea) | | 519 | | | 49,934 |
|
Machinery – Diversified — 2.6% |
Hyundai Robotics Co. Ltd. (South Korea)* | | 531 | | | 188,979 |
SFA Engineering Corp.
(South Korea)* | | 2,389 | | | 86,473 |
Total Machinery – Diversified | | | | | 275,452 |
|
Media — 0.5% | | | | | |
CJ E&M Corp. (South Korea)* | | 578 | | | 52,749 |
|
Metal Fabricate/Hardware — 0.1% |
Hyosung Corp. (South Korea)* | | 81 | | | 10,555 |
|
Miscellaneous Manufacturing — 1.2% |
Doosan Corp. (South Korea)* | | 903 | | | 95,314 |
POSCO Chemtech Co. Ltd. (South Korea)* | | 287 | | | 10,670 |
| | | | |
COMMON STOCKS (continued) |
|
Miscellaneous Manufacturing (continued) |
SK Materials Co. Ltd.
(South Korea)* | | 93 | | $ | 15,637 |
Total Miscellaneous Manufacturing | | | | | 121,621 |
|
Oil & Gas — 1.8% | | | | | |
S-Oil Corp. (South Korea) | | 1,719 | | | 187,869 |
�� |
Pharmaceuticals — 3.0% | | | | | |
Celltrion Healthcare Co. Ltd. (South Korea)* | | 112 | | | 11,362 |
Celltrion, Inc. (South Korea)* | | 2 | | | 413 |
Dong-A Socio Holdings Co. Ltd. (South Korea)* | | 407 | | | 48,663 |
Green Cross Corp.
(South Korea)* | | 314 | | | 66,287 |
Hanmi Pharm Co. Ltd.
(South Korea)* | | 253 | | | 138,015 |
Yuhan Corp. (South Korea)* | | 250 | | | 51,142 |
Total Pharmaceuticals | | | | | 315,882 |
|
Retail — 4.4% | | | | | |
E-MART, Inc. (South Korea)* | | 260 | | | 65,817 |
Lotte Shopping Co. Ltd.
(South Korea)* | | 930 | | | 172,874 |
Samsung C&T Corp.
(South Korea)* | | 899 | | | 105,809 |
Shinsegae, Inc. (South Korea)* | | 436 | | | 122,180 |
Total Retail | | | | | 466,680 |
|
Semiconductors — 21.4% | | | | | |
Dongjin Semichem Co. Ltd. (South Korea)* | | 498 | | | 10,281 |
Samsung Electronics Co. Ltd. (South Korea) | | 767 | | | 1,825,525 |
SK Hynix, Inc. (South Korea) | | 5,088 | | | 363,581 |
TES Co. Ltd. (South Korea) | | 1,459 | | | 52,061 |
Total Semiconductors | | | | | 2,251,448 |
|
Shipbuilding — 0.2% | | | | | |
Hyundai Heavy Industries Co. Ltd. (South Korea)* | | 263 | | | 24,690 |
|
Telecommunications — 2.1% | | | | | |
SK Telecom Co. Ltd.
(South Korea) | | 896 | | | 223,466 |
See accompanying Notes to Financial Statements.
18
ADVISORSHARES KIM KOREA EQUITY ETF
Schedule of Investments (continued)
December 31, 2017 (Unaudited)
| | | | |
COMMON STOCKS (continued) |
| | | | | |
Transportation — 0.9% | | | | | |
Hyundai Glovis Co. Ltd. (South Korea)* | | 732 | | $ | 92,991 |
Total Common Stocks | | | | | |
(Cost $8,169,016) | | | | | 10,163,612 |
| | | | | |
Total Investments — 96.6% | | | | | |
(Cost $8,169,016) | | | | | 10,163,612 |
| | | | | |
Other Assets in Excess of Liabilities — 3.4% | | | | | 359,020 |
Net Assets — 100.0% | | | | $ | 10,522,632 |
SUMMARY OF SCHEDULE OF INVESTMENTS
| | |
Advertising | | 1.9 | % |
Aerospace/Defense | | 0.1 | |
Airlines | | 2.2 | |
Apparel | | 1.8 | |
Auto Manufacturers | | 4.3 | |
Auto Parts & Equipment | | 4.2 | |
Banks | | 1.8 | |
Biotechnology | | 1.4 | |
Chemicals | | 4.9 | |
Commercial Services | | 0.2 | |
Computers | | 2.5 | |
Cosmetics/Personal Care | | 2.7 | |
Distribution/Wholesale | | 2.0 | |
Diversified Financial Services | | 4.7 | |
Electrical Components & Equipment | | 4.1 | |
Electronics | | 1.1 | |
Engineering & Construction | | 1.1 | |
Food | | 2.5 | |
Gas | | 1.4 | |
Healthcare – Products | | 0.2 | |
Holding Companies – Diversified | | 1.0 | |
Home Furnishings | | 0.3 | |
Insurance | | 1.5 | |
Internet | | 8.1 | |
Iron/Steel | | 1.9 | |
Leisure Time | | 0.5 | |
Machinery – Diversified | | 2.6 | |
Media | | 0.5 | |
Metal Fabricate/Hardware | | 0.1 | |
Miscellaneous Manufacturing | | 1.2 | |
Oil & Gas | | 1.8 | |
Pharmaceuticals | | 3.0 | |
Retail | | 4.4 | |
Semiconductors | | 21.4 | |
Shipbuilding | | 0.2 | |
Telecommunications | | 2.1 | |
Transportation | | 0.9 | |
Total Investments | | 96.6 | |
Other Assets in Excess of Liabilities | | 3.4 | |
Net Assets | | 100.0 | % |
See accompanying Notes to Financial Statements.
19
ADVISORSHARES MADRONA DOMESTIC ETF
Schedule of Investments
December 31, 2017 (Unaudited)
| | | | |
COMMON STOCKS — 98.5% | | | | | |
| | | | | |
Advertising — 0.4% | | | | | |
Interpublic Group of Cos., Inc. (The) | | 3,460 | | $ | 69,754 |
Omnicom Group, Inc. | | 722 | | | 52,583 |
Total Advertising | | | | | 122,337 |
| | | | | |
Aerospace/Defense — 1.6% | | | | | |
Arconic, Inc. | | 5,299 | | | 144,398 |
Boeing Co. (The) | | 233 | | | 68,714 |
General Dynamics Corp. | | 88 | | | 17,904 |
Harris Corp. | | 329 | | | 46,603 |
L3 Technologies, Inc. | | 59 | | | 11,673 |
Lockheed Martin Corp. | | 29 | | | 9,311 |
Northrop Grumman Corp. | | 37 | | | 11,356 |
Raytheon Co. | | 54 | | | 10,144 |
Rockwell Collins, Inc. | | 449 | | | 60,893 |
TransDigm Group, Inc.(a) | | 223 | | | 61,240 |
United Technologies Corp. | | 206 | | | 26,279 |
Total Aerospace/Defense | | | | | 468,515 |
| | | | | |
Agriculture — 0.7% | | | | | |
Altria Group, Inc. | | 361 | | | 25,779 |
Archer-Daniels-Midland Co. | | 2,935 | | | 117,635 |
Philip Morris International, Inc. | | 511 | | | 53,987 |
Total Agriculture | | | | | 197,401 |
| | | | | |
Airlines — 1.2% | | | | | |
Alaska Air Group, Inc. | | 890 | | | 65,424 |
Delta Air Lines, Inc. | | 2,422 | | | 135,632 |
Southwest Airlines Co. | | 2,017 | | | 132,012 |
United Continental Holdings, Inc.* | | 342 | | | 23,051 |
Total Airlines | | | | | 356,119 |
| | | | | |
Apparel — 1.1% | | | | | |
Hanesbrands, Inc. | | 3,640 | | | 76,112 |
Michael Kors Holdings Ltd.* | | 369 | | | 23,229 |
NIKE, Inc., Class B | | 765 | | | 47,851 |
Ralph Lauren Corp. | | 1,029 | | | 106,697 |
Under Armour, Inc., Class C*(a) | | 925 | | | 12,321 |
VF Corp. | | 732 | | | 54,168 |
Total Apparel | | | | | 320,378 |
| | | | | |
Auto Manufacturers — 1.3% | | | | | |
Ford Motor Co. | | 12,358 | | | 154,352 |
General Motors Co. | | 4,110 | | | 168,469 |
PACCAR, Inc. | | 892 | | | 63,403 |
Total Auto Manufacturers | | | | | 386,224 |
| | | | | |
Auto Parts & Equipment — 1.2% |
Aptiv PLC | | 1,070 | | | 90,768 |
BorgWarner, Inc. | | 1,854 | | | 94,721 |
| | | | |
COMMON STOCKS (continued) |
| | | | | |
Auto Parts & Equipment (continued) | | | | | |
Delphi Technologies PLC* | | 356 | | $ | 18,679 |
Goodyear Tire & Rubber Co. (The) | | 4,721 | | | 152,536 |
Total Auto Parts & Equipment | | | | | 356,704 |
| | | | | |
Banks — 6.3% | | | | | |
Bank of America Corp. | | 2,399 | | | 70,819 |
Bank of New York Mellon Corp. (The) | | 989 | | | 53,268 |
BB&T Corp. | | 999 | | | 49,670 |
Capital One Financial Corp. | | 788 | | | 78,469 |
Citigroup, Inc. | | 851 | | | 63,323 |
Citizens Financial Group, Inc. | | 4,184 | | | 175,644 |
Comerica, Inc. | | 2,218 | | | 192,545 |
Fifth Third Bancorp | | 895 | | | 27,154 |
Goldman Sachs Group, Inc. (The) | | 548 | | | 139,609 |
Huntington Bancshares, Inc. | | 4,016 | | | 58,473 |
JPMorgan Chase & Co. | | 597 | | | 63,843 |
KeyCorp | | 2,915 | | | 58,796 |
M&T Bank Corp. | | 108 | | | 18,467 |
Morgan Stanley | | 2,949 | | | 154,734 |
Northern Trust Corp. | | 607 | | | 60,633 |
PNC Financial Services Group, Inc. (The) | | 432 | | | 62,333 |
Regions Financial Corp. | | 7,798 | | | 134,749 |
State Street Corp. | | 1,030 | | | 100,538 |
SunTrust Banks, Inc. | | 951 | | | 61,425 |
US Bancorp | | 290 | | | 15,538 |
Wells Fargo & Co. | | 1,066 | | | 64,674 |
Zions Bancorporation | | 2,566 | | | 130,430 |
Total Banks | | | | | 1,835,134 |
| | | | | |
Beverages — 1.0% | | | | | |
Brown-Forman Corp., Class B | | 242 | | | 16,618 |
Coca-Cola Co. (The) | | 347 | | | 15,920 |
Constellation Brands, Inc., Class A | | 325 | | | 74,285 |
Dr Pepper Snapple Group, Inc. | | 284 | | | 27,565 |
Molson Coors Brewing Co., Class B | | 1,089 | | | 89,374 |
Monster Beverage Corp.* | | 855 | | | 54,113 |
PepsiCo, Inc. | | 107 | | | 12,832 |
Total Beverages | | | | | 290,707 |
| | | | | |
Biotechnology — 1.3% | | | | | |
Alexion Pharmaceuticals, Inc.* | | 851 | | | 101,771 |
Amgen, Inc. | | 56 | | | 9,739 |
Biogen, Inc.* | | 183 | | | 58,298 |
Celgene Corp.* | | 1,000 | | | 104,360 |
Illumina, Inc.* | | 61 | | | 13,328 |
See accompanying Notes to Financial Statements.
20
ADVISORSHARES MADRONA DOMESTIC ETF
Schedule of Investments (continued)
December 31, 2017 (Unaudited)
| | | | |
COMMON STOCKS (continued) |
| | | | | |
Biotechnology (continued) | | | | | |
Incyte Corp.* | | 172 | | $ | 16,290 |
Regeneron Pharmaceuticals, Inc.* | | 144 | | | 54,138 |
Vertex Pharmaceuticals, Inc.* | | 83 | | | 12,438 |
Total Biotechnology | | | | | 370,362 |
| | | | | |
Building Materials — 1.6% | | | | | |
Fortune Brands Home & Security, Inc. | | 851 | | | 58,242 |
Johnson Controls International PLC | | 2,798 | | | 106,632 |
Martin Marietta Materials, Inc. | | 341 | | | 75,375 |
Masco Corp. | | 2,996 | | | 131,644 |
Vulcan Materials Co. | | 851 | | | 109,243 |
Total Building Materials | | | | | 481,136 |
| | | | | |
Chemicals — 1.7% | | | | | |
Air Products & Chemicals, Inc. | | 330 | | | 54,146 |
Albemarle Corp. | | 270 | | | 34,530 |
DowDuPont, Inc. | | 407 | | | 28,987 |
Eastman Chemical Co. | | 995 | | | 92,177 |
FMC Corp. | | 95 | | | 8,993 |
International Flavors & Fragrances, Inc. | | 95 | | | 14,498 |
LyondellBasell Industries NV, Class A | | 629 | | | 69,391 |
Monsanto Co. | | 241 | | | 28,144 |
Mosaic Co. (The) | | 581 | | | 14,908 |
PPG Industries, Inc. | | 425 | | | 49,649 |
Praxair, Inc. | | 237 | | | 36,659 |
Sherwin-Williams Co. (The) | | 154 | | | 63,146 |
Total Chemicals | | | | | 495,228 |
| | | | | |
Commercial Services — 3.4% | | | | | |
Automatic Data Processing, Inc. | | 71 | | | 8,320 |
Cintas Corp. | | 325 | | | 50,645 |
Ecolab, Inc. | | 324 | | | 43,474 |
Equifax, Inc. | | 596 | | | 70,280 |
Gartner, Inc.* | | 331 | | | 40,763 |
Global Payments, Inc. | | 673 | | | 67,461 |
H&R Block, Inc. | | 2,437 | | | 63,898 |
IHS Markit Ltd.* | | 1,222 | | | 55,173 |
Moody’s Corp. | | 54 | | | 7,971 |
Nielsen Holdings PLC(a) | | 1,312 | | | 47,757 |
PayPal Holdings, Inc.* | | 811 | | | 59,706 |
Quanta Services, Inc.* | | 987 | | | 38,602 |
Robert Half International, Inc. | | 1,213 | | | 67,370 |
S&P Global, Inc. | | 337 | | | 57,088 |
| | | | |
COMMON STOCKS (continued) |
|
Commercial Services (continued) |
Total System Services, Inc. | | 786 | | $ | 62,165 |
United Rentals, Inc.* | | 769 | | | 132,199 |
Verisk Analytics, Inc.* | | 122 | | | 11,712 |
Western Union Co. (The) | | 6,313 | | | 120,010 |
Total Commercial Services | | | | | 1,004,594 |
|
Computers — 3.1% | | | | | |
Accenture PLC, Class A | | 185 | | | 28,322 |
Apple, Inc. | | 422 | | | 71,415 |
Cognizant Technology Solutions Corp., Class A | | 1,045 | | | 74,216 |
CSRA, Inc. | | 1,884 | | | 56,369 |
DXC Technology Co. | | 1,914 | | | 181,639 |
HP, Inc. | | 441 | | | 9,265 |
International Business Machines Corp. | | 227 | | | 34,826 |
NetApp, Inc. | | 2,196 | | | 121,483 |
Seagate Technology PLC(a) | | 4,605 | | | 192,673 |
Western Digital Corp. | | 1,902 | | | 151,266 |
Total Computers | | | | | 921,474 |
|
Cosmetics/Personal Care — 0.4% |
Colgate-Palmolive Co. | | 151 | | | 11,393 |
Coty, Inc., Class A | | 3,816 | | | 75,900 |
Estee Lauder Cos., Inc. (The), Class A | | 176 | | | 22,394 |
Procter & Gamble Co. (The) | | 94 | | | 8,637 |
Total Cosmetics/Personal Care | | | | | 118,324 |
|
Distribution/Wholesale — 0.9% |
Fastenal Co. | | 1,479 | | | 80,887 |
LKQ Corp.* | | 3,032 | | | 123,311 |
W.W. Grainger, Inc.(a) | | 311 | | | 73,474 |
Total Distribution/Wholesale | | | | | 277,672 |
|
Diversified Financial Services — 7.2% |
Affiliated Managers Group, Inc. | | 804 | | | 165,021 |
Alliance Data Systems Corp. | | 690 | | | 174,901 |
American Express Co. | | 917 | | | 91,067 |
Ameriprise Financial, Inc. | | 1,116 | | | 189,129 |
BlackRock, Inc. | | 143 | | | 73,461 |
Cboe Global Markets, Inc. | | 1,218 | | | 151,751 |
Charles Schwab Corp. (The) | | 1,808 | | | 92,877 |
CME Group, Inc. | | 60 | | | 8,763 |
Discover Financial Services | | 2,033 | | | 156,378 |
E*TRADE Financial Corp.* | | 2,077 | | | 102,957 |
Franklin Resources, Inc. | | 1,274 | | | 55,202 |
See accompanying Notes to Financial Statements.
21
ADVISORSHARES MADRONA DOMESTIC ETF
Schedule of Investments (continued)
December 31, 2017 (Unaudited)
| | | | |
COMMON STOCKS (continued) |
|
Diversified Financial Services (continued) |
Intercontinental Exchange, Inc. | | 657 | | $ | 46,358 |
Invesco Ltd. | | 3,868 | | | 141,337 |
Mastercard, Inc., Class A | | 401 | | | 60,695 |
Nasdaq, Inc. | | 489 | | | 37,570 |
Navient Corp. | | 8,670 | | | 115,484 |
Raymond James Financial, Inc. | | 1,695 | | | 151,364 |
Synchrony Financial | | 4,012 | | | 154,903 |
T. Rowe Price Group, Inc. | | 769 | | | 80,691 |
Visa, Inc., Class A | | 559 | | | 63,737 |
Total Diversified Financial Services | | | | | 2,113,646 |
|
Electric — 1.4% | | | | | |
AES Corp. (The) | | 7,148 | | | 77,413 |
Alliant Energy Corp. | | 345 | | | 14,700 |
Ameren Corp. | | 213 | | | 12,565 |
American Electric Power Co., Inc. | | 211 | | | 15,523 |
CenterPoint Energy, Inc. | | 486 | | | 13,783 |
CMS Energy Corp. | | 197 | | | 9,318 |
Consolidated Edison, Inc. | | 214 | | | 18,179 |
Dominion Energy, Inc. | | 166 | | | 13,456 |
DTE Energy Co. | | 132 | | | 14,449 |
Duke Energy Corp. | | 189 | | | 15,897 |
Edison International | | 180 | | | 11,383 |
Entergy Corp. | | 415 | | | 33,777 |
Eversource Energy | | 194 | | | 12,257 |
Exelon Corp. | | 210 | | | 8,276 |
FirstEnergy Corp. | | 548 | | | 16,780 |
NRG Energy, Inc. | | 726 | | | 20,676 |
PG&E Corp. | | 237 | | | 10,625 |
Pinnacle West Capital Corp. | | 161 | | | 13,714 |
PPL Corp. | | 309 | | | 9,564 |
Public Service Enterprise Group, Inc. | | 302 | | | 15,553 |
SCANA Corp. | | 228 | | | 9,070 |
Southern Co. (The) | | 314 | | | 15,100 |
WEC Energy Group, Inc. | | 235 | | | 15,611 |
Xcel Energy, Inc. | | 309 | | | 14,866 |
Total Electric | | | | | 412,535 |
|
Electrical Components & Equipment — 0.6% |
Acuity Brands, Inc. | | 766 | | | 134,816 |
AMETEK, Inc. | | 294 | | | 21,306 |
Emerson Electric Co. | | 205 | | | 14,287 |
Total Electrical Components & Equipment | | | | | 170,409 |
| | | | |
COMMON STOCKS (continued) |
|
Electronics — 1.0% | | | | | |
Agilent Technologies, Inc. | | 124 | | $ | 8,304 |
Allegion PLC | | 682 | | | 54,260 |
Amphenol Corp., Class A | | 160 | | | 14,048 |
Corning, Inc. | | 258 | | | 8,253 |
FLIR Systems, Inc. | | 670 | | | 31,235 |
Fortive Corp. | | 291 | | | 21,054 |
Garmin Ltd. | | 185 | | | 11,021 |
Honeywell International, Inc. | | 243 | | | 37,267 |
Mettler-Toledo International, Inc.* | | 14 | | | 8,673 |
PerkinElmer, Inc. | | 342 | | | 25,007 |
TE Connectivity Ltd. | | 611 | | | 58,069 |
Waters Corp.* | | 88 | | | 17,001 |
Total Electronics | | | | | 294,192 |
|
Engineering & Construction — 0.5% |
Fluor Corp. | | 1,371 | | | 70,812 |
Jacobs Engineering Group, Inc. | | 922 | | | 60,815 |
Total Engineering & Construction | | | | | 131,627 |
|
Environmental Control — 0.3% |
Republic Services, Inc. | | 145 | | | 9,803 |
Stericycle, Inc.* | | 881 | | | 59,899 |
Waste Management, Inc. | | 189 | | | 16,311 |
Total Environmental Control | | | | | 86,013 |
|
Food — 1.7% | | | | | |
Campbell Soup Co. | | 342 | | | 16,454 |
Conagra Brands, Inc. | | 726 | | | 27,348 |
General Mills, Inc. | | 1,205 | | | 71,444 |
Hershey Co. (The) | | 70 | | | 7,946 |
Hormel Foods Corp. | | 450 | | | 16,375 |
JM Smucker Co. (The) | | 103 | | | 12,797 |
Kellogg Co. | | 124 | | | 8,430 |
Kraft Heinz Co. (The) | | 387 | | | 30,093 |
Kroger Co. (The) | | 3,119 | | | 85,617 |
McCormick & Co., Inc. | | 96 | | | 9,783 |
Mondelez International, Inc., Class A | | 1,389 | | | 59,449 |
Safeway, Inc. PDC, LLC CVR*(b) | | 447 | | | 0 |
Safeway, Inc. SCRP. CVR*(b) | | 447 | | | 0 |
Sysco Corp. | | 982 | | | 59,637 |
Tyson Foods, Inc., Class A | | 972 | | | 78,800 |
Total Food | | | | | 484,173 |
|
Forest Products & Paper — 0.2% |
International Paper Co. | | 1,130 | | | 65,472 |
See accompanying Notes to Financial Statements.
22
ADVISORSHARES MADRONA DOMESTIC ETF
Schedule of Investments (continued)
December 31, 2017 (Unaudited)
| | | | |
COMMON STOCKS (continued) |
| | | | | |
Gas — 0.2% | | | | | |
NiSource, Inc. | | 449 | | $ | 11,526 |
Sempra Energy | | 310 | | | 33,145 |
Total Gas | | | | | 44,671 |
| | | | | |
Hand/Machine Tools — 0.6% | | | | | |
Snap-on, Inc. | | 825 | | | 143,797 |
Stanley Black & Decker, Inc. | | 220 | | | 37,332 |
Total Hand/Machine Tools | | | | | 181,129 |
| | | | | |
Healthcare – Products — 2.6% |
Abbott Laboratories | | 1,076 | | | 61,407 |
Align Technology, Inc.* | | 118 | | | 26,218 |
Baxter International, Inc. | | 746 | | | 48,221 |
Becton Dickinson and Co. | | 314 | | | 67,215 |
Boston Scientific Corp.* | | 1,488 | | | 36,888 |
Cooper Cos., Inc. (The) | | 145 | | | 31,593 |
Danaher Corp. | | 448 | | | 41,583 |
DENTSPLY SIRONA, Inc. | | 443 | | | 29,163 |
Edwards Lifesciences Corp.* | | 500 | | | 56,355 |
Henry Schein, Inc.* | | 446 | | | 31,167 |
Hologic, Inc.* | | 1,418 | | | 60,620 |
IDEXX Laboratories, Inc.* | | 64 | | | 10,008 |
Intuitive Surgical, Inc.* | | 39 | | | 14,233 |
Medtronic PLC | | 181 | | | 14,616 |
Patterson Cos., Inc. | | 901 | | | 32,553 |
ResMed, Inc. | | 416 | | | 35,231 |
Stryker Corp. | | 268 | | | 41,497 |
Thermo Fisher Scientific, Inc. | | 290 | | | 55,065 |
Varian Medical Systems, Inc.* | | 89 | | | 9,892 |
Zimmer Biomet Holdings, Inc. | | 534 | | | 64,438 |
Total Healthcare – Products | | | | | 767,963 |
| | | | | |
Healthcare – Services — 3.3% | | | |
Aetna, Inc. | | 389 | | | 70,172 |
Anthem, Inc. | | 338 | | | 76,053 |
Centene Corp.* | | 703 | | | 70,919 |
Cigna Corp. | | 398 | | | 80,830 |
DaVita, Inc.* | | 993 | | | 71,744 |
Envision Healthcare Corp.* | | 3,034 | | | 104,855 |
HCA Healthcare, Inc.* | | 1,586 | | | 139,314 |
Humana, Inc. | | 257 | | | 63,754 |
IQVIA Holdings, Inc.* | | 695 | | | 68,041 |
Laboratory Corp. of America Holdings* | | 396 | | | 63,166 |
Quest Diagnostics, Inc. | | 243 | | | 23,933 |
UnitedHealth Group, Inc. | | 342 | | | 75,397 |
| | | | |
COMMON STOCKS (continued) |
|
Healthcare – Services (continued) |
Universal Health Services, Inc., Class B | | 568 | | $ | 64,383 |
Total Healthcare – Services | | | | | 972,561 |
|
Holding Companies – Diversified — 0.2% |
Leucadia National Corp. | | 2,731 | | | 72,344 |
|
Home Builders — 1.8% | | | | | |
D.R. Horton, Inc. | | 3,540 | | | 180,788 |
Lennar Corp., Class A | | 2,319 | | | 146,654 |
Lennar Corp., Class B | | 46 | | | 2,377 |
PulteGroup, Inc. | | 6,388 | | | 212,401 |
Total Home Builders | | | | | 542,220 |
|
Home Furnishings — 0.6% | | | | | |
Leggett & Platt, Inc. | | 863 | | | 41,191 |
Whirlpool Corp. | | 863 | | | 145,536 |
Total Home Furnishings | | | | | 186,727 |
|
Household Products/Wares — 0.2% |
Avery Dennison Corp. | | 99 | | | 11,371 |
Church & Dwight Co., Inc. | | 171 | | | 8,579 |
Clorox Co. (The) | | 105 | | | 15,618 |
Kimberly-Clark Corp. | | 96 | | | 11,583 |
Total Household Products/Wares | | | | | 47,151 |
|
Housewares — 0.3% | | | | | |
Newell Brands, Inc. | | 2,497 | | | 77,157 |
| | | | | |
Insurance — 5.8% | | | | | |
Aflac, Inc. | | 106 | | | 9,305 |
Allstate Corp. (The) | | 978 | | | 102,406 |
American International Group, Inc. | | 1,757 | | | 104,682 |
Aon PLC | | 375 | | | 50,250 |
Arthur J Gallagher & Co. | | 607 | | | 38,411 |
Assurant, Inc. | | 1,654 | | | 166,789 |
Berkshire Hathaway, Inc.,
Class B* | | 75 | | | 14,867 |
Chubb Ltd. | | 394 | | | 57,575 |
Everest Re Group Ltd. | | 508 | | | 112,400 |
Hartford Financial Services Group, Inc. (The) | | 2,080 | | | 117,063 |
Lincoln National Corp. | | 1,475 | | | 113,383 |
Loews Corp. | | 170 | | | 8,505 |
Marsh & McLennan Cos., Inc. | | 631 | | | 51,357 |
MetLife, Inc. | | 2,421 | | | 122,406 |
Principal Financial Group, Inc. | | 1,297 | | | 91,516 |
Progressive Corp. (The) | | 1,638 | | | 92,252 |
Prudential Financial, Inc. | | 1,032 | | | 118,659 |
See accompanying Notes to Financial Statements.
23
ADVISORSHARES MADRONA DOMESTIC ETF
Schedule of Investments (continued)
December 31, 2017 (Unaudited)
| | | | |
COMMON STOCKS (continued) |
| | | | | |
Insurance (continued) | | | | | |
Torchmark Corp. | | 353 | | $ | 32,021 |
Travelers Cos., Inc. (The) | | 170 | | | 23,059 |
Unum Group | | 1,156 | | | 63,453 |
Willis Towers Watson PLC | | 342 | | | 51,536 |
XL Group Ltd. (Bermuda) | | 4,240 | | | 149,078 |
Total Insurance | | | | | 1,690,973 |
| | | | | |
Internet — 2.3% | | | | | |
Alphabet, Inc., Class A* | | 75 | | | 79,005 |
Alphabet, Inc., Class C* | | 80 | | | 83,712 |
Amazon.com, Inc.* | | 18 | | | 21,050 |
eBay, Inc.* | | 812 | | | 30,645 |
Expedia, Inc. | | 533 | | | 63,837 |
F5 Networks, Inc.* | | 580 | | | 76,108 |
Facebook, Inc., Class A* | | 708 | | | 124,934 |
Netflix, Inc.* | | 81 | | | 15,549 |
Priceline Group, Inc. (The)* | | 36 | | | 62,559 |
Symantec Corp. | | 1,547 | | | 43,409 |
TripAdvisor, Inc.*(a) | | 301 | | | 10,372 |
VeriSign, Inc.*(a) | | 545 | | | 62,370 |
Total Internet | | | | | 673,550 |
| | | | | |
Iron/Steel — 0.6% | | | | | |
Nucor Corp. | | 2,911 | | | 185,081 |
| | | | | |
Leisure Time — 1.2% | | | | | |
Carnival Corp. | | 1,247 | | | 82,763 |
Harley-Davidson, Inc. | | 2,263 | | | 115,142 |
Royal Caribbean Cruises Ltd. | | 1,326 | | | 158,165 |
Total Leisure Time | | | | | 356,070 |
| | | | | |
Lodging — 1.1% | | | | | |
Hilton Worldwide Holdings, Inc. | | 941 | | | 75,148 |
Marriott International, Inc., Class A | | 487 | | | 66,101 |
MGM Resorts International | | 1,520 | | | 50,753 |
Wyndham Worldwide Corp. | | 927 | | | 107,411 |
Wynn Resorts Ltd. | | 126 | | | 21,242 |
Total Lodging | | | | | 320,655 |
| | | | | |
Machinery – Construction & Mining — 0.2% |
Caterpillar, Inc. | | 369 | | | 58,147 |
| | | | | |
Machinery – Diversified — 0.9% |
Cummins, Inc. | | 428 | | | 75,602 |
Deere & Co. | | 323 | | | 50,553 |
Flowserve Corp. | | 269 | | | 11,333 |
Rockwell Automation, Inc. | | 154 | | | 30,238 |
Roper Technologies, Inc. | | 128 | | | 33,152 |
| | | | |
COMMON STOCKS (continued) |
| | | | | |
Machinery – Diversified (continued) |
Xylem, Inc. | | 795 | | $ | 54,219 |
Total Machinery – Diversified | | | | | 255,097 |
| | | | | |
Media — 2.8% | | | | | |
CBS Corp., Class B | | 2,484 | | | 146,556 |
Charter Communications, Inc., Class A* | | 31 | | | 10,415 |
Comcast Corp., Class A | | 1,418 | | | 56,791 |
Discovery Communications, Inc., Class A*(a) | | 6,294 | | | 140,860 |
Discovery Communications, Inc., Class C* | | 6,842 | | | 144,845 |
News Corp., Class A | | 1,677 | | | 27,184 |
News Corp., Class B | | 1,382 | | | 22,941 |
Scripps Networks Interactive, Inc., Class A | | 267 | | | 22,796 |
Time Warner, Inc. | | 511 | | | 46,741 |
Twenty-First Century Fox, Inc., Class A | | 2,352 | | | 81,215 |
Twenty-First Century Fox, Inc., Class B | | 2,383 | | | 81,308 |
Viacom, Inc., Class B | | 720 | | | 22,183 |
Walt Disney Co. (The) | | 274 | | | 29,458 |
Total Media | | | | | 833,293 |
| | | | | |
Mining — 0.8% | | | | | |
Freeport-McMoRan, Inc.* | | 11,876 | | | 225,169 |
| | | | | |
Miscellaneous Manufacturing — 1.7% |
3M Co. | | 93 | | | 21,889 |
AO Smith Corp. | | 783 | | | 47,982 |
Dover Corp. | | 644 | | | 65,038 |
Eaton Corp. PLC | | 759 | | | 59,969 |
General Electric Co. | | 3,326 | | | 58,039 |
Illinois Tool Works, Inc. | | 259 | | | 43,214 |
Ingersoll-Rand PLC | | 620 | | | 55,298 |
Parker-Hannifin Corp. | | 318 | | | 63,466 |
Pentair PLC (United Kingdom) | | 853 | | | 60,239 |
Textron, Inc. | | 558 | | | 31,577 |
Total Miscellaneous Manufacturing | | | | | 506,711 |
| | | | | |
Office/Business Equipment — 0.4% |
Xerox Corp. | | 3,968 | | | 115,667 |
| | | | | |
Oil & Gas — 4.3% | | | | | |
Andeavor | | 1,447 | | | 165,450 |
Apache Corp. | | 367 | | | 15,495 |
Cabot Oil & Gas Corp. | | 2,677 | | | 76,562 |
See accompanying Notes to Financial Statements.
24
ADVISORSHARES MADRONA DOMESTIC ETF
Schedule of Investments (continued)
December 31, 2017 (Unaudited)
| | | | |
COMMON STOCKS (continued) |
| | | | | |
Oil & Gas (continued) | | | | | |
Chevron Corp. | | 1,170 | | $ | 146,472 |
Cimarex Energy Co. | | 1,305 | | | 159,223 |
Concho Resources, Inc.* | | 123 | | | 18,477 |
ConocoPhillips | | 403 | | | 22,121 |
Devon Energy Corp. | | 4,413 | | | 182,698 |
EOG Resources, Inc. | | 214 | | | 23,093 |
EQT Corp. | | 171 | | | 9,733 |
Exxon Mobil Corp. | | 352 | | | 29,441 |
Marathon Petroleum Corp. | | 1,723 | | | 113,684 |
Newfield Exploration Co.* | | 2,036 | | | 64,195 |
Occidental Petroleum Corp. | | 764 | | | 56,276 |
Phillips 66 | | 650 | | | 65,748 |
Pioneer Natural Resources Co. | | 126 | | | 21,779 |
Valero Energy Corp. | | 899 | | | 82,627 |
Total Oil & Gas | | | | | 1,253,074 |
| | | | | |
Oil & Gas Services — 1.2% | | | | | |
Baker Hughes a GE Co. | | 2,323 | | | 73,500 |
Halliburton Co. | | 3,344 | | | 163,421 |
National Oilwell Varco, Inc. | | 589 | | | 21,216 |
Schlumberger Ltd. | | 1,394 | | | 93,942 |
Total Oil & Gas Services | | | | | 352,079 |
| | | | | |
Packaging & Containers — 0.9% |
Ball Corp. | | 1,560 | | | 59,046 |
Packaging Corp. of America | | 404 | | | 48,702 |
Sealed Air Corp. | | 1,522 | | | 75,035 |
WestRock Co. | | 1,501 | | | 94,878 |
Total Packaging & Containers | | | | | 277,661 |
| | | | | |
Pharmaceuticals — 3.3% | | | | | |
AbbVie, Inc. | | 1,191 | | | 115,182 |
Allergan PLC | | 667 | | | 109,108 |
AmerisourceBergen Corp. | | 719 | | | 66,019 |
Bristol-Myers Squibb Co. | | 619 | | | 37,932 |
Cardinal Health, Inc. | | 840 | | | 51,467 |
Eli Lilly & Co. | | 701 | | | 59,206 |
Express Scripts Holding Co.* | | 2,521 | | | 188,167 |
Johnson & Johnson | | 83 | | | 11,597 |
McKesson Corp. | | 918 | | | 143,162 |
Merck & Co., Inc. | | 324 | | | 18,232 |
Mylan NV* | | 1,934 | | | 81,828 |
Perrigo Co. PLC(a) | | 153 | | | 13,335 |
Pfizer, Inc. | | 597 | | | 21,623 |
Zoetis, Inc. | | 652 | | | 46,970 |
Total Pharmaceuticals | | | | | 963,828 |
| | | | |
COMMON STOCKS (continued) |
| | | | | |
Pipelines — 0.3% | | | | | |
Kinder Morgan, Inc. | | 3,389 | | $ | 61,239 |
ONEOK, Inc. | | 265 | | | 14,164 |
Williams Cos., Inc. (The) | | 308 | | | 9,391 |
Total Pipelines | | | | | 84,794 |
| | | | | |
Real Estate — 0.4% | | | | | |
CBRE Group, Inc., Class A* | | 2,602 | | | 112,693 |
| | | | | |
REITS — 2.0% | | | | | |
Alexandria Real Estate Equities, Inc. | | 163 | | | 21,286 |
American Tower Corp. | | 386 | | | 55,071 |
Apartment Investment & Management Co.,
Class A | | 460 | | | 20,107 |
AvalonBay Communities, Inc. | | 93 | | | 16,592 |
Boston Properties, Inc. | | 152 | | | 19,765 |
Crown Castle International Corp. | | 207 | | | 22,979 |
Digital Realty Trust, Inc. | | 172 | | | 19,591 |
Duke Realty Corp. | | 700 | | | 19,047 |
Equinix, Inc. | | 37 | | | 16,769 |
Equity Residential | | 280 | | | 17,856 |
Essex Property Trust, Inc. | | 76 | | | 18,344 |
Extra Space Storage, Inc. | | 170 | | | 14,866 |
Federal Realty Investment Trust | | 140 | | | 18,593 |
GGP, Inc. | | 837 | | | 19,577 |
HCP, Inc. | | 669 | | | 17,448 |
Host Hotels & Resorts, Inc. | | 911 | | | 18,083 |
Iron Mountain, Inc. | | 467 | | | 17,620 |
Kimco Realty Corp. | | 924 | | | 16,771 |
Macerich Co. (The) | | 371 | | | 24,367 |
Mid-America Apartment Communities, Inc. | | 169 | | | 16,995 |
Prologis, Inc. | | 296 | | | 19,095 |
Public Storage | | 80 | | | 16,720 |
Realty Income Corp. | | 338 | | | 19,273 |
Regency Centers Corp. | | 260 | | | 17,987 |
SBA Communications Corp.* | | 89 | | | 14,539 |
Simon Property Group, Inc. | | 73 | | | 12,537 |
UDR, Inc. | | 545 | | | 20,993 |
Ventas, Inc. | | 272 | | | 16,323 |
Vornado Realty Trust | | 151 | | | 11,805 |
Welltower, Inc. | | 282 | | | 17,983 |
Weyerhaeuser Co. | | 501 | | | 17,665 |
Total REITS | | | | | 596,647 |
See accompanying Notes to Financial Statements.
25
ADVISORSHARES MADRONA DOMESTIC ETF
Schedule of Investments (continued)
December 31, 2017 (Unaudited)
| | | | |
COMMON STOCKS (continued) |
| | | | | |
Retail — 8.2% | | | | | |
Advance Auto Parts, Inc. | | 631 | | $ | 62,904 |
AutoZone, Inc.* | | 179 | | | 127,335 |
Best Buy Co., Inc. | | 1,856 | | | 127,080 |
CarMax, Inc.* | | 842 | | | 53,998 |
Chipotle Mexican Grill, Inc.*(a) | | 168 | | | 48,557 |
Costco Wholesale Corp. | | 74 | | | 13,773 |
CVS Health Corp. | | 834 | | | 60,465 |
Darden Restaurants, Inc. | | 612 | | | 58,764 |
Dollar General Corp. | | 828 | | | 77,012 |
Dollar Tree, Inc.* | | 783 | | | 84,024 |
Foot Locker, Inc. | | 2,511 | | | 117,716 |
Gap, Inc. (The) | | 1,888 | | | 64,305 |
Genuine Parts Co. | | 168 | | | 15,962 |
Home Depot, Inc. (The) | | 376 | | | 71,263 |
Kohl’s Corp. | | 1,316 | | | 71,367 |
L Brands, Inc. | | 2,211 | | | 133,146 |
Lowe’s Cos., Inc. | | 1,173 | | | 109,019 |
Macy’s, Inc.(a) | | 5,990 | | | 150,888 |
McDonald’s Corp. | | 77 | | | 13,253 |
Nordstrom, Inc.(a) | | 884 | | | 41,884 |
O’Reilly Automotive, Inc.* | | 319 | | | 76,732 |
PVH Corp. | | 833 | | | 114,296 |
Ross Stores, Inc. | | 1,068 | | | 85,707 |
Signet Jewelers Ltd.(a) | | 1,567 | | | 88,614 |
Starbucks Corp. | | 1,179 | | | 67,710 |
Tapestry, Inc. | | 1,570 | | | 69,441 |
Target Corp. | | 302 | | | 19,706 |
Tiffany & Co. | | 346 | | | 35,967 |
TJX Cos., Inc. (The) | | 905 | | | 69,196 |
Tractor Supply Co. | | 980 | | | 73,255 |
Ulta Beauty, Inc.* | | 434 | | | 97,069 |
Walgreens Boots Alliance, Inc. | | 844 | | | 61,291 |
Wal-Mart Stores, Inc. | | 119 | | | 11,751 |
Yum! Brands, Inc. | | 507 | | | 41,376 |
Total Retail | | | | | 2,414,826 |
| | | | | |
Savings & Loans — 0.1% | | | | | |
People’s United Financial, Inc. | | 934 | | | 17,466 |
| | | | | |
Semiconductors — 5.1% | | | | | |
Advanced Micro Devices, Inc.*(a) | | 1,428 | | | 14,680 |
Analog Devices, Inc. | | 747 | | | 66,505 |
Applied Materials, Inc. | | 3,357 | | | 171,610 |
| | | | |
COMMON STOCKS (continued) |
| | | | | |
Semiconductors (continued) | | | | | |
Broadcom Ltd. | | 577 | | $ | 148,231 |
Intel Corp. | | 1,697 | | | 78,333 |
KLA-Tencor Corp. | | 1,422 | | | 149,410 |
Lam Research Corp. | | 879 | | | 161,798 |
Microchip Technology, Inc.(a) | | 1,327 | | | 116,617 |
Micron Technology, Inc.* | | 4,469 | | | 183,765 |
NVIDIA Corp. | | 46 | | | 8,901 |
Qorvo, Inc.* | | 2,043 | | | 136,064 |
QUALCOMM, Inc. | | 1,265 | | | 80,985 |
Skyworks Solutions, Inc. | | 1,299 | | | 123,340 |
Texas Instruments, Inc. | | 398 | | | 41,567 |
Xilinx, Inc. | | 150 | | | 10,113 |
Total Semiconductors | | | | | 1,491,919 |
| | | | | |
Software — 2.5% | | | | | |
Activision Blizzard, Inc. | | 959 | | | 60,724 |
Adobe Systems, Inc.* | | 430 | | | 75,353 |
Akamai Technologies, Inc.* | | 1,262 | | | 82,081 |
ANSYS, Inc.* | | 74 | | | 10,922 |
Autodesk, Inc.* | | 183 | | | 19,184 |
CA, Inc. | | 465 | | | 15,475 |
Cadence Design Systems, Inc.* | | 448 | | | 18,735 |
Cerner Corp.* | | 718 | | | 48,386 |
Citrix Systems, Inc.* | | 998 | | | 87,824 |
Electronic Arts, Inc.* | | 287 | | | 30,152 |
Fidelity National Information Services, Inc. | | 610 | | | 57,395 |
Fiserv, Inc.* | | 387 | | | 50,747 |
Intuit, Inc. | | 288 | | | 45,441 |
Microsoft Corp. | | 130 | | | 11,120 |
Oracle Corp. | | 1,157 | | | 54,703 |
Paychex, Inc. | | 176 | | | 11,982 |
Red Hat, Inc.* | | 188 | | | 22,579 |
salesforce.com, Inc.* | | 187 | | | 19,117 |
Synopsys, Inc.* | | 105 | | | 8,950 |
Total Software | | | | | 730,870 |
| | | | | |
Telecommunications — 0.8% | | | | | |
AT&T, Inc. | | 350 | | | 13,608 |
CenturyLink, Inc. | | 334 | | | 5,571 |
Cisco Systems, Inc. | | 921 | | | 35,274 |
Juniper Networks, Inc. | | 4,755 | | | 135,518 |
Motorola Solutions, Inc. | | 316 | | | 28,548 |
See accompanying Notes to Financial Statements.
26
ADVISORSHARES MADRONA DOMESTIC ETF
Schedule of Investments (continued)
December 31, 2017 (Unaudited)
| | | | |
COMMON STOCKS (continued) |
|
Telecommunications (continued) |
Verizon Communications, Inc. | | | 312 | | $ | 16,514 |
Total Telecommunications | | | | | | 235,033 |
|
Textiles — 0.0%** | | | | | | |
Mohawk Industries, Inc.* | | | 31 | | | 8,553 |
|
Toys/Games/Hobbies — 0.2% |
Hasbro, Inc. | | | 466 | | | 42,355 |
Mattel, Inc. | | | 771 | | | 11,858 |
Total Toys/Games/Hobbies | | | | | | 54,213 |
|
Transportation — 1.5% | | | | | | |
C.H. Robinson Worldwide, Inc. | | | 145 | | | 12,918 |
CSX Corp. | | | 823 | | | 45,273 |
Expeditors International of Washington, Inc. | | | 503 | | | 32,539 |
FedEx Corp. | | | 312 | | | 77,856 |
JB Hunt Transport Services, Inc. | | | 458 | | | 52,661 |
Kansas City Southern | | | 551 | | | 57,976 |
Norfolk Southern Corp. | | | 424 | | | 61,438 |
Union Pacific Corp. | | | 497 | | | 66,648 |
United Parcel Service, Inc., Class B | | | 337 | | | 40,154 |
Total Transportation | | | | | | 447,463 |
|
Water — 0.0%** | | | | | | |
American Water Works Co., Inc. | | | 124 | | | 11,345 |
Total Common Stocks | | | | | | |
(Cost $23,608,737) | | | | | | 28,925,176 |
|
MONEY MARKET FUND — 1.5% |
BlackRock Liquidity Funds FedFund Portfolio, Institutional Class 1.17%(c) (Cost $449,530) | | | 449,530 | | | 449,530 |
|
REPURCHASE AGREEMENTS — 2.1%(d) |
Citigroup Global Markets, Inc., dated 12/29/17, due 01/02/18, 1.39%, total to be received $106,361, (collateralized by various U.S. Government Agency Obligations, 0.00% – 4.38%, 02/15/18 – 11/15/39, totaling $107,941) | | $ | 106,349 | | | 106,349 |
| | | | |
REPURCHASE AGREEMENTS (continued) |
| | | | | | | |
Daiwa Capital Markets America, dated 12/29/17, due 01/02/18, 1.43%, total to be received $250,030, (collateralized by various U.S. Government Agency Obligations, 0.00% – 6.50%, 01/11/18 – 12/01/51, totaling $254,353) | | $ | 250,000 | | $ | 250,000 | |
RBC Dominion Securities, Inc., dated 12/29/17, due 01/02/18, 1.40%, total to be received $250,029, (collateralized by various U.S. Government Agency Obligations, 1.88% – 8.88%, 02/15/19 – 12/20/47, totaling $254,210) | | | 250,000 | | | 250,000 | |
Total Repurchase Agreements |
(Cost $606,349) | | | | | | 606,349 | |
| | | | | | | |
Total Investments — 102.1% | | | | | | | |
(Cost $24,664,616) | | | | | | 29,981,055 | |
| | | | | | | |
Liabilities in Excess of Other Assets — (2.1%) | | | | | | (617,975 | ) |
Net Assets — 100.0% | | | | | $ | 29,363,080 | |
See accompanying Notes to Financial Statements.
27
ADVISORSHARES MADRONA DOMESTIC ETF
Schedule of Investments (continued)
December 31, 2017 (Unaudited)
SUMMARY OF SCHEDULE OF INVESTMENTS
| | |
Advertising | | 0.4 | % |
Aerospace/Defense | | 1.6 | |
Agriculture | | 0.7 | |
Airlines | | 1.2 | |
Apparel | | 1.1 | |
Auto Manufacturers | | 1.3 | |
Auto Parts & Equipment | | 1.2 | |
Banks | | 6.3 | |
Beverages | | 1.0 | |
Biotechnology | | 1.3 | |
Building Materials | | 1.6 | |
Chemicals | | 1.7 | |
Commercial Services | | 3.4 | |
Computers | | 3.1 | |
Cosmetics/Personal Care | | 0.4 | |
Distribution/Wholesale | | 0.9 | |
Diversified Financial Services | | 7.2 | |
Electric | | 1.4 | |
Electrical Components & Equipment | | 0.6 | |
Electronics | | 1.0 | |
Engineering & Construction | | 0.5 | |
Environmental Control | | 0.3 | |
Food | | 1.7 | |
Forest Products & Paper | | 0.2 | |
Gas | | 0.2 | |
Hand/Machine Tools | | 0.6 | |
Healthcare – Products | | 2.6 | |
Healthcare – Services | | 3.3 | |
Holding Companies – Diversified | | 0.2 | |
Home Builders | | 1.8 | |
Home Furnishings | | 0.6 | |
Household Products/Wares | | 0.2 | |
Housewares | | 0.3 | |
Insurance | | 5.8 | |
Internet | | 2.3 | |
Iron/Steel | | 0.6 | |
Leisure Time | | 1.2 | |
Lodging | | 1.1 | |
Machinery – Construction & Mining | | 0.2 | |
Machinery – Diversified | | 0.9 | |
Media | | 2.8 | |
Mining | | 0.8 | |
SUMMARY OF SCHEDULE OF INVESTMENTS (continued)
| | |
Miscellaneous Manufacturing | | 1.7 | % | |
Office/Business Equipment | | 0.4 | | |
Oil & Gas | | 4.3 | | |
Oil & Gas Services | | 1.2 | | |
Packaging & Containers | | 0.9 | | |
Pharmaceuticals | | 3.3 | | |
Pipelines | | 0.3 | | |
Real Estate | | 0.4 | | |
REITS | | 2.0 | | |
Retail | | 8.2 | | |
Savings & Loans | | 0.1 | | |
Semiconductors | | 5.1 | | |
Software | | 2.5 | | |
Telecommunications | | 0.8 | | |
Textiles | | 0.0 | ** | |
Toys/Games/Hobbies | | 0.2 | | |
Transportation | | 1.5 | | |
Water | | 0.0 | ** | |
Money Market Fund | | 1.5 | | |
Repurchase Agreements | | 2.1 | | |
Total Investments | | 102.1 | | |
Liabilities in Excess of Other Assets | | (2.1 | ) | |
Net Assets | | 100.0 | % | |
See accompanying Notes to Financial Statements.
28
ADVISORSHARES MADRONA GLOBAL BOND ETF
Schedule of Investments
December 31, 2017 (Unaudited)
| | | | |
EXCHANGE TRADED FUNDS — 98.3% | | | |
| | | |
Asset Allocation Fund — 12.7% | | | |
SPDR Bloomberg Barclays Convertible Securities ETF(a) | | 47,230 | | $ | 2,389,838 |
| | | |
Debt Fund — 85.6% | | | | | |
AdvisorShares Peritus High Yield ETF† | | 35,991 | | | 1,301,147 |
iShares iBoxx $ Investment Grade Corporate Bond ETF | | 19,945 | | | 2,424,514 |
PowerShares Emerging Markets Sovereign Debt Portfolio | | 37,384 | | | 1,104,323 |
PowerShares Financial Preferred Portfolio(a) | | 117,600 | | | 2,219,112 |
PowerShares Fundamental Investment Grade Corporate Bond Portfolio(a) | | 28,924 | | | 739,587 |
PowerShares International Corporate Bond Portfolio(a) | | 33,834 | | | 933,480 |
PowerShares National AMT-Free Municipal Bond Portfolio(a) | | 21,751 | | | 561,393 |
PowerShares Senior Loan Portfolio | | 64,366 | | | 1,482,993 |
PowerShares Taxable Municipal Portfolio(a) | | 24,366 | | | 747,792 |
PowerShares Variable Rate Preferred Portfolio | | 21,425 | | | 549,765 |
SPDR Bloomberg Barclays High Yield Bond ETF(a) | | 14,969 | | | 549,662 |
Vanguard Intermediate-Term Treasury ETF(a) | | 8,589 | | | 549,267 |
Vanguard Long-Term Treasury ETF(a) | | 4,772 | | | 372,216 |
Vanguard Mortgage-Backed Securities ETF | | 24,570 | | | 1,288,451 |
WisdomTree Emerging Markets Corporate Bond Fund | | 17,772 | | | 1,295,223 |
Total Debt Fund | | | | | 16,118,925 |
Total Exchange Traded Funds | | | | | |
(Cost $18,192,863) | | | | | 18,508,763 |
| | | |
MONEY MARKET FUNDS — 3.8% | | | |
BlackRock Liquidity Funds FedFund Portfolio, Institutional Class,
1.17%(b)(c) | | 124,000 | | | 124,000 |
BlackRock Liquidity Funds FedFund Portfolio, Institutional Class,
1.17%(b) | | 346,835 | | | 346,835 |
Morgan Stanley Institutional Liquidity Funds – Government Portfolio, Institutional Class,
1.20%(b)(c) | | 121,000 | | | 121,000 |
| | | | |
MONEY MARKET FUNDS (continued) | | | |
| | | |
Invesco STIT – Government & Agency Portfolio, Institutional Class, 1.18%(b)(c) | | | 125,000 | | $ | 125,000 |
Total Money Market Funds | | | | | | |
(Cost $716,835) | | | | | | 716,835 |
| | | | | | |
REPURCHASE AGREEMENTS — 28.1%(c) | | | |
BNP Paribas Securities Corp., dated 12/29/17, due 01/02/18, 1.40%, total to be received $1,320,630, (collateralized by various U.S. Government Agency Obligations, 0.00% – 7.00%, 03/31/19 – 10/20/47, totaling $1,343,486) | | $ | 1,320,476 | | | 1,320,476 |
Citigroup Global Markets, Inc., dated 12/29/17, due 01/02/18, 1.41%, total to be received $1,320,631, (collateralized by various U.S. Government Agency Obligations, 0.00% – 9.00%, 04/01/18 – 08/20/67, totaling $1,342,706) | | | 1,320,476 | | | 1,320,476 |
Daiwa Capital Markets America, dated 12/29/17, due 01/02/18, 1.43%, total to be received $1,320,633, (collateralized by various U.S. Government Agency Obligations, 0.00% – 6.50%, 01/11/18 – 12/01/51, totaling $1,343,468) | | | 1,320,476 | | | 1,320,476 |
Merrill Lynch Pierce Fenner & Smith, Inc., dated 12/29/17, due 01/02/18, 1.40%, total to be received $21,345, (collateralized by various U.S. Government Agency Obligations, 1.88% – 2.75%, 07/31/22 – 08/15/42, totaling $21,597) | | | 21,343 | | | 21,343 |
See accompanying Notes to Financial Statements.
29
ADVISORSHARES MADRONA GLOBAL BOND ETF
Schedule of Investments (continued)
December 31, 2017 (Unaudited)
| | | | |
REPURCHASE AGREEMENTS (continued) | | | |
| | | | | | |
RBC Dominion Securities, Inc., dated 12/29/17, due 01/02/18, 1.40%, total to be received $1,320,630, (collateralized by various U.S. Government Agency Obligations, 1.88% – 8.88%, 02/15/19 – 12/20/47, totaling $1,342,715) | | $ | 1,320,476 | | $ | 1,320,476 |
Total Repurchase Agreements |
(Cost $5,303,247) | | | | | | 5,303,247 |
| | | | | | |
Total Investments — 130.2% | | | | | | |
(Cost $24,212,945) | | | | | | 24,528,845 |
| | | | | | |
Liabilities in Excess of Other Assets — (30.2%) | | | | | | (5,690,641) |
| | | | | | |
Net Assets — 100.0% | | | | | $ | 18,838,204 |
SUMMARY OF SCHEDULE OF INVESTMENTS
| | |
Asset Allocation Fund | | 12.7 | % |
Debt Fund | | 85.6 | |
Money Market Funds | | 3.8 | |
Repurchase Agreements | | 28.1 | |
Total Investments | | 130.2 | |
Liabilities in Excess of Other Assets | | (30.2 | ) |
Net Assets | | 100.0 | % |
See accompanying Notes to Financial Statements.
30
ADVISORSHARES MADRONA INTERNATIONAL ETF
Schedule of Investments
December 31, 2017 (Unaudited)
| | | | |
COMMON STOCKS — 100.9% | | | |
| | | | | |
ARGENTINA — 3.2% | | | | | |
Empresa Distribuidora Y Comercializadora Norte*(a) | | 3,025 | | $ | 150,343 |
Grupo Supervielle SA(a) | | 4,304 | | | 126,193 |
Pampa Energia SA*(a) | | 1,672 | | | 112,492 |
Telecom Argentina SA(a)(b) | | 940 | | | 34,432 |
Total Argentina | | | | | 423,460 |
| | | | | |
BELGIUM — 2.4% | | | | | |
Anheuser-Busch InBev SA/NV(a)(b) | | 2,885 | | | 321,851 |
| | | | | |
BRAZIL — 5.9% | | | | | |
Banco Bradesco SA(a) | | 6,338 | | | 64,901 |
Banco Santander Brasil SA(a) | | 7,741 | | | 74,855 |
Cia Brasileira de Distribuicao(a) | | 4,154 | | | 97,910 |
Cia de Saneamento Basico do Estado de Sao Paulo(a) | | 11,253 | | | 117,594 |
Embraer SA(a) | | 2,630 | | | 62,936 |
Fibria Celulose SA(a) | | 6,068 | | | 89,200 |
Itau Unibanco Holding SA(a) | | 3,159 | | | 41,067 |
Telefonica Brasil SA(a) | | 3,011 | | | 44,653 |
TIM Participacoes SA(a) | | 3,353 | | | 64,746 |
Vale SA(a) | | 9,178 | | | 112,247 |
Total Brazil | | | | | 770,109 |
| | | | | |
CANADA — 3.9% | | | | | |
Canadian Solar, Inc.*(b) | | 10,671 | | | 179,913 |
CGI Group, Inc., Class A* | | 1,391 | | | 75,573 |
Magna International, Inc. | | 2,660 | | | 150,742 |
Manulife Financial Corp.(b) | | 5,272 | | | 109,974 |
Total Canada | | | | | 516,202 |
| | | | | |
CHILE — 1.3% | | | | | |
Banco Santander Chile(a) | | 601 | | | 18,793 |
Latam Airlines Group SA(a)(b) | | 7,092 | | | 98,579 |
Sociedad Quimica y Minera de Chile SA(a)(b) | | 823 | | | 48,862 |
Total Chile | | | | | 166,234 |
| | | | | |
CHINA — 15.8% | | | | | |
51job, Inc.*(a)(b) | | 407 | | | 24,766 |
58.com, Inc.*(a) | | 371 | | | 26,552 |
Alibaba Group
Holding Ltd.*(a)(b) | | 2,233 | | | 385,036 |
Autohome, Inc.*(a) | | 924 | | | 59,755 |
Baidu, Inc.*(a) | | 170 | | | 39,816 |
Bitauto Holdings Ltd.*(a)(b) | | 1,446 | | | 45,983 |
Changyou.com Ltd.*(a) | | 2,769 | | | 100,875 |
Cheetah Mobile, Inc.*(a)(b) | | 10,094 | | | 121,935 |
| | | | |
COMMON STOCKS (continued) | | | |
| | | | | |
CHINA (continued) | | | | | |
Daqo New Energy Corp.*(a) | | 2,683 | | $ | 159,477 |
Fang Holdings Ltd.*(a)(b) | | 5,364 | | | 29,931 |
Huaneng Power International, Inc.(a)(b) | | 1,811 | | | 45,275 |
Jumei International Holding Ltd.*(a)(b) | | 38,416 | | | 112,175 |
Momo, Inc.*(a) | | 2,893 | | | 70,821 |
NetEase, Inc.(a)(b) | | 282 | | | 97,310 |
New Oriental Education & Technology Group, Inc.(a) | | 428 | | | 40,232 |
Noah Holdings Ltd.*(a) | | 1,586 | | | 73,400 |
NQ Mobile, Inc., Class A*(a)(b) | | 24,197 | | | 97,272 |
Tarena International, Inc.(a)(b) | | 7,205 | | | 108,003 |
Vipshop Holdings Ltd.*(a) | | 8,920 | | | 104,542 |
Xinyuan Real Estate Co., Ltd.(a) | | 11,378 | | | 77,484 |
Yirendai Ltd.(a)(b) | | 1,745 | | | 76,728 |
YY, Inc.*(a) | | 827 | | | 93,501 |
ZTO Express Cayman, Inc.*(a) | | 5,708 | | | 90,472 |
Total China | | | | | 2,081,341 |
| | | | | |
COLOMBIA — 1.5% | | | | | |
Bancolombia SA(a)(b) | | 696 | | | 27,604 |
Ecopetrol SA(a)(b) | | 11,448 | | | 167,484 |
Total Colombia | | | | | 195,088 |
| | | | | |
FINLAND — 2.8% | | | | | |
Nokia OYJ(a) | | 79,624 | | | 371,048 |
| | | | | |
FRANCE — 2.4% | | | | | |
Criteo SA*(a) | | 12,227 | | | 318,269 |
| | | | | |
INDIA — 1.0% | | | | | |
HDFC Bank Ltd.(a) | | 624 | | | 63,442 |
Infosys Ltd.(a)(b) | | 1,367 | | | 22,173 |
WNS Holdings Ltd.*(a) | | 1,074 | | | 43,099 |
Total India | | | | | 128,714 |
| | | | | |
IRELAND — 1.3% | | | | | |
Trinity Biotech PLC*(a)(b) | | 33,971 | | | 173,592 |
| | | | | |
ISRAEL — 4.2% | | | | | |
Teva Pharmaceutical Industries Ltd.(a)(b) | | 29,516 | | | 559,328 |
| | | | | |
LUXEMBOURG — 4.0% | | | | | |
Ternium SA(a) | | 16,645 | | | 525,816 |
See accompanying Notes to Financial Statements.
31
ADVISORSHARES MADRONA INTERNATIONAL ETF
Schedule of Investments (continued)
December 31, 2017 (Unaudited)
| | | | |
COMMON STOCKS (continued) | | | |
| | | | | |
MEXICO — 1.4% | | | | | |
America Movil SAB de CV, Class L(a) | | 4,882 | | $ | 83,726 |
Cemex SAB de CV*(a) | | 10,671 | | | 80,032 |
Grupo Televisa SAB(a) | | 1,377 | | | 25,709 |
Total Mexico | | | | | 189,467 |
| | | | | |
NETHERLANDS – 17.3% | | | | | |
Aegon NV(c) | | 88,830 | | | 559,629 |
Royal Dutch Shell PLC, Class A(a) | | 10,315 | | | 688,114 |
Royal Dutch Shell PLC, Class B(a)(b) | | 8,148 | | | 556,427 |
VEON Ltd.(a) | | 123,136 | | | 472,842 |
Total Netherlands | | | | | 2,277,012 |
| | | | | |
NORWAY — 4.1% | | | | | |
Statoil ASA(a) | | 25,294 | | | 541,798 |
| | | | | |
PERU — 0.9% | | | | | |
Cia de Minas Buenaventura SAA(a) | | 8,254 | | | 116,216 |
| | | | | |
RUSSIA — 0.8% | | | | | |
Mobile TeleSystems PJSC(a) | | 4,901 | | | 49,941 |
QIWI PLC(a) | | 3,431 | | | 59,459 |
Total Russia | | | | | 109,400 |
| | | | | |
SOUTH AFRICA — 0.3% | | | | | |
MiX Telematics Ltd.(a) | | 3,603 | | | 45,974 |
| | | | | |
SOUTH KOREA — 0.9% | | | | | |
Hanwha Q CELLS Co.
Ltd.*(a)(b) | | 1,830 | | | 12,846 |
LG Display Co., Ltd.(a)(b) | | 7,372 | | | 101,439 |
Total South Korea | | | | | 114,285 |
| | | | | |
SPAIN — 2.6% | | | | | |
Grifols SA(a) | | 14,712 | | | 337,199 |
| | | | | |
SWITZERLAND — 4.4% | | | | | |
STMicroelectronics NV(b) (c) | | 26,547 | | | 579,786 |
| | | | | |
TAIWAN — 6.0% | | | | | |
Advanced Semiconductor Engineering, Inc.(a) | | 4,410 | | | 28,577 |
Himax Technologies, Inc.(a) | | 3,047 | | | 31,750 |
Silicon Motion Technology Corp.(a)(b) | | 11,031 | | | 584,202 |
Siliconware Precision Industries Co., Ltd.(a)(b) | | 9,695 | | | 81,535 |
| | | | |
COMMON STOCKS (continued) | | | |
| | | | | | |
TAIWAN (continued) | | | | | | |
Taiwan Semiconductor Manufacturing Co., Ltd.(a) | | | 1,442 | | $ | 57,175 |
Total Taiwan | | | | | | 783,239 |
| | | | | | |
UNITED KINGDOM — 4.2% | | | | | | |
BP PLC(a) | | | 13,236 | | | 556,309 |
| | | | | | |
UNITED STATES — 8.3% | | | | | | |
Carnival PLC(a)(b) | | | 4,647 | | | 308,003 |
Mitel Networks Corp.* | | | 25,985 | | | 213,856 |
Shire PLC(a) | | | 3,365 | | | 521,979 |
Tucows, Inc., Class A*(b) | | | 619 | | | 43,361 |
Total United States | | | | | | 1,087,199 |
Total Common Stocks | | | | | | |
(Cost $11,319,423) | | | | | | 13,288,936 |
| | | | | | |
MONEY MARKET FUNDS — 3.6%(e) | | | |
BlackRock Liquidity Funds FedFund Portfolio, Institutional Class 1.17%(d) | | | 158,000 | | | 158,000 |
Morgan Stanley Institutional Liquidity Funds – Government Portfolio, Institutional Class 1.20%(d) | | | 154,000 | | | 154,000 |
Invesco STIT – Government & Agency Portfolio, Institutional Class 1.18%(d) | | | 159,000 | | | 159,000 |
Total Money Market Funds | | | | | | |
(Cost $471,000) | | | | | | 471,000 |
| | | | | | |
REPURCHASE AGREEMENTS — 21.8%(e) | | | |
Citigroup Global Markets, Inc., dated 12/29/17, due 01/02/18, 1.41%, total to be received $777,542, (collateralized by various U.S. Government Agency Obligations, 0.00% – 9.00%, 04/01/18 – 08/20/67, totaling $790,539) | | $ | 777,451 | | | 777,451 |
Daiwa Capital Markets America, dated 12/29/17, due 01/02/18, 1.43%, total to be received $777,544, (collateralized by various U.S. Government Agency Obligations, 0.00% – 6.50%, 01/11/18 – 12/01/51, totaling $790,988) | | | 777,451 | | | 777,451 |
See accompanying Notes to Financial Statements.
32
ADVISORSHARES MADRONA INTERNATIONAL ETF
Schedule of Investments (continued)
December 31, 2017 (Unaudited)
| | | | |
REPURCHASE AGREEMENTS (continued) | | | |
| | | | | | |
Mizuho Securities USA, Inc., dated 12/29/17, due 01/02/18, 1.38%, total to be received $536,846, (collateralized by various U.S. Government Agency Obligations, 0.00% – 2.13%, 07/19/18 – 09/30/24, totaling $545,853) | | $ | 536,784 | | $ | 536,784 |
RBC Dominion Securities, Inc., dated 12/29/17, due 01/02/18, 1.40%, total to be received $777,542, (collateralized by various U.S. Government Agency Obligations, 1.88% – 8.88%, 02/15/19 – 12/20/47, totaling $790,544) | | | 777,451 | | | 777,451 |
Total Repurchase Agreements | | | | | | |
(Cost $2,869,137) | | | | | | 2,869,137 |
| | | | | | |
Total Investments — 126.3% | | | | | | |
(Cost $14,659,560) | | | | | | 16,629,073 |
| | | | | | |
Liabilities in Excess of Other Assets — (26.3%) | | | | | | (3,465,372) |
| | | | | | |
Net Assets — 100.0% | | | | | $ | 13,163,701 |
SUMMARY OF SCHEDULE OF INVESTMENTS
| | |
Aerospace/Defense | | 0.5 | % |
Airlines | | 0.7 | |
Auto Parts & Equipment | | 1.1 | |
Banks | | 3.2 | |
Beverages | | 2.4 | |
Building Materials | | 0.6 | |
Chemicals | | 1.6 | |
Commercial Services | | 1.6 | |
Computers | | 1.1 | |
Diversified Financial Services | | 1.1 | |
Electric | | 2.3 | |
Electronics | | 0.8 | |
Energy – Alternate Sources | | 1.5 | |
Food | | 0.7 | |
Forest Products & Paper | | 0.7 | |
Healthcare – Products | | 1.3 | |
Insurance | | 5.1 | |
Internet | | 9.7 | |
Iron/Steel | | 4.8 | |
Leisure Time | | 2.3 | |
Media | | 0.2 | |
Mining | | 0.9 | |
Oil & Gas | | 19.1 | |
Pharmaceuticals | | 10.8 | |
Real Estate | | 0.6 | |
Semiconductors | | 10.4 | |
Software | | 5.7 | |
Telecommunications | | 8.5 | |
Transportation | | 0.7 | |
Water | | 0.9 | |
Money Market Funds | | 3.6 | |
Repurchase Agreements | | 21.8 | |
Total Investments | | 126.3 | |
Liabilities in Excess of Other Assets | | (26.3 | ) |
Net Assets | | 100.0 | % |
See accompanying Notes to Financial Statements.
33
ADVISORSHARES MEIDELL TACTICAL ADVANTAGE ETF
Schedule of Investments
December 31, 2017 (Unaudited)
| | | | |
EXCHANGE TRADED FUNDS — 95.4% | | | |
| | | | | | |
Equity Fund — 95.4% | | | | | | |
iShares Core S&P Mid-Cap ETF | | | 14,411 | | $ | 2,734,920 |
iShares Core S&P Small-Cap ETF(a) | | | 53,229 | | | 4,088,519 |
iShares Micro-Cap ETF | | | 14,200 | | | 1,359,082 |
iShares MSCI Emerging Markets ETF | | | 29,255 | | | 1,378,496 |
iShares Nasdaq Biotechnology ETF | | | 12,720 | | | 1,358,114 |
iShares U.S. Financials ETF(a) | | | 11,311 | | | 1,350,873 |
SPDR S&P Regional Banking ETF(a) | | | 22,911 | | | 1,348,312 |
Total Exchange Traded Funds | | | | | | |
(Cost $13,598,928) | | | | | | 13,618,316 |
| | | | | | |
MONEY MARKET FUNDS — 8.0% | | | |
BlackRock Liquidity Funds FedFund Portfolio, Institutional Class,
1.17%(b) (c) | | | 151,000 | | | 151,000 |
Dreyfus Institutional Treasury and Agency Cash Advantage Fund, 1.23%(b) | | | 689,528 | | | 689,528 |
Morgan Stanley Institutional Liquidity Funds – Government Portfolio, Institutional Class,
1.20%(b)(c) | | | 148,000 | | | 148,000 |
Invesco STIT – Government & Agency Portfolio, Institutional Class, 1.18%(b)(c) | | | 152,000 | | | 152,000 |
Total Money Market Funds | | | | | | |
(Cost $1,140,528) | | | | | | 1,140,528 |
| | | | | | |
REPURCHASE AGREEMENTS — 27.3%(c) | | | |
Citigroup Global Markets, Inc., dated 12/29/17, due 01/02/18, 1.41%, total to be received $1,010,704, (collateralized by various U.S. Government Agency Obligations, 0.00% – 9.00%, 04/01/18 – 08/20/67, totaling $1,027,598) | | $ | 1,010,585 | | | 1,010,585 |
Daiwa Capital Markets America, dated 12/29/17, due 01/02/18, 1.43%, total to be received $1,010,705, (collateralized by various U.S. Government Agency Obligations, 0.00% – 6.50%, 01/11/18 – 12/01/51, totaling $1,028,182) | | | 1,010,585 | | | 1,010,585 |
| | | | |
REPURCHASE AGREEMENTS (continued) | | | | |
| | | | | | | |
HSBC Securities USA, Inc., dated 12/29/17, due 01/02/18, 1.36%, total to be received $859,140, (collateralized by various U.S. Government Agency Obligations, 0.00% – 9.13%, 12/31/17 – 05/15/47, totaling $872,104) | | $ | 859,043 | | $ | 859,043 | |
RBC Dominion Securities, Inc., dated 12/29/17, due 01/02/18, 1.40%, total to be received $1,010,703, (collateralized by various U.S. Government Agency Obligations, 1.88% – 8.88%, 02/15/19 – 12/20/47, totaling $1,027,605) | | | 1,010,585 | | | 1,010,585 | |
Total Repurchase Agreements | | | | | | | |
(Cost $3,890,798) | | | | | | 3,890,798 | |
| | | | | | | |
Total Investments — 130.7% | | | | | | | |
(Cost $18,630,254) | | | | | | 18,649,642 | |
| | | | | | | |
Liabilities in Excess of Other Assets — (30.7%) | | | | | | (4,383,694 | ) |
| | | | | | | |
Net Assets — 100.0% | | | | | $ | 14,265,948 | |
SUMMARY OF SCHEDULE OF INVESTMENTS
| | | |
Equity Fund | | 95.4 | % |
Money Market Funds | | 8.0 | |
Repurchase Agreements | | 27.3 | |
Total Investments | | 130.7 | |
Liabilities in Excess of Other Assets | | (30.7 | ) |
Net Assets | | 100.0 | % |
See accompanying Notes to Financial Statements.
34
ADVISORSHARES NEW TECH AND MEDIA ETF
Schedule of Investments
December 31, 2017 (Unaudited)
| | | | |
COMMON STOCKS — 99.6% | | | | | |
| | | | | |
Computers — 9.4% | | | | | |
Apple, Inc. | | 14,463 | | $ | 2,447,573 |
DXC Technology Co. | | 25,854 | | | 2,453,545 |
Total Computers | | | | | 4,901,118 |
| | | | | |
Healthcare – Products — 3.6% | | | |
Mazor Robotics Ltd.
(Israel)*(a)(b) | | 36,506 | | | 1,883,710 |
| | | | | |
Home Furnishings — 10.0% | | | | | |
Roku, Inc.*(a) | | 100,000 | | | 5,178,000 |
| | | | | |
Internet — 54.5% | | | | | |
Alphabet, Inc., Class C* | | 5,103 | | | 5,339,779 |
Amazon.com, Inc.* | | 5,670 | | | 6,630,895 |
CDW Corp. | | 30,000 | | | 2,084,700 |
Facebook, Inc., Class A* | | 10,930 | | | 1,928,708 |
Netflix, Inc.* | | 12,821 | | | 2,461,119 |
Snap, Inc., Class A* | | 140,000 | | | 2,045,400 |
Tencent Holdings Ltd. (China)(b) | | 45,092 | | | 2,341,177 |
Tucows, Inc., Class A*(a) | | 30,957 | | | 2,168,538 |
Twitter, Inc.* | | 138,236 | | | 3,319,046 |
Total Internet | | | | | 28,319,362 |
| | | | | |
Software — 9.2% | | | | | |
Ebix, Inc. | | 29,358 | | | 2,326,622 |
Microsoft Corp. | | 28,463 | | | 2,434,725 |
Total Software | | | | | 4,761,347 |
| | | | | |
Telecommunications — 12.9% | | | |
GTT Communications, Inc.*(a) | | 49,000 | | | 2,300,550 |
Nice Ltd. (Israel)(b) | | 26,316 | | | 2,418,704 |
TESSCO Technologies, Inc. | | 100,000 | | | 2,015,000 |
Total Telecommunications | | | | | 6,734,254 |
Total Common Stocks | | | | | |
(Cost $51,159,699) | | | | | 51,777,791 |
| | | | | |
MONEY MARKET FUND — 0.4% | | | |
Dreyfus Institutional Treasury and Agency Cash Advantage Fund, 1.23%(c) (Cost $192,733) | | 192,733 | | | 192,733 |
| | | | |
REPURCHASE AGREEMENTS — 13.8%(d) | | | |
| | | | | | |
Citigroup Global Markets, Inc., dated 12/29/17, due 01/02/18, 1.41%, total to be received $1,676,649, (collateralized by various U.S. Government Agency Obligations, 0.00% – 9.00%,
04/01/18 – 8/20/67, totaling $1,704,674) | | $ | 1,676,452 | | $ | 1,676,452 |
Daiwa Capital Markets America, dated 12/29/17, due 01/02/18, 1.43%, total to be received $1,676,652, (collateralized by various U.S. Government Agency Obligations, 0.00% – 6.50%, 01/11/18 – 12/01/51, totaling $1,705,643) | | | 1,676,452 | | | 1,676,452 |
HSBC Securities USA, Inc., dated 12/29/17, due 01/02/18, 1.37%, total to be received $1,676,643, (collateralized by various U.S. Government Agency Obligations, 0.00% – 7.25%, 01/15/18 – 02/15/47, totaling $1,704,007) | | | 1,676,452 | | | 1,676,452 |
Mizuho Securities USA, Inc., dated 12/29/17, due 01/02/18, 1.38%, total to be received $496,918, (collateralized by various U.S. Government Agency Obligations, 0.00% – 2.13%, 07/19/18 – 09/30/24, totaling $505,256) | | | 496,861 | | | 496,861 |
See accompanying Notes to Financial Statements.
35
ADVISORSHARES NEW TECH AND MEDIA ETF
Schedule of Investments (continued)
December 31, 2017 (Unaudited)
| | | | |
REPURCHASE AGREEMENTS (continued) | | | | |
| | | | | | | |
RBC Dominion Securities, Inc., dated 12/29/17, due 01/02/18, 1.40%, total to be received $1,676,648, (collateralized by various U.S. Government Agency Obligations, 1.88% – 8.88%, 02/15/19 – 12/20/47, totaling $1,704,686) | | $ | 1,676,452 | | $ | 1,676,452 | |
Total Repurchase Agreements | | | | | | | |
(Cost $7,202,669) | | | | | | 7,202,669 | |
| | | | | | | |
Total Investments — 113.8% | | | | | | | |
(Cost $58,555,101) | | | | | | 59,173,193 | |
| | | | | | | |
Liabilities in Excess of Other Assets — (13.8%) | | | | | | (7,189,887 | ) |
Net Assets — 100.0% | | | | | $ | 51,983,306 | |
SUMMARY OF SCHEDULE OF INVESTMENTS
| | | |
Computers | | 9.4 | % |
Healthcare – Products | | 3.6 | |
Home Furnishings | | 10.0 | |
Internet | | 54.5 | |
Software | | 9.2 | |
Telecommunications | | 12.9 | |
Money Market Fund | | 0.4 | |
Repurchase Agreements | | 13.8 | |
Total Investments | | 113.8 | |
Liabilities in Excess of Other Assets | | (13.8 | ) |
Net Assets | | 100.0 | % |
See accompanying Notes to Financial Statements.
36
ADVISORSHARES NEWFLEET MULTI-SECTOR INCOME ETF
Schedule of Investments
December 31, 2017 (Unaudited)
| | | | |
ASSET BACKED SECURITIES — 29.0% | | | |
| | | | | | |
American Credit Acceptance Receivables Trust, Class B, Series 2016-1A, 4.24%, 06/13/22‡ | | $ | 555,876 | | $ | 559,356 |
American Credit Acceptance Receivables Trust, Class C, Series 2017-2, 2.86%, 06/12/23‡ | | | 645,000 | | | 644,962 |
AmeriCredit Automobile Receivables Trust, Class B, Series 2016-1, 2.30%, 03/08/21 | | | 720,000 | | | 721,082 |
AmeriCredit Automobile Receivables Trust, Class C, Series 2014-2, 2.18%, 06/08/20 | | | 500,000 | | | 500,331 |
AmeriCredit Automobile Receivables Trust, Class C, Series 2015-3, 2.73%, 03/08/21 | | | 655,000 | | | 658,575 |
AmeriCredit Automobile Receivables Trust, Class C, Series 2015-4, 2.88%, 07/08/21 | | | 715,000 | | | 721,410 |
AmeriCredit Automobile Receivables Trust, Class C, Series 2017-1, 2.71%, 08/18/22 | | | 650,000 | | | 649,845 |
AmeriCredit Automobile Receivables Trust, Class D, Series 2014-1, 2.54%, 06/08/20 | | | 755,000 | | | 757,186 |
Aqua Finance Trust, Class A, Series 2017-A, 3.72%, 11/15/35‡ | | | 596,763 | | | 595,408 |
Ascentium Equipment Receivables Trust, Class B, Series 2017-1A, 2.85%, 10/10/21‡ | | | 645,000 | | | 639,948 |
Associates Manufactured Housing Pass-Through Certificates, Class B1, Series 1996-1, 8.00%, 03/15/27@* | | | 256,757 | | | 262,263 |
Avis Budget Rental Car Funding Aesop LLC, Class A, Series 2012-3A, 2.10%, 03/20/19‡ | | | 250,000 | | | 250,009 |
Avis Budget Rental Car Funding Aesop LLC, Class A, Series 2013-1A, 1.92%, 09/20/19‡ | | | 1,140,000 | | | 1,138,398 |
Avis Budget Rental Car Funding Aesop LLC, Class A, Series 2013-2A, 2.97%, 02/20/20‡ | | | 1,465,000 | | | 1,475,056 |
| | | | |
ASSET BACKED SECURITIES (continued) | | | |
| | | | | | |
Avis Budget Rental Car Funding Aesop LLC, Class A, Series 2015-2A, 2.63%, 12/20/21‡ | | $ | 670,000 | | $ | 669,197 |
BRE Grand Islander Timeshare Issuer LLC, Class A, Series 2017-1A, 2.94%, 05/25/29‡ | | | 543,959 | | | 540,807 |
BXG Receivables Note Trust, Class A, Series 2013-A, 3.01%, 12/04/28‡ | | | 127,656 | | | 127,424 |
BXG Receivables Note Trust, Class A, Series 2015-A, 2.88%, 05/02/30‡ | | | 595,830 | | | 595,973 |
California Republic Auto Receivables Trust, Class A4, Series 2014-3, 1.79%, 03/16/20 | | | 271,496 | | | 271,364 |
California Republic Auto Receivables Trust, Class B, Series 2014-2, 2.34%, 04/15/20 | | | 500,000 | | | 500,867 |
California Republic Auto Receivables Trust, Class B, Series 2015-3, 2.70%, 09/15/21 | | | 645,000 | | | 645,545 |
Capital Auto Receivables Asset Trust, Class C, Series 2015-2, 2.67%, 08/20/20 | | | 650,000 | | | 653,379 |
CarFinance Capital Auto Trust, Class B, Series 2014-1A, 2.72%, 04/15/20‡ | | | 32,710 | | | 32,740 |
CarFinance Capital Auto Trust, Class B, Series 2014-2A, 2.64%, 11/16/20‡ | | | 480,000 | | | 479,834 |
CarFinance Capital Auto Trust, Class B, Series 2015-1A, 2.91%, 06/15/21‡ | | | 1,000,000 | | | 1,002,822 |
CarMax Auto Owner Trust, Class B, Series 2014-4, 2.20%, 09/15/20 | | | 700,000 | | | 700,374 |
CarMax Auto Owner Trust, Class C, Series 2015-2, 2.39%, 03/15/21 | | | 615,000 | | | 615,932 |
Centre Point Funding LLC, Class 1, Series 2012-2A, 2.61%, 08/20/21‡ | | | 436,522 | | | 435,209 |
Chrysler Capital Auto Receivables Trust, Class D, Series 2015-BA, 4.17%, 01/16/23‡ | | | 635,000 | | | 646,971 |
See accompanying Notes to Financial Statements.
37
ADVISORSHARES NEWFLEET MULTI-SECTOR INCOME ETF
Schedule of Investments (continued)
December 31, 2017 (Unaudited)
| | | | |
ASSET BACKED SECURITIES (continued) | | | |
| | | | | | |
CKE Restaurant Holdings, Inc., Class A2, Series 2013-1A, 4.47%, 03/20/43‡ | | $ | 549,470 | | $ | 550,974 |
CLUB Credit Trust, Class B, Series 2017-P1, 3.56%, 09/15/23‡ | | | 270,000 | | | 270,780 |
Conseco Finance Corp., Class B1, Series 1995-5, 7.30%, 09/15/26@* | | | 5,123 | | | 5,142 |
CPS Auto Receivables Trust, Class B, Series 2017-C, 2.30%, 07/15/21‡ | | | 805,000 | | | 801,937 |
Dell Equipment Finance Trust, Class A3, Series 2017-2, 2.19%, 10/24/22‡ | | | 615,000 | | | 613,204 |
Diamond Resorts Owner Trust, Class A, Series 2014-1, 2.54%, 05/20/27‡ | | | 398,659 | | | 396,350 |
Diamond Resorts Owner Trust, Class A, Series 2017-1A, 3.27%, 10/22/29‡ | | | 617,313 | | | 613,025 |
DRB Prime Student Loan Trust, Class A3, Series 2015-D, 2.50%, 01/25/36‡ | | | 216,493 | | | 216,957 |
Drive Auto Receivables Trust, Class B, Series 2016-AA, 3.17%, 05/15/20‡ | | | 85,897 | | | 85,975 |
Drive Auto Receivables Trust, Class B, Series 2016-BA, 2.56%, 06/15/20‡ | | | 570,838 | | | 571,410 |
Drive Auto Receivables Trust, Class C, Series 2015-DA, 3.38%, 11/15/21‡ | | | 726,183 | | | 730,894 |
Drive Auto Receivables Trust, Class C, Series 2016-CA, 3.02%, 11/15/21‡ | | | 665,000 | | | 670,185 |
Drive Auto Receivables Trust, Class C, Series 2017-2, 2.75%, 09/15/23 | | | 805,000 | | | 806,475 |
Drug Royalty II LP, Class A2, Series 2014-1, 3.48%, 07/15/23‡ | | | 173,687 | | | 173,320 |
DT Auto Owner Trust, Class B, Series 2016-1A, 2.79%, 05/15/20‡ | | | 19,219 | | | 19,225 |
| | | | |
ASSET BACKED SECURITIES (continued) | | | |
| | | | | | |
DT Auto Owner Trust, Class C, Series 2014-3A, 3.04%, 09/15/20‡ | | $ | 12,263 | | $ | 12,270 |
DT Auto Owner Trust, Class C, Series 2015-3A, 3.25%, 07/15/21‡ | | | 541,221 | | | 542,715 |
DT Auto Owner Trust, Class C, Series 2016-2A, 3.67%, 01/18/22‡ | | | 625,000 | | | 628,972 |
DT Auto Owner Trust, Class C, Series 2016-3A, 3.15%, 03/15/22‡ | | | 650,000 | | | 652,191 |
Exeter Automobile Receivables Trust, Class A, Series 2016-1A, 2.35%, 07/15/20‡ | | | 126,579 | | | 126,668 |
Exeter Automobile Receivables Trust, Class B, Series 2017-2A, 2.82%, 05/16/22‡ | | | 785,000 | | | 783,252 |
Exeter Automobile Receivables Trust, Class B, Series 2017-3A, 2.81%, 09/15/22‡ | | | 270,000 | | | 268,309 |
Exeter Automobile Receivables Trust, Class C, Series 2014-1A, 3.57%, 07/15/19‡ | | | 218,121 | | | 218,551 |
Exeter Automobile Receivables Trust, Class C, Series 2014-2A, 3.26%, 12/16/19‡ | | | 564,755 | | | 566,875 |
Exeter Automobile Receivables Trust, Class C, Series 2015-1A, 4.10%, 12/15/20‡ | | | 500,000 | | | 506,306 |
Exeter Automobile Receivables Trust, Class C, Series 2015-2A, 3.90%, 03/15/21‡ | | | 1,115,000 | | | 1,128,994 |
First Investors Auto Owner Trust, Class B, Series 2017-2A, 2.65%, 11/15/22‡ | | | 650,000 | | | 649,504 |
Flagship Credit Auto Trust, Class A, Series 2016-1, 2.77%, 12/15/20‡ | | | 282,905 | | | 284,054 |
Flagship Credit Auto Trust, Class D, Series 2014-2, 5.21%, 02/15/21‡ | | | 645,000 | | | 662,827 |
Foursight Capital Automobile Receivables Trust, Class A2, Series 2016-1, 2.87%, 10/15/21‡ | | | 520,092 | | | 520,578 |
Foursight Capital Automobile Receivables Trust, Class B, Series 2017-1, 3.05%, 12/15/22‡ | | | 650,000 | | | 645,829 |
See accompanying Notes to Financial Statements.
38
ADVISORSHARES NEWFLEET MULTI-SECTOR INCOME ETF
Schedule of Investments (continued)
December 31, 2017 (Unaudited)
| | | | |
ASSET BACKED SECURITIES (continued) | | | |
| | | | | | |
GLS Auto Receivables Trust, Class B, Series 2017-1A, 2.98%, 12/15/21‡ | | $ | 770,000 | | $ | 767,974 |
Gold Key Resorts LLC, Class A, Series 2014-A, 3.22%, 03/17/31‡ | | | 225,227 | | | 224,398 |
GreatAmerica Leasing Receivables Funding LLC, Class A4, Series 2017-1, 2.36%, 01/20/23‡ | | | 640,000 | | | 636,650 |
Hertz Vehicle Financing II LP, Class A, Series 2015-2A, 2.02%, 09/25/19‡ | | | 1,075,000 | | | 1,072,863 |
Hertz Vehicle Financing II LP, Class A, Series 2016-1A, 2.32%, 03/25/20‡ | | | 200,000 | | | 199,387 |
Hilton Grand Vacations Trust, Class A, Series 2013-A, 2.28%, 01/25/26‡ | | | 394,429 | | | 391,770 |
Hilton Grand Vacations Trust, Class A, Series 2014-AA, 1.77%, 11/25/26‡ | | | 140,284 | | | 138,157 |
Hilton Grand Vacations Trust, Class A, Series 2017-AA, 2.66%, 12/26/28‡ | | | 544,371 | | | 540,885 |
Hyundai Auto Receivables Trust, Class D, Series 2014-B, 2.51%, 12/15/20 | | | 425,000 | | | 426,461 |
Hyundai Auto Receivables Trust, Class D, Series 2015-A, 2.73%, 06/15/21 | | | 500,000 | | | 502,742 |
Leaf Receivables Funding 12 LLC, Class B, Series 2017-1, 2.65%, 02/15/22‡ | | | 775,000 | | | 767,504 |
Mariner Finance Issuance
Trust, Class A, Series
2017-AA, 3.62%, 02/20/29‡ | | | 645,000 | | | 649,333 |
Marriott Vacation Club
Owner Trust, Class A,
Series 2012-1A, 2.51%, 05/20/30‡ | | | 439,918 | | | 438,415 |
Murray Hill Marketplace Trust, Class A, Series 2016-LC1, 4.19%, 11/25/22‡ | | | 69,297 | | | 69,403 |
MVW Owner Trust, Class B, Series 2015-1A, 2.96%, 12/20/32‡ | | | 280,865 | | | 278,094 |
| | | | |
ASSET BACKED SECURITIES (continued) | | | |
| | | | | | |
Navient Private Education Loan Trust, Class A2A,
Series 2017-A, 2.88%, 12/16/58‡ | | $ | 670,000 | | $ | 665,037 |
Navistar Financial Dealer Note Master Owner Trust II, Class B, Series 2016-1, 3.30%, (1-Month USD LIBOR + 1.75%), 09/27/21@‡ | | | 1,065,000 | | | 1,071,221 |
NextGear Floorplan Master Owner Trust, Class A2, Series 2017-2A, 2.56%, 10/17/22‡ | | | 670,000 | | | 668,419 |
OneMain Direct Auto Receivables Trust, Class B, Series 2016-1A, 2.76%, 05/15/21‡ | | | 1,010,000 | | | 1,012,778 |
OneMain Financial Issuance Trust, Class A, Series 2015-1A, 3.19%, 03/18/26‡ | | | 120,000 | | | 120,763 |
OneMain Financial Issuance Trust, Class A, Series 2015-2A, 2.57%, 07/18/25‡ | | | 144,774 | | | 144,861 |
Orange Lake Timeshare Trust, Class A, Series 2012-AA, 3.45%, 03/10/27‡ | | | 53,212 | | | 53,398 |
Orange Lake Timeshare Trust, Class A, Series 2015-AA, 2.88%, 09/08/27‡ | | | 266,666 | | | 264,640 |
Prestige Auto Receivables Trust, Class C, Series 2017-1A, 2.81%, 01/17/23‡ | | | 810,000 | | | 806,495 |
Santander Drive Auto Receivables Trust, Class B, Series 2016-2, 2.08%, 02/16/21 | | | 750,000 | | | 750,272 |
Santander Drive Auto Receivables Trust, Class C, Series 2014-3, 2.13%, 08/17/20 | | | 126,073 | | | 126,129 |
Santander Drive Auto Receivables Trust, Class C, Series 2016-1, 3.09%, 04/15/22 | | | 1,370,000 | | | 1,384,383 |
Santander Drive Auto Receivables Trust, Class C, Series 2017-1, 2.58%, 05/16/22 | | | 650,000 | | | 648,410 |
Santander Drive Auto Receivables Trust, Class D, Series 2013-5, 2.73%, 10/15/19 | | | 473,587 | | | 474,893 |
See accompanying Notes to Financial Statements.
39
ADVISORSHARES NEWFLEET MULTI-SECTOR INCOME ETF
Schedule of Investments (continued)
December 31, 2017 (Unaudited)
| | | | |
ASSET BACKED SECURITIES (continued) | | | |
| | | | | | |
Sierra Timeshare Receivables Funding LLC, Class A,
Series 2014-1A, 2.07%, 03/20/30‡ | | $ | 73,778 | | $ | 73,615 |
Sierra Timeshare Receivables Funding LLC, Class A, Series 2014-2A, 2.05%, 06/20/31@‡* | | | 47,215 | | | 47,125 |
Silverleaf Finance XVIII LLC, Class A, Series 2014-A, 2.81%, 01/15/27‡ | | | 144,945 | | | 144,543 |
SLM Private Education Loan Trust, Class A2A, Series 2013-B, 1.85%, 06/17/30‡ | | | 427,014 | | | 425,404 |
SLM Private Education Loan Trust, Class A2A, Series 2013-C, 2.94%, 10/15/31‡ | | | 176,570 | | | 177,750 |
Sofi Consumer Loan Program LLC, Class A, Series 2016-3, 3.05%, 12/26/25‡ | | | 374,289 | | | 376,341 |
Sofi Consumer Loan Program LLC, Class A, Series 2017-1, 3.28%, 01/26/26‡ | | | 633,839 | | | 640,399 |
Sofi Consumer Loan
Program LLC, Class A2, Series 2017-5, 2.78%, 09/25/26‡ | | | 270,000 | | | 267,758 |
Sofi Consumer Loan
Program LLC, Class A2, Series 2017-6, 2.82%, 11/25/26‡ | | | 660,000 | | | 659,956 |
Sofi Professional Loan
Program LLC, Class A2A, Series 2017-C, 1.75%, 07/25/40‡ | | | 600,570 | | | 598,271 |
SoFi Professional Loan
Program LLC, Class A1FX, Series 2017-B, 1.83%, 05/25/40‡ | | | 440,647 | | | 439,970 |
SoFi Professional Loan
Program LLC, Class A2, Series 2015-A, 2.42%, 03/25/30‡ | | | 142,749 | | | 142,850 |
Springleaf Funding Trust, Class A, Series 2016-AA, 2.90%, 11/15/29‡ | | | 805,000 | | | 806,491 |
TCF Auto Receivables Owner Trust, Class B, Series
2014-1A, 2.33%, 05/15/20‡ | | | 800,000 | | | 800,649 |
| | | | |
ASSET BACKED SECURITIES (continued) | | | |
| | | | | | |
Tidewater Auto Receivables Trust, Class C, Series
2014-AA, 2.56%, 08/15/19‡ | | $ | 47,244 | | $ | 47,252 |
TRIP Rail Master Funding LLC, Class A1, Series 2017-1A, 2.71%, 08/15/47‡ | | | 633,320 | | | 631,635 |
Volvo Financial Equipment LLC, Class B, Series 2017-1A, 2.40%, 01/18/22‡ | | | 650,000 | | | 645,323 |
Welk Resorts LLC, Class A, Series 2015-AA, 2.79%, 06/16/31‡ | | | 332,959 | | | 331,538 |
Wendys Funding LLC, Class A2II, Series 2015-1A, 4.08%, 06/15/45‡ | | | 522,963 | | | 536,535 |
Westgate Resorts LLC, Class A, Series 2016-1A, 3.50%, 12/20/28‡ | | | 326,453 | | | 328,389 |
Westlake Automobile Receivables Trust, Class B, Series 2016-3A, 2.07%, 12/15/21‡ | | | 1,230,000 | | | 1,226,366 |
Westlake Automobile Receivables Trust, Class C, Series 2015-1A, 2.29%, 11/16/20‡ | | | 60,213 | | | 60,220 |
Westlake Automobile Receivables Trust, Class C, Series 2016-2A, 2.83%, 05/17/21‡ | | | 780,000 | | | 782,534 |
Total Asset Backed Securities | | | | | | |
(Cost $57,705,454) | | | | | | 57,702,664 |
| | | | | | |
MORTGAGE BACKED SECURITIES — 25.8% | | | |
| | | | | | |
Commercial Mortgage Backed Securities — 5.7% |
Access Point Funding I LLC, Class A, Series 2017-A, 3.06%, 04/15/29‡ | | | 411,359 | | | 410,523 |
Aventura Mall Trust, Class C, Series 2013-AVM, 3.74%, 12/05/32@‡* | | | 250,000 | | | 254,755 |
BAMLL Commercial Mortgage Securities Trust, Class A, Series 2015-200P, 3.22%, 04/14/33‡ | | | 400,000 | | | 405,294 |
See accompanying Notes to Financial Statements.
40
ADVISORSHARES NEWFLEET MULTI-SECTOR INCOME ETF
Schedule of Investments (continued)
December 31, 2017 (Unaudited)
| | | | |
MORTGAGE BACKED SECURITIES (continued) |
|
Commercial Mortgage Backed Securities (continued) |
Bayview Commercial Asset Trust, Class A2, Series 2006-2A, 1.83%, (1-Month USD LIBOR + 0.28%), 07/25/36@‡ | | $ | 202,297 | | $ | 196,812 |
Bayview Commercial Asset Trust, Class A3, Series 2008-1, 3.05%, (1-Month USD LIBOR + 1.50%), 01/25/38@‡ | | | 52,636 | | | 52,795 |
Caesars Palace Las Vegas Trust, Class C, Series 2017-VICI, 4.14%, 10/15/34‡ | | | 445,000 | | | 457,627 |
Citigroup Commercial Mortgage Trust, Class A, Series 2016-SMPL, 2.23%, 09/10/31‡ | | | 470,000 | | | 461,460 |
Cold Storage Trust, Class A, Series 2017-ICE3, 2.48%, (1-Month USD LIBOR + 1.00%), 04/15/36@‡ | | | 775,000 | | | 778,317 |
Colony Multifamily Mortgage Trust, Class A, Series 2014-1, 2.54%, 04/20/50‡ | | | 144,910 | | | 144,123 |
Commercial Mortgage Lease-Backed Certificates, Class A3, Series 2001-CMLB, 7.47%, 06/20/31@‡* | | | 460,000 | | | 500,984 |
Credit Suisse Commercial Mortgage Trust, Class A, Series 2016-BDWN, 4.38%, (1-Month USD LIBOR + 2.90%), 02/15/29@‡ | | | 980,000 | | | 985,513 |
GAHR Commercial Mortgage Trust, Class CFX, Series 2015-NRF, 3.38%, 12/15/34@‡* | | | 200,000 | | | 201,460 |
Hilton USA Trust, Class B, Series 2016-SFP, 3.32%, 11/05/35‡ | | | 800,000 | | | 797,614 |
Hospitality Mortgage Trust, Class B, Series 2017-HIT, 2.42%, (1-Month USD LIBOR + 1.18%),
05/08/30@‡ | | | 750,000 | | | 750,802 |
JPMorgan Chase Commercial Mortgage Securities Trust, Class B, Series 2015-SGP, 4.23%, (1-Month USD LIBOR + 2.75%),
07/15/36@‡ | | | 535,000 | | | 540,141 |
| | | | |
MORTGAGE BACKED SECURITIES (continued) |
|
Commercial Mortgage Backed Securities (continued) |
JPMorgan Chase Commercial Mortgage Securities Trust, Class A3, Series 2011-C4, 4.11%, 07/15/46‡ | | $ | 757,950 | | $ | 760,670 |
JPMorgan Chase Commercial Mortgage Securities Trust, Class AM, Series 2006-LDP9, 5.37%, 05/15/47 | | | 483,899 | | | 484,885 |
JPMorgan Chase Commercial Mortgage Securities Trust, Class AM, Series 2007-LDPX, 5.46%, 01/15/49@* | | | 227,761 | | | 228,664 |
Morgan Stanley Capital I Trust, Class A, Series 2017-CLS, 1.95%, (1-Month USD LIBOR + 0.70%), 11/15/34@‡ | | | 600,000 | | | 600,747 |
Morgan Stanley Capital I Trust, Class AM, Series 2008-T29, 6.31%, 01/11/43@* | | | 55,898 | | | 55,864 |
Motel 6 Trust, Class A, Series 2017-MTL6, 2.40%, (1-Month USD LIBOR + 0.92%), 08/15/34@‡ | | | 664,947 | | | 667,698 |
SBA Tower Trust, 3.17%, 04/11/22‡ | | | 780,000 | | | 777,226 |
Sutherland Commercial Mortgage Loans, Class A, Series 2017-SBC6, 3.19%, 05/25/37@‡* | | | 455,167 | | | 455,213 |
Velocity Commercial Capital Loan Trust, Class AFX, Series 2017-1, 3.00%, 05/25/47@‡* | | | 227,106 | | | 227,121 |
VSD, 3.60%, 12/25/43 | | | 225,734 | | | 225,679 |
Total Commercial Mortgage Backed Securities | | | | | | 11,421,987 |
| | | | | | |
Residential Mortgage Backed Securities — 19.9% |
Ajax Mortgage Loan Trust, Class A, Series 2017-B, 3.16%, 09/25/56@‡* | | | 300,000 | | | 299,999 |
Alternative Loan Trust, Class 1A1, Series 2004-22CB, 6.00%, 10/25/34 | | | 113,239 | | | 117,137 |
AMSR Trust, Class C, Series 2016-SFR1, 3.74%, (1-Month USD LIBOR + 2.25%), 11/17/33@‡ | | | 332,500 | | | 337,091 |
See accompanying Notes to Financial Statements.
41
ADVISORSHARES NEWFLEET MULTI-SECTOR INCOME ETF
Schedule of Investments (continued)
December 31, 2017 (Unaudited)
| | | | |
MORTGAGE BACKED SECURITIES (continued) |
|
Residential Mortgage Backed Securities (continued) |
Angel Oak Mortgage
Trust LLC, Class A1,
Series 2017-3, 2.71%, 11/25/47@‡* | | $ | 701,500 | | $ | 700,624 |
Asset Backed Funding Certificates Trust, Class A6, Series 2005-AQ1, 4.78%, 01/25/35 | | | 97,937 | | | 101,077 |
Banc of America Funding Trust, Class 5A1, Series 2004-A, 3.62%, 07/20/34@* | | | 163,547 | | | 163,846 |
Banc of America Funding Trust, Class 1A1, Series 2005-1, 5.50%, 02/25/35 | | | 161,279 | | | 161,837 |
Bayview Financial Acquisition Trust, Class 1A2, Series 2007-A, 6.21%, 05/28/37 | | | 262,642 | | | 271,604 |
Bayview Koitere Fund Trust, Class A, Series 2017-RT4, 3.50%, 07/28/57@‡* | | | 241,042 | | | 246,619 |
Bayview Opportunity Master Fund IIIb Trust, Class A1, Series 2017-RN2, 3.47%, 04/28/32@‡* | | | 127,645 | | | 128,302 |
Bayview Opportunity Master Fund IVa Trust, Class A1, Series 2017-RT1, 3.00%, 03/28/57@‡* | | | 874,349 | | | 876,799 |
Bayview Opportunity Master Fund IVb Trust, Class A, Series 2017-SPL4, 3.50%, 01/28/55@‡* | | | 486,730 | | | 494,890 |
Bear Stearns ALT-A Trust, Class 3A1, Series 2004-5, 3.79%, 06/25/34@* | | | 292,387 | | | 300,003 |
Bear Stearns ARM Trust, Class 21A1, Series 2004-1, 3.40%, 04/25/34@* | | | 304,680 | | | 306,532 |
Bear Stearns ARM Trust, Class 22A1, Series 2004-9, 3.87%, 11/25/34@* | | | 549,746 | | | 553,087 |
Bear Stearns ARM Trust, Class 21A1, Series 2004-10, 3.77%, 01/25/35@* | | | 758,312 | | | 765,962 |
Bear Stearns ARM Trust, Class 15A1, Series 2004-10, 3.64%, 01/25/35@* | | | 442,945 | | | 455,656 |
| | | | |
MORTGAGE BACKED SECURITIES (continued) |
|
Residential Mortgage Backed Securities (continued) |
Centex Home Equity Loan Trust, Class AF5, Series 2004-D, 5.85%, 09/25/34 | | $ | 322,306 | | $ | 333,046 |
Chase Mortgage Trust, Class M2, Series 2016-1, 3.75%, 04/25/45@‡* | | | 458,486 | | | 465,651 |
Chase Mortgage Trust, Class M2, Series 2016-2, 3.75%, 12/25/45@‡* | | | 705,054 | | | 714,798 |
Citicorp Residential Mortgage Trust, Class A4,
Series 2006-1, 5.37%, 07/25/36 | | | 25,616 | | | 25,655 |
Citigroup Mortgage Loan Trust, Inc., Class A,
Series 2014-A, 4.00%, 01/25/35@‡* | | | 487,226 | | | 510,307 |
Citigroup Mortgage Loan Trust, Inc., Class A1, Series 2015-PS1, 3.75%, 09/25/42@‡* | | | 298,281 | | | 304,892 |
Citigroup Mortgage Loan Trust, Inc., Class A1,
Series 2015-A, 3.50%, 06/25/58@‡* | | | 671,797 | | | 681,728 |
Colony American Finance Ltd., Class A, Series 2015-1 (Cayman Islands), 2.90%, 10/15/47‡ | | | 336,069 | | | 337,065 |
Colony Starwood Homes
Trust, Class C, Series 2016-2A, 3.63%, (1-Month USD LIBOR + 2.15%), 12/17/33@‡ | | | 665,000 | | | 666,553 |
COLT Mortgage Loan Trust, Class A2, Series 2016-1, 3.50%, 05/25/46‡ | | | 626,298 | | | 631,661 |
COLT Mortgage Loan Trust, Class A3, Series 2017-1, 3.07%, 05/27/47@‡* | | | 379,211 | | | 380,230 |
Countrywide Asset-Backed Certificates, Class A3,
Series 2004-S1, 5.12%, 02/25/35 | | | 303,296 | | | 306,808 |
Credit Suisse Commercial Mortgage Trust, Class A16, Series 2013-HYB1, 3.01%, 04/25/43@‡* | | | 553,055 | | | 557,514 |
Credit Suisse Commercial Mortgage Trust, Class A2, Series 2014-IVR2, 3.81%, 04/25/44@‡* | | | 540,979 | | | 557,595 |
See accompanying Notes to Financial Statements.
42
ADVISORSHARES NEWFLEET MULTI-SECTOR INCOME ETF
Schedule of Investments (continued)
December 31, 2017 (Unaudited)
| | | | |
MORTGAGE BACKED SECURITIES (continued) |
|
Residential Mortgage Backed Securities (continued) |
Credit Suisse First Boston Mortgage Securities
Corp., Class 6A1,
Series 2004-AR8, 3.37%, 09/25/34@* | | $ | 106,944 | | $ | 108,605 |
Credit Suisse First Boston Mortgage-Backed
Pass-Through Certificates, Class 6A1, Series 2004-8, 4.50%, 12/25/19 | | | 71,561 | | | 71,936 |
Credit Suisse First Boston Mortgage-Backed
Pass-Through Certificates, Class 5A1, Series 2003-AR30, 3.48%, 01/25/34@* | | | 174,014 | | | 179,179 |
Deephaven Residential Mortgage Trust, Class A1, Series 2017-1A, 2.73%, 12/26/46@‡* | | | 436,049 | | | 434,926 |
Deephaven Residential Mortgage Trust, Class A1, Series 2017-2A, 2.45%, 06/25/47@‡* | | | 209,911 | | | 208,128 |
Deephaven Residential Mortgage Trust, Class A3, Series 2017-3A, 2.81%, 10/25/47@‡* | | | 251,484 | | | 252,102 |
Galton Funding Mortgage Trust, Class A21,
Series 2017-1, 3.50%, 07/25/56@‡* | | | 771,632 | | | 780,620 |
GMACM Mortgage Loan Trust, Class 12A, Series 2004-AR1, 3.98%, 06/25/34@* | | | 241,889 | | | 245,446 |
GSAA Trust, Class AF4,
Series 2005-1, 5.62%, 11/25/34 | | | 86,582 | | | 88,384 |
GSR Mortgage Loan Trust, Class 1A6, Series 2003-3F, 6.00%, 04/25/33 | | | 264,979 | | | 275,536 |
GSR Mortgage Loan Trust, Class 3A1, Series 2004-7, 3.24%, 06/25/34@* | | | 404,396 | | | 401,339 |
Home Equity Loan Trust, Class AIIB, Series 2003-HS2, 1.80%, (1-Month USD LIBOR + 0.25%), 06/25/28@ | | | 109,244 | | | 108,453 |
Jefferies Resecuritization Trust, Class 1A1, Series 2014-R1, 4.00%, 12/27/37‡ | | | 90,728 | | | 90,789 |
| | | | |
MORTGAGE BACKED SECURITIES (continued) |
|
Residential Mortgage Backed Securities (continued) |
JPMorgan Mortgage Trust, Class 2A2, Series 2014-2, 3.50%, 06/25/29@‡* | | $ | 370,411 | | $ | 379,342 |
JPMorgan Mortgage Trust, Class 1A1, Series 2004-A3, 3.52%, 07/25/34@* | | | 216,333 | | | 216,675 |
JPMorgan Mortgage Trust, Class 4A1, Series 2006-A2, 3.73%, 08/25/34@* | | | 178,696 | | | 180,917 |
JPMorgan Mortgage Trust, Class 2A1, Series 2004-A4, 3.49%, 09/25/34@* | | | 101,905 | | | 103,608 |
JPMorgan Mortgage Trust, Class 4A1, Series 2005-A2, 3.24%, 04/25/35@* | | | 559,550 | | | 556,802 |
JPMorgan Mortgage Trust, Class 2A2, Series 2017-3, 2.50%, 08/25/47@‡* | | | 803,273 | | | 797,030 |
JPMorgan Mortgage Trust, Class A1, Series 2017-5, 3.19%, 10/26/48@‡* | | | 1,678,806 | | | 1,697,000 |
JPMorgan Mortgage Trust, Class A3, Series 2017-4, 3.50%, 11/25/48@‡* | | | 233,035 | | | 236,562 |
JPMorgan Mortgage Trust, Class AM1, Series 2015-1, 2.61%, 12/25/44@‡* | | | 433,466 | | | 434,810 |
JPMorgan Mortgage Trust, Class A2, Series 2015-5, 2.86%, 05/25/45@‡* | | | 691,094 | | | 693,762 |
MASTR Alternative Loan Trust, Class 6A1, Series 2004-4, 5.50%, 04/25/34 | | | 285,121 | | | 296,682 |
MASTR Alternative Loan Trust, Class 2A1, Series 2005-2, 6.00%, 01/25/35 | | | 172,875 | | | 179,392 |
MASTR Asset Securitization Trust, Class 1A1, Series 2005-1, 5.00%, 05/25/20 | | | 135,684 | | | 137,485 |
MASTR Specialized Loan Trust, Class A2, Series 2005-3, 5.70%, 11/25/35‡ | | | 222,871 | | | 230,214 |
Merrill Lynch Mortgage Investors Trust, Class A1, Series 2004-A4, 3.27%, 08/25/34@* | | | 611,730 | | | 624,990 |
See accompanying Notes to Financial Statements.
43
ADVISORSHARES NEWFLEET MULTI-SECTOR INCOME ETF
Schedule of Investments (continued)
December 31, 2017 (Unaudited)
| | | | |
MORTGAGE BACKED SECURITIES (continued) |
|
Residential Mortgage Backed Securities (continued) |
Mill City Mortgage Loan Trust, Class A1, Series 2016-1, 2.50%, 04/25/57@‡* | | $ | 532,365 | | $ | 530,429 |
Mill City Mortgage Loan Trust, Class A1, Series 2017-1, 2.75%, 11/25/58@‡* | | | 327,459 | | | 328,153 |
National City Mortgage
Capital Trust, Class 2A1, Series 2008-1, 6.00%, 03/25/38 | | | 159,375 | | | 165,481 |
New Residential Mortgage Loan Trust, Class A1, Series 2016-2A, 3.75%, 11/26/35@‡* | | | 448,636 | | | 460,439 |
New Residential Mortgage Loan Trust, Class A3, Series 2014-2A, 3.75%, 05/25/54@‡* | | | 182,471 | | | 185,742 |
New Residential Mortgage Loan Trust, Class A1, Series 2015-2A, 3.75%, 08/25/55@‡* | | | 847,334 | | | 871,508 |
New Residential Mortgage Loan Trust, Class A1, Series 2016-1A, 3.75%, 03/25/56@‡* | | | 232,013 | | | 236,828 |
New Residential Mortgage Loan Trust, Class A1, Series 2016-3A, 3.75%, 09/25/56@‡* | | | 723,022 | | | 741,189 |
New Residential Mortgage Loan Trust, Class A1, Series 2016-4A, 3.75%, 11/25/56@‡* | | | 197,906 | | | 203,005 |
NovaStar Mortgage Funding Trust, Class M5, Series 2004-4, 3.28%, (1-Month USD LIBOR + 1.73%), 03/25/35@ | | | 1,166,692 | | | 1,172,513 |
Oak Hill Advisors Residential Loan Trust, Class A1, Series 2017-NPL2, 3.00%, 07/25/57‡ | | | 311,809 | | | 312,194 |
Pretium Mortgage Credit Partners I LLC, Class A1, Series 2017-NPL3, 3.25%, 06/29/32‡ | | | 451,708 | | | 452,524 |
Pretium Mortgage Credit Partners I LLC, Class A1, Series 2017-NPL2, 3.25%, 03/28/57‡ | | | 395,870 | | | 397,206 |
Progress Residential Trust, Class B, Series 2017-SFR1, 3.02%, 08/17/34‡ | | | 665,000 | | | 656,965 |
| | | | |
MORTGAGE BACKED SECURITIES (continued) |
|
Residential Mortgage Backed Securities (continued) |
RASC Series Trust, Class AI6, Series 2004-KS2, 4.30%, 03/25/34@* | | $ | 35,361 | | $ | 35,725 |
RCO Mortgage LLC, Class A1, Series 2017-1, 3.38%, 08/25/22‡ | | | 222,816 | | | 223,532 |
Starwood Waypoint Homes Trust, Class A, Series 2017-1, 2.44%, (1-Month USD LIBOR + 0.95%), 01/17/35@‡ | | | 503,162 | | | 506,200 |
Structured Adjustable Rate Mortgage Loan Trust, Class 6A, Series 2004-1, 3.58%, 02/25/34@* | | | 280,330 | | | 276,583 |
Structured Adjustable Rate Mortgage Loan Trust, Class 3A2, Series 2004-4, 3.54%, 04/25/34@* | | | 492,347 | | | 499,806 |
Structured Adjustable Rate Mortgage Loan Trust, Class 3A1, Series 2004-4, 3.54%, 04/25/34@* | | | 92,450 | | | 93,039 |
Structured Asset Securities Corp., Class 2A, Series 2003-37A, 3.32%, 12/25/33@* | | | 174,113 | | | 175,037 |
Structured Asset Securities Corp., Class A3A, Series 2004-4XS, 5.33%, 02/25/34 | | | 465,724 | | | 473,117 |
Structured Asset Securities Corp. Assistance Loan
Trust, Class A,
Series 2003-AL1, 3.36%, 04/25/31‡ | | | 736,153 | | | 730,420 |
Structured Asset Securities Corp. Mortgage Pass-Through Certificates, Class 1A1, Series 2003-33H, 5.50%, 10/25/33 | | | 299,755 | | | 306,114 |
Structured Asset Securities Corp. Mortgage
Pass-Through Certificates, Class 6A, Series 2003-34A, 3.67%, 11/25/33@* | | | 235,202 | | | 233,968 |
Towd Point Mortgage Trust, Class A1B, Series 2016-1, 2.75%, 02/25/55@‡* | | | 605,679 | | | 607,338 |
See accompanying Notes to Financial Statements.
44
ADVISORSHARES NEWFLEET MULTI-SECTOR INCOME ETF
Schedule of Investments (continued)
December 31, 2017 (Unaudited)
| | | | |
MORTGAGE BACKED SECURITIES (continued) |
| | | |
Residential Mortgage Backed Securities (continued) |
Towd Point Mortgage Trust, Class M1, Series 2015-6, 3.75%, 04/25/55@‡* | | $ | 260,000 | | $ | 271,528 |
Towd Point Mortgage Trust, Class A1B, Series 2015-5, 2.75%, 05/25/55@‡* | | | 635,532 | | | 637,266 |
Towd Point Mortgage Trust, Class A2, Series 2015-5, 3.50%, 05/25/55@‡* | | | 250,000 | | | 258,054 |
Towd Point Mortgage Trust, Class A1, Series 2016-3, 2.25%, 04/25/56@‡* | | | 103,602 | | | 102,871 |
Towd Point Mortgage Trust, Class A1, Series 2016-4, 2.25%, 07/25/56@‡* | | | 528,676 | | | 525,684 |
Tricon American Homes Trust, Class A, Series 2017-SFR1, 2.72%, 09/17/34‡ | | | 265,000 | | | 262,022 |
Verus Securitization Trust, Class A1, Series 2017-1A, 2.85%, 01/25/47‡ | | | 174,549 | | | 175,518 |
Verus Securitization Trust, Class A1, Series 2017-2A, 2.49%, 07/25/47‡ | | | 927,054 | | | 929,850 |
VOLT LVI LLC, Class A1, Series 2017-NPL3, 3.50%, 03/25/47‡ | | | 507,483 | | | 510,927 |
VOLT LVIII LLC, Class A1, Series 2017-NPL5, 3.38%, 05/28/47‡ | | | 150,669 | | | 151,269 |
WaMu Mortgage Pass-Through Certificates Trust, Class A1, Series 2003-AR6, 3.23%, 06/25/33@* | | | 157,853 | | | 159,474 |
Washington Mutual MSC Mortgage Pass-Through Certificates Trust, Class 2A1, Series 2003-AR4, 3.05%, 08/25/33@* | | | 99,749 | | | 99,133 |
Wells Fargo Mortgage Backed Securities Trust, Class A1, Series 2003-G, 3.37%, 06/25/33@* | | | 19,654 | | | 19,885 |
| | | | |
MORTGAGE BACKED SECURITIES (continued) |
| | | |
Residential Mortgage Backed Securities (continued) |
Wells Fargo Mortgage Backed Securities Trust, Class 5A1, Series 2003-J, 3.49%, 10/25/33@* | | $ | 115,535 | | $ | 117,739 |
Wells Fargo Mortgage Backed Securities Trust, Class 2A1, Series 2003-J, 3.48%, 10/25/33@* | | | 128,102 | | | 130,198 |
Wells Fargo Mortgage Backed Securities Trust, Class A1, Series 2004-A, 3.56%, 02/25/34@* | | | 251,783 | | | 260,564 |
Wells Fargo Mortgage Backed Securities Trust, Class 1A2, Series 2004-K, 3.48%, 07/25/34@* | | | 224,908 | | | 226,726 |
Wells Fargo Mortgage Backed Securities Trust, Class 2A12, Series 2004-K, 3.47%, 07/25/34@* | | | 85,176 | | | 87,671 |
Wells Fargo Mortgage Backed Securities Trust, Class A1, Series 2004-U, 3.60%, 10/25/34@* | | | 326,845 | | | 329,141 |
Wells Fargo Mortgage Backed Securities Trust, Class 2A1, Series 2004-Z, 3.74%, 12/25/34@* | | | 96,580 | | | 98,590 |
Wells Fargo Mortgage Backed Securities Trust, Class 2A1, Series 2005-AR10, 3.47%, 06/25/35@* | | | 485,433 | | | 499,531 |
Wells Fargo Mortgage Backed Securities Trust, Class 2A1, Series 2005-14, 5.50%, 12/25/35 | | | 71,934 | | | 74,049 |
Total Residential Mortgage Backed Securities | | | | | | 39,568,027 |
| | | |
U.S. Government Agency Securities — 0.2% | | | |
Federal Home Loan Mortgage Corp., Class J, Series 2012-4011, 4.00%, 12/15/41 | | | 308,116 | | | 318,308 |
Total Mortgage Backed Securities | | | |
(Cost $51,256,571) | | | | | | 51,308,322 |
See accompanying Notes to Financial Statements.
45
ADVISORSHARES NEWFLEET MULTI-SECTOR INCOME ETF
Schedule of Investments (continued)
December 31, 2017 (Unaudited)
| | | | |
CORPORATE BONDS — 24.8% | | | |
| | | |
Consumer Discretionary — 2.7% | | | |
Aptiv PLC, 3.15%, 11/19/20 | | $ | 530,000 | | $ | 538,544 |
CalAtlantic Group, Inc., 5.25%, 06/01/26 | | | 390,000 | | | 413,887 |
CSC Holdings LLC, 6.75%, 11/15/21 | | | 365,000 | | | 392,375 |
Discovery Communications LLC, 2.20%, 09/20/19 | | | 680,000 | | | 677,141 |
DR Horton, Inc., 4.75%, 02/15/23 | | | 650,000 | | | 695,034 |
Hyundai Capital America, 2.45%, 06/15/21‡ | | | 515,000 | | | 504,305 |
Lennar Corp., 2.95%, 11/29/20‡ | | | 940,000 | | | 937,650 |
Scientific Games International, Inc., 7.00%, 01/01/22‡ | | | 155,000 | | | 163,719 |
Scientific Games International, Inc., 5.00%, 10/15/25‡ | | | 535,000 | | | 537,675 |
TRI Pointe Group, Inc./TRI Pointe Homes, Inc., 5.88%, 06/15/24 | | | 495,000 | | | 530,887 |
Wyndham Worldwide Corp., 4.15%, 04/01/24 | | | 35,000 | | | 35,211 |
Total Consumer Discretionary | | | | | | 5,426,428 |
| | | | | | |
Consumer Staples — 0.1% | | | | | | |
Kraft Heinz Foods Co., 3.50%, 07/15/22 | | | 281,000 | | | 287,683 |
| | | | | | |
Energy — 1.5% | | | | | | |
Antero Resources Corp., 5.63%, 06/01/23 | | | 160,000 | | | 167,200 |
Carrizo Oil & Gas, Inc., 6.25%, 04/15/23(a) | | | 550,000 | | | 573,375 |
Energy Transfer Equity LP, 4.25%, 03/15/23 | | | 290,000 | | | 288,550 |
Energy Transfer LP/Regency Energy Finance Corp., 5.00%, 10/01/22 | | | 440,000 | | | 469,500 |
Kinder Morgan, Inc., 3.15%, 01/15/23 | | | 350,000 | | | 348,270 |
Kinder Morgan, Inc., 5.63%, 11/15/23‡ | | | 545,000 | | | 602,467 |
NGL Energy Partners LP/NGL Energy Finance Corp., 5.13%, 07/15/19 | | | 535,000 | | | 545,700 |
Ultra Resources, Inc., 6.88%, 04/15/22‡ | | | 30,000 | | | 30,188 |
Total Energy | | | | | | 3,025,250 |
| | | | | | |
Financials — 11.3% | | | | | | |
Air Lease Corp., 2.63%, 09/04/18 | | | 520,000 | | | 521,619 |
| | | | |
CORPORATE BONDS (continued) | | | |
| | | | | | |
Financials (continued) | | | | | | |
Ares Capital Corp., 3.88%, 01/15/20 | | $ | 210,000 | | $ | 213,810 |
Ares Capital Corp., 3.50%, 02/10/23 | | | 545,000 | | | 537,540 |
Bank of America Corp., 2.00%, 01/11/18 | | | 235,000 | | | 235,005 |
Bank of America Corp., 5.49%, 03/15/19 | | | 66,000 | | | 68,351 |
Bank of America Corp., 2.54%, (3-Month USD LIBOR + 1.18%), 10/21/22@ | | | 650,000 | | | 663,195 |
Bank of America Corp., 2.36%, (3-Month USD LIBOR + 1.00%), 04/24/23@ | | | 535,000 | | | 543,935 |
Bank of New York Mellon Corp. (The), Series E, 4.95%, (3-Month USD LIBOR + 3.42%)#@ | | | 555,000 | | | 575,146 |
Bank of New York Mellon Corp. (The), 2.05%, 05/03/21 | | | 650,000 | | | 642,410 |
Capital One Financial Corp., 4.20%, 10/29/25 | | | 495,000 | | | 510,106 |
Citigroup, Inc., 2.33%, (3-Month USD LIBOR + 0.96%), 04/25/22@ | | | 670,000 | | | 677,352 |
Fifth Third Bancorp, 4.50%, 06/01/18 | | | 321,000 | | | 324,161 |
First Horizon National Corp., 3.50%, 12/15/20 | | | 550,000 | | | 562,031 |
First Tennessee Bank NA, 2.95%, 12/01/19 | | | 250,000 | | | 251,775 |
Ford Motor Credit Co. LLC, 8.13%, 01/15/20 | | | 455,000 | | | 504,251 |
Ford Motor Credit Co. LLC, 3.20%, 01/15/21 | | | 650,000 | | | 659,572 |
FS Investment Corp., 4.25%, 01/15/20 | | | 585,000 | | | 595,282 |
General Motors Financial Co., Inc., 3.20%, 07/06/21 | | | 700,000 | | | 707,403 |
General Motors Financial Co., Inc., 3.70%, 05/09/23 | | | 280,000 | | | 285,914 |
Goldman Sachs Group, Inc. (The), 2.35%, 11/15/21 | | | 165,000 | | | 162,648 |
Goldman Sachs Group, Inc. (The), 3.00%, 04/26/22 | | | 515,000 | | | 517,262 |
Goldman Sachs Group, Inc. (The), 3.08%, (3-Month USD LIBOR + 1.60%), 11/29/23@ | | | 270,000 | | | 281,251 |
See accompanying Notes to Financial Statements.
46
ADVISORSHARES NEWFLEET MULTI-SECTOR INCOME ETF
Schedule of Investments (continued)
December 31, 2017 (Unaudited)
| | | | |
CORPORATE BONDS (continued) | | | |
| | | | | | |
Financials (continued) | | | | | | |
Goldman Sachs Group, Inc. (The), Series G, 3.13%, (3-Month USD LIBOR + 1.75%), 10/28/27@ | | $ | 650,000 | | $ | 688,110 |
Huntington Bancshares, Inc., 7.00%, 12/15/20 | | | 200,000 | | | 223,804 |
Icahn Enterprises LP/Icahn Enterprises Finance Corp., 6.25%, 02/01/22‡ | | | 520,000 | | | 533,000 |
iStar, Inc., 6.00%, 04/01/22 | | | 235,000 | | | 243,812 |
iStar, Inc., 5.25%, 09/15/22 | | | 185,000 | | | 186,619 |
JPMorgan Chase & Co., Series Z, 5.30%, (3-Month USD LIBOR + 3.80%)#@ | | | 805,000 | | | 836,878 |
JPMorgan Chase & Co., 2.25%, 01/23/20 | | | 380,000 | | | 379,860 |
JPMorgan Chase & Co., 2.27%, (3-Month USD LIBOR + 0.90%), 04/25/23@ | | | 400,000 | | | 404,789 |
Kimco Realty Corp., 3.30%, 02/01/25 | | | 685,000 | | | 680,725 |
Ladder Capital Finance Holdings LLLP/Ladder Capital Finance Corp., 5.88%, 08/01/21‡ | | | 425,000 | | | 439,344 |
Lincoln National Corp., 8.75%, 07/01/19 | | | 39,000 | | | 42,597 |
Lincoln National Corp., 4.20%, 03/15/22 | | | 475,000 | | | 500,700 |
Lincoln National Corp., 3.40%, (3-Month USD LIBOR + 2.04%), 04/20/67@ | | | 100,000 | | | 91,750 |
Morgan Stanley, 2.76%, (3-Month USD LIBOR + 1.40%), 10/24/23@ | | | 1,950,000 | | | 2,006,816 |
Navient Corp., 6.50%, 06/15/22 | | | 290,000 | | | 304,717 |
Nuveen Finance LLC, 2.95%, 11/01/19‡ | | | 400,000 | | | 404,003 |
Santander Holdings USA, Inc., 3.70%, 03/28/22‡ | | | 1,040,000 | | | 1,053,522 |
SBA Tower Trust, 3.16%, 10/08/20‡ | | | 570,000 | | | 576,413 |
SBA Tower Trust, 2.88%, 07/09/21‡ | | | 780,000 | | | 774,657 |
Springleaf Finance Corp., 6.13%, 05/15/22 | | | 500,000 | | | 521,250 |
State Street Corp., 4.96%, 03/15/18 | | | 300,000 | | | 301,731 |
Wells Fargo & Co., 3.07%, 01/24/23 | | | 425,000 | | | 428,433 |
| | | | |
CORPORATE BONDS (continued) | | | |
| | | | | | |
Financials (continued) | | | | | | |
Wells Fargo Bank NA, 2.15%, 12/06/19 | | $ | 785,000 | | $ | 784,010 |
Total Financials | | | | | | 22,447,559 |
| | | | | | |
Health Care — 2.4% | | | | | | |
Abbott Laboratories, 2.90%, 11/30/21 | | | 335,000 | | | 339,184 |
AbbVie, Inc., 2.50%, 05/14/20 | | | 540,000 | | | 541,963 |
Allergan Funding SCS, 3.00%, 03/12/20 | | | 85,000 | | | 85,808 |
Allergan Funding SCS, 3.45%, 03/15/22 | | | 85,000 | | | 86,445 |
Anthem, Inc., 2.95%, 12/01/22 | | | 347,000 | | | 347,540 |
Anthem, Inc., 3.35%, 12/01/24 | | | 246,000 | | | 249,948 |
Becton Dickinson and Co., 2.89%, 06/06/22 | | | 622,000 | | | 618,746 |
Cardinal Health, Inc., 1.95%, 06/14/19 | | | 400,000 | | | 397,681 |
Cardinal Health, Inc., 2.62%, 06/15/22 | | | 640,000 | | | 629,960 |
Cardinal Health, Inc., 3.08%, 06/15/24 | | | 255,000 | | | 251,389 |
CHS/Community Health Systems, Inc., 6.25%, 03/31/23 | | | 280,000 | | | 253,400 |
Mylan NV, 3.15%, 06/15/21 | | | 170,000 | | | 171,085 |
Tenet Healthcare Corp., 4.63%, 07/15/24‡ | | | 485,000 | | | 474,694 |
Zimmer Biomet Holdings, Inc., 3.15%, 04/01/22 | | | 295,000 | | | 296,004 |
Total Health Care | | | | | | 4,743,847 |
| | | | | | |
Industrials — 1.9% | | | | | | |
Continental Airlines Class C-2 Pass-Through Trust, Series AMBC, 6.24%, 03/15/20 | | | 114,330 | | | 116,788 |
General Electric Co., Series D, 5.00%, (3-Month USD LIBOR + 3.33%)#@ | | | 815,000 | | | 840,958 |
Masco Corp., 3.50%, 04/01/21 | | | 515,000 | | | 525,635 |
Masco Corp., 5.95%, 03/15/22 | | | 304,000 | | | 336,883 |
Penske Truck Leasing Co. LP/PTL Finance Corp., 2.50%, 06/15/19 | | | 195,000 | | | 195,442 |
Penske Truck Leasing Co. LP/PTL Finance Corp., 3.38%, 02/01/22‡ | | | 230,000 | | | 234,520 |
Pitney Bowes, Inc., 4.13%, 05/15/22 | | | 738,000 | | | 681,727 |
See accompanying Notes to Financial Statements.
47
ADVISORSHARES NEWFLEET MULTI-SECTOR INCOME ETF
Schedule of Investments (continued)
December 31, 2017 (Unaudited)
| | | | |
CORPORATE BONDS (continued) | | |
| | | | |
Industrials (continued) | | | | |
Standard Industries, Inc., 5.50%, 02/15/23‡ | | $ 480,000 | | $ 501,600 |
TransDigm, Inc., 6.50%, 07/15/24 | | 270,000 | | 277,425 |
Total Industrials | | | | 3,710,978 |
| | | | |
Information Technology — 1.0% | | |
Apple, Inc., 2.25%, 02/23/21 | | 325,000 | | 324,766 |
Apple, Inc., 2.50%, 02/09/22 | | 510,000 | | 510,742 |
Apple, Inc., 3.00%, 02/09/24 | | 535,000 | | 542,231 |
Broadcom Corp./Broadcom Cayman Finance Ltd., 2.38%, 01/15/20‡ | | 395,000 | | 392,522 |
Broadcom Corp./Broadcom Cayman Finance Ltd., 2.65%, 01/15/23‡ | | 270,000 | | 260,585 |
Total Information Technology | | | | 2,030,846 |
| | | | |
Materials — 0.5% | | | | |
Freeport-McMoRan, Inc., 3.88%, 03/15/23 | | 275,000 | | 275,000 |
Reynolds Group Issuer, Inc./Reynolds Group Issuer LLC/Reynolds Group Issuer Lu, 4.86%, (3-Month USD LIBOR + 3.50%), 07/15/21@‡ | | 670,000 | | 681,725 |
Total Materials | | | | 956,725 |
| | | | |
Real Estate — 1.4% | | | | |
Alexandria Real Estate Equities, Inc., 3.45%, 04/30/25 | | 655,000 | | 653,872 |
American Tower Corp., 3.00%, 06/15/23 | | 258,000 | | 257,646 |
Education Realty Operating Partnership LP, 4.60%, 12/01/24 | | 100,000 | | 104,150 |
Government Properties Income Trust, 3.75%, 08/15/19 | | 85,000 | | 85,746 |
Hospitality Properties Trust, 4.65%, 03/15/24 | | 515,000 | | 541,904 |
Kilroy Realty LP, 3.45%, 12/15/24 | | 149,000 | | 148,801 |
Select Income REIT, 4.15%, 02/01/22 | | 515,000 | | 521,245 |
Senior Housing Properties Trust, 3.25%, 05/01/19 | | 415,000 | | 417,328 |
Total Real Estate | | | | 2,730,692 |
| | | | |
Telecommunication Services — 1.7% | | |
AT&T, Inc., 2.30%, (3-Month USD LIBOR + 0.89%), 02/14/23@ | | 525,000 | | 529,472 |
AT&T, Inc., 3.40%, 08/14/24 | | 536,000 | | 539,527 |
| | | | |
CORPORATE BONDS (continued) | | |
| | |
Telecommunication Services (continued) | | |
AT&T, Inc., 4.10%, 02/15/28‡ | | $ 221,000 | | $ 222,178 |
Crown Castle International Corp., 4.88%, 04/15/22 | | 355,000 | | 381,058 |
Sprint Spectrum Co. LLC/Sprint Spectrum Co. II LLC/Sprint Spectrum Co. III LLC, 3.36%, 09/20/21‡ | | 731,250 | | 737,649 |
Verizon Communications, Inc., 2.95%, 03/15/22 | | 856,000 | | 862,060 |
Total Telecommunication Services | | | | 3,271,944 |
| | | | |
Utilities — 0.3% | | | | |
Exelon Corp., 2.85%, 06/15/20 | | 555,000 | | 560,494 |
Total Corporate Bonds | | | | |
(Cost $48,852,387) | | | | 49,192,446 |
| | | | |
TERM LOANS — 11.6% | | | | |
| | | | |
Consumer Discretionary — 3.8% | | |
Altice US Finance I Corp., 3.82%, (1-Month USD LIBOR + 2.25%), 07/28/25@ | | 478,959 | | 477,863 |
Caesars Entertainment Operating Co., Inc.
(fka Harrah’s Operating
Co., Inc.), 3.85%,
(1-Month USD LIBOR + 2.50%), 10/07/24@(b) | | 250,000 | | 250,586 |
Charter Communications Operating, LLC (aka CCO Safari LLC), 04/13/25(b) | | 865,000 | | 866,544 |
CityCenter Holdings, LLC, 4.07%, (1-Month USD LIBOR + 2.50%), 04/18/24@ | | 218,900 | | 220,146 |
CSC Holdings, LLC (fka CSC Holdings Inc./Cablevision), 3.74%, (1-Month USD LIBOR + 2.25%), 07/17/25@ | | 658,346 | | 656,749 |
Eldorado Resorts, Inc., 3.75%, (1-Month USD LIBOR + 2.25%), 04/17/24@ | | 594,085 | | 595,291 |
McGraw-Hill Global Education Holdings LLC, 5.57%, (1-Month USD LIBOR + 4.00%), 05/04/22@ | | 501,184 | | 500,976 |
MGM Growth Properties Operating Partnership LP, 3.82%, (1-Month USD LIBOR + 2.25%), 04/25/23@ | | 616,028 | | 619,215 |
See accompanying Notes to Financial Statements.
48
ADVISORSHARES NEWFLEET MULTI-SECTOR INCOME ETF
Schedule of Investments (continued)
December 31, 2017 (Unaudited)
| | | | |
TERM LOANS (continued) | | | | | | |
| | | |
Consumer Discretionary (continued) | | | |
PetSmart, Inc., 4.57%, (1-Month USD LIBOR + 3.00%), 03/11/22@ | | $ | 504,099 | | $ | 404,935 |
Playa Resorts Holding B.V., 4.62%, (3-Month USD LIBOR + 3.00%), 04/29/24@ | | | 806,736 | | | 811,693 |
Seminole Tribe of Florida, 3.57%, (1-Month USD LIBOR + 2.00%), 07/08/24@ | | | 399,000 | | | 401,424 |
Sinclair Television Group, Inc., 12/12/24(b) | | | 505,000 | | | 504,765 |
StationCasinos LLC, 4.06%, (1-Month USD LIBOR + 2.50%), 06/08/23@ | | | 371,567 | | | 372,675 |
Univision Communications, 4.32%, (1-Month USD LIBOR + 2.75%),
03/15/24@ | | | 804,142 | | | 802,690 |
Total Consumer Discretionary | | | | | | 7,485,552 |
| | | | | | |
Consumer Staples — 1.2% | | | | | | |
Albertson’s LLC, 4.32%, (1-Month USD LIBOR + 2.75%), 08/25/21@ | | | 481,413 | | | 472,576 |
Aramark Intermediate HoldCo Corp., 3.57%, (1-Month USD LIBOR + 2.00%), 03/11/25@ | | | 100,000 | | | 100,641 |
Aramark Servies, Inc., 3.57%, (1-Month USD LIBOR + 2.00%), 03/28/24@ | | | 342,580 | | | 344,936 |
Hostess Brands, LLC, 3.82%, (1-Month USD LIBOR + 2.25%), 08/03/22@ | | | 893,525 | | | 895,411 |
JBS U.S., 4.10%, (3-Month USD LIBOR + 2.50%), 10/30/22@ | | | 537,770 | | | 529,233 |
Post Holdings, Inc., 3.82%, (1-Month USD LIBOR + 2.25%), 05/24/24@ | | | 114,425 | | | 114,977 |
Total Consumer Staples | | | | | | 2,457,774 |
| | | | | | |
Energy — 0.7% | | | | | | |
Medallion Midland
Acquisition, LLC, 4.82%, (1-Month USD LIBOR + 3.25%), 10/30/24@ | | | 260,000 | | | 260,975 |
MEG Energy, 5.20%,
(3-Month USD LIBOR + 3.50%), 12/31/23@ | | | 633,143 | | | 634,770 |
| | | | |
TERM LOANS (continued) | | | | | | |
| | | | | | |
Energy (continued) | | | | | | |
Ultra Resources, Inc., 4.41%, (3-Month USD LIBOR + 3.00%), 04/12/24@ | | $ | 585,000 | | $ | 585,439 |
Total Energy | | | | | | 1,481,184 |
| | | | | | |
Financials — 0.1% | | | | | | |
Delos Finance S.a.r.l., 3.69%, (3-Month USD LIBOR + 2.00%), 10/06/23@ | | | 289,000 | | | 291,555 |
| | | | | | |
Health Care — 0.7% | | | | | | |
Acadia Healthcare Co., Inc., 4.14%, (1-Month USD LIBOR + 2.75%), 02/16/23@ | | | 174,483 | | | 175,704 |
CHS/Community Health Systems, Inc., 4.48%, (3-Month USD LIBOR + 3.00%), 01/27/21@ | | | 321,621 | | | 307,503 |
HLF Financing, 7.07%, (1-Month USD LIBOR + 5.50%), 02/15/23@ | | | 122,688 | | | 122,669 |
INC Research Holdings, Inc., 3.82%, (1-Month USD LIBOR + 2.25%), 08/01/24@ | | | 198,594 | | | 199,137 |
Valeant Pharmaceuticals International, Inc., 4.94%, (1-Month USD LIBOR + 3.50%), 04/01/22@ | | | 492,743 | | | 500,328 |
Total Health Care | | | | | | 1,305,341 |
| | | | | | |
Industrials — 1.4% | | | | | | |
Advanced Disposal Services, Inc. (fka ADS Waste Holdings, Inc.), 3.74%,
(1-Week USD LIBOR + 2.25%), 11/10/23@ | | | 635,587 | | | 637,970 |
American Airlines, Inc., 3.57%, (1-Month USD LIBOR + 2.00%), 04/28/23@ | | | 495,000 | | | 495,208 |
Hayward Industries, Inc., 5.07%, (1-Month USD LIBOR + 3.50%), 08/05/24@ | | | 503,738 | | | 505,627 |
Quikrete Holdings, Inc., 4.32%, (1-Month USD LIBOR + 2.75%), 11/15/23@ | | | 445,192 | | | 446,635 |
TransDigm, Inc., 4.32%, (3-Month USD LIBOR + 2.75%), 06/09/23@ | | | 203,457 | | | 203,993 |
See accompanying Notes to Financial Statements.
49
ADVISORSHARES NEWFLEET MULTI-SECTOR INCOME ETF
Schedule of Investments (continued)
December 31, 2017 (Unaudited)
| | | | |
TERM LOANS (continued) | | | | | | |
| | | | | | |
Industrials (continued) | | | | | | |
TransDigm, Inc., 4.69%, (3-Month USD LIBOR + 3.00%), 08/22/24@ | | $ | 169,150 | | $ | 170,149 |
United AirLines, Inc., 3.38%, (3-Month USD LIBOR + 2.00%), 04/01/24@ | | | 426,775 | | | 428,339 |
Total Industrials | | | | | | 2,887,921 |
| | | | | | |
Information Technology — 0.7% | | | |
First Data Corp., 3.80%, (1-Month USD LIBOR + 2.25%), 04/26/24@ | | | 487,489 | | | 488,230 |
Kronos, Inc., 4.90%, (3-Month USD LIBOR + 3.50%), 11/01/23@ | | | 329,676 | | | 332,253 |
Rackspace Hosting, Inc., 4.38%, (3-Month USD LIBOR + 3.00%), 11/03/23@ | | | 501,053 | | | 501,506 |
Total Information Technology | | | | | | 1,321,989 |
| | | | | | |
Materials — 0.2% | | | | | | |
Ineos US Finance LLC, 3.57%, (1-Month USD LIBOR + 2.00%), 03/31/24@ | | | 365,000 | | | 365,896 |
| | | | | | |
Real Estate — 0.5% | | | | | | |
Capital Automotive LP, 4.07%, (1-Month USD LIBOR + 2.50%), 03/25/24@ | | | 725,765 | | | 728,668 |
Realogy Group, 3.82%, (1-Month USD LIBOR + 2.25%), 07/20/22@ | | | 285,737 | | | 286,854 |
Total Real Estate | | | | | | 1,015,522 |
| | | | | | |
Telecommunication Services — 1.2% | | | |
CenturyLink, Inc., 4.32%, (3-Month USD Prime + 1.75%), 01/31/25@ | | | 365,000 | | | 352,681 |
Level 3 Financing, Inc., 3.70%, (3-Month USD LIBOR + 2.25%), 02/22/24@ | | | 815,000 | | | 816,166 |
UPC Financing Partnership, 3.98%, (1-Month USD LIBOR + 2.50%), 01/15/26@ | | | 485,000 | | | 485,405 |
Virgin Media Bristol LLC, 3.98%, (1-Month USD LIBOR + 2.50%), 01/15/26@ | | | 665,000 | | | 665,751 |
Total Telecommunication Services | | | | | | 2,320,003 |
| | | | |
TERM LOANS (continued) | | | | | | |
| | | | | | |
Utilities — 1.1% | | | | | | |
Calpine Corp., 3.84%, (3-Month USD LIBOR + 2.50%), 01/15/24@ | | $ | 437,775 | | $ | 437,672 |
Dynegy, Inc., 4.25%, (1-Month USD LIBOR + 2.75%), 02/07/24@ | | | 622,594 | | | 626,315 |
Energy Future Intermediate Holding Co. LLC, 4.57%, (1-Month USD LIBOR + 3.00%), 06/30/18@ | | | 370,000 | | | 371,254 |
NRG Energy, 3.94%, (3-Month USD LIBOR + 2.25%), 06/30/23@ | | | 383,573 | | | 384,256 |
Vistra Operations Co. LLC (fka Tex Operations Co. LLC), 3.83%, (1-Month USD LIBOR + 2.75%), 08/04/23@ | | | 227,296 | | | 228,788 |
Vistra Operations Co. LLC (fka Tex Operations Co. LLC), 3.83%, (1-Month USD LIBOR + 2.50%), 08/04/23@ | | | 40,031 | | | 40,294 |
Vistra Operations Co. LLC (fka Tex Operations Co. LLC), 4.08%, (1-Month USD LIBOR + 2.75%), 12/14/23@ | | | 68,310 | | | 68,877 |
Total Utilities | | | | | | 2,157,456 |
Total Term Loans | | | | | | |
(Cost $23,135,950) | | | | | | 23,090,193 |
| | | | | | |
FOREIGN BONDS — 6.6% | | | | | | |
| | | | | | |
Consumer Staples — 0.4% | | | | | | |
BAT Capital Corp. (United Kingdom), 2.76%, 08/15/22‡ | | | 805,000 | | | 801,478 |
| | | | | | |
Energy — 1.1% | | | | | | |
Petrobras Global Finance BV (Brazil), 8.38%, 05/23/21 | | | 450,000 | | | 514,068 |
Petrobras Global Finance BV (Brazil), 5.30%, 01/27/25‡ | | | 275,000 | | | 276,169 |
Petroleos Mexicanos (Mexico), 4.88%, 01/24/22 | | | 1,300,000 | | | 1,358,175 |
Total Energy | | | | | | 2,148,412 |
| | | | | | |
Financials — 1.6% | | | | | | |
AerCap Ireland Capital
DAC/AerCap Global Aviation Trust (Netherlands), 4.50%, 05/15/21 | | | 405,000 | | | 425,671 |
See accompanying Notes to Financial Statements.
50
ADVISORSHARES NEWFLEET MULTI-SECTOR INCOME ETF
Schedule of Investments (continued)
December 31, 2017 (Unaudited)
| | | | |
FOREIGN BONDS (continued) | | | |
| | | | | | |
Financials (continued) | | | | | | |
AerCap Ireland Capital
DAC/AerCap Global Aviation Trust (Netherlands), 3.95%, 02/01/22 | | $ | 150,000 | | $ | 154,739 |
Brookfield Finance LLC (Canada), 4.00%, 04/01/24 | | | 561,000 | | | 581,544 |
Guanay Finance Ltd. (Chile), 6.00%, 12/15/20‡ | | | 622,608 | | | 642,563 |
HSBC Holdings PLC (United Kingdom), 2.95%, 05/25/21 | | | 640,000 | | | 644,709 |
Mizuho Financial Group, Inc. (Japan), 2.27%, 09/13/21 | | | 785,000 | | | 771,080 |
Total Financials | | | | | | 3,220,306 |
| | | | | | |
Industrials — 0.4% | | | | | | |
British Airways Class B Pass Through Trust (United Kingdom), 5.63%, 06/20/20‡ | | | 175,216 | | | 181,498 |
Doric Nimrod Air Finance Alpha Ltd. Class A
Pass-Through Trust, Series 2012-1A (Guernsey), 5.13%, 11/30/22‡ | | | 599,694 | | | 626,706 |
Total Industrials | | | | | | 808,204 |
| | | | | | |
Materials — 2.5% | | | | | | |
Anglo American Capital PLC (United Kingdom), 3.63%, 09/11/24‡ | | | 680,000 | | | 677,540 |
Fibria Overseas Finance Ltd. (Brazil), 4.00%, 01/14/25 | | | 655,000 | | | 649,678 |
FMG Resources Pty Ltd. (Australia), 9.75%, 03/01/22‡ | | | 650,000 | | | 720,850 |
Glencore Funding LLC (Switzerland), 4.13%, 05/30/23‡ | | | 640,000 | | | 662,880 |
James Hardie International Finance Dac (Ireland), 4.75%, 01/15/25‡ | | | 515,000 | | | 521,438 |
NOVA Chemicals Corp. (Canada), 4.88%, 06/01/24‡ | | | 70,000 | | | 70,000 |
NOVA Chemicals Corp. (Canada), 5.00%, 05/01/25‡ | | | 545,000 | | | 545,000 |
Rusal Capital DAC (Russia), 5.13%, 02/02/22‡ | | | 385,000 | | | 393,803 |
Yamana Gold, Inc. (Canada), 4.63%, 12/15/27‡ | | | 720,000 | | | 725,158 |
Total Materials | | | | | | 4,966,347 |
| | | | |
FOREIGN BONDS (continued) | | | |
| | | | | | |
Sovereign Government — 0.6% | | | |
Argentine Republic Government International Bond (Argentina), 6.88%, 04/22/21 | | $ | 355,000 | | $ | 387,261 |
Argentine Republic Government International Bond (Argentina), 5.63%, 01/26/22 | | | 235,000 | | | 248,512 |
Costa Rica Government International Bond (Costa Rica), 4.38%, 04/30/25‡ | | | 535,000 | | | 518,950 |
Total Sovereign Government | | | | | | 1,154,723 |
Total Foreign Bonds | | | | | | |
(Cost $12,959,924) | | | | | | 13,099,470 |
| | | | | | |
U.S. GOVERNMENT AGENCY SECURITIES — 1.3% |
Federal National Mortgage Association, 2.50%, 02/01/31 | | | 1,028,682 | | | 1,027,904 |
Federal National Mortgage Association, 2.50%, 08/01/31 | | | 234,105 | | | 233,928 |
Federal National Mortgage Association, 3.00%, 10/01/30 | | | 500,821 | | | 511,364 |
Federal National Mortgage Association, 3.00%, 10/01/30 | | | 682,237 | | | 696,590 |
Federal National Mortgage Association, 5.00%, 06/25/37 | | | 31,574 | | | 32,346 |
Federal National Mortgage Association, 4.00%, 11/25/41 | | | 120,305 | | | 121,431 |
| | | | | | |
Total U.S. Government Agency Securities |
(Cost $2,675,261) | | | | | | 2,623,563 |
| | | | | | |
MONEY MARKET FUND — 1.2% | | | |
JPMorgan U.S. Government Money Market Fund – Institutional Class, 1.14%(c) (Cost $2,304,335) | | | 2,304,335 | | | 2,304,335 |
See accompanying Notes to Financial Statements.
51
ADVISORSHARES NEWFLEET MULTI-SECTOR INCOME ETF
Schedule of Investments (continued)
December 31, 2017 (Unaudited)
| | | | |
REPURCHASE AGREEMENTS — 0.3%(d) | | | | |
| | | | | | | |
Citigroup Global Markets, Inc., dated 12/29/17, due 01/02/18, 1.39%, total to be received $65,005, (collateralized by various U.S. Government Agency Obligations, 0.00% – 4.38%, 02/15/18 – 11/15/39, totaling $65,970) | | $ | 64,997 | | $ | 64,997 | |
Daiwa Capital Markets America, dated 12/29/17, due 01/02/18, 1.43%, total to be received $250,030, (collateralized by various U.S. Government Agency Obligations, 0.00% – 6.50%, 01/11/18 – 12/01/51, totaling $254,353) | | | 250,000 | | | 250,000 | |
RBC Dominion Securities, Inc., dated 12/29/17, due 01/02/18, 1.40%, total to be received $250,029, (collateralized by various U.S. Government Agency Obligations, 1.88% – 8.88%, 02/15/19 – 12/20/47, totaling $254,210) | | | 250,000 | | | 250,000 | |
| | | | | | | |
Total Repurchase Agreements |
(Cost $564,997) | | | | | | 564,997 | |
| | | | | | | |
Total Investments — 100.6% | | | | | | | |
(Cost $199,454,879) | | | | | | 199,885,990 | |
| | | | | | | |
Liabilities in Excess of Other Assets — (0.6%) | | | | | | (1,190,025 | ) |
Net Assets — 100.0% | | | | | $ | 198,695,965 | |
SUMMARY OF SCHEDULE OF INVESTMENTS
| | |
Asset Backed Securities | | 29.0 | % |
Commercial Mortgage Backed Securities | | 5.7 | |
Consumer Discretionary | | 6.5 | |
Consumer Staples | | 1.7 | |
Energy | | 3.3 | |
Financials | | 13.0 | |
Health Care | | 3.1 | |
Industrials | | 3.7 | |
Information Technology | | 1.7 | |
Materials | | 3.2 | |
Real Estate | | 1.9 | |
Residential Mortgage Backed Securities | | 19.9 | |
Sovereign Government | | 0.6 | |
Telecommunication Services | | 2.9 | |
U.S. Government Agency Securities | | 1.5 | |
Utilities | | 1.4 | |
Money Market | | 1.2 | |
Repurchase Agreements | | 0.3 | |
Total Investments | | 100.6 | |
Liabilities in Excess of Other Assets | | (0.6 | ) |
Net Assets | | 100.0 | % |
See accompanying Notes to Financial Statements.
52
ADVISORSHARES PACIFIC ASSET ENHANCED FLOATING RATE ETF
Schedule of Investments
December 31, 2017 (Unaudited)
| | | | |
TERM LOANS — 80.9% | | | | | | |
| | | | | | |
Advertising — 1.6% | | | | | | |
Acosta, Inc., 4.82%, (1-Month USD LIBOR + 3.25%), 09/26/21@ | | $ | 486,222 | | $ | 429,497 |
| | | | | | |
Aerospace/Defense — 2.5% | | | | | | |
Accudyne Industries Borrower SCA, 08/18/24 (Luxembourg)(a) | | | 249,375 | | | 251,518 |
TransDigm, Inc., 4.32%, (1-Month USD LIBOR + 2.75%), 06/09/23@ | | | 284,882 | | | 285,633 |
TransDigm, Inc., 4.44%, (3-Month USD LIBOR + 2.75%), 06/09/23@ | | | 148,619 | | | 149,011 |
Total Aerospace/Defense | | | | | | 686,162 |
| | | | | | |
Auto Parts & Equipment — 2.3% | | | |
Cooper-Standard Automotive, Inc., 3.94%, (3-Month USD LIBOR + 2.25%), 11/02/23@ | | | 225,528 | | | 227,022 |
Federal-Mogul LLC, 5.23%, (1-Month USD LIBOR + 3.75%), 04/15/21@ | | | 289,077 | | | 291,625 |
Federal-Mogul LLC, 5.32%, (1-Month USD LIBOR + 3.75%), 04/15/21@ | | | 95,676 | | | 96,519 |
Total Auto Parts & Equipment | | | | | | 615,166 |
| | | | | | |
Building Materials — 2.7% | | | | | | |
GYP Holdings III Corp., 4.38%, (3-Month USD LIBOR + 3.00%), 04/01/23@ | | | 486,306 | | | 489,042 |
Quikrete Holdings, Inc., 4.32%, (1-Month USD LIBOR + 2.75%), 11/15/23@ | | | 241,593 | | | 242,375 |
Total Building Materials | | | | | | 731,417 |
| | | | | | |
Chemicals — 1.6% | | | | | | |
Avantor Performance Materials Holdings LLC, 5.51%, (1-Month USD LIBOR + 4.00%), 11/21/24@ | | | 250,000 | | | 251,485 |
MacDermid, Inc., 4.57%, (1-Month USD LIBOR + 3.00%), 06/07/23@ | | | 189,056 | | | 190,261 |
Total Chemicals | | | | | | 441,746 |
| | | | | | |
Coal — 1.4% | | | | | | |
Arch Coal, Inc., 4.82%, (1-Month USD LIBOR + 3.25%), 03/07/24@ | | | 248,747 | | | 251,172 |
| | | | |
TERM LOANS (continued) | | | | | | |
| | | | | | |
Coal (continued) | | | | | | |
Peabody Energy Corp., 5.07%, (1-Month USD LIBOR + 3.50%), 03/31/22@ | | $ | 117,370 | | $ | 119,131 |
Total Coal | | | | | | 370,303 |
| | | | | | |
Commercial Services — 4.1% | | | | | | |
Allied Universal Holdco LLC, 5.44%, (3-Month USD LIBOR + 3.75%), 07/28/22@ | | | 248,734 | | | 247,141 |
Brightview Landscapes LLC, 4.38%, (3-Month USD LIBOR + 3.00%), 12/18/20@ | | | 131,493 | | | 132,374 |
Brightview Landscapes LLC, 4.49%, (1-Month USD LIBOR + 3.00%), 12/18/20@ | | | 107,239 | | | 107,958 |
Brightview Landscapes LLC, 7.99%, (1-Month USD LIBOR + 6.50%), 12/17/21@ | | | 117,021 | | | 117,826 |
Camelot Finance LP, 4.82%, (1-Month USD LIBOR + 3.25%), 10/03/23@ | | | 243,781 | | | 245,567 |
Garda World Security Corp., 4.97%, (3-Month USD LIBOR + 3.50%), 05/24/24 (Canada)@ | | | 248,747 | | | 250,457 |
Garda World Security Corp., 7.00%, (Prime + 2.50%), 05/24/24 (Canada)@ | | | 627 | | | 631 |
Total Commercial Services | | | | | | 1,101,954 |
| | | | | | |
Computers — 2.4% | | | | | | |
McAfee LLC, 6.07%, (1-Month USD LIBOR + 4.50%), 09/30/24@ | | | 249,375 | | | 248,930 |
Western Digital Corp., 3.57%, (1-Month USD LIBOR + 2.00%), 04/29/23@ | | | 394,027 | | | 395,899 |
Total Computers | | | | | | 644,829 |
| | | | | | |
Distribution/Wholesale — 5.5% | | | |
Nexeo Solutions LLC, 4.58%, (3-Month USD LIBOR + 3.25%), 06/09/23@ | | | 164,122 | | | 165,097 |
Nexeo Solutions LLC, 4.63%, (2-Month USD LIBOR + 3.25%), 06/09/23@ | | | 166,412 | | | 167,401 |
Nexeo Solutions LLC, 4.94%, (3-Month USD LIBOR + 3.25%), 06/09/23@ | | | 161,991 | | | 162,953 |
See accompanying Notes to Financial Statements.
53
ADVISORSHARES PACIFIC ASSET ENHANCED FLOATING RATE ETF
Schedule of Investments (continued)
December 31, 2017 (Unaudited)
| | | | |
TERM LOANS (continued) | | | | | | |
| | | |
Distribution/Wholesale (continued) | | | |
Spin Holdco, Inc., 5.15%, (2-Month USD LIBOR + 3.75%), 11/14/22@ | | $ | 486,916 | | $ | 491,176 |
Univar USA, Inc., 4.07%, (1-Month USD LIBOR + 2.50%), 07/01/24@ | | | 488,822 | | | 491,090 |
Total Distribution/Wholesale | | | | | | 1,477,717 |
| | | | | | |
Electric — 1.8% | | | | | | |
Vistra Operations Co. LLC, 4.08%, (3-Month USD LIBOR + 2.75%), 12/14/23@ | | | 120,000 | | | 120,997 |
Vistra Operations Co. LLC, 4.24%, (1-Month USD LIBOR + 2.75%), 12/14/23@ | | | 375,000 | | | 378,114 |
Total Electric | | | | | | 499,111 |
| | | | | | |
Environmental Control — 0.9% | | | |
Wrangler Buyer Corp., 4.59%, (1-Month USD LIBOR + 3.00%), 09/27/24@ | | | 250,000 | | | 251,964 |
| | | | | | |
Food — 3.1% | | | | | | |
Albertson’s LLC, 4.46%, (3-Month USD LIBOR + 3.00%), 06/22/23@ | | | 346,478 | | | 339,933 |
U.S. Foods, Inc., 4.07%, (1-Month USD LIBOR + 2.50%), 06/27/23@ | | | 486,250 | | | 489,636 |
Total Food | | | | | | 829,569 |
| | | | | | |
Hand/Machine Tools — 1.8% | | | | | | |
Apex Tool Group LLC, 4.82%, (1-Month USD LIBOR + 3.25%), 01/31/20@ | | | 478,150 | | | 477,653 |
| | | | | | |
Healthcare – Services — 2.0% | | | | | | |
Air Medical Group Holdings, Inc., 4.94%, (3-Month USD LIBOR + 3.25%), 04/28/22@ | | | 248,724 | | | 248,170 |
CHS/Community Health Systems, Inc., 4.23%, (3-Month USD LIBOR + 2.75%), 12/31/19@ | | | 104,607 | | | 101,564 |
CHS/Community Health Systems, Inc., 4.48%, (3-Month USD LIBOR + 3.00%), 01/27/21@ | | | 193,764 | | | 185,258 |
Total Healthcare – Services | | | | | | 534,992 |
| | | | |
TERM LOANS (continued) | | | | | | |
| | | |
Household Products/Wares — 1.8% | | | |
Prestige Brands, Inc., 4.32%, (1-Month USD LIBOR + 2.75%), 01/26/24@ | | $ | 479,040 | | $ | 482,709 |
| | | | | | |
Insurance — 3.3% | | | | | | |
HUB International Ltd., 4.41%, (3-Month USD LIBOR + 3.00%), 10/02/20@ | | | 242,446 | | | 243,798 |
USI, Inc., 05/16/24(a) | | | 399,000 | | | 399,000 |
VF Holdings Corp., 4.82%, (1-Month USD LIBOR + 3.25%), 06/30/23@ | | | 248,741 | | | 250,961 |
Total Insurance | | | | | | 893,759 |
| | | | | | |
Internet — 1.8% | | | | | | |
Uber Technologies, Inc., 5.55%, (1-Month USD LIBOR + 4.00%), 07/13/23@ | | | 493,750 | | | 497,515 |
| | | | | | |
Leisure Time — 3.6% | | | | | | |
24 Hour Fitness Worldwide, Inc., 5.44%, (3-Month USD LIBOR + 3.75%),
05/28/21@ | | | 242,462 | | | 243,145 |
BRP US, Inc., 3.93%, (2-Month USD LIBOR + 2.50%), 06/30/23@ | | | 247,500 | | | 248,969 |
ClubCorp Holdings, Inc., 09/18/24(a) | | | 489,634 | | | 492,273 |
Total Leisure Time | | | | | | 984,387 |
| | | | | | |
Lodging — 3.6% | | | | | | |
Caesars Resort Collection LLC, 10/02/24(a) | | | 500,000 | | | 502,857 |
Hilton Worldwide Finance LLC, 3.55%, (1-Month USD LIBOR + 2.00%), 10/25/23@ | | | 204,051 | | | 205,287 |
Playa Resorts Holding BV, 4.62%, (3-Month USD LIBOR + 3.25%),
04/29/24@ | | | 248,750 | | | 250,279 |
Total Lodging | | | | | | 958,423 |
| | | | | | |
Machinery – Diversified — 0.8% | | | |
RBS Global, Inc., 3.80%, (1-Month USD LIBOR + 2.25%), 08/21/24@ | | | 207,725 | | | 208,829 |
See accompanying Notes to Financial Statements.
54
ADVISORSHARES PACIFIC ASSET ENHANCED FLOATING RATE ETF
Schedule of Investments (continued)
December 31, 2017 (Unaudited)
| | | | |
TERM LOANS (continued) | | | | | | |
| | | | | | |
Media — 0.9% | | | | | | |
Altice US Finance I Corp., 3.82%, (1-Month USD LIBOR + 2.25%),
07/28/25@ | | $ | 244,967 | | $ | 244,406 |
| | | | | | |
Metal Fabricate/Hardware — 0.9% | | | |
Crosby U.S. Acquisition Corp., 4.45%, (3-Month USD LIBOR + 3.00%),
11/23/20@ | | | 248,705 | | | 243,084 |
| | | | | | |
Miscellaneous Manufacturing — 1.1% | | | |
Gates Global LLC, 4.69%, (3-Month USD LIBOR + 3.00%), 04/01/24@ | | | 298,443 | | | 300,516 |
| | | | | | |
Oil & Gas — 2.0% | | | | | | |
Chesapeake Energy Corp., 8.95%, (3-Month USD LIBOR + 7.50%),
08/23/21@ | | | 500,000 | | | 533,625 |
| | | | | | |
Packaging & Containers — 6.1% | | | |
Plastipak Holdings, Inc., 10/15/24(a) | | | 249,375 | | | 251,058 |
Proampac PG Borrower LLC, 4.88%, (3-Month USD LIBOR + 3.50%), 11/20/23@ | | | 105,927 | | | 106,953 |
Proampac PG Borrower LLC, 4.91%, (1-Month USD LIBOR + 3.50%), 11/20/23@ | | | 40,414 | | | 40,805 |
Proampac PG Borrower LLC, 4.94%, (3-Month USD LIBOR + 3.50%), 11/20/23@ | | | 136,057 | | | 137,376 |
Proampac PG Borrower LLC, 5.00%, (1-Month USD LIBOR + 3.50%), 11/20/23@ | | | 212,704 | | | 214,765 |
Proampac PG Borrower LLC, 7.25%, (Prime + 3.00%), 11/20/23@ | | | 1,148 | | | 1,159 |
Reynolds Group Holdings, Inc., 4.32%, (1-Month USD LIBOR + 2.75%), 02/05/23@ | | | 444,731 | | | 447,333 |
SIG Combibloc, 4.57%, (1-Month USD LIBOR + 3.00%), 03/11/22 (Luxembourg)@ | | | 449,515 | | | 452,199 |
Total Packaging & Containers | | | | | | 1,651,648 |
| | | | |
TERM LOANS (continued) | | | | | | |
| | | | | | |
Pharmaceuticals — 0.9% | | | | | | |
Valeant Pharmaceuticals International, Inc., 4.94%, (1-Month USD LIBOR + 3.50%), 04/01/22@ | | $ | 244,253 | | $ | 248,013 |
| | | | | | |
Real Estate — 1.8% | | | | | | |
DTZ US Borrower LLC, 4.63%, (3-Month USD LIBOR + 3.25%), 11/04/21@ | | | 146,811 | | | 145,133 |
DTZ US Borrower LLC, 4.73%, (3-Month USD LIBOR + 3.25%), 11/04/21@ | | | 326,703 | | | 322,969 |
DTZ US Borrower LLC, 4.94%, (3-Month USD LIBOR + 3.25%), 11/04/21@ | | | 18,910 | | | 18,694 |
Total Real Estate | | | | | | 486,796 |
| | | | | | |
Retail — 12.7% | | | | | | |
1011778 BC ULC, 3.82%, (1-Month USD LIBOR + 2.25%), 02/16/24 (Canada)@ | | | 225,320 | | | 225,501 |
1011778 BC ULC, 3.94%, (3-Month USD LIBOR + 2.25%), 02/16/24 (Canada)@ | | | 144,855 | | | 144,971 |
BJ’s Wholesale Club, Inc., 8.95%, (2-Month USD LIBOR + 7.50%), 02/03/25@ | | | 250,000 | | | 244,805 |
CEC Entertainment, Inc., 4.82%, (1-Month USD LIBOR + 3.25%), 02/15/21@ | | | 484,887 | | | 458,218 |
Michaels Stores, Inc., 4.21%, (1-Month USD LIBOR + 2.75%), 01/27/23@ | | | 51,592 | | | 51,661 |
Michaels Stores, Inc., 4.25%, (1-Month USD LIBOR + 2.75%), 01/27/23@ | | | 8,895 | | | 8,907 |
Michaels Stores, Inc., 4.32%, (1-Month USD LIBOR + 2.75%), 01/27/23@ | | | 138,637 | | | 138,822 |
Neiman Marcus Group Ltd. LLC, 4.64%, (1-Month USD LIBOR + 3.25%), 10/25/20@ | | | 486,111 | | | 398,310 |
Petco Animal Supplies, Inc., 4.38%, (3-Month USD LIBOR + 3.00%), 01/26/23@ | | | 493,719 | | | 374,918 |
See accompanying Notes to Financial Statements.
55
ADVISORSHARES PACIFIC ASSET ENHANCED FLOATING RATE ETF
Schedule of Investments (continued)
December 31, 2017 (Unaudited)
| | | | |
TERM LOANS (continued) | | | | | | |
| | | | | | |
Retail (continued) | | | | | | |
PetSmart, Inc., 4.57%, (1-Month USD LIBOR + 3.00%), 03/10/22@ | | $ | 487,500 | | $ | 391,601 |
Rite Aid Corp., 6.24%,
(1-Week USD LIBOR + 4.75%), 08/21/20@ | | | 250,000 | | | 251,355 |
Smart & Final Stores LLC, 5.19%, (3-Month USD LIBOR + 3.50%), 11/15/22@ | | | 250,000 | | | 244,791 |
SRS Distribution Inc., 4.82%, (1-Month USD LIBOR + 3.25%), 08/25/22@ | | | 289,449 | | | 291,349 |
SRS Distribution Inc., 4.94%, (3-Month USD LIBOR + 3.25%), 08/25/22@ | | | 204,254 | | | 205,594 |
Total Retail | | | | | | 3,430,803 |
| | | | | | |
Semiconductors — 1.1% | | | | | | |
Microsemi Corp., 3.38%, (2-Month USD LIBOR + 2.00%), 01/13/23@ | | | 93,963 | | | 94,433 |
ON Semiconductor Corp., 3.57%, (1-Month USD LIBOR + 2.00%),
03/31/23@ | | | 189,354 | | | 190,448 |
Total Semiconductors | | | | | | 284,881 |
| | | | | | |
Software — 2.5% | | | | | | |
CCC Information Services, Inc., 04/29/24(a) | | | 249,373 | | | 250,090 |
Infor US, Inc., 4.44%, (1-Month USD LIBOR + 2.75%), 02/01/22@ | | | 180,654 | | | 181,445 |
Solera LLC, 4.82%, (1-Month USD LIBOR + 3.25%), 03/03/23@ | | | 245,625 | | | 247,519 |
Total Software | | | | | | 679,054 |
| | | | | | |
Telecommunications — 2.3% | | | | | | |
Avaya, Inc., 12/13/24(a) | | | 375,000 | | | 369,727 |
Frontier Communications Corp., 5.32%, (1-Month USD LIBOR + 3.75%), 06/17/24@ | | | 248,750 | | | 239,422 |
Total Telecommunications | | | | | | 609,149 |
Total Term Loans | | | | | | |
(Cost $22,149,106) | | | | | | 21,829,677 |
| | | | |
CORPORATE BONDS — 8.7% | | | | | | |
| | | | | | |
Commercial Services — 1.9% | | | | | | |
Ahern Rentals, Inc., 7.38%, 05/15/23‡ | | $ | 250,000 | | $ | 236,250 |
Prime Security Services Borrower LLC/Prime Finance, Inc., 9.25%, 05/15/23‡ | | | 250,000 | | | 278,125 |
Total Commercial Services | | | | | | 514,375 |
| | | |
Diversified Financial Services — 1.0% | | | |
Jefferies Finance LLC/JFIN Co-Issuer Corp., 7.38%, 04/01/20‡ | | | 250,000 | | | 258,125 |
| | | | | | |
Home Builders — 1.0% | | | | | | |
Lennar Corp., 4.50%, 06/15/19 | | | 250,000 | | | 256,563 |
| | | | | | |
Lodging — 1.0% | | | | | | |
MGM Resorts International, 6.75%, 10/01/20 | | | 250,000 | | | 270,625 |
| | | | | | |
Media — 1.0% | | | | | | |
CSC Holdings LLC, 6.63%, 10/15/25‡ | | | 250,000 | | | 271,245 |
| | | | | | |
Retail — 0.9% | | | | | | |
Golden Nugget, Inc., 6.75%, 10/15/24‡ | | | 250,000 | | | 255,000 |
| | | | | | |
Telecommunications — 1.9% | | | | | | |
Sprint Communications, Inc., 6.00%, 11/15/22 | | | 250,000 | | | 250,625 |
T-Mobile USA, Inc., 6.38%, 03/01/25(b) | | | 250,000 | | | 268,125 |
Total Telecommunications | | | | | | 518,750 |
Total Corporate Bonds | | | | | | |
(Cost $2,294,790) | | | | | | 2,344,683 |
| | | | | | |
FOREIGN BOND — 0.5% | | | | | | |
| | | | | | |
Food — 0.5% | | | | | | |
JBS USA LUX SA/JBS USA Finance, Inc., 7.25%, 06/01/21 (Brazil) (Cost $125,961)‡ | | | 125,000 | | | 127,657 |
| | | | | | |
MONEY MARKET FUND — 19.0% | | | |
JPMorgan U.S. Government Money Market Fund – Institutional Class, 1.14%(c) (Cost $5,138,631) | | | 5,138,631 | | | 5,138,631 |
See accompanying Notes to Financial Statements.
56
ADVISORSHARES PACIFIC ASSET ENHANCED FLOATING RATE ETF
Schedule of Investments (continued)
December 31, 2017 (Unaudited)
| | | | |
REPURCHASE AGREEMENT — 0.9%(d) | | | | |
| | | | | | | |
Daiwa Capital Markets America, dated 12/29/17, due 01/02/18, 1.43%, total to be received $239,464, (collateralized by various U.S. Government
Agency Obligations,
0.00% – 6.50%,
01/11/18 – 12/01/51, totaling $243,604)
(Cost $239,435) | | $ | 239,435 | | $ | 239,435 | |
Total Investments — 110.0% | | | | | | | |
(Cost $29,947,923) | | | | | | 29,680,083 | |
| | | | | | | |
Liabilities in Excess of Other Assets — (10.0%) | | | | | | (2,686,741 | ) |
Net Assets — 100.0% | | | | | $ | 26,993,342 | |
SUMMARY OF SCHEDULE OF INVESTMENTS
| | |
Advertising | | 1.6 | % |
Aerospace/Defense | | 2.5 | |
Auto Parts & Equipment | | 2.3 | |
Building Materials | | 2.7 | |
Chemicals | | 1.6 | |
Coal | | 1.4 | |
Commercial Services | | 6.0 | |
Computers | | 2.4 | |
Distribution/Wholesale | | 5.5 | |
Diversified Financial Services | | 1.0 | |
Electric | | 1.8 | |
Environmental Control | | 0.9 | |
Food | | 3.6 | |
Hand/Machine Tools | | 1.8 | |
Healthcare – Services | | 2.0 | |
Home Builders | | 1.0 | |
Household Products/Wares | | 1.8 | |
Insurance | | 3.3 | |
Internet | | 1.8 | |
Leisure Time | | 3.6 | |
Lodging | | 4.6 | |
Machinery – Diversified | | 0.8 | |
Media | | 1.9 | |
Metal Fabricate/Hardware | | 0.9 | |
Miscellaneous Manufacturing | | 1.1 | |
Oil & Gas | | 2.0 | |
Packaging & Containers | | 6.1 | |
Pharmaceuticals | | 0.9 | |
Real Estate | | 1.8 | |
Retail | | 13.6 | |
Semiconductors | | 1.1 | |
Software | | 2.5 | |
Telecommunications | | 4.2 | |
Money Market Fund | | 19.0 | |
Repurchase Agreement | | 0.9 | |
Total Investments | | 110.0 | |
Liabilities in Excess of Other Assets | | (10.0 | ) |
Net Assets | | 100.0 | % |
See accompanying Notes to Financial Statements.
57
ADVISORSHARES PACIFIC ASSET ENHANCED FLOATING RATE ETF
Schedule of Investments (continued)
December 31, 2017 (Unaudited)
Total Return Swaps contracts outstanding as of December 31, 2017: |
| | | | Annual Financing Rate Received (Paid) | | | | | | | | | | Unrealized Appreciation/ (Depreciation) |
iBoxx USD Liquid Leveraged Loans Index | | 4,000,000 | | (1.61 | )% | | Quarterly | | 9/20/2018 | | $ | 4,000,000 | | $ | 4,002,386 | | $ | 2,386 |
| | | | | | | | | | | | | | | | | | |
Morgan Stanley acts as the counterparty to the total return swap contracts listed above. The Fund either receives fees from, or pays fees to, the counterparty, depending upon the total return of the benchmark, and the agreed-upon floating financing rate.
See accompanying Notes to Financial Statements.
58
ADVISORSHARES PERITUS HIGH YIELD ETF
Schedule of Investments
December 31, 2017 (Unaudited)
| | | | |
CORPORATE BONDS — 67.5% | | | |
| | | | | | |
Aerospace/Defense — 2.0% | | | | | | |
Kratos Defense & Security Solutions, Inc., 6.50%, 11/30/25‡ | | $ | 1,172,000 | | $ | 1,220,345 |
Triumph Group, Inc., 7.75%, 08/15/25‡ | | | 1,733,000 | | | 1,843,479 |
Total Aerospace/Defense | | | | | | 3,063,824 |
| | | | | | |
Agriculture — 1.0% | | | | | | |
Alliance One International, Inc., 8.50%, 04/15/21‡(a) | | | 1,448,000 | | | 1,520,400 |
| | | | | | |
Auto Manufacturers — 1.2% | | | | | | |
Navistar International Corp., 6.63%, 11/01/25‡ | | | 1,706,000 | | | 1,784,271 |
| | | | | | |
Auto Parts & Equipment — 1.1% | | | |
Titan International, Inc., 6.50%, 11/30/23‡ | | | 1,706,000 | | | 1,740,120 |
| | | | | | |
Banks — 1.1% | | | | | | |
Freedom Mortgage Corp., 8.13%, 11/15/24‡ | | | 1,706,000 | | | 1,742,252 |
| | | | | | |
Biotechnology — 1.6% | | | | | | |
AMAG Pharmaceuticals, Inc., 7.88%, 09/01/23‡ | | | 2,574,000 | | | 2,519,302 |
| | | | | | |
Chemicals — 3.0% | | | | | | |
CVR Partners LP/CVR Nitrogen Finance Corp., 9.25%, 06/15/23‡ | | | 2,192,000 | | | 2,367,360 |
Hexion, Inc., 10.00%, 04/15/20(a) | | | 2,379,000 | | | 2,271,945 |
Total Chemicals | | | | | | 4,639,305 |
| | | | | | |
Commercial Services — 6.1% | | | | | | |
ACE Cash Express, Inc., 12.00%, 12/15/22‡ | | | 1,706,000 | | | 1,769,975 |
Michael Baker International LLC, 8.75%, 03/01/23‡ | | | 1,462,000 | | | 1,418,140 |
Quad/Graphics, Inc., 7.00%, 05/01/22 | | | 1,543,000 | | | 1,604,720 |
StoneMor Partners LP/Cornerstone Family Services of West Virginia Subsidiary, 7.88%, 06/01/21(a) | | | 2,578,000 | | | 2,539,330 |
Weight Watchers International, Inc., 8.63%, 12/01/25‡ | | | 1,952,000 | | | 2,044,720 |
Total Commercial Services | | | | | | 9,376,885 |
| | | | |
CORPORATE BONDS (continued) | | | |
| | | |
Computers — 4.2% | | | | | | |
Everi Payments, Inc., 7.50%, 12/15/25‡ | | $ | 1,462,000 | | $ | 1,452,862 |
Exela Intermediate LLC/Exela Finance, Inc., 10.00%, 07/15/23‡ | | | 1,342,000 | | | 1,311,805 |
Harland Clarke Holdings Corp., 9.25%, 03/01/21‡ | | | 2,218,000 | | | 2,256,815 |
West Corp., 8.50%, 10/15/25‡(a) | | | 1,443,000 | | | 1,432,178 |
Total Computers | | | | | | 6,453,660 |
| | | | | | |
Diversified Financial Services — 1.5% | | | |
CNG Holdings, Inc., 9.38%, 05/15/20‡ | | | 2,442,000 | | | 2,380,950 |
| | | | | | |
Electrical Components & Equipment — 1.6% |
Artesyn Embedded Technologies, Inc., 9.75%, 10/15/20‡ | | | 2,517,000 | | | 2,485,537 |
| | | | | | |
Energy – Alternate Sources — 1.0% | | | |
Enviva Partners LP/Enviva Partners Finance Corp., 8.50%, 11/01/21 | | | 1,404,000 | | | 1,500,525 |
| | | | | | |
Food — 3.6% | | | | | | |
Bi-Lo LLC/Bi-Lo Finance Corp., 9.25%, 02/15/19‡(a) | | | 2,691,000 | | | 2,576,632 |
Pilgrim’s Pride Corp., 5.88%, 09/30/27‡ | | | 1,058,000 | | | 1,092,385 |
SUPERVALU, Inc., 6.75%, 06/01/21 | | | 1,826,000 | | | 1,828,283 |
Total Food | | | | | | 5,497,300 |
| | | | | | |
Healthcare – Products — 3.4% | | | |
Avantor, Inc., 9.00%, 10/01/25‡ | | | 1,445,000 | | | 1,426,937 |
Greatbatch Ltd., 9.13%, 11/01/23‡ | | | 1,429,000 | | | 1,554,038 |
Mallinckrodt International Finance SA/Mallinckrodt CB LLC, 5.63%, 10/15/23‡(a) | | | 2,595,000 | | | 2,218,725 |
Total Healthcare – Products | | | | | | 5,199,700 |
| | | | | | |
Healthcare – Services — 1.2% | | | | | | |
Kindred Healthcare, Inc., 8.75%, 01/15/23(a) | | | 1,686,000 | | | 1,795,590 |
See accompanying Notes to Financial Statements.
59
ADVISORSHARES PERITUS HIGH YIELD ETF
Schedule of Investments (continued)
December 31, 2017 (Unaudited)
| | | | |
CORPORATE BONDS (continued) | | | |
| | | |
Holding Companies – Diversified — 0.9% | | | |
Trident Merger Sub, Inc., 6.63%, 11/01/25‡ | | $ | 1,443,000 | | $ | 1,443,000 |
| | | | | | |
Home Builders — 0.9% | | | | | | |
Beazer Homes USA, Inc., 5.88%, 10/15/27‡ | | | 1,445,000 | | | 1,455,837 |
| | | | | | |
Machinery – Diversified — 2.2% | | | |
JPW Industries Holding Corp., 9.00%, 10/01/24‡ | | | 1,623,000 | | | 1,700,093 |
Xerium Technologies, Inc., 9.50%, 08/15/21 | | | 1,596,000 | | | 1,619,940 |
Total Machinery – Diversified | | | | | | 3,320,033 |
| | | | | | |
Media — 2.4% | | | | | | |
Lee Enterprises, Inc., 9.50%, 03/15/22‡ | | | 1,989,000 | | | 2,068,560 |
Time, Inc., 7.50%, 10/15/25‡(a) | | | 1,445,000 | | | 1,708,713 |
Total Media | | | | | | 3,777,273 |
| | | | | | |
Mining — 1.0% | | | | | | |
Northwest Acquisitions ULC/Dominion Finco, Inc., 7.13%, 11/01/22‡ | | | 1,445,000 | | | 1,495,575 |
| | | | | | |
Miscellaneous Manufacturing — 2.0% | | | |
FXI Holdings, Inc., 7.88%, 11/01/24‡ | | | 1,706,000 | | | 1,706,512 |
Techniplas LLC, 10.00%, 05/01/20‡ | | | 1,641,000 | | | 1,353,825 |
Total Miscellaneous Manufacturing | | | | | | 3,060,337 |
| | | | | | |
Oil & Gas — 6.4% | | | | | | |
Calumet Specialty Products Partners LP/Calumet
Finance Corp., 11.50%, 01/15/21‡ | | | 1,374,000 | | | 1,562,925 |
Gulfport Energy Corp., 6.38%, 01/15/26‡ | | | 1,445,000 | | | 1,452,225 |
Jonah Energy LLC/Jonah Energy Finance Corp., 7.25%, 10/15/25‡ | | | 1,686,000 | | | 1,700,752 |
Par Petroleum LLC/Petroleum Finance Corp., 7.75%, 12/15/25‡ | | | 1,706,000 | | | 1,708,133 |
Sanchez Energy Corp., 7.75%, 06/15/21 | | | 1,501,000 | | | 1,418,445 |
SRC Energy, Inc., 6.25%, 12/01/25‡ | | | 488,000 | | | 501,420 |
| | | | |
CORPORATE BONDS (continued) | | | |
| | | | | | |
Oil & Gas (continued) | | | | | | |
Whiting Petroleum Corp., 6.63%, 01/15/26‡ | | $ | 1,464,000 | | $ | 1,495,110 |
Total Oil & Gas | | | | | | 9,839,010 |
| | | | | | |
Packaging & Containers — 1.0% | | | |
Plastipak Holdings, Inc., 6.25%, 10/15/25‡ | | | 1,445,000 | | | 1,484,738 |
| | | | | | |
Pharmaceuticals — 3.6% | | | | | | |
Horizon Pharma, Inc./Horizon Pharma USA, Inc., 8.75%, 11/01/24‡ | | | 2,486,000 | | | 2,638,268 |
Valeant Pharmaceuticals International, Inc., 5.50%, 11/01/25‡ | | | 1,058,000 | | | 1,081,805 |
Valeant Pharmaceuticals International, Inc., 9.00%, 12/15/25‡ | | | 1,706,000 | | | 1,782,258 |
Total Pharmaceuticals | | | | | | 5,502,331 |
| | | | | | |
Pipelines — 4.0% | | | | | | |
Crestwood Midstream Partners LP/Crestwood Midstream Finance Corp., 6.25%, 04/01/23 | | | 1,374,000 | | | 1,434,731 |
Genesis Energy LP/Genesis Energy Finance Corp., 6.25%, 05/15/26 | | | 1,706,000 | | | 1,703,867 |
Martin Midstream Partners LP/Martin Midstream Finance Corp., 7.25%, 02/15/21 | | | 1,502,000 | | | 1,524,530 |
SemGroup Corp., 7.25%, 03/15/26‡ | | | 1,392,000 | | | 1,430,280 |
Total Pipelines | | | | | | 6,093,408 |
| | | | | | |
Retail — 4.4% | | | | | | |
Ferrellgas Partners LP/Ferrellgas Partners Finance Corp., 8.63%, 06/15/20(a) | | | 2,382,000 | | | 2,042,565 |
Golden Nugget, Inc., 8.75%, 10/01/25‡ | | | 1,624,000 | | | 1,709,260 |
Guitar Center, Inc., 6.50%, 04/15/19‡(a) | | | 1,683,000 | | | 1,565,190 |
Nathan’s Famous, Inc., 6.63%, 11/01/25‡ | | | 1,443,000 | | | 1,504,327 |
Total Retail | | | | | | 6,821,342 |
See accompanying Notes to Financial Statements.
60
ADVISORSHARES PERITUS HIGH YIELD ETF
Schedule of Investments (continued)
December 31, 2017 (Unaudited)
| | | | |
CORPORATE BONDS (continued) | | | |
| | | | | | |
Software — 1.1% | | | | | | |
CURO Financial Technologies Corp., 12.00%, 03/01/22‡(a) | | $ | 1,544,000 | | $ | 1,706,120 |
| | | | | | |
Telecommunications — 3.9% | | | | | | |
Frontier Communications Corp., 11.00%, 09/15/25 | | | 2,557,000 | | | 1,892,180 |
Gogo Intermediate Holdings LLC/Gogo Finance Co., Inc., 12.50%, 07/01/22‡ | | | 1,238,000 | | | 1,400,488 |
Windstream Services LLC/Windstream Finance Corp., 8.63%, 10/31/25‡(a) | | | 2,862,000 | | | 2,768,985 |
Total Telecommunications | | | | | | 6,061,653 |
| | | | | | |
Toys/Games/Hobbies — 0.1% | | | |
Mattel, Inc., 6.75%, 12/31/25‡ | | | 94,000 | | | 95,499 |
Total Corporate Bonds | | | | | | |
(Cost $102,869,274) | | | | | | 103,855,777 |
| | | | | | |
TERM LOANS — 19.2% | | | | | | |
| | | | | | |
Coal — 2.5% | | | | | | |
Foresight Energy LLC, 7.44%, (3-Month USD LIBOR + 5.75%), 03/16/22@ | | | 1,985,000 | | | 1,867,557 |
Murray Energy Corp., 9.44%, (3-Month USD LIBOR + 7.75%), 04/16/20@ | | | 2,227,453 | | | 1,979,092 |
Total Coal | | | | | | 3,846,649 |
| | | | | | |
Commercial Services — 1.8% | | | | | | |
Jackson Hewitt Tax
Service, Inc., 8.38%, (3-Month USD LIBOR + 7.00%), 07/24/20@ | | | 2,830,849 | | | 2,806,079 |
| | | | | | |
Electronics — 1.3% | | | | | | |
KEMET Corp., 7.57%, (1-Month USD LIBOR + 6.00%), 04/26/24@ | | | 1,950,000 | | | 1,971,938 |
| | | | | | |
Food — 2.9% | | | | | | |
Flavors Holdings, Inc., 7.44%, (3-Month USD LIBOR + 5.75%), 04/03/20@ | | | 2,392,842 | | | 2,219,361 |
| | | | |
TERM LOANS (continued) | | | | | | |
| | | | | | |
Food (continued) | | | | | | |
Shearer’s Foods LLC, 8.44%, (3-Month USD LIBOR + 6.75%), 06/30/22@ | | $ | 2,431,000 | | $ | 2,279,063 |
Total Food | | | | | | 4,498,424 |
| | | | | | |
Forest Products & Paper — 2.2% | | | |
Appvion, Inc., 8.05%, (1-Month USD LIBOR + 6.50%), 07/02/18@ | | | 2,019,025 | | | 2,022,397 |
Verso Paper Holdings LLC, 12.47%, (1-Month USD LIBOR + 11.00%), 10/14/21@ | | | 1,313,027 | | | 1,350,225 |
Total Forest Products & Paper | | | | | | 3,372,622 |
| | | | | | |
Office/Business Equipment — 1.1% | | | |
Eastmen Kodak Co., 7.82%, (3-Month USD LIBOR + 6.25%), 09/03/19@ | | | 1,964,899 | | | 1,704,550 |
| | | | | | |
Oil & Gas — 2.1% | | | | | | |
Osum Production Corp., 7.19%, (3-Month USD LIBOR + 5.50%), 07/31/20@ | | | 3,813,400 | | | 3,241,390 |
| | | | | | |
Retail — 2.4% | | | | | | |
California Pizza Kitchen, Inc., 7.57%, (1-Month USD LIBOR + 6.00%), 08/23/22@ | | | 1,994,949 | | | 1,960,038 |
General Nutrition Centers, Inc., 03/04/19(b) | | | 2,000,000 | | | 1,660,000 |
Total Retail | | | | | | 3,620,038 |
| | | | | | |
Telecommunications — 1.6% | | | | | | |
Global Tel*Link Corp., 9.08%, (3-Month USD LIBOR + 8.25%), 11/20/20@ | | | 2,375,000 | | | 2,380,201 |
| | | | | | |
Transportation — 1.3% | | | | | | |
YRC Worldwide, Inc., 10.07%, (1-Month USD LIBOR + 8.50%), 07/21/22@ | | | 2,070,465 | | | 2,067,317 |
Total Term Loans | | | | | | |
(Cost $30,651,217) | | | | | | 29,509,208 |
See accompanying Notes to Financial Statements.
61
ADVISORSHARES PERITUS HIGH YIELD ETF
Schedule of Investments (continued)
December 31, 2017 (Unaudited)
| | | | |
FOREIGN BONDS — 11.6% | | | | | | |
| | | | | | |
Beverages — 1.1% | | | | | | |
CEDC Finance Corp. International, Inc., 10.00%, 12/31/22 (Poland)‡ | | $ | 1,933,132 | | $ | 1,739,819 |
| | | | | | |
Diversified Financial Services — 2.3% | | | |
Cooke Omega Investments, Inc./Alpha VesselCo Holdings, Inc., 8.50%, 12/15/22 (Canada)‡ | | | 1,706,000 | | | 1,701,735 |
goeasy Ltd., 7.88%, 11/01/22 (Canada)‡ | | | 1,706,000 | | | 1,784,902 |
Total Diversified Financial Services | | | | | | 3,486,637 |
| | | | | | |
Food — 1.2% | | | | | | |
JBS USA LUX SA/JBS USA Finance, Inc., 8.25%, 02/01/20 (Brazil)‡ | | | 1,797,000 | | | 1,806,884 |
| | | | | | |
Home Builders — 0.8% | | | | | | |
Mattamy Group Corp., 6.50%, 10/01/25 (Canada)‡ | | | 1,202,000 | | | 1,277,125 |
| | | | | | |
Mining — 1.1% | | | | | | |
IAMGOLD Corp., 7.00%, 04/15/25 (Canada)‡ | | | 1,619,000 | | | 1,675,665 |
| | | | | | |
Oil & Gas — 2.5% | | | | | | |
Athabasca Oil Corp., 9.88%, 02/24/22 (Canada)‡ | | | 1,952,000 | | | 1,903,200 |
Precision Drilling Corp., 7.75%, 12/15/23
(Canada)(a) | | | 1,797,000 | | | 1,895,835 |
Total Oil & Gas | | | | | | 3,799,035 |
| | | | | | |
Oil & Gas Services — 1.3% | | | | | | |
Welltec A/S, 9.50%, 12/01/22 (Denmark)‡ | | | 2,000,000 | | | 2,020,000 |
| | | | | | |
Transportation — 1.3% | | | | | | |
Global Ship Lease, Inc., 9.88%, 11/15/22 (United Kingdom)‡ | | | 2,000,000 | | | 2,072,500 |
Total Foreign Bonds | | | | | | |
(Cost $17,594,382) | | | | | | 17,877,665 |
| | | | |
MONEY MARKET FUNDS — 2.6% | | | |
| | | | | | |
BlackRock Liquidity Funds FedFund Portfolio, Institutional Class,
1.17%(c)(d) | | | 776,000 | | $ | 776,000 |
JPMorgan U.S. Government Money Market Fund – Institutional Class, 1.14%(c) | | | 1,756,630 | | | 1,756,630 |
Morgan Stanley Institutional Liquidity Funds – Government Portfolio, Institutional Class,
1.20%(c)(d) | | | 757,000 | | | 757,000 |
Invesco STIT – Government & Agency Portfolio, Institutional Class, 1.18%(c)(d) | | | 781,000 | | | 781,000 |
Total Money Market Funds | | | | | | |
(Cost $4,070,630) | | | | | | 4,070,630 |
| | | | | | |
REPURCHASE AGREEMENTS — 9.8%(d) | | | |
Citigroup Global Markets, Inc., dated 12/29/17, due 01/02/18, 1.41%, total to be received $4,042,380, (collateralized by various U.S. Government Agency Obligations, 0.00% – 9.00%, 04/01/18 – 08/20/67, totaling $4,109,949) | | $ | 4,041,905 | | | 4,041,905 |
Daiwa Capital Markets America, dated 12/29/17, due 01/02/18, 1.43%, total to be received $4,042,387, (collateralized by various U.S. Government Agency Obligations, 0.00% – 6.50%, 01/11/18 – 12/01/51, totaling $4,112,284) | | | 4,041,905 | | | 4,041,905 |
HSBC Securities USA, Inc., dated 12/29/17, due 01/02/18, 1.36%, total to be received $2,925,796, (collateralized by various U.S. Government Agency Obligations, 0.00% – 9.13%, 12/31/17 – 05/15/47, totaling $2,969,944) | | | 2,925,464 | | | 2,925,464 |
See accompanying Notes to Financial Statements.
62
ADVISORSHARES PERITUS HIGH YIELD ETF
Schedule of Investments (continued)
December 31, 2017 (Unaudited)
| | | | |
REPURCHASE AGREEMENTS (continued) | | | | |
| | | | | | | |
RBC Dominion Securities, Inc., dated 12/29/17, due 01/02/18, 1.40%, total to be received $4,042,377, (collateralized by various U.S. Government Agency Obligations, 1.88% – 8.88%, 02/15/19 – 12/20/47, totaling $4,109,976) | | $ | 4,041,905 | | $ | 4,041,905 | |
Total Repurchase Agreements | | | | |
(Cost $15,051,179) | | | | | | 15,051,179 | |
| | | | | | | |
Total Investments — 110.7% | | | | | | | |
(Cost $170,236,682) | | | | | | 170,364,459 | |
| | | | | | | |
Liabilities in Excess of Other Assets — (10.7%) | | | | | | (16,522,472 | ) |
Net Assets — 100.0% | | | | | $ | 153,841,987 | |
SUMMARY OF SCHEDULE OF INVESTMENTS
| | |
Aerospace/Defense | | 2.0 | % |
Agriculture | | 1.0 | |
Auto Manufacturers | | 1.2 | |
Auto Parts & Equipment | | 1.1 | |
Banks | | 1.1 | |
Beverages | | 1.1 | |
Biotechnology | | 1.6 | |
Chemicals | | 3.0 | |
Coal | | 2.5 | |
Commercial Services | | 7.9 | |
Computers | | 4.2 | |
Diversified Financial Services | | 3.8 | |
Electrical Components & Equipment | | 1.6 | |
Electronics | | 1.3 | |
Energy – Alternate Sources | | 1.0 | |
Food | | 7.7 | |
Forest Products & Paper | | 2.2 | |
Healthcare – Products | | 3.4 | |
Healthcare – Services | | 1.2 | |
Holding Companies – Diversified | | 0.9 | |
Home Builders | | 1.7 | |
Machinery – Diversified | | 2.2 | |
Media | | 2.4 | |
Mining | | 2.1 | |
Miscellaneous Manufacturing | | 2.0 | |
Office/Business Equipment | | 1.1 | |
Oil & Gas | | 11.0 | |
Oil & Gas Services | | 1.3 | |
Packaging & Containers | | 1.0 | |
Pharmaceuticals | | 3.6 | |
Pipelines | | 4.0 | |
Retail | | 6.8 | |
Software | | 1.1 | |
Telecommunications | | 5.5 | |
Toys/Games/Hobbies | | 0.1 | |
Transportation | | 2.6 | |
Money Market Funds | | 2.6 | |
Repurchase Agreements | | 9.8 | |
Total Investments | | 110.7 | |
Liabilities in Excess of Other Assets | | (10.7 | ) |
Net Assets | | 100.0 | % |
See accompanying Notes to Financial Statements.
63
ADVISORSHARES RANGER EQUITY BEAR ETF
Schedule of Investments
December 31, 2017 (Unaudited)
| | | | |
EXCHANGE TRADED FUND — 44.4% | | | | |
| | | | | | | |
Debt Fund — 44.4% | | | | | | | |
AdvisorShares Sage Core Reserves ETF† | | | | | | | |
(Cost $67,115,250) | | 675,000 | | | $ | 67,041,000 | |
| | | | | | | |
MONEY MARKET FUNDS — 2.3% | | | | |
Fidelity Institutional Money Market Government Portfolio – Class III, 0.89%(a) | | 2,936,256 | | | | 2,936,256 | |
Morgan Stanley Institutional Liquidity Funds – Government Portfolio, 1.19%(a) | | 500,000 | | | | 500,000 | |
Total Money Market Funds | | | | | | | |
(Cost $3,436,256) | | | | | | 3,436,256 | |
Total Investments Before Securities Sold, Not Yet Purchased
(Cost $70,551,506) | | | | | | 70,477,256 | |
| | | | | | | |
Securities Sold, Not Yet Purchased — (93.8)% |
| | | | | | | |
COMMON STOCKS — (93.8)% | | | | |
| | | | | | | |
Aerospace/Defense — (4.5)% | | | | | | | |
Aerojet Rocketdyne Holdings, Inc.* | | (50,000 | ) | | | (1,560,000 | ) |
Triumph Group, Inc. | | (195,000 | ) | | | (5,304,000 | ) |
Total Aerospace/Defense | | | | | | (6,864,000 | ) |
| | | | | | | |
Apparel — (5.3)% | | | | | | | |
Hanesbrands, Inc. | | (190,000 | ) | | | (3,972,900 | ) |
NIKE, Inc., Class B | | (65,000 | ) | | | (4,065,750 | ) |
Total Apparel | | | | | | (8,038,650 | ) |
| | | | | | | |
Auto Parts & Equipment — (3.5)% | | | | |
Cooper Tire & Rubber Co. | | (149,100 | ) | | | (5,270,685 | ) |
| | | | | | | |
Building Materials — (1.9)% | | | | | | | |
Martin Marietta Materials, Inc. | | (13,000 | ) | | | (2,873,520 | ) |
| | | | | | | |
Chemicals — (2.9)% | | | | | | | |
Sensient Technologies Corp. | | (60,000 | ) | | | (4,389,000 | ) |
| | | | | | | |
Commercial Services — (2.0)% | | | | |
Sabre Corp. | | (150,000 | ) | | | (3,075,000 | ) |
| | | | | | | |
Computers — (2.9)% | | | | | | | |
NetScout Systems, Inc.* | | (143,000 | ) | | | (4,354,350 | ) |
| | | | |
COMMON STOCKS (continued) | | | | |
| | | | | | | |
Cosmetics/Personal Care — (1.2)% | | | | |
Edgewell Personal Care Co.* | | (30,000 | ) | | $ | (1,781,700 | ) |
| | | | | | | |
Diversified Financial Services — (3.8)% | | | | |
Alliance Data Systems Corp. | | (15,000 | ) | | | (3,802,200 | ) |
Credit Acceptance Corp.* | | (5,800 | ) | | | (1,876,184 | ) |
Total Diversified Financial Services | | | | | | (5,678,384 | ) |
| | | | | | | |
Electrical Components & Equipment — (4.1)% |
Energizer Holdings, Inc. | | (129,500 | ) | | | (6,213,410 | ) |
| | | | | | | |
Electronics — (1.7)% | | | | | | | |
Jabil, Inc. | | (100,000 | ) | | | (2,625,000 | ) |
| | | | | | | |
Engineering & Construction — (2.4)% | | | | |
KBR, Inc. | | (180,000 | ) | | | (3,569,400 | ) |
| | | | | | | |
Food — (5.8)% | | | | | | | |
Kellogg Co. | | (92,000 | ) | | | (6,254,160 | ) |
TreeHouse Foods, Inc.* | | (50,000 | ) | | | (2,473,000 | ) |
Total Food | | | | | | (8,727,160 | ) |
| | | | | | | |
Hand/Machine Tools — (4.3)% | | | | |
Snap-on, Inc. | | (36,900 | ) | | | (6,431,670 | ) |
| | | | | | | |
Healthcare – Products — (5.6)% | | | | |
DENTSPLY SIRONA, Inc. | | (60,000 | ) | | | (3,949,800 | ) |
Patterson Cos., Inc. | | (125,000 | ) | | | (4,516,250 | ) |
Total Healthcare – Products | | | | | | (8,466,050 | ) |
| | | | | | | |
Healthcare – Services — (1.5)% | | | | |
Select Medical Holdings Corp.* | | (125,000 | ) | | | (2,206,250 | ) |
| | | | | | | |
Household Products/Wares — (3.0)% | | | | |
Spectrum Brands Holdings, Inc. | | (40,000 | ) | | | (4,496,000 | ) |
| | | | | | | |
Internet — (3.3)% | | | | | | | |
Alibaba Group Holding Ltd. (China)*(b) | | (13,500 | ) | | | (2,327,805 | ) |
Netflix, Inc.* | | (13,500 | ) | | | (2,591,460 | ) |
Total Internet | | | | | | (4,919,265 | ) |
| | | | | | | |
Leisure Time — (4.0)% | | | | | | | |
Harley-Davidson, Inc. | | (120,000 | ) | | | (6,105,600 | ) |
See accompanying Notes to Financial Statements.
64
ADVISORSHARES RANGER EQUITY BEAR ETF
Schedule of Investments (continued)
December 31, 2017 (Unaudited)
| | | | |
COMMON STOCKS (continued) | | | | |
| | | | | | | |
Media — (2.5)% | | | | | | | |
Houghton Mifflin Harcourt Co.* | | (400,000 | ) | | $ | (3,720,000 | ) |
| | | | | | | |
Pharmaceuticals — (3.1)% | | | | | | | |
Prestige Brands Holdings, Inc.* | | (107,185 | ) | | | (4,760,086 | ) |
| | | | | | | |
REITS — (8.9)% | | | | | | | |
Macerich Co. (The) | | (83,000 | ) | | | (5,451,440 | ) |
Simon Property Group, Inc. | | (27,000 | ) | | | (4,636,980 | ) |
Taubman Centers, Inc. | | (50,000 | ) | | | (3,271,500 | ) |
Total REITS | | | | | | (13,359,920 | ) |
| | | | | | | |
Retail — (3.2)% | | | | | | | |
Genuine Parts Co. | | (51,000 | ) | | | (4,845,510 | ) |
| | | | | | | |
Software — (5.1)% | | | | | | | |
Akamai Technologies, Inc.* | | (25,000 | ) | | | (1,626,000 | ) |
Medidata Solutions, Inc.* | | (45,000 | ) | | | (2,851,650 | ) |
Pegasystems, Inc. | | (70,000 | ) | | | (3,300,500 | ) |
Total Software | | | | | | (7,778,150 | ) |
| | | | | | | |
Telecommunications — (7.3)% | | | | |
Ciena Corp.* | | (205,000 | ) | | | (4,290,650 | ) |
NETGEAR, Inc.* | | (65,000 | ) | | | (3,818,750 | ) |
Ubiquiti Networks, Inc.* | | (40,000 | ) | | | (2,840,800 | ) |
Total Telecommunications | | | | | | (10,950,200 | ) |
Total Securities Sold, Not Yet Purchased [Proceeds Received $(137,944,337)] | | | | | | (141,498,960 | ) |
| | | | | | | |
Total Investments — (47.1)% | | | | | | | |
(Cost $(67,392,831)) | | | | | | (71,021,704 | ) |
| | | | | | | |
Other Assets in Excess of Liabilities — 147.1% | | | | | | 221,847,180 | |
Net Assets — 100.0% | | | | | $ | 150,825,476 | |
Cash of $143,981,174 has been segregated to cover margin requirement for open short sales as of December 31, 2017.
SUMMARY OF SCHEDULE OF INVESTMENTS
| | |
Aerospace/Defense | | (4.5 | )% |
Apparel | | (5.3 | ) |
Auto Parts & Equipment | | (3.5 | ) |
Building Materials | | (1.9 | ) |
Chemicals | | (2.9 | ) |
Commercial Services | | (2.0 | ) |
Computers | | (2.9 | ) |
Cosmetics/Personal Care | | (1.2 | ) |
Debt Fund | | 44.4 | |
Diversified Financial Services | | (3.8 | ) |
Electrical Components & Equipment | | (4.1 | ) |
Electronics | | (1.7 | ) |
Engineering & Construction | | (2.4 | ) |
Food | | (5.8 | ) |
Hand/Machine Tools | | (4.3 | ) |
Healthcare – Products | | (5.6 | ) |
Healthcare – Services | | (1.5 | ) |
Household Products/Wares | | (3.0 | ) |
Internet | | (3.3 | ) |
Leisure Time | | (4.0 | ) |
Media | | (2.5 | ) |
Pharmaceuticals | | (3.1 | ) |
REITS | | (8.9 | ) |
Retail | | (3.2 | ) |
Software | | (5.1 | ) |
Telecommunications | | (7.3 | ) |
Money Market Funds | | 2.3 | |
Total Investments | | (47.1 | ) |
Other Assets in Excess of Liabilities | | 147.1 | |
Net Assets | | 100.0 | % |
See accompanying Notes to Financial Statements.
65
ADVISORSHARES SAGE CORE RESERVES ETF
Schedule of Investments
December 31, 2017 (Unaudited)
| | | | |
CORPORATE BONDS — 49.3% | | | |
| | | | | | |
Aerospace/Defense — 1.1% | | | | | | |
Northrop Grumman Corp., 1.75%, 06/01/18 | | $ | 844,000 | | $ | 843,509 |
| | | | | | |
Auto Manufacturers — 2.3% | | | | | | |
Ford Motor Credit Co. LLC, 2.24%, 06/15/18 | | | 845,000 | | | 845,893 |
General Motors Co.,
3.50%, 10/02/18 | | | 825,000 | | | 833,736 |
Total Auto Manufacturers | | | | | | 1,679,629 |
| | | | | | |
Banks — 13.9% | | | | | | |
Bank of America Corp., Series L, 2.60%, 01/15/19 | | | 415,000 | | | 416,484 |
Bank of America Corp., Series L, 2.65%, 04/01/19 | | | 830,000 | | | 834,865 |
Bank of New York Mellon Corp. (The), Series G, 2.20%, 05/15/19 | | | 420,000 | | | 420,639 |
BB&T Corp., Series MTN, 2.25%, 02/01/19 | | | 630,000 | | | 631,177 |
Branch Banking & Trust Co., 1.81%, (3-Month USD LIBOR + 0.45%),
01/15/20@ | | | 475,000 | | | 477,099 |
Branch Banking & Trust Co., 1.74%, (3-Month USD LIBOR + 0.22%),
06/01/20@ | | | 400,000 | | | 399,111 |
Capital One Financial Corp., 2.45%, 04/24/19 | | | 276,000 | | | 276,727 |
Capital One NA/McLean VA, Series BKNT, 2.53%, (3-Month USD LIBOR + 1.15%), 01/30/23@ | | | 670,000 | | | 674,218 |
Citigroup, Inc.,
1.80%, 02/05/18 | | | 840,000 | | | 839,931 |
Citigroup, Inc.,
2.05%, 06/07/19 | | | 420,000 | | | 418,928 |
Goldman Sachs Group, Inc. (The), 5.95%, 01/18/18 | | | 415,000 | | | 415,659 |
Goldman Sachs Group, Inc. (The), Series FRN, 3.23%, (3-Month USD LIBOR + 1.77%), 02/25/21@ | | | 1,065,000 | | | 1,102,812 |
JPMorgan Chase & Co., 2.35%, 01/28/19 | | | 590,000 | | | 591,253 |
JPMorgan Chase & Co., 2.96%, (3-Month USD LIBOR + 1.48%),
03/01/21@ | | | 630,000 | | | 649,900 |
| | | | |
CORPORATE BONDS (continued) | | |
| | | | |
Banks (continued) | | | | |
US Bancorp, Series MTN, 2.00%, (3-Month USD LIBOR + 0.64%), 01/24/22@ | | $ 1,125,000 | | $ 1,135,057 |
Wells Fargo & Co.,
2.13%, 04/22/19 | | 1,100,000 | | 1,100,038 |
Total Banks | | | | 10,383,898 |
| | | | |
Biotechnology — 1.5% | | | | |
Amgen, Inc., 1.73%, (3-Month USD LIBOR + 0.32%), 05/10/19@ | | 705,000 | | 706,323 |
Gilead Sciences, Inc.,
1.85%, 09/20/19 | | 400,000 | | 398,438 |
Total Biotechnology | | | | 1,104,761 |
| | | | |
Building Materials — 0.6% | | | | |
Vulcan Materials Co., 2.19%, (3-Month USD LIBOR + 0.60%), 06/15/20@ | | 430,000 | | 430,458 |
| | | | |
Chemicals — 1.0% | | | | |
Dow Chemical Co. (The), 8.55%, 05/15/19 | | 680,000 | | 736,803 |
| | | | |
Computers — 1.2% | | | | |
Apple, Inc., 1.90%, (3-Month USD LIBOR + 0.50%), 02/09/22@ | | 870,000 | | 882,494 |
| | | | |
Diversified Financial Services — 4.5% | | |
Air Lease Corp.,
2.13%, 01/15/18 | | 420,000 | | 419,976 |
American Express Co.,
7.00%, 03/19/18 | | 400,000 | | 404,306 |
American Express Credit Corp., Series GMTN,
2.25%, 08/15/19 | | 420,000 | | 420,977 |
American Express Credit Corp., Series F, 2.62%, (3-Month USD LIBOR + 1.05%), 09/14/20@ | | 540,000 | | 549,840 |
International Lease Finance Corp., 3.88%, 04/15/18 | | 620,000 | | 622,883 |
International Lease Finance Corp., 5.88%, 04/01/19 | | 300,000 | | 312,334 |
Jefferies Group LLC,
5.13%, 04/13/18 | | 629,000 | | 634,201 |
Total Diversified Financial Services | | | | 3,364,517 |
| | | | |
See accompanying Notes to Financial Statements.
66
ADVISORSHARES SAGE CORE RESERVES ETF
Schedule of Investments (continued)
December 31, 2017 (Unaudited)
| | | | |
CORPORATE BONDS (continued) | | | |
| | | | | | |
Electric — 2.3% | | | | | | |
Dominion Energy, Inc.,
Series A, 1.88%, 01/15/19 | | $ | 180,000 | | $ | 179,506 |
PG&E Corp., 2.40%, 03/01/19 | | | 755,000 | | | 755,649 |
Southern Co. (The),
2.45%, 09/01/18 | | | 805,000 | | | 807,472 |
Total Electric | | | | | | 1,742,627 |
| | | | | | |
Food — 0.8% | | | | | | |
Tyson Foods, Inc., 2.04%, (3-Month USD LIBOR + 0.55%), 06/02/20@ | | | 590,000 | | | 593,441 |
| | | | | | |
Healthcare – Products — 1.1% | | | |
Abbott Laboratories,
2.35%, 11/22/19 | | | 834,000 | | | 835,290 |
| | | | | | |
Healthcare – Services — 0.5% | | | | | | |
Catholic Health Initiatives, 2.60%, 08/01/18 | | | 340,000 | | | 341,130 |
| | | | | | |
Internet — 1.1% | | | | | | |
eBay, Inc., 2.50%, 03/09/18 | | | 835,000 | | | 835,816 |
| | | | | | |
Machinery – Diversified — 1.4% | | | |
John Deere Capital Corp., Series MTN, 5.75%, 09/10/18 | | | 270,000 | | | 277,140 |
Roper Technologies, Inc., 2.05%, 10/01/18 | | | 755,000 | | | 755,059 |
Total Machinery – Diversified | | | | | | 1,032,199 |
| | | | | | |
Media — 1.1% | | | | | | |
Time Warner Cable, Inc., 6.75%, 07/01/18 | | | 785,000 | | | 802,498 |
| | | | | | |
Pharmaceuticals — 4.1% | | | | | | |
AbbVie, Inc.,
1.80%, 05/14/18 | | | 965,000 | | | 964,615 |
Allergan Funding SCS,
2.35%, 03/12/18 | | | 490,000 | | | 490,412 |
Allergan Funding SCS, 2.80%, (3-Month USD LIBOR + 1.26%), 03/12/20@ | | | 855,000 | | | 867,653 |
Express Scripts Holding Co., 2.25%, 06/15/19 | | | 745,000 | | | 744,060 |
Total Pharmaceuticals | | | | | | 3,066,740 |
| | | | | | |
Pipelines — 3.1% | | | | | | |
Buckeye Partners LP, 2.65%, 11/15/18 | | | 555,000 | | | 556,712 |
| | | | |
CORPORATE BONDS (continued) | | | |
| | | | | | |
Pipelines (continued) | | | | | | |
Enbridge Energy Partners LP, Series B, 6.50%, 04/15/18 | | $ | 400,000 | | $ | 405,329 |
Energy Transfer LP, 2.50%, 06/15/18 | | | 780,000 | | | 781,250 |
Midcontinent Express Pipeline LLC, 6.70%, 09/15/19‡ | | | 537,000 | | | 561,568 |
Total Pipelines | | | | | | 2,304,859 |
| | | | | | |
REITS — 2.7% | | | | | | |
ERP Operating LP, 2.38%, 07/01/19 | | | 740,000 | | | 742,015 |
Realty Income Corp., 2.00%, 01/31/18 | | | 260,000 | | | 259,981 |
Ventas Realty LP/Ventas Capital Corp., 2.00%, 02/15/18 | | | 845,000 | | | 844,977 |
Welltower, Inc., 2.25%, 03/15/18 | | | 155,000 | | | 155,068 |
Total REITS | | | | | | 2,002,041 |
| | | | | | |
Retail — 1.8% | | | | | | |
CVS Health Corp., 1.90%, 07/20/18 | | | 840,000 | | | 839,860 |
Target Corp., 6.00%, 01/15/18 | | | 525,000 | | | 525,670 |
Total Retail | | | | | | 1,365,530 |
| | | | | | |
Telecommunications — 2.4% | | | | | | |
AT&T, Inc., 5.50%, 02/01/18 | | | 810,000 | | | 812,336 |
AT&T, Inc., 2.62%, (3-Month USD LIBOR + 0.93%), 06/30/20@(a) | | | 350,000 | | | 354,305 |
AT&T, Inc., 2.30%, (3-Month USD LIBOR + 0.89%), 02/14/23@ | | | 600,000 | | | 605,111 |
Total Telecommunications | | | | | | 1,771,752 |
| | | | | | |
Toys/Games/Hobbies — 0.5% | | | |
Mattel, Inc., 2.35%, 05/06/19 | | | 385,000 | | | 382,066 |
| | | | | | |
Transportation — 0.3% | | | | | | |
Burlington Northern Santa Fe LLC, 5.75%, 03/15/18 | | | 220,000 | | | 221,660 |
| | | | | | |
Total Corporate Bonds | | | | | | |
(Cost $36,679,522) | | | | | | 36,723,718 |
| | | | | | |
ASSET BACKED SECURITIES — 25.4% | | | |
| | | | | | |
Diversified Financial Services — 25.4% | | | |
Ally Master Owner Trust, Class A, Series 2015-3, 1.63%, 05/15/20 | | | 325,000 | | | 324,793 |
See accompanying Notes to Financial Statements.
67
ADVISORSHARES SAGE CORE RESERVES ETF
Schedule of Investments (continued)
December 31, 2017 (Unaudited)
| | | | |
ASSET BACKED SECURITIES (continued) | | | |
| | | |
Diversified Financial Services (continued) | | | |
American Express Credit Account Master Trust,
Class A, Series 2013-2, 1.90%, (1-Month USD LIBOR + 0.42%), 05/17/21@ | | $ | 1,520,000 | | $ | 1,524,226 |
American Express Credit Account Master Trust, Class A, Series 2014-1, 1.85%, (1-Month USD LIBOR + 0.37%), 12/15/21@ | | | 400,000 | | | 401,567 |
BA Credit Card Trust, Class A, Series 2015-A2, 1.36%, 09/15/20 | | | 745,000 | | | 744,217 |
Cabela’s Credit Card Master Note Trust, Class A2, Series 2015-1A, 2.02%, (1-Month USD LIBOR + 0.54%), 03/15/23@ | | | 285,000 | | | 287,215 |
Capital One Multi-Asset Execution Trust, Class A3, Series 2014-A3, 1.86%, (1-Month USD LIBOR + 0.38%), 01/18/22@ | | | 400,000 | | | 401,370 |
Capital One Multi-Asset Execution Trust, Class A3, Series 2016-A3, 1.34%, 04/15/22 | | | 1,090,000 | | | 1,079,133 |
CarMax Auto Owner Trust, Class A3, Series 2016-3, 1.39%, 05/17/21 | | | 900,000 | | | 893,454 |
CarMax Auto Owner Trust, Class C, Series 2014-1, 1.93%, 11/15/19 | | | 500,000 | | | 499,930 |
Chase Issuance Trust,
Class A, Series 2016-A2, 1.37%, 06/15/21 | | | 755,000 | | | 747,895 |
Chase Issuance Trust, Class A, Series 2017-A1, 1.78%, (1-Month USD LIBOR + 0.30%), 01/18/22@ | | | 900,000 | | | 904,328 |
Chase Issuance Trust, Class A5, Series 2015-A5, 1.36%, 04/15/20 | | | 240,000 | | | 239,748 |
Citibank Credit Card Issuance Trust, Class A2, Series
2017-A2, 1.74%, 01/19/21 | | | 640,000 | | | 638,646 |
Citibank Credit Card Issuance Trust, Class A6, Series
2014-A6, 2.15%, 07/15/21 | | | 500,000 | | | 500,633 |
| | | | |
ASSET BACKED SECURITIES (continued) | | | |
| | | |
Diversified Financial Services (continued) | | | |
Citibank Credit Card Issuance Trust, Class A8, Series
2014-A8, 1.73%, 04/09/20 | | $ | 375,000 | | $ | 375,010 |
Discover Card Execution Note Trust, Class A1, Series
2013-A1, 1.78%, (1-Month USD LIBOR + 0.30%), 08/17/20@ | | | 635,000 | | | 635,222 |
Discover Card Execution Note Trust, Class A6, Series
2013-A6, 1.93%, (1-Month USD LIBOR + 0.45%), 04/15/21@ | | | 840,000 | | | 842,730 |
Ford Credit Auto Owner Trust, Class A3, Series 2016-A, 1.39%, 07/15/20 | | | 303,954 | | | 302,990 |
Ford Credit Auto Owner Trust, Class C, Series 2014-A, 1.90%, 09/15/19 | | | 545,000 | | | 545,143 |
Ford Credit Floorplan Master Owner Trust A, Class A1, Series 2015-4, 1.77%, 08/15/20 | | | 375,000 | | | 374,816 |
Honda Auto Receivables Owner Trust, Class A3, Series 2015-1, 1.05%, 10/15/18 | | | 88,682 | | | 88,649 |
Honda Auto Receivables Owner Trust, Class A3, Series 2016-1, 1.22%, 12/18/19 | | | 446,576 | | | 444,955 |
Honda Auto Receivables Owner Trust, Class A3, Series 2016-4, 1.21%, 12/18/20 | | | 680,000 | | | 673,311 |
Hyundai Auto Receivables Trust, Class A2A, Series 2017-B, 1.57%, 08/17/20 | | | 224,000 | | | 223,383 |
Hyundai Auto Receivables Trust, Class A3, Series
2015-B, 1.12%, 11/15/19 | | | 532,218 | | | 530,859 |
Hyundai Auto Receivables Trust, Class C, Series
2014-A, 2.02%, 08/15/19 | | | 745,000 | | | 745,242 |
Nissan Auto Receivables Owner Trust, Class A3, Series
2015-A, 1.05%, 10/15/19 | | | 352,223 | | | 351,542 |
Nissan Auto Receivables Owner Trust, Class A3, Series
2015-B, 1.34%, 03/16/20 | | | 510,377 | | | 509,005 |
See accompanying Notes to Financial Statements.
68
ADVISORSHARES SAGE CORE RESERVES ETF
Schedule of Investments (continued)
December 31, 2017 (Unaudited)
| | | | |
ASSET BACKED SECURITIES (continued) | | | |
| | | |
Diversified Financial Services (continued) | | | |
Nissan Auto Receivables Owner Trust, Class A3, Series
2016-C, 1.18%, 01/15/21 | | $ | 625,000 | | $ | 618,707 |
Synchrony Credit Card Master Note Trust, Class A, Series 2015-2, 1.60%, 04/15/21 | | | 400,000 | | | 399,763 |
Toyota Auto Receivables, Class A2A, Series 2016-C, 1.00%, 01/15/19 | | | 186,828 | | | 186,707 |
Toyota Auto Receivables Owner Trust, Class A3, Series 2016-D, 1.23%, 10/15/20 | | | 850,000 | | | 842,764 |
Verizon Owner Trust, Class A, Series 2016-1A, 1.42%, 01/20/21‡ | | | 765,000 | | | 760,932 |
Wells Fargo Dealer Floorplan Master Note Trust, Class A, Series 2015-1, 2.00%, (1-Month USD LIBOR + 0.50%), 01/20/20@ | | | 265,000 | | | 265,065 |
Total Asset Backed Securities | | | | | | |
(Cost $18,929,074) | | | | | | 18,903,950 |
| | | | | | |
FOREIGN BONDS — 9.9% | | | | | | |
| | | | | | |
Banks — 4.7% | | | | | | |
Barclays Bank PLC, Series GMTN, 1.94%, (3-Month USD LIBOR + 0.55%), 08/07/19 (United Kingdom)@ | | | 420,000 | | | 421,506 |
BNP Paribas SA, Series MTN, 2.40%, 12/12/18 (France) | | | 295,000 | | | 295,873 |
Royal Bank of Canada, Series GMTN, 1.80%, 07/30/18 (Canada) | | | 630,000 | | | 629,283 |
Sumitomo Mitsui Financial Group, Inc., 3.22%, (3-Month USD LIBOR + 1.68%), 03/09/21 (Japan)@ | | | 615,000 | | | 636,284 |
Toronto-Dominion Bank (The), Series GMTN, 1.45%, 09/06/18 (Canada) | | | 425,000 | | | 423,515 |
Toronto-Dominion Bank (The), 1.51%, (3-Month USD LIBOR + 0.15%), 10/24/19 (Canada)@ | | | 510,000 | | | 510,219 |
| | | | |
FOREIGN BONDS (continued) | | | |
| | | | | | |
Banks (continued) | | | | | | |
Westpac Banking Corp., 2.25%, 07/30/18 (Australia) | | $ | 561,000 | | $ | 562,183 |
Total Banks | | | | | | 3,478,863 |
| | | | | | |
Beverages — 1.1% | | | | | | |
Anheuser-Busch InBev Finance, Inc., 1.90%, 02/01/19 (Belgium) | | | 840,000 | | | 838,481 |
| | | | | | |
Diversified Financial Services — 0.7% | | | |
Nomura Holdings, Inc., Series GMTN, 2.75%, 03/19/19 (Japan) | | | 549,000 | | | 553,270 |
| | | | | | |
Oil & Gas — 1.2% | | | | | | |
BP Capital Markets PLC, 1.38%, 05/10/18 (United Kingdom) | | | 500,000 | | | 499,263 |
Ecopetrol SA, 7.63%, 07/23/19 (Colombia) | | | 335,000 | | | 360,125 |
Total Oil & Gas | | | | | | 859,388 |
| | | | | | |
Retail — 0.3% | | | | | | |
Alimentation Couche-Tard, Inc., 2.07%, (3-Month USD LIBOR + 0.50%), 12/13/19 (Canada)@‡ | | | 200,000 | | | 200,179 |
| | | | | | |
Sovereign — 0.8% | | | | | | |
Export-Import Bank of Korea, 1.75%, 02/27/18 (South Korea) | | | 620,000 | | | 619,623 |
| | | | | | |
Telecommunications — 1.1% | | | | | | |
Vodafone Group PLC, 1.50%, 02/19/18 (United Kingdom) | | | 845,000 | | | 844,395 |
| | | | | | |
Total Foreign Bonds | | | | | | |
(Cost $7,392,174) | | | | | | 7,394,199 |
| | | | | | |
MORTGAGE BACKED SECURITIES — 6.7% | | | |
| | | | | | |
Commercial Mortgage Backed Securities — 6.7% |
CFCRE Commercial Mortgage Trust, Class A2, Series
2011-C2, 3.06%, 12/15/47 | | | 266 | | | 266 |
COMM Mortgage Trust, Class A2, Series 2013-CR6, 2.12%, 03/10/46 | | | 71,122 | | | 71,084 |
See accompanying Notes to Financial Statements.
69
ADVISORSHARES SAGE CORE RESERVES ETF
Schedule of Investments (continued)
December 31, 2017 (Unaudited)
| | | | |
MORTGAGE BACKED SECURITIES (continued) |
| | | | | | |
Commercial Mortgage Backed Securities (continued) |
COMM Mortgage Trust,
Class A2, Series 2013-LC13, 3.01%, 08/10/46 | | $ | 415,000 | | $ | 417,197 |
Fannie Mae Connecticut Avenue Securities,
Class 1M1, Series 2014-C02, 2.50%, (1-Month USD LIBOR + 0.95%), 05/25/24@ | | | 247,108 | | | 247,996 |
Fannie Mae Connecticut Avenue Securities,
Class 1M1, Series 2016-C04, 3.00%, (1-Month USD LIBOR + 1.45%), 01/25/29@ | | | 1,039,779 | | | 1,050,060 |
Fannie Mae Connecticut Avenue Securities,
Class 1M1, Series 2016-C06, 2.85%, (1-Month USD LIBOR + 1.30%), 04/25/29@ | | | 699,010 | | | 707,143 |
Fannie Mae Connecticut Avenue Securities,
Class 1M1, Series 2017-C03, 2.50%, (1-Month USD LIBOR + 0.95%), 10/25/29@ | | | 700,836 | | | 706,525 |
Fannie Mae Connecticut Avenue Securities,
Class 1M1, Series 2017-C05, 2.10%, (1-Month USD LIBOR + 0.55%), 01/25/30@ | | | 703,234 | | | 704,204 |
Freddie Mac REMICS, Class ED, Series 2010-3645, 2.50%, 12/15/20 | | | 268,993 | | | 269,491 |
WFRBS Commercial Mortgage Trust, Class A2, Series
2013-C13, 1.96%, 05/15/45 | | | 796,551 | | | 795,962 |
Total Mortgage Backed Securities | | | |
(Cost $4,950,594) | | | | | | 4,969,928 |
| | | | | | |
U.S. TREASURY NOTES — 5.0% | | | |
U.S. Treasury Note, 1.38%, 09/30/18 | | | 2,985,000 | | | 2,977,538 |
U.S. Treasury Note, 1.25%, 11/30/18 | | | 745,000 | | | 741,435 |
Total U.S. Treasury Notes | | | | | | |
(Cost $3,727,004) | | | | | | 3,718,973 |
| | | | | | |
U.S. TREASURY BILL — 0.2% | | | | | | |
| | | | | | |
U.S. Treasury Bill, 1.24%, 05/03/18(b) | | | | | | |
(Cost $99,589) | | | 100,000 | | | 99,532 |
| | | | |
| | | | | | | |
MONEY MARKET FUND — 7.6% | | | | |
JPMorgan U.S. Government Money Market Fund – Institutional Class, 1.14%(c) (Cost $5,693,719) | | | 5,693,719 | | $ | 5,693,719 | |
| | | | | | | |
REPURCHASE AGREEMENTS — 0.4%(d) | | | | |
Daiwa Capital Markets America, dated 12/29/17, due 01/02/18, 1.43%, total to be received $250,030, (collateralized by various U.S. Government Agency Obligations, 0.00% – 6.50%, 01/11/18 – 12/01/51, totaling $254,353) | | $ | 250,000 | | | 250,000 | |
RBC Dominion Securities, Inc., dated 12/29/17, due 01/02/18, 1.40%, total to be received $95,811, (collateralized by various U.S. Government Agency Obligations, 1.88% – 8.88%, 02/15/19 – 12/20/47, totaling $97,413) | | | 95,800 | | | 95,800 | |
Total Repurchase Agreements | | | | |
(Cost $345,800) | | | | | | 345,800 | |
| | | | | | | |
Total Investments — 104.5% | | | | | | | |
(Cost $77,817,476) | | | | | | 77,849,819 | |
| | | | | | | |
Liabilities in Excess of Other Assets – (4.5%) | | | | | | (3,387,218 | ) |
Net Assets — 100.0% | | | | | $ | 74,462,601 | |
See accompanying Notes to Financial Statements.
70
ADVISORSHARES SAGE CORE RESERVES ETF
Schedule of Investments (continued)
December 31, 2017 (Unaudited)
SUMMARY OF SCHEDULE OF INVESTMENTS
| | |
Aerospace/Defense | | 1.1 | % |
Auto Manufacturers | | 2.3 | |
Banks | | 18.6 | |
Beverages | | 1.1 | |
Biotechnology | | 1.5 | |
Building Materials | | 0.6 | |
Chemicals | | 1.0 | |
Commercial Mortgage Backed Securities | | 6.7 | |
Computers | | 1.2 | |
Diversified Financial Services | | 30.6 | |
Electric | | 2.3 | |
Food | | 0.8 | |
Healthcare – Products | | 1.1 | |
Healthcare – Services | | 0.5 | |
Internet | | 1.1 | |
Machinery – Diversified | | 1.4 | |
Media | | 1.1 | |
Oil & Gas | | 1.2 | |
Pharmaceuticals | | 4.1 | |
Pipelines | | 3.1 | |
REITS | | 2.7 | |
Retail | | 2.1 | |
Sovereign | | 0.8 | |
Telecommunications | | 3.5 | |
Toys/Games/Hobbies | | 0.5 | |
Transportation | | 0.3 | |
U.S. Treasury Bill | | 0.2 | |
U.S. Treasury Notes | | 5.0 | |
Money Market Fund | | 7.6 | |
Repurchase Agreements | | 0.4 | |
Total Investments | | 104.5 | |
Liabilities in Excess of Other Assets | | (4.5 | ) |
Net Assets | | 100.0 | % |
See accompanying Notes to Financial Statements.
71
ADVISORSHARES STAR GLOBAL BUY-WRITE ETF
Schedule of Investments
December 31, 2017 (Unaudited)
| | | | |
EXCHANGE TRADED FUNDS — 96.1% | | | |
| | | | | |
Asset Allocation Fund — 1.9% | | | |
SPDR Bloomberg Barclays Convertible Securities ETF | | 6,453 | | $ | 326,522 |
| | | | | |
Debt Fund — 14.6% | | | | | |
PowerShares Fundamental High Yield Corporate Bond Portfolio | | 43,687 | | | 827,869 |
SPDR Doubleline Total Return Tactical ETF | | 17,003 | | | 827,026 |
Vanguard Intermediate-Term Bond ETF | | 9,863 | | | 826,815 |
Total Debt Fund | | | | | 2,481,710 |
| | | | | |
Equity Fund — 79.6% | | | | | |
Financial Select Sector SPDR Fund | | 24,769 | | | 691,303 |
iShares MSCI EAFE ETF | | 22,629 | | | 1,591,045 |
iShares MSCI Emerging Markets ETF | | 17,877 | | | 842,364 |
iShares Russell 2000 ETF | | 6,720 | | | 1,024,531 |
SPDR S&P 500 ETF Trust(a) | | 30,093 | | | 8,030,618 |
Vanguard REIT ETF | | 5,994 | | | 497,382 |
X-trackers MSCI Europe Hedged Equity ETF | | 28,653 | | | 814,318 |
Total Equity Fund | | | | | 13,491,561 |
Total Exchange Traded Funds | | | | | |
(Cost $13,885,950) | | | | | 16,299,793 |
| | | | | |
MONEY MARKET FUND — 3.7% | | | |
BlackRock Liquidity Funds T-Fund Portfolio, Institutional Class, 1.17%(b) (Cost $622,658) | | 622,658 | | | 622,658 |
| | | | | | |
PURCHASED PUT OPTION — 0.3% | | |
SPDR S&P 500 ETF Trust, Option expiring 03/16/18, Strike Price $268.00 (Cost $41,662) | | 9,400 | | 94 | | 48,739 |
|
Total Investments Before
Written Options — 100.1% |
(Cost $14,550,270) | | | | | | 16,971,190 |
Investments | | Notional
Amount | | | Contracts | | | | | |
WRITTEN CALL OPTIONS – (0.1)% | | | | |
| | | | | | | | | | |
iShares MSCI EAFE ETF, expiring 01/19/18, Strike Price $71.50 | | (17,000 | ) | | (170 | ) | | $ | (1,615 | ) |
iShares MSCI Emerging Markets ETF, expiring 01/19/18, Strike Price $47.50 | | (8,900 | ) | | (89 | ) | | | (3,560 | ) |
SPDR S&P 500 ETF Trust, expiring 01/19/18, Strike Price $272.00 | | (15,000 | ) | | (150 | ) | | | (2,775 | ) |
Total Written Call Options [Premiums Received $(18,628)] | | | | | | (7,950 | ) |
| | | | | | | | | | |
Total Investments — 100.0% | | | | | | | |
(Cost $14,531,642) | | | | | | | | | 16,963,240 | |
| | | | | | | | | | |
Liabilities in Excess of
Other Assets — 0.0%** | | | | | | (5,441 | ) |
Net Assets — 100.0% | | | | | | | | $ | 16,957,799 | |
SUMMARY OF SCHEDULE OF INVESTMENTS
| | |
Asset Allocation Fund | | 1.9 | % | |
Debt Fund | | 14.6 | | |
Equity Fund | | 79.6 | | |
Purchased Put Option | | 0.3 | | |
Written Call Option | | (0.1 | ) | |
Money Market Fund | | 3.7 | | |
Total Investments | | 100.0 | | |
Liabilities in Excess of Other Assets | | (0.0) | ** | |
Net Assets | | 100.0 | % | |
See accompanying Notes to Financial Statements.
72
ADVISORSHARES VICE ETF
Schedule of Investments
December 31, 2017 (Unaudited)
| | | | |
COMMON STOCKS — 99.0% | | | | | |
| | | | | |
Agriculture — 29.5% | | | | | |
Altria Group, Inc. | | 4,235 | | $ | 302,421 |
British American Tobacco PLC (United Kingdom)(a) | | 5,275 | | | 353,372 |
Imperial Brands PLC (United Kingdom)(a) | | 6,595 | | | 281,409 |
Philip Morris International, Inc. | | 2,910 | | | 307,442 |
Turning Point Brands, Inc. | | 19,395 | | | 409,816 |
Universal Corp. | | 5,895 | | | 309,488 |
Vector Group Ltd. | | 15,595 | | | 349,016 |
Total Agriculture | | | | | 2,312,964 |
| | | | | |
Beverages — 37.3% | | | | | |
Ambev SA (Brazil)(a) | | 13,203 | | | 85,291 |
Anheuser-Busch InBev SA/NV (Belgium)(a) | | 1,380 | | | 153,953 |
Boston Beer Co., Inc. (The), Class A* | | 1,800 | | | 343,980 |
Brown-Forman Corp., Class B | | 5,395 | | | 370,475 |
Cia Cervecerias Unidas SA (Chile)(a) | | 3,480 | | | 102,938 |
Constellation Brands, Inc., Class A | | 2,040 | | | 466,283 |
Craft Brew Alliance, Inc.* | | 11,695 | | | 224,544 |
Diageo PLC (United Kingdom)(a) | | 2,460 | | | 359,234 |
Fomento Economico Mexicano SAB de CV (Mexico)(a) | | 1,440 | | | 135,216 |
Heineken NV (Netherlands)(a) | | 2,280 | | | 118,834 |
MGP Ingredients, Inc. | | 4,440 | | | 341,347 |
Molson Coors Brewing Co., Class B | | 1,200 | | | 98,484 |
Vina Concha y Toro SA (Chile)(a) | | 3,480 | | | 126,846 |
Total Beverages | | | | | 2,927,425 |
| | | | | |
Entertainment — 4.6% | | | | | |
RCI Hospitality Holdings, Inc. | | 12,940 | | | 362,061 |
| | | | | |
Healthcare – Products — 1.0% | | | |
Abbott Laboratories | | 1,350 | | | 77,044 |
| | | | | |
Housewares — 4.8% | | | | | |
Scotts Miracle-Gro Co. (The) | | 3,480 | | | 372,325 |
| | | | | |
Pharmaceuticals — 16.4% | | | | | |
AbbVie, Inc. | | 4,555 | | | 440,514 |
Catalent, Inc.* | | 8,875 | | | 364,585 |
Insys Therapeutics, Inc.* | | 50,388 | | | 484,733 |
Total Pharmaceuticals | | | | | 1,289,832 |
| | | | | |
Retail — 5.4% | | | | | |
BJ’s Restaurants, Inc. | | 2,580 | | | 93,912 |
| | | | |
COMMON STOCKS (continued) | | | |
| | | | | |
Retail (continued) | | | | | |
Dave & Buster’s Entertainment, Inc.* | | 5,995 | | $ | 330,744 |
Total Retail | | | | | 424,656 |
Total Common Stocks | | | | | |
(Cost $7,479,411) | | | | | 7,766,307 |
| | | | | |
MONEY MARKET FUND — 0.9% | | | |
BlackRock Liquidity Funds Treasury Trust Fund Portfolio, Institutional Class, 1.11%(b) (Cost $69,987) | | 69,987 | | | 69,987 |
| | | | | |
Total Investments — 99.9% | | | | | |
(Cost $7,549,398) | | | | | 7,836,294 |
| | | | | |
Other Assets in Excess of Liabilities — 0.1% | | | | | 10,116 |
Net Assets — 100.0% | | | | $ | 7,846,410 |
SUMMARY OF SCHEDULE OF INVESTMENTS
| | |
Agriculture | | 29.5 | % |
Beverages | | 37.3 | |
Entertainment | | 4.6 | |
Healthcare – Products | | 1.0 | |
Housewares | | 4.8 | |
Pharmaceuticals | | 16.4 | |
Retail | | 5.4 | |
Money Market Fund | | 0.9 | |
Total Investments | | 99.9 | |
Other Assets in Excess of Liabilities | | 0.1 | |
Net Assets | | 100.0 | % |
See accompanying Notes to Financial Statements.
73
ADVISORSHARES WILSHIRE BUYBACK ETF
Schedule of Investments
December 31, 2017 (Unaudited)
| | | | |
COMMON STOCKS — 98.6% | | | | | |
| | | | | |
Aerospace/Defense — 0.9% | | | | | |
Raytheon Co. | | 5,756 | | $ | 1,081,265 |
| | | | | |
Agriculture — 1.1% | | | | | |
Altria Group, Inc. | | 18,410 | | | 1,314,658 |
| | | | | |
Auto Parts & Equipment — 1.4% | | | |
BorgWarner, Inc. | | 9,476 | | | 484,129 |
Lear Corp. | | 6,840 | | | 1,208,354 |
Total Auto Parts & Equipment | | | | | 1,692,483 |
| | | | | |
Banks — 4.1% | | | | | |
BB&T Corp. | | 10,031 | | | 498,741 |
Fifth Third Bancorp | | 45,428 | | | 1,378,286 |
M&T Bank Corp. | | 4,981 | | | 851,701 |
PacWest Bancorp | | 8,342 | | | 420,437 |
PNC Financial Services Group, Inc. (The) | | 6,853 | | | 988,819 |
US Bancorp | | 18,991 | | | 1,017,538 |
Total Banks | | | | | 5,155,522 |
| | | | | |
Biotechnology — 3.4% | | | | | |
Alexion Pharmaceuticals, Inc.* | | 7,086 | | | 847,415 |
Amgen, Inc. | | 8,001 | | | 1,391,374 |
Biogen, Inc.* | | 6,392 | | | 2,036,299 |
Total Biotechnology | | | | | 4,275,088 |
| | | | | |
Chemicals — 2.3% | | | | | |
Eastman Chemical Co. | | 11,432 | | | 1,059,061 |
Monsanto Co. | | 6,113 | | | 713,876 |
WR Grace & Co. | | 16,223 | | | 1,137,719 |
Total Chemicals | | | | | 2,910,656 |
| | | | | |
Commercial Services — 4.3% | | | | | |
Automatic Data Processing, Inc. | | 10,482 | | | 1,228,385 |
ManpowerGroup, Inc. | | 8,844 | | | 1,115,317 |
Robert Half International, Inc. | | 34,270 | | | 1,903,356 |
ServiceMaster Global Holdings, Inc.* | | 9,599 | | | 492,141 |
United Rentals, Inc.* | | 3,452 | | | 593,433 |
Total Commercial Services | | | | | 5,332,632 |
| | | | | |
Computers — 2.3% | | | | | |
NCR Corp.*(a) | | 42,204 | | | 1,434,514 |
Teradata Corp.*(a) | | 36,651 | | | 1,409,597 |
Total Computers | | | | | 2,844,111 |
| | | | | |
Cosmetics/Personal Care — 0.9% | | | |
Edgewell Personal Care Co.*(a) | | 19,958 | | | 1,185,306 |
| | | | | |
Distribution/Wholesale — 1.0% | | | |
HD Supply Holdings, Inc.* | | 30,496 | | | 1,220,755 |
| | | | |
COMMON STOCKS (continued) | | | |
| | | |
Diversified Financial Services — 9.7% | | | |
Alliance Data Systems Corp. | | 13,433 | | $ | 3,404,997 |
Ally Financial, Inc. | | 50,413 | | | 1,470,043 |
Ameriprise Financial, Inc. | | 15,756 | | | 2,670,169 |
FNF Group | | 12,784 | | | 501,644 |
Franklin Resources, Inc. | | 37,443 | | | 1,622,405 |
Synchrony Financial | | 63,934 | | | 2,468,492 |
Total Diversified Financial Services | | | | | 12,137,750 |
| | | | | |
Electric — 0.4% | | | | | |
WEC Energy Group, Inc. | | 7,548 | | | 501,414 |
| | | | | |
Electrical Components & Equipment — 0.5% |
Emerson Electric Co. | | 8,472 | | | 590,414 |
| | | | | |
Electronics — 1.7% | | | | | |
Amphenol Corp., Class A | | 11,388 | | | 999,867 |
Gentex Corp. | | 14,013 | | | 293,572 |
Waters Corp.* | | 4,510 | | | 871,287 |
Total Electronics | | | | | 2,164,726 |
| | | | | |
Environmental Control — 0.6% | | | |
Waste Management, Inc. | | 7,972 | | | 687,984 |
| | | | | |
Food — 6.9% | | | | | |
Campbell Soup Co. | | 37,351 | | | 1,796,957 |
Conagra Brands, Inc. | | 80,939 | | | 3,048,972 |
Hormel Foods Corp. | | 21,105 | | | 768,011 |
Ingredion, Inc. | | 7,641 | | | 1,068,212 |
JM Smucker Co. (The) | | 15,397 | | | 1,912,923 |
Total Food | | | | | 8,595,075 |
| | | | | |
Healthcare – Products — 2.8% | | | |
DENTSPLY SIRONA, Inc. | | 16,386 | | | 1,078,690 |
Patterson Cos., Inc. | | 26,943 | | | 973,450 |
Varian Medical Systems, Inc.*(a) | | 12,704 | | | 1,412,050 |
Total Healthcare – Products | | | | | 3,464,190 |
| | | | | |
Healthcare – Services — 5.9% | | | |
Cigna Corp. | | 5,585 | | | 1,134,258 |
HCA Healthcare, Inc.* | | 18,269 | | | 1,604,749 |
Humana, Inc. | | 9,263 | | | 2,297,872 |
Laboratory Corp. of America Holdings* | | 5,718 | | | 912,078 |
Quest Diagnostics, Inc. | | 14,164 | | | 1,395,012 |
Total Healthcare – Services | | | | | 7,343,969 |
| | | | | |
Home Builders — 0.7% | | | | | |
NVR, Inc.* | | 243 | | | 852,497 |
| | | | | |
Housewares — 0.8% | | | | | |
Toro Co. (The) | | 14,503 | | | 946,031 |
See accompanying Notes to Financial Statements.
74
ADVISORSHARES WILSHIRE BUYBACK ETF
Schedule of Investments (continued)
December 31, 2017 (Unaudited)
| | | | |
COMMON STOCKS (continued) | | | |
| | | | | |
Insurance — 10.5% | | | | | |
Aflac, Inc. | | 20,641 | | $ | 1,811,867 |
Alleghany Corp.*(a) | | 697 | | | 415,475 |
Assurant, Inc. | | 23,686 | | | 2,388,496 |
Axis Capital Holdings Ltd. | | 41,907 | | | 2,106,246 |
Cincinnati Financial Corp. | | 8,042 | | | 602,909 |
Lincoln National Corp. | | 22,932 | | | 1,762,783 |
MetLife, Inc. | | 32,562 | | | 1,646,335 |
RenaissanceRe Holdings Ltd. (Bermuda) | | 7,248 | | | 910,276 |
Torchmark Corp. | | 16,454 | | | 1,492,542 |
Total Insurance | | | | | 13,136,929 |
| | | | | |
Internet — 3.1% | | | | | |
CDW Corp. | | 35,720 | | | 2,482,183 |
TripAdvisor, Inc.*(a) | | 39,252 | | | 1,352,624 |
Total Internet | | | | | 3,834,807 |
| | | | | |
Iron/Steel — 0.6% | | | | | |
Steel Dynamics, Inc. | | 17,498 | | | 754,689 |
| | | | | |
Lodging — 1.3% | | | | | |
Marriott International, Inc., Class A | | 12,180 | | | 1,653,191 |
| | | | | |
Media — 2.5% | | | | | |
AMC Networks, Inc., Class A*(a) | | 29,933 | | | 1,618,777 |
Charter Communications, Inc., Class A* | | 4,466 | | | 1,500,397 |
Total Media | | | | | 3,119,174 |
| | | | | |
Miscellaneous Manufacturing — 2.1% | | | |
Carlisle Cos., Inc. | | 8,421 | | | 957,047 |
Donaldson Co., Inc.(a) | | 20,459 | | | 1,001,468 |
Pentair PLC (United Kingdom) | | 9,517 | | | 672,090 |
Total Miscellaneous Manufacturing | | | | | 2,630,605 |
| | | | | |
Oil & Gas — 0.6% | | | | | |
Cabot Oil & Gas Corp. | | 26,354 | | | 753,724 |
| | | | | |
Packaging & Containers — 1.5% | | | |
Crown Holdings, Inc.* | | 22,793 | | | 1,282,106 |
Sealed Air Corp. | | 12,476 | | | 615,067 |
Total Packaging & Containers | | | | | 1,897,173 |
| | | | | |
REITS — 1.9% | | | | | |
GGP, Inc. | | 34,327 | | | 802,909 |
SL Green Realty Corp. | | 10,653 | | | 1,075,207 |
VEREIT, Inc. | | 66,924 | | | 521,338 |
Total REITS | | | | | 2,399,454 |
| | | | |
COMMON STOCKS (continued) | | | |
| | | | | |
Retail — 12.1% | | | | | |
Advance Auto Parts, Inc. | | 3,173 | | $ | 316,316 |
AutoZone, Inc.* | | 1,877 | | | 1,335,241 |
Bed Bath & Beyond, Inc.(a) | | 72,277 | | | 1,589,371 |
Best Buy Co., Inc. | | 24,589 | | | 1,683,609 |
Burlington Stores, Inc.* | | 9,129 | | | 1,123,141 |
Dollar General Corp. | | 10,085 | | | 938,006 |
Foot Locker, Inc. | | 29,629 | | | 1,389,008 |
Kohl’s Corp. | | 34,531 | | | 1,872,616 |
Macy’s, Inc. | | 22,561 | | | 568,312 |
PVH Corp. | | 8,412 | | | 1,154,211 |
Ross Stores, Inc. | | 12,311 | | | 987,958 |
Wal-Mart Stores, Inc. | | 11,346 | | | 1,120,417 |
Williams-Sonoma, Inc.(a) | | 19,786 | | | 1,022,936 |
Total Retail | | | | | 15,101,142 |
| | | | | |
Semiconductors — 1.3% | | | | | |
Applied Materials, Inc. | | 13,799 | | | 705,405 |
Texas Instruments, Inc. | | 9,095 | | | 949,882 |
Total Semiconductors | | | | | 1,655,287 |
| | | | | |
Shipbuilding — 1.3% | | | | | |
Huntington Ingalls Industries, Inc. | | 6,784 | | | 1,598,989 |
| | | | | |
Software — 3.6% | | | | | |
Adobe Systems, Inc.* | | 4,438 | | | 777,715 |
Akamai Technologies, Inc.* | | 18,646 | | | 1,212,736 |
Intuit, Inc. | | 4,606 | | | 726,735 |
Jack Henry & Associates, Inc.(a) | | 7,470 | | | 873,691 |
Red Hat, Inc.* | | 8,002 | | | 961,040 |
Total Software | | | | | 4,551,917 |
| | | | | |
Telecommunications — 3.5% | | | | | |
ARRIS International PLC* | | 109,398 | | | 2,810,434 |
Motorola Solutions, Inc. | | 17,279 | | | 1,560,985 |
Total Telecommunications | | | | | 4,371,419 |
| | | | | |
Transportation — 1.0% | | | | | |
Norfolk Southern Corp. | | 8,284 | | | 1,200,351 |
Total Common Stocks | | | | | |
(Cost $114,660,483) | | | | | 122,955,377 |
| | | | | |
MONEY MARKET FUNDS — 1.7% | | | |
BlackRock Liquidity Funds FedFund Portfolio, Institutional Class, 1.17%(b)(c) | | 127,000 | | | 127,000 |
See accompanying Notes to Financial Statements.
75
ADVISORSHARES WILSHIRE BUYBACK ETF
Schedule of Investments (continued)
December 31, 2017 (Unaudited)
| | | | |
MONEY MARKET FUNDS (continued) | | | |
| | | | | | |
Morgan Stanley Institutional Liquidity Funds – Government Portfolio, Institutional Class, 1.20%(b)(c) | | | 124,000 | | $ | 124,000 |
Invesco STIT – Government & Agency Portfolio, Institutional Class, 1.18%(b)(c) | | | 128,000 | | | 128,000 |
Wells Fargo Advantage Government Money Market Fund – Institutional Class, 1.14%(b) | | | 1,697,152 | | | 1,697,152 |
Total Money Market Funds | | | | | | |
(Cost $2,076,152) | | | | | | 2,076,152 |
| | | | | | |
REPURCHASE AGREEMENTS — 2.0%(c) | | | |
Citigroup Global Markets, Inc., dated 12/29/17, due 01/02/18, 1.41%, total to be received $677,342, (collateralized by various U.S. Government Agency Obligations, 0.00% – 9.00%, 04/01/18 – 08/20/67, totaling $688,663) | | $ | 677,262 | | | 677,262 |
Daiwa Capital Markets America, dated 12/29/17, due 01/02/18, 1.43%, total to be received $677,343, (collateralized by various U.S. Government Agency Obligations, 0.00% – 6.50%, 01/11/18 – 12/01/51, totaling $689,055) | | | 677,262 | | | 677,262 |
HSBC Securities USA, Inc., dated 12/29/17, due 01/02/18, 1.36%, total to be received $498,985, (collateralized by various U.S. Government Agency Obligations, 0.00% – 9.13%, 12/31/17 – 05/15/47, totaling $506,514) | | | 498,928 | | | 498,928 |
| | | | |
REPURCHASE AGREEMENTS (continued) | | | | |
| | | | | | | |
RBC Dominion Securities, Inc., dated 12/29/17, due 01/02/18, 1.40%, total to be received $677,341, (collateralized by various U.S. Government Agency Obligations, 1.88% – 8.88%, 02/15/19 – 12/20/47, totaling $688,668) | | $ | 677,262 | | $ | 677,262 | |
Total Repurchase Agreements | | | | | | | |
(Cost $2,530,714) | | | | | | 2,530,714 | |
| | | | | | | |
Total Investments — 102.3% | | | | | | | |
(Cost $119,267,349) | | | | | | 127,562,243 | |
| | | | | | | |
Liabilities in Excess of Other Assets — (2.3%) | | | | | | (2,873,394 | ) |
Net Assets — 100.0% | | | | | $ | 124,688,849 | |
See accompanying Notes to Financial Statements.
76
ADVISORSHARES WILSHIRE BUYBACK ETF
Schedule of Investments (continued)
December 31, 2017 (Unaudited)
SUMMARY OF SCHEDULE OF INVESTMENTS
| | |
Aerospace/Defense | | 0.9 | % |
Agriculture | | 1.1 | |
Auto Parts & Equipment | | 1.4 | |
Banks | | 4.1 | |
Biotechnology | | 3.4 | |
Chemicals | | 2.3 | |
Commercial Services | | 4.3 | |
Computers | | 2.3 | |
Cosmetics/Personal Care | | 0.9 | |
Distribution/Wholesale | | 1.0 | |
Diversified Financial Services | | 9.7 | |
Electric | | 0.4 | |
Electrical Components & Equipment | | 0.5 | |
Electronics | | 1.7 | |
Environmental Control | | 0.6 | |
Food | | 6.9 | |
Healthcare – Products | | 2.8 | |
Healthcare – Services | | 5.9 | |
Home Builders | | 0.7 | |
Housewares | | 0.8 | |
Insurance | | 10.5 | |
Internet | | 3.1 | |
Iron/Steel | | 0.6 | |
Lodging | | 1.3 | |
Media | | 2.5 | |
Miscellaneous Manufacturing | | 2.1 | |
Oil & Gas | | 0.6 | |
Packaging & Containers | | 1.5 | |
REITS | | 1.9 | |
Retail | | 12.1 | |
Semiconductors | | 1.3 | |
Shipbuilding | | 1.3 | |
Software | | 3.6 | |
Telecommunications | | 3.5 | |
Transportation | | 1.0 | |
Money Market Funds | | 1.7 | |
Repurchase Agreements | | 2.0 | |
Total Investments | | 102.3 | |
Liabilities in Excess of Other Assets | | (2.3 | ) |
Net Assets | | 100.0 | % |
See accompanying Notes to Financial Statements.
77
ADVISORSHARES TRUST
Statements of Assets and Liabilities
December 31, 2017 (Unaudited)
| | AdvisorShares Cornerstone
Small Cap ETF | | AdvisorShares
Dorsey Wright
ADR ETF | | AdvisorShares Focused
Equity ETF |
ASSETS | | | | | | | | | | | |
Investments, at Cost | | $ | 3,926,072 | | $ | 147,503,280 | | | $ | 11,714,166 | |
Investments in Affiliates, at Cost (Note 8) | | | — | | | — | | | | — | |
Repurchase Agreements, at Cost (Note 2) | | | 460,323 | | | 19,295,767 | | | | 357,200 | |
Total Cost of Investments | | | 4,386,395 | | | 166,799,047 | | | | 12,071,366 | |
Investments, at Market Value (including securities on loan) (Note 2)(a) | | | 4,668,228 | | | 171,633,891 | | | | 13,128,314 | |
Investments in Affiliates, at Market Value (Note 8) | | | — | | | — | | | | — | |
Repurchase Agreements, at Market Value (Note 2) | | | 460,323 | | | 19,295,767 | | | | 357,200 | |
Total Market Value of Investments | | | 5,128,551 | | | 190,929,658 | | | | 13,485,514 | |
Cash | | | — | | | 20,457 | | | | — | |
Dividends and Interest Receivable | | | 4,068 | | | 193,191 | | | | 5,371 | |
Receivable from Securities Sold | | | — | | | — | | | | 3,404,593 | |
Capital Shares Receivable | | | — | | | 1,467,635 | | | | — | |
Reclaim Receivable | | | — | | | 6,530 | | | | — | |
Due from Investment Advisor | | | 5,962 | | | — | | | | 340 | |
Prepaid CCO Fees | | | — | | | 393 | | | | — | |
Prepaid Expenses | | | 140 | | | 37,187 | | | | 2,243 | |
Total Assets | | | 5,138,721 | | | 192,655,051 | | | | 16,898,061 | |
LIABILITIES | | | | | | | | | | | |
Cash collateral for securities on loan(b) | | | 460,323 | | | 22,284,767 | | | | 357,200 | |
Advisory Fees Payable | | | — | | | 111,946 | | | | — | |
Trustee Fees Payable | | | 1,223 | | | 738 | | | | 1,095 | |
Payable for Securities Purchased | | | — | | | 1,442,694 | | | | 3,245,835 | |
CCO Fees Payable | | | 219 | | | — | | | | 203 | |
Due to Custodian | | | — | | | — | | | | — | |
Accrued Expenses | | | 32,186 | | | 44,834 | | | | 29,841 | |
Total Liabilities | | | 493,951 | | | 23,884,979 | | | | 3,634,174 | |
NET ASSETS | | $ | 4,644,770 | | $ | 168,770,072 | | | $ | 13,263,887 | |
COMPONENTS OF NET ASSETS | | | | | | | | | | | |
Capital Stock at Zero Par Value | | $ | 3,654,824 | | $ | 145,808,468 | | | $ | 11,083,805 | |
Undistributed (Accumulated) Net Investment Income (Loss) | | | 2,293 | | | (52,259 | ) | | | (1,488 | ) |
Undistributed (Accumulated) Net Realized Gain (Loss) | | | 245,497 | | | (1,116,748 | ) | | | 767,422 | |
Net Unrealized Appreciation (Depreciation) | | | 742,156 | | | 24,130,611 | | | | 1,414,148 | |
NET ASSETS | | $ | 4,644,770 | | $ | 168,770,072 | | | $ | 13,263,887 | |
SHARES ISSUED AND OUTSTANDING | | | | | | | | | | | |
Shares Outstanding (Unlimited Shares Authorized) | | | 136,476 | | | 2,875,000 | | | | 425,000 | |
Net Asset Value (NAV) Per Share | | $ | 34.03 | | $ | 58.70 | | | $ | 31.21 | |
| | | | | | | | | | | |
(a) Market value of securities on loan | | $ | 960,924 | | $ | 27,890,281 | | | $ | 790,987 | |
(b) Non-cash collateral for securities on loan | | $ | 522,982 | | $ | 6,246,642 | | | $ | 450,486 | |
See accompanying Notes to Financial Statements.
78
ADVISORSHARES TRUST
Statements of Assets and Liabilities
December 31, 2017 (Unaudited)
AdvisorShares
KIM Korea
Equity ETF | | AdvisorShares Madrona
Domestic ETF | | AdvisorShares Madrona Global Bond ETF | | AdvisorShares Madrona
International ETF | | AdvisorShares
Meidell Tactical
Advantage ETF | | AdvisorShares
New Tech and
Media ETF |
| | | | | | | | | | | | | | | | | | | | | |
$ | 8,169,016 | | | $ | 24,058,267 | | | $ | 17,732,088 | | | $ | 11,790,423 | | | $ | 14,739,456 | | $ | 51,352,432 | |
| — | | | | — | | | | 1,177,610 | | | | — | | | | — | | | — | |
| — | | | | 606,349 | | | | 5,303,247 | | | | 2,869,137 | | | | 3,890,798 | | | 7,202,669 | |
| 8,169,016 | | | | 24,664,616 | | | | 24,212,945 | | | | 14,659,560 | | | | 18,630,254 | | | 58,555,101 | |
|
10,163,612
| | | | 29,374,706 | | | | 17,924,451 | | | | 13,759,936 | | | | 14,758,844 | | | 51,970,524 | |
| — | | | | — | | | | 1,301,147 | | | | — | | | | — | | | — | |
| — | | | | 606,349 | | | | 5,303,247 | | | | 2,869,137 | | | | 3,890,798 | | | 7,202,669 | |
| 10,163,612 | | | | 29,981,055 | | | | 24,528,845 | | | | 16,629,073 | | | | 18,649,642 | | | 59,173,193 | |
| — | | | | — | | | | — | | | | — | | | | 1,374,497 | | | — | |
| 79,574 | | | | 33,259 | | | | 13,006 | | | | 7,356 | | | | 859 | | | 16,504 | |
| 1,005,895 | | | | 16,972 | | | | — | | | | — | | | | — | | | — | |
| — | | | | — | | | | 648,950 | | | | — | | | | — | | | — | |
| — | | | | — | | | | — | | | | 1,069 | | | | — | | | — | |
| 4,524 | | | | — | | | | — | | | | — | | | | — | | | — | |
| — | | | | — | | | | — | | | | — | | | | — | | | — | |
| 709 | | | | 8,760 | | | | 5,299 | | | | 2,506 | | | | 4,254 | | | 38,865 | |
| 11,254,314 | | | | 30,040,046 | | | | 25,196,100 | | | | 16,640,004 | | | | 20,029,252 | | | 59,228,562 | |
| | | | | | | | | | | | | | | | | | | | | |
| — | | | | 606,349 | | | | 5,673,247 | | | | 3,340,137 | | | | 4,341,798 | | | 7,202,669 | |
| — | | | | 23,236 | | | | 8,275 | | | | 8,662 | | | | 9,821 | | | 25,500 | |
| 1,101 | | | | 1,088 | | | | 1,115 | | | | 1,237 | | | | 1,126 | | | 528 | |
| 196,311 | | | | 5,602 | | | | 637,617 | | | | — | | | | 1,374,497 | | | — | |
| 168 | | | | 156 | | | | 229 | | | | 274 | | | | 259 | | | 288 | |
| 508,798 | | | | — | | | | — | | | | 85,511 | | | | — | | | — | |
| 25,304 | | | | 40,535 | | | | 37,413 | | | | 40,482 | | | | 35,803 | | | 16,271 | |
| 731,682 | | | | 676,966 | | | | 6,357,896 | | | | 3,476,303 | | | | 5,763,304 | | | 7,245,256 | |
$ | 10,522,632 | | | $ | 29,363,080 | | | $ | 18,838,204 | | | $ | 13,163,701 | | | $ | 14,265,948 | | $ | 51,983,306 | |
| | | | | | | | | | | | | | | | | | | | | |
$ | 8,315,679 | | | $ | 27,336,951 | | | $ | 19,431,950 | | | $ | 16,879,255 | | | $ | 14,003,972 | | $ | 53,201,480 | |
| (25,735 | ) | | | 5,099 | | | | 58 | | | | 11,680 | | | | 4,451 | | | (61,681 | ) |
| 238,516 | | | | (3,295,409 | ) | | | (909,704 | ) | | | (5,696,747 | ) | | | 238,137 | | | (1,774,585 | ) |
| 1,994,172 | | | | 5,316,439 | | | | 315,900 | | | | 1,969,513 | | | | 19,388 | | | 618,092 | |
$ | 10,522,632 | | | $ | 29,363,080 | | | $ | 18,838,204 | | | $ | 13,163,701 | | | $ | 14,265,948 | | $ | 51,983,306 | |
| | | | | | | | | | | | | | | | | | | | | |
| 350,000 | | | | 550,000 | | | | 725,000 | | | | 425,000 | | | | 425,000 | | | 2,425,000 | |
$ | 30.06 | | | $ | 53.39 | | | $ | 25.98 | | | $ | 30.97 | | | $ | 33.57 | | $ | 21.44 | |
| | | | | | | | | | | | | | | | | | | | | |
$ | — | | | $ | 1,061,468 | | | $ | 5,534,850 | | | $ | 4,250,478 | | | $ | 4,245,890 | | $ | 7,024,961 | |
$ | — | | | $ | 481,937 | | | $ | — | | | $ | 1,030,053 | | | $ | — | | $ | — | |
See accompanying Notes to Financial Statements.
79
ADVISORSHARES TRUST
Statements of Assets and Liabilities
December 31, 2017 (Unaudited)
| | AdvisorShares Newfleet
Multi-Sector
Income ETF | | AdvisorShares Pacific Asset
Enhanced Floating
Rate ETF | | AdvisorShares Peritus High
Yield ETF |
ASSETS | | | | | | | | | | | | |
Investments, at Cost | | $ | 198,889,882 | | | $ | 29,708,488 | | | $ | 155,185,503 | |
Investments in Affiliates, at Cost (Note 8) | | | — | | | | — | | | | — | |
Repurchase Agreements, at Cost (Note 2) | | | 564,997 | | | | 239,435 | | | | 15,051,179 | |
Total Cost of Investments | | | 199,454,879 | | | | 29,947,923 | | | | 170,236,682 | |
Investments, at Market Value (including securities on loan) (Note 2)(a) | | | 199,320,993 | | | | 29,440,648 | | | | 155,313,280 | |
Investments in Affiliates, at Market Value (Note 8) | | | — | | | | — | | | | — | |
Repurchase Agreements, at Market Value (Note 2) | | | 564,997 | | | | 239,435 | | | | 15,051,179 | |
Total Market Value of Investments | | | 199,885,990 | | | | 29,680,083 | | | | 170,364,459 | |
Cash | | | 96,707 | | | | 33,530 | | | | 546,479 | |
Cash collateral held at brokers | | | — | | | | — | | | | — | |
Unrealized Appreciation on Swaps Contracts | | | — | | | | 2,386 | | | | — | |
Dividends and Interest Receivable | | | 783,515 | | | | 77,861 | | | | 2,236,175 | |
Receivable from Securities Sold | | | 657,073 | | | | — | | | | — | |
Due from Investment Advisor | | | — | | | | — | | | | — | |
Prepaid CCO Fees | | | 571 | | | | — | | | | — | |
Prepaid Expenses | | | 24,265 | | | | 5,699 | | | | 19,654 | |
Total Assets | | | 201,448,121 | | | | 29,799,559 | | | | 173,166,767 | |
LIABILITIES | | | | | | | | | | | | |
Interest Payable | | | — | | | | — | | | | — | |
Cash collateral for securities on loan(b) | | | 564,997 | | | | 239,435 | | | | 17,365,179 | |
Advisory Fees Payable | | | 113,444 | | | | 11,265 | | | | 153,385 | |
Trustee Fees Payable | | | 686 | | | | 1,099 | | | | 1,126 | |
Securities Sold, Not Yet Purchased(c) | | | — | | | | — | | | | — | |
Payable for Securities Purchased | | | 2,027,185 | | | | 2,519,055 | | | | 1,780,000 | |
Options Written, at value(d) | | | — | | | | — | | | | — | |
CCO Fees Payable | | | — | | | | 117 | | | | 795 | |
Due to Broker | | | — | | | | 13,556 | | | | — | |
Dividend Payable on Securities Sold, Not Yet Purchased | | | — | | | | — | | | | — | |
Accrued Expenses | | | 45,844 | | | | 21,690 | | | | 24,295 | |
Total Liabilities | | | 2,752,156 | | | | 2,806,217 | | | | 19,324,780 | |
NET ASSETS | | $ | 198,695,965 | | | $ | 26,993,342 | | | $ | 153,841,987 | |
COMPONENTS OF NET ASSETS | | | | | | | | | | | | |
Capital Stock at Zero Par Value | | $ | 204,614,897 | | | $ | 27,488,371 | | | $ | 332,796,256 | |
Undistributed (Accumulated) Net Investment Income (Loss) | | | (665,769 | ) | | | 53,658 | | | | 42,043 | |
Undistributed (Accumulated) Net Realized Gain (Loss) | | | (5,684,274 | ) | | | (283,233 | ) | | | (179,124,089 | ) |
Net Unrealized Appreciation (Depreciation) | | | 431,111 | | | | (265,454 | ) | | | 127,777 | |
NET ASSETS | | $ | 198,695,965 | | | $ | 26,993,342 | | | $ | 153,841,987 | |
SHARES ISSUED AND OUTSTANDING | | | | | | | | | | | | |
Shares Outstanding (Unlimited Shares Authorized) | | | 4,100,000 | | | | 550,000 | | | | 4,200,000 | |
Net Asset Value (NAV) Per Share | | $ | 48.46 | | | $ | 49.08 | | | $ | 36.63 | |
| | | | | | | | | | | | |
(a) Market value of securities on loan | | $ | 548,806 | | | $ | 234,549 | | | $ | 17,711,759 | |
(b) Non-cash collateral for securities on loan | | $ | — | | | $ | — | | | $ | 774,509 | |
(c) Proceeds Received from Securities Sold, Not Yet Purchased | | $ | — | | | $ | — | | | $ | — | |
(d) Premiums Received for Options Written | | $ | — | | | $ | — | | | $ | — | |
See accompanying Notes to Financial Statements.
80
ADVISORSHARES TRUST
Statements of Assets and Liabilities
December 31, 2017 (Unaudited)
AdvisorShares
Ranger Equity
Bear ETF
| | AdvisorShares
Sage Core
Reserves ETF | | AdvisorShares
STAR Global
Buy-Write ETF | | | | AdvisorShares
Wilshire
Buyback ETF |
| | | | | | | | | | | | | | | | | | |
$ | 3,436,256 | | | $ | 77,471,676 | | | $ | 14,550,270 | | | $ | 7,549,398 | | | $ | 116,736,635 | |
| 67,115,250 | | | | — | | | | — | | | | — | | | | — | |
| — | | | | 345,800 | | | | — | | | | — | | | | 2,530,714 | |
| 70,551,506 | | | | 77,817,476 | | | | 14,550,270 | | | | 7,549,398 | | | | 119,267,349 | |
|
3,436,256
| | | | 77,504,019 | | | | 16,971,190 | | | | 7,836,294 | | | | 125,031,529 | |
| 67,041,000 | | | | — | | | | — | | | | — | | | | — | |
| — | | | | 345,800 | | | | — | | | | — | | | | 2,530,714 | |
| 70,477,256 | | | | 77,849,819 | | | | 16,971,190 | | | | 7,836,294 | | | | 127,562,243 | |
| 79,609,146 | | | | — | | | | — | | | | 1,092 | | | | — | |
| 143,981,174 | | | | 120,230 | | | | — | | | | — | | | | — | |
| — | | | | — | | | | — | | | | — | | | | — | |
| 33,503 | | | | 333,917 | | | | 41,056 | | | | 11,370 | | | | 147,053 | |
| — | | | | — | | | | — | | | | — | | | | — | |
| — | | | | — | | | | — | | | | 5,248 | | | | — | |
| 129 | | | | — | | | | — | | | | — | | | | — | |
| 29,196 | | | | 13,653 | | | | 10,567 | | | | — | | | | 13,577 | |
| 294,130,404 | | | | 78,317,619 | | | | 17,022,813 | | | | 7,854,004 | | | | 127,722,873 | |
| | | | | | | | | | | | | | | | | | |
| 21,680 | | | | — | | | | — | | | | — | | | | — | |
| — | | | | 345,800 | | | | — | | | | — | | | | 2,909,714 | |
| 204,860 | | | | 7,927 | | | | 18,660 | | | | — | | | | 80,151 | |
| 869 | | | | 1,046 | | | | 1,113 | | | | 434 | | | | 930 | |
| 141,498,960 | | | | — | | | | — | | | | — | | | | — | |
| 1,426,783 | | | | 3,469,674 | | | | — | | | | — | | | | — | |
| — | | | | — | | | | 7,950 | | | | — | | | | — | |
| — | | | | 65 | | | | 180 | | | | 194 | | | | 125 | |
| — | | | | — | | | | 2,219 | | | | — | | | | — | |
| 80,925 | | | | — | | | | — | | | | — | | | | — | |
| 70,851 | | | | 30,506 | | | | 34,892 | | | | 6,966 | | | | 43,104 | |
| 143,304,928 | | | | 3,855,018 | | | | 65,014 | | | | 7,594 | | | | 3,034,024 | |
$ | 150,825,476 | | | $ | 74,462,601 | | | $ | 16,957,799 | | | $ | 7,846,410 | | | $ | 124,688,849 | |
| | | | | | | | | | | | | | | | | | |
$ | 382,572,070 | | | $ | 74,760,865 | | | $ | 15,623,504 | | | $ | 7,563,002 | | | $ | 129,121,987 | |
| (3,142,599 | ) | | | (5,986 | ) | | | 46,977 | | | | (767 | ) | | | 52,328 | |
| (224,975,122 | ) | | | (324,621 | ) | | | (1,144,280 | ) | | | (2,721 | ) | | | (12,780,360 | ) |
| (3,628,873 | ) | | | 32,343 | | | | 2,431,598 | | | | 286,896 | | | | 8,294,894 | |
$ | 150,825,476 | | | $ | 74,462,601 | | | $ | 16,957,799 | | | $ | 7,846,410 | | | $ | 124,688,849 | |
| | | | | | | | | | | | | | | | | | |
| 19,175,000 | | | | 750,000 | | | | 550,000 | | | | 300,000 | | | | 1,750,000 | |
$ | 7.87 | | | $ | 99.28 | | | $ | 30.83 | | | $ | 26.15 | | | $ | 71.25 | |
| | | | | | | | | | | | | | | | | | |
$ | — | | | $ | 336,482 | | | $ | — | | | $ | — | | | $ | 9,998,101 | |
$ | — | | | $ | — | | | $ | — | | | $ | — | | | $ | 7,304,054 | |
$ | 137,944,337 | | | $ | — | | | $ | — | | | $ | — | | | $ | — | |
$ | — | | | $ | — | | | $ | 18,628 | | | $ | — | | | $ | — | |
See accompanying Notes to Financial Statements.
81
ADVISORSHARES TRUST
Statements of Operations
For the Six Months Ended December 31, 2017 (Unaudited)
| | AdvisorShares
Cornerstone Small
Cap ETF | | AdvisorShares
Dorsey Wright
ADR ETF | | AdvisorShares
Focused Equity ETF |
INVESTMENT INCOME: | | | | | | | | | | | | |
Dividend Income | | $ | 23,989 | | | $ | 783,761 | | | $ | 64,787 | |
Dividend Income from Affiliates | | | — | | | | — | | | | — | |
Securities lending income (net) (Note 2) | | | 2,458 | | | | 193,474 | | | | 379 | |
Foreign withholding tax | | | — | | | | (38,699 | ) | | | — | |
Total Investment Income | | | 26,447 | | | | 938,536 | | | | 65,166 | |
| | | | | | | | | | | | |
EXPENSES: | | | | | | | | | | | | |
Advisory Fees | | | 14,626 | | | | 418,069 | | | | 43,901 | |
Accounting & Administration Fees | | | 28,973 | | | | 38,224 | | | | 20,744 | |
Professional Fees | | | 10,575 | | | | 17,682 | | | | 10,898 | |
Exchange Listing Fees | | | 7,944 | | | | 4,539 | | | | 3,705 | |
Custody Fees | | | 1,937 | | | | 5,446 | | | | 1,086 | |
Report to Shareholders | | | 3,976 | | | | 10,374 | | | | 2,462 | |
Trustee Fees | | | 2,544 | | | | 2,598 | | | | 2,546 | |
CCO Fees | | | 929 | | | | 3,069 | | | | 1,216 | |
Pricing Fees | | | 1,873 | | | | 3,094 | | | | 2,056 | |
Transfer Agent Fees | | | 169 | | | | 4,181 | | | | 472 | |
Insurance Fees | | | 119 | | | | 1,728 | | | | 308 | |
Licensing Fees | | | — | | | | 5,435 | | | | — | |
Miscellaneous Fees | | | 660 | | | | 2,328 | | | | 419 | |
Total Expenses | | | 74,325 | | | | 516,767 | | | | 89,813 | |
| | | | | | | | | | | | |
Advisory Fees Waived/Recoupment | | | (14,626 | ) | | | 132,928 | | | | (43,901 | ) |
Expense Reimbursement | | | (39,447 | ) | | | — | | | | (2,011 | ) |
Net Expenses | | | 20,252 | | | | 649,695 | | | | 43,901 | |
Net Investment Income (Loss) | | | 6,195 | | | | 288,841 | | | | 21,265 | |
| | | | | | | | | | | | |
REALIZED AND UNREALIZED GAIN (LOSS) ON: | | | | | | | | | | | | |
Net Realized Gain (Loss) on: | | | | | | | | | | | | |
Investments | | | (171,234 | ) | | | (768,565 | ) | | | 274,743 | |
Investments in Affiliates | | | — | | | | — | | | | — | |
In-Kind Redemptions | | | 416,827 | | | | 2,828,556 | | | | 513,725 | |
Foreign Currency Transactions | | | — | | | | — | | | | — | |
Net Change in Unrealized Appreciation (Depreciation) on: | | | | | | | | | | | | |
Investments | | | 227,538 | | | | 19,869,817 | | | | 349,205 | |
Foreign Currency Translations | | | — | | | | — | | | | — | |
Net Realized and Unrealized Gain (Loss) | | | 473,131 | | | | 21,929,808 | | | | 1,137,673 | |
NET INCREASE (DECREASE) IN NET ASSETS RESULTING FROM OPERATIONS | | $ | 479,326 | | | $ | 22,218,649 | | | $ | 1,158,938 | |
See accompanying Notes to Financial Statements.
82
ADVISORSHARES TRUST
Statements of Operations
For the Six Months Ended December 31, 2017 (Unaudited)
AdvisorShares
KIM Korea Equity
ETF | | AdvisorShares
Madrona
Domestic ETF | | AdvisorShares Madrona
Global Bond
ETF | | AdvisorShares
Madrona
International
ETF | | AdvisorShares
Meidell Tactical
Advantage ETF | | AdvisorShares
New Tech and
Media ETF(1) |
| | | | | | | | | | | | | | | | | | | | | | |
$ | 206,704 | | | $ | 240,219 | | | $ | 330,865 | | | $ | 140,622 | | | $ | 100,316 | | | $ | 38,663 | |
| — | | | | — | | | | 59,311 | | | | — | | | | — | | | | — | |
| — | | | | 1,581 | | | | 42,529 | | | | 11,913 | | | | 9,426 | | | | 12,288 | |
| (26,107 | ) | | | — | | | | — | | | | (10,983 | ) | | | — | | | | — | |
| 180,597 | | | | 241,800 | | | | 432,705 | | | | 141,552 | | | | 109,742 | | | | 50,951 | |
| | | | | | | | | | | | | | | | | | | | | | |
| | | | | | | | | | | | | | | | | | | | | | |
| 44,095 | | | | 111,462 | | | | 45,476 | | | | 49,166 | | | | 83,041 | | | | 79,505 | |
| 21,530 | | | | 43,399 | | | | 38,113 | | | | 37,808 | | | | 37,921 | | | | 5,341 | |
| 11,321 | | | | 12,013 | | | | 11,233 | | | | 10,946 | | | | 10,823 | | | | 30,345 | |
| 3,668 | | | | 3,284 | | | | 3,300 | | | | 3,300 | | | | 3,289 | | | | 3,542 | |
| 34,604 | | | | 5,826 | | | | 939 | | | | 740 | | | | 1,146 | | | | 2,761 | |
| 2,736 | | | | 883 | | | | 775 | | | | 868 | | | | 1,185 | | | | 5,192 | |
| 2,545 | | | | 2,595 | | | | 2,587 | | | | 2,587 | | | | 2,581 | | | | 2,071 | |
| 1,149 | | | | 1,647 | | | | 1,403 | | | | 1,243 | | | | 1,290 | | | | 1,038 | |
| 2,023 | | | | 3,164 | | | | 3,154 | | | | 3,097 | | | | 2,649 | | | | 1,959 | |
| 394 | | | | 1,045 | | | | 682 | | | | 461 | | | | 519 | | | | 994 | |
| 257 | | | | 813 | | | | 547 | | | | 354 | | | | 439 | | | | 1,255 | |
| — | | | | — | | | | — | | | | — | | | | — | | | | — | |
| 834 | | | | 1,917 | | | | 598 | | | | 675 | | | | 643 | | | | 1,529 | |
| 125,156 | | | | 188,048 | | | | 108,807 | | | | 111,245 | | | | 145,526 | | | | 135,532 | |
| | | | | | | | | | | | | | | | | | | | | | |
| (44,095 | ) | | | (13,889 | ) | | | (22,402 | ) | | | (34,424 | ) | | | (52,105 | ) | | | (22,900 | ) |
| (29,092 | ) | | | — | | | | — | | | | — | | | | — | | | | — | |
| 51,969 | | | | 174,159 | | | | 86,405 | | | | 76,821 | | | | 93,421 | | | | 112,632 | |
| 128,628 | | | | 67,641 | | | | 346,300 | | | | 64,731 | | | | 16,321 | | | | (61,681 | ) |
| | | | | | | | | | | | | | | | | | | | | | |
| | | | | | | | | | | | | | | | | | | | | | |
| | | | | | | | | | | | | | | | | | | | | | |
| 386,422 | | | | 222,870 | | | | (330 | ) | | | 262,618 | | | | 1,466,172 | | | | (2,384,468 | ) |
| — | | | | — | | | | 18,109 | | | | — | | | | — | | | | — | |
| — | | | | — | | | | — | | | | — | | | | 8,352 | | | | 609,883 | |
| (2,582 | ) | | | — | | | | — | | | | — | | | | — | | | | — | |
| | | | | | | | | | | | | | | | | | | | | | |
| 590,964 | | | | 2,437,791 | | | | 71,984 | | | | 1,333,429 | | | | (81,785 | ) | | | 618,092 | |
| (348 | ) | | | — | | | | — | | | | — | | | | — | | | | — | |
| 974,456 | | | | 2,660,661 | | | | 89,763 | | | | 1,596,047 | | | | 1,392,739 | | | | (1,156,493 | ) |
$ |
1,103,084
| | | $ | 2,728,302 | | | $ | 436,063 | | | $ | 1,660,778 | | | $ | 1,409,060 | | | $ | (1,218,174 | ) |
See accompanying Notes to Financial Statements.
83
ADVISORSHARES TRUST
Statements of Operations
For the Six Months Ended December 31, 2017 (Unaudited)
| | AdvisorShares Newfleet
Multi-Sector
Income ETF | | AdvisorShares Pacific Asset Enhanced
Floating
Rate ETF | | AdvisorShares Peritus High Yield ETF |
INVESTMENT INCOME: | | | | | | | | | | | |
Dividend Income | | $ | 32,338 | | | $ | — | | | $ | — |
Dividend Income from Affiliates | | | — | | | | — | | | | — |
Interest Income | | | 3,368,427 | | | | 623,460 | | | | 6,608,378 |
Securities lending income (net) (Note 2) | | | 3,054 | | | | 96 | | | | 92,888 |
Foreign withholding tax | | | — | | | | — | | | | — |
Total Investment Income | | | 3,403,819 | | | | 623,556 | | | | 6,701,266 |
| | | | | | | | | | | |
EXPENSES: | | | | | | | | | | | |
Advisory Fees | | | 836,291 | | | | 129,918 | | | | 897,347 |
Accounting & Administration Fees | | | 72,587 | | | | 52,003 | | | | 61,347 |
Professional Fees | | | 33,458 | | | | 12,197 | | | | 27,067 |
Exchange Listing Fees | | | 3,300 | | | | 3,191 | | | | 3,300 |
Custody Fees | | | 14,688 | | | | 4,247 | | | | 8,013 |
Report to Shareholders | | | 10,386 | | | | 890 | | | | 1,933 |
Trustee Fees | | | 3,040 | | | | 2,604 | | | | 2,925 |
CCO Fees | | | 8,709 | | | | 1,647 | | | | 6,100 |
Pricing Fees | | | 10,431 | | | | 7,722 | | | | 4,171 |
Transfer Agent Fees | | | 9,650 | | | | 1,026 | | | | 6,119 |
Insurance Fees | | | 7,789 | | | | 805 | | | | 5,200 |
Interest on Securities Sold, Not Yet Purchased | | | — | | | | — | | | | — |
Dividend Expense | | | — | | | | — | | | | — |
Miscellaneous Fees | | | 7,707 | | | | 894 | | | | 5,082 |
Total Expenses | | | 1,018,036 | | | | 217,144 | | | | 1,028,604 |
| | | | | | | | | | | |
Advisory Fees Waived/Recoupment | | | (53,084 | ) | | | (66,712 | ) | | | — |
Expense Reimbursement | | | — | | | | — | | | | — |
Net Expenses | | | 964,952 | | | | 150,432 | | | | 1,028,604 |
Net Investment Income (Loss) | | | 2,438,867 | | | | 473,124 | | | | 5,672,662 |
| | | | | | | | | | | |
REALIZED AND UNREALIZED GAIN (LOSS) ON: | | | | | | | | | | | |
Net Realized Gain (Loss) on: | | | | | | | | | | | |
Investments | | | (154,794 | ) | | | (47,409 | ) | | | 294,463 |
In-Kind Redemptions | | | — | | | | — | | | | 304,927 |
Swaps | | | — | | | | (26,574 | ) | | | — |
Short Sales | | | — | | | | — | | | | — |
Options Written | | | — | | | | — | | | | — |
Distributions by other Investment Companies | | | — | | | | — | | | | — |
Net Change in Unrealized Appreciation (Depreciation) on: | | | | | | | | | | | |
Investments | | | (98,015 | ) | | | (136,066 | ) | | | 227,379 |
Short Sales | | | — | | | | — | | | | — |
Options Written | | | — | | | | — | | | | — |
Swaps | | | — | | | | 25,429 | | | | — |
Net Realized and Unrealized Gain (Loss) | | | (252,809 | ) | | | (184,620 | ) | | | 826,769 |
NET INCREASE (DECREASE) IN NET ASSETS RESULTING FROM OPERATIONS | | $ | 2,186,058 | | | $ | 288,504 | | | $ | 6,499,431 |
See accompanying Notes to Financial Statements.
84
ADVISORSHARES TRUST
Statements of Operations
For the Six Months Ended December 31, 2017 (Unaudited)
AdvisorShares
Ranger Equity Bear
ETF
| | AdvisorShares
Sage Core
Reserves ETF | | AdvisorShares
STAR Global Buy-
Write ETF | | | | AdvisorShares
Wilshire Buyback
ETF |
| | | | | | | | | | | | | | | | | | |
$ | 153,557 | | | $ | 8,002 | | | $ | 209,421 | | | $ | 15,401 | | | $ | 1,034,250 | |
| 495,922 | | | | — | | | | — | | | | — | | | | — | |
| — | | | | 693,485 | | | | — | | | | — | | | | — | |
| — | | | | 371 | | | | — | | | | — | | | | 15,403 | |
| — | | | | — | | | | — | | | | (391 | ) | | | (2,686 | ) |
| 649,479 | | | | 701,858 | | | | 209,421 | | | | 15,010 | | | | 1,046,967 | |
| | | | | | | | | | | | | | | | | | |
| | | | | | | | | | | | | | | | | | |
| 1,300,139 | | | | 121,646 | | | | 118,540 | | | | 1,877 | | | | 601,987 | |
| 38,288 | | | | 59,046 | | | | 37,902 | | | | 125 | | | | 38,307 | |
| 26,020 | | | | 18,524 | | | | 12,190 | | | | 4,427 | | | | 26,903 | |
| 3,300 | | | | 3,441 | | | | 3,300 | | | | 359 | | | | 4,539 | |
| 6,521 | | | | 4,365 | | | | 659 | | | | 392 | | | | 9,070 | |
| 15,524 | | | | 6,100 | | | | 363 | | | | 922 | | | | 10,187 | |
| 2,917 | | | | 2,741 | | | | 2,582 | | | | 434 | | | | 2,822 | |
| 6,222 | | | | 3,469 | | | | 1,343 | | | | 194 | | | | 5,235 | |
| 4,499 | | | | 8,297 | | | | 3,509 | | | | 369 | | | | 2,825 | |
| 6,501 | | | | 3,041 | | | | 659 | | | | 23 | | | | 5,017 | |
| 5,217 | | | | 2,563 | | | | 533 | | | | 154 | | | | 4,423 | |
| 39,709 | | | | — | | | | — | | | | — | | | | — | |
| 857,560 | | | | — | | | | — | | | | — | | | | — | |
| 5,626 | | | | 2,689 | | | | 663 | | | | 194 | | | | 4,370 | |
| 2,318,043 | | | | 235,922 | | | | 182,243 | | | | 9,470 | | | | 715,685 | |
| | | | | | | | | | | | | | | | | | |
| — | | | | (94,001 | ) | | | (19,799 | ) | | | (1,877 | ) | | | (113,698 | ) |
| — | | | | — | | | | — | | | | (5,247 | ) | | | — | |
| 2,318,043 | | | | 141,921 | | | | 162,444 | | | | 2,346 | | | | 601,987 | |
| (1,668,564 | ) | | | 559,937 | | | | 46,977 | | | | 12,664 | | | | 444,980 | |
| | | | | | | | | | | | | | | | | | |
| | | | | | | | | | | | | | | | | | |
| | | | | | | | | | | | | | | | | | |
| — | | | | 3,778 | | | | (62,115 | ) | | | (2,721 | ) | | | (1,656,741 | ) |
| — | | | | — | | | | 226,445 | | | | — | | | | 11,192,025 | |
| — | | | | — | | | | — | | | | — | | | | — | |
| (14,602,185 | ) | | | — | | | | — | | | | — | | | | — | |
| — | | | | — | | | | (127,922 | ) | | | — | | | | — | |
| — | | | | — | | | | 791 | | | | — | | | | — | |
| | | | | | | | | | | | | | | | | | |
| (141,750 | ) | | | (83,895 | ) | | | 907,502 | | | | 286,896 | | | | 100,741 | |
| 2,003,368 | | | | — | | | | — | | | | — | | | | — | |
| — | | | | — | | | | (2,281 | ) | | | — | | | | — | |
| — | | | | — | | | | — | | | | — | | | | — | |
| (12,740,567 | ) | | | (80,117 | ) | | | 942,420 | | | | 284,175 | | | | 9,636,025 | |
$ |
(14,409,131
| ) | | $ | 479,820 | | | $ | 989,397 | | | $ | 296,839 | | | $ | 10,081,005 | |
See accompanying Notes to Financial Statements.
85
ADVISORSHARES TRUST
Statements of Changes in Net Assets
| | AdvisorShares Cornerstone
Small Cap ETF | | AdvisorShares Dorsey
Wright ADR ETF |
| | | Six months
ended
December 31,
2017
(Unaudited) | | | | For the period
July 6, 2016* to June 30, 2017 | | | | Six months
ended
December 31,
2017
(Unaudited) | | | | |
INCREASE (DECREASE) IN NET ASSETS | | | | | | | | | | | | | | | |
OPERATIONS | | | | | | | | | | | | | | | |
Net Investment Income (Loss) | | $ | 6,195 | | | $ | 3,030 | | | $ | 288,841 | | | $ | 430,035 |
Net Realized Gain (Loss) | | | 245,593 | | | | 252,170 | | | | 2,059,991 | | | | 126,327 |
Net Change in Unrealized Appreciation (Depreciation) | | | 227,538 | | | | 514,618 | | | | 19,869,817 | | | | 2,996,898 |
Net Increase (Decrease) In Net Assets Resulting From Operations | | | 479,326 | | | | 769,818 | | | | 22,218,649 | | | | 3,553,260 |
DISTRIBUTIONS TO SHAREHOLDERS FROM | | | | | | | | | | | | | | | |
Net Investment Income | | | (4,326 | ) | | | (2,606 | ) | | | (368,211 | ) | | | (482,641) |
Net Realized Gains | | | (96,752 | ) | | | — | | | | — | | | | — |
Total Distributions | | | (101,078 | ) | | | (2,606 | ) | | | (368,211 | ) | | | (482,641) |
CAPITAL STOCK TRANSACTIONS | | | | | | | | | | | | | | | |
Proceeds from Shares Issued | | | 2,428,788 | | | | 4,274,277 | | | | 88,360,274 | | | | 58,828,551 |
Value of Shares Redeemed | | | (2,448,590 | ) | | | (755,165 | ) | | | (6,625,477 | ) | | | (11,362,316) |
Net Increase (Decrease) From Capital Stock Transactions | | | (19,802 | ) | | | 3,519,112 | | | | 81,734,797 | | | | 47,466,235 |
Net Increase (Decrease) in
Net Assets | | | 358,446 | | | | 4,286,324 | | | | 103,585,235 | | | | 50,536,854 |
Net Assets: | | | | | | | | | | | | | | | |
Beginning of Year/Period | | | 4,286,324 | | | | — | | | | 65,184,837 | | | | 14,647,983 |
End of Year/Period | | $ | 4,644,770 | | | $ | 4,286,324 | | | $ | 168,770,072 | | | $ | 65,184,837 |
Undistributed (Accumulated) Net Investment Income (Loss) | | $ | 2,293 | | | $ | 424 | | | $ | (52,259 | ) | | $ | 27,111 |
Changes in Shares Outstanding | | | | | | | | | | | | | | | |
Shares Outstanding, Beginning of Year/Period | | | 136,476 | | | | — | | | | 1,400,000 | | | | 375,000 |
Shares Sold | | | 75,000 | | | | 161,476 | | | | 1,600,000 | | | | 1,300,000 |
Shares Repurchased | | | (75,000 | ) | | | (25,000 | ) | | | (125,000 | ) | | | (275,000) |
Shares Outstanding, End of Year/Period | | | 136,476 | | | | 136,476 | | | | 2,875,000 | | | | 1,400,000 |
See accompanying Notes to Financial Statements.
86
ADVISORSHARES TRUST
Statements of Changes in Net Assets
AdvisorShares Focused
Equity ETF | | AdvisorShares KIM Korea
Equity ETF | | AdvisorShares Madrona
Domestic ETF |
Six months ended
December 31,
2017
(Unaudited) | | For the period September 20,
2016* to June 30,
2017 | | Six months ended December 31,
2017
(Unaudited) | | For the period
September 28,
2016* to June 30, 2017 | | Six months ended
December 31,
2017
(Unaudited) | | |
| | | | | | | | | | | | | | | | | | | | | | |
| | | | | | | | | | | | | | | | | | | | | | |
$ | 21,265 | | | $ | 18,058 | | | $ | 128,628 | | | $ | 159,600 | | | $ | 67,641 | | | $ | 128,712 | |
| 788,468 | | | | (21,046 | ) | | | 383,840 | | | | 117,769 | | | | 222,870 | | | | 2,566,957 | |
|
349,205
| | | | 1,064,943 | | | | 590,616 | | | | 1,403,556 | | | | 2,437,791 | | | | 2,357,587 | |
|
1,158,938
| | | | 1,061,955 | | | | 1,103,084 | | | | 1,680,925 | | | | 2,728,302 | | | | 5,053,256 | |
| | | | | | | | | | | | | | | | | | | | | | |
| (38,174 | ) | | | (2,637 | ) | | | (244,793 | ) | | | (37,280 | ) | | | (101,602 | ) | | | (174,323 | ) |
| — | | | | — | | | | (295,337 | ) | | | — | | | | — | | | | — | |
| (38,174 | ) | | | (2,637 | ) | | | (540,130 | ) | | | (37,280 | ) | | | (101,602 | ) | | | (174,323 | ) |
| | | | | | | | | | | | | | | | | | | | | | |
| 2,342,709 | | | | 11,090,289 | | | | — | | | | 8,316,033 | | | | — | | | | 5,659,351 | |
| (2,349,193 | ) | | | — | | | | — | | | | — | | | | — | | | | (11,247,204 | ) |
|
(6,484
| ) | | | 11,090,289 | | | | — | | | | 8,316,033 | | | | — | | | | (5,587,853 | ) |
|
1,114,280
| | | | 12,149,607 | | | | 562,954 | | | | 9,959,678 | | | | 2,626,700 | | | | (708,920 | ) |
| | | | | | | | | | | | | | | | | | | | | | |
| 12,149,607 | | | | — | | | | 9,959,678 | | | | — | | | | 26,736,380 | | | | 27,445,300 | |
$ | 13,263,887 | | | $ | 12,149,607 | | | $ | 10,522,632 | | | $ | 9,959,678 | | | $ | 29,363,080 | | | $ | 26,736,380 | |
$ |
(1,488
| ) | | $ | 15,421 | | | $ | (25,735 | ) | | $ | 90,430 | | | $ | 5,099 | | | $ | 39,060 | |
| | | | | | | | | | | | | | | | | | | | | | |
|
425,000
| | | | — | | | | 350,000 | | | | — | | | | 550,000 | | | | 675,000 | |
| 75,000 | | | | 425,000 | | | | — | | | | 350,000 | | | | — | | | | 125,000 | |
| (75,000 | ) | | | — | | | | — | | | | — | | | | — | | | | (250,000 | ) |
| 425,000 | | | | 425,000 | | | | 350,000 | | | | 350,000 | | | | 550,000 | | | | 550,000 | |
See accompanying Notes to Financial Statements.
87
ADVISORSHARES TRUST
Statements of Changes in Net Assets
| | AdvisorShares Madrona
Global Bond ETF | | AdvisorShares Madrona
International ETF |
| | Six months ended
December 31,
2017
(Unaudited) | | | | Six months ended
December 31,
2017
(Unaudited) | | |
INCREASE (DECREASE) IN NET ASSETS | | | | | | | | | | | | | | | |
OPERATIONS | | | | | | | | | | | | | | | |
Net Investment Income (Loss) | | $ | 346,300 | | | $ | 598,952 | | | $ | 64,731 | | | $ | 196,314 |
Net Realized Gain (Loss) | | | 17,779 | | | | 92,189 | | | | 262,618 | | | | 1,225,746 |
Net Change in Unrealized Appreciation (Depreciation) | | | 71,984 | | | | 60,524 | | | | 1,333,429 | | | | 1,556,958 |
Net Increase (Decrease) In Net Assets Resulting From Operations | | | 436,063 | | | | 751,665 | | | | 1,660,778 | | | | 2,979,018 |
DISTRIBUTIONS TO SHAREHOLDERS FROM | | | | | | | | | | | | | | | |
Net Investment Income | | | (363,497 | ) | | | (591,272 | ) | | | (158,733 | ) | | | (306,516) |
Total Distributions | | | (363,497 | ) | | | (591,272 | ) | | | (158,733 | ) | | | (306,516) |
CAPITAL STOCK TRANSACTIONS | | | | | | | | | | | | | | | |
Proceeds from Shares Issued | | | 1,299,426 | | | | 1,933,092 | | | | 759,564 | | | | — |
Value of Shares Redeemed | | | — | | | | (5,114,905 | ) | | | — | | | | (6,432,777) |
Net Increase (Decrease) From Capital Stock Transactions | | | 1,299,426 | | | | (3,181,813 | ) | | | 759,564 | | | | (6,432,777) |
Net Increase (Decrease) in
Net Assets | | | 1,371,992 | | | | (3,021,420 | ) | | | 2,261,609 | | | | (3,760,275) |
Net Assets: | | | | | | | | | | | | | | | |
Beginning of Year/Period | | | 17,466,212 | | | | 20,487,632 | | | | 10,902,092 | | | | 14,662,367 |
End of Year/Period | | $ | 18,838,204 | | | $ | 17,466,212 | | | $ | 13,163,701 | | | $ | 10,902,092 |
Undistributed (Accumulated) Net Investment Income (Loss) | | $ | 58 | | | $ | 17,255 | | | $ | 11,680 | | | $ | 105,682 |
Changes in Shares Outstanding | | | | | | | | | | | | | | | |
Shares Outstanding, Beginning of Year/Period | | | 675,000 | | | | 800,000 | | | | 400,000 | | | | 650,000 |
Shares Sold | | | 50,000 | | | | 75,000 | | | | 25,000 | | | | — |
Shares Repurchased | | | — | | | | (200,000 | ) | | | — | | | | (250,000) |
Shares Outstanding, End of Year/Period | | | 725,000 | | | | 675,000 | | | | 425,000 | | | | 400,000 |
See accompanying Notes to Financial Statements.
88
ADVISORSHARES TRUST
Statements of Changes in Net Assets
AdvisorShares Meidell
Tactical Advantage ETF | | AdvisorShares New Tech and Media ETF | | AdvisorShares Newfleet
Multi-Sector Income ETF |
Six months ended
December 31,
2017
(Unaudited) | | | | For the period
July 11, 2017* to
December 31, 2017 | | Six months ended
December 31,
2017
(Unaudited) | | |
| | | | | | | | | | | | | | | | | | |
| | | | | | | | | | | | | | | | | | |
$ | 16,321 | | | $ | 3,044 | | | $ | (61,681 | ) | | $ | 2,438,867 | | | $ | 4,000,339 | |
| 1,474,524 | | | | 2,400,265 | | | | (1,774,585 | ) | | | (154,794 | ) | | | 426,691 | |
|
(81,785
| ) | | | (331,296 | ) | | | 618,092 | | | | (98,015 | ) | | | 1,504,734 | |
|
1,409,060
| | | | 2,072,013 | | | | (1,218,174 | ) | | | 2,186,058 | | | | 5,931,764 | |
| | | | | | | | | | | | | | | | | | |
| — | | | | — | | | | — | | | | (3,213,983 | ) | | | (6,793,358 | ) |
| — | | | | — | | | | — | | | | (3,213,983 | ) | | | (6,793,358 | ) |
| | | | | | | | | | | | | | | | | | |
| — | | | | — | | | | 58,280,088 | | | | 12,188,858 | | | | 14,641,846 | |
| (756,403 | ) | | | (7,097,975 | ) | | | (5,078,608 | ) | | | (70,470,091 | ) | | | (17,038,617 | ) |
|
(756,403
| ) | | | (7,097,975 | ) | | | 53,201,480 | | | | (58,281,233 | ) | | | (2,396,771 | ) |
|
652,657
| | | | (5,025,962 | ) | | | 51,983,306 | | | | (59,309,158 | ) | | | (3,258,365 | ) |
| | | | | | | | | | | | | | | | | | |
| 13,613,291 | | | | 18,639,253 | | | | — | | | | 258,005,123 | | | | 261,263,488 | |
$ | 14,265,948 | | | $ | 13,613,291 | | | $ | 51,983,306 | | | $ | 198,695,965 | | | $ | 258,005,123 | |
$ |
4,451
| | | $ | (11,870 | ) | | $ | (61,681 | ) | | $ | (665,769 | ) | | $ | 109,347 | |
| | | | | | | | | | | | | | | | | | |
|
450,000
| | | | 700,000 | | | | — | | | | 5,300,000 | | | | 5,350,000 | |
| — | | | | — | | | | 2,650,000 | | | | 250,000 | | | | 300,000 | |
| (25,000 | ) | | | (250,000 | ) | | | (225,000 | ) | | | (1,450,000 | ) | | | (350,000 | ) |
| 425,000 | | | | 450,000 | | | | 2,425,000 | | | | 4,100,000 | | | | 5,300,000 | |
See accompanying Notes to Financial Statements.
89
ADVISORSHARES TRUST
Statements of Changes in Net Assets
| | AdvisorShares Pacific Asset
Enhanced Floating Rate ETF | | AdvisorShares Peritus
High Yield ETF |
| | Six months ended December 31,
2017
(Unaudited) | | | | Six months ended December 31,
2017
(Unaudited) | | |
INCREASE (DECREASE) IN NET ASSETS | | | | | | | | | | | | | | | |
OPERATIONS | | | | | | | | | | | | | | | |
Net Investment Income (Loss) | | $ | 473,124 | | | $ | 951,281 | | | $ | 5,672,662 | | | $ | 14,823,876 |
Net Realized Gain (Loss) | | | (73,983 | ) | | | 40,296 | | | | 599,390 | | | | (12,085,801) |
Net Change in Unrealized Appreciation (Depreciation) | | | (110,637 | ) | | | 280,261 | | | | 227,379 | | | | 26,430,170 |
Net Increase (Decrease) In Net Assets Resulting From Operations | | | 288,504 | | | | 1,271,838 | | | | 6,499,431 | | | | 29,168,245 |
DISTRIBUTIONS TO SHAREHOLDERS FROM | | | | | | | | | | | | | | | |
Net Investment Income | | | (438,229 | ) | | | (929,104 | ) | | | (5,943,701 | ) | | | (13,874,887) |
Total Distributions | | | (438,229 | ) | | | (929,104 | ) | | | (5,943,701 | ) | | | (13,874,887) |
CAPITAL STOCK TRANSACTIONS | | | | | | | | | | | | | | | |
Proceeds from Shares Issued | | | — | | | | — | | | | — | | | | — |
Value of Shares Redeemed | | | — | | | | — | | | | (16,523,685 | ) | | | (47,084,275) |
Net Increase (Decrease) From Capital Stock Transactions | | | — | | | | — | | | | (16,523,685 | ) | | | (47,084,275) |
Net Increase (Decrease) in
Net Assets | | | (149,725 | ) | | | 342,734 | | | | (15,967,955 | ) | | | (31,790,917) |
Net Assets: | | | | | | | | | | | | | | | |
Beginning of Year/Period | | | 27,143,067 | | | | 26,800,333 | | | | 169,809,942 | | | | 201,600,859 |
End of Year/Period | | $ | 26,993,342 | | | $ | 27,143,067 | | | $ | 153,841,987 | | | $ | 169,809,942 |
Undistributed (Accumulated) Net Investment Income (Loss) | | $ | 53,658 | | | $ | 18,763 | | | $ | 42,043 | | | $ | 313,082 |
Changes in Shares Outstanding | | | | | | | | | | | | | | | |
Shares Outstanding, Beginning of Year/Period | | | 550,000 | | | | 550,000 | | | | 4,650,000 | | | | 5,950,000 |
Shares Sold | | | — | | | | — | | | | — | | | | — |
Shares Repurchased | | | — | | | | — | | | | (450,000 | ) | | | (1,300,000) |
Shares Outstanding, End of Year/Period | | | 550,000 | | | | 550,000 | | | | 4,200,000 | | | | 4,650,000 |
See accompanying Notes to Financial Statements.
90
ADVISORSHARES TRUST
Statements of Changes in Net Assets
AdvisorShares Ranger
Equity Bear ETF | | AdvisorShares Sage
Core Reserves ETF | | AdvisorShares STAR
Global Buy-Write ETF |
Six months ended December 31,
2017
(Unaudited) | | | | Six months ended December 31,
2017
(Unaudited) | | | | Six months ended December 31,
2017
(Unaudited) | | |
| | | | | | | | | | | | | | | | | | | | | |
| | | | | | | | | | | | | | | | | | | | | |
$ | (1,668,564 | ) | | $ | (3,963,360 | ) | | $ | 559,937 | | | $ | 887,673 | | | $ | 46,977 | | | $ | 55,257 |
| (14,602,185 | ) | | | (28,449,687 | ) | | | 3,778 | | | | 13,815 | | | | 37,199 | | | | 664,566 |
|
1,861,618
| | | | (7,383,569 | ) | | | (83,895 | ) | | | 79,076 | | | | 905,221 | | | | 932,693 |
|
(14,409,131
| ) | | | (39,796,616 | ) | | | 479,820 | | | | 980,564 | | | | 989,397 | | | | 1,652,516 |
| | | | | | | | | | | | | | | | | | | | | |
| — | | | | — | | | | (585,136 | ) | | | (973,996 | ) | | | — | | | | (140,175) |
| — | | | | — | | | | (585,136 | ) | | | (973,996 | ) | | | — | | | | (140,175) |
| | | | | | | | | | | | | | | | | | | | | |
| 20,821,329 | | | | 82,749,313 | | | | — | | | | 12,428,209 | | | | — | | | | 4,985,784 |
| (30,091,139 | ) | | | (82,395,823 | ) | | | (9,951,452 | ) | | | (39,777,832 | ) | | | (1,508,109 | ) | | | (6,421,545) |
|
(9,269,810
| ) | | | 353,490 | | | | (9,951,452 | ) | | | (27,349,623 | ) | | | (1,508,109 | ) | | | (1,435,761) |
|
(23,678,941
| ) | | | (39,443,126 | ) | | | (10,056,768 | ) | | | (27,343,055 | ) | | | (518,712 | ) | | | 76,580 |
| | | | | | | | | | | | | | | | | | | | | |
| 174,504,417 | | | | 213,947,543 | | | | 84,519,369 | | | | 111,862,424 | | | | 17,476,511 | | | | 17,399,931 |
$ | 150,825,476 | | | $ | 174,504,417 | | | $ | 74,462,601 | | | $ | 84,519,369 | | | $ | 16,957,799 | | | $ | 17,476,511 |
$ |
(3,142,599
| ) | | $ | (1,474,035 | ) | | $ | (5,986 | ) | | $ | 19,213 | | | $ | 46,977 | | | $ | — |
| | | | | | | | | | | | | | | | | | | | | |
|
20,375,000
| | | | 20,175,000 | | | | 850,000 | | | | 1,125,000 | | | | 600,000 | | | | 650,000 |
| 2,450,000 | | | | 8,925,000 | | | | — | | | | 125,000 | | | | — | | | | 175,000 |
| (3,650,000 | ) | | | (8,725,000 | ) | | | (100,000 | ) | | | (400,000 | ) | | | (50,000 | ) | | | (225,000) |
| 19,175,000 | | | | 20,375,000 | | | | 750,000 | | | | 850,000 | | | | 550,000 | | | | 600,000 |
See accompanying Notes to Financial Statements.
91
ADVISORSHARES TRUST
Statements of Changes in Net Assets
| | | | AdvisorShares Wilshire
Buyback ETF |
| | For the period December 12,
2017* to
December 31,
2017 | | Six months ended
December 31,
2017
(Unaudited) | | |
INCREASE (DECREASE) IN NET ASSETS | | | | | | | | | | | | |
OPERATIONS | | | | | | | | | | | | |
Net Investment Income (Loss) | | $ | 12,664 | | | $ | 444,980 | | | $ | 1,121,853 | |
Net Realized Gain (Loss) | | | (2,721 | ) | | | 9,535,284 | | | | 15,382,803 | |
Net Change in Unrealized Appreciation (Depreciation) | | | 286,896 | | | | 100,741 | | | | 10,498,238 | |
Net Increase (Decrease) In Net Assets Resulting From Operations | | | 296,839 | | | | 10,081,005 | | | | 27,002,894 | |
DISTRIBUTIONS TO SHAREHOLDERS FROM | | | | | | | | | | | | |
Net Investment Income | | | (13,431 | ) | | | (815,430 | ) | | | (1,650,149 | ) |
Total Distributions | | | (13,431 | ) | | | (815,430 | ) | | | (1,650,149 | ) |
CAPITAL STOCK TRANSACTIONS | | | | | | | | | | | | |
Proceeds from Shares Issued | | | 7,563,002 | | | | 67,081,677 | | | | 104,180,597 | |
Value of Shares Redeemed | | | — | | | | (94,057,923 | ) | | | (142,703,816 | ) |
Net Increase (Decrease) From Capital Stock Transactions | | | 7,563,002 | | | | (26,976,246 | ) | | | (38,523,219 | ) |
Net Increase (Decrease) in Net Assets | | | 7,846,410 | | | | (17,710,671 | ) | | | (13,170,474 | ) |
Net Assets: | | | | | | | | | | | | |
Beginning of Year/Period | | | — | | | | 142,399,520 | | | | 155,569,994 | |
End of Year/Period | | $ | 7,846,410 | | | $ | 124,688,849 | | | $ | 142,399,520 | |
Undistributed (Accumulated) Net Investment Income (Loss) | | $ | (767 | ) | | $ | 52,328 | | | $ | 422,778 | |
Changes in Shares Outstanding | | | | | | | | | | | | |
Shares Outstanding, Beginning of Year/Period | | | — | | | | 2,150,000 | | | | 2,800,000 | |
Shares Sold | | | 300,000 | | | | 1,000,000 | | | | 1,675,000 | |
Shares Repurchased | | | — | | | | (1,400,000 | ) | | | (2,325,000 | ) |
Shares Outstanding, End of Year/Period | | | 300,000 | | | | 1,750,000 | | | | 2,150,000 | |
See accompanying Notes to Financial Statements.
92
This page intentionally left blank.
93
ADVISORSHARES TRUST
Financial Highlights
| | AdvisorShares Cornerstone
Small Cap ETF |
| |
Six months ended December 31,
2017
(Unaudited)
| | For the period
July 6, 2016* to
June 30, 2017 |
Selected Data for a Share of Capital Stock Outstanding | | | | | | | | |
Net Asset Value, Beginning of Year/Period | | $ | 31.41 | | | $ | 25.15 | |
Investment Operations | | | | | | | | |
Net Investment Income (Loss)(1) | | | 0.05 | | | | 0.03 | |
Net Realized and Unrealized Gain (Loss) | | | 3.31 | | | | 6.26 | |
Distributions of Net Realized Gains by other investment companies | | | — | | | | — | |
Net Increase (Decrease) in Net Assets Resulting from Investment Operations(3) | | | 3.36 | | | | 6.29 | |
Distributions from Net Investment Income | | | (0.03 | ) | | | (0.03 | ) |
Distributions from Realized Capital Gains | | | (0.71 | ) | | | — | |
Total Distributions | | | (0.74 | ) | | | (0.03 | ) |
Net Asset Value, End of Year/Period | | $ | 34.03 | | | $ | 31.41 | |
Market Value, End of Year/Period | | $ | 34.04 | | | $ | 31.40 | |
| | | | | | | | |
Total Return | | | | | | | | |
Total Investment Return Based on Net Asset Value(4) | | | 10.70 | % | | | 25.00 | % |
Total Investment Return Based on Market(4) | | | 10.77 | % | | | 24.98 | % |
Ratios/Supplemental Data | | | | | | | | |
Net Assets, End of Year/Period (000’s omitted) | | $ | 4,645 | | | $ | 4,286 | |
Ratio to Average Net Assets of: | | | | | | | | |
Expenses, net of expense waivers and reimbursements(5) | | | 0.90 | % | | | 0.90 | % |
Expenses, prior to expense waivers and reimbursements(5) | | | 3.30 | % | | | 3.91 | % |
Net Investment Income (Loss)(5) | | | 0.28 | % | | | 0.09 | % |
Portfolio Turnover Rate(7) | | | 47 | % | | | 93 | % |
See accompanying Notes to Financial Statements.
94
ADVISORSHARES TRUST
Financial Highlights
AdvisorShares Dorsey Wright ADR ETF | | AdvisorShares Focused
Equity ETF |
Six months
ended
December 31,
2017
(Unaudited) | | | | | | | | | | | | Six months ended
December 31,
2017
(Unaudited) | | For the period
September 20,
2016* to
June 30, 2017 |
| | | | | | | | | | | | | | | | | | | | | | | | | | | | | | | |
$ | 46.56 | | | $ | 39.06 | | | | $ | 38.86 | | | $ | 38.95 | | | $ | 32.65 | | | $ | 28.72 | | | $ | 28.59 | | | $ | 25.00 | |
| | | | | | | | | | | | | | | | | | | | | | | | | | | | | | | |
| 0.14 | | | | 0.68 | | | | | 0.17 | | | | 0.34 | | | | 0.18 | | | | 0.11 | | | | 0.05 | | | | 0.06 | |
| 12.13 | | | | 7.27 | | | | | 0.23 | | | | (0.20 | ) | | | 6.29 | | | | 3.99 | | | | 2.66 | | | | 3.54 | |
| — | | | | — | | | | | — | | | | — | | | | — | | | | 0.00 | (2) | | | — | | | | — | |
| 12.27 | | | | 7.95 | | | | | 0.40 | | | | 0.14 | | | | 6.47 | | | | 4.10 | | | | 2.71 | | | | 3.60 | |
| (0.13 | ) | | | (0.45 | ) | | | | (0.20 | ) | | | (0.23 | ) | | | (0.17 | ) | | | (0.17 | ) | | | (0.09 | ) | | | (0.01 | ) |
| — | | | | — | | | | | — | | | | — | | | | — | | | | — | | | | — | | | | — | |
| (0.13 | ) | | | (0.45 | ) | | | | (0.20 | ) | | | (0.23 | ) | | | (0.17 | ) | | | (0.17 | ) | | | (0.09 | ) | | | (0.01 | ) |
$ | 58.70 | | | $ | 46.56 | | | | $ | 39.06 | | | $ | 38.86 | | | $ | 38.95 | | | $ | 32.65 | | | $ | 31.21 | | | $ | 28.59 | |
$ | 58.81 | | | $ | 46.61 | | | | $ | 39.06 | | | $ | 38.77 | | | $ | 38.93 | | | $ | 32.63 | | | $ | 31.31 | | | $ | 28.59 | |
| | | | | | | | | | | | | | | | | | | | | | | | | | | | | | | |
| | | | | | | | | | | | | | | | | | | | | | | | | | | | | | | |
| 26.36 | % | | | 20.43 | % | | | | 1.05 | % | | | 0.36 | % | | | 19.85 | % | | | 14.30 | % | | | 9.49 | % | | | 14.39 | % |
| 26.46 | % | | | 20.55 | % | | | | 1.27 | % | | | 0.19 | % | | | 19.85 | % | | | 14.29 | % | | | 9.83 | % | | | 14.40 | % |
| | | | | | | | | | | | | | | | | | | | | | | | | | | | | | | |
$ | 168,770 | | | $ | 65,185 | | | | $ | 14,648 | | | $ | 15,543 | | | $ | 12,660 | | | $ | 7,346 | | | $ | 13,264 | | | $ | 12,150 | |
| | | | | | | | | | | | | | | | | | | | | | | | | | | | | | | |
| 1.17 | % | | | 1.25 | % | | | | 1.25 | % | | | 1.25 | % | | | 1.25 | % | | | 1.25 | % | | | 0.70 | % | | | 0.75 | % |
| 0.93 | % | | | 1.43 | % | | | | 1.62 | % | | | 1.63 | % | | | 1.67 | % | | | 2.52 | % | | | 1.43 | % | | | 2.04 | % |
| 0.52 | % | | | 1.55 | % | | | | 0.44 | % | | | 0.88 | % | | | 0.50 | % | | | 0.36 | % | | | 0.34 | % | | | 0.28 | % |
| 15 | % | | | 108 | % | (8) | | | 25 | % | | | 27 | % | | | 24 | % | | | 38 | % | | | 26 | % | | | 36 | % |
See accompanying Notes to Financial Statements.
95
ADVISORSHARES TRUST
Financial Highlights
| | AdvisorShares KIM Korea
Equity ETF |
| | Six months
ended
December 31,
2017
(Unaudited) | | For the period
September 28,
2016* to
June 30,
2017 |
Selected Data for a Share of Capital Stock Outstanding | | | | | | | | |
Net Asset Value, Beginning of Year/Period | | $ | 28.46 | | | $ | 25.00 | |
Investment Operations | | | | | | | | |
Net Investment Income (Loss)(1) | | | 0.37 | | | | 0.56 | |
Net Realized and Unrealized Gain (Loss) | | | 2.77 | | | | 3.01 | |
Distributions of Net Realized Gains by other investment companies | | | — | | | | — | |
Net Increase (Decrease) in Net Assets Resulting from Investment Operations(3) | | | 3.14 | | | | 3.57 | |
Distributions from Net Investment Income | | | (0.70 | ) | | | (0.11 | ) |
Distributions from Realized Capital Gains | | | (0.84 | ) | | | — | |
Total Distributions | | | (1.54 | ) | | | (0.11 | ) |
Net Asset Value, End of Year/Period | | $ | 30.06 | | | $ | 28.46 | |
Market Value, End of Year/Period | | $ | 30.52 | | | $ | 28.54 | |
| | | | | | | | |
Total Return | | | | | | | | |
Total Investment Return Based on Net Asset Value(4) | | | 11.13 | % | | | 14.40 | % |
Total Investment Return Based on Market(4) | | | 12.35 | % | | | 14.73 | % |
Ratios/Supplemental Data | | | | | | | | |
Net Assets, End of Year/Period (000’s omitted) | | $ | 10,523 | | | $ | 9,960 | |
Ratio to Average Net Assets of: | | | | | | | | |
Expenses, net of expense waivers and reimbursements(5) | | | 0.99 | % | | | 0.99 | % |
Expenses, prior to expense waivers and reimbursements(5) | | | 2.38 | % | | | 2.37 | % |
Net Investment Income (Loss)(5) | | | 2.45 | % | | | 2.93 | % |
Portfolio Turnover Rate(7) | | | 55 | % | | | 69 | % |
See accompanying Notes to Financial Statements.
96
ADVISORSHARES TRUST
Financial Highlights
AdvisorShares Madrona
Domestic ETF |
Six months
ended
December 31,
2017
(Unaudited) | | | | | | | | | | |
| | | | | | | | | | | | | | | | | | | | | | |
$ | 48.61 | | | $ | 40.66 | | | $ | 43.55 | | | $ | 41.26 | | | $ | 32.34 | | | $ | 25.31 | |
| | | | | | | | | | | | | | | | | | | | | | |
| 0.12 | | | | 0.21 | | | | 0.23 | | | | 0.13 | | | | 0.11 | | | | 0.15 | |
| 4.84 | | | | 8.04 | | | | (2.97 | ) | | | 2.30 | | | | 8.91 | | | | 7.01 | |
| — | | | | 0.00 (2 | ) | | | — | | | | — | | | | — | | | | — | |
| 4.96 | | | | 8.25 | | | | (2.74 | ) | | | 2.43 | | | | 9.02 | | | | 7.16 | |
| (0.18 | ) | | | (0.30 | ) | | | (0.15 | ) | | | (0.14 | ) | | | (0.10 | ) | | | (0.13 | ) |
| — | | | | — | | | | — | | | | — | | | | — | | | | — | |
| (0.18 | ) | | | (0.30 | ) | | | (0.15 | ) | | | (0.14 | ) | | | (0.10 | ) | | | (0.13 | ) |
$ | 53.39 | | | $ | 48.61 | | | $ | 40.66 | | | $ | 43.55 | | | $ | 41.26 | | | $ | 32.34 | |
$ | 53.51 | | | $ | 48.62 | | | $ | 40.67 | | | $ | 43.55 | | | $ | 41.26 | | | $ | 32.34 | |
| | | | | | | | | | | | | | | | | | | | | | |
| | | | | | | | | | | | | | | | | | | | | | |
| 10.20 | % | | | 20.36 | % | | | (6.29 | )% | | | 5.89 | % | | | 27.93 | % | | | 28.37 | % |
| 10.44 | % | | | 20.36 | % | | | (6.26 | )% | | | 5.89 | % | | | 27.93 | % | | | 28.52 | % |
| | | | | | | | | | | | | | | | | | | | | | |
$ | 29,363 | | | $ | 26,736 | | | $ | 27,445 | | | $ | 31,574 | | | $ | 24,755 | | | $ | 18,593 | |
| | | | | | | | | | | | | | | | | | | | | | |
| 1.25 | % | | | 1.25 | % | | | 1.25 | % | | | 1.25 | % | | | 1.25 | % | | | 1.25 | % |
| 1.35 | % | | | 1.37 | % | | | 1.32 | % | | | 1.37 | % | | | 1.42 | % | | | 1.61 | % |
| 0.49 | % | | | 0.48 | % | | | 0.57 | % | | | 0.30 | % | | | 0.31 | % | | | 0.51 | % |
| 15 | % | | | 62 | % | | | 53 | % | | | 15 | % | | | 14 | % | | | 33 | % |
See accompanying Notes to Financial Statements.
97
ADVISORSHARES TRUST
Financial Highlights
| | AdvisorShares Madrona
Global Bond ETF |
| | Six months
ended
December 31,
2017 (Unaudited) | | | | | | | | | | |
Selected Data for a Share of Capital Stock Outstanding | | | | | | | | | | | | | | | | | | | | | | | | |
Net Asset Value, Beginning of Year/Period | | $ | 25.88 | | | $ | 25.61 | | | $ | 24.97 | | | $ | 26.36 | | | $ | 25.05 | | | $ | 25.69 | |
Investment Operations | | | | | | | | | | | | | | | | | | | | | | | | |
Net Investment Income (Loss)(1) | | | 0.50 | | | | 0.81 | | | | 0.75 | | | | 0.74 | | | | 0.86 | | | | 0.72 | |
Net Realized and Unrealized Gain (Loss) | | | 0.12 | | | | 0.25 | | | | 0.59 | | | | (1.39 | ) | | | 1.30 | | | | (0.66 | ) |
Distributions of Net Realized Gains by other investment companies | | | — | | | | 0.01 | | | | 0.06 | | | | 0.04 | | | | — | | | | 0.01 | |
Net Increase (Decrease) in Net Assets Resulting from Investment Operations(3) | | | 0.62 | | | | 1.07 | | | | 1.40 | | | | (0.61 | ) | | | 2.16 | | | | 0.07 | |
Distributions from Net Investment Income | | | (0.52 | ) | | | (0.80 | ) | | | (0.76 | ) | | | (0.78 | ) | | | (0.85 | ) | | | (0.71 | ) |
Distributions from Realized Capital Gains | | | — | | | | — | | | | — | | | | — | | | | — | | | | (0.00 | )(2) |
Total Distributions | | | (0.52 | ) | | | (0.80 | ) | | | (0.76 | ) | | | (0.78 | ) | | | (0.85 | ) | | | (0.71 | ) |
Net Asset Value, End of Year/Period | | $ | 25.98 | | | $ | 25.88 | | | $ | 25.61 | | | $ | 24.97 | | | $ | 26.36 | | | $ | 25.05 | |
Market Value, End of Year/Period | | $ | 25.89 | | | $ | 25.89 | | | $ | 25.62 | | | $ | 24.96 | | | $ | 26.42 | | | $ | 24.96 | |
| | | | | | | | | | | | | | | | | | | | | | | | |
Total Return | | | | | | | | | | | | | | | | | | | | | | | | |
Total Investment Return Based on Net Asset Value(4) | | | 2.45 | % | | | 4.23 | % | | | 5.76 | % | | | (2.37 | )% | | | 8.80 | % | | | 0.20 | % |
Total Investment Return Based on Market(4) | | | 2.02 | % | | | 4.24 | % | | | 5.84 | % | | | (2.63 | )% | | | 9.44 | % | | | (0.13 | )% |
Ratios/Supplemental Data | | | | | | | | | | | | | | | | | | | | | | | | |
Net Assets, End of Year/Period (000’s
omitted) | | $ | 18,838 | | | $ | 17,466 | | | $ | 20,488 | | | $ | 28,096 | | | $ | 24,383 | | | $ | 22,543 | |
Ratio to Average Net Assets of: | | | | | | | | | | | | | | | | | | | | | | | | |
Expenses, net of expense waivers and reimbursements(5) | | | 0.95 | % | | | 0.95 | % | | | 0.95 | % | | | 0.95 | % | | | 0.95 | % | | | 0.95 | % |
Expenses, prior to expense waivers and reimbursements(5) | | | 1.20 | % | | | 1.20 | % | | | 1.05 | % | | | 0.99 | % | | | 1.07 | % | | | 1.02 | % |
Net Investment Income (Loss)(5) | | | 3.81 | % | | | 3.15 | % | | | 3.01 | % | | | 2.88 | % | | | 3.36 | % | | | 2.73 | % |
Portfolio Turnover Rate(7) | | | 6 | % | | | 21 | % | | | 24 | % | | | 34 | % | | | 20 | % | | | 28 | % |
See accompanying Notes to Financial Statements.
98
ADVISORSHARES TRUST
Financial Highlights
AdvisorShares Madrona
International ETF |
Six months ended December 31,
2017
(Unaudited) | | | | | | | | | | |
|
| | | | | | | | | | | | | | | | | | | | | |
$ | 27.26 | | | $ | 22.56 | | | $ | 27.66 | | | $ | 29.66 | | | $ | 23.97 | | | $ | 21.06 | |
| | | | | | | | | | | | | | | | | | | | | | |
| 0.16 | | | | 0.36 | | | | 0.41 | | | | 0.39 | | | | 0.41 | | | | 0.39 | |
| 3.92 | | | | 4.85 | | | | (5.17 | ) | | | (1.92 | ) | | | 5.77 | | | | 2.82 | |
|
—
| | | | 0.00 | (2) | | | — | | | | — | | | | — | | | | — | |
|
4.08
| | | | 5.21 | | | | (4.76 | ) | | | (1.53 | ) | | | 6.18 | | | | 3.21 | |
| (0.37 | ) | | | (0.51 | ) | | | (0.34 | ) | | | (0.47 | ) | | | (0.49 | ) | | | (0.30 | ) |
| — | | | | — | | | | — | | | | — | | | | — | | | | — | |
| (0.37 | ) | | | (0.51 | ) | | | (0.34 | ) | | | (0.47 | ) | | | (0.49 | ) | | | (0.30 | ) |
$ | 30.97 | | | $ | 27.26 | | | $ | 22.56 | | | $ | 27.66 | | | $ | 29.66 | | | $ | 23.97 | |
$ | 30.97 | | | $ | 27.25 | | | $ | 22.56 | | | $ | 27.65 | | | $ | 29.58 | | | $ | 23.95 | |
| | | | | | | | | | | | | | | | | | | | | | |
| | | | | | | | | | | | | | | | | | | | | | |
|
15.02
| % | | | 23.36 | % | | | (17.32 | )% | | | (5.06 | )% | | | 25.91 | % | | | 15.24 | % |
| 15.02 | % | | | 23.31 | % | | | (17.25 | )% | | | (4.82 | )% | | | 25.64 | % | | | 14.86 | % |
| | | | | | | | | | | | | | | | | | | | | | |
$ |
13,164
| | | $ | 10,902 | | | $ | 14,662 | | | $ | 19,365 | | | $ | 19,279 | | | $ | 14,978 | |
| | | | | | | | | | | | | | | | | | | | | | |
|
1.25
| % | | | 1.25 | % | | | 1.25 | % | | | 1.25 | % | | | 1.25 | % | | | 1.25 | % |
|
1.81
| % | | | 1.80 | % | | | 1.62 | % | | | 1.69 | % | | | 1.55 | % | | | 1.65 | % |
| 1.05 | % | | | 1.43 | % | | | 1.69 | % | | | 1.41 | % | | | 1.48 | % | | | 1.65 | % |
| 19 | % | | | 186 | % | | | 196 | % | | | 85 | % | | | 182 | % | | | 93 | % |
See accompanying Notes to Financial Statements.
99
ADVISORSHARES TRUST
Financial Highlights
| |
AdvisorShares Meidell
Tactical Advantage ETF
|
| |
Six months
ended
December 31,
2017 (Unaudited)
| | | | | | | | | | |
Selected Data for a Share of Capital Stock Outstanding | | | | | | | | | | | | | | | | | | | | | | | | |
Net Asset Value, Beginning of Year/Period | | $ | 30.25 | | | $ | 26.63 | | | $ | 30.86 | | | $ | 30.00 | | | $ | 28.33 | | | $ | 25.12 | |
Investment Operations | | | | | | | | | | | | | | | | | | | | | | | | |
Net Investment Income (Loss)(1) | | | 0.04 | | | | 0.01 | | | | (0.07 | ) | | | 0.17 | | | | 0.14 | | | | 0.14 | |
Net Realized and Unrealized Gain (Loss) | | | 3.28 | | | | 3.61 | | | | (4.07 | ) | | | 0.87 | | | | 1.53 | | | | 3.30 | |
Distributions of Net Realized Gains by other investment companies | | | — | | | | — | | | | 0.01 | | | | — | | | | — | | | | — | |
Net Increase (Decrease) in Net Assets Resulting from Investment Operations(3) | | | 3.32 | | | | 3.62 | | | | (4.13 | ) | | | 1.04 | | | | 1.67 | | | | 3.44 | |
Distributions from Net Investment Income | | | — | | | | — | | | | (0.10 | ) | | | (0.18 | ) | | | — | | | | (0.23 | ) |
Distributions from Realized Capital Gains | | | — | | | | — | | | | — | | | | — | | | | — | | | | — | |
Total Distributions | | | — | | | | — | | | | (0.10 | ) | | | (0.18 | ) | | | — | | | | (0.23 | ) |
Net Asset Value, End of Year/Period | | $ | 33.57 | | | $ | 30.25 | | | $ | 26.63 | | | $ | 30.86 | | | $ | 30.00 | | | $ | 28.33 | |
Market Value, End of Year/Period | | $ | 33.56 | | | $ | 30.27 | | | $ | 26.56 | | | $ | 30.87 | | | $ | 30.00 | | | $ | 28.37 | |
| | | | | | | | | | | | | | | | | | | | | | | | |
Total Return | | | | | | | | | | | | | | | | | | | | | | | | |
Total Investment Return Based on Net Asset Value(4) | | | 10.96 | % | | | 13.61 | % | | | (13.40 | )% | | | 3.47 | % | | | 5.89 | % | | | 13.81 | % |
Total Investment Return Based on Market(4) | | | 10.87 | % | | | 13.97 | % | | | (13.63 | )% | | | 3.52 | % | | | 5.75 | % | | | 12.33 | % |
Ratios/Supplemental Data | | | | | | | | | | | | | | | | | | | | | | | | |
Net Assets, End of Year/Period (000’s
omitted) | | $ | 14,266 | | | $ | 13,613 | | | $ | 18,639 | | | $ | 16,972 | | | $ | 15,750 | | | $ | 9,209 | |
Ratio to Average Net Assets of: | | | | | | | | | | | | | | | | | | | | | | | | |
Expenses, net of expense waivers and reimbursements(5) | | | 1.35 | % | | | 1.35 | % | | | 1.35 | % | | | 1.35 | % | | | 1.35 | % | | | 1.35 | % |
Expenses, prior to expense waivers and reimbursements(5) | | | 2.10 | % | | | 2.07 | % | | | 1.88 | % | | | 1.99 | % | | | 2.12 | % | | | 2.99 | % |
Net Investment Income (Loss)(5) | | | 0.24 | % | | | 0.02 | % | | | (0.26 | )% | | | 0.57 | % | | | 0.49 | % | | | 0.51 | % |
Portfolio Turnover Rate(7) | | | 895 | % | | | 1,123 | % | | | 1,428 | % | | | 434 | % | | | 687 | % | | | 605 | % |
See accompanying Notes to Financial Statements.
100
ADVISORSHARES TRUST
Financial Highlights
AdvisorShares New Tech and Media ETF | | AdvisorShares Newfleet
Multi-Sector Income ETF |
For the period
July 11,
2017* to
December 31,
2017
(Unaudited) | | Six months
ended
December 31,
2017
(Unaudited) | | | | | | | | | | For the period March 19,
2013* to
June 30, 2013 |
|
| | | | | | | | | | | | | | | | | | | | | | | | | |
$ | 20.00 | | | $ | 48.68 | | | $ | 48.83 | | | $ | 49.08 | | | $ | 49.94 | | | $ | 49.04 | | | $ | 50.00 | |
| | | | | | | | | | | | | | | | | | | | | | | | | | |
| (0.05 | ) | | | 0.47 | | | | 0.74 | | | | 1.25 | | | | 1.28 | | | | 1.26 | | | | 0.28 | |
| 1.49 | | | | (0.07 | ) | | | 0.38 | | | | (0.13 | ) | | | (0.77 | ) | | | 0.99 | | | | (0.99 | ) |
|
—
| | | | — | | | | 0.00 | (2) | | | — | | | | — | | | | — | | | | — | |
|
1.44
| | | | 0.40 | | | | 1.12 | | | | 1.12 | | | | 0.51 | | | | 2.25 | | | | (0.71 | ) |
| — | | | | (0.62 | ) | | | (1.27 | ) | | | (1.37 | ) | | | (1.37 | ) | | | (1.35 | ) | | | (0.25 | ) |
| — | | | | — | | | | — | | | | — | | | | — | | | | — | | | | — | |
| — | | | | (0.62 | ) | | | (1.27 | ) | | | (1.37 | ) | | | (1.37 | ) | | | (1.35 | ) | | | (0.25 | ) |
$ | 21.44 | | | $ | 48.46 | | | $ | 48.68 | | | $ | 48.83 | | | $ | 49.08 | | | $ | 49.94 | | | $ | 49.04 | |
$ | 21.45 | | | $ | 48.38 | | | $ | 48.70 | | | $ | 48.82 | | | $ | 49.04 | | | $ | 49.94 | | | $ | 49.01 | |
| | | | | | | | | | | | | | | | | | | | | | | | | | |
| | | | | | | | | | | | | | | | | | | | | | | | | | |
|
7.18
| % | | | 0.84 | % | | | 2.30 | % | | | 2.33 | % | | | 1.04 | % | | | 4.65 | % | | | (1.42 | )% |
| 7.25 | % | | | 0.63 | % | | | 2.37 | % | | | 2.39 | % | | | 0.95 | % | | | 4.70 | % | | | (1.48 | )% |
| | | | | | | | | | | | | | | | | | | | | | | | | | |
$ |
51,983
| | | $ | 198,696 | | | $ | 258,005 | | | $ | 261,263 | | | $ | 215,941 | | | $ | 154,811 | | | $ | 83,362 | |
| | | | | | | | | | | | | | | | | | | | | | | | | | |
|
0.85
| % | | | 0.75 | % | | | 0.75 | % | | | 0.75 | % | | | 0.75 | % | | | 0.75 | % | | | 0.75 | % |
|
1.02
| % | | | 0.79 | % | | | 0.80 | % | | | 0.81 | % | | | 0.82 | % | | | 0.83 | % | | | 1.13 | % |
| (0.47 | )% | | | 1.90 | % | | | 1.53 | % | | | 2.57 | % | | | 2.60 | % | | | 2.55 | % | | | 1.98 | % |
| 322 | % | | | 37 | % | | | 63 | % | | | 51 | % | | | 49 | % | | | 85 | % | | | 105 | % |
See accompanying Notes to Financial Statements.
101
ADVISORSHARES TRUST
Financial Highlights
| | AdvisorShares Pacific Asset Enhanced
Floating Rate ETF |
| | Six months
ended
December 31,
2017
(Unaudited) | | | | | | For the period February 18,
2015* to June 30,
2015 |
Selected Data for a Share of Capital Stock Outstanding | | | | | | | | | | | | | | | | |
Net Asset Value, Beginning of Year/Period | | $ | 49.35 | | | $ | 48.73 | | | $ | 49.66 | | | $ | 50.00 | |
Investment Operations | | | | | | | | | | | | | | | | |
Net Investment Income (Loss)(1) | | | 0.86 | | | | 1.73 | | | | 1.74 | | | | 0.62 | |
Net Realized and Unrealized Gain (Loss) | | | (0.33 | ) | | | 0.58 | | | | (0.95 | ) | | | (0.38 | ) |
Distributions of Net Realized Gains by other investment companies | | | — | | | | — | | | | — | | | | — | |
Net Increase (Decrease) in Net Assets Resulting from Investment Operations(3) | | | 0.53 | | | | 2.31 | | | | 0.79 | | | | 0.24 | |
Distributions from Net Investment Income | | | (0.80 | ) | | | (1.69 | ) | | | (1.72 | ) | | | (0.58 | ) |
Distributions from Realized Capital Gains | | | — | | | | — | | | | — | | | | — | |
Total Distributions | | | (0.80 | ) | | | (1.69 | ) | | | (1.72 | ) | | | (0.58 | ) |
Net Asset Value, End of Year/Period | | $ | 49.08 | | | $ | 49.35 | | | $ | 48.73 | | | $ | 49.66 | |
Market Value, End of Year/Period | | $ | 49.17 | | | $ | 49.33 | | | $ | 48.26 | | | $ | 49.78 | |
| | | | | | | | | | | | | | | | |
Total Return | | | | | | | | | | | | | | | | |
Total Investment Return Based on
Net Asset Value(4) | | | 1.07 | % | | | 4.78 | % | | | 1.69 | % | | | 0.47 | % |
Total Investment Return Based on Market(4) | | | 1.30 | % | | | 5.75 | % | | | 0.46 | % | | | 0.71 | % |
Ratios/Supplemental Data | | | | | | | | | | | | | | | | |
Net Assets, End of Year/Period (000’s omitted) | | $ | 26,993 | | | $ | 27,143 | | | $ | 26,800 | | | $ | 27,312 | |
Ratio to Average Net Assets of: | | | | | | | | | | | | | | | | |
Expenses, net of expense waivers and reimbursements(5) | | | 1.10 | % | | | 1.10 | % | | | 1.10 | % | | | 1.10 | % |
Expenses, prior to expense waivers and reimbursements(5) | | | 1.59 | % | | | 1.39 | % | | | 1.51 | % | | | 1.41 | % |
Net Investment Income (Loss)(5) | | | 3.46 | % | | | 3.49 | % | | | 3.58 | % | | | 3.46 | % |
Portfolio Turnover Rate(7) | | | 45 | % | | | 52 | % | | | 27 | % | | | 102 | % |
See accompanying Notes to Financial Statements.
102
ADVISORSHARES TRUST
Financial Highlights
AdvisorShares Peritus
High Yield ETF |
Six months
ended
December 31,
2017
(Unaudited) | | | | | | | | | | |
|
| | | | | | | | | | | | | | | | | | | | | |
$ | 36.52 | | | $ | 33.88 | | | $ | 40.65 | | | $ | 53.27 | | | $ | 50.43 | | | $ | 48.59 | |
| | | | | | | | | | | | | | | | | | | | | | |
| 1.29 | | | | 2.71 | | | | 3.11 | | | | 3.59 | | | | 4.14 | | | | 4.28 | |
| 0.18 | | | | 2.49 | | | | (6.93 | ) | | | (12.33 | ) | | | 2.69 | | | | 1.66 | |
|
—
| | | | 0.00 | (2) | | | — | | | | — | | | | — | | | | — | |
|
1.47
| | | | 5.20 | | | | (3.82 | ) | | | (8.74 | ) | | | 6.83 | | | | 5.94 | |
| (1.36 | ) | | | (2.56 | ) | | | (2.95 | ) | | | (3.88 | ) | | | (3.95 | ) | | | (4.09 | ) |
| — | | | | — | | | | — | | | | — | | | | (0.04 | ) | | | (0.01 | ) |
| (1.36 | ) | | | (2.56 | ) | | | (2.95 | ) | | | (3.88 | ) | | | (3.99 | ) | | | (4.10 | ) |
$ | 36.63 | | | $ | 36.52 | | | $ | 33.88 | | | $ | 40.65 | | | $ | 53.27 | | | $ | 50.43 | |
$ | 36.15 | | | $ | 36.00 | | | $ | 33.84 | | | $ | 40.58 | | | $ | 53.27 | | | $ | 49.91 | |
| | | | | | | | | | | | | | | | | | | | | | |
| | | | | | | | | | | | | | | | | | | | | | |
|
4.10
| % | | | 15.72 | % | | | (9.34 | )% | | | (16.82 | )% | | | 14.04 | % | | | 12.58 | % |
| 4.27 | % | | | 14.33 | % | | | (9.20 | )% | | | (16.88 | )% | | | 15.20 | % | | | 11.29 | % |
| | | | | | | | | | | | | | | | | | | | | | |
$ | 153,842 | | | $ | 169,810 | | | $ | 201,601 | | | $ | 375,991 | | | $ | 1,075,997 | | | $ | 259,729 | |
| | | | | | | | | | | | | | | | | | | | | | |
|
1.26
| % | | | 1.24 | % | | | 1.22 | % | | | 1.23 | % | | | 1.18 | % | | | 1.25 | % |
|
1.26
| % | | | 1.24 | % | | | 1.28 | % | | | 1.23 | % | | | 1.18 | % | | | 1.23 | % |
| 6.95 | % | | | 7.55 | % | | | 8.77 | % | | | 7.65 | % | | | 7.95 | % | | | 8.44 | % |
| 68 | % | | | 147 | % | | | 79 | % | | | 88 | % | | | 87 | % | | | 37 | % |
See accompanying Notes to Financial Statements.
103
ADVISORSHARES TRUST
Financial Highlights
| | AdvisorShares Ranger
Equity Bear ETF |
| | Six months ended
December 31,
2017
(Unaudited) | | | | | | | | | | |
Selected Data for a Share of Capital Stock Outstanding | | | | | | | | | | | | | | | | | | | | | | | | | | |
Net Asset Value, Beginning of Year/Period | | $ | 8.56 | | | $ | 10.60 | | | $ | 10.88 | | | $ | 11.78 | | | | $ | 16.17 | | | | $ | 23.33 | |
Investment Operations | | | | | | | | | | | | | | | | | | | | | | | | | | |
Net Investment Income (Loss)(1) | | | (0.08 | ) | | | (0.20 | ) | | | (0.27 | ) | | | (0.31 | ) | | | | (0.38 | ) | | | | (0.60 | ) |
Net Realized and Unrealized Gain (Loss) | | | (0.61 | ) | | | (1.84 | ) | | | (0.01 | ) | | | (0.59 | ) | | | | (4.01 | ) | | | | (6.56 | ) |
Distributions of Net Realized Gains by other investment companies | | | — | | | | — | | | | — | | | | — | | | | | — | | | | | — | |
Net Increase (Decrease) in Net Assets Resulting from Investment Operations(3) | | | (0.69 | ) | | | (2.04 | ) | | | (0.28 | ) | | | (0.90 | ) | | | | (4.39 | ) | | | | (7.16 | ) |
Distributions from Net Investment Income | | | — | | | | — | | | | — | | | | — | | | | | — | | | | | — | |
Distributions from Realized Capital Gains | | | — | | | | — | | | | — | | | | — | | | | | — | | | | | — | |
Total Distributions | | | — | | | | — | | | | — | | | | — | | | | | — | | | | | — | |
Net Asset Value, End of Year/Period | | $ | 7.87 | | | $ | 8.56 | | | $ | 10.60 | | | $ | 10.88 | | | | $ | 11.78 | | | | $ | 16.17 | |
Market Value, End of Year/Period | | $ | 7.84 | | | $ | 8.55 | | | $ | 10.61 | | | $ | 10.88 | | | | $ | 11.79 | | | | $ | 16.16 | |
| | | | | | | | | | | | | | | | | | | | | | | | | | |
Total Return | | | | | | | | | | | | | | | | | | | | | | | | | | |
Total Investment Return Based on Net Asset Value(4) | | | (8.16 | )% | | | (19.24 | )% | | | (2.53 | )% | | | (7.64 | )% | | | | (27.15 | )% | | | | (30.69 | )% |
Total Investment Return Based on Market(4) | | | (8.30 | )% | | | (19.42 | )% | | | (2.48 | )% | | | (7.72 | )% | | | | (27.04 | )% | | | | (30.76 | )% |
Ratios/Supplemental Data | | | | | | | | | | | | | | | | | | | | | | | | | | |
Net Assets, End of Year/Period (000’s omitted) | | $ | 150,825 | | | $ | 174,504 | | | $ | 213,948 | | | $ | 128,059 | | | | $ | 161,952 | | | | $ | 218,357 | |
Ratio to Average Net Assets of: | | | | | | | | | | | | | | | | | | | | | | | | | | |
Expenses, net of expense waivers and reimbursements(5) | | | 2.67 | %(6) | | | 2.67 | %(6) | | | 2.68 | %(6) | | | 2.80 | %(6) | | | | 2.87 | %(6) | | | | 3.12 | %(6) |
Expenses, prior to expense waivers and reimbursements(5) | | | 2.67 | %(6) | | | 2.67 | %(6) | | | 2.68 | %(6) | | | 2.80 | %(6) | | | | 2.87 | %(6) | | | | 3.12 | %(6) |
Net Investment Income (Loss)(5) | | | (1.93 | )% | | | (2.15 | )% | | | (2.49 | )% | | | (2.72 | )% | | | | (2.81 | )% | | | | (3.11 | )% |
Portfolio Turnover Rate(7) | | | 120 | % | | | 245 | % | | | 402 | % | | | 419 | % | | | | 484 | % | | | | 697 | % |
See accompanying Notes to Financial Statements.
104
ADVISORSHARES TRUST
Financial Highlights
AdvisorShares Sage Core
Reserves ETF |
Six months
ended
December 31,
2017
(Unaudited) | | | | | | | | For the period
January 14, 2014*
to June 30, 2014 |
|
| | | | | | | | | | | | | | | | | | |
$ |
99.43
| | | $ | 99.43 | | | $ | 99.38 | | | $ | 99.78 | | | | $ | 100.00 | |
| | | | | | | | | | | | | | | | | | | |
| 0.69 | | | | 0.97 | | | | 0.69 | | | | 0.12 | | | | | 0.36 | |
|
(0.11
| ) | | | 0.11 | | | | 0.12 | | | | (0.12 | ) | | | | (0.25 | ) |
|
—
| | | | — | | | | — | | | | — | | | | | — | |
|
0.58
| | | | 1.08 | | | | 0.81 | | | | — | | | | | 0.11 | |
|
(0.73
| ) | | | (1.08 | ) | | | (0.76 | ) | | | (0.40 | ) | | | | (0.33 | ) |
|
—
| | | | — | | | | — | | | | — | | | | | — | |
| (0.73 | ) | | | (1.08 | ) | | | (0.76 | ) | | | (0.40 | ) | | | | (0.33 | ) |
$ | 99.28 | | | $ | 99.43 | | | $ | 99.43 | | | $ | 99.38 | | | | $ | 99.78 | |
$ | 99.28 | | | $ | 99.44 | | | $ | 99.63 | | | $ | 99.40 | | | | $ | 99.80 | |
| | | | | | | | | | | | | | | | | | | |
| | | | | | | | | | | | | | | | | | | |
|
0.58
| % | | | 1.08 | % | | | 0.83 | % | | | 0.00 | %(2) | | | | 0.11 | % |
|
0.57
| % | | | 0.88 | % | | | 1.00 | % | | | 0.00 | %(2) | | | | 0.13 | % |
| | | | | | | | | | | | | | | | | | | |
$ |
74,463
| | | $ | 84,519 | | | $ | 111,862 | | | $ | 34,783 | | | | $ | 37,419 | |
| | | | | | | | | | | | | | | | | | | |
|
0.35
| % | | | 0.35 | % | | | 0.35 | % | | | 0.35 | % | | | | 0.35 | % |
|
0.58
| % | | | 0.50 | % | | | 0.55 | % | | | 0.73 | % | | | | 0.73 | % |
| 1.38 | % | | | 0.97 | % | | | 0.70 | % | | | 0.12 | % | | | | 0.78 | % |
| 38 | % | | | 81 | % | | | 72 | % | | | 59 | % | | | | 12 | % |
See accompanying Notes to Financial Statements.
105
ADVISORSHARES TRUST
Financial Highlights
| | AdvisorShares STAR Global
Buy-Write ETF |
| |
Six months ended
December 31,
2017
(Unaudited)
| | | | | | | | | | For the period September 17,
2012* to
June 30, 2013 |
Selected Data for a Share of Capital Stock Outstanding | | | | | | | | | | | | | | | | | | | | | | | | |
Net Asset Value, Beginning of Year/Period | | $ | 29.13 | | | $ | 26.77 | | | $ | 26.60 | | | $ | 26.18 | | | $ | 23.61 | | | $ | 25.00 | |
Investment Operations | | | | | | | | | | | | | | | | | | | | | | | | |
Net Investment Income (Loss)(1) | | | 0.08 | | | | 0.09 | | | | 0.10 | | | | 0.01 | | | | (0.10 | ) | | | (0.03 | ) |
Net Realized and Unrealized Gain (Loss) | | | 1.62 | | | | 2.48 | | | | 0.07 | | | | 0.41 | | | | 2.67 | | | | (1.16 | ) |
Distributions of Net Realized Gains by other investment companies | | | 0.00 | (2) | | | 0.01 | | | | 0.00 | (2) | | | — | | | | — | | | | — | |
Net Increase (Decrease) in Net Assets Resulting from Investment Operations(3) | | | 1.70 | | | | 2.58 | | | | 0.17 | | | | 0.42 | | | | 2.57 | | | | (1.19 | ) |
Distributions from Net Investment Income | | | — | | | | (0.22 | ) | | | — | | | | — | | | | — | | | | (0.17 | ) |
Distributions from Realized Capital Gains | | | — | | | | — | | | | — | | | | — | | | | — | | | | (0.03 | ) |
Total Distributions | | | — | | | | (0.22 | ) | | | — | | | | — | | | | — | | | | (0.20 | ) |
Net Asset Value, End of Year/Period | | $ | 30.83 | | | $ | 29.13 | | | $ | 26.77 | | | $ | 26.60 | | | $ | 26.18 | | | $ | 23.61 | |
Market Value, End of Year/Period | | $ | 30.83 | | | $ | 29.13 | | | $ | 26.76 | | | $ | 26.61 | | | $ | 26.22 | | | $ | 23.62 | |
| | | | | | | | | | | | | | | | | | | | | | | | |
Total Return | | | | | | | | | | | | | | | | | | | | | | | | |
Total Investment Return Based on Net Asset Value(4) | | | 5.85 | % | | | 9.70 | % | | | 0.64 | % | | | 1.60 | % | | | 10.89 | % | | | (4.80 | )% |
Total Investment Return Based on Market(4) | | | 5.84 | % | | | 9.74 | % | | | 0.56 | % | | | 1.49 | % | | | 11.01 | % | | | (4.76 | )% |
Ratios/Supplemental Data | | | | | | | | | | | | | | | | | | | | | | | | |
Net Assets, End of Year/Period (000’s omitted) | | $ | 16,958 | | | $ | 17,477 | | | $ | 17,400 | | | $ | 26,597 | | | $ | 27,490 | | | $ | 22,428 | |
Ratio to Average Net Assets of: | | | | | | | | | | | | | | | | | | | | | | | | |
Expenses, net of expense waivers and reimbursements(5) | | | 1.85 | % | | | 1.85 | % | | | 1.85 | % | | | 1.85 | % | | | 1.85 | % | | | 1.85 | % |
Expenses, prior to expense waivers and reimbursements(5) | | | 2.08 | % | | | 2.14 | % | | | 1.97 | % | | | 1.87 | % | | | 1.79 | % | | | 2.35 | % |
Net Investment Income (Loss)(5) | | | 0.54 | % | | | 0.32 | % | | | 0.38 | % | | | 0.03 | % | | | (0.42 | )% | | | (0.14 | )% |
Portfolio Turnover Rate(7) | | | 8 | % | | | 26 | % | | | 58 | % | | | 45 | % | | | 166 | % | | | 40 | % |
See accompanying Notes to Financial Statements.
106
ADVISORSHARES TRUST
Financial Highlights
| | AdvisorShares Wilshire
Buyback ETF |
For the period December 12, 2017* to December 31, 2017
(Unaudited) | | Six months ended
December 31, 2017
(Unaudited) | | | | | | | | | | |
| | | | | | | | | | | | | | | | | | | | | | | | | | |
$ | 25.00 | | | $ | 66.23 | | | $ | 55.56 | | | $ | 57.05 | | | $ | 51.22 | | | $ | 41.05 | | | $ | 33.16 | |
| | | | | | | | | | | | | | | | | | | | | | | | | | |
| 0.05 | | | | 0.23 | | | | 0.47 | | | | 0.47 | | | | 0.42 | | | | 0.43 | | | | 0.23 | |
| 1.14 | | | | 5.26 | | | | 10.93 | | | | (1.54 | ) | | | 5.75 | | | | 9.89 | | | | 7.99 | |
|
—
| | | | — | | | | — | | | | — | | | | — | | | | — | | | | — | |
|
1.19
| | | | 5.49 | | | | 11.40 | | | | (1.07 | ) | | | 6.17 | | | | 10.32 | | | | 8.22 | |
| (0.04 | ) | | | (0.47 | ) | | | (0.73 | ) | | | (0.42 | ) | | | (0.34 | ) | | | (0.15 | ) | | | (0.21 | ) |
| — | | | | — | | | | — | | | | — | | | | — | | | | — | | | | (0.12 | ) |
| (0.04 | ) | | | (0.47 | ) | | | (0.73 | ) | | | (0.42 | ) | | | (0.34 | ) | | | (0.15 | ) | | | (0.33 | ) |
$ | 26.15 | | | $ | 71.25 | | | $ | 66.23 | | | $ | 55.56 | | | $ | 57.05 | | | $ | 51.22 | | | $ | 41.05 | |
$ | 26.26 | | | $ | 71.29 | | | $ | 66.17 | | | $ | 55.53 | | | $ | 57.05 | | | $ | 51.25 | | | $ | 41.13 | |
| | | | | | | | | | | | | | | | | | | | | | | | | | |
| | | | | | | | | | | | | | | | | | | | | | | | | | |
| 4.80 | % | | | 8.27 | % | | | 20.55 | % | | | (1.87 | )% | | | 12.06 | % | | | 25.18 | % | | | 25.01 | % |
| 5.22 | % | | | 8.45 | % | | | 20.52 | % | | | (1.91 | )% | | | 11.99 | % | | | 25.00 | % | | | 24.96 | % |
| | | | | | | | | | | | | | | | | | | | | | | | | | |
$ | 7,846 | | | $ | 124,689 | | | $ | 142,400 | | | $ | 155,570 | | | $ | 242,472 | | | $ | 137,015 | | | $ | 25,657 | |
| | | | | | | | | | | | | | | | | | | | | | | | | | |
|
0.75
| % | | | 0.90 | % | | | 0.90 | % | | | 0.99 | % | | | 0.99 | % | | | 0.99 | % | | | 0.99 | % |
|
3.03
| % | | | 1.07 | % | | | 1.07 | % | | | 1.21 | % | | | 1.11 | % | | | 1.16 | % | | | 1.90 | % |
| 4.05 | % | | | 0.67 | % | | | 0.76 | % | | | 0.86 | % | | | 0.76 | % | | | 0.90 | % | | | 0.62 | % |
| 2 | % | | | 73 | % | | | 180 | % | | | 196 | % | | | 52 | % | | | 7 | % | | | 57 | % |
See accompanying Notes to Financial Statements.
107
ADVISORSHARES TRUST
Notes to Financial Statements
December 31, 2017 (unaudited)
1. Organization
AdvisorShares Trust (the “Trust”) was organized as a Delaware statutory trust on July 30, 2007 and has authorized capital of unlimited shares. The Funds are investment companies and accordingly follow the investment company accounting and reporting guidance of the Financial Accounting Standards Board (“FASB”) Accounting Standard Codification Topic 946 “Financial Services — Investment Companies”. The Trust is an open-end management investment company, registered under the Investment Company Act of 1940, as amended (the “Act”). The Trust is comprised of 17 active funds (the “Funds” or “ETFs” and individually, the “Fund” or “ETF”):
| | | | Commencement
of Operations |
AdvisorShares Cornerstone Small Cap ETF | | SCAP | | July 6, 2016 |
AdvisorShares Dorsey Wright ADR ETF | | AADR | | July 21, 2010 |
AdvisorShares Focused Equity ETF | | CWS | | September 20, 2016 |
AdvisorShares KIM Korea Equity ETF | | KOR | | September 28, 2016 |
AdvisorShares Madrona Domestic ETF | | FWDD | | June 21, 2011 |
AdvisorShares Madrona Global Bond ETF | | FWDB | | June 21, 2011 |
AdvisorShares Madrona International ETF | | FWDI | | June 21, 2011 |
AdvisorShares Meidell Tactical Advantage ETF | | MATH | | June 23, 2011 |
AdvisorShares New Tech and Media ETF | | FNG | | July 11, 2017 |
AdvisorShares Newfleet Multi-Sector Income ETF | | MINC | | March 19, 2013 |
AdvisorShares Pacific Asset Enhanced Floating Rate ETF | | FLRT | | February 18, 2015 |
AdvisorShares Peritus High Yield ETF | | HYLD | | December 1, 2010 |
AdvisorShares Ranger Equity Bear ETF | | HDGE | | January 27, 2011 |
AdvisorShares Sage Core Reserves ETF | | HOLD | | January 14, 2014 |
AdvisorShares STAR Global Buy-Write ETF | | VEGA | | September 17, 2012 |
AdvisorShares Vice ETF | | ACT | | December 12, 2017 |
AdvisorShares Wilshire Buyback ETF | | TTFS | | October 4, 2011 |
AdvisorShares Cornerstone Small Cap ETF (“Cornerstone Small Cap ETF”) seeks to provide total return through long-term capital appreciation and current income. The Portfolio Manager invests in a diversified group of U.S.-traded equity securities, including common and preferred stock, American Depositary Receipts (“ADRs”), and publicly-traded REITs.
AdvisorShares Dorsey Wright ADR ETF (“Dorsey Wright ADR ETF”) seeks to achieve the Fund’s investment objective by selecting primarily a portfolio of U.S.-traded securities of non-U.S. organizations, most often ADRs. The Fund invests in developed and emerging markets and may invest in securities of any market capitalization.
AdvisorShares Focused Equity ETF (“Focused Equity ETF”) seeks long-term capital appreciation. CWS invests primarily in a focused group of U.S. exchange-listed equity securities that the portfolio manager believes have favorable fundamental attributes.
AdvisorShares KIM Korea Equity ETF (“KIM Korea Equity ETF”) seeks to provide long-term capital appreciation above the capital appreciation of its primary benchmark, the MSCI Korea Index, and other Korea-focused indexes. The Fund seeks to achieve its investment objective by investing primarily in growth-oriented stocks of any capitalization range listed on the Korea Exchange. The fund engages in sector allocation based on analysis of the macro economy and its effect on corporate
108
ADVISORSHARES TRUST
Notes to Financial Statements (Continued)
December 31, 2017 (unaudited)
1. Organization – (continued)
competitiveness and industry cycles and strives to invest with large economic cycles as compared to short-term market trends and short-term supply and demand.
AdvisorShares Madrona Domestic ETF (‘‘Madrona Domestic ETF’’) seeks to provide long-term capital appreciation above the capital appreciation of its benchmark, the S&P 500 Index by selecting a portfolio of up to 500 of the largest U.S. traded equity securities using a weighted allocation system based on consensus analyst estimates of the present value of future expected earnings relative to the share price of each security.
AdvisorShares Madrona Global Bond ETF (‘‘Madrona Global Bond ETF’’) seeks investment results that exceed the price and yield performance of its benchmark, the Bloomberg Barclays Capital Aggregate Bond Index. The Portfolio Manager seeks to achieve this objective by selecting a diversified portfolio of fixed income exchange-traded products (ETPs), including but not limited to, exchange-traded notes (ETNs), exchange-traded currency trusts and exchange-traded commodity pools. FWDB invests in at least 12 distinct global bond classes that cover the entire global investable bond universe. The Portfolio Manager constructs FWDB’s portfolio using a weighted allocation system based on historic yield curve analysis and a mean reversion strategy.
AdvisorShares Madrona International ETF (‘‘Madrona International ETF’’) seeks to provide long-term capital appreciation above the capital appreciation of its international benchmarks, such as the MSCI EAFE Index, the Fund’s primary benchmark, and the BNY Mellon Classic ADR Index, the Fund’s secondary benchmark. The Fund seeks to achieve this objective by selecting a portfolio primarily composed of at least 250 of the largest ADRs from among the largest issuers of Europe, Australasia and the Far East (EAFE) and Canada. Its portfolio may also include ADRs that provide exposure to certain markets deemed to be emerging markets.
AdvisorShares Meidell Tactical Advantage ETF (‘‘Meidell Tactical Advantage ETF’’) seeks to provide long-term capital appreciation and capital preservation. The Fund is considered a ‘‘fund-of-funds’’ that seeks to achieve this investment objective by managing a tactical strategy that has the ability to dynamically rebalance the Fund’s portfolio from as much as 100% equity assets to 100% fixed income assets or cash and cash equivalents depending on market trends. The Fund employs a long tactical strategy that seeks to minimize portfolio losses by rotating out of higher volatility assets and lower volatility assets depending on the Fund’s current view of risks in different asset classes.
AdvisorShares New Tech and Media ETF (“New Tech and Media ETF”) seeks to achieve its investment objective by investing, under normal circumstances, at least 80% of its net assets (plus any borrowings for investment purposes) in securities of technology and media companies. The Fund will invest primarily in U.S. exchange-listed equity securities, including common and preferred stock and ADRs, of technology and technology-related companies, including innovative and fast-growing technologies such as social media companies and internet retail companies. The Fund will concentrate its investments in the software and services industry within the information technology sector.
AdvisorShares Newfleet Multi-Sector Income ETF (‘‘Newfleet Multi-Sector Income ETF’’) seeks to provide current income consistent with preservation of capital, while limiting fluctuations in net asset value (‘‘NAV’’) due to changes in interest rates. In seeking to achieve the Fund’s investment objective, the Sub-Advisor applies a time-tested approach and extensive credit research to capitalize on opportunities across undervalued areas of the bond markets. The Fund principally invests in investment-grade securities, which are securities with credit ratings within the four highest rating
109
ADVISORSHARES TRUST
Notes to Financial Statements (Continued)
December 31, 2017 (unaudited)
1. Organization – (continued)
categories of a nationally recognized statistical rating organization or, if unrated, those securities that the Sub-Advisor determines to be of comparable quality.
AdvisorShares Pacific Asset Enhanced Floating Rate ETF (‘‘Pacific Asset Enhanced Floating Rate ETF’’) seeks to provide a high level of current income. The fund seeks to achieve its investment objective by selecting a focused portfolio comprised primarily of income producing floating rate loans and floating rate debt securities.
AdvisorShares Peritus High Yield ETF (‘‘Peritus High Yield ETF’’) seeks high current income by investing in a focused portfolio of high yield debt securities commonly referred to as ‘‘junk bonds’’. The Fund does not have any portfolio maturity limitation and may invest in instruments with short-term, medium-term or long-term maturities.
AdvisorShares Ranger Equity Bear ETF (‘‘Ranger Equity Bear ETF’’) seeks capital appreciation through short sales of domestically traded equity securities. The portfolio management team implements a bottom-up, fundamental, research driven security selection process. In selecting short positions, the Fund seeks to identify securities with low earnings quality or aggressive accounting which may be intended on the part of company management to mask operational deterioration and bolster the reported earnings per share over a short time period. In addition, the portfolio management team seeks to identify earnings driven events that may act as a catalyst to the price decline of a security, such as downwards earnings revisions or reduced forward guidance.
AdvisorShares Sage Core Reserves ETF (‘‘Sage Core Reserves ETF’’) seeks to preserve capital while maximizing income. The Sub-Advisor seeks to achieve the fund’s investment objective by investing in a variety of fixed income securities, including bonds, forwards and instruments issued by U.S. and foreign issuers. It will invest in U.S. dollar-denominated investment grade debt securities, including mortgage- or asset-backed securities, rated Baa- or higher by Moody’s Investors Service, Inc. (‘‘Moody’s’’), or equivalently rated by Standard & Poor’s Ratings Services (‘‘S&P’’) or Fitch, Inc. (‘‘Fitch’’), or, if unrated, determined by the Sub-Advisor to be of comparable quality.
AdvisorShares STAR Global Buy-Write ETF (‘‘STAR Global Buy-Write ETF’’) seeks consistent repeatable returns across all market cycles. The Portfolio Manager seeks to achieve this investment objective by using a proprietary strategy known as Volatility Enhanced Global Appreciation (VEGA). VEGA employs a ‘‘Buy-Write’’ or ‘‘Covered Call’’ overlay for their global allocation strategy using ETPs. The strategy simultaneously writes (sells) a call option against each position in order to seek cumulative price appreciation from the portfolio’s global exposure, while generating a consistent income stream from the sale of covered call and/or cash-secured put options. When volatility is low the portfolio manager buys protective put options to manage downside risk.
AdvisorShares Vice ETF (“Vice ETF”) seeks to achieve its investment objective by investing in securities of companies that derive at least 50% of their net revenue from tobacco and alcoholic beverages and companies that derive at least 50% of their net revenue from the marijuana and hemp industry or have at least 50% of their company assets dedicated to lawful research and development of cannabis or cannabinoid-related products. The Fund will invest primarily in U.S. exchange listed equity securities, including common and preferred stock and ADRs.
AdvisorShares Wilshire Buyback ETF (‘‘Wilshire Buyback ETF’’) seeks to achieve its investment objective by primarily investing in the broad U.S. equity market. The Fund invests in stocks with liquidity and fundamental characteristics that are historically associated with superior long-term performance.
110
ADVISORSHARES TRUST
Notes to Financial Statements (Continued)
December 31, 2017 (unaudited)
1. Organization – (continued)
Based on extensive historical research, Wilshire Associates Incorporated designed a quantitative stock selection process to make allocation decisions in the Fund’s portfolio.
Some of the Funds are considered “fund of funds” and seek to achieve their investment objectives by investing primarily in other affiliated and unaffiliated exchange-traded funds (“ETFs”), as well as other exchange-traded products, including, but not limited to, exchange-traded notes (“ETNs”) and closed-end funds (collectively with ETFs and ETNs, “ETPs”), that offer diversified exposure to various global regions, credit qualities, durations and maturity dates.
For the period ended December 31, 2017, the Funds held significant positions (greater than 25% of net assets), except those invested in short term money market instruments, in other funds as follows:
| | | | Market
Value as of
December 31,
2017 | | % of Fund
Net Assets
as of
December 31,
2017 | | |
Meidell Tactical Advantage ETF | | iShares Core S&P Small-Cap ETF | | $ | 4,088,519 | | 28.7 | % | | https://www.ishares.com |
| | | | | | | | |
Ranger Equity Bear ETF | | AdvisorShares Sage Core Reserves ETF | | | 67,041,000 | | 44.4 | | | Contained within this report. |
| | | | | | | | | | |
STAR Global Buy-Write ETF | | SPDR S&P 500 ETF Trust | | | 8,030,618 | | 47.4 | | | https://us.spdrs.com |
2. Summary of Significant Accounting Policies
These financial statements are prepared in accordance with U.S. generally accepted accounting principles (‘‘GAAP’’) which require management to make estimates and assumptions that affect the reported amounts of assets and liabilities and disclosures of contingent assets and liabilities at the date of the financial statements and the reported amounts of increases and decreases in net assets from operations during the reporting period. Actual results could differ from those estimates.
Investment Valuation
In computing each Fund’s NAV, the Fund’s securities holdings are valued based on their last readily available market price. Price information on listed securities, including Underlying ETFs, is taken from the exchange where the security is primarily traded. Securities regularly traded in an OTC market are valued at the latest quoted sales price on the primary exchange or national securities market on which such securities are traded. Securities not listed on an exchange or national securities market, or securities in which there was no last reported sales price, are valued at the most recent bid price. Other portfolio securities and assets for which market quotations are not readily available are valued based on fair value as determined in good faith by the Board of Trustees of the Trust.
Investment Transactions
Investment transactions are accounted for on the trade date. Realized gains and losses on sales of investment securities are calculated using the identified cost method. Dividend income and distributions to shareholders are recognized on the ex-dividend date and interest income and expenses are recognized on the accrual basis. Premiums and discounts are amortized over the life of the bond using the effective interest method.
111
ADVISORSHARES TRUST
Notes to Financial Statements (Continued)
December 31, 2017 (unaudited)
2. Summary of Significant Accounting Policies – (continued)
Distributions received from investments in Real Estate Investment Trusts (“REITs”) are recorded as dividend income on ex-dividend date, subject to reclassification upon notice of the character of such distributions by the issuer. The portion of dividend attributable to the return of capital is recorded against the cost basis of the security.
Foreign Taxes
The Funds may be subject to foreign taxes (a portion of which may be reclaimable) on income, capital gains on investments, certain foreign currency transactions or other corporate events. All foreign taxes are recorded in accordance with the applicable foreign tax regulations and rates that exist in the foreign jurisdictions in which the Funds invest. These foreign taxes, if any, are paid by the Funds and are reflected in their Statements of Operations.
Expenses
Expenses of the Trust, which are directly identifiable to a specific Fund, are applied to that Fund. Expenses which are not readily identifiable to a specific Fund are allocated in such a manner as deemed equitable, taking into consideration the nature and type of expense and the relative net assets of each Fund.
Swap Agreements
Certain funds may invest in equity swaps to obtain exposure to the underlying referenced security, obtain leverage or enjoy the returns from ownership without actually owning equity. Equity swaps are two-party contracts that generally obligate one party to pay the positive return and the other party to pay the negative return on a specified reference security, basket of securities, security index or index component during the period of the swap. Equity swap contracts are marked to market daily based on the value of the underlying security and the change, if any, is recorded as an unrealized gain or loss. Equity swaps normally do not involve the delivery of securities or other underlying assets. Accordingly, the risk of loss with respect to equity swaps is normally limited to the net amount of payments that a Fund is contractually obligated to make. If the other party to an equity swap defaults a Fund’s risk of loss consists of the net amount of payments that the Fund is contractually entitled to receive, if any. Equity swaps are derivatives and their value can be very volatile. To the extent that the Adviser or Sub-Adviser, as applicable, do not accurately analyze and predict future market trends, the values of assets or economic factors, the Funds may suffer a loss, which may be substantial. The swap markets in which many types of swap transactions are traded have grown substantially in recent years, with a large number of banks and investment banking firms acting both as principals and as agents. As a result, the markets for certain types of swaps have become relatively liquid. Periodic payments received or paid by the Funds are recorded as realized gains or losses.
Repurchase Agreements
The Funds may enter into repurchase agreements provided that the value of the underlying collateral, including accrued interest, will equal or exceed the value of the repurchase agreement during the term of the agreement. The underlying collateral for all repurchase agreements is held in safekeeping by the Fund’s custodian or at the Federal Reserve Bank. If the seller defaults and the value of the collateral declines, or if bankruptcy proceedings commence with respect to the seller of the security, realization of the collateral by the Fund may be delayed or limited.
At December 31, 2017 the market values of repurchase agreements outstanding are included as cash collateral for securities on loan on the Statements of Assets and Liabilities.
112
ADVISORSHARES TRUST
Notes to Financial Statements (Continued)
December 31, 2017 (unaudited)
2. Summary of Significant Accounting Policies – (continued)
Short Sales
Certain Funds may sell securities it does not own as a hedge against some of its long positions
and/or in anticipation of a decline in the market value of that security (short sale). When the Funds make a short sale, it must borrow the security sold short and deliver it to the broker-dealer through which it made the short sale. The Funds may have to pay a fee to borrow the particular security and may be obligated to remit any interest or dividends received on such borrowed securities. Dividends declared on short positions open are recorded on the ex-date as an expense. A gain, limited to the price at which the Funds sold the security short, or a loss, unlimited in magnitude, will be recognized upon the termination of a short sale if the market price at termination is less than or greater than, respectively, the proceeds originally received. The Funds are also subject to the risk that it may be unable to reacquire a security to terminate a short position except at a price substantially in excess of the last quoted price.
The Funds are required to pledge cash or securities to the broker as collateral for the securities sold short. Collateral requirements are calculated daily based on the current market value of the short positions. Cash deposited with broker for collateral for securities sold short is recorded as an asset on the Statements of Assets and Liabilities and securities segregated as collateral are denoted in the Schedule of Investments. The Funds may receive or pay the net of the following amounts: (i) a portion of the income from the investment of cash collateral; (ii) the broker’s fee on the borrowed securities; and (iii) a financing charge for the difference in the market value of the short position and cash collateral deposited with the broker. This income or fee is calculated daily based upon the market value of each borrowed security and a variable rate that is dependent on the availability of the security. The net amount of income or fees paid by Ranger Equity Bear ETF for the period ended December 31, 2017 was $39,709, which is included as Interest on Securities Sold, Not Yet Purchased in the Statements of Operations.
Deposits with brokers and segregated cash for securities sold short represent cash balances on deposit with the Funds’ prime brokers and custodian. The Funds are subject to credit risk should the prime brokers be unable to meet its obligations to the Funds.
Term Loans
Certain Funds invests in senior secured corporate loans or bank loans, some of which may be partially or entirely unfunded and purchased on a when-issued or delayed delivery basis, that pay interest at rates which are periodically reset by reference to a base lending rate plus a spread. Bank loans generally pay interest at rates which are periodically determined by reference to a base lending rate plus a premium. All loans carry a variable rate of interest. These base lending rates are generally (i) the Prime Rate offered by one or more major United States banks, (ii) the lending rate offered by one or more European banks such as the London Interbank Offered Rate (“LIBOR”) or (iii) the Certificate of Deposit rate. Bank Loans, while exempt from registration, under the Securities Act of 1933, contain certain restrictions on resale and cannot be sold publicly. Floating rate bank loans often require prepayments from excess cash flow or permit the borrower to repay at its election. The degree to which borrowers repay, whether as a contractual requirement or at their election, cannot be predicted with accuracy. As a result, actual maturity may be substantially less than the stated maturity. Bank loans in which the Fund invests are generally readily marketable, but may be subject to certain restrictions on resale.
113
ADVISORSHARES TRUST
Notes to Financial Statements (Continued)
December 31, 2017 (unaudited)
2. Summary of Significant Accounting Policies – (continued)
Options
Certain Funds are authorized to write and purchase put and call options. When a Fund writes an option, an amount equal to the premium received by the Fund is reflected as an asset and an equivalent liability. The amount of the liability is subsequently marked to market to reflect the current market value of the option written. When a security is purchased or sold through an exercise of an option, the related premium paid (or received) is added to (or deducted from) the basis of the security acquired or deducted from (or added to) the proceeds of the security sold. When an option expires (or the Fund enters into a closing transaction), the Fund realizes a gain or loss on the option to the extent of the premiums received or paid (or gain or loss to the extent the cost of the closing transaction exceeds the premium paid or received). The Fund, as writer of an option, bears the market risk of an unfavorable change in the price of the security underlying the written option. Written and purchased options are non-income producing investments.
Short-Term Investments
Each Fund may invest in high-quality short-term debt securities and money market instruments on an ongoing basis to maintain liquidity or pending selection of investments in accordance with its policies. These short-term debt securities and money market instruments include shares of other mutual funds, commercial paper, certificates of deposit, bankers’ acceptances, U.S. Government securities and repurchase agreements.
Securities Lending
The Funds participate in a securities lending program offered by The Bank of New York Mellon (‘‘BNYM’’) (the ‘‘Program’’), providing for the lending of securities to qualified brokers. Securities lending income includes earnings of such temporary cash investments, plus or minus any rebate to a borrower. These earnings (after any rebate) are then divided between BNYM, as a fee for its services under the Program, and the Funds, according to agreed-upon rates. Collateral on all securities loaned is accepted in cash and is maintained at a minimum level of 102% (105% in the case of certain foreign securities) of the market value, plus interest, if applicable, of investments on loan. It is the Fund’s policy to obtain additional collateral from or return excess collateral to the borrower by the end of the next business day, following the valuation date of the securities loaned. Therefore, the value of the collateral held may be temporarily less than the value of the securities on loan. Lending securities entails a risk of loss to the Funds if and to the extent that the market value of the securities loaned were to increase and the borrower did not increase the collateral accordingly, and the borrower fails to return the securities. Under the terms of the Program, the Funds are indemnified for such losses by BNYM. Cash collateral is held in a separate account managed by BNYM, who is authorized to exclusively enter into money market instruments and overnight repurchase agreements, which are collateralized at 102% with securities issued or fully guaranteed by the U.S. Treasury; U.S. Government or any agency, instrumentality or authority of the U.S. government. The securities purchased with cash collateral received are reflected in the Schedule of Investments. BNYM bears the risk of any deficiency in the amount of the cash collateral available for return to the borrower due to any loss on the collateral invested.
The money market instruments and repurchase agreements income related to the Program earned by the Funds is disclosed on the Statements of Operations.
The value of loaned securities and related collateral outstanding at December 31, 2017 are shown in the Schedules of Investments and Statements of Assets and Liabilities.
114
ADVISORSHARES TRUST
Notes to Financial Statements (Continued)
December 31, 2017 (unaudited)
2. Summary of Significant Accounting Policies – (continued)
| | Gross
Amounts of | | Gross Amounts Offset in the
Statements | | Net Amounts Presented
in the | | Gross Amounts not offset
in the Statements of
Assets and Liabilities | | |
| | Recognized
Assets
(Liabilities) | | of Assets
and (Liabilities) | | Statements of Assets and (Liabilities) | | | | Collateral Pledged/
Received | | |
Cornerstone Small Cap ETF | | | | | | | | | | | | | | | | | | | | | |
Securities Lending | | $ | (460,323 | ) | | $ | — | | $ | (460,323 | ) | | $ | 460,323 | (1) | | $ | — | | $ | — |
Repurchase Agreements | | | 460,323 | | | | — | | | 460,323 | | | | 460,323 | (2) | | | — | | | — |
Dorsey Wright ADR ETF | | | | | | | | | | | | | | | | | | | | | |
Securities Lending | | | (22,284,767 | ) | | | — | | | (22,284,767 | ) | | | 22,284,767 | (1) | | | — | | | — |
Repurchase Agreements | | | 19,295,767 | | | | — | | | 19,295,767 | | | | 19,295,767 | (2) | | | — | | | — |
Focused Equity ETF | | | | | | | | | | | | | | | | | | | | | |
Securities Lending | | | (357,200 | ) | | | — | | | (357,200 | ) | | | 357,200 | (1) | | | — | | | — |
Repurchase Agreements | | | 357,200 | | | | — | | | 357,200 | | | | 357,200 | (2) | | | — | | | — |
Madrona Domestic ETF | | | | | | | | | | | | | | | | | | | | | |
Securities Lending | | | (606,349 | ) | | | — | | | (606,349 | ) | | | 606,349 | (1) | | | — | | | — |
Repurchase Agreements | | | 606,349 | | | | — | | | 606,349 | | | | 606,349 | (2) | | | — | | | — |
Madrona Global Bond ETF | | | | | | | | | | | | | | | | | | | | | |
Securities Lending | | | (5,673,247 | ) | | | — | | | (5,673,247 | ) | | | 5,673,247 | (1) | | | — | | | — |
Repurchase Agreements | | | 5,303,247 | | | | — | | | 5,303,247 | | | | 5,303,247 | (2) | | | — | | | — |
Madrona International ETF | | | | | | | | | | | | | | | | | | | | | |
Securities Lending | | | (3,340,137 | ) | | | — | | | (3,340,137 | ) | | | 3,340,137 | (1) | | | — | | | — |
Repurchase Agreements | | | 2,869,137 | | | | — | | | 2,869,137 | | | | 2,869,137 | (2) | | | — | | | — |
Meidell Tactical Advantage ETF | | | | | | | | | | | | | | | | | | | | | |
Securities Lending | | | (4,341,798 | ) | | | — | | | (4,341,798 | ) | | | 4,341,798 | (1) | | | — | | | — |
Repurchase Agreements | | | 3,890,798 | | | | — | | | 3,890,798 | | | | 3,890,798 | (2) | | | — | | | — |
New Tech and Media ETF | | | | | | | | | | | | | | | | | | | | | |
Securities Lending | | | (7,202,669 | ) | | | — | | | (7,202,669 | ) | | | 7,202,669 | (1) | | | — | | | — |
Repurchase Agreements | | | 7,202,669 | | | | — | | | 7,202,669 | | | | 7,202,669 | (2) | | | — | | | — |
Newfleet Multi-Sector Income ETF | | | | | | | | | | | | | | | | | | | | | |
Securities Lending | | | (564,997 | ) | | | — | | | (564,997 | ) | | | 564,997 | (1) | | | — | | | — |
Repurchase Agreements | | | 564,997 | | | | — | | | 564,997 | | | | 564,997 | (2) | | | — | | | — |
Pacific Asset Enhanced Floating Rate ETF | | | | | | | | | | | | | | | | | | | | | |
Securities Lending | | | (239,435 | ) | | | — | | | (239,435 | ) | | | 239,435 | (1) | | | — | | | — |
Repurchase Agreements | | | 239,435 | | | | — | | | 239,435 | | | | 239,435 | (2) | | | — | | | — |
Swaps | | | 2,386 | | | | — | | | 2,386 | | | | — | | | | — | | | 2,386 |
Peritus High Yield ETF | | | | | | | | | | | | | | | | | | | | | |
Securities Lending | | | (17,365,179 | ) | | | — | | | (17,365,179 | ) | | | 17,365,179 | (1) | | | — | | | — |
Repurchase Agreements | | | 15,051,179 | | | | — | | | 15,051,179 | | | | 15,051,179 | (2) | | | — | | | — |
Sage Core Reserves ETF | | | | | | | | | | | | | | | | | | | | | |
Securities Lending | | | (345,800 | ) | | | — | | | (345,800 | ) | | | 345,800 | (1) | | | — | | | — |
Repurchase Agreements | | | 345,800 | | | | — | | | 345,800 | | | | 345,800 | (2) | | | — | | | — |
Wilshire Buyback ETF | | | | | | | | | | | | | | | | | | | | | |
Securities Lending | | | (2,909,714 | ) | | | — | | | (2,909,714 | ) | | | 2,909,714 | (1) | | | — | | | — |
Repurchase Agreements | | | 2,530,714 | | | | — | | | 2,530,714 | | | | 2,530,714 | (2) | | | — | | | — |
115
ADVISORSHARES TRUST
Notes to Financial Statements (Continued)
December 31, 2017 (unaudited)
2. Summary of Significant Accounting Policies – (continued)
Dividends and Distributions
Each Fund will generally pay out dividends to shareholders at least annually. Each Fund will distribute its net capital gains, if any, to shareholders annually. Income and capital gain distributions are determined in accordance with income tax regulations which may differ from U.S. generally accepted accounting principles. Distributions are recorded on ex-dividend date.
Indemnifications
In the normal course of business, each Fund enters into contracts that contain a variety of representations which provide general indemnifications. The Trust’s maximum exposure under these arrangements cannot be known; however, the Trust expects any risk of loss to be remote.
3. Investment Advisory Agreement and Other Agreements
Investment Advisory Agreement
Each Fund has entered into an investment advisory agreement with AdvisorShares Investments, LLC (the ‘‘Advisor’’) pursuant to which the Advisor acts as the Fund’s investment adviser. Pursuant to the agreement, the Advisor has overall supervisory responsibility for the general management and investment of each Fund’s securities portfolio, and has ultimate responsibility (subject to oversight by the Trust’s Board of Trustees) for oversight of the Trust’s sub-advisers. For its services, each Fund pays the Advisor an annual management fee and which is calculated daily and paid monthly based on average daily net assets. From time to time, the Advisor may waive all or a portion of its fee.
The Advisor’s annual management fee for each Fund is as follows:
| | |
Cornerstone Small Cap ETF | | 0.65% |
Dorsey Wright ADR ETF | | 0.75% |
Focused Equity ETF | | 0.75% |
KIM Korea Equity ETF | | 0.84% |
Madrona Domestic ETF | | 0.80% |
Madrona Global Bond ETF | | 0.50% |
Madrona International ETF | | 0.80% |
Meidell Tactical Advantage ETF | | 1.20% |
New Tech and Media ETF | | 0.60% |
Newfleet Multi-Sector Income ETF | | 0.65% |
Pacific Asset Enhanced Floating Rate ETF | | 0.95% |
Peritus High Yield ETF | | 1.10% |
Ranger Equity Bear ETF | | 1.50% |
Sage Core Reserves ETF | | 0.30% |
STAR Global Buy-Write ETF | | 1.35% |
Vice ETF | | 0.60% |
Wilshire Buyback ETF | | 0.90% |
116
ADVISORSHARES TRUST
Notes to Financial Statements (Continued)
December 31, 2017 (unaudited)
3. Investment Advisory Agreement and Other Agreements – (continued)
Sub-Advisory Agreements
Each Fund’s investment sub-advisor provides investment advice and management services to the Fund. AdvisorShares supervises the day-to-day investment and reinvestment of the assets in the Fund and is responsible for monitoring the Fund’s adherence to its investment mandate. Pursuant to an investment sub-advisory agreement between each sub-advisor and the Advisor, the sub-advisor receives an annual fee.
From time to time, each sub-advisor may waive all or a portion of its fee.
Expense Limitation Agreement
The Advisor has contractually agreed to reduce their fees and reimburse expenses in order to keep net expenses (excluding interest, taxes, brokerage commissions, acquired fund fees and expenses, and extraordinary expenses) from exceeding a specified amount for each Fund’s average daily net assets. The expense limitation agreement will be terminated upon termination of the investment advisory agreement between the Advisor and the Fund. The investment advisory agreement may only be terminated with the approval of the Fund’s Board. The expense caps in effect for each Fund during the period ended December 31, 2017 were as follows:
| | |
Cornerstone Small Cap ETF | | 0.90% | |
Dorsey Wright ADR ETF | | 0.98% | * |
Focused Equity ETF | | 0.75% | |
KIM Korea Equity ETF | | 0.99% | |
Madrona Domestic ETF | | 1.25% | |
Madrona Global Bond ETF | | 0.95% | |
Madrona International ETF | | 1.25% | |
Meidell Tactical Advantage ETF | | 1.35% | |
New Tech and Media ETF | | 0.85% | |
Newfleet Multi-Sector Income ETF | | 0.75% | |
Pacific Asset Enhanced Floating Rate ETF | | 1.10% | |
Peritus High Yield ETF | | 1.35% | |
Ranger Equity Bear ETF | | 1.85% | |
Sage Core Reserves ETF | | 0.35% | |
STAR Global Buy-Write ETF | | 1.85% | |
Vice ETF | | 0.75% | |
Wilshire Buyback ETF | | 0.90% | |
117
ADVISORSHARES TRUST
Notes to Financial Statements (Continued)
December 31, 2017 (unaudited)
3. Investment Advisory Agreement and Other Agreements – (continued)
For the period ended December 31, 2017, the Advisor waived fees and reimbursed expenses for each Fund as follows. Each Fund may recoup such waivers until the date indicated, or for a maximum of three years from reimbursement, whichever is sooner.
| | | | | | | | |
Cornerstone Small Cap ETF | | $ | 101,317 | | $ | 101,317 | | 6/30/2020 | | 2017 |
| | | 54,073 | | | 54,073 | | 6/30/2021 | | 2018 |
Total | | | 155,390 | | | 155,390 | | | | |
| | | | | | | | |
Dorsey Wright ADR ETF | | | 55,807 | | | — | | 6/30/2018 | | 2015 |
| | | 58,928 | | | — | | 6/30/2019 | | 2016 |
| | | 50,172 | | | 31,979 | | 6/30/2020 | | 2017 |
Total | | | 164,907 | | | 31,979 | | | | |
| | | | | | | | | | |
Focused Equity ETF | | | 83,821 | | | 83,821 | | 6/30/2020 | | 2017 |
| | | 45,912 | | | 45,912 | | 6/30/2021 | | 2018 |
Total | | | 129,733 | | | 129,733 | | | | |
| | | | | | | | | | |
KIM Korea Equity ETF | | | 75,130 | | | 75,130 | | 6/30/2020 | | 2017 |
| | | 73,187 | | | 73,187 | | 6/30/2021 | | 2018 |
Total | | | 148,317 | | | 148,317 | | | | |
| | | | | | | | | | |
Madrona Domestic ETF | | | 35,654 | | | 35,654 | | 6/30/2018 | | 2015 |
| | | 21,361 | | | 21,361 | | 6/30/2019 | | 2016 |
| | | 32,079 | | | 32,079 | | 6/30/2020 | | 2017 |
| | | 13,889 | | | 13,889 | | 6/30/2021 | | 2018 |
Total | | | 102,983 | | | 102,983 | | | | |
| | | | | | | | | | |
Madrona Global Bond ETF | | | 12,090 | | | 11,721 | | 6/30/2018 | | 2015 |
| | | 23,218 | | | 23,218 | | 6/30/2019 | | 2016 |
| | | 46,960 | | | 46,960 | | 6/30/2020 | | 2017 |
| | | 22,402 | | | 22,402 | | 6/30/2021 | | 2018 |
Total | | | 104,670 | | | 104,301 | | | | |
| | | | | | | | | | |
Madrona International ETF | | | 79,853 | | | 79,853 | | 6/30/2018 | | 2015 |
| | | 63,601 | | | 63,601 | | 6/30/2019 | | 2016 |
| | | 75,380 | | | 75,380 | | 6/30/2020 | | 2017 |
| | | 34,424 | | | 34,424 | | 6/30/2021 | | 2018 |
Total | | | 253,258 | | | 253,258 | | | | |
| | | | | | | | | | |
Meidell Tactical Advantage ETF | | | 103,519 | | | 103,519 | | 6/30/2018 | | 2015 |
| | | 96,939 | | | 96,939 | | 6/30/2019 | | 2016 |
| | | 110,946 | | | 110,946 | | 6/30/2020 | | 2017 |
| | | 52,105 | | | 52,105 | | 6/30/2021 | | 2018 |
Total | | | 363,509 | | | 363,509 | | | | |
| | | | | | | | | | |
New Tech and Media ETF | | | 22,900 | | | 22,900 | | 6/30/2021 | | 2018 |
Total | | | 22,900 | | | 22,900 | | | | |
118
ADVISORSHARES TRUST
Notes to Financial Statements (Continued)
December 31, 2017 (unaudited)
3. Investment Advisory Agreement and Other Agreements – (continued)
| | | | | | | | |
Newfleet Multi-Sector Income ETF | | 139,832 | | 139,832 | | 6/30/2018 | | 2015 |
| | 132,621 | | 132,621 | | 6/30/2019 | | 2016 |
| | 133,302 | | 133,302 | | 6/30/2020 | | 2017 |
| | 53,084 | | 53,084 | | 6/30/2021 | | 2018 |
Total | | 458,839 | | 458,839 | | | | |
| | | | | | | | |
Pacific Asset Enhanced Floating Rate ETF | | 30,047 | | 30,047 | | 6/30/2018 | | 2015 |
| | 108,286 | | 108,286 | | 6/30/2019 | | 2016 |
| | 79,534 | | 79,534 | | 6/30/2020 | | 2017 |
| | 66,712 | | 66,712 | | 6/30/2021 | | 2018 |
Total | | 284,579 | | 284,579 | | | | |
| | | | | | | | |
| | | | | | | | |
Sage Core Reserves ETF | | 141,235 | | 141,235 | | 6/30/2018 | | 2015 |
| | 90,545 | | 90,545 | | 6/30/2019 | | 2016 |
| | 141,505 | | 141,505 | | 6/30/2020 | | 2017 |
| | 94,001 | | 94,001 | | 6/30/2021 | | 2018 |
Total | | 467,286 | | 467,286 | | | | |
| | | | | | | | |
STAR Global Buy-Write ETF | | 13,786 | | 13,786 | | 6/30/2018 | | 2015 |
| | 25,820 | | 25,820 | | 6/30/2019 | | 2016 |
| | 50,044 | | 50,044 | | 6/30/2020 | | 2017 |
| | 19,799 | | 19,799 | | 6/30/2021 | | 2018 |
Total | | 109,449 | | 109,449 | | | | |
| | | | | | | | |
AdvisorShares Vice ETF | | 7,124 | | 7,124 | | 6/30/2021 | | 2018 |
Total | | 7,124 | | 7,124 | | | | |
| | | | | | | | |
Wilshire Buyback ETF | | 211,220 | | 211,220 | | 6/30/2018 | | 2015 |
| | 454,474 | | 454,474 | | 6/30/2019 | | 2016 |
| | 244,904 | | 244,904 | | 6/30/2020 | | 2017 |
| | 113,698 | | 113,698 | | 6/30/2021 | | 2018 |
Total | | 1,024,296 | | 1,024,296 | | | | |
Administrator, Custodian, Fund Accountant and Transfer Agent
The Bank of New York Mellon (‘‘BNYM’’) (in each capacity, the ‘‘Administrator’’, ‘‘Custodian’’, ‘‘Fund Accountant’’ or ‘‘Transfer Agent’’), serves as the Fund’s Administrator, Custodian, Fund Accountant and Transfer Agent pursuant to a certain Fund Administration and Accounting Agreement, a Custody Agreement or a Transfer Agency and Service Agreement, as the case may be.
Distribution and Service (12b-1) Plan
Foreside Fund Services, LLC (the ‘‘Distributor’’) serves as the Fund’s distributor of Creation Units for the Fund pursuant to the distribution agreement. The Distributor does not maintain any secondary market shares. The Funds have adopted a Distribution and Service Plan (‘‘Plan’’) pursuant to Rule 12b-1 under
119
ADVISORSHARES TRUST
Notes to Financial Statements (Continued)
December 31, 2017 (unaudited)
3. Investment Advisory Agreement and Other Agreements – (continued)
the 1940 Act. In accordance with its Plan, each Fund is authorized to pay an amount up to 0.25% of its average daily net assets each year for certain distribution-related activities. No fees are currently paid by each Fund under the Plan, and there are no current plans to impose these fees. However, in the event Rule 12b-1 fees were charged, over time they would increase the cost of an investment in each Fund.
4. Creation and Redemption Transactions
The Funds issue and redeem shares on a continuous basis at NAV in groups of 25,000 shares, at minimum, called ‘‘Creation Units.’’ Except when aggregated in Creation Units, shares are not redeemable securities of a Fund. Only ‘‘Authorized Participants’’ may purchase or redeem shares directly from each Fund. An Authorized Participant is either (i) a broker-dealer or other participant in the clearing process through the Continuous Net Settlement System of the National Securities Clearing Corporation or (ii) a DTC participant and, in each case, must have executed a Participant Agreement with the Distributor. Most retail investors will not qualify as Authorized Participants or have the resources to buy and sell whole Creation Units. Therefore, they will be unable to purchase or redeem the shares directly from the Fund. Rather, most retail investors will purchase shares in the secondary market with the assistance of a broker and will be subject to customary brokerage commissions or fees.
5. Summary of Fair Value Disclosure
The Financial Accounting Standard Board’s (‘‘FASB’’) Accounting Standards Codification (‘‘ASC’’) 820-10, Fair Value Measurements and Disclosures, defines fair value, establishes an authoritative framework for measuring fair value in accordance with generally accepted accounting principles, and expands disclosure about fair value measurements. Various inputs are used in determining the value of the Fund’s investments. These inputs are summarized in the three broad levels listed below:
• Level 1 — Unadjusted quoted prices in active markets for identical assets or liabilities that the company has the ability to access.
• Level 2 — Observable inputs other than quoted prices included in Level 1 that are observable for the asset or liability either directly or indirectly. These inputs may include quoted prices for the identical instrument on an inactive market, prices for similar instruments, interest rates, prepayment speeds, credit risk, yield curves, default rates, and similar data.
• Level 3 — Unobservable inputs for the asset or liability to the extent that relevant observable inputs are not available, representing the company’s own assumptions about the assumptions that a market participant would use in valuing the asset or liability, and that would be based on the best information available.
Investments that use Level 2 or Level 3 inputs may include, but are not limited to: (i) an unlisted security related to corporate actions; (ii) a restricted security (e.g., one that may not be publicly sold without registration under the Securities Act of 1933 as amended); (iii) a security whose trading has been suspended or which has been de-listed from its primary trading exchange; (iv) a security that is thinly traded; (v) a security in default or bankruptcy proceedings for which there is no current market quotation; (vi) a security affected by currency controls or restrictions; and (vii) a security affected by a significant event (e.g., an event that occurs after the close of the markets on which the security is traded but before the time as of which a Fund’s net asset value is computed and that may materially affect the value of the Fund’s investment). Examples of events that may be ‘‘significant
120
ADVISORSHARES TRUST
Notes to Financial Statements (Continued)
December 31, 2017 (unaudited)
5. Summary of Fair Value Disclosure – (continued)
events’’ are government actions, natural disasters, armed conflicts and acts of terrorism. The inputs or methodology used for valuing securities are not necessarily an indication of the risk associated with investing in those securities.
The following is a summary of the inputs used as of December 31, 2017 in valuing the Funds’ assets and liabilities carried at fair value:
| | Cornerstone Small Cap ETF | | | | | | | | | | | | Madrona International ETF |
Level 1 | | | | | | | | | | | | | | | | | | | | | | |
Exchange Traded Funds | | $ | — | | $ | — | | $ | — | | $ | — | | $ | — | | | $ | 18,508,763 | | $ | — |
Common Stocks | | | 4,637,036 | | | 165,983,028 | | | 13,035,671 | | | 10,163,612 | | | 28,925,176 | | | | — | | | 13,288,936 |
Money Market Funds | | | 31,192 | | | 5,650,863 | | | 92,643 | | | — | | | 449,530 | | | | 716,835 | | | 471,000 |
Level 2 | | | | | | | | | | | | | | | | | | | | | | |
Repurchase Agreements for Securities Loaned | | | 460,323 | | | 19,295,767 | | | 357,200 | | | — | | | 606,349 | | | | 5,303,247 | | | 2,869,137 |
Level 3 | | | | | | | | | | | | | | | | | | | | | | |
Common Stocks | | | — | | | — | | | — | | | — | | | — | (a) | | | — | | | — |
Total | | $ | 5,128,551 | | $ | 190,929,658 | | $ | 13,485,514 | | $ | 10,163,612 | | $ | 29,981,055 | | | $ | 24,528,845 | | $ | 16,629,073 |
| | Meidell Tactical Advantage
ETF | | | | Newfleet Multi-Sector Income ETF | | Pacific Asset Enhanced Floating Rate ETF | | | | | | |
Level 1 | | | | | | | | | | | | | | | | | | | | | | |
Exchange Traded Funds | | $ | 13,618,316 | | $ | — | | $ | — | | $ | — | | $ | — | | $ | 67,041,000 | | | $ | — |
Common Stocks | | | — | | | 51,777,791 | | | — | | | — | | | — | | | — | | | | — |
Money Market Funds | | | 1,140,528 | | | 192,733 | | | 2,304,335 | | | 5,138,631 | | | 4,070,630 | | | 3,436,256 | | | | 5,693,719 |
Level 2 | | | | | | | | | | | | | | | | | | | | | | |
Mortgage Backed Securities | | | — | | | — | | | 51,308,322 | | | — | | | — | | | — | | | | 4,969,928 |
Asset Backed Securities | | | — | | | — | | | 57,702,664 | | | — | | | — | | | — | | | | 18,903,950 |
Corporate Bonds | | | — | | | — | | | 49,192,446 | | | 2,344,683 | | | 103,855,777 | | | — | | | | 36,723,718 |
Term Loans | | | — | | | — | | | 23,090,193 | | | 21,829,677 | | | 29,509,208 | | | — | | | | — |
Foreign Bonds | | | — | | | — | | | 13,099,470 | | | 127,657 | | | 17,877,665 | | | — | | | | 7,394,199 |
U.S. Government Agency Securities | | | — | | | — | | | 2,623,563 | | | — | | | — | | | — | | | | — |
U.S. Treasury Note | | | — | | | — | | | — | | | — | | | — | | | — | | | | 3,718,973 |
U.S. Treasury Bill | | | — | | | — | | | — | | | — | | | — | | | — | | | | 99,532 |
Repurchase Agreements for Securities Loaned | | | 3,890,798 | | | 7,202,669 | | | 564,997 | | | 239,435 | | | 15,051,179 | | | — | | | | 345,800 |
Liabilities | | | | | | | | | | | | | | |
Level 1 | | | | | | | | | | | | | | | | | | | | | | |
Common Stocks | | | — | | | — | | | — | | | — | | | — | | | (141,498,960 | ) | | | — |
Level 2 | | | | | | | | | | | | | | | | | | | | | | |
Swaps Contracts† | | | — | | | — | | | — | | | 2,386 | | | — | | | — | | | | — |
Total | | $ | 18,649,642 | | $ | 59,173,193 | | $ | 199,885,990 | | $ | 29,682,469 | | $ | 170,364,459 | | $ | (71,021,704 | ) | | $ | 77,849,819 |
121
ADVISORSHARES TRUST
Notes to Financial Statements (Continued)
December 31, 2017 (unaudited)
5. Summary of Fair Value Disclosure – (continued)
| | STAR Global Buy-Write ETF | | | | |
Level 1 | | | | | | | | | | |
Exchange Traded Funds | | $ | 16,299,793 | | | $ | — | | $ | — |
Common Stocks | | | — | | | | 7,766,307 | | | 122,955,377 |
Purchased Options | | | 48,739 | | | | — | | | — |
Money Market Funds | | | 622,658 | | | | 69,987 | | | 2,076,152 |
Level 2 | | | | | | | | | | |
Repurchase Agreements for Securities Loaned | | | — | | | | — | | | 2,530,714 |
Liabilities | | | | | | | | | | |
Level 1 | | | | | | | | | | |
Written Options | | | (7,950 | ) | | | — | | | — |
Total | | $ | 16,963,240 | | | $ | 7,836,294 | | $ | 127,562,243 |
There were no recognized transfers between Level 1 and Level 2.
A reconciliation of assets or liabilities in which Level 3 inputs are used in determining fair value is presented when there are significant (individually, greater than 1% of the net assets of a fund, or collectively, greater than 5% of the net assets of a fund) Level 3 assets or liabilities at the end of the period.
6. Derivative Instruments
The Funds have adopted authoritative standards of accounting for derivative instruments which establish disclosure requirement for derivative instruments. These standards improve financial reporting for derivative instruments by requiring enhanced disclosures that enables investors to understand how and why a fund uses derivatives instruments, how derivatives instruments are accounted for and how derivative instruments affect a fund’s financial position and results of operations. The Funds use derivative instruments as part of their principal investment strategy to achieve their investment objective.
At December 31, 2017, the fair values of derivative instruments were as follows:
Statements of Assets and Liabilities:
| | | | | | | | | | |
Pacific Asset Enhanced Floating Rate ETF | | Unrealized Appreciation on Swaps Contracts | | $ | — | | $ | — | | $ | — | | $ | 2,386 |
STAR Global Buy-Write ETF | | Options Purchased, at Value | | | 48,739 | | | — | | | — | | | — |
| | | | | | | | | | |
STAR Global Buy-Write ETF | | Options Written, at Value | | $ | (7,950 | ) | | $ | — | | $ | — | | $ | — |
| | | | | | | | | | | | | | | |
122
ADVISORSHARES TRUST
Notes to Financial Statements (Continued)
December 31, 2017 (unaudited)
6. Derivative Instruments – (continued)
Transactions in derivative instruments during the period ended December 31, 2017, were as follows:
Statements of Operations:
| | | | | | | | | | |
Pacific Asset Enhanced Floating Rate ETF | | Swaps | | $ | — | | | $ | — | | $ | — | | $ | (26,574 | ) |
STAR Global Buy-Write ETF | | Investments – Options Purchased | | | (159,441 | ) | | | — | | | — | | | — | |
STAR Global Buy-Write ETF | | Options Written | | | (127,922 | ) | | | — | | | — | | | — | |
| | Change in
Unrealized Gain (Loss): | | | | | | | | |
Pacific Asset Enhanced Floating Rate ETF | | Swaps | | $ | — | | | $ | — | | $ | — | | $ | 25,429 |
STAR Global Buy-Write ETF | | Investments – Options Purchased | | | (7,109 | ) | | | — | | | — | | | — |
STAR Global Buy-Write ETF | | Options Written | | | (2,281 | ) | | | — | | | — | | | — |
For the period ended December 31, 2017, the average volume of the derivatives opened by the Funds was as follows:
| | Pacific Asset Enhanced Floating Rate ETF | | STAR Global Buy-Write ETF |
Long Swaps Contracts | | 4,000,000 | | — |
Purchased Options Contracts | | — | | 728 |
Written Options Contracts | | — | | 3,436 |
7. Federal Income Tax
Each Fund intends to qualify as a ‘‘regulated investment company’’ under Sub-chapter M of the Internal Revenue Code of 1986, as amended. If so qualified, the Funds will not be subject to Federal income tax to the extent it distributes substantially all of its net investment income and net capital gains to its shareholders. Accounting for Uncertainty in Income Taxes provides guidance for how uncertain tax positions should be recognized, measured, presented and disclosed in the financial statements, and requires the evaluation of tax positions taken or expected to be taken in the course of preparing a Fund’s tax returns to determine whether the tax positions are ‘‘more-likely-than-not’’ of being sustained by the applicable tax authority. Tax positions not deemed to meet the more-than-likely-than-not threshold would be recorded as a tax benefit or expense in the current year. Interest and penalty related to income taxes would be recorded as income tax expense. Management of the Funds is required to analyze all open tax years (2015 − 2017), as defined by IRS statute of limitations, for all major jurisdictions, including federal tax authorities and certain state tax authorities. As of December 31, 2017, the Funds did not have a liability for any unrecognized tax benefits. The Funds have no examination in progress and is not aware of any tax positions for which it is reasonably possible that the amounts of unrecognized tax benefits will significantly change in the next twelve months.
123
ADVISORSHARES TRUST
Notes to Financial Statements (Continued)
December 31, 2017 (unaudited)
7. Federal Income Tax – (continued)
At December 31, 2017, the approximate cost of investments, excluding short positions, and net unrealized appreciation (depreciation) for federal income tax purposes was as follows:
| | | | Gross Unrealized Appreciation | | Gross Unrealized (Depreciation) | | Net Unrealized Appreciation (Depreciation) | | Other Derivatives Net Unrealized Appreciation (Depreciation) |
Cornerstone Small Cap ETF | | $ | 4,386,395 | | $ | 809,496 | | $ | (67,340 | ) | | 742,156 | | | $ | — | |
Dorsey Wright ADR ETF | | | 166,799,047 | | | 24,703,093 | | | (572,482 | ) | | 24,130,611 | | | | — | |
Focused Equity ETF | | | 12,071,366 | | | 1,459,364 | | | (45,216 | ) | | 1,414,148 | | | | — | |
KIM Korea Equity ETF | | | 8,169,016 | | | 2,069,035 | | | (74,439 | ) | | 1,994,596 | | | | — | |
Madrona Domestic ETF | | | 24,664,616 | | | 5,956,417 | | | (639,978 | ) | | 5,316,439 | | | | — | |
Madrona Global Bond ETF | | | 24,212,945 | | | 468,223 | | | (152,323 | ) | | 315,900 | | | | — | |
Madrona International ETF | | | 14,659,560 | | | 2,449,019 | | | (479,506 | ) | | 1,969,513 | | | | — | |
Meidell Tactical Advantage ETF | | | 18,630,254 | | | 79,649 | | | (60,261 | ) | | 19,388 | | | | — | |
New Tech and Media ETF | | | 58,555,101 | | | 1,670,202 | | | (1,052,110 | ) | | 618,092 | | | | — | |
Newfleet Multi-Sector Income ETF | | | 199,454,879 | | | 1,258,068 | | | (826,957 | ) | | 431,111 | | | | — | |
Pacific Asset Enhanced Floating Rate ETF | | | 29,947,923 | | | 175,933 | | | (443,773 | ) | | (267,840 | ) | | | 2,386 | |
Peritus High Yield ETF | | | 170,236,682 | | | 3,841,665 | | | (3,713,888 | ) | | 127,777 | | | | — | |
Ranger Equity Bear ETF | | | 70,551,506 | | | — | | | (74,250 | ) | | (74,250 | ) | | | (3,554,623 | ) |
Sage Core Reserves ETF | | | 77,817,476 | | | 131,503 | | | (99,160 | ) | | 32,343 | | | | — | |
STAR Global Buy-Write ETF | | | 14,550,270 | | | 2,450,162 | | | (29,242 | ) | | 2,420,920 | | | | 10,678 | |
Vice ETF | | | 7,549,398 | | | 324,358 | | | (37,462 | ) | | 286,896 | | | | — | |
Wilshire Buyback ETF | | | 119,267,349 | | | 11,755,662 | | | (3,460,768 | ) | | 8,294,894 | | | | — | |
124
ADVISORSHARES TRUST
Notes to Financial Statements (Continued)
December 31, 2017 (unaudited)
7. Federal Income Tax – (continued)
Under current tax regulations, capital losses on securities transactions realized after October 31 (‘‘Post-October Losses’’) may be deferred and treated as occurring on the first business day of the following fiscal year. Under the recently enacted Regulated Investment Company Modernization Act of 2010, the Funds will be permitted to defer taxable ordinary income losses incurred after December 31 and treat as occurring on the first business day of the following fiscal year. Post-October losses and ordinary income losses deferred to July 1, 2017 are as follows:
| | Late Year Ordinary Loss Deferral | | Short-Term Capital
Post-October Loss | | Long-Term Capital
Post-October Loss |
Cornerstone Small Cap ETF | | $ | — | | $ | — | | $ | — |
Dorsey Wright ADR ETF | | | — | | | — | | | — |
Focused Equity ETF | | | — | | | — | | | — |
KIM Korea Equity ETF | | | — | | | — | | | — |
Madrona Domestic ETF | | | — | | | — | | | — |
Madrona Global Bond ETF | | | — | | | — | | | — |
Madrona International ETF | | | — | | | — | | | — |
Meidell Tactical Advantage ETF | | | 11,870 | | | — | | | — |
New Tech and Media ETF | | | — | | | — | | | — |
Newfleet Multi-Sector Income ETF | | | — | | | — | | | — |
Pacific Asset Enhanced Floating Rate ETF | | | — | | | — | | | — |
Peritus High Yield ETF | | | — | | | — | | | — |
Ranger Equity Bear ETF | | | 1,474,035 | | | — | | | — |
Sage Core Reserves ETF | | | — | | | — | | | — |
STAR Global Buy-Write ETF | | | — | | | — | | | — |
Vice ETF | | | — | | | — | | | — |
Wilshire Buyback ETF | | | — | | | — | | | — |
125
ADVISORSHARES TRUST
Notes to Financial Statements (Continued)
December 31, 2017 (unaudited)
7. Federal Income Tax – (continued)
The following Funds have capital loss carryforwards available to offset future realized gains of:
| | Short-Term
Post-Effective
No Expiration | | Long-Term
Post-Effective
No Expiration | | |
Cornerstone Small Cap ETF | | $ | — | | $ | — | | $ | — |
Dorsey Wright ADR ETF | | | 2,784,113 | | | 382,910 | | | 3,167,023 |
Focused Equity ETF | | | 5,916 | | | — | | | 5,916 |
KIM Korea Equity ETF | | | — | | | — | | | — |
Madrona Domestic ETF | | | 1,577,848 | | | 1,779,622 | | | 3,357,470 |
Madrona Global Bond ETF | | | 318,626 | | | 586,355 | | | 904,981 |
Madrona International ETF | | | 4,920,018 | | | 1,015,881 | | | 5,935,899 |
Meidell Tactical Advantage ETF | | | 998,325 | | | 27,512 | | | 1,025,837 |
New Tech and Media ETF | | | — | | | — | | | — |
Newfleet Multi-Sector Income ETF | | | 1,221,328 | | | 4,262,558 | | | 5,483,886 |
Pacific Asset Enhanced Floating Rate ETF | | | 172,284 | | | 36,966 | | | 209,250 |
Peritus High Yield ETF | | | 96,105,972 | | | 83,617,507 | | | 179,723,479 |
Ranger Equity Bear ETF | | | 208,972,932 | | | 175,200 | | | 209,148,132 |
Sage Core Reserves ETF | | | 164,529 | | | 163,870 | | | 328,399 |
STAR Global Buy-Write ETF | | | — | | | 680,372 | | | 680,372 |
Vice ETF | | | — | | | — | | | — |
Wilshire Buyback ETF | | | 19,751,742 | | | 2,202,053 | | | 21,953,795 |
8. Other Affiliated Parties and Transactions
Affiliated holdings are funds which are managed by the Trust or an affiliate of the Trust. Transactions with affiliated companies during the period ended December 31, 2017 were as follows:
| | | | | | | | | | | | | | |
Madrona Global Bond ETF | | | | | | | | | | | | | | | | | | | | | | | |
Peritus High Yield ETF | | $ | 2,226,968 | | $ | 127,164 | | $ | (1,063,338 | ) | | $ | 18,109 | | $ | (7,756 | ) | | $ | 1,301,147 | | $ | 59,311 |
Ranger Equity Bear ETF | | | | | | | | | | | | | | | | | | | | | | | |
Sage Core Reserves ETF | | | 67,182,750 | | | — | | | — | | | | — | | | (141,750 | ) | | | 67,041,000 | | | 495,923 |
126
ADVISORSHARES TRUST
Notes to Financial Statements (Continued)
December 31, 2017 (unaudited)
9. Investment Transactions
Purchases and sales of investments for the period ended December 31, 2017 were as follows:
| | | | |
| | | | | | | | | | | | |
Cornerstone Small Cap ETF | | $ | 2,070,033 | | $ | — | | $ | 2,409,101 | | $ | 2,253,198 | | $ | — | | $ | 2,315,391 |
Dorsey Wright ADR ETF | | | 16,505,162 | | | — | | | 87,507,435 | | | 17,946,581 | | | — | | | 6,691,220 |
Focused Equity ETF | | | 3,245,835 | | | — | | | 2,331,472 | | | 3,404,593 | | | — | | | 2,339,601 |
KIM Korea Equity ETF | | | 5,683,196 | | | — | | | — | | | 6,282,520 | | | — | | | — |
Madrona Domestic ETF | | | 4,197,830 | | | — | | | — | | | 4,012,255 | | | — | | | — |
Madrona Global Bond ETF | | | 1,063,894 | | | — | | | 1,278,580 | | | 1,165,749 | | | — | | | — |
Madrona International ETF | | | 2,738,194 | | | — | | | 759,019 | | | 2,237,595 | | | — | | | — |
Meidell Tactical Advantage ETF | | | 119,191,143 | | | — | | | — | | | 119,370,718 | | | — | | | 732,103 |
New Tech and Media ETF | | | 87,374,763 | | | — | | | 57,213,330 | | | 86,897,876 | | | — | | | 4,755,933 |
Newfleet Multi-Sector Income ETF | | | 90,205,385 | | | — | | | — | | | 135,226,490 | | | 7,143,083 | | | — |
Pacific Asset Enhanced
Floating Rate ETF | | | 12,463,883 | | | — | | | — | | | 10,588,528 | | | — | | | — |
Peritus High Yield ETF | | | 108,992,017 | | | — | | | — | | | 113,295,027 | | | — | | | 13,239,602 |
Ranger Equity Bear ETF | | | 319,219,451 | | | — | | | — | | | 275,314,613 | | | — | | | — |
Sage Core Reserves ETF | | | 21,560,131 | | | 1,261,333 | | | — | | | 25,787,796 | | | 3,048,904 | | | — |
STAR Global Buy-Write ETF | | | 1,267,932 | | | — | | | — | | | 1,201,423 | | | — | | | 1,452,753 |
Vice ETF | | | 153,587 | | | — | | | 7,433,652 | | | 105,108 | | | — | | | — |
Wilshire Buyback ETF | | | 95,198,726 | | | — | | | 65,675,154 | | | 95,318,423 | | | — | | | 91,518,722 |
10. Risks Involved with Investing in the Funds
The Funds are subject to the principal risks described below, some or all of these risks may adversely affect the Funds’ NAV, trading price, yield, total return and ability to meet its investment objective. As with any investment, an investment in each Fund could result in a loss or the performance of each Fund could be inferior to that of other investments.
Credit Risk
Credit risk is the risk that an issuer or guarantor of debt instruments or the counterparty to a financial transaction, including derivatives contracts, repurchase agreements or loans of portfolio securities, is unable or unwilling to make timely interest and/or principal payments or to otherwise honor its obligations. The Fund’s, and its affiliates, manage counterparty credit risk by entering into transactions only with counterparties that they believe have the financial resources to honor their obligations and by monitoring the financial stability of those counterparties. Financial assets, which potentially expose the Funds to issuer and counterparty credit risks, consist principally of financial instruments and receivables due from counterparties. The extent of each Fund’s exposure to credit and counterparty risks with respect to those financial assets is approximated by their value recorded in its Statements of Assets and Liabilities. High yield securities may also be subject to greater levels of credit or default risk than higher-rated securities and high yield securities may be less liquid and more difficult to sell at an advantageous time or price or to value than higher-rated securities. In particular, high yield securities are often issued by smaller, less creditworthy companies or by highly leveraged (indebted) companies, which are generally less able than more financially stable companies to make scheduled payments of interest and principal.
127
ADVISORSHARES TRUST
Notes to Financial Statements (Continued)
December 31, 2017 (unaudited)
10. Risks Involved with Investing in the Funds – (continued)
Fund of Funds Risk
Some of the Funds’ investment performance, because they are fund of funds, depends on the investment performance of the Underlying ETFs in which they invest. An investment in these Funds is subject to the risk associated with the Underlying ETFs that comprise their Underlying Index. The Funds will indirectly pay a proportional share of the asset-based fees, if any, of the Underlying ETFs in which they invest.
Liquidity Risk
In certain circumstances, it may be difficult for the Fund to purchase and sell particular investments within a reasonable time at a fair price. To the extent that there is not an established retail market for instruments in which the Fund may invest, trading in such instruments may be relatively inactive. Trading in shares may be halted because of market conditions or for reasons that, in the view of the Exchange, make trading in shares inadvisable. In addition, trading in shares is subject to trading halts caused by extraordinary market volatility pursuant to ‘‘circuit breaker’’ rules. There can be no assurance that the requirements necessary to maintain the listing of the shares of the Fund will continue to be met or will remain unchanged.
Market Risk
Investments in securities, in general, are subject to market risks that may cause their prices to fluctuate over time. The Fund’s investments may decline in value due to factors affecting securities markets generally, or particular countries, segments, economic sectors, industries or companies within those markets. The value of a security held in a short position may increase due to general economic and market conditions which are not specifically related to a particular issuer, such as real or perceived positive economic conditions or changes in interest or currency rates. Because the market value of ETF shares may differ from their net asset value, the shares may trade at a premium or discount. An investment in the Fund may lose money.
New Fund Risk
Some of the Funds are new funds. As new funds, there can be no assurance that the Funds will grow to or maintain an economically viable size, in which case the Funds may experience greater tracking error to their Underlying Index than it otherwise would be at higher asset levels or it could ultimately liquidate.
128
ADVISORSHARES TRUST
Notes to Financial Statements (Continued)
December 31, 2017 (unaudited)
11. Subsequent Events
The Funds have adopted authoritative standards of accounting for disclosure of events that occur after the Statements of Assets and Liabilities date but before financial statements are issued or are available to be issued. These standards require the Fund to recognize in the financial statements the effects of all recognized subsequent events that provide additional evidence about conditions that existed at December 31, 2017.
Since December 31, 2017 the following events occurred:
The following Funds paid dividends after December 31, 2017:
| | | | Ordinary
Income Per Share Distributed | | |
Madrona Global Bond ETF | | FWDB | | $ | 0.04004 | | 1/31/2018 |
Newfleet Multi-Sector Income ETF | | MINC | | | 0.09200 | | 1/31/2018 |
Pacific Asset Enhanced Floating Rate ETF | | FLRT | | | 0.13258 | | 1/31/2018 |
Peritus High Yield ETF | | HYLD | | | 0.19208 | | 1/31/2018 |
Sage Core Reserves ETF | | HOLD | | | 0.12125 | | 1/31/2018 |
Effective February 13, 2018, the AdvisorShares Trust Board of Trustees has approved a transition of the AdvisorShares Peritus High Yield ETF from the AdvisorShares Trust to the Exchange Traded Concepts Trust II, which is sponsored by Exchange Traded Concepts. Peritus Asset Management will continue to manage the Fund after this transition. The change in the ETF Trust will still ensure that normal business will remain intact for the Fund, not affecting the ETF’s investment approach and fund operations during this transition.
129
Board Review of Investment Advisory and Sub-Advisory Agreements
Approval of the Advisory and Sub-Advisory Agreements for AdvisorShares New Tech and Media ETF
At a meeting held on May 17, 2017, the Board of Trustees (the “Board”) of the AdvisorShares Trust (the “Trust”), including those trustees who are not “interested persons” of the Trust, as that term is defined in the Investment Company Act of 1940 (the “1940 Act”) (the “Independent Trustees”), considered the approval of the investment advisory agreement (the “Advisory Agreement”) between the Trust and AdvisorShares Investments, LLC (the “Advisor”) on behalf of the AdvisorShares New Tech and Media ETF (the “Fund”). The Board noted that the Advisor provides investment advisory services to the other series of the Trust and that the renewal of the investment advisory agreement with respect to those series was considered at the same meeting. The Board also considered the approval of a separate sub-advisory agreement (the “Sub-Advisory Agreement” and collectively with the Advisory Agreement, the “New Agreements”) between the Advisor and Sabretooth Advisors, LLC (the “Sub-Advisor”), on behalf of the Fund, pursuant to which the Sub-Advisor performs portfolio management and related services for the Fund.
In connection with its consideration of the New Agreements, the Board, including the Independent Trustees, was presented with, and requested, received and evaluated, materials about the New Agreements and the services proposed to be provided thereunder, including information about the key features of the Fund and related matters from the Advisor and Sub-Advisor. In that regard, the Board reviewed presentations from the Sub-Advisor, which included information with respect to staffing, management, organizational structure, and investment philosophy and processes at the firm. The Board also reviewed information regarding the proposed investment advisory fee rates and various other materials that it considered relevant to its consideration and approval of the proposed New Agreements. In addition, the Board reviewed information provided by the Advisor in connection with the renewal of its advisory agreement with respect to the other series of the Trust.
In considering each of the New Agreements, the Board considered factors bearing on the nature, extent and quality of the services proposed to be provided to the Fund and the costs of those services, with a view toward making a business judgment as to whether each of the proposed New Agreements is, under the circumstances, in the best interests of the Fund. In its deliberations, the Board did not identify any single piece of information that was paramount or controlling and individual trustees may have attributed different weights to various factors. Certain factors considered by the Board are addressed in more detail below.
Nature, Extent and Quality of Services
In considering the nature, extent and quality of the services to be provided by the Advisor and Sub-Advisor to the Fund, the Board reviewed, among other things, the Sub-Advisor’s personnel, experience, and compliance program. The Board considered the background and experience of the Sub-Advisor’s senior management and the qualification and background of the portfolio manager proposed to be responsible for the day-to-day portfolio management of the Fund. The Board also reviewed information pertaining to the Sub-Advisor’s organizational structure, investment operations, and other relevant information, including information relating to the financial condition of the Sub-Advisor, to determine whether adequate resources were available to provide a high level of service to the Fund.
The Board noted the extensive responsibilities that the Advisor has as investment advisor to the Fund, including the selection of the Fund’s sub-advisors and oversight of the sub-advisors’ compliance with Fund policies and objectives, oversight of general Fund compliance with federal and state laws, and the implementation of Board directives as they relate to the Fund.
The Board concluded that, within the context of its full deliberations, it was satisfied with the nature, extent and quality of the services to be provided to the Fund by the Advisor and the Sub-Advisor.
130
Board Review of Investment Advisory and Sub-Advisory Agreements (Continued)
Performance
In connection with the assessment of the ability of the Sub-Advisor to perform its duties under the Sub-Advisory Agreement, the Board considered the sufficiency of the Sub-Advisor’s resources and concluded that the Sub-Advisor had the financial resources necessary to perform its obligations under the Sub-Advisory Agreement. The Board also reviewed information about the Sub-Advisor’s investment philosophy, the proposed portfolio construction of the Fund, and the specific investment techniques to be employed, as well as information regarding the investment performance of the type of stocks to be included in the proposed portfolio.
Cost of Services and Profitability
The Board considered the cost of the services to be provided by the Advisor and Sub-Advisor, reviewed the fees to be paid pursuant to the New Agreements, and considered estimated profitability information. The Board noted that the Advisor would be responsible for paying the Sub-Advisor out of the advisory fee it receives from the Fund. The Board also reviewed information regarding advisory fees of comparable funds, and evaluated the proposed fee arrangements in light of this information and the factors that judicial decisions have specified as pertinent generally. The Board also considered the Advisor’s contractual arrangements to waive its advisory fee and/or reimburse expenses in an effort to control the expense ratios of the Fund. Based on its review, within the context of its full deliberations, the Board determined that the fees proposed to be paid to the Advisor and Sub-Advisor are fair and reasonable.
Economies of Scale
The Board considered the potential for economies of scale and determined that it would reconsider this factor at an appropriate time in the future. In the event there were to be significant asset growth in the Fund, the Board determined to reassess whether the investment advisory and sub-advisory fees appropriately took into account any economies of scale that had been realized as a result of that growth.
Ancillary Benefits
The Board noted the potential benefits to be received by the Sub-Advisor as a result of its relationship with the Fund (other than the sub-advisory fee), including the intangible benefits of its association with the Trust generally and any favorable publicity arising in connection with the Fund’s performance.
Conclusion
Based on its deliberations and evaluation of the information described above, the Board, including the Independent Trustees, unanimously: (i) concluded that the terms of the New Agreements are fair and reasonable; (ii) concluded that the fee to be paid to the Advisor is fair and reasonable in light of the services that it will provide to the Fund; (iii) concluded that the fee to be paid to the Sub-Advisor is fair and reasonable in light of the services that the Sub-Advisor will provide to the Fund; and (iv) agreed to approve each of the New Agreements for an initial term of two years.
Approval of the Advisory Agreement for AdvisorShares Vice ETF
At a meeting held on August 16, 2017, the Board, including the Independent Trustees, considered the approval of the investment advisory agreement (the “Advisory Agreement”) between the Trust and the Advisor on behalf of the AdvisorShares Vice ETF (the “Fund”). The Board noted that the Advisor provides investment advisory services to the other series of the Trust and that the renewal of the advisory agreement with respect to those series had been considered and approved by the Board at its May 2017 meeting.
131
Board Review of Investment Advisory and Sub-Advisory Agreements (Continued)
In connection with its consideration of the Advisory Agreement, the Board, including the Independent Trustees, was presented with, and requested, received and evaluated, materials about the services proposed to be provided thereunder, including information about the key features of the Fund and related matters. In that regard, the Board reviewed a presentation from the Advisor, which included information with respect to the investment advisory fee rate, the services to be provided, and the proposed portfolio managers.
In considering the Advisory Agreement, the Board considered factors bearing on the nature, extent and quality of the services proposed to be provided to the Fund and the cost of those services, with a view toward making a business judgment as to whether the Advisory Agreement is, under the circumstances, in the best interests of the Fund. In its deliberations, the Board did not identify any single piece of information that was paramount or controlling and individual trustees may have attributed different weights to various factors. Certain factors considered by the Board are addressed in more detail below.
Nature, Extent and Quality of Services
In considering the nature, extent and quality of the services to be provided by the Advisor to the Fund, the Board noted that the Advisor would be providing portfolio management services to the Fund and reviewed, among other things, the qualification and background of the portfolio managers proposed to be responsible for the day-to-day portfolio management of the Fund. The Board also reviewed information pertaining to the other services to be provided by the Advisor to the Fund and the Advisor’s capacity to provide such services. The Board concluded that, within the context of its full deliberations, it was satisfied with the nature, extent and quality of the services to be provided to the Fund by the Advisor.
Performance
In connection with the assessment of the ability of the Advisor to perform its duties under the Advisory Agreement, the Board considered the sufficiency of its resources and concluded that the Advisor had the financial and operational resources necessary to perform its obligations under the Advisory Agreement. The Board also reviewed information about the Advisor’s investment philosophy and the proposed portfolio construction of the Fund.
Cost of Services and Profitability
The Board considered the cost of the services to be provided by the Advisor, reviewed the fee to be paid pursuant to the Advisory Agreement, and considered the estimated profitability projected by the Advisor. The Board also reviewed information regarding advisory fees of comparable funds, and evaluated the proposed fee arrangement in light of this information and the factors that judicial decisions have specified as pertinent generally. The Board also considered the Advisor’s contractual arrangement to waive its advisory fee and/or reimburse expenses in an effort to control the expense ratio of the Fund. Based on its review, within the context of its full deliberations, the Board determined that the fee proposed to be paid to the Advisor is fair and reasonable.
Economies of Scale
The Board considered the potential for economies of scale and determined that it would reconsider this factor at an appropriate time in the future. In the event there were to be significant asset growth in the Fund, the Board determined to reassess whether the investment advisory fee appropriately took into account any economies of scale that had been realized as a result of that growth.
132
Board Review of Investment Advisory and Sub-Advisory Agreements (Continued)
Conclusion
Based on its deliberations and evaluation of the information described above, the Board, including the Independent Trustees, unanimously: (i) concluded that the terms of the Advisory Agreement are fair and reasonable; (ii) concluded that the fee to be paid to the Advisor is fair and reasonable in light of the services that it will provide to the Fund; and (iii) agreed to approve the Advisory Agreement for an initial term of two years.
Renewal of the Sub-Advisory Agreements for AdvisorShares Ranger Equity Bear ETF and AdvisorShares STAR Global Buy-Write ETF
At the meeting held on August 16, 2017, the Board, including the Independent Trustees, unanimously approved the renewal of separate sub-advisory agreements (collectively, the “Sub-Advisory Agreements”) with respect to certain series of the Trust (each a “Fund” and collectively the “Funds”), between the Advisor and (1) Partnervest Advisory Services, on behalf of the AdvisorShares STAR Global Buy-Write ETF, and (2) Ranger Alternative Management, L.P., on behalf of the AdvisorShares Ranger Equity Bear ETF (collectively, the “Sub-Advisors”), pursuant to which the Sub-Advisors perform portfolio management and related services for the Funds.
Pursuant to Section 15 of the 1940 Act, to continue after their initial two-year term, the Sub-Advisory Agreements must be approved annually (i) by the vote of the Board or by a vote of the shareholders of the Funds and (ii) by the vote of a majority of the Independent Trustees, cast in person at a meeting called for the purpose of voting on such approval. Each year, the Board calls and holds a meeting to decide whether to renew the Sub-Advisory Agreements for an additional one-year term. In preparation for the meeting, the Board requests and reviews a wide variety of information from the Advisor and Sub-Advisors. The Board uses this information, as well as other information that the Advisor, Sub-Advisors and other service providers may submit to the Board, to help decide whether to renew the Sub-Advisory Agreements for an additional year.
As discussed in further detail below, prior to the meeting, the Board, including the Independent Trustees, reviewed written materials from the Advisor and each Sub-Advisor regarding, among other things: (i) the nature, extent and quality of the services provided by the Sub-Advisor; (ii) the personnel and operations of the Sub-Advisor; (iii) the investment performance of each Fund; (iv) the costs of the services provided and profits and other benefits realized by the Sub-Advisor and its affiliates from the relationship with each Fund; (v) the extent to which economies of scale would be realized as each Fund grows; and (vi) whether fee levels reflect the sharing of these economies of scale for the benefit of each Fund’s shareholders. At the meeting, the Board was presented with additional information to help it evaluate each Sub-Advisor’s fee and other aspects of the Sub-Advisory Agreements.
The Board received an overview of each Sub-Advisor’s operations and management of the Funds, including comparative fee data and profitability analysis for each Fund, and was also provided with information with respect to compliance oversight. The Board reviewed the management of each Fund, including the Fund’s strategy, the focus in the markets, the Fund’s positioning in the market, and its attractive and unique offering. The Board reviewed each Sub-Advisor’s overall business generally, including any noteworthy personnel changes.
The Board deliberated on the renewal of the Sub-Advisory Agreements in light of the written materials that it received before the meeting, information it received at the meeting, and information it had received at prior board meetings. In its deliberations, the Board considered the factors and reached the conclusions described below relating to the selection of each Sub-Advisor and the renewal of its Sub-Advisory Agreement. The Board did not identify any single piece of information discussed below that was paramount, controlling or determinative of its decision.
133
Board Review of Investment Advisory and Sub-Advisory Agreements (Continued)
Nature, Extent and Quality of Services
In considering the nature, extent and quality of the services provided by each Sub-Advisor, the Board reviewed the portfolio management services provided to each Fund. The most recent Form ADV for each Sub-Advisor also was provided to the Board, as were responses to a detailed series of questions that, among other things, requested information about their business, services, and compensation. The Board considered each Sub-Advisor’s overall quality of personnel, operations, and financial condition, its investment advisory capabilities, and information concerning each Sub-Advisor’s compliance function, operational capabilities, and portfolio management team. Based on its review, within the context of its full deliberations, the Board determined that it was satisfied with the nature, extent and quality of the services provided to the Funds by the Sub-Advisors.
Performance
The Board was provided with information regarding each Fund’s performance for various periods, as well as comparative performance information. Each Sub-Advisor provided information regarding factors impacting the performance of the Funds, outlining current market conditions, and explaining its expectations and strategies for the future. Based on this information, the Board concluded that it was satisfied with the investment results that each Sub-Advisor had been able to achieve for its respective Fund.
Cost of Advisory Services and Profitability
In considering whether the sub-advisory fees payable with respect to each Fund were reasonable, the Board reviewed the sub-advisory fees paid by the Advisor to each Sub-Advisor, the fees waived and/or expenses reimbursed by each Sub-Advisor over the period, the costs and other expenses incurred by each Sub-Advisor in providing advisory services, and the profitability analysis with respect to each Fund. The Board also reviewed information comparing the advisory fees paid by each Fund to those paid by comparable funds. Based on its review, in the context of its full deliberations, the Board concluded for each Fund that the sub-advisory fees appeared reasonable in light of the services rendered.
Economies of Scale
The Board considered for each Fund whether economies of scale were realized during the current contract period, noting any fee waivers and/or expense reimbursements by the Sub-Advisors and whether the Advisor’s and/or Sub-Advisors’ fees included breakpoints. The Board determined to reassess at an appropriate time in the future whether the aggregate advisory fee appropriately took into account any economies of scale that had been realized as a result of any significant asset growth of the Funds.
Ancillary Benefits
The Board noted the potential benefits to be received by each Sub-Advisor as a result of its relationship with a Fund (other than the sub-advisory fee), including the intangible benefits of its association with the Trust generally and any favorable publicity arising in connection with the Fund’s performance.
134
Board Review of Investment Advisory and Sub-Advisory Agreements (Continued)
Conclusion
Based on its deliberations and evaluation of the information described above, the Board, including the Independent Trustees, unanimously: (i) concluded that the terms of each Sub-Advisory Agreement are fair and reasonable; (ii) concluded that each Sub-Advisor’s fee is reasonable in light of the services that it provides to its respective Fund; and (iii) agreed to renew each Sub-Advisory Agreement for another year.
Approval of New and Interim Advisory and Sub-Advisory Agreements for AdvisorShares Cornerstone Small Cap ETF, AdvisorShares Dorsey Wright ADR ETF, AdvisorShares Focused Equity ETF, AdvisorShares KIM Korea Equity ETF, AdvisorShares Madrona Domestic ETF, AdvisorShares Madrona Global Bond ETF, AdvisorShares Madrona International ETF, AdvisorShares Meidell Tactical Advantage ETF, AdvisorShares New Tech and Media ETF, AdvisorShares Newfleet Multi-Sector Income ETF, AdvisorShares Pacific Asset Enhanced Floating Rate ETF, AdvisorShares Peritus High Yield ETF, AdvisorShares Ranger Equity Bear ETF, AdvisorShares Sage Core Reserves ETF, AdvisorShares STAR Global Buy-Write ETF, AdvisorShares Vice ETF, and AdvisorShares Wilshire Buyback ETF
Prior to September 8, 2017, the Advisor was majority owned by Wilson Lane Group, LLC, which is owned by Noah Hamman, the Advisor’s Chief Executive Officer, and partially owned by another party holding a minority interest. As of September 8, 2017, the minority owner no longer owns any equity interest in the Advisor and the Advisor is 100% wholly owned by Wilson Lane Group. Although Wilson Lane Group was already a majority owner of the Advisor, this caused a technical change in control of the Advisor under the 1940 Act and resulted in the assignment and automatic termination of the previous investment advisory agreement dated June 2, 2009 between the Trust and the Advisor pursuant to which the Advisor served as advisor to each series of the Trust (the “Prior Advisory Agreement”). In addition to the assignment and automatic termination of the Prior Advisory Agreement, the change in control also resulted in the automatic termination of each sub-advisory agreement between the Advisor and the sub-advisors to each sub-advised series of the Trust (collectively, the “Prior Sub-Advisory Agreements).
At a meeting held on September 15, 2017, the Board considered and approved an interim investment advisory agreement (the “Interim Advisory Agreement”) between the Trust and the Advisor, on behalf of each series of the Trust (each a “Fund” and, collectively, the “Funds”), and separate interim sub-advisory agreements (collectively with the Interim Advisory Agreement, the “Interim Agreements”) between the Advisor and each of (i) Cornerstone Investment Partners, LLC, relating to the AdvisorShares Cornerstone Small Cap ETF, (ii) Dorsey, Wright & Associates, LLC, relating to AdvisorShares Dorsey Wright ADR ETF, (iii) Korea Investment Management Co., Ltd., relating to AdvisorShares KIM Korea Equity ETF, (iv) Madrona Funds, LLC, relating to AdvisorShares Madrona Domestic ETF, AdvisorShares Madrona Global Bond ETF, and AdvisorShares Madrona International ETF, (v) American Wealth Management, relating to AdvisorShares Meidell Tactical Advantage ETF, (vi) Sabretooth Advisors, LLC, relating to AdvisorShares New Tech and Media ETF, (vii) Newfleet Asset Management, LLC, relating to AdvisorShares Newfleet Multi-Sector Income ETF, (viii) Pacific Asset Management, relating to AdvisorShares Pacific Asset Enhanced Floating Rate ETF, (ix) Peritus I Asset Management, LLC, relating to AdvisorShares Peritus High Yield ETF, (x) Ranger Alternative Management, L.P., relating to AdvisorShares Ranger Equity Bear ETF, (xi) Sage Advisory Services, Ltd. Co., relating to AdvisorShares Sage Core Reserves ETF, (xii) Partnervest Advisory Services LLC, relating to AdvisorShares STAR Global Buy-Write ETF, and (xiii) Wilshire Associates Incorporated, relating to AdvisorShares Wilshire Buyback ETF (collectively, the “Sub-Advisors”), consistent with the requirements of Rule 15a-4 under the 1940 Act, pursuant to which the Advisor and each respective Sub-Advisor continued to serve as the investment advisor and sub-advisor, as applicable, to its respective Fund(s) after the Prior Advisory Agreement and Prior Sub-Advisory Agreements terminated on September 8, 2017.
135
Board Review of Investment Advisory and Sub-Advisory Agreements (Continued)
At a meeting held on October 10, 2017, the Board, including the Independent Trustees, considered and approved a new advisory agreement between the Trust and the Advisor (the “New Advisory Agreement”), on behalf of each Fund, and separate new sub-advisory agreements (together with the New Advisory Agreement, the “New Agreements”) pursuant to which the Sub-Advisors would continue to perform portfolio management and related services. With respect to the Board’s consideration and approval, references below to the New Agreements also refer to the Interim Agreements as applicable.
The Board’s approval of the New Advisory Agreement, on behalf of each Fund, and each Sub-Advisory Agreement, on behalf of the AdvisorShares Madrona Domestic ETF, AdvisorShares Madrona Global Bond ETF, AdvisorShares Madrona International ETF, AdvisorShares Meidell Tactical Advantage ETF, AdvisorShares Peritus High Yield ETF, and AdvisorShares Ranger Equity Bear ETF, was made subject to shareholder approval.
In considering whether to approve the Interim Advisory Agreement and New Advisory Agreement, the Board reviewed and discussed information and analysis provided by the Advisor over the course of the Advisor’s service as investment adviser to the Funds, noting that it had considered and approved the annual renewal of the Prior Advisory Agreement at its May 2017 meeting. The Board also considered and discussed information provided by the Advisor about the circumstances leading to its change in control. In considering whether to approve the Interim and New Sub-Advisory Agreements, the Board reviewed and discussed information and analysis provided by each Sub-Advisor over the course of the Sub-Advisor’s service as investment sub-adviser to its respective Fund(s), noting that it had considered either the initial approval or annual renewal of each Prior Sub-Advisory Agreement at a meeting held within the prior twenty months (the “Prior Meetings”). In considering each of the New Agreements, the Board considered factors bearing on the nature, extent and quality of the services proposed to be provided to the Funds and the costs of those services, with a view toward making a business judgment as to whether each of the New Agreements is, under the circumstances, in the best interests of the Funds. In its deliberations, the Board did not identify any single piece of information that was paramount or controlling and individual trustees may have attributed different weights to various factors. Certain factors considered by the Board are addressed in more detail below.
Nature, Extent and Quality of Services
In considering the nature, extent and quality of the services provided by the Advisor, the Board noted that the most recent Form ADV for the Advisor had been provided to the Board at the May 2017 meeting, as were the Advisor’s responses to a detailed series of questions that requested, among other things, information about its business, services, and compensation. The Board considered the Advisor’s overall quality of personnel, operations, and financial condition, its investment advisory capabilities, and information concerning the Advisor’s compliance function, operational capabilities, and portfolio management team. The Board also noted the extensive responsibilities that the Advisor has as investment adviser to the Funds, including the selection of certain Funds’ sub-advisors and oversight of the sub-advisors’ compliance with Fund policies and objectives, oversight of general Fund compliance with federal and state laws, and the implementation of Board directives as they relate to the Funds. The Board considered the effect, if any, of the change in control on the Advisor’s ability to continue to provide the level of service it had been providing to the Funds and specifically considered the ability of the Advisor to continue to meet its financial obligations. Based on its review, within the context of its full deliberations, the Board determined that it was satisfied with the nature, extent and quality of the services provided, and expected to continue to be provided, to the Funds by the Advisor.
In considering the nature, extent and quality of the services provided by each Sub-Advisor to its respective Fund, the Board reviewed the portfolio management services provided to the Funds. The
136
Board Review of Investment Advisory and Sub-Advisory Agreements (Continued)
Board noted that the most recent Form ADV for each Sub-Advisor had been provided to the Board at the Prior Meetings, as were the Sub-Advisor’s responses to a detailed series of questions that requested, among other things, information about its business, services, and compensation. The Board considered each Sub-Advisor’s overall quality of personnel, experience, and compliance program. The Board considered the background and experience of each Sub-Advisor’s senior management and the qualification and background of the portfolio managers responsible for the day-to-day portfolio management of the Funds. The Board also reviewed information pertaining to each Sub-Advisor’s organizational structure, investment operations, and other relevant information, including information relating to the financial condition of the Sub-Advisor to determine whether adequate resources were available to provide a high level of service to the Funds. Based on its review, within the context of its full deliberations, the Board determined that it was satisfied with the nature, extent and quality of the services provided to each Fund by its respective Sub-Advisor.
Performance
At the Prior Meetings, the Board was provided with information regarding each operational Fund’s performance for various periods, as well as comparative performance information. The Advisor and Sub-Advisors provided information regarding factors impacting the performance of the Funds, outlining current market conditions, and explaining its expectations and strategies for the future. Based on this information, the Board concluded that it was satisfied with the investment results that the Advisor and each Sub-Advisor had been able to achieve for their respective Fund(s).
Cost of Services and Profitability
In considering whether a Fund’s advisory and sub-advisory fees were reasonable, the Board had reviewed at the Prior Meetings the advisory fees paid by each Fund to the Advisor, the sub-advisory fees paid by the Advisor to each Sub-Advisor, the fees waived and/or expenses reimbursed by the Advisor and/or a Sub-Advisor, the costs and other expenses incurred by the Advisor and a Sub-Advisor in providing advisory services, and the Advisor’s and a Sub-Advisor’s profitability analysis with respect to each respective Fund, as applicable. The Board also had reviewed information comparing the advisory and sub-advisory fees paid by the Funds to those paid by comparable funds. The Board noted that the fees under the New Agreements are the same as the fees under the Prior Advisory and Sub-Advisory Agreements and the Interim Agreements. Based on its review, in the context of its full deliberations, the Board concluded for each Fund that the advisory and sub-advisory fees appeared reasonable in light of the services rendered.
Economies of Scale
At the Prior Meetings, the Board considered whether economies of scale were realized, noting the fee waivers and expense reimbursements by the Advisor and the Sub-Advisors and whether the fees included breakpoints. The Board determined to reassess at an appropriate time in the future whether the advisory fees appropriately took into account any economies of scale that had been realized as a result of any significant asset growth of the Funds.
Ancillary Benefits
At the Prior Meetings, the Board noted the potential benefits to be received by the Advisor and each Sub-Advisor as a result of its relationship with a Fund (other than the advisory and sub-advisory fee), including the intangible benefits of its association with the Trust generally and any favorable publicity arising in connection with the Fund’s performance.
137
Board Review of Investment Advisory and Sub-Advisory Agreements (Continued)
Conclusion
Based on its deliberations and evaluation of the information described above, the Board, including the Independent Trustees, unanimously: (i) concluded that the terms of the New Agreements are fair and reasonable; (ii) concluded that the Advisor’s fees are fair and reasonable in light of the services that it provides to each Fund; (iii) concluded that each Sub-Advisor’s fee is fair and reasonable in light of the services that the Sub-Advisor provides to its respective Fund(s); and (iv) agreed to approve each of the New Agreements for and initial term of two years.
138
Quarterly Portfolio Holdings Information
The Funds are required to file their complete schedule of portfolio holdings with the SEC for their first and third quarters on Form N-Q. Copies of the filings are available without charge on the SEC’s website at www.sec.gov. You can also obtain copies of Form N-Q by visiting the SEC’s Public Reference Room in Washington, DC. Information on the operation of the Public Reference Room may be obtained by calling 1-800-SEC-0330.
Proxy Voting Information
A description of the Funds proxy voting policies and procedures, as well as a record of how the Funds voted proxies during the most recent 12-month period ended June 30, is available without charge upon request by calling 1-877-843-3831. This information is also available on the SEC’s website at www.sec.gov.
Premium/Discount Information
Information about the differences between the daily market price on the secondary market for the shares of a Fund and the Fund’s net asset value may be found on the Fund’s website at www.advisorshares.com.
139
Investment Advisor
AdvisorShares Investments, LLC
4800 Montgomery Lane, Suite 150
Bethesda, MD 20814
Sub-Advisors
Madrona Funds, LLC
2911 Bond Street, Suite 105
Everett, WA 98201
Ranger Alternative Management, L.P.
2828 N. Harwood Street, Suite 1900
Dallas, TX 75201
Peritus I Asset Management, LLC
26 West Anapamu, 3rd Floor
Santa Barbara, CA 93103
American Wealth Management
570 Hammill Lane
Reno, NV 89511
Newfleet Asset Management, LLC
100 Pearl Street
Hartford, CT 06103
Partnervest Advisory Services, LLC
1216 State Street, 3rd Floor
Santa Barbara, CA 93101
Sage Advisory Services, Ltd. Co.
5900 Southwest Parkway, Building I
Austin, TX 78735
Pacific Life Fund Advisors, LLC
700 Newport Center Drive
Newport Beach, CA 92660
Cornerstone Investment Partners, LLC
3438 Peachtree Road NE, Suite 900
Atlanta, GA 30326
Dorsey, Wright & Associates, LLC
1101 Boulder Spring Drive, Suite 150
Richmond, VA 23225
Korea Investment Management Co., Ltd.
88 Uisadang-Daero, Yeondgdeungpo
Seoul, Korea, 150-745
Wilshire Associates Incorporated
1299 Ocean Avenue
Santa Monica, CA 90401
Sabretooth Advisors, LLC
2600 Philmont Avenue, Suite 215
Huntington Valley, PA 19006
Distributor
Foreside Fund Services, LLC
Three Canal Plaza, Suite 100
Portland, ME 04101
Custodian/Fund Administrator/Transfer Agent
The Bank of New York Mellon
101 Barclay Street
New York, NY 10286
Legal Counsel
Morgan, Lewis & Bockius LLP
1111 Pennsylvania Avenue, NW
Washington, D.C. 20004
Independent Registered Public Accounting Firm
Tait, Weller & Baker LLP
1818 Market Street
Philadelphia, PA 19103
This report is submitted for the general information of the shareholders of the Fund. It is not authorized for distribution to prospective investors unless preceded or accompanied by an effective prospectus, which includes information regarding the Fund’s risks, objectives, fees and expenses, experience of management and other information.
Not Applicable for the semi-annual reporting period.
Not Applicable for the semi-annual reporting period.
Not Applicable for the semi-annual reporting period.
Not Applicable for the semi-annual reporting period.
Not applicable.
Not applicable.
Not applicable.
Not applicable.
Not applicable.
Pursuant to the requirements of the Securities Exchange Act of 1934 and the Investment Company Act of 1940, the registrant has duly caused this report to be signed on its behalf by the undersigned, thereunto duly authorized.
Pursuant to the requirements of the Securities Exchange Act of 1934 and the Investment Company Act of 1940, this report has been signed below by the following persons on behalf of the registrant and in the capacities and on the dates indicated.