Annual Report
March 31, 2007
| | |
| | |
| | |
| | |
| | |
U.S. Equity Funds | | |
Laudus Rosenberg U.S. Large Capitalization Fund | | |
Laudus Rosenberg U.S. Large Capitalization Growth Fund | | |
Laudus Rosenberg U.S. Large Capitalization Value Fund | | |
Laudus Rosenberg U.S. Discovery Fund (closed to new investors) | |
Laudus Rosenberg U.S. Small Capitalization Fund (closed to new investors) | |
| | |
International Equity Funds | | |
Laudus Rosenberg International Equity Fund | | |
Laudus Rosenberg International Discovery Fund | | |
Laudus Rosenberg International Small Capitalization Fund (closed) | |
| | |
Long/Short Equity Funds | | |
Laudus Rosenberg U.S. Large/Mid Capitalization Long/Short Equity Fund | |
Laudus Rosenberg Global Long/Short Equity Fund | | |
Laudus Rosenberg Value Long/Short Equity Fund | | |
Each of the Funds is a series of Laudus Trust, which is an open-end management investment company offering diversified portfolios with different investment objectives and strategies.
Charles Schwab Investment Management, Inc. is the Adviser to the Funds and AXA Rosenberg Investment Management LLC is the Sub-adviser.
Table of Contents
1 | President’s Message |
| |
2 | Management’s Discussion |
| |
13 | Performance and Fund Facts |
| |
30 | Fund Expenses |
| |
32 | Portfolio Holdings |
| |
130 | Financial Statements and Notes |
| |
157 | Report of Independent Registered Public Accounting Firm |
| |
158 | Trustees and Officers of Laudus Trust |
| |
163 | Definitions, Terms and Other Information |
Nothing in this report represents a recommendation of a security by the investment adviser. Portfolio Manager views and portfolio holdings may have changed since the report date.
Notice About Duplicate Mailings
In order to reduce expenses of the Laudus Trust incurred in connection with the mailing of prospectuses, prospectus supplements, semi-annual reports and annual reports to multiple shareholders at the same address, Laudus Trust may in the future deliver one copy of a prospectus, prospectus supplement, semi-annual report or annual report to a single investor sharing a street address or post office box with other investors, provided that all such investors have the same last name or are believed to be members of the same family. This process, called ‘‘householding,’’ will continue indefinitely unless you instruct us otherwise. If you share an address with another investor and wish to receive your own prospectus, prospectus supplements, semi-annual reports and annual reports, please call the Trust toll-free at 800.447.3332.
Each of the Funds is a series of the Laudus Trust (the ‘‘Trust’’), an open-end management investment company offering multiple portfolios with different investment objectives and strategies. Except as explicitly described otherwise, the investment objective and policies of each of the Funds may be changed without shareholder approval. The Funds are advised by Charles Schwab Investment Management, Inc. (‘‘CSIM’’). AXA Rosenberg Investment Management LLC (‘‘AXA Rosenberg’’) acts as Sub-adviser to the Funds. The Funds are distributed by ALPS Distributors, Inc.
President’s Message

Evelyn Dilsaver is President and CEO of Laudus Funds. She joined the firm in 1992 and has held a variety of executive positions at Schwab.
Dear Shareholder,
I am pleased to present the annual report for the Laudus Rosenberg Funds for the year ended March 31, 2007. With support from investors like you, Laudus Rosenberg Funds assets exceeded $4.6 billion as of this report date.
The Laudus Rosenberg Funds are sub-advised by AXA Rosenberg, one of the world’s premier equity specialists and institutional money managers. The funds employ the kind of highly consistent investment approach that is a hallmark of institutional-style investing. Since making this distinctive approach to investment management available to investment advisers and individual investors in 2004, the total assets of the Laudus Rosenberg Funds have grown by over 250%.
We continue to evaluate opportunities to expand our product offering through funds that leverage this framework. To that end, I’m pleased to report that on May 31, 2006, we launched the Laudus Rosenberg International Discovery Fund which has $71 million in net assets as of the end of the report period. The fund utilizes the same investment discipline used in all of the Laudus Rosenberg Funds and provides international small/mid-cap exposure in developed and emerging markets.
In closing, I would like to emphasize that your trust is very important to us and I will do all I can to maintain that trust. Thank you for investing in Laudus Funds.
Sincerely,

Investors should consider carefully information contained in the prospectus, including investment objectives, risks, charges and expenses. You can request a prospectus by calling 1-800-447-3332. Please read the prospectus carefully before investing.
Laudus Trust Annual Report 1
Management’s Discussion for the year ended March 31, 2007
U.S. Market Overview
U.S. markets over the past twelve months have been struck by sharp bouts of increased volatility. In June 2006 and February 2007, markets corrected sharply following renewed concern of the durability of global economic growth. Worries surrounding the U.S. sub-prime mortgage market, uncertainty regarding the U.S. Federal Reserve Open Market Committee’s next move on interest rate levels, and slowing corporate earnings in the U.S. were but a few of the concerns hanging over the markets during the past twelve months.
The Open Market Committee raised the federal funds target rate to 5.25% in June 2006, a rate that has remained unchanged since then. The Federal Reserve chairman, in his most recent comments, dampened hopes that the central bank had adopted a softer policy stance by reinforcing inflation concerns and by emphasizing that the Fed would not abandon its bias towards raising interest rates.
Macroeconomic data released during Q1 07 painted a somewhat mixed picture for the economy. Weak data on new homes sales and durable good orders heightened investors’ fears about a sharp slowdown in economic growth. Although there was an upward revision to fourth quarter 2006 U.S. GDP, most market participants recognize that growth has been below trend for the last three quarters. Corporate earnings are anticipated to be weaker and expectations are for the slowest growth in more than three years, with consensus growth of around 4% versus the past ten quarters of double-digit growth.
Continuing signs of a slow down in U.S. housing and the growing trouble in the sub-prime housing mortgage industry weighed on the market in Q1 07. Concerns grew that the steep losses in the securities backed up by sub-prime loans would increase investor risk-aversion and prompt further market losses, threatening an already troubled housing market. Sub-prime mortgages, written on properties for clients with little or no equity, continue to remain vulnerable. A number of mortgage companies, which made these loans, are seeing significant default rates and some have filed for bankruptcy, further heightening market concern.
The price of oil rallied as the first quarter came to a close, driven by geo-political issues with Iran, OPEC declining to raise production targets, and renewed growth in energy demand from China — all of which pushed the price of oil above $65 per barrel. Industrial metals such as copper, tin, and lead, after slipping during the first part of the year, rallied strongly at month-end on news of improving global demand. After a robust 2006, the mergers and acquisition environment continued at a torrid pace in the first quarter and has provided further support to the markets as announced deals in the U.S. reached $439 billion and over $1.1 trillion globally.
The dollar weakened against the world’s major currencies on persistent domestic economic growth concerns and news that the U.S. was initiating sanctions against selected Chinese industries. Also weighing on the dollar has been a bias towards global monetary tightening this quarter in Japan, India, China, United Kingdom, and Europe, as the dollar has become a less appealing currency relative to higher-yielding peers.
U.S. Equity Funds Performance
Total returns are for the year ended 3/31/07. For performance details, see pages 13 through 17.
Laudus Rosenberg U.S. Large Capitalization Fund(1,2) |
AXLIX | AXLVX | Russell |
Institutional shares | Investor shares | 1000 Index |
11.10% | 10.69% | 11.84% |
| | |
Laudus Rosenberg U.S. Large Capitalization Growth Fund(1) |
REDIX | REFIX | Russell 1000 |
Institutional shares | Investor shares | Growth Index |
5.62% | 5.36% | 7.06% |
| | |
Laudus Rosenberg U.S. Large Capitalization Value Fund(1,2) |
LLCVX | LCVJX | Russell 1000 |
Institutional shares | Investor shares | Value Index |
13.45% | 13.22% | 16.83% |
| | |
Laudus Rosenberg U.S. Discovery Fund(1,3) | |
(Closed to new investors) | |
RDISX | RDIVX | Russell 2500 |
Institutional shares | Investor shares | Index |
5.71% | 5.34% | 8.23% |
| | |
Laudus Rosenberg U.S. Small Capitalization Fund(1,3) |
(Closed to new investors) | |
USCIX | LIFUX BRSCX | Russell 2000 |
Institutional shares | Adviser Investor shares | Index |
1.11% | shares 0.75% | 5.91% |
| 0.90% | |
Past performance does not guarantee future results. The performance data quoted represents past performance, and current returns may be lower or higher. The performance information does not reflect the deduction of taxes that a shareholder would pay on fund distributions or the redemption of fund shares. The investment return and principal value will fluctuate so that an investor’s shares, when redeemed, may be worth more or less than the original cost. To obtain performance information current to the most recent month end, visit www.laudus.com.
2 Laudus Trust Annual Report
Management’s Discussion continued
Performance data quoted does not reflect the non-recurring redemption fee of 2% that may be charged if shares are sold or exchanged within 30 days of the purchase date. If these fees were reflected, the performance data quoted would be lower.
Total returns include change in share price and reinvestment of distributions. Total returns reflect the waiver of a portion of a Fund’s advisory or administrative fees for certain periods since the inception date. In such instances, and without the waiver of fees, total return would have been lower.
Investors cannot invest directly in any index.
(1) Equity securities (stocks) are more volatile and carry more risk than other forms of investments, including investments in high-grade fixed income securities. The net asset value per share of this Fund will fluctuate as the value of the securities in the portfolio changes. Common stocks, and funds investing in common stocks, generally provide greater return potential when compared with other types of investments.
(2) Value-based investments are subject to the risk that the broad market may not recognize their value.
(3) Small capitalization funds typically carry additional risks since smaller companies generally have experienced a greater degree of market volatility.
Laudus Rosenberg U.S. Large Capitalization Fund
For its fiscal year ended 3/31/07, the Fund posted a positive return but underperformed its benchmark, the Russell 1000 Index: the Fund’s Investor Shares gained 10.69% versus the benchmark’s return of 11.84%. While the Fund’s exposure to risk factors provided a positive contribution, it was offset primarily by industry allocation; stock selection had little impact.
Among risk factors, the Fund’s overweight to earnings variation was its single largest contributor for the year, as the market rewarded companies with more-consistent earnings. Overweights to Book-to-Price and Earnings-to-Price measures — traditional value factors and reflective of the Fund’s value orientation — also contributed, as the Fund generally held more deeply undervalued stocks than did the benchmark, and value generally outperformed growth for the reporting period. Correspondingly, the Fund’s overweight to stocks demonstrating strong short-term growth was its largest drag among risk factors. An overweight to stocks with higher relative strength, an indicator of growth, also detracted.
Among industries, the Fund’s consistent overweight to Basic Materials & Metals throughout the year was the strongest contributor to performance. Although volatile over the year, Integrated Oil Companies posted a strong one-year return, so the Fund’s substantial overweight to the industry contributed notably to returns. An overweight to Miscellaneous Finance, which includes brokerages and capital markets, also contributed for the period. The Fund’s substantial underexposure to Construction & Homebuilding, one of the few negatively performing industries for the year, worked in the Fund’s favor, contributing slightly as demand weakened and inventories rose.
In a year in which most industries in the domestic large-cap universe posted positive returns, it is not surprising that the primary industry detractors from performance came from underweight positions. First among them was the Fund’s substantial underexposure to REITs. Although the impact of this position has moderated recently, for the year REITs generally performed well. An underweight to Retail, another double-digit gainer for the year, also dampened performance, as did underweights to Drugs & Pharmaceuticals, Instruments, and Software.
Laudus Rosenberg U.S. Large Capitalization Growth Fund For its fiscal year ended 3/31/07, the Fund posted a positive return but underperformed its benchmark, the Russell 1000 Growth Index: the Fund’s Investor Shares gained 5.36% versus the benchmark’s return of 7.06%. While stock selection contributed slightly to performance, it was overshadowed by the impact of industry allocation. The Fund’s exposure to risk factors had little net effect.
Among industries, the Fund’s consistent overweight to Basic Materials & Metals throughout the year was the strongest contributor to performance. An overexposure to Miscellaneous Finance, which includes brokerages and capital markets, was the Fund’s second-largest industry contributor, as the economy held up well and the industry benefited over the reporting period. Overweights to Government Aircraft & Defense and Chemicals & Rubber — although volatile over the year — also contributed.
However, in a year in which most industries in the benchmark’s universe posted positive returns, it is not surprising that the primary detractors from performance came from underweight positions in positively performing industries, and such positions for the most part overshadowed the gains of the Fund’s overweight positions. First among them was the Fund’s underweight to the strongly performing Retail industry, which constitutes the largest component in the Fund’s benchmark. And although the impact of the Fund’s substantial underexposure to REITs has moderated recently, for the year REITs generally performed well, and the position hurt the Fund. The
Laudus Trust Annual Report 3
Management’s Discussion continued
Fund’s substantial underweight to Construction & Homebuilding, one of the year’s few negatively performing industries, worked in its favor, contributing slightly as the industry declined as housing demand weakened and inventories rose.
Among risk factors, the portfolio has more of a value orientation than its benchmark, as evidenced by its overexposures to Book-to-Price and Earnings-to-Price measures — traditional value factors — both of which contributed notably, as the Fund generally held more deeply undervalued stocks than did the benchmark. Stocks with more of a value-orientation generally outperformed growth for the reporting period. On the other hand, although the impact of this factor varied from quarter to quarter, the Fund’s overexposure to stocks with high relative strength detracted from Fund performance over the year. Because stocks with higher relative strength tend to have better-than-average near-term earnings growth, our Earnings Forecast Model tends to favor such stocks when we find that these expectations are not fully reflected in stock prices; and the market finally rewarded this factor in the first quarter of 2007. The Fund’s overweight to stocks demonstrating strong short-term growth also detracted.
Laudus Rosenberg U.S. Large Capitalization Value Fund For its fiscal year ended 3/31/07, the Fund posted a positive return but underperformed its benchmark, the Russell 1000 Value Index: the Fund’s Investor Shares gained 13.22% versus the benchmark’s return of 16.83%. The Fund’s underperformance was primarily attributable to its industry allocation, although exposure to risk factors and stock selection also detracted.
Among industries, the Fund’s consistent overweight to Basic Materials & Metals was the strongest contributor to performance. An overexposure to Miscellaneous Finance, which includes brokerages and capital markets, was the Fund’s second-largest industry contributor, as the economy held up well and the industry benefited over the reporting period. And although volatile over the year, Oil & Coal Resources posted a positive one-year performance, so the Fund’s substantial overweight to the industry also contributed notably.
However, in a year in which most industries in the benchmark’s universe posted positive returns, it is not surprising that the primary industry detractors from performance came from underweight positions in positively performing industries, and such positions for the most part overshadowed the gains of the Fund’s overweight positions. First among them was the Fund’s substantial underexposure to Electric Utilities, the third-strongest industry performer for the period, as investors favored the dividend yields paid by these companies. Although the impact of the Fund’s substantial underexposure to REITs has moderated recently, for the year REITs, generally performed well; hence, the underweight position hurt the Fund. An underweight to Communications Utilities, the strongest-performing industry for the year, also dampened performance. An overweight to Land & Water Transportation, although posting a slightly positive return for the period, also dragged on performance, as did underweights to Chemicals & Rubber and Integrated Oil Companies. The Fund’s substantial underexposure to Construction & Homebuilding, one of the year’s few negatively performing industries, worked in its favor, contributing slightly as demand weakened and inventories rose.
Among risk factors, the Fund’s exposure to companies exhibiting stronger growth characteristics and trading activity than the benchmark represented the two largest detractors from Fund performance for the period. Concurrently, its underexposure to yield also dampened performance, as investors favored predictable dividends while the consensus on the direction of the economy remained elusive. However, the Fund’s exposure to more-consistently earning stocks than the benchmark represented its strongest positive contribution among risk factor exposures. In addition, the Fund’s overweights to Book-to-Price and Earnings-to-Price measures — traditional value factors and reflective of the Fund’s value orientation — also contributed, as the Fund generally held more deeply undervalued stocks than did the benchmark, and value generally outperformed growth for the reporting period.
Laudus Rosenberg U.S. Discovery Fund For its fiscal year ended 3/31/07, the Fund posted a positive return but underperformed its benchmark, the Russell 2500TM Index: the Fund’s Investor Shares gained 5.34% for the period versus the benchmark’s gain of 8.23%. The Fund’s underperformance was primarily attributable to stock selection.
An example is Illumina Inc., a medical equipment company that produces tools and systems for genetic analysis. Both our Valuation and Earnings Forecast Model found the stock to be attractive, but a patent litigation award against the company late in the year caused its
4 Laudus Trust Annual Report
Management’s Discussion continued
price to fall. In spite of the judgment, we continue to find the stock attractive. However, in other cases, individual stocks did add value. One, supported by the Earnings Forecast Model, was Allegheny Technologies Inc., a specialty steel and materials company that outperformed due to ongoing strong demand for its products from the Aerospace, Defense and Oil & Gas industries. Another was Avnet, Inc., an electronic parts distributor: while our Earnings Forecast Model has been modestly positive on the stock, our Valuation Model showed a much stronger expectation for outperformance. We added to our initial position, established in 2005, when the price fell during the third quarter of 2006. In January of 2007, the company declared positive earnings and guidance, and the stock rallied thru the end of the period.
Among industries, the Fund’s consistent overweight to Basic Materials & Metals throughout the year was the strongest contributor to performance. Although exhibiting some volatility throughout the year, a substantial overexposure to Insurance stocks also contributed to Fund performance. The Fund’s overweight to the strongly performing Textiles and Apparel industry also contributed notably.
However, in a year in which most industries in the benchmark’s universe posted positive returns, it is not surprising that the primary industry detractors from performance came from underweight positions in positively performing industries, and such positions essentially negated the positives to result in a net zero impact. First among them was the Fund’s substantial underexposure to REITs; although the impact has moderated recently, for the year REITs generally performed well, and the underweight position hurt the Fund. An underexposure to Communications Utilities — the year’s strongest performer — also detracted from performance; the performance of both of those industries are indicative of investors’ taste for dividend yield over the year. And while the Fund’s underexposure to the poorly performing Construction & Homebuilding detracted only slightly from performance, Construction Materials held up surprisingly well in this environment, posting a double-digit return, and the Fund’s underweighting had more of a dampening effect. An underexposure to Publishing, Broadcasting & Cinema also detracted.
Among risk factors, while over- and underweightings have not measurably changed during the year, the impact of the Fund’s exposures to those risk factors varied substantially. For instance, the Fund’s continued higher exposure to traditional value factors compared to the benchmark — such Book-to-Price and Earnings-to-Price measures — represented its strongest risk factor contributors for the year. The Fund’s overweight to earnings variation contributed as the market rewarded companies with more-consistent earnings. Detracting somewhat, but not nearly enough to overcome the positive risk factor contributors, was the portfolio’s heavy overweighting to relative strength, a measure of recent price performance. High-relative-strength stocks tend to have better-than-average near-term earnings growth, but the market did not reward this factor for the reporting period. A slight underexposure to yield, which was rewarded by the market, also detracted from performance.
Laudus Rosenberg U.S. Small Capitalization Fund
For its fiscal year ended 3/31/07, the Fund posted a slightly positive return but underperformed its benchmark, the Russell 2000 Index: the Fund’s Investor Shares gained 0.75% versus the benchmark’s gain of 5.91%. The Fund’s underperformance was primarily attributable to stock selection, although exposures to risk factors compensated somewhat. Industry allocation also detracted.
Among underperforming stocks, for example, was Checkpoint Systems, a producer of electronic surveillance and radio frequency tags for retail sales systems. Both our Valuation and Earnings Forecast Models found the stock to be attractive, but it suffered as the company announced weaker earnings in the third quarter of 2006. The stock has rallied from its mid-year lows, and we continued to hold it despite its negative contribution for this fiscal year. Other stocks did contribute positively. CF Industries Holdings, one of North America’s largest manufacturers and distributors of nitrogen and phosphate fertilizer products, gained driven by expectations of rising fertilizer prices as a result of farmers gearing up to plant their largest corn crop in 60 years to meet demand from the ethanol industry. When we began building our position last October, both our Valuation and Earnings Forecast Models showed the stock to be a bargain; since its price rose, the Valuation Model has reverted to a near-neutral outlook, but the Earnings Forecast Model continues to find its earnings prospects attractive. In addition, strong stock selection within the
Laudus Trust Annual Report 5
Management’s Discussion continued
Financial sector also contributed, notably by avoiding stocks affected by the sub-prime lending collapse.
Among industries, the Fund’s consistent overweight to Basic Materials & Metals throughout the year was the strongest contributor to performance; it was the strongest-performing industry for the year. The Fund’s overweight to Retail also contributed strongly, as small-cap retailers generally performed well, as did an overweight to the strongly performing Textiles and Apparel industry. Although exhibiting some volatility throughout the year, a substantial overexposure to Insurance companies also contributed to Fund performance, as our models found them attractive; as of the close of the fiscal year, the Fund’s overweight in Insurance represented its largest industry overweight.
However, in a year in which most industries in the benchmark’s universe posted positive returns, it is not surprising that the primary industry detractors from performance came from underweight positions in positively performing industries, and such positions for the most part overshadowed the gains of the Fund’s overweight positions. First among them was the Fund’s substantial underexposure to REITs; although the impact has moderated recently, for the year, REITs generally performed well, and the underweight position hurt the Fund. An underexposure to Drugs & Pharmaceuticals also dragged on performance. Although the Fund’s substantial underweight to Banks & Credit Institutions worked in its favor more recently as it protected the portfolio in large part from the fallout of the sub-prime lending collapse, over the one-year period, the industry posted a positive return, so its exposure detracted from performance. And although underexposed to Construction & Homebuilding, the year’s poorest performer as demand weakened and inventories rose, the position dampened Fund performance. Underexposure to double-digit gainers Cars & Trucks and Construction Materials also detracted.
Among risk factors, while over- and underweightings have not measurably changed during the year, the impact of the Fund’s exposures to those risk factors varied substantially. For instance, the Fund’s higher exposure to traditional value factors compared to the benchmark —such as Book-to-Price and Earnings-to-Price measures —represented its strongest risk factor contributors for the year. For the year, the Fund’s underweight to trading activity also contributed, as did its overweight to earnings
6 Laudus Trust Annual Report variation as the market rewarded companies with more-consistent earnings. Detracting somewhat, but not nearly enough to overcome the positive risk factor contributors, were the portfolio’s heavy overweighting to relative strength, a measure of recent price performance. A slight underexposure to yield, which was rewarded by the market as investors sought predictability, also detracted from performance.
International Equity Market Overview
The past four quarters witnessed strong market performance for international equities. In spite of market weakness in the second quarter of 2006 and the first quarter of 2007, international markets posted solid returns over the past twelve months. Robust corporate earnings, a record level of global merger & acquisition (M&A) activity, firm global economic growth, along with abundant financial liquidity, all helped propel global markets to multi-year highs.
Global markets began the second quarter of 2006 strongly but were sent tumbling in May and June and later in February 2007 only to have markets rebound strongly. Over the past year, a wave of global liquidity has spurred global markets higher, supported by a record period of global M&A deals. Markets shrugged off rising interest rates in Europe and Japan and focused on relatively stable energy prices and continued corporate profit growth. Many commodities, after a multi-year run of price appreciation, retreated from record high levels as supply increased and growth in demand moderated. The dollar was weaker against most major currencies over the past twelve months as monetary tightening in Japan, India, China, United Kingdom, and in Europe has made the dollar a less appealing currency relative to higher yielding peers.
After a pullback in the second quarter of 2006, markets regained their footing and pushed ahead to post multi-year highs as the year came to a close. As the first quarter in 2007 unfolded, a deteriorating U.S. housing market and weakness in the sub-prime lending business caused angst for global investors, but markets recovered as the first quarter of 2007 ended.
The European Central Bank increased interest rates, but in spite of higher rates, European markets posted strong gains. Helping markets push higher was the record level of announced M&A deals in Europe. Over the course of the year the dollar continued to weaken against the Euro.
6 Laudus Trust Annual Report
Management’s Discussion continued
Business confidence levels of the EU economies have continued to improve as the year progressed. European markets were helped by the Fed’s decision to leave rates unchanged in August which translated into significant yield declines in bond markets on both sides of the Atlantic.
Japan has begun to show improved economic growth and the Bank of Japan (BOJ) increased interest rates for the first time since 2000. A new government took power this year under Prime Minister Abe. The major story of the year was the BOJ announcing it will terminate its five-year-old ‘‘quantitative easing policy’’. Japanese markets were impacted by the perception that potentially overly tight monetary policy would lead to weakening domestic export prospects and negatively impact the domestic economic recovery.
Asia Pacific equity markets posted solid returns over the past twelve months. China passed Great Britain to become the world’s fourth largest economy. Australia’s predominately materials-focused economy benefited from the continued global demand for raw materials. There were some difficulties in Asia as the Shanghai market pulled back in late February 2007 which caused considerable global market turbulence and put into question how long the global market rally would continue.
International Equity Funds Performance
Total returns are for the year ended 3/31/07 unless indicated otherwise. For performance details, see pages 18 through 23.
Laudus Rosenberg International Equity Fund(1) | |
REQIX | RIEIX | MSCI-EAFE |
Institutional shares | Investor shares | Index |
18.37% | 18.08% | 20.69% |
| | |
Laudus Rosenberg International Discovery Fund | (1,2,*) |
| | S&P/Citigroup |
| | Global ex US |
| | Broad Market |
| | Index (BMI) |
LIDSX | LIDIX | $2-$10 Billion |
Institutional shares | Investor shares | Cap Range |
21.90% | 21.62% | 22.73% |
| | |
Laudus Rosenberg International | |
Small Capitalization Fund(1,2) | |
(Closed) | | |
| | S&P/Citigroup |
| | World ex US |
| | Extended |
ICSIX | RISIX | Market Index |
Institutional shares | Investor shares | (EMI) |
20.82% | 20.35% | 23.14% |
Past performance does not guarantee future results. The performance data quoted represents past performance, and current returns may be lower or higher. The performance information does not reflect the deduction of taxes that a shareholder would pay on fund distributions or the redemption of fund shares. The investment return and principal value will fluctuate so that an investor’s shares, when redeemed, may be worth more or less than the original cost. To obtain performance information current to the most recent month end, visit www.laudus.com.
Performance data quoted does not reflect the non-recurring redemption fee of 2% that may be charged if shares are sold or exchanged within 30 days of the purchase date. If these fees were reflected, the performance data quoted would be lower.
Total returns include change in share price and reinvestment of distributions. Total returns reflect the waiver of a portion of a Fund’s advisory or administrative fees for certain periods since the inception date. In such instances, and without the waiver of fees, total return would have been lower.
Investors cannot invest directly in any index.
* Performance is for the period May 31, 2006 (inception date) through March 31, 2007 (Not annualized).
(1) There are risks associated with investing in foreign companies, such as erratic market conditions, economic and political instability and fluctuations in currency exchange rates. Investing in emerging markets accentuates these risks.
(2) Small capitalization funds typically carry additional risks since smaller companies generally have experienced a greater degree of market volatility.
Laudus Rosenberg International Equity Fund For its fiscal year ended 3/31/07, the Fund posted a strong positive return but underperformed its benchmark, the MSCI EAFE Index: the Fund’s Investor Shares gained 18.08% for the one-year period versus the benchmark’s gain of 20.69%. Stock selection detracted from performance for the year. Industry allocation also detracted. Exposure to risk factors made a positive contribution; as is typical for this Fund, regional allocation had little net effect.
In general, although many of the Fund’s overweight positions contributed to performance, it was the Fund’s underweight positions that hurt performance most. Among industries, the Fund’s consistent overweight to Basic Materials & Metals was the strongest contributor to performance. An overweight to Insurance was the Fund’s second-largest industry contributor, whose position in the portfolio was driven by our valuation model. An overweight to Chemicals & Rubber also contributed, another of the stronger industry performers for the period. Overweights in Miscellaneous Finance; Photo-optical, Microcomputers & Office Machines; and Cars & Trucks were also notable positive contributors to Fund performance.
Laudus Trust Annual Report 7
Management’s Discussion continued
But the drag from the Fund’s industry underexposures overshadowed the positives. An underweight to Electric Utilities, a strong performer as a result of deregulation in Europe and strong ongoing M&A activity, posting a one-year return that exceeded that of Basic Minerals & Metals, was the largest industry drag on Fund performance. Underweights to Retail and Real Estate Development, also strong performers, also detracted. Although Construction & Homebuilding was weak domestically for the year, internationally the industry held up well, and an underexposure there also hurt the Fund, as did an underexposure to Land & Water Transportation.
Risk factors that made the greatest contribution to Fund performance were overweights to Book-to-Price and Earnings-to-Price measures — traditional value factors that are reflective of the Fund’s value orientation. Over the one-year period, value generally outperformed growth in international markets; although the Fund’s overexposure in those areas was not extreme, the market rewarded those factors for the period. Detracting was the Fund’s slightly higher exposure to volatility (beta) than the benchmark during a period where the market rewarded lower volatility.
Laudus Rosenberg International Discovery Fund
For the ten-month period since its inception through 3/31/07, the Fund posted a positive return but underperformed its benchmark, the S&P/Citigroup Global ex U.S. Broad Market Index $2 - $10 Billion Cap Range. The Fund’s Investor Shares gained 21.62% versus the benchmark’s gain of 22.73% for the same period. While exposure to risk factors and industry allocation contributed somewhat, and stock selection had a small positive contribution, as is expected for this Fund, regional exposure had little net effect.
Among risk factor exposures, the Fund’s greatest contributors to performance were overweights to Book-to-Price and Earnings-to-Price measures — traditional value factors that are reflective of the Fund’s value orientation; over the period, value generally outperformed growth in international markets. Although small, the Fund’s underexposure to relative strength, a growth indicator and strongest factor return for the period by a large measure, also contributed. Detracting most was the Fund’s exposure to somewhat smaller-sized companies than the benchmark, as well as a slightly higher exposure to volatility (beta) during a period in which the market rewarded lower volatility.
In general, the Fund’s overweight positions contributed most to performance, although many of the Fund’s underweight positions detracted. Among industries, the Fund’s consistent overweight to Basic Materials & Metals throughout the year was the strongest contributor to performance. An overweight to Restaurants, Hotels & Theaters was the Fund’s second-largest industry contributor, followed by overweights to Airlines; Communications Utilities; Beer, Liquor & Tobacco; and Government Aircraft & Defense, all very strong performers for the period.
The largest industry drags on performance were almost entirely attributable to underweight exposures compared to the benchmark, led by an underexposure to Real Estate Development, the strongest-performing industry for the year. Although Construction & Homebuilding was weak domestically for the year, internationally the industry held up well, and an underexposure there hurt the Fund and was the largest industry detractor from performance for the period. Underweights to Retail; Publishing, Broadcasting & Cinema; Land & Water Transportation; Information Services; and Construction Materials were the largest detractors from performance on an industry basis.
Laudus Rosenberg International Small Capitalization Fund For its fiscal year ended 3/31/07, the Fund posted a strong positive return but underperformed its benchmark, the S&P/Citigroup World ex U.S. Extended Market Index: the Fund’s Investor Shares gained 20.35% versus the benchmark’s gain of 23.14%. Exposures to risk factors contributed positively; industry allocation also contributed, although to a lesser degree. As is typical for this Fund, regional exposure had little net effect. Stock selection was the greatest overall detractor.
Stock selection dampened performance across holdings in REITs and Miscellaneous Financials (broker/dealers, exchanges and asset managers). For example, one stock that the portfolio did not hold — Deutsche Bouerse —performed strongly on activity in publicly traded exchanges. And individual holdings among British Energy companies declined as problems relating to power-generation plants negatively impacted their earnings; an example is British Land Company, which detracted from performance.
Some individual stock positions did, however, contribute measurably. In the Materials sector, the Fund’s persistent overweight, along with strong stock selection, represents
8 Laudus Trust Annual Report
Management’s Discussion continued
some of the Fund’s most notable successes; holdings in Austrian steel/metals producers B¨ohler-Uddeholm AG and Voestalpine AG both were positive contributors. Metal product manufacturers in Europe performed strongly, where stock selection was rewarded across a large number of holdings. Defense-related and airline picks were also strong; Spanish airline Iberia Lineas and Air France KLM contributed modestly. A long-term holding of French tire-maker Michelin also contributed.
Among risk factor exposures, the Fund’s greatest contributors to performance were overweights to Book-to-Price and Earnings-to-Price measures — traditional value factors that are reflective of the Fund’s value orientation. Over the one-year period, value generally outperformed growth in international markets. An underexposure to higher-growth companies than the benchmark also added value. Detracting from performance was the Fund’s slightly higher exposure to volatility (beta) than the benchmark during a period in which the market rewarded lower volatility.
Among industries, in general, it was the Fund’s overweight exposures that contributed most to performance, although many of the Fund’s underweight positions detracted. The Fund’s consistent overweight to Basic Materials & Metals throughout the year was the strongest contributor to performance. An overweight to Restaurants, Hotels & Theaters was the Fund’s second-largest industry contributor, followed by an overweight to Insurance, whose position in the portfolio was driven by our valuation model. Also contributing were overweights in Government Aircraft & Defense; Airlines; Beer, Liquor & Tobacco; Cars & Trucks; and Miscellaneous Finance, all very strong performers for the period.
The largest industry drags on performance were almost entirely attributable to underweight exposures compared to the benchmark. Although Construction & Homebuild-ing was weak domestically for the year, internationally the industry held up well, so an underexposure there hurt the Fund and was the largest industry detractor from performance for the period. Underweights to Information Services; Real Estate Development; Publishing, Broadcasting & Cinema; Retail; and Gas & Other Public Utilities all dragged on Fund performance for the year. The only overweight position that notably dragged on performance was in Construction Materials. An underweight to Electric Utilities — a strong performer as a result of deregulation in Europe and strong ongoing M&A activity — also detracted.
Long/Short Equity Funds Performance
While the reward to earnings is the biggest driver of our relative performance over time, our portfolios have exposures to risk characteristics and industries that will also have an impact on performance. These active exposures are a by-product of trading off the return opportunities identified by our stock selection models with the risk of deviating on these dimensions between the Long and Short sides of the portfolios.
Total returns are for the year ended 3/31/07. For performance details, see pages 24 through 29.
Laudus Rosenberg U.S. Large/Mid Capitalization | |
Long/Short Equity Fund(1) | | |
SSMNX | RMNIX | 90-Day T-Bills |
Institutional shares | Investor shares | |
4.98% | 4.68% | 5.24% |
| | |
Laudus Rosenberg Global Long/Short Equity Fund(1,2) |
MSMNX | RMSIX | 90-Day T-Bills |
Institutional shares | Investor shares | |
1.77% | 1.45% | 5.24% |
| | |
Laudus Rosenberg Value Long/Short Equity Fund(3,4) |
BMNIX | BRMIX | 90-Day T-Bills |
Institutional shares | Investor shares | |
3.19% | 2.81% | 5.24% |
Past performance does not guarantee future results. The performance data quoted represents past performance, and current returns may be lower or higher. The performance information does not reflect the deduction of taxes that a shareholder would pay on fund distributions or the redemption of fund shares. The investment return and principal value will fluctuate so that an investor’s shares, when redeemed, may be worth more or less than the original cost. To obtain performance information current to the most recent month end, visit www.laudus.com.
Performance data quoted does not reflect the non-recurring redemption fee of 2% that may be charged if shares are sold or exchanged within 30 days of the purchase date. If these fees were reflected, the performance data quoted would be lower.
Total returns include change in share price and reinvestment of distributions. Total returns reflect the waiver of a portion of a Fund’s advisory or administrative fees for certain periods since the inception date. In such instances, and without the waiver of fees, total return would have been lower.
Investments in long/short funds are more volatile and risky than some other forms of investments. Since they have both long and short portfolios, an investment will involve risks associated with twice the number of investment decisions made for a typical stock fund. These types of funds typically have a high portfolio turnover that could increase transaction costs and cause short-term capital gains to be realized. While it may be the intent of the
Laudus Trust Annual Report 9
Management’s Discussion continued
Manager to take long positions in stocks that outperform the market and short positions in stocks that underperform the market, there is no assurance that the Manager will be successful.
The Fund may sell a security short by borrowing it from a third party and selling it at the then-current market price. The Fund is obligated to buy the security on a later date so it can return the security to the lender. Short sales involve the risk that the Fund will incur a loss by subsequently buying a security at a higher price than the price at which the Fund previously sold the security short. Moreover, because the Fund’s loss on a short sale arises from increases in the value of the security sold short, the extent of such loss is theoretically unlimited.
Since risk in long/short funds relates specifically to the Manager’s stock selection techniques and not to any systematic or economy-wide factors, the proper benchmark is an asset that also has the least exposure to systematic influences. 90-day T-bills are such an asset. The full faith and credit of the U.S. government back an investment in 90-day T-bills. T-bills have a fixed rate of return, and investors do not bear the risk of losing their investment. The income received from T-bills is free from state income tax.
(1) Mid capitalization stocks typically carry additional risk, since smaller companies generally have higher risk of failure and, historically, their stocks have experienced a greater degree of volatility.
(2) There are risks associated with investing in foreign companies, such as erratic market conditions, economic and political instability and fluctuations in currency exchange rates.
(3) Value-based investments are subject to the risk that the broad market may not recognize their value.
(4) Small- and mid-capitalization funds typically carry additional risk since small- and mid-capitalization companies generally have a higher risk of failure.
Laudus Rosenberg U.S. Large/Mid Capitalization Long/Short Equity Fund For its fiscal year ended 3/31/07, the Fund posted a positive return but underperformed its benchmark, 90-day T-bills: the Fund’s Investor Shares gained 4.68% versus the benchmark’s gain of 5.24% over the same period. Residual stock selection and exposures to risk factors contributed positively, while industry allocation detracted slightly from performance.
Among industries, contributing net long positions were generally offset by detracting net short positions, with the net result a small drag on overall Fund performance. The Fund’s long-only exposure to Integrated Oil Companies represented its strongest industry contributor; although volatile over the period, the industry posted a strong double-digit gain. A net long exposure to Miscellaneous Finance, which includes brokers and capital markets, was the second-largest industry contributor. A net long position in Basic Minerals & Metals also contributed notably. A net long exposure to Cellular/Wireless also contributed, as did net long exposures to Commercial Aircraft & Components (long-only), Banks & Credit Institutions, and Insurance. The only net short position that contributed notably was in IT Hardware, one of the few negatively performing industries over the reporting period. A substantially net short exposure to Construction & Homebuilding, the year’s worst performer protected the Fund from the fallout of declining home prices and rising inventories, resulting in a modest contribution.
On the other hand, however, detractors at the industry level overshadowed contributors — nearly all coming from net short exposures. The largest detractor was the Fund’s net short exposure to REITs. The Fund’s valuation model has continued to indicate that the industry is overvalued; however, the industry continued to post strong returns for the report period. Net short exposures to Instruments; Software; Soaps & Cosmetics; and Drugs & Pharmaceuticals also worked against it for the year as all posted strong positive returns. A modest net long exposure to Land & Water Transportation, along with a substantial one to Oil Drilling and Services, both worked against the Fund.
Among individual holdings, although each has a relatively small impact on overall Fund performance, a long position in Countrywide Financial dragged on the Fund as the company suffered from the fallout of the sub-prime lending collapse. A long holding in credit-card giant Capital One Financial also detracted, as it was caught in the maelstrom due to concerns that the deterioration would spread to auto lending and credit cards — two large components of Capital One’s managed loan portfolio. On the other hand, long positions in AT&T and Apple contributed notably on the backs of improved profits and strong overall performance.
The Fund is managed for long-term performance and seeks to outperform its benchmark through various market conditions as a result of superior stock picking. Consistent with the Fund’s underlying model, it seeks to capitalize on stocks with both long-term earnings and those with accelerating near-term earnings growth.
Laudus Rosenberg Global Long/Short Equity Fund
For its fiscal year ended 3/31/07, the Fund posted a positive return but underperformed its benchmark, 90-day T-bills: the Fund’s Investor shares gained 1.45% versus the benchmark’s gain of 5.24%. While the Fund’s exposure to risk factors provided a positive contribution, it was offset by a combination of weak industry allocation
10 Laudus Trust Annual Report
Management’s Discussion continued
and stock selection. As is expected for this Fund, regional allocation had no effect. Although many of the long positions made notable contributions, in a year in which internationally virtually every industry posted a positive return, it was understandably difficult to perform in short positions.
For the entire year, the Fund’s net long exposure to relative strength, a measure of price momentum relative to the market, was the largest contributor to performance. And although in the most-recent quarter it appeared that value had finally relinquished its stronghold over growth, for the year, value characteristics added value. Therefore, the Fund’s higher exposures to traditional value factors compared to the benchmark — such Book-to-Price and Earnings-to-Price measures — contributed strongly over the reporting period. And while it added value for the most-recent quarter, a net long exposure to earnings variation — a measure of the variability of historical earnings — detracted for the year. Also detracting were the Fund’s net long exposures to volatility (beta) and trading activity than the benchmark during a period where the market rewarded lower volatility.
Among industries, a net long exposure to Basic Minerals and Metals was the strongest contributor to Fund performance for the year. A substantial net long exposure to Miscellaneous Finance also contributed, as did net longs in Cellular & Wireless; Photo-optical, Microcomputers & Office Machines; Chemicals & Rubber; Government Aircraft & Defense; Beer, Liquor & Tobacco; Integrated Oil Companies; Communications Utilities; and Insurance, all of which posted strong positive returns for the one-year period.
Overshadowing the contribution of the Fund’s net long positions, however, was a longer and deeper list of net shorts, which, due to the strength of so many industries over the period, dragged down Fund performance. The largest industry detractor was the Fund’s net short exposure to Construction & Homebuilding as despite the downturn in the U.S. housing market and its residual fallout, the industry continued to hold up well outside the U.S. Continued net short exposures to Retail, Cars & Trucks, Information Services, Instruments, Real Estate Development and Financial Investments also dampened performance, along with a number of other net short exposures. The Fund largely avoided exposure to the sub-prime lending collapse and its resultant fallout in the
U.S., although a position in Countrywide Financial did drag on Fund performance.
Among individual stocks, one of the strongest contributors for the period was the portfolio’s net long position in Nippon Steel. The stock rose due to an earnings increase, improving economic conditions in Japan and strong worldwide demand for high-grade steel. On the other hand, one of the notable detractors for the period was a long position in Moody’s; despite a booming market in the issuance of corporate debt, the company suffered due to questions raised by its inability to have identified factors leading to failing sub-prime lenders, as well as the housing slowdown.
The Fund is managed for long-term performance and seeks to outperform its benchmark through various market conditions as a result of superior stock picking. Consistent with the Fund’s underlying model, it seeks to capitalize on stocks with both long-term earnings and those with accelerating near-term earnings growth.
Laudus Rosenberg Value Long/Short Equity Fund
For its fiscal year ended 3/31/07, the Fund posted a positive return but underperformed its benchmark, 90-day T-bills: the Fund’s Investor Shares gained 2.81% versus the benchmark’s gain of 5.24%. Exposures to risk factors contributed strongly to the Fund’s performance; however, stock selection detracted. Industry exposures contributed only modestly.
Several individual holdings did provide notable contributions to Fund performance. Among them were long positions in Allegheny Technologies, a specialist in industrial metals, and steel manufacturer U.S. Steel — both of which saw robust performance over the period as a result of strong global demand.
Contributions attributable to risk-factor exposures varied greatly throughout the year, rotating from quarter to quarter. For instance, the Fund’s consistently net long exposure to traditional value factors — such as Earnings-to-Price and Book-to-Price, indicative of the Fund’s value orientation — were its greatest contributors for the one-year period. A net long exposure to earnings variation also contributed, as the market rewarded stocks with more-consistent earnings. A net short exposure to stocks with high trading activity also added value, as did the Fund’s net short exposure to leverage. Detracting somewhat, but not nearly enough to overcome the positive risk factors, were the portfolio’s heavy net long exposure to relative strength, a measure of recent price perform-
Laudus Trust Annual Report 11
Management’s Discussion continued
ance. High-relative-strength stocks tend to have better-than-average near-term earnings growth, but the market did not reward this factor for the reporting period. A slight net long exposure to growth characteristics, as our valuation model indicated that growth was well-priced, also detracted as the market failed to reward that factor as well.
Among industries, the Fund’s substantial net long exposure to Basic Minerals & Metals, the year’s second-strongest-performing industry, was the Fund’s largest industry contributor to performance. A substantial net long exposure to Insurance also contributed notably, as did a net long exposure to Chemicals & Rubber, another strong performer for the year. Mitigating the positives to some degree was the Fund’s net short exposure to Communications Utilities, which posted the strongest return among industries for the year. The next-largest drag on performance came from the Fund’s net short exposure to REITs; although its impact has moderated recently, for the year REITs generally performed well, and the position hurt the Fund. Underexposures to Publishing, Broadcasting & Cinema and to Restaurants, Hotels & Theaters also dampened Fund performance. And although detracting somewhat, the Fund’s net short exposure to Construction & Homebuilding, the worst-performing industry for the period protected the Fund from further industry fallout.
The Fund is managed for long-term performance and seeks to outperform its benchmark through various market conditions as a result of superior stock picking. Consistent with the Fund’s underlying model, it seeks to capitalize on stocks with both long-term earnings and those with accelerating near-term earnings growth.
12 Laudus Trust Annual Report
Performance and Fund Facts
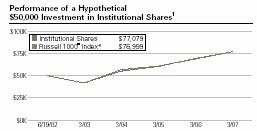
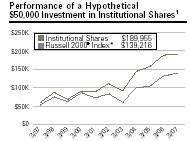
Laudus Rosenberg U.S. Large Capitalization Fund as of 3/31/07

Average Annual Total Returns1 | | | | |
| | | Since Inception | Since Inception |
Class and Inception Date | 1 year | 3 year | Institutional | Investor |
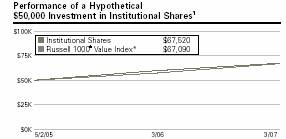
Institutional (6/19/02) | 11.10% | 11.87% | 9.47% | n/a |
Investor (7/31/02) | 10.69% | 11.47% | n/a | 12.17% |
Russell 1000 Index* | 11.84% | 10.73% | 9.44% | 12.66% |
Past performance does not guarantee future results. The performance data quoted represents past performance, and current returns may be lower or higher. The performance information does not reflect the deduction of taxes that a shareholder would pay on fund distributions or the redemption of fund shares. The investment return and principal value will fluctuate so that an investor’s shares, when redeemed, may be worth more or less than the original cost. To obtain performance information current to the most recent month end, visit www.laudusfunds.com.
Performance data quoted does not reflect the non-recurring redemption fee of 2% that may be charged if shares are sold or exchanged within 30 days of the purchase date. If these fees were reflected, the performance data quoted would be lower.
Investors cannot invest directly in any index.
* The Russell 1000 Index measures the performance of the 1,000 largest companies in the Russell 3000 Index, and represents approximately 92% of the total market capitalization of the Russell 3000 Index.
1 Total returns include change in share price and reinvestment of distributions. Total returns may reflect the waiver of a portion of a Fund’s advisory fees for certain periods since the inception date. In such instances, and without the waiver of fees, total returns would have been lower.
| Institutional | Investor |
Fund Overview2 | Shares | Shares |
Initial Investment | $50,000 | $2,500 |
Inception Date | 6/19/02 | 7/31/02 |
Total Net Assets ($ x 1,000) | $94,921 | $10,074 |
Ticker Symbol | AXLIX | AXLVX |
Cusip | 51855Q101 | 51855Q853 |
NAV | $13.21 | $13.21 |
Net Expense Ratio3 | 0.99% | 1.29% |
Gross Expense Ratio4 | 1.14% | 1.52% |
Fund Characteristics2 | Long |
Number of Securities | 187 |
Avg. Market Capitalization | 89,121 |
($Wtd. x 1,000,000) | |
Portfolio Turnover | 144% |
(One year trailing) | |
Price to Earnings (P/E) | 14.72 |
Price to Book (P/B) | 2.60 |
Price to Cash Flow | 11.48 |
Beta | 1.18 |
Return on Equity | 20.33% |
Five-Year Earnings Growth | 24.84% |
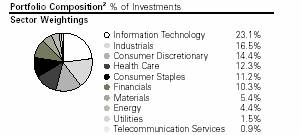
Top Equity Holdings2 % of Net Assets | Long |
Exxon Mobil Corp. | 4.4% |
AT&T Corp. | 3.8% |
Bank of America Corp. | 3.7% |
Cisco Systems, Inc. | 2.8% |
International Business Machines Corp. | 2.8% |
Wachovia Corp. | 2.3% |
Oracle Corp. | 2.0% |
Hewlett-Packard Co. | 2.0% |
The Walt Disney Co. | 2.0% |
McDonald’s Corp. | 1.9% |
Total | 27.7% |
2 Portfolio holdings are subject to change and may not represent current or future holdings.
3 Net Expenses. Reflects expenses expected to be charged to shareholders through at least 7/30/09. Adviser expects to hold expenses at this level by waiving its management fee and/or bearing other expenses. Please see the prospectus for more information.
4 Total Annual Fund Operating Expenses. Provides the expense ratio projected for this Share Class for the period 7/31/06 – 7/31/07. Actual expenses influenced by total assets and may be reduced based on contractual fee waiver by Adviser. Please see the prospectus for more information.
Laudus Trust Annual Report 13
Performance and Fund Facts
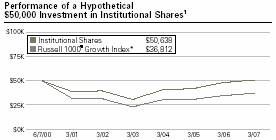
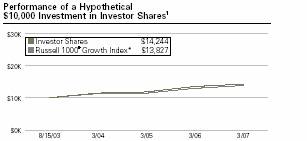
Laudus Rosenberg U.S. Large Capitalization
Growth Fund as of 3/31/07
Average Annual Total Returns1 | | | | |
| | | Since Inception | Since Inception |
Class and Inception Date | 1 year | 5 year | Institutional | Investor |
Institutional (6/7/00) | 5.62% | 5.20% | 0.19% | n/a |
Investor (8/15/03) | 5.36% | n/a | n/a | 10.24% |
Russell 1000 Growth Index* | 7.06% | 3.47% | –4.39% | 9.35% |
Past performance does not guarantee future results. The performance data quoted represents past performance, and current returns may be lower or higher. The performance information does not reflect the deduction of taxes that a shareholder would pay on fund distributions or the redemption of fund shares. The investment return and principal value will fluctuate so that an investor’s shares, when redeemed, may be worth more or less than the original cost. To obtain performance information current to the most recent month end, visit www.laudusfunds.com.
Performance data quoted does not reflect the non-recurring redemption fee of 2% that may be charged if shares are sold or exchanged within 30 days of the purchase date. If these fees were reflected, the performance data quoted would be lower.
Investors cannot invest directly in any index.
* The Russell 1000 Growth Index measures the performance of those Russell 1000 companies with higher price-to-book ratios and higher forecasted growth values.
1 Total returns include change in share price and reinvestment of distributions. Total returns may reflect the waiver of a portion of a Fund’s advisory fees for certain periods since the inception date. In such instances, and without the waiver of fees, total returns would have been lower.
| Institutional | Investor |
Fund Overview2 | Shares | Shares |
Initial Investment | $50,000 | $2,500 |
Inception Date | 6/7/00 | 8/15/03 |
Total Net Assets ($ x 1,000) | $75,481 | $2,242 |
Ticker Symbol | REDIX | REFIX |
Cusip | 51855Q200 | 51855Q846 |
NAV | $9.76 | $9.83 |
Net Expense Ratio3 | 0.99% | 1.29% |
Gross Expense Ratio4 | 1.34% | 1.91% |
Fund Characteristics2 | Long |
Number of Securities | 341 |
Avg. Market Capitalization | 66,533 |
($Wtd. x 1,000,000) | |
Portfolio Turnover | 71% |
(One year trailing) | |
Price to Earnings (P/E) | 19.65 |
Price to Book (P/B) | 4.78 |
Price to Cash Flow | 14.67 |
Beta | 1.15 |
Return on Equity | 29.96% |
Five-Year Earnings Growth | 24.40% |
Top Equity Holdings2 % of Net Assets | Long |
Microsoft Corp. | 2.8% |
Cisco Systems, Inc. | 2.7% |
International Business Machines Corp. | 2.2% |
General Electric Co. | 2.0% |
Johnson & Johnson | 1.7% |
Google, Inc., Class A | 1.6% |
Apple, Inc. | 1.2% |
Wal-Mart Stores, Inc. | 1.2% |
Oracle Corp. | 1.2% |
Intel Corp. | 1.2% |
Total | 17.8% |
2 Portfolio holdings are subject to change and may not represent current or future holdings.
3 Net Expenses. Reflects expenses expected to be charged to shareholders through at least 7/30/09. Adviser expects to hold expenses at this level by waiving its management fee and/or bearing other expenses. Please see the prospectus for more information.
4 Total Annual Fund Operating Expenses. Provides the expense ratio projected for this Share Class for the period 7/31/06 – 7/31/07. Actual expenses influenced by total assets and may be reduced based on contractual fee waiver by Adviser. Please see the prospectus for more information.
14 Laudus Trust Annual Report
Performance and Fund Facts
Laudus Rosenberg U.S. Large Capitalization
Value Fund as of 3/31/07

Average Annual Total Returns1 | | | |
| | Since Inception | Since Inception |
Class and Inception Date | 1 year | Institutional | Investor |
Institutional (5/02/05) | 13.55%** | 17.39% | n/a |
Investor (5/02/05) | 13.22% | n/a | 17.01% |
Russell 1000 Value Index* | 16.83% | 16.61% | 16.61% |
Past performance does not guarantee future results. The performance data quoted represents past performance, and current returns may be lower or higher. The performance information does not reflect the deduction of taxes that a shareholder would pay on fund distributions or the redemption of fund shares. The investment return and principal value will fluctuate so that an investor’s shares, when redeemed, may be worth more or less than the original cost. To obtain performance information current to the most recent month end, visit www.laudusfunds.com.
Performance data quoted does not reflect the non-recurring redemption fee of 2% that may be charged if shares are sold or exchanged within 30 days of the purchase date. If these fees were reflected, the performance data quoted would be lower.
Value-based investments are subject to the risk that the broad market may not recognize their value. Investors cannot invest directly in any index.
* The Russell 1000 Value Index measures the performance of those Russell 1000 companies with lower valuation ratios such as price-to-book and price-to-earnings ratios.
** One year returns presented in the table differs from the return presented in the Financial Highlights. This is a result of the calculation of the Financial Highlights return adhering to GAAP presentation.
1 Total returns include change in share price and reinvestment of distributions. Total returns may reflect the waiver of a portion of a Fund’s advisory fees for certain periods since the inception date. In such instances, and without the waiver of fees, total returns would have been lower.
| Institutional | Investor |
Fund Overview2 | Shares | Shares |
Initial Investment | $50,000 | $2,500 |
Inception Date | 5/2/05 | 5/2/05 |
Total Net Assets ($ x 1,000) | $6,058 | $540 |
Ticker Symbol | LLCVX | LCVJX |
Cusip | 51855Q713 | 51855Q721 |
NAV | $12.74 | $12.70 |
Net Expense Ratio3 | 0.99% | 1.29% |
Gross Expense Ratio4 | 2.41% | 2.78% |
Fund Characteristics2 | | Long |
Number of Securities | | 121 |
Avg. Market Capitalization | | 101,956 |
($Wtd. x 1,000,000) | | |
Portfolio Turnover | | 108% |
(One year trailing) | | |
Price to Earnings (P/E) | | 12.53 |
Price to Book (P/B) | | 2.04 |
Price to Cash Flow | | 8.26 |
Beta | | 1.23 |
Return on Equity | | 18.42% |
Five-Year Earnings Growth | | 26.99% |
Top Equity Holdings2 % of Net Assets | Long |
AT & T Corp. | 4.5% |
Bank of America Corp. | 4.5% |
Exxon Mobil Corp. | 4.1% |
Pfizer, Inc. | 4.1% |
Citigroup, Inc. | 3.2% |
ConocoPhillips | 3.1% |
Verizon Communications, Inc. | 2.9% |
JPMorgan Chase & Co. | 2.3% |
McDonald’s Corp. | 2.1% |
Merrill Lynch & Co., Inc. | 2.0% |
Total | 32.8% |
2 Portfolio holdings are subject to change and may not represent current or future holdings.
3 Net Expenses. Reflects expenses expected to be charged to shareholders through at least 7/30/09. Adviser expects to hold expenses at this level by waiving its management fee and/or bearing other expenses. Please see the prospectus for more information.
4 Total Annual Fund Operating Expenses. Provides the expense ratio projected for this Share Class for the period 7/31/06 – 7/31/07. Actual expenses influenced by total assets and may be reduced based on contractual fee waiver by Adviser. Please see the prospectus for more information.
Laudus Trust Annual Report 15
Performance and Fund Facts
Laudus Rosenberg U.S. Discovery Fund as of 3/31/07

Average Annual Total Returns1 | | | | |
| | | | |
| | | Since Inception | Since Inception |
Class and Inception Date | 1 year | 5 year | Institutional | Investor |
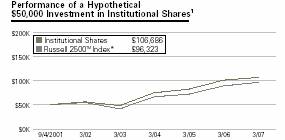
Institutional (9/4/01) | 5.71% | 13.91% | 14.57% | n/a |
Investor (10/3/01) | 5.34% | 13.56% | n/a | 15.76% |
Russell 2500TM Index* | 8.23% | 12.15% | 12.49% | 15.04% |
Past performance does not guarantee future results. The performance data quoted represents past performance, and current returns may be lower or higher. The performance information does not reflect the deduction of taxes that a shareholder would pay on fund distributions or the redemption of fund shares. The investment return and principal value will fluctuate so that an investor’s shares, when redeemed, may be worth more or less than the original cost. To obtain performance information current to the most recent month end, visit www.laudusfunds.com.
Performance data quoted does not reflect the non-recurring redemption fee of 2% that may be charged if shares are sold or exchanged within 30 days of the purchase date. If these fees were reflected, the performance data quoted would be lower.
Small and mid-capitalization funds typically carry additional risks since smaller companies generally have experienced a greater degree of market volatility.
Investors cannot invest directly in any index.
* The Russell 2500 Index measures the performance of the 2,500 smallest companies in the Russell 3000 Index, and represents approximately 16% of the total market capitalization of the Russell 3000 Index.
1 Total returns include change in share price and reinvestment of distributions. Total returns may reflect the waiver of a portion of a Fund’s advisory fees for certain periods since the inception date. In such instances, and without the waiver of fees, total returns would have been lower.
| Institutional | Investor |
Fund Overview2 | Shares | Shares |
Initial Investment | $50,000 | $2,500 |
Inception Date | 9/4/01 | 10/3/01 |
Total Net Assets ($ x 1,000) | $718,185 | $217,045 |
Ticker Symbol | RDISX | RDIVX |
Cusip | 51855Q309 | 51855Q838 |
NAV | $19.80 | $19.59 |
Gross Expense Ratio3 | 1.09% | 1.43% |
| | |
Fund Characteristics2 | | Long |
Number of Securities | | 779 |
Avg. Market Capitalization | | $2,670 |
($Wtd. x 1,000,000) | | |
Portfolio Turnover | | 86% |
(One year trailing) | | |
Price to Earnings (P/E) | | 16.72 |
Price to Book (P/B) | | 2.06 |
Price to Cash Flow | | 12.52 |
Beta | | 1.27 |
Return on Equity | | 13.71% |
Five-Year Earnings Growth | | 30.30% |
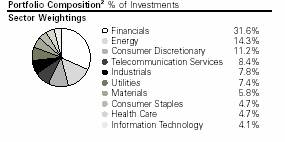
Top Equity Holdings2 % of Net Assets | Long |
BMC Software, Inc. | 1.8% |
Avnet, Inc. | 1.6% |
A.G. Edwards, Inc. | 1.5% |
Emdeon Corp. | 1.2% |
Tidewater, Inc. | 1.1% |
Big Lots, Inc. | 1.1% |
LSI Logic Corp. | 1.1% |
Northeast Utilities | 1.1% |
MDU Resources Group, Inc. | 1.0% |
FMC Corp. | 1.0% |
Total | 12.5% |

2 Portfolio holdings are subject to change and may not represent current or future holdings.
3 Total Annual Fund Operating Expenses. Provides the expense ratio projected for this Share Class for the period 7/31/06 – 7/31/07. Actual expenses influenced by total assets and may be reduced based on contractual fee waiver by Adviser. Please see the prospectus for more information.
16 Laudus Trust Annual Report
Performance and Fund Facts
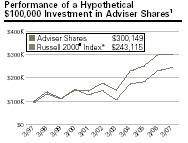
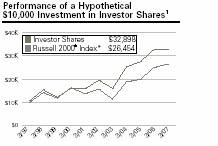
Laudus Rosenberg U.S. Small Capitalization Fund as of 3/31/07
Average Annual Total Returns1 | | | | |
| | | | Since Inception | Since Inception | Since Inception |
Class and Inception Date | 1 year | 5 year | 10 year | Institutional | Investor | Adviser |
Institutional (2/22/89) | 1.11% | 11.42% | 12.26% | 13.83% | n/a | n/a |
Adviser (1/21/97) | 0.90% | 11.15% | 11.99% | n/a | n/a | 11.39% |
Investor (10/22/96) | 0.75% | 11.03% | 11.90% | n/a | 12.08% | n/a |
Russell 2000 Index* | 5.91% | 10.95% | 10.23% | 11.08% | 9.76% | 9.11% |
Past performance does not guarantee future results. The performance data quoted represents past performance, and current returns may be lower or higher. The performance information does not reflect the deduction of taxes that a shareholder would pay on fund distributions or the redemption of fund shares. The investment return and principal value will fluctuate so that an investor’s shares, when redeemed, may be worth more or less than the original cost. To obtain performance information current to the most recent month end, visit www.laudusfunds.com.
Performance data quoted does not reflect the non-recurring redemption fee of 2% that may be charged if shares are sold or exchanged within 30 days of the purchase date. If these fees were reflected, the performance data quoted would be lower.
Small capitalization funds typically carry additional risks since smaller companies generally have experienced a greater degree of market volatility. Investors cannot invest directly in any index.
* The Russell 2000 Index measures the performance of the 2,000 smallest companies in the Russell 3000 Index, and represents approximately 8% of the total market capitalization of the Russell 3000 Index.
1 Total returns include change in share price and reinvestment of distributions. Total returns may reflect the waiver of a portion of a Fund’s advisory fees for certain periods since the inception date. In such instances, and without the waiver of fees, total returns would have been lower.
| Institutional | Adviser | Investor |
Fund Overview2 | Shares | Shares | Shares |
Initial Investment | $50,000 | $100,000 | $2,500 |
Inception Date | 2/22/89 | 1/21/97 | 10/22/96 |
Total Net Assets | $699,921 | $48,923 | $269,185 |
($ x 1,000) | | | |
Ticker Symbol | USCIX | LIFUX | BRSCX |
Cusip | 51855Q408 | 51855Q739 | 51855Q820 |
NAV | $12.57 | $12.35 | $12.22 |
Gross | 1.04% | 1.32% | 1.39% |
Expense Ratio3 | | | |
Fund Characteristics2 | Long |
Number of Securities | 660 |
Avg. Market Capitalization | 1,175 |
($Wtd. x 1,000,000) | |
Portfolio Turnover | 76% |
(One year trailing) | |
Price to Earnings (P/E) | 19.08 |
Price to Book (P/B) | 1.91 |
Price to Cash Flow | 12.04 |
Beta | 1.32 |
Return on Equity | 10.85% |
Five-Year Earnings Growth | 29.68% |
Top Equity Holdings2 % of Net Assets | Long |
Delphi Financial Group, Inc., Class A | 1.4% |
Perot Systems Corp., Class A | 1.3% |
TeleTech Holdings, Inc. | 1.2% |
Brown Shoe Co., Inc. | 1.2% |
MPS Group, Inc. | 1.2% |
Knight Capital Group, Inc., Class A | 1.1% |
Regal Beloit Corp. | 1.1% |
Mentor Graphics Corp. | 1.1% |
Imation Corp. | 1.0% |
Woodward Governor Co. | 1.0% |
Total | 11.6% |
2 Portfolio holdings are subject to change and may not represent current or future holdings.
3 Total Annual Fund Operating Expenses. Provides the expense ratio projected for this Share Class for the period 7/31/06 – 7/31/07. Actual expenses influenced by total assets and may be reduced based on contractual fee waiver by Adviser. Please see the prospectus for more information.
Laudus Trust Annual Report 17
Performance and Fund Facts
Laudus Rosenberg International Equity Fund as of 3/31/07
Average Annual Total Returns1 | | | | |
| | | Since Inception | Since Inception |
Class and Inception Date | 1 year | 5 year | Institutional | Investor |
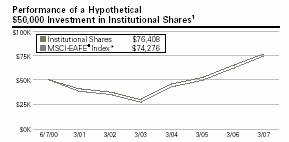
Institutional (6/7/00) | 18.37% | 15.39% | 6.42% | n/a |
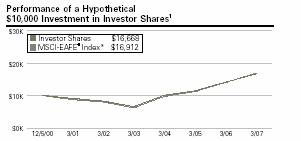
Investor (12/5/00) | 18.08% | 15.09% | n/a | 8.42% |
MSCI-EAFE Index* | 20.69% | 16.24% | 5.98% | 8.67% |
Past performance does not guarantee future results. The performance data quoted represents past performance, and current returns may be lower or higher. The performance information does not reflect the deduction of taxes that a shareholder would pay on fund distributions or the redemption of fund shares. The investment return and principal value will fluctuate so that an investor’s shares, when redeemed, may be worth more or less than the original cost. To obtain performance information current to the most recent month end, visit www.laudusfunds.com.
Performance data quoted does not reflect the non-recurring redemption fee of 2% that may be charged if shares are sold or exchanged within 30 days of the purchase date. If these fees were reflected, the performance data quoted would be lower.
There are risks associated with investing in foreign companies, such as erratic market conditions, economic and political instability and fluctuations in currency exchange rates.
Investors cannot invest directly in any index.
* The Morgan Stanley Capital International Europe, Australasia, Far East (MSCI-EAFE Index) Index is a free float-adjusted market capitalization index that is designed to measure market equity performance in 21 developed market countries, excluding the U.S. and Canada.
1 Total returns include change in share price and reinvestment of distributions. Total returns may reflect the waiver of a portion of a Fund’s advisory fees for certain periods since the inception date. In such instances, and without the waiver of fees, total returns would have been lower.
| Institutional | Investor |
Fund Overview2 | Shares | Shares |
| | |
Initial Investment | $50,000 | $2,500 |
Inception Date | 6/7/00 | 12/5/00 |
Total Net Assets ($ x 1,000) | $68,398 | $61,411 |
Ticker Symbol | REQIX | RIEIX |
Cusip | 51855Q507 | 51855Q812 |
NAV | $13.58 | $13.54 |
Net Expense Ratio3 | 1.34% | 1.64% |
Gross Expense Ratio4 | 1.96% | 2.33% |
Fund Characteristics2 | Long |
Number of Securities | 387 |
Avg. Market Capitalization | 58,632 |
($Wtd. x 1,000,000) | |
Portfolio Turnover | 64% |
(One year trailing) | |
Price to Earnings (P/E) | 14.85 |
Price to Book (P/B) | 1.92 |
Price to Cash Flow | 9.08 |
Beta | 1.02 |
Return on Equity | 13.93% |
Five-Year Earnings Growth | 28.31% |
| |
Top Equity Holdings2 % of Net Assets | Long |
Royal Bank of Scotland Group plc | 1.9% |
Royal Dutch Shell plc, Class A | 1.7% |
Banco Santander Central Hispano S.A. | 1.6% |
UBS AG — Reg’d | 1.6% |
Telefonica S.A. | 1.5% |
DaimlerChrysler AG — Reg’d | 1.5% |
Nestle S.A. — Reg’d | 1.4% |
Deutsche Bank AG — Reg’d | 1.3% |
Fortis | 1.3% |
Bayer AG | 1.3% |
Total | 15.1% |
2 Portfolio holdings are subject to change and may not represent current or future holdings.
3 Net Expenses. Reflects expenses expected to be charged to shareholders through at least 7/30/09. Adviser expects to hold expenses at this level by waiving its management fee and/or bearing other expenses. Please see the prospectus for more information.
4 Total Annual Fund Operating Expenses. Provides the expense ratio projected for this Share Class for the period 7/31/06 – 7/31/07. Actual expenses influenced by total assets and may be reduced based on contractual fee waiver by Adviser. Please see the prospectus for more information.
18 Laudus Trust Annual Report
Performance and Fund Facts continued
Laudus Rosenberg International Equity Fund as of 3/31/07
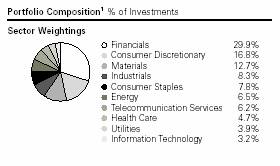
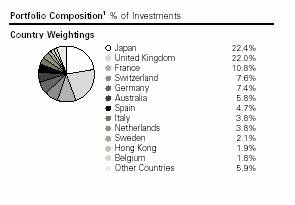
1 Portfolio holdings are subject to change and may not represent current or future holdings.
Laudus Trust Annual Report 19
Performance and Fund Facts
Laudus Rosenberg International Discovery Fund as of 3/31/07
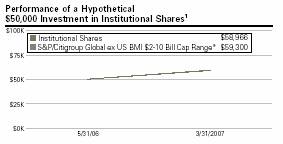
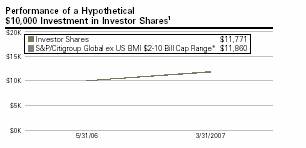
Total Returns1 | | | |
| | Since Inception | Since Inception |
Class and Inception Date | 1 year | Institutional** | Investor** |
Institutional (5/31/06) | n/a | 21.90% | n/a |
Investor (5/31/06) | n/a | n/a | 21.62% |
S&P/Citigroup Global ex US BMI $2-10 Bill Cap Range* | n/a | 22.73% | 22.73% |
Past performance does not guarantee future results. The performance data quoted represents past performance, and current returns may be lower or higher. The performance information does not reflect the deduction of taxes that a shareholder would pay on fund distributions or the redemption of fund shares. The investment return and principal value will fluctuate so that an investor’s shares, when redeemed, may be worth more or less than the original cost. To obtain performance information current to the most recent month end, visit www.laudusfunds.com.
Performance data quoted does not reflect the non-recurring redemption fee of 2% that may be charged if shares are sold or exchanged within 30 days of the purchase date. If these fees were reflected, the performance data quoted would be lower.
There are risks associated with investing in foreign companies, such as erratic market conditions, economic and political instability and fluctuations in currency exchange rates. Investing in emerging markets accentuates these risks.
Small capitalization funds typically carry additional risks since smaller companies generally have experienced a greater degree of market volatility.
Investors cannot invest directly in any index.
* The S&P/Citigroup Global ex US Broad Market Index (BMI) $2 - $10 Bill Cap Range includes companies in approximately 52 developed and emerging markets with more than $100 million of free float capitalization.
** For the period from inception 5/31/06 through 3/31/07. Not annualized.
1 Total returns include change in share price and reinvestment of distributions. Total returns may reflect the waiver of a portion of a Fund’s advisory fees for certain periods since the inception date. In such instances, and without the waiver of fees, total returns would have been lower.
| Institutional | Investor |
Fund Overview2 | Shares | Shares |
Initial Investment | $50,000 | $2,500 |
Inception Date | 5/31/06 | 5/31/06 |
Total Net Assets ($ x 1,000) | $19,173 | $51,572 |
Ticker Symbol | LIDSX | LIDIX |
Cusip | 51855Q689 | 51855Q697 |
NAV | $12.05 | $12.04 |
Net Expense Ratio3 | 1.34% | 1.65% |
Gross Expense Ratio4 | 1.34% | 1.74% |
Fund Characteristics2 | Long |
Number of Securities | 475 |
Avg. Market Capitalization | 6,902 |
($Wtd. x 1,000,000) | |
Portfolio Turnover | 106% |
(One year trailing) | |
Price to Earnings (P/E) | 16.26 |
Price to Book (P/B) | 1.83 |
Price to Cash Flow | 8.72 |
Beta | 1.01 |
Return on Equity | 12.06% |
Five-Year Earnings Growth | 28.50% |
| |
Top Equity Holdings2 % of Net Assets | Long |
Sumitomo Metal Mining Co., Ltd. | 0.7% |
Compagnie Generale des Etablissements Michelin, | 0.7% |
Class B | |
Suncorp-Metway Ltd. | 0.7% |
Kobe Steel Ltd. | 0.7% |
Cap Gemini S.A. | 0.6% |
Asahi Kasei Corp. | 0.6% |
Infineon Technologies AG | 0.6% |
Saputo, Inc. | 0.6% |
Konica Minolta Holdings, Inc. | 0.6% |
National Bank of Canada | 0.6% |
Total | 6.4% |
2 Portfolio holdings are subject to change and may not represent current or future holdings.
3 Net Expenses. Reflects expenses expected to be charged to shareholders through at least 7/30/09. Adviser expects to hold expenses at this level by waiving its management fee and/or bearing other expenses. Please see the prospectus for more information.
4 Total Annual Fund Operating Expenses. Provides the expense ratio projected for this Share Class for the period 7/31/06 – 7/31/07. Actual expenses influenced by total assets and may be reduced based on contractual fee waiver by Adviser. Please see the prospectus for more information.
20 Laudus Trust Annual Report
Performance and Fund Facts continued
Laudus Rosenberg International Discovery Fund as of 3/31/07
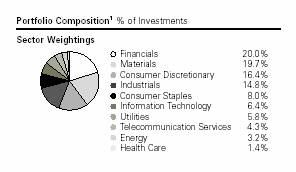
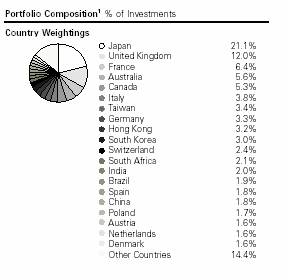
1 Portfolio holdings are subject to change and may not represent current or future holdings.
Laudus Trust Annual Report 21
Performance and Fund Facts
Laudus Rosenberg International Small Capitalization Fund as of 3/31/07


Average Annual Total Returns1 | | | | | |
| | | | Since Inception | Since Inception |
Class and Inception Date | 1 year | 5 year | 10 years | Institutional | Investor |
Institutional (9/23/96) | 20.82% | 27.42% | 13.41% | 12.85% | n/a |
Investor (10/29/96) | 20.35% | 27.05% | 13.06% | n/a | 12.59% |
S&P/Citigroup World ex US EMI* | 23.14% | 23.89% | 11.57% | 10.73% | 10.85% |
Past performance does not guarantee future results. The performance data quoted represents past performance, and current returns may be lower or higher. The performance information does not reflect the deduction of taxes that a shareholder would pay on fund distributions or the redemption of fund shares. The investment return and principal value will fluctuate so that an investor’s shares, when redeemed, may be worth more or less than the original cost. To obtain performance information current to the most recent month end, visit www.laudusfunds.com.
Performance data quoted does not reflect the non-recurring redemption fee of 2% that may be charged if shares are sold or exchanged within 30 days of the purchase date. If these fees were reflected, the performance data quoted would be lower.
There are risks associated with investing in foreign companies, such as erratic market conditions, economic and political instability and fluctuations in currency exchange rates.
Small capitalization funds typically carry additional risks since smaller companies generally have experienced a greater degree of market volatility.
Investors cannot invest directly in any index.
* S&P/Citigroup World ex US Extended Market Index (EMI) is a float-adjusted index which measures the performance of small companies (approximately the bottom 20% by market capitalization) in 25 developed equity markets.
1 Total returns include change in share price and reinvestment of distributions. Total returns may reflect the waiver of a portion of a Fund’s advisory fees for certain periods since the inception date. In such instances, and without the waiver of fees, total returns would have been lower.
| Institutional | Investor |
Fund Overview2 | Shares | Shares |
| | |
Initial Investment | $50,000 | $2,500 |
Inception Date | 9/23/96 | 10/29/96 |
Total Net Assets ($ x 1,000) | $1,048,829 | $882,163 |
Ticker Symbol | ICSIX | RISIX |
Cusip | 51855Q606 | 51855Q796 |
NAV | $22.67 | $22.38 |
Gross Expense Ratio3 | 1.25% | 1.60% |
Fund Characteristics2 | Long |
| |
Number of Securities | 1,119 |
Avg. Market Capitalization | 4,344 |
($Wtd. x 1,000,000) | |
Portfolio Turnover | 92% |
(One year trailing) | |
Price to Earnings (P/E) | 16.26 |
Price to Book (P/B) | 1.64 |
Price to Cash Flow | 8.79 |
Beta | 1.04 |
Return on Equity | 10.81% |
Five-Year Earnings Growth | 27.14% |
Top Equity Holdings2 % of Net Assets | Long |
| |
Compagnie Generale des Etablissements Michelin, | |
Class B | 1.4% |
Enterprise Inns plc | 1.2% |
Swiss Life Holding — Reg’d | 1.2% |
Cable & Wireless | 1.1% |
Antofagasta plc | 1.1% |
IFIL — Investments S.p.A. | 1.1% |
Infineon Technologies AG | 1.1% |
International Power plc | 1.0% |
Friends Provident plc | 0.9% |
Air France-KLM | 0.9% |
Total | 11.0% |
2 Portfolio holdings are subject to change and may not represent current or future holdings.
3 Total Annual Fund Operating Expenses. Provides the expense ratio projected for this Share Class for the period 7/31/06 – 7/31/07. Actual expenses influenced by total assets and may be reduced based on contractual fee waiver by Adviser. Please see the prospectus for more information.
22 Laudus Trust Annual Report
Performance and Fund Facts continued
Laudus Rosenberg International Small Capitalization Fund as of 3/31/07
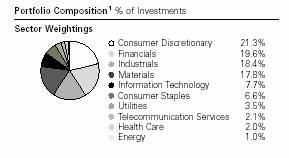

1 Portfolio holdings are subject to change and may not represent current or future holdings.
Laudus Trust Annual Report 23
Performance and Fund Facts
Laudus Rosenberg U.S. Large/Mid Capitalization
Long/Short Equity Fund as of 3/31/07
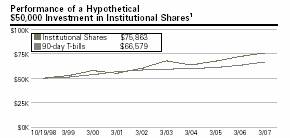

Average Annual Total Returns1 | | | | |
| | | Since Inception | Since Inception |
Class and Inception Date | 1 year | 5 year | Institutional | Investor |
Institutional (10/19/98) | 4.98% | 4.80% | 5.06% | n/a |
Investor (11/11/98) | 4.68% | 4.48% | n/a | 4.74% |
90 day T-bills | 5.24% | 2.68% | 3.45% | 3.43% |
Past performance does not guarantee future results. The performance data quoted represents past performance, and current returns may be lower or higher. The performance information does not reflect the deduction of taxes that a shareholder would pay on fund distributions or the redemption of fund shares. The investment return and principal value will fluctuate so that an investor’s shares, when redeemed, may be worth more or less than the original cost. To obtain performance information current to the most recent month end, visit www.laudusfunds.com.
Performance data quoted does not reflect the non-recurring redemption fee of 2% that may be charged if shares are sold or exchanged within 30 days of the purchase date. If these fees were reflected, the performance data quoted would be lower.
Mid-capitalization stocks typically carry additional risk, since smaller companies generally have higher risk and volatility.
Investments in long/short funds are more volatile and risky than some other forms of investments. Since they have both long and short portfolios, an investment will involve risks associated with twice the number of investment decisions made for a typical stock fund. These types of Funds typically have a high portfolio turnover that could increase transaction costs and cause short-term capital gains to be realized. While it may be the intent of the Manager to take long positions in stocks that outperform the market and short positions in stocks that underperform the market, there is no assurance that the Manager will be successful.
The Fund uses the return that an investor could achieve through an investment in 3-month U.S. Treasury Bills as a benchmark against which to measure the Fund’s performance. AXA Rosenberg attempts to achieve returns for the Fund’s shareholders which exceed the benchmark. An investment in the Fund is different from an investment in 3-month U.S. Treasury Bills because, among other differences, U.S. Treasury Bills are backed by the full faith and credit of the U.S. Government, U.S. Treasury Bills have a fixed rate of return, investors in U.S. Treasury Bills do not risk losing their investment, and an investment in the Fund is more volatile than an investment in U.S. Treasury Bills.
1 Total returns include change in share price and reinvestment of distributions. Total returns may reflect the waiver of a portion of a Fund’s advisory fees for certain periods since the inception date. In such instances, and without the waiver of fees, total returns would have been lower.
| Institutional | Investor |
Fund Overview2 | Shares | Shares |
Initial Investment | $50,000 | $2,500 |
Inception Date | 10/19/98 | 11/11/98 |
Total Net Assets | | |
($ x 1,000) | $10,176 | $9,148 |
Ticker Symbol | SSMNX | RMNIX |
Cusip | 51855Q804 | 51855Q770 |
NAV | $12.14 | $12.19 |
Net Expense Ratio3 | 1.24% | 1.54% |
Net Expense Ratio4 (paid by | | |
shareholders) | 2.69% | 2.99% |
Gross Expense Ratio5 | 3.01% | 3.31% |
Fund Characteristics2 | Long | Short |
Number of Securities | 72.00 | 65 |
Avg. Market Capitalization | 56,875 | 49,181 |
($Wtd. x 1,000,000) | | |
Portfolio Turnover | 169% | 116% |
(One year trailing) | | |
Price to Earnings (P/E) | 15.73 | 48.62 |
Price to Book (P/B) | 2.68 | 3.98 |
Price to Cash Flow | 11.34 | 15.97 |
Beta | 1.20 | 1.15 |
Return on Equity | 19.59% | 8.41% |
Five-Year Earnings Growth | 24.27% | 19.81% |
2 Portfolio holdings are subject to change and may not represent current or future holdings.
3 Net Expenses. Reflects expenses expected to be charged to shareholders through at least 7/30/09. Excludes dividend expense on securities sold short, an expense associated with executing this strategy. Adviser expects to hold expenses at this level by waiving its management fee and/or bearing other expenses. Please see the prospectus for more information.
4 Net Expenses. Reflects expenses expected to be charged to shareholders through at least 7/30/09. Includes dividend expense on securities sold short. Adviser expects to hold expenses at this level by waiving its management fee and/or bearing other expenses. Please see the prospectus for more information.
5 Total Annual Fund Operating Expenses. Provides the expense ratio projected for this Share Class for the period 7/31/06 – 7/31/07. Actual expenses influenced by total assets and may be reduced based on contractual fee waiver by Adviser. Please see the prospectus for more information.
24 Laudus Trust Annual Report
Performance and Fund Facts continued
Laudus Rosenberg U.S. Large/Mid Capitalization
Long/Short Equity Fund as of 3/31/07
Top Equity Holdings1 % of Net Assets | Long |
| |
AT&T Corp. | 4.6% |
The Allstate Corp. | 4.2% |
Union Pacific Corp. | 4.2% |
International Business Machines Corp. | 4.1% |
Bank of America Corp. | 3.8% |
Loews Corp. | 3.5% |
Merrill Lynch & Co., Inc. | 3.0% |
PG&E Corp. | 3.0% |
ACE Ltd. | 3.0% |
Honeywell International, Inc. | 2.8% |
Total | 36.2% |
Top Equity Holdings1 % of Net Assets | Short |
| |
Microsoft Corp. | 4.2% |
Yahoo! Inc. | 3.9% |
eBay, Inc. | 3.6% |
The Procter & Gamble Co. | 3.5% |
Intel Corp. | 3.4% |
TXU Corp. | 2.9% |
The Dow Chemical Co. | 2.8% |
Adobe Systems, Inc. | 2.7% |
Amgen, Inc. | 2.6% |
Ford Motor Co. | 2.6% |
Total | 32.2% |
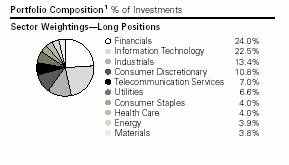
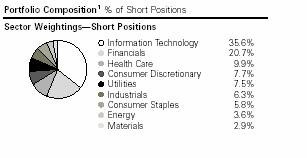
1 Portfolio holdings are subject to change and may not represent current or future holdings.
Laudus Trust Annual Report 25
Performance and Fund Facts
Laudus Rosenberg Global Long/Short Equity Fund as of 3/31/07
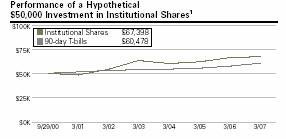

Average Annual Total Returns1 | | | | |
| | | | |
| | | Since Inception | Since Inception |
Class and Inception Date | 1 year | 5 year | Institutional | Investor |
Institutional (9/29/00) | 1.77% | 4.49% | 4.70% | n/a |
Investor (8/23/01) | 1.45% | 4.17% | n/a | 4.36% |
90 day T-bills | 5.24% | 2.68% | 2.97% | 2.68% |
Past performance does not guarantee future results. The performance data quoted represents past performance, and current returns may be lower or higher. The performance information does not reflect the deduction of taxes that a shareholder would pay on fund distributions or the redemption of fund shares. The investment return and principal value will fluctuate so that an investor’s shares, when redeemed, may be worth more or less than the original cost. To obtain performance information current to the most recent month end, visit www.laudusfunds.com.
Performance data quoted does not reflect the non-recurring redemption fee of 2% that may be charged if shares are sold or exchanged within 30 days of the purchase date. If these fees were reflected, the performance data quoted would be lower.
Investments in long/short funds are more volatile and risky than some other forms of investments. Since they have both long and short portfolios, an investment will involve risks associated with twice the number of investment decisions made for a typical stock fund. These types of Funds typically have a high portfolio turnover that could increase transaction costs and cause short-term capital gains to be realized. While it may be the intent of the Manager to take long positions in stocks that outperform the market and short positions in stocks that underperform the market, there is no assurance that the Manager will be successful.
The Fund uses the return that an investor could achieve through an investment in 3-month U.S. Treasury Bills as a benchmark against which to measure the Fund’s performance. AXA Rosenberg attempts to achieve returns for the Fund’s shareholders which exceed the benchmark. An investment in the Fund is different from an investment in 3-month U.S. Treasury Bills because, among other differences, U.S. Treasury Bills are backed by the full faith and credit of the U.S. Government, U.S. Treasury Bills have a fixed rate of return, investors in U.S. Treasury Bills do not risk losing their investment, and an investment in the Fund is more volatile than an investment in U.S. Treasury Bills.
There are risks associated with investing in foreign companies, such as erratic market conditions, economic and political instability and fluctuations in currency exchange rates.
1 Total returns include change in share price and reinvestment of distributions. Total returns may reflect the waiver of a portion of a Fund’s advisory fees for certain periods since the inception date. In such instances, and without the waiver of fees, total returns would have been lower.
| Institutional | Investor |
Fund Overview 2 | Shares | Shares |
Initial Investment | $50,000 | $2,500 |
Inception Date | 9/29/00 | 8/23/01 |
Total Net Assets ($ x 1,000) | $17,005 | $3,655 |
Ticker Symbol | MSMNX | RMSIX |
Cusip | 51855Q879 | 51855Q754 |
NAV | $12.23 | $12.12 |
Net Expense Ratio3 | 1.99% | 2.29% |
Net Expense Ratio4 (paid by | | |
shareholders) | 3.07% | 3.37% |
Gross Expense Ratio5 | 3.31% | 3.68% |
Fund Characteristics2 | Long | Short |
Number of Securities | 413 | 424 |
Avg. Market Capitalization | | |
($Wtd. x 1,000,000) | 27,366 | 25,073 |
Portfolio Turnover | 234% | 157% |
(One year trailing) | | |
Price to Earnings (P/E) | 20.15 | 26.68 |
Price to Book (P/B) | 2.23 | 3.31 |
Price to Cash Flow | 10.92 | 15.53 |
Beta | 1.26 | 1.12 |
Return on Equity | 12.05% | 13.47% |
Five-Year Earnings Growth | 28.08% | 27.13% |
2 Portfolio holdings are subject to change and may not represent current or future holdings.
3 Net Expenses. Reflects expenses expected to be charged to shareholders through at least 7/30/09. Excludes dividend expense on securities sold short, an expense associated with executing this strategy. Adviser expects to hold expenses at this level by waiving its management fee and/or bearing other expenses. Please see the prospectus for more information.
4 Net Expenses. Reflects expenses expected to be charged to shareholders through at least 7/30/09. Includes dividend expense on securities sold short. Adviser expects to hold expenses at this level by waiving its management fee and/or bearing other expenses. Please see the prospectus for more information.
5 Total Annual Fund Operating Expenses. Provides the expense ratio projected for this Share Class for the period 7/31/06 – 7/31/07. Actual expenses influenced by total assets and may be reduced based on contractual fee waiver by Adviser. Please see the prospectus for more information.
26 Laudus Trust Annual Report
Performance and Fund Facts continued
Laudus Rosenberg Global Long/Short Equity Fund as of 3/31/07
Top Equity Holdings 1 % of Net Assets | Long |
| |
Cisco Systems, Inc. | 2.2% |
Union Pacific Corp. | 1.2% |
Bank of America Corp. | 1.1% |
AT&T Corp. | 1.1% |
International Business Machines Corp. | 1.0% |
J.C. Penney Co., Inc. | 0.9% |
Celgene Corp. | 0.9% |
Merrill Lynch & Co., Inc. | 0.9% |
NII Holdings, Inc. | 0.9% |
Loews Corp. | 0.9% |
Total | 11.1% |
Top Equity Holdings1 % of Net Assets | Short |
| |
Intel Corp. | 1.8% |
Yahoo! Inc. | 1.8% |
eBay, Inc. | 1.7% |
QUALCOMM, Inc. | 1.5% |
Dell, Inc. | 1.5% |
United Parcel Service, Inc., Class B | 1.4% |
Microsoft Corp. | 1.3% |
Wm. Wrigley Jr. Co. | 1.0% |
Amazon.com, Inc. | 0.8% |
Genentech, Inc. | 0.8% |
Total | 13.6% |
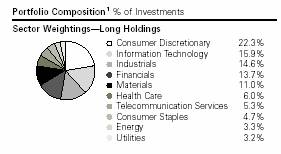

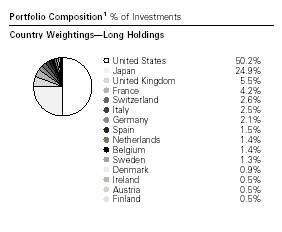
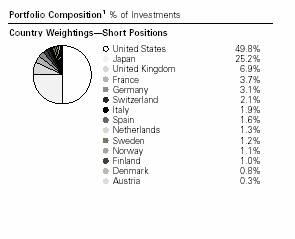
1 Portfolio holdings are subject to change and may not represent current or future holdings.
Laudus Trust Annual Report 27
Performance and Fund Facts
Laudus Rosenberg Value Long/Short Equity Fund as of 3/31/07
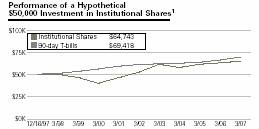
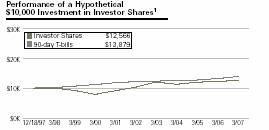
Average Annual Total Returns1 | | | | |
| | | Since Inception | Since Inception |
Class and Inception Date | 1 year | 5 year | Institutional | Investor |
Institutional (12/16/97) | 3.19% | 4.39% | 2.82% | n/a |
Investor (12/18/97) | 2.81% | 4.07% | n/a | 2.49% |
90 day T-bills | 5.24% | 2.68% | 3.59% | 3.59% |
Past performance does not guarantee future results. The performance data quoted represents past performance, and current returns may be lower or higher. The performance information does not reflect the deduction of taxes that a shareholder would pay on fund distributions or the redemption of fund shares. The investment return and principal value will fluctuate so that an investor’s shares, when redeemed, may be worth more or less than the original cost. To obtain performance information current to the most recent month end, visit www.laudusfunds.com.
Performance data quoted does not reflect the non-recurring redemption fee of 2% that may be charged if shares are sold or exchanged within 30 days of the purchase date. If these fees were reflected, the performance data quoted would be lower.
Investments in long/short funds are more volatile and risky than some other forms of investments. Since they have both long and short portfolios, an investment will involve risks associated with twice the number of investment decisions made for a typical stock fund. These types of Funds typically have a high portfolio turnover that could increase transaction costs and cause short-term capital gains to be realized. While it may be the intent of the Manager to take long positions in stocks that outperform the market and short positions in stocks that underperform the market, there is no assurance that the Manager will be successful.
The Fund uses the return that an investor could achieve through an investment in 3-month U.S. Treasury Bills as a benchmark against which to measure the Fund’s performance. AXA Rosenberg attempts to achieve returns for the Fund’s shareholders which exceed the benchmark. An investment in the Fund is different from an investment in 3-month U.S. Treasury Bills because, among other differences, U.S. Treasury Bills are backed by the full faith and credit of the U.S. Government, U.S. Treasury Bills have a fixed rate of return, investors in U.S. Treasury Bills do not risk losing their investment, and an investment in the Fund is more volatile than an investment in U.S. Treasury Bills.
Small- and mid-capitalization funds typically carry additional risk since small- and mid-capitalization companies generally have a higher risk of failure.
Value-based investments are subject to the risk that the broad market may not recognize their value.
1 Total returns include change in share price and reinvestment of distributions. Total returns may reflect the waiver of a portion of a Fund’s advisory fees for certain periods since the inception date. In such instances, and without the waiver of fees, total returns would have been lower.
| Institutional | Investor |
Fund Overview2 | Shares | Shares |
| | |
Initial Investment | $50,000 | $2,500 |
Inception Date | 12/16/97 | 12/18/97 |
Total Net Assets | $260,596 | $64,400 |
($ x 1,000) | | |
Ticker Symbol | BMNIX | BRMIX |
Cusip | 51855Q861 | 51855Q762 |
NAV | $10.75 | $10.63 |
Gross Expense Ratio3 | 1.74% | 2.04% |
Gross Expense Ratio4 (paid by | 2.89% | 3.19% |
shareholders) | | |
Fund Characteristics2 | Long | Short |
| | |
Number of Securities | 799 | 472 |
Avg. Market Capitalization | 3,562 | 3,321 |
($Wtd. x 1,000,000) | | |
Portfolio Turnover | 140% | 119% |
(One year trailing) | | |
Price to Earnings (P/E) | 17.20 | 45.27 |
Price to Book (P/B) | 2.04 | 2.83 |
Price to Cash Flow | 12.77 | 19.36 |
Beta | 1.35 | 1.36 |
Return on Equity | 13.15% | 6.44% |
Five-Year Earnings Growth | 29.60% | 13.82% |
2 Portfolio holdings are subject to change and may not represent current or future holdings.
3 Total Annual Fund Operating Expenses. Provides the expense ratio projected for this Share Class for the period 7/31/06 - 7/31/07. Excludes dividend expense on securities sold short, an expense associated with executing this strategy. Actual expenses influenced by total assets and may be reduced based on contractual fee waiver by Adviser. Please see the prospectus for more information.
4 Total Annual Fund Operating Expenses. Provides the expense ratio projected for this Share Class for the period 7/31/06 - 7/31/07. Includes dividend expense on securities sold short, an expense associated with executing this strategy. Actual expenses influenced by total assets and may be reduced based on contractual fee waiver by Adviser. Please see the prospectus for more information.
28 Laudus Trust Annual Report
Performance and Fund Facts continued
Laudus Rosenberg Value Long/Short Equity Fund as of 3/31/07
Top Equity Holdings1 % of Net Assets | Long |
| |
United States Steel Corp. | 1.3% |
NII Holdings, Inc. | 1.2% |
Celgene Corp. | 1.2% |
Avnet, Inc. | 1.1% |
Allegheny Technologies, Inc. | 1.1% |
ENSCO International, Inc. | 1.1% |
The Sherwin-Williams Co. | 1.1% |
BMC Software, Inc. | 1.0% |
A.G. Edwards, Inc. | 1.0% |
Phillips-Van Heusen Corp. | 0.9% |
Total | 11.0% |
Top Equity Holdings1 % of Net Assets | Short |
| |
Sovereign Bancorp, Inc. | 1.0% |
Developers Diversified Realty Corp. | 1.0% |
Activision, Inc. | 1.0% |
Intuitive Surgical, Inc. | 1.0% |
New York Community Bancorp, Inc. | 1.0% |
Plum Creek Timber Co., Inc. | 1.0% |
VeriSign, Inc. | 1.0% |
Altera Corp. | 0.9% |
R.H. Donnelley Corp. | 0.9% |
Kinder Morgan Management, LLC | 0.9% |
Total | 9.7% |
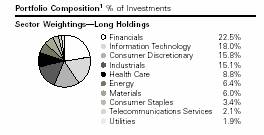
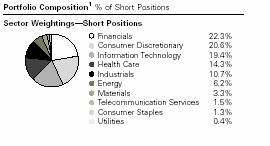
1 Portfolio holdings are subject to change and may not represent current or future holdings.
Laudus Trust Annual Report 29
Disclosure of Fund Expenses (Unaudited)
Examples for a $1,000 Investment
As a fund shareholder, you incur two types of costs: transaction costs, such as redemption fees; and, ongoing costs, such as management fees, transfer agent and shareholder services fees, and other fund expenses.
The expense examples below are intended to help you understand your ongoing cost (in dollars) of investing in a fund and to compare this cost with the ongoing cost of investing in other mutual funds. These examples are based on an investment of $1,000 invested for the period beginning October 1, 2006 and held through March 31, 2007, unless otherwise noted.
Actual Return lines in the table below provide information about actual account values and actual expenses. You may use this information, together with the amount you invested, to estimate the expenses that you paid over the period. To do so, simply divide your account value by $1,000 (for example, an $8,600 account value ?$1,000 = 8.6), then multiply the result by the number given for your fund or share class under the heading entitled ‘‘Expenses Paid During Period.’’
Hypothetical Return lines in the table below provide information about hypothetical account values and hypothetical expenses based on a fund’s share classes’ actual expense ratios and an assumed return of 5% per year before expenses. Because the return used is not an actual return, it may not be used to estimate the actual ending account value or expenses you paid for the period. You may use this information to compare the ongoing costs of investing in the fund and other funds. To do so, compare this 5% hypothetical example with the 5% hypothetical examples that appear in the shareholder reports of the other funds.
Please note that the expenses shown in the table are meant to highlight your ongoing costs only, and do not reflect any transactional costs, such as redemption fees. If these transactional costs were included, your costs would have been higher.
| | | Ending | | |
| | Beginning | Account Value | Expenses |
| Expense | Account | (Net of | Paid During |
| Ratio1 | Value | Expenses) | Period2 |
| (Annualized) | at 10/1/06 | at 3/31/07 | 10/1/06 - 3/31/07 |
Laudus Rosenberg U.S. Large Capitalization Fund | | | | |
Institutional Shares | 1.00% | | | | |
Actual Return | | $1,000 | $1,094.18 | $ | 5.22 |
Hypothetical 5% Return | | $1,000 | $1,019.95 | $ | 5.04 |
Investor Shares | 1.31% | | | | |
Actual Return | | $1,000 | $1,091.93 | $ | 6.83 |
Hypothetical 5% Return | | $1,000 | $1,018.40 | $ | 6.59 |
Laudus Rosenberg U.S. Large Capitalization Growth Fund | | | |
Institutional Shares | 0.99% | | | | |
Actual Return | | $1,000 | $1,077.20 | $ | 5.13 |
Hypothetical 5% Return | | $1,000 | $1,020.00 | $ | 4.99 |
Investor Shares | 1.29% | | | | |
Actual Return | | $1,000 | $1,075.50 | $ | 6.68 |
Hypothetical 5% Return | | $1,000 | $1,018.50 | $ | 6.49 |
Laudus Rosenberg U.S. Large Capitalization Value Fund | | | |
Institutional Shares | 0.99% | | | | |
Actual Return | | $1,000 | $1,097.60 | $ | 5.18 |
Hypothetical 5% Return | | $1,000 | $1,020.13 | $ | 4.99 |
Investor Shares | 1.29% | | | | |
Actual Return | | $1,000 | $1,096.20 | $ | 6.74 |
Hypothetical 5% Return | | $1,000 | $1,018.64 | $ | 6.49 |
Laudus Rosenberg U.S. Discovery Fund | | | | | |
Institutional Shares | 0.97% | | | | |
Actual Return | | $1,000 | $1,120.00 | $ | 5.13 |
Hypothetical 5% Return | | $1,000 | $1,020.09 | $ | 4.89 |
Investor Shares | 1.37% | | | | |
Actual Return | | $1,000 | $1,117.90 | $ | 7.23 |
Hypothetical 5% Return | | $1,000 | $1,018.10 | $ | 6.89 |
| | | | | | |
1 Based on the most recent six-month expense ratio; may differ from the expense ratio provided in Financial Highlights.
2 Expenses for each fund or share class are equal to that fund’s or share class’ annualized expense ratio (net of any expenses waived or reimbursed), multiplied by the average account value for the hypothetical account over the period, multiplied by 182 days of the period, and divided by 365 days of the fiscal year.
30 Laudus Trust Annual Report
| | | Ending | | |
| | Beginning | Account Value | Expenses |
| Expense | Account | (Net of | Paid During |
| Ratio1 | Value | Expenses) | Period2 |
| (Annualized) | at 10/1/06 | at 3/31/07 | 10/1/06 - 3/31/07 |
Laudus Rosenberg U.S. Small | | | | | |
Capitalization Fund | | | | | |
Institutional Shares | 0.92% | | | | |
Actual Return | | $1,000 | $1,089.30 | | $4.79 |
Hypothetical 5% Return | | $1,000 | $1,020.34 | | $4.63 |
Adviser Shares | 1.17% | | | | |
Actual Return | | $1,000 | $1,088.20 | | $6.09 |
Hypothetical 5% Return | | $1,000 | $1,019.10 | | $5.89 |
Investor Shares | 1.28% | | | | |
Actual Return | | $1,000 | $1,087.30 | | $6.66 |
Hypothetical 5% Return | | $1,000 | $1,018.55 | | $6.44 |
Laudus Rosenberg International Equity Fund | | | | |
Institutional Shares | 1.34% | | | | |
Actual Return | | $1,000 | $1,154.40 | | $7.20 |
Hypothetical 5% Return | | $1,000 | $1,018.25 | | $6.74 |
Investor Shares | 1.64% | | | | |
Actual Return | | $1,000 | $1,152.40 | | $8.80 |
Hypothetical 5% Return | | $1,000 | $1,016.75 | | $8.25 |
Laudus Rosenberg International Discovery Fund | | | | |
Institutional Shares | 1.34% | | | | |
Actual Return | | $1,000 | $1,189.20 | | $7.31 |
Hypothetical 5% Return | | $1,000 | $1,018.25 | | $6.74 |
Investor Shares | 1.64% | | | | |
Actual Return | | $1,000 | $1,187.60 | | $8.94 |
Hypothetical 5% Return | | $1,000 | $1,016.75 | | $8.25 |
Laudus Rosenberg International Small Capitalization Fund | | | |
| | | | | |
Institutional Shares | 1.10% | | | | |
Actual Return | | $1,000 | $1,202.42 | | $6.04 |
Hypothetical 5% Return | | $1,000 | $1,019.45 | | $5.54 |
Investor Shares | 1.50% | | | | |
Actual Return | | $1,000 | $1,200.05 | | $8.23 |
Hypothetical 5% Return | | $1,000 | $1,017.45 | | $7.54 |
Laudus Rosenberg U.S. Large/Mid Capitalization | | | | |
Long/Short Equity Fund | | | | | |
Institutional Shares | 2.59% | | | | |
Actual Return | | $1,000 | $1,036.00 | $13.15 |
Hypothetical 5% Return | | $1,000 | $1,012.02 | $12.99 |
Investor Shares | 2.90% | | | | |
Actual Return | | $1,000 | $1,034.80 | $14.71 |
Hypothetical 5% Return | | $1,000 | $1,010.47 | $14.54 |
Laudus Rosenberg Global Long/Short Equity Fund | | | | |
Institutional Shares | 3.05% | | | | |
Actual Return | | $1,000 | $1,035.34 | $15.48 |
Hypothetical 5% Return | | $1,000 | $1,009.72 | $15.28 |
Investor Shares | 3.36% | | | | |
Actual Return | | $1,000 | $1,033.17 | $17.03 |
Hypothetical 5% Return | | $1,000 | $1,008.18 | $16.82 |
Laudus Rosenberg Value Long/Short Equity Fund | | | | |
Institutional Shares | 3.09% | | | | |
Actual Return | | $1,000 | $1,026.10 | $15.61 |
Hypothetical 5% Return | | $1,000 | $1,009.52 | $15.48 |
Investor Shares | 3.39% | | | | |
Actual Return | | $1,000 | $1,024.20 | $17.11 |
Hypothetical 5% Return | | $1,000 | $1,008.03 | $16.97 |
1 Based on the most recent six-month expense ratio; may differ from the expense ratio provided in Financial Highlights.
2 Expenses for each fund or share class are equal to that fund’s or share class’ annualized expense ratio (net of any expenses waived or reimbursed), multiplied by the average account value for the hypothetical account over the period, multiplied by 182 days of the period, and divided by 365 days of the fiscal year.
Laudus Trust Annual Report 31
Laudus Rosenberg U.S. Large Capitalization Fund |
Portfolio Holdings as of March 31, 2007 | |
| | | |
| | Cost | Value |
Holdings by Category | ($) | ($) |
| | | |
99.4% | Common Stock | 92,204,139 | 104,326,475 |
— % | Short-Term Investment | 40,000 | 40,000 |
| | | |
99.4% | Total Investments | 92,244,139 | 104,366,475 |
0.6% | Other Assets and | | |
| Liabilities | | 628,072 |
| | | |
100.0% | Net Assets | | 104,994,547 |
| | | | |
| | | | Number of | Value |
Security | | | | Shares | ($) |
| | | | | |
Common Stock 99.4% of net assets | | |
| | | | | |
Agriculture, Food & Beverage 2.9% | | | |
Bunge Ltd. | | | | 730 | 60,020 |
Campbell Soup Co. | | | | 13,400 | 521,930 |
Corn Products International, Inc. | | 3,700 | 131,683 |
General Mills, Inc. | | | | 17,290 | 1,006,624 |
H.J. Heinz Co. | | | | 1,140 | 53,717 |
Kellogg Co. | | | | 14,100 | 725,163 |
Seaboard Corp. | | | | 127 | 287,020 |
The Pepsi Bottling Group, Inc. | | 8,590 | 273,935 |
| | | | | 3,060,092 |
Airlines 0.5% | | | | | |
FedEx Corp. | | | | 4,980 | 535,001 |
Banks & Credit Institutions 7.3% | | | |
Bank of America Corp. | | | 75,420 | 3,847,929 |
The Bank of New York Co., Inc. | | 33,249 | 1,348,247 |
The First Marblehead Corp. | | | 460 | 20,649 |
Wachovia Corp. | | | | 44,000 | 2,422,200 |
| | | | | 7,639,025 |
Basic Minerals & Metals 3.9% | | | | |
Allegheny Technologies, Inc. | | | 5,670 | 604,932 |
Chaparral Steel Co. | | | | 2,260 | 131,464 |
Freeport-McMoran Copper & Gold, | | |
Inc., Class B | | | | 10,170 | 673,152 |
Nucor Corp. | | | | 12,091 | 787,487 |
Precision Castparts Corp. | | | 7,386 | 768,513 |
Reliance Steel & Aluminum Co. | | 4,000 | 193,600 |
Southern Copper Corp. | | | 2,800 | 200,648 |
Steel Dynamics, Inc. | | | | 3,507 | 151,503 |
United States Steel Corp. | | | 6,300 | 624,771 |
| | | | | 4,136,070 |
Beer, Liquor, & Tobacco 2.9% | | | | |
Altria Group, Inc. | | | | 10,874 | 954,846 |
Anheuser-Busch Cos., Inc. | | | 32,600 | 1,644,996 |
UST, Inc. | | | | 7,460 | 432,531 |
| | | | | 3,032,373 |
Biotechnology 1.0% | | | | |
Celgene Corp. * | | | | 19,500 | 1,022,970 |
Cellular & Wireless 0.6% | | | | | |
NII Holdings, Inc. * | | | | 8,300 | 615,694 |
Chemicals & Rubber 1.4% | | | | |
Cabot Corp. | | | | 3,890 | 185,670 |
Celanese Corp., Series A | | | 4,600 | 141,864 |
| | | | | |
| | | | Number of | Value |
Security | | | | Shares | ($) |
FMC Corp. | | | | 2,260 | 170,472 |
Hercules, Inc. * | | | | 6,400 | 125,056 |
Nalco Holding Co. | | | | 6,600 | 157,740 |
The Sherwin-Williams Co. | | | 10,980 | 725,119 |
| | | | | 1,505,921 |
Commercial Aircraft & Components 0.3% | | |
Rockwell Collins, Inc. | | | | 5,280 | 353,390 |
Communications Utilities 5.3% | | | |
AT&T Corp. | | | | 100,751 | 3,972,612 |
CenturyTel, Inc. | | | | 400 | 18,076 |
Comcast Corp., Class A * | | | 30,711 | 796,950 |
Qwest Communications | | | | |
International, Inc. * | | | | 54,691 | 491,672 |
The DIRECTV Group, Inc. * | | | 10,150 | 234,161 |
| | | | | 5,513,471 |
Construction & Homebuilding 0.0% | | | |
Granite Construction, Inc. | | | 380 | 20,999 |
Construction Materials 0.3% | | | |
MDU Resources Group, Inc. | | 10,547 | 303,121 |
Consumer Durables 0.7% | | | | | |
Harley-Davidson, Inc. | | | | 12,422 | 729,793 |
Drugs & Pharmaceuticals 3.6% | | | |
King Pharmaceuticals, Inc. * | | | 7,510 | 147,722 |
Merck & Co., Inc. | | | | 3,850 | 170,055 |
NBTY, Inc. * | | | | 3,000 | 159,120 |
Pfizer, Inc. | | | | 75,732 | 1,912,990 |
Schering-Plough Corp. | | | | 37,420 | 954,584 |
Wyeth | | | | 8,440 | 422,253 |
| | | | | 3,766,724 |
Electric Utilities 3.8% | | | | |
Alliant Energy Corp. | | | | 7,060 | 316,429 |
Consolidated Edison, Inc. | | | 13,420 | 685,225 |
Constellation Energy Group | | | 2,620 | 227,809 |
Edison International | | | | 13,300 | 653,429 |
Exelon Corp. | | | | 390 | 26,797 |
FPL Group, Inc. | | | | 13,100 | 801,327 |
Northeast Utilities | | | | 9,277 | 304,007 |
PG&E Corp. | | | | 18,300 | 883,341 |
Puget Energy, Inc. | | | | 1,580 | 40,574 |
Westar Energy, Inc. | | | | 2,370 | 65,223 |
| | | | | 4,004,161 |
Forest Products & Paper 1.1% | | | | |
3M Co. | | | | 4,559 | 348,444 |
International Paper Co. | | | 23,400 | 851,760 |
| | | | | 1,200,204 |
Furniture & Household Items 1.5% | | | |
Acuity Brands, Inc. | | | | 2,400 | 130,656 |
Hasbro, Inc. | | | | 9,800 | 280,476 |
International Game Technology | | 16 | 646 |
Mattel, Inc. | | | | 22,010 | 606,816 |
Steelcase, Inc., Class A | | | 4,800 | 95,472 |
The Procter & Gamble Co. | | | 7,000 | 442,120 |
32 Laudus Funds Annual Report
See financial notes.
Laudus Rosenberg U.S. Large Capitalization Fund |
| | Number of | Value |
Security | | Shares | ($) |
| | | |
Government Aircraft & Defense 2.1% | | |
Garmin Ltd. | | 10,121 | 548,052 |
General Dynamics Corp. | | 8,580 | 655,512 |
Lockheed Martin Corp. | | 1,600 | 155,232 |
Raytheon Co. | | 16,950 | 889,197 |
| | | 2,247,993 |
Health Care & Hospital 1.0% | | | |
Health Net, Inc. * | | 6,516 | 350,626 |
Humana, Inc. * | | 9,600 | 556,992 |
Laboratory Corp. of America | | |
Holdings * | | 2,560 | 185,933 |
Manor Care, Inc. | | 80 | 4,349 |
| | | 1,097,900 |
Information & Services 1.8% | | | |
Accenture Ltd., Class A | | 25,140 | 968,896 |
IAC/InterActive Corp. * | | 9,262 | 349,270 |
Manpower, Inc. | | 2,590 | 191,064 |
Sotheby’s | | 1,060 | 47,149 |
The Dun & Bradstreet Corp. | 4,080 | 372,096 |
| | | 1,928,475 |
Instruments 3.0% | | | |
Baxter International, Inc. | | 25,850 | 1,361,519 |
Honeywell International, Inc. | 18,500 | 852,110 |
Johnson & Johnson | | 5,130 | 309,134 |
Mettler-Toledo International, Inc. * | 1,070 | 95,840 |
PerkinElmer, Inc. | | 7,700 | 186,494 |
Waters Corp. * | | 6,300 | 365,400 |
| | | 3,170,497 |
Insurance 9.1% | | | |
ACE Ltd. | | 15,800 | 901,548 |
Alleghany Corp. * | | 326 | 121,943 |
American Financial Group, Inc. | 5,250 | 178,710 |
American International Group, Inc. | 2,300 | 154,606 |
American National Insurance Co. | 440 | 56,289 |
Arch Capital Group Ltd. * | | 4,100 | 279,661 |
Aspen Insurance Holdings Ltd. | 4,890 | 128,167 |
CNA Financial Corp. * | | 3,040 | 130,994 |
Endurance Specialty Holdings Ltd. | 3,560 | 127,234 |
Everest Re Group Ltd. | | 3,400 | 326,978 |
Loews Corp. | | 25,200 | 1,144,836 |
MetLife, Inc. | | 21,900 | 1,382,985 |
PartnerRe Ltd. | | 1,380 | 94,585 |
Prudential Financial, Inc. | | 12,214 | 1,102,436 |
Radian Group, Inc. | | 4,800 | 263,424 |
Reinsurance Group of America, Inc. | 1,870 | 107,936 |
The Allstate Corp. | | 25,500 | 1,531,530 |
The Chubb Corp. | | 3,650 | 188,596 |
The Travelers Cos., Inc. * | | 12,330 | 638,324 |
Wesco Financial Corp. | | 200 | 92,000 |
XL Capital Ltd., Class A | | 8,730 | 610,751 |
| | | 9,563,533 |
Integrated Oil Companies 5.9% | | |
Chevron Corp. | | 7,512 | 555,588 |
Exxon Mobil Corp. | | 61,090 | 4,609,240 |
| Number of | Value |
Security | Shares | ($) |
| | |
Hess Corp. | 10,400 | 576,888 |
Marathon Oil Corp. | 4,840 | 478,337 |
| | 6,220,053 |
IT Hardware 4.1% | | |
Amphenol Corp., Class A | 5,600 | 361,592 |
Cisco Systems, Inc. * | 117,942 | 3,011,059 |
Harris Corp. | 3,600 | 183,420 |
LSI Logic Corp. * | 11,451 | 119,548 |
MEMC Electronic Materials, Inc. * | 8,960 | 542,797 |
NVIDIA Corp. * | 795 | 22,880 |
ON Semiconductor Corp. * | 1,690 | 15,075 |
| | 4,256,371 |
Land & Water Transportation 1.3% | | |
Burlington Northern Santa Fe Corp. | 430 | 34,585 |
CSX Corp. | 70 | 2,804 |
Seacor Holdings, Inc. * | 500 | 49,200 |
Union Pacific Corp. | 12,270 | 1,246,018 |
| | 1,332,607 |
Metal Products & Machinery 3.8% | | |
AGCO Corp. * | 3,120 | 115,346 |
American Standard Cos., Inc. | 9,610 | 509,522 |
Dover Corp. | 7 | 342 |
General Electric Co. | 49,900 | 1,764,464 |
Lincoln Electric Holdings, Inc. | 2,110 | 125,672 |
Parker Hannifin Corp. | 7,000 | 604,170 |
SPX Corp. | 3,540 | 248,508 |
Terex Corp. * | 5,714 | 410,037 |
The Manitowoc Co., Inc. | 1,210 | 76,871 |
Varian Semiconductor Equipment | | |
Associates, Inc. * | 3,013 | 160,834 |
| | 4,015,766 |
Miscellaneous Finance 4.9% | | |
A.G. Edwards, Inc. | 4,400 | 304,392 |
Chicago Mercantile Exchange | | |
Holdings, Inc., Class A | 334 | 177,842 |
Citigroup, Inc. | 14,200 | 729,028 |
JPMorgan Chase & Co. | 37,011 | 1,790,592 |
Merrill Lynch & Co., Inc. | 24,300 | 1,984,581 |
Morgan Stanley | 1,434 | 112,942 |
| | 5,099,377 |
Oil & Coal Resources 0.3% | | |
XTO Energy, Inc. | 5,530 | 303,099 |
Oil Distribution 0.3% | | |
Holly Corp. | 2,720 | 161,296 |
Tesoro Corp. | 1,420 | 142,611 |
| | 303,907 |
Oil Drilling & Services 2.0% | | |
Diamond Offshore Drilling, Inc. | 3,370 | 272,801 |
ENSCO International, Inc. | 9,000 | 489,600 |
GlobalSantaFe Corp. | 10,540 | 650,107 |
Noble Corp. | 3,570 | 280,888 |
Superior Energy Services, Inc. * | 4,900 | 168,903 |
Tidewater, Inc. | 3,800 | 222,604 |
| | 2,084,903 |
See financial notes.
Laudus Funds Annual Report 33
Laudus Rosenberg U.S. Large Capitalization Fund |
Portfolio Holdings continued | | |
| | | |
| | Number of | Value |
Security | | Shares | ($) |
| | | |
Photo-optical, Micros & Office Machinery 2.1% | |
Brocade Communications Systems, | | |
Inc. * | | 7,970 | 75,874 |
Hewlett-Packard Co. | | 51,920 | 2,084,069 |
| | | 2,159,943 |
Publishing, Broadcasting & Cinema | 5.9% | |
CBS Corp., Class B | | 25,208 | 771,113 |
Gannett Co., Inc. | | 13,660 | 768,921 |
News Corp., Class A | | 82,749 | 1,913,157 |
The Walt Disney Co. | | 59,627 | 2,052,957 |
Time Warner, Inc. | | 33,333 | 657,327 |
| | | 6,163,475 |
Real Estate Development 0.2% | | |
Service Corp. International | 13,490 | 159,991 |
Real Estate Investment Trusts 0.1% | | |
HRPT Properties Trust | 12,150 | 149,445 |
Restaurants, Hotels & Theaters | 1.9% | |
Burger King Holdings, Inc. | 300 | 6,480 |
McDonald’s Corp. | | 44,780 | 2,017,339 |
| | | 2,023,819 |
Retail 3.6% | | | |
Abercrombie & Fitch Co., Class A | 5,700 | 431,376 |
American Eagle Outfitters, Inc. | 4,050 | 121,459 |
AutoZone, Inc. * | | 3,340 | 427,988 |
Big Lots, Inc. * | | 6,100 | 190,808 |
CVS/Caremark Corp. | | 1,100 | 37,554 |
J.C. Penney Co., Inc. | | 11,990 | 985,098 |
Nordstrom, Inc. | | 13,140 | 695,632 |
OfficeMax, Inc. | | 4,160 | 219,398 |
Safeway, Inc. | | 9,950 | 364,568 |
The Kroger Co. | | 10,240 | 289,280 |
The Men’s Wearhouse, Inc. | 450 | 21,173 |
| | | 3,784,334 |
Soaps & Cosmetics 0.1% | | | |
Avon Products, Inc. | | 1,640 | 61,106 |
The Estee Lauder Cos., Inc., Class A | 140 | 6,839 |
| | | 67,945 |
Software 7.0% | | | |
BMC Software, Inc. * | | 12,160 | 374,406 |
Cadence Design Systems, Inc. * | 10,750 | 226,395 |
Cognizant Technology Solutions | | |
Corp., Class A * | | 7,819 | 690,183 |
| | | | |
| | Number of | Value |
Security | | Shares | ($) |
| | | |
Computer Sciences Corp. * | 5,360 | 279,417 |
International Business Machines | | |
Corp. | | 30,645 | 2,888,598 |
Microsoft Corp. | | 24,270 | 676,405 |
Oracle Corp. * | | 116,220 | 2,107,069 |
Sybase, Inc. * | | 2,070 | 52,330 |
THQ, Inc. * | | 613 | 20,958 |
| | | 7,315,761 |
Textiles & Apparel 0.8% | | | |
Coach, Inc. * | | 3,745 | 187,437 |
Guess?, Inc. | | 2,140 | 86,649 |
Liz Claiborne, Inc. | | 6,260 | 268,241 |
Polo Ralph Lauren Corp. | 3,447 | 303,853 |
| | | 846,180 |
Wholesale 1.0% | | | |
Anixter International, Inc. * | 1,700 | 112,098 |
Arrow Electronics, Inc. * | 7,170 | 270,668 |
Avnet, Inc. * | | 7,600 | 274,664 |
W.W. Grainger, Inc. | | 4,900 | 378,476 |
| | | 1,035,906 |
Total Common Stock (Cost $92,204,139) | 104,326,475 |
| Face | |
Security | Amount | Value |
Rate, Maturity Date | ($) | ($) |
| |
Short-Term Investment 0.0% of net assets | |
| |
Repurchase Agreement 0.0% | |
Fixed Income Clearing Corp. dated | |
03/30/07, due 04/02/07 at 5.00%, | |
with a maturity value of $40,017 | |
(fully collateralized by United | |
States Treasury Note with a value | |
of $44,438.) | 40,000 | 40,000 |
Total Short-Term Investment | |
(Cost $40,000) | 40,000 |
| |
End of Investments. | |
| |
At 03/31/07 the tax basis cost of the fund’s investments was |
$92,471,527, and the unrealized appreciation and depreciation |
were $12,476,310 and ($581,362), respectively, with a net |
unrealized appreciation of $11,894,948. | |
| |
* Non-income producing security. | |
| | | |
34 Laudus Funds Annual Report
See financial notes.
Laudus Rosenberg U.S. Large Capitalization Growth Fund |
Portfolio Holdings as of March 31, 2007 | |
| | | |
| | Cost | Value |
Holdings by Category | ($) | ($) |
| | | |
99.2% | Common Stock | 69,070,731 | 77,114,283 |
| | | |
99.2% | Total Investments | 69,070,731 | 77,114,283 |
8.0% | Collateral for | | |
| Securities on Loan | 6,243,025 | 6,243,025 |
(7.2)% | Other Assets and | | |
| Liabilities | | (5,634,450) |
| | | |
100.0% | Net Assets | | 77,722,858 |
| | | Number of | Value |
Security | | | Shares | ($) |
| | | | |
Common Stock 99.2% of net assets | | |
| | | | |
Agriculture, Food & Beverage 3.0% | | | |
Campbell Soup Co. (a) | | | 3,100 | 120,744 |
General Mills Inc | | | 1,490 | 86,748 |
H.J. Heinz Co. | | | 4,100 | 193,192 |
Kellogg Co. | | | 3,900 | 200,577 |
PepsiCo, Inc. | | | 13,100 | 832,636 |
The Coca-Cola Co. | | | 17,300 | 830,400 |
The Pepsi Bottling Group, Inc. | | 2,800 | 89,292 |
| | | | 2,353,589 |
Airlines 1.1% | | | | |
AMR Corp. (a)* | | | 3,270 | 99,572 |
Continental Airlines, Inc., Class B * | 2,900 | 105,531 |
FedEx Corp. | | | 5,200 | 558,636 |
U S Airways Group Inc | | | 2,100 | 95,508 |
| | | | 859,247 |
Autos 0.3% | | | | |
Autoliv, Inc. | | | 483 | 27,584 |
BorgWarner, Inc. (a) | | | 200 | 15,084 |
PACCAR, Inc. (a) | | | 3,100 | 227,540 |
| | | | 270,208 |
Banks & Credit Institutions 4.1% | | | |
Alliance Data Systems Corp | | | 2,100 | 129,402 |
American Express Co. | | | 8,900 | 501,960 |
Bank of America Corp. | | | 400 | 20,408 |
Deere & Co. | | | 800 | 86,912 |
First Marblehead Corp (a) | | | 1,715 | 76,986 |
Freddie Mac | | | 2,500 | 148,725 |
Harley-Davidson, Inc. (a) | | | 5,600 | 329,000 |
Investors Financial Services Corp. | 2,100 | 122,115 |
Mellon Financial Cor | | | 6,300 | 271,782 |
Northern Trust Corp (a) | | | 3,900 | 234,546 |
SLM Corp. | | | 2,300 | 94,070 |
State Street Corp | | | 5,800 | 375,550 |
Synovus Financial Corp (a) | | | 4,700 | 151,998 |
The Bank of New York Co., Inc. | | 2,000 | 81,100 |
U.S. Bancorp (a) | | | 500 | 17,485 |
Wachovia Corp. | | | 3,400 | 187,170 |
Wells Fargo & Co. | | | 9,730 | 335,004 |
| | | | 3,164,213 |
Basic Minerals & Metals 1.9% | | | | |
Alcoa, Inc. | | | 6,900 | 233,910 |
Allegheny Technologies, Inc. | | | 2,000 | 213,380 |
Carpenter Technology Corp. (a) | | 900 | 108,684 |
| | Number of | Value |
Security | | Shares | ($) |
| | | |
Freeport-McMoran Copper & Gold, | | |
Inc., Class B | | 2,900 | 191,951 |
Harsco Corp. (a) | | 2,400 | 107,664 |
Newmont Mining Corp. (a) | 2,200 | 92,378 |
Precision Castparts Corp. | 2,700 | 280,935 |
Southern Copper Corp. (a) | 1,600 | 114,656 |
Titanium Metals Corp * | 2,800 | 100,464 |
| | | 1,444,022 |
Beer, Liquor, & Tobacco 1.3% | | |
Altria Group, Inc. | | 5,200 | 456,612 |
Anheuser-Busch Cos., Inc. | 9,300 | 469,278 |
UST, Inc. (a) | | 2,100 | 121,758 |
| | | 1,047,648 |
Biotechnology 1.8% | | |
Amgen, Inc. * | | 9,400 | 525,272 |
Celgene Corp. (a)* | | 7,200 | 377,712 |
Genentech, Inc. * | | 3,400 | 279,208 |
Gilead Sciences, Inc. * | 3,300 | 252,450 |
| | | 1,434,642 |
Cellular & Wireless 0.5% | | | |
NII Holdings, Inc. * | | 3,200 | 237,376 |
Sprint Nextel Corp. | | 5,100 | 96,696 |
U.S. Cellular Corp. * | | 1,000 | 73,450 |
| | | 407,522 |
Chemicals & Rubber 3.1% | | |
Cabot Corp. (a) | | 1,000 | 47,730 |
Celanese Corp., Series A | 1,600 | 49,344 |
Du Pont De Nemours | 12,800 | 632,704 |
International Flavors & Fragrances, | | |
Inc. (a) | | 2,300 | 108,606 |
Monsanto Co. | | 9,800 | 538,608 |
Nalco Holding Company | 3,720 | 88,908 |
PPG Industries, Inc. | | 1,200 | 84,372 |
Praxair, Inc. | | 6,000 | 377,760 |
Rohm and Haas Co. | | 400 | 20,688 |
Sigma-Aldrich Corp. | | 2,200 | 91,344 |
The Goodyear Tire & Rubber Co. (a)* | 4,800 | 149,712 |
The Scotts Miracle-Gro Co., | | |
Class A (a) | | 1,300 | 57,239 |
The Sherwin-Williams Co. | 2,000 | 132,080 |
| | | 2,379,095 |
Commercial Aircraft & Components 1.6% | | |
Goodrich Corp. | | 2,400 | 123,552 |
Rockwell Collins, Inc. | | 3,400 | 227,562 |
The Boeing Co. | | 9,900 | 880,209 |
| | | 1,231,323 |
Communications Utilities 3.8% | | |
American Tower Corp., Class A * | 3,200 | 124,640 |
Comcast Corp., Class A * | 22,350 | 579,982 |
Echostar Communications Corp | 3,790 | 164,600 |
Google, Inc., Class A * | 2,700 | 1,237,032 |
Level 3 Communications, Inc. * | 24,300 | 148,230 |
The DIRECTV Group, Inc. | 16,500 | 380,655 |
Yahoo! Inc. * | | 10,900 | 341,061 |
| | | 2,976,200 |
See financial notes.
Laudus Funds Annual Report 35
Laudus Rosenberg U.S. Large Capitalization Growth Fund |
Portfolio Holdings continued | | | | |
| | | | |
| | | Number of | Value |
Security | | | Shares | ($) |
| | | | |
Construction & Homebuilding 0.1% | | | |
Quanta Services Inc | | | 1,900 | 47,918 |
Construction Materials 0.5% | | | | |
Martin Marietta Materials, Inc. (a) | | 1,100 | 148,720 |
Vulcan Materials Co. | | | 1,900 | 221,312 |
| | | | 370,032 |
Drugs & Pharmaceuticals 4.2% | | | |
Abbott Laboratories | | | 9,400 | 524,520 |
Allergan, Inc. | | | 1,200 | 132,984 |
Bristol-Myers Squibb Co. | | 6,900 | 191,544 |
Eli Lilly & Co. | | | 5,800 | 311,518 |
Forest Laboratories, Inc. * | | 2,300 | 118,312 |
Genzyme Corp. * | | | 1,800 | 108,036 |
Merck & Co., Inc. | | | 11,630 | 513,697 |
Schering-Plough Corp. | | | 26,100 | 665,811 |
Wyeth | | | 13,800 | 690,414 |
| | | | 3,256,836 |
Electric Utilities 1.3% | | | | |
Constellation Energy Group | | 1,100 | 95,645 |
Exelon Corp | | | 9,600 | 659,616 |
PG&E Corp. | | | 600 | 28,962 |
The AES Corp. * | | | 3,500 | 75,320 |
TXU Corp. | | | 3,010 | 192,941 |
| | | | 1,052,484 |
Financial Investments 0.2% | | | | |
Dolby Laboratories Inc., Class A * | | 1,500 | 51,765 |
Trinity Industries I | | | 2,600 | 108,992 |
| | | | 160,757 |
Forest Products & Paper 1.5% | | | |
3M Co. | | | 10,200 | 779,586 |
Avery Dennison Corp. | | | 1,460 | 93,820 |
Kimberly-Clark Corp. | | | 2,000 | 136,980 |
Packaging Corp. of America | | 3,100 | 75,640 |
Sealed Air Corp. (a) | | | 2,800 | 88,480 |
| | | | 1,174,506 |
Furniture & Household Items 1.0% | | | |
Carlisle Cos Inc (a) | | | 2,000 | 85,860 |
Ethan Allen Interiors, Inc. (a) | | 200 | 7,068 |
Hillenbrand Industries, Inc. (a) | | 1,000 | 59,370 |
International Game Technology | | 2,980 | 120,333 |
Johnson Controls, Inc. (a) | | 2,200 | 208,164 |
Leggett & Platt, Inc. (a) | | | 2,200 | 49,874 |
Pactiv Corp. * | | | 3,400 | 114,716 |
Steelcase Inc., Class A (a) | | 2,260 | 44,951 |
Thomas & Betts Corp. * | | 1,300 | 63,466 |
| | | | 753,802 |
Gas & Other Public Utilities 0.3% | | |
Allied Waste Industries Inc (a) | | 200 | 2,518 |
Waste Management, Inc. | | 3,200 | 110,112 |
Williams Cos., Inc. | | | 3,400 | 96,764 |
| | | | 209,394 |
Government Aircraft & Defense 1.5% | | | |
Alliant Techsystems, Inc. (a)* | | 500 | 43,960 |
Lockheed Martin Corp. | | | 5,950 | 577,269 |
| | | | |
| | Number of | Value |
Security | | Shares | ($) |
| | | |
Northrop Grumman Corp. | | 1,200 | 89,064 |
Raytheon Co. | | 4,600 | 241,316 |
Textron, Inc. | | 2,300 | 206,540 |
| | | 1,158,149 |
Health Care & Hospital 1.4% | | | |
Health Net, Inc. * | | 2,400 | 129,144 |
Humana, Inc. * | | 3,400 | 197,268 |
Manor Care, Inc. (a) | | 2,100 | 114,156 |
UnitedHealth Group, Inc. | | 10,800 | 572,076 |
Vca Antech Inc | | 3,000 | 108,930 |
| | | 1,121,574 |
Information & Services 2.0% | | | |
Caterpillar, Inc. | | 5,000 | 335,150 |
Ceridian Corp. (a)* | | 3,800 | 132,392 |
Convergys Corp. * | | 200 | 5,082 |
Corrections Corp. of America (a)* | 1,600 | 84,496 |
Expedia, Inc. * | | 3,100 | 71,858 |
Iac Interactivecorp (a) | | 2,700 | 101,817 |
ITT Educational Services, Inc. * | 1,400 | 114,086 |
Jones Lang LaSalle, Inc. | | 1,200 | 125,136 |
Manpower, Inc. | | 1,800 | 132,786 |
Moody’s Corp. (a) | | 1,670 | 103,640 |
Paychex, Inc. (a) | | 2,000 | 75,740 |
The Brink’s Co. (a) | | 1,400 | 88,830 |
The Dun & Bradstreet Corp. | 1,400 | 127,680 |
Total System Services, Inc. (a) | 2,400 | 76,440 |
URS Corp. * | | 200 | 8,518 |
| | | 1,583,651 |
Instruments 4.7% | | | |
Agilent Technologies, Inc. * | 3,000 | 101,070 |
AMETEK, Inc. | | 2,700 | 93,258 |
Baxter International, Inc. | | 10,600 | 558,302 |
Beckman Coulter, Inc. | | 940 | 60,057 |
Becton Dickinson & Co. | | 1,900 | 146,091 |
Boston Scientific Corp. * | | 8,300 | 120,682 |
Dade Behring Holdings, Inc. | 2,210 | 96,908 |
Danaher Corp. | | 4,600 | 328,670 |
Edwards Lifesciences Corp. (a)* | 2,000 | 101,400 |
Honeywell International, Inc. | 7,200 | 331,632 |
Medtronic, Inc. | | 9,300 | 456,258 |
Mettler-Toledo International, Inc. * | 1,400 | 125,398 |
PerkinElmer, Inc. | | 2,470 | 59,823 |
Roper Industries, Inc. | | 2,200 | 120,736 |
St. Jude Medical, Inc. * | | 2,300 | 86,503 |
Stryker Corp. (a) | | 5,700 | 378,024 |
Thermo Electron Corp. * | | 1,900 | 88,825 |
Trimble Navigation Ltd | | 3,900 | 104,676 |
Waters Corp. * | | 2,200 | 127,600 |
Zimmer Holdings, Inc. * | | 1,700 | 145,197 |
| | | 3,631,110 |
Insurance 2.4% | | | |
ACE Ltd. | | 600 | 34,236 |
AFLAC, Inc. | | 3,390 | 159,533 |
Ambac Finl Group Inc | | 900 | 77,751 |
American International Group, Inc. | 7,400 | 497,428 |
Arthur J. Gallagher & Co. (a) | 300 | 8,499 |
CNA Financial Corp. (a)* | | 1,500 | 64,635 |
36 Laudus Funds Annual Report
See financial notes.
Laudus Rosenberg U.S. Large Capitalization Growth Fund |
| | Number of | Value |
Security | | Shares | ($) |
| | | |
Fidelity National Financial, Inc., | | | |
Class A (a) | | 314 | 7,539 |
Hanover Insurance Group, Inc. (a) | 800 | 36,896 |
HCC Insurance Holdings, Inc. | | 2,300 | 70,840 |
Markel Corp. * | | 200 | 96,966 |
Philadelphia Consolidated Holding | | |
Corp. * | | 1,800 | 79,182 |
Prudential Financial, Inc. (a) | | 1,460 | 131,780 |
Radian Group, Inc. | | 300 | 16,464 |
Transatlantic Holdings, Inc. | | 200 | 13,024 |
Wellcare Health Plans Inc | | 1,200 | 102,300 |
WellPoint, Inc. * | | 5,500 | 446,050 |
| | | 1,843,123 |
Integrated Oil Companies 0.6% | | | |
Exxon Mobil Corp. | | 6,260 | 472,317 |
IT Hardware 7.4% | | | |
Agere Systems, Inc. (a)* | | 5,100 | 115,362 |
Amphenol Corp New | | 2,000 | 129,140 |
Applied Materials, Inc. | | 12,100 | 221,672 |
Avaya, Inc. (a)* | | 401 | 4,736 |
Avocent Corp. * | | 15 | 404 |
Avx Corp (a) | | 300 | 4,560 |
Broadcom Corp., Class A * | | 2,900 | 93,003 |
Cisco Systems, Inc. * | | 80,900 | 2,065,377 |
Corning, Inc. * | | 11,400 | 259,236 |
Harris Corp. (a) | | 2,810 | 143,169 |
Integrated Device Technology Inc | 3,500 | 53,970 |
Intel Corp. | | 46,800 | 895,284 |
International Rectifier Corp. (a)* | | 1,600 | 61,136 |
L-3 Communications Holdings, Inc. | 800 | 69,976 |
LSI Logic Corp. (a)* | | 9,900 | 103,356 |
MEMC Electronic Materials, Inc. * | 3,200 | 193,856 |
Molex, Inc. (a) | | 3,800 | 107,160 |
Motorola, Inc. | | 13,940 | 246,320 |
Novellus Systems, Inc. * | | 1,980 | 63,400 |
QUALCOMM, Inc. | | 12,800 | 546,048 |
Texas Instruments, Inc. | | 11,300 | 340,130 |
Vishay Intertechnology, Inc. * | | 400 | 5,592 |
| | | 5,722,887 |
Land & Water Transportation 1.6% | | | |
Burlington Northern Santa Fe Corp. | 2,810 | 226,008 |
Csx Corp | | 4,500 | 180,225 |
J.B. Hunt Transport Services, Inc. | 3,613 | 94,805 |
Kansas City Southern * | | 1,140 | 40,561 |
Norfolk Southern Corp. | | 780 | 39,468 |
Ryder System, Inc. | | 670 | 33,058 |
Union Pacific Corp | | 2,700 | 274,185 |
United Parcel Service, Inc., Class B | 5,100 | 357,510 |
| | | 1,245,820 |
Mainframe & Minicomputers 1.8% | | | |
Apple Computer, Inc. * | | 10,400 | 966,264 |
Dell, Inc. * | | 18,200 | 422,422 |
| | | 1,388,686 |
Metal Products & Machinery 6.6% | | | |
Agco Corp | | 200 | 7,394 |
Amer Std Cos Inc | | 3,600 | 190,872 |
Crown Holdings, Inc. * | | 5,100 | 124,746 |
| | Number of | Value |
Security | | Shares | ($) |
| | | |
Cummins, Inc. | | 1,000 | 144,720 |
Dover Corp. | | 3,600 | 175,716 |
Emerson Electric Co. | | 12,040 | 518,804 |
Energizer Holdings, Inc. (a)* | 1,260 | 107,516 |
Gardner Denver, Inc. * | | 1,800 | 62,730 |
General Electric Co. | | 43,600 | 1,541,696 |
Illinois Tool Works, Inc. | | 8,900 | 459,240 |
Lincoln Electric Holdings, Inc. (a) | 1,590 | 94,700 |
Manitowoc Co | | 2,000 | 127,060 |
Pall Corp. | | 800 | 30,400 |
Parker Hannifin Corp (a) | | 1,500 | 129,465 |
Procter & Gamble Co. | | 4,900 | 309,484 |
Snap-On, Inc. | | 200 | 9,620 |
Terex Corp. * | | 1,700 | 121,992 |
The Stanley Works (a) | | 1,900 | 105,184 |
Toro Co (a) | | 1,700 | 87,108 |
United Technologies Corp. | 11,500 | 747,500 |
| | | 5,095,947 |
Miscellaneous Finance 3.8% | | | |
A.G. Edwards, Inc. | | 200 | 13,836 |
Ameriprise Financial, Inc. | | 3,600 | 205,704 |
Chicago Mercantile Exchange | | |
Holdings, Inc. | | 700 | 372,722 |
Eaton Vance Corp. (a) | | 3,400 | 121,176 |
Franklin Resources, Inc. | | 3,200 | 386,656 |
Intercontinentalexchange Inc | 1,400 | 171,094 |
Investment Technology Gp Inc New | 1,500 | 58,800 |
Merrill Lynch & Co., Inc. | | 3,300 | 269,511 |
Morgan Stanley | | 2,600 | 204,776 |
Price T Rowe Group | | 5,200 | 245,388 |
Principal Financial Group In | 1,300 | 77,831 |
SEI Investments Co. | | 1,900 | 114,437 |
The Goldman Sachs Group, Inc. | 3,600 | 743,868 |
| | | 2,985,799 |
Oil & Coal Resources 0.9% | | |
Apache Corp. | | 120 | 8,484 |
Equitable Resources Inc | | 2,700 | 130,464 |
Plains Exploration & Production | | |
Co. (a)* | | 2,500 | 112,850 |
Unit Corp. (a)* | | 1,800 | 91,062 |
XTO Energy, Inc. | | 7,147 | 391,727 |
| | | 734,587 |
Oil Distribution 0.3% | | | |
Holly Corp | | 1,700 | 100,810 |
Tesoro Petroleum Corp. | | 1,100 | 110,473 |
| | | 211,283 |
Oil Drilling & Services 2.6% | | | |
Baker Hughes, Inc. (a) | | 2,200 | 145,486 |
Cameron Intl Corp | | 2,400 | 150,696 |
Diamond Offshore Drilling, Inc. | 1,650 | 133,568 |
ENSCO International, Inc. | 3,220 | 175,168 |
FMC Technologies, Inc. * | 1,800 | 125,568 |
Global Industries Ltd. * | | 3,290 | 60,174 |
Halliburton Co. | | 7,000 | 222,180 |
Helmerich & Payne, Inc. (a) | 3,500 | 106,190 |
National-Oilwell Varco, Inc. * | 3,500 | 272,265 |
Oceaneering International, Inc. (a)* | 2,200 | 92,664 |
Pride International, Inc. * | | 3,210 | 96,621 |
See financial notes.
Laudus Funds Annual Report 37
Laudus Rosenberg U.S. Large Capitalization Growth Fund |
Portfolio Holdings continued | | | | |
| | | | |
| | Number of | Value |
Security | | Shares | ($) |
| | | | |
Smith International, Inc. (a) | | | 4,700 | 225,835 |
Superior Energy Services, Inc. * | | | 2,830 | 97,550 |
TETRA Technologies, Inc. (a)* | | | 2,700 | 66,717 |
Tidewater, Inc. (a) | | | 1,300 | 76,154 |
| | | | 2,046,836 |
Photo-optical, Micros & Office Machinery 1.8% | | |
Diebold, Inc. | | | 2,000 | 95,420 |
EMC Corp. * | | 14,300 | 198,055 |
Hewlett-Packard Co. | | 21,700 | 871,038 |
NCR Corp. * | | | 1,700 | 81,209 |
Network Appliance, Inc. * | | | 2,700 | 98,604 |
VeriFone Holdings, Inc. (a)* | | | 1,800 | 66,114 |
| | | | 1,410,440 |
Publishing, Broadcasting & Cinema 2.7% | | | |
McGraw-Hill Cos., Inc. | | | 6,500 | 408,720 |
News Corp., Class A | | 25,200 | 582,624 |
Omnicom Group, Inc. | | | 3,300 | 337,854 |
Time Warner, Inc. | | | 5,940 | 117,137 |
Viacom Inc | | | 4,400 | 180,884 |
Walt Disney Co. | | 13,680 | 471,002 |
| | | | 2,098,221 |
Real Estate Investment Trusts 0.2% | | | | |
Simon Property Group, Inc. | | | 900 | 100,125 |
Weingarten Realty | | | 760 | 36,146 |
| | | | 136,271 |
Restaurants, Hotels & Theaters 1.8% | | | |
Brinker International Inc | | | 3,600 | 117,720 |
Burger King Holdings, Inc. (a) | | | 280 | 6,048 |
CBRL Group, Inc. (a) | | | 800 | 37,040 |
Hilton Hotels Corp. | | | 7,900 | 284,084 |
Las Vegas Sands Corp. (a)* | | | 3,000 | 259,830 |
MGM MIRAGE * | | | 2,600 | 180,752 |
Starbucks Corp. * | | | 6,000 | 188,160 |
YUM! Brands, Inc. | | | 5,300 | 306,128 |
| | | | 1,379,762 |
Retail 9.1% | | | | |
Abercrombie & Fitch Co., Class A | | | 1,800 | 136,224 |
American Eagle Outfitters Inc Ne | | | 4,000 | 119,960 |
Autozone Inc | | | 1,100 | 140,954 |
Best Buy Co., Inc. | | | 2,700 | 131,544 |
CarMax, Inc. (a)* | | | 4,400 | 107,976 |
Costco Wholesale Corp. (a) | | | 2,400 | 129,216 |
CVS Corp. | | 22,300 | 761,322 |
Dick’s Sporting Goods, Inc. * | | | 1,390 | 80,981 |
Dollar Tree Stores Inc (a) | | | 170 | 6,501 |
eBay, Inc. * | | | 8,000 | 265,200 |
Federated Department Stores, Inc. | | 1,900 | 85,595 |
GameStop Corp., Class A * | | | 3,400 | 110,738 |
Home Depot, Inc. | | 15,000 | 551,100 |
J.C. Penney Co., Inc. | | | 4,500 | 369,720 |
Kohl’s Corp. * | | | 6,200 | 474,982 |
Kroger Co | | | 3,200 | 90,400 |
| | | | | |
| Number of | Value |
Security | Shares | ($) |
| | |
Limited Brands Inc | 1,310 | 34,139 |
Lowe’s Cos., Inc. | 12,200 | 384,178 |
Medco Health Solutions, Inc. * | 3,900 | 282,867 |
Nordstrom, Inc. | 4,700 | 248,818 |
RadioShack Corp. (a) | 3,457 | 93,443 |
Staples, Inc. | 5,400 | 139,536 |
Target Corp. | 12,100 | 717,046 |
The Men’s Wearhouse, Inc. | 1,400 | 65,870 |
The TJX Cos., Inc. | 8,900 | 239,944 |
Wal-Mart Stores, Inc. | 20,200 | 948,390 |
Walgreen Co. | 7,300 | 334,997 |
| | 7,051,641 |
Soaps & Cosmetics 3.4% | | |
Avon Products, Inc. | 8,800 | 327,888 |
Church & Dwight Inc (a) | 2,100 | 105,735 |
Colgate-Palmolive Co. | 8,100 | 540,999 |
Ecolab, Inc. | 3,900 | 167,700 |
Johnson & Johnson | 22,100 | 1,331,746 |
Lauder Estee Cos Inc (a) | 2,900 | 141,665 |
| | 2,615,733 |
Software 8.8% | | |
Adobe Systems, Inc. * | 3,900 | 162,630 |
Akamai Technologies, Inc. * | 3,000 | 149,760 |
Automatic Data Processing, Inc. | 3,700 | 179,080 |
BMC Software, Inc. * | 4,600 | 141,634 |
Cadence Design Systems, Inc. * | 6,300 | 132,678 |
Cognizant Technology Solutions Corp., | | |
Class A * | 3,000 | 264,810 |
DST Systems, Inc. * | 1,700 | 127,840 |
Electronic Arts, Inc. * | 2,300 | 115,828 |
Emdeon Corp (a) | 7,500 | 113,475 |
FactSet Research Systems, Inc. (a) | 1,500 | 94,275 |
Fair Isaac Corp. (a) | 1,500 | 58,020 |
First Data Corp. | 5,690 | 153,061 |
International Business Machines | | |
Corp. | 18,200 | 1,715,532 |
Intuit, Inc. (a)* | 7,600 | 207,936 |
McAfee, Inc. (a)* | 4,100 | 119,228 |
Microsoft Corp. | 78,200 | 2,179,434 |
Oracle Corp. * | 50,610 | 917,559 |
Synopsys, Inc. (a)* | 150 | 3,935 |
| | 6,836,715 |
Textiles & Apparel 1.1% | | |
Coach, Inc. * | 7,670 | 383,884 |
NIKE, Inc., Class B | 3,600 | 382,536 |
Polo Ralph Lauren Corp. (a) | 1,400 | 123,410 |
| | 889,830 |
Wholesale 1.1% | | |
Airgas, Inc. | 2,200 | 92,730 |
Arrow Electronics, Inc. * | 700 | 26,425 |
Avnet, Inc. (a)* | 2,140 | 77,339 |
Cardinal Health, Inc. | 2,900 | 211,555 |
Copart, Inc. * | 2,474 | 69,297 |
38 Laudus Funds Annual Report
See financial notes.
Laudus Rosenberg U.S. Large Capitalization Growth Fund |
| Number of | Value |
Security | Shares | ($) |
| | |
Sysco Corp. (a) | 7,900 | 267,257 |
W.W. Grainger, Inc. | 1,500 | 115,860 |
| | 860,463 |
Total Common Stock (Cost $69,070,731) | 77,114,283 |
| | |
End of Investments. | | |
| | | |
At 3/31/07 the tax basis cost of the fund’s investments was $69,485,820 and the unrealized appreciation and depreciation was $8,466,803 and ($838,340), respectively, with a net unrealized appreciation of $7,628,463.
| Number of | Value |
Security | Shares | ($) |
| | |
Collateral Invested for Securities on Loan 8.0% of net assets |
State Street Navigator Security | | |
Lending Prime Portfolio | 6,243,025 | 6,243,025 |
| | |
End of collateral invested for securities on loan. | |
| | |
* Non-income producing security. | | |
(a) All or a portion of this security is on loan. | |
See financial notes.
Laudus Funds Annual Report 39
Laudus Rosenberg U.S. Large Capitalization Value Fund
Portfolio Holdings as of March 31, 2007 | | |
| | | |
| | Cost | Value |
Holdings by Category | ($) | ($) |
| | | |
99.7% | Common Stock | 5,574,417 | 6,576,131 |
| | | |
99.7% | Total Investments | 5,574,417 | 6,576,131 |
0.3% | Other Assets and Liabilities | | 22,618 |
| | | |
100.0% | Net Assets | | 6,598,749 |
| | Number of | Value |
Security | | Shares | ($) |
| | | |
Common Stock 99.7% of net assets | |
| | | |
Agriculture, Food & Beverage 1.2% | | |
General Mills, Inc. | | 1,090 | 63,460 |
The Pepsi Bottling Group, Inc. | 500 | 15,945 |
| | | 79,405 |
Airlines 0.2% | | | |
AMR Corp. * | | 400 | 12,180 |
Autos 0.6% | | | |
PACCAR, Inc. | | 500 | 36,700 |
Banks & Credit Institutions | 10.0% | |
Bank of America Corp. | | 5,800 | 295,916 |
Comerica, Inc. | | 650 | 38,428 |
Deere & Co. | | 900 | 97,776 |
The Bank of New York Co., Inc. | 2,400 | 97,320 |
Wachovia Corp. | | 1,200 | 66,060 |
Wells Fargo & Co. | | 1,900 | 65,417 |
| | | 660,917 |
Basic Minerals & Metals 1.9% | | | |
Freeport-McMoran Copper & | | |
Gold, Inc., Class B | | 400 | 26,476 |
Reliance Steel & Aluminum Co. | 300 | 14,520 |
Steel Dynamics, Inc. | | 600 | 25,920 |
United States Steel Corp. | | 600 | 59,502 |
| | | 126,418 |
Beer, Liquor, & Tobacco 1.7% | | | |
Altria Group, Inc. | | 900 | 79,029 |
Loews Corp.-Carolina Group | 400 | 30,244 |
| | | 109,273 |
Chemicals & Rubber 2.6% | | | |
Celanese Corp., Series A | | 280 | 8,635 |
FMC Corp. | | 216 | 16,293 |
Lyondell Chemical Co. | | 1,000 | 29,970 |
The Dow Chemical Co. | | 2,600 | 119,236 |
| | | 174,134 |
Communications Utilities 8.8% | | |
AT&T Corp. | | 7,600 | 299,668 |
CenturyTel, Inc. | | 390 | 17,624 |
Comcast Corp., Class A * | | 1,075 | 27,896 |
Embarq Corp. | | 700 | 39,445 |
Verizon Communications, Inc. | 5,100 | 193,392 |
| | | 578,025 |
| | | | |
Construction Materials 0.3% | | | |
The Mosaic Co. * | | 800 | 21,328 |
| | | Number of | Value |
Security | | | Shares | ($) |
| | | | |
Drugs & Pharmaceuticals 4.4% | | |
King Pharmaceuticals, Inc. * | | 1,100 | 21,637 |
Pfizer, Inc. | | | 10,600 | 267,756 |
| | | | 289,393 |
Electric Utilities 7.2% | | | | |
Alliant Energy Corp. | | | 600 | 26,892 |
American Electric Power Co., | | | |
Inc. | | | 1,500 | 73,125 |
Edison International | | | 1,100 | 54,043 |
Entergy Corp. | | | 800 | 83,936 |
FPL Group, Inc. | | | 1,400 | 85,638 |
Northeast Utilities | | | 450 | 14,746 |
Pepco Holdings, Inc. | | | 190 | 5,514 |
PG&E Corp. | | | 1,300 | 62,751 |
Pinnacle West Capital Corp. | | 500 | 24,125 |
Xcel Energy, Inc. | | | 1,700 | 41,973 |
| | | | 472,743 |
Financial Investments 1.0% | | | | |
CIT Group, Inc. | | | 900 | 47,628 |
Rent-A-Center, Inc. * | | | 200 | 5,596 |
United Rentals, Inc. * | | | 400 | 11,000 |
| | | | 64,224 |
Forest Products & Paper 0.9% | | |
International Paper Co. | | | 1,690 | 61,516 |
Furniture & Household Items 1.0% | | | |
Hasbro, Inc. | | | 760 | 21,751 |
Mattel, Inc. | | | 1,600 | 44,112 |
| | | | 65,863 |
Gas & Other Public Utilities 0.4% | | | |
Allied Waste Industries, Inc. * | | 1,100 | 13,849 |
Atmos Energy Corp. | | | 400 | 12,512 |
| | | | 26,361 |
Health Care & Hospital 0.3% | | | | |
Health Net, Inc. * | | | 300 | 16,143 |
LifePoint Hospitals, Inc. * | | 100 | 3,822 |
| | | | 19,965 |
Information & Services 1.3% | | | | |
Convergys Corp. * | | | 700 | 17,787 |
Deluxe Corp. | | | 300 | 10,059 |
Expedia, Inc. * | | | 600 | 13,908 |
IAC/InterActive Corp. * | | | 520 | 19,609 |
Manpower, Inc. | | | 300 | 22,131 |
| | | | 83,494 |
Instruments 0.3% | | | | |
Honeywell International, Inc. | | 400 | 18,424 |
Insurance 9.5% | | | | |
Alleghany Corp. * | | | 133 | 49,539 |
American International Group,Inc. | | | 1,300 | 87,386 |
CNA Financial Corp. * | | | 300 | 12,927 |
Genworth Financial, Inc., | | | | |
Class A | | | 1,750 | 61,145 |
Loews Corp. | | | 1,800 | 81,774 |
40 Laudus Funds Annual Report |
See financial notes.
Laudus Rosenberg U.S. Large Capitalization Value Fund |
| | | Number of | Value |
Security | | | Shares | ($) |
| | | | |
Radian Group, Inc. | | | 320 | 17,562 |
The Allstate Corp. | | | 1,900 | 114,114 |
The Hartford Financial Services | | | |
Group, Inc. | | | 1,000 | 95,580 |
The Travelers Cos., Inc. | | | 2,100 | 108,717 |
| | | | 628,744 |
Integrated Oil Companies 11.5% | | | |
Chevron Corp. | | | 1,500 | 110,940 |
ConocoPhillips | | | 3,000 | 205,050 |
Exxon Mobil Corp. | | | 3,600 | 271,620 |
Hess Corp. | | | 1,000 | 55,470 |
Marathon Oil Corp. | | | 1,200 | 118,596 |
| | | | 761,676 |
IT Hardware 0.4% | | | | |
Atmel Corp. * | | | 808 | 4,064 |
Novellus Systems, Inc. * | | | 380 | 12,168 |
Vishay Intertechnology, Inc. * | | 700 | 9,786 |
| | | | 26,018 |
Land & Water Transportation 1.3% | | | |
CSX Corp. | | | 800 | 32,040 |
Overseas Shipholding Group, | | | |
Inc. | | | 200 | 12,520 |
Ryder System, Inc. | | | 300 | 14,802 |
SEACOR Holdings, Inc. * | | 120 | 11,808 |
YRC Worldwide, Inc. * | | | 300 | 12,066 |
| | | | 83,236 |
Mainframe & Minicomputers 0.2% | | | |
Sun Microsystems * | | | 2,700 | 16,227 |
Metal Products & Machinery 5.0% | | | |
AGCO Corp. * | | | 500 | 18,485 |
Cummins, Inc. | | | 188 | 27,207 |
General Electric Co. | | | 3,600 | 127,296 |
Procter & Gamble Co. | | | 1,700 | 107,372 |
SPX Corp. | | | 270 | 18,954 |
Terex Corp. * | | | 400 | 28,704 |
| | | | 328,018 |
Miscellaneous Finance 10.1% | | | | |
A.G. Edwards, Inc. | | | 60 | 4,151 |
Citigroup, Inc. | | | 4,100 | 210,494 |
JPMorgan Chase & Co. | | | 3,200 | 154,816 |
Merrill Lynch & Co., Inc. | | | 1,600 | 130,672 |
Morgan Stanley | | | 1,300 | 102,388 |
The Goldman Sachs Group, Inc. | | 300 | 61,989 |
| | | | 664,510 |
Oil & Coal Resources 1.3% | | | | |
Apache Corp. | | | 1,200 | 84,840 |
Oil Distribution 0.5% | | | | |
Tesoro Corp. | | | 330 | 33,142 |
Oil Drilling & Services 0.5% | | | | |
Pride International, Inc. * | | | 300 | 9,030 |
Rowan Cos., Inc. | | | 300 | 9,741 |
Tidewater, Inc. | | | 300 | 17,574 |
| | | | 36,345 |
| | Number of | Value |
Security | | Shares | ($) |
| | | |
Publishing, Broadcasting & Cinema 3.9% | | |
CBS Corp., Class B | | 2,500 | 76,475 |
Gannett Co., Inc. | | 1,000 | 56,290 |
Time Warner, Inc. | | 6,200 | 122,264 |
| | | 255,029 |
Real Estate Development 0.3% | | | |
Service Corp. International | | 1,400 | 16,604 |
Real Estate Investment Trusts 0.8% | | | |
Colonial Properties Trust | | 300 | 13,701 |
HRPT Properties Trust | | 1,000 | 12,300 |
iStar Financial, Inc. | | 600 | 28,098 |
| | | 54,099 |
Restaurants, Hotels & Theaters 2.1% | | |
CBRL Group, Inc. | | 104 | 4,815 |
McDonald’s Corp. | | 3,000 | 135,150 |
| | | 139,965 |
Retail 4.5% | | | |
Dillard’s, Inc., Class A | | 300 | 9,819 |
J.C. Penney Co., Inc. | | 800 | 65,728 |
OfficeMax, Inc. | | 350 | 18,459 |
RadioShack Corp. | | 210 | 5,677 |
Safeway, Inc. | | 1,700 | 62,288 |
Saks, Inc. | | 100 | 2,084 |
Sears Holdings Corp. * | | 400 | 72,064 |
The Kroger Co. | | 2,161 | 61,048 |
| | | 297,167 |
Software 2.9% | | | |
Cadence Design Systems, | | | |
Inc. * | | 500 | 10,530 |
Computer Sciences Corp. * | | 690 | 35,970 |
Electronic Data Systems Corp. | | 1,500 | 41,520 |
First American Corp. | | 400 | 20,288 |
International Business | | | |
Machines Corp. | | 600 | 56,556 |
Sybase, Inc. * | | 500 | 12,640 |
Synopsys, Inc. * | | 610 | 16,000 |
| | | 193,504 |
Textiles & Apparel 0.3% | | | |
Liz Claiborne, Inc. | | 500 | 21,425 |
Wholesale 0.5% | | | |
Arrow Electronics, Inc. * | | 550 | 20,763 |
Avnet, Inc. * | | 400 | 14,456 |
| | | 35,219 |
Total Common Stock (Cost $5,574,417) | 6,576,131 |
| | | |
End of Investments. | | | |
| | | |
At 03/31/07 the tax basis cost of the fund’s investments was |
$5,591,895, and the unrealized appreciation and depreciation |
were $1,008,226 and ($23,990), respectively, with a net unrealized |
appreciation of $984,236. | | | |
* Non-income producing security. | | |
| | | | | | |
See financial notes.
Laudus Funds Annual Report 41
Laudus Rosenberg U.S. Discovery Fund |
Portfolio Holdings as of March 31, 2007 | |
| | | |
| | Cost | Value |
Holdings by Category | ($) | ($) |
| | | |
99.3% | Common Stock | 761,034,449 | 928,439,355 |
0.8% | Short-Term Investment | 7,521,000 | 7,521,000 |
| | | |
100.1% | Total Investments | 768,555,449 | 935,960,355 |
7.8% | Collateral Invested for | | |
| Securities on Loan | 72,805,635 | 72,805,635 |
(7.9)% | Other Assets and | | |
| Liabilities | | (73,536,081) |
| | | |
100.0% | Net Assets | | 935,229,909 |
| | Number of | Value |
Security | | Shares | ($) |
| | | |
Common Stock 99.3% of net assets | | |
| | | |
Agriculture, Food & Beverage 1.7% | | | |
Corn Products International, Inc. | | 118,749 | 4,226,277 |
Flowers Foods, Inc. (a) | | 122,995 | 3,710,759 |
Imperial Sugar Co. (a) | | 4,730 | 158,597 |
J & J Snack Foods Corp. | | 10,871 | 429,296 |
Lancaster Colony Corp. | | 14,462 | 639,076 |
Lance, Inc. (a) | | 26,304 | 532,393 |
Omega Protein Corp. * | | 7,400 | 51,652 |
Penford Corp. | | 12,479 | 251,327 |
Ralcorp Holdings, Inc. (a)* | | 26,810 | 1,723,883 |
Seaboard Corp. | | 1,200 | 2,712,000 |
Seneca Foods Corp., Class B * | | 1,000 | 28,060 |
Tasty Baking Co. | | 22,514 | 196,547 |
The Hain Celestial Group, Inc. (a)* | 39,507 | 1,187,976 |
The Topps Co., Inc. | | 720 | 6,998 |
| | | 15,854,841 |
Airlines 1.2% | | | |
ABX Air, Inc. | | 4,149 | 28,421 |
AirNet Systems, Inc. * | | 11,970 | 38,424 |
Alaska Air Group, Inc. (a)* | | 113,932 | 4,340,809 |
Pinnacle Airlines Corp. (a)* | | 12,726 | 220,032 |
Republic Airways Holdings, Inc. * | 58,174 | 1,335,675 |
SkyWest, Inc. (a) | | 194,541 | 5,219,535 |
| | | 11,182,896 |
Autos 1.0% | | | |
Aftermarket Technology Corp. * | | 21,412 | 519,883 |
Autoliv, Inc. (a) | | 143,282 | 8,182,835 |
Spartan Motors, Inc. (a) | | 25,401 | 589,557 |
Supreme Industries, Inc., Class A | 18,670 | 109,220 |
| | | 9,401,495 |
Banks & Credit Institutions 2.4% | | | |
1st Independence Financial | | | |
Group, Inc. | | 98 | 1,657 |
Advanta Corp., Class A | | 9,700 | 388,776 |
Advanta Corp., Class B | | 31,231 | 1,369,167 |
American National Bankshares, | | | |
Inc. | | 100 | 2,289 |
Ameris Bancorp (a) | | 6,732 | 164,799 |
BancFirst Corp. (a) | | 4,300 | 199,305 |
Banco Latinoamericano de | | | |
Exportaciones, S.A., Class E | | 6,120 | 101,837 |
Banner Corp. (a) | | 2,998 | 124,567 |
Bar Harbor Bankshares | | 717 | 23,231 |
Berkshire Hills Bancorp, Inc. | | 1,170 | 39,370 |
| Number of | Value |
Security | Shares | ($) |
| | |
Beverly Hills Bancorp, Inc. | 42,948 | 326,405 |
BNCCorp, Inc. * | 1,910 | 31,420 |
BOE Financial Services of Virginia, | | |
Inc. | 100 | 3,126 |
Britton & Koontz Capital Corp. | 526 | 9,994 |
Camco Financial Corp. | 100 | 1,284 |
Capital Bank Corp. | 703 | 12,127 |
Carolina Bank Holdings, Inc. * | 300 | 4,800 |
Carver Bancorp, Inc. | 1,400 | 23,450 |
Central Bancorp, Inc. | 1,000 | 30,450 |
Centrue Financial Corp. | 4,068 | 78,797 |
CFS Bancorp, Inc. (a) | 5,162 | 77,378 |
Citizens Holdings Co. | 700 | 15,288 |
Citizens South Banking Corp. | 650 | 8,119 |
Codorus Valley Bancorp, Inc. | 210 | 3,996 |
Community Bank Shares of | | |
Indiana, Inc. | 4,277 | 92,918 |
Community Capital Corp. | 3,009 | 60,767 |
Community Financial Corp. | 1,720 | 20,881 |
Community Shores Bank Corp. * | 1,430 | 17,689 |
Community West Bancshares | 4,594 | 72,677 |
CompuCredit Corp. (a)* | 4,730 | 147,671 |
Consumer Portfolio Services, | | |
Inc. * | 3,517 | 21,630 |
Cowlitz Bancorp * | 1,500 | 25,500 |
Delta Financial Corp. (a) | 11,568 | 95,667 |
Desert Community Bank | 1,200 | 22,800 |
Dollar Financial Corp. (a)* | 49,579 | 1,254,349 |
Elmira Savings Bank, FSB | 529 | 14,008 |
Evans Bancorp, Inc. (a) | 940 | 18,330 |
Exchange National Bancshares, | | |
Inc. | 8,042 | 291,120 |
Federal Agricultural Mortgage | | |
Corp., Class C (a) | 27,230 | 740,656 |
Fidelity Southern Corp. | 2,725 | 51,884 |
First Bancorp of Indiana, Inc. | 1,455 | 25,608 |
First Bancshares, Inc. | 960 | 16,200 |
First BancTrust Corp. | 5,645 | 66,780 |
First Capital, Inc. | 990 | 17,800 |
First Citizens BancShares, Inc., | | |
Class A | 2,580 | 518,580 |
First Defiance Financial Corp. | 4,070 | 116,809 |
First Federal Bancshares of | | |
Arkansas, Inc. | 7,300 | 172,572 |
First Federal Bankshares, Inc. | 2,400 | 51,480 |
First Financial Service Corp. | 400 | 11,476 |
First Franklin Corp. | 3,251 | 56,892 |
First M&F Corp. | 6,200 | 114,080 |
First PacTrust Bancorp, Inc. | 190 | 4,903 |
First Place Financial Corp. | 34,952 | 749,720 |
First Regional Bancorp (a)* | 20,515 | 609,295 |
First United Corp. | 4,965 | 111,712 |
First West Virginia Bancorp, Inc. | 3,300 | 66,825 |
FNB Corp. of North Carolina | 5,628 | 94,269 |
FNB Corp. of Virginia (a) | 5,596 | 200,505 |
FNB Financial Services Corp. | 725 | 11,114 |
Franklin Bank Corp. (a)* | 47,190 | 843,285 |
GB&T Bancshares, Inc. | 1,420 | 25,745 |
Glen Burnie Bancorp | 480 | 8,556 |
GS Financial Corp. | 1,310 | 26,888 |
Guaranty Federal Bancshares, Inc. | 2,370 | 69,441 |
Habersham Bancorp, Inc. | 7,400 | 169,830 |
42 Laudus Funds Annual Report
See financial notes.
Laudus Rosenberg U.S. Discovery Fund |
| Number of | Value |
Security | Shares | ($) |
| | |
HF Financial Corp. | 5,526 | 100,849 |
HMN Financial, Inc. | 2,097 | 70,962 |
Home Federal Bancorp | 1,618 | 47,278 |
Hopfed Bancorp, Inc. | 675 | 10,776 |
Horizon Bancorp | 3,511 | 94,481 |
Intervest Bancshares Corp. * | 10,144 | 291,133 |
Irwin Financial Corp. | 1,770 | 32,993 |
ITLA Capital Corp. | 11,140 | 579,503 |
Lakeland Financial Corp. (a) | 1,065 | 24,176 |
Leesport Financial Corp. | 4,446 | 96,123 |
LSB Bancshares, Inc. (a) | 17,500 | 256,375 |
LSB Financial Corp. | 4,725 | 124,929 |
MASSBANK Corp. | 10,420 | 341,776 |
Meta Financial Group, Inc. | 140 | 4,410 |
MFB Corp. | 2,000 | 67,200 |
MidWestOne Financial Group, Inc. | 10,600 | 185,182 |
Monroe Bancorp | 113 | 1,957 |
MutualFirst Financial, Inc. | 164 | 3,228 |
New Hampshire Thrift | | |
Bancshares, Inc. | 1,200 | 18,756 |
Northeast Bancorp | 1,200 | 22,380 |
Northrim BanCorp, Inc. | 1,816 | 53,663 |
Northway Financial, Inc. | 1,400 | 45,703 |
OceanFirst Financial Corp. (a) | 8,943 | 155,161 |
PAB Bankshares, Inc. | 2,510 | 44,578 |
Pacific Premier Bancorp, Inc. * | 147 | 1,588 |
Park Bancorp, Inc. | 905 | 30,883 |
Parkvale Financial Corp. | 9,402 | 274,632 |
Peoples Bancorp of North | | |
Carolina | 10,242 | 274,486 |
Peoples Bancorp, Inc. | 500 | 9,793 |
Peoples BancTrust Co., Inc. | 932 | 17,736 |
Peoples Community Bancorp, Inc. | 1,155 | 19,612 |
Pinnacle Bancshares, Inc. | 1,600 | 24,168 |
Premier Financial Bancorp, Inc. | 200 | 3,254 |
Provident Financial Holdings, Inc. | 12,970 | 356,934 |
Republic First Bancorp, Inc. * | 19,331 | 248,983 |
Royal Bancshares of | | |
Pennsylvania, Class A (a) | 734 | 17,433 |
Shore Bancshares, Inc. (a) | 10,911 | 288,596 |
Simmons First National Corp., | | |
Class A (a) | 8,190 | 246,273 |
South Street Financial Corp. | 133 | 1,137 |
Southern Missouri Bancorp, Inc. | 100 | 1,545 |
Southwest Bancorp, Inc. | 17,960 | 461,392 |
Sterling Financial Corp. | | |
Pennsylvania | 10,381 | 230,458 |
Team Financial, Inc. | 1,050 | 15,908 |
Teche Holding Co. | 1,000 | 44,200 |
TF Financial Corp. | 2,600 | 79,300 |
the First Marblehead Corp. (a) | 123,946 | 5,563,936 |
The Washington Savings Bank, | | |
F.S.B | 9,870 | 83,895 |
Timberland Bancorp, Inc. | 1,076 | 37,929 |
United Bancshares, Inc. | 1,140 | 18,434 |
United Community Financial | | |
Corp. (a) | 28,767 | 317,875 |
United Security Bancshares,Inc. (a) | 972 | 28,606 |
Unity Bancorp, Inc. | 6,347 | 75,275 |
Wainwright Bank & Trust Co. | 2,683 | 34,289 |
| | Number of | Value |
Security | | Shares | ($) |
Willow Financial Bancorp, Inc. (a) | 1,449 | 18,692 |
WSFS Financial Corp. | | 10,177 | 656,213 |
WVS Financial Corp. (a) | 1,900 | 32,680 |
| | | 22,340,251 |
Basic Minerals & Metals 4.2% | | |
Allegheny Technologies, Inc. | 36,410 | 3,884,583 |
Brush Engineered Materials,Inc. (a)* | | 1,680 | 81,430 |
Carpenter Technology Corp. | 66,000 | 7,970,160 |
Chaparral Steel Co. | | 72,133 | 4,195,977 |
Cleveland-Cliffs, Inc. (a) | 510 | 32,645 |
Commercial Metals Co. (a) | 44,855 | 1,406,204 |
CommScope, Inc. (a)* | | 1,250 | 53,625 |
Friedman Industries, Inc. | 12,690 | 117,255 |
General Cable Corp. (a)* | 53,069 | 2,835,477 |
Harsco Corp. | | 71,092 | 3,189,187 |
Northwest Pipe Co. * | | 21,700 | 864,311 |
OM Group, Inc. * | | 54,500 | 2,435,060 |
Reliance Steel & Aluminum Co. (a) | | 105,580 | 5,110,072 |
Southern Copper Corp. (a) | 1,000 | 71,660 |
Steel Dynamics, Inc. (a) | 53,716 | 2,320,531 |
Superior Essex, Inc. (a)* | 43,445 | 1,506,238 |
Titanium Metals Corp. * | 81,349 | 2,918,802 |
| | | 38,993,217 |
Beer, Liquor, & Tobacco 0.1% | | |
Alliance One International, | | |
Inc. (a)* | | 99,240 | 915,985 |
MGP Ingredients, Inc. (a) | 16,606 | 338,264 |
| | | 1,254,249 |
Biotechnology 0.1% | | | |
Digene Corp. (a)* | | 16,518 | 700,528 |
Harvard Bioscience, Inc. * | 5,680 | 27,378 |
| | | 727,906 |
Cellular & Wireless 0.7% | | |
NII Holdings, Inc. (a)* | | 88,200 | 6,542,676 |
USA Mobility, Inc. (a)* | | 2,830 | 56,402 |
| | | 6,599,078 |
Chemicals & Rubber 3.2% | | | |
A. Schulman, Inc. | | 24,933 | 587,421 |
Arch Chemicals, Inc. | | 52,590 | 1,641,860 |
Bairnco Corp. | | 7,950 | 106,928 |
Celanese Corp., Series A | 28,130 | 867,529 |
CF Industries Holdings, Inc. | 130,946 | 5,047,968 |
FMC Corp. | | 127,152 | 9,591,075 |
Hercules, Inc. * | | 113,530 | 2,218,376 |
Innospec, Inc. | | 18,998 | 1,095,045 |
Landec Corp. (a)* | | 52,550 | 745,159 |
LSB Industries, Inc. (a)* | 39,420 | 613,769 |
Nalco Holding Co. (a) | | 15,000 | 358,500 |
NewMarket Corp. | | 43,630 | 1,774,432 |
Pioneer Cos., Inc. * | | 3,529 | 97,542 |
PolyOne Corp. (a)* | | 62,548 | 381,543 |
Stepan Co. (a) | | 20,720 | 543,900 |
Terra Industries, Inc. (a)* | 153,988 | 2,694,790 |
See financial notes.
Laudus Funds Annual Report 43
Laudus Rosenberg U.S. Discovery Fund |
Portfolio Holdings continued | | | |
| | | | |
| | | Number of | Value |
Security | | | Shares | ($) |
| | | | |
The Scotts Miracle-Gro Co.,Class A (a) | | | 20,120 | 885,884 |
Tronox, Inc., Class A (a) | | | 13,170 | 189,648 |
| | | | 29,441,369 |
Commercial Aircraft & Components 0.4% | | |
Ducommun, Inc. * | | | 2,230 | 57,378 |
Sequa Corp., Class A (a)* | | 11,240 | 1,346,215 |
Triumph Group, Inc. (a) | | | 35,450 | 1,961,803 |
| | | | 3,365,396 |
Communications Utilities 1.8% | | |
Alaska Communication Systems | | | |
Group, Inc. (a) | | | 7,770 | 114,607 |
Atlantic Tele-Network, Inc. | | 4,505 | 117,716 |
CenturyTel, Inc. | | | 73,218 | 3,308,721 |
CT Communications, Inc. (a) | | 56,678 | 1,365,940 |
D&E Communications, Inc. | | 38,728 | 515,857 |
General Communication, Inc., | | | |
Class A (a)* | | | 145,010 | 2,030,140 |
Gilat Satellite Networks Ltd. * | | 93,665 | 772,736 |
Golden Telecom, Inc. (a) | | | 16,900 | 935,922 |
Harris Stratex Networks, Inc., | | | |
Class A (a)* | | | 509 | 9,768 |
HickoryTech Corp. | | | 3,704 | 25,669 |
Level 3 Communications, Inc. (a)* | 677,055 | 4,130,035 |
Mediacom Communications | | | |
Corp., Class A * | | | 173,991 | 1,416,287 |
PAETEC Holding Corp. (a)* | | 2,882 | 30,203 |
Premiere Global Services, Inc. * | | 3,980 | 44,656 |
United Online, Inc. (a) | | | 126,665 | 1,777,110 |
| | | | 16,595,367 |
Construction & Homebuilding 1.3% | | | |
Comfort Systems USA, Inc. | | 118,521 | 1,419,882 |
EMCOR Group, Inc. (a) | | | 82,200 | 4,848,156 |
Granite Construction, Inc. (a) | | 34,230 | 1,891,550 |
Horizon Offshore, Inc. * | | | 1,348 | 19,492 |
Infrasource Services, Inc. * | | 13,410 | 409,407 |
Insituform Technologies, Inc., | | | |
Class A (a)* | | | 46,353 | 963,679 |
Meadow Valley Corp. * | | | 10,385 | 134,590 |
Perini Corp. | | | 68,490 | 2,524,541 |
Skyline Corp. | | | 7,960 | 268,570 |
U.S. Home Systems, Inc. * | | 3,095 | 39,461 |
| | | | 12,519,328 |
Construction Materials 1.1% | | | | |
Ameron International Corp. | | 4,430 | 291,760 |
Martin Marietta Materials, Inc. | | 1,070 | 144,664 |
MDU Resources Group, Inc. | | 337,697 | 9,705,412 |
Oil-Dri Corp. of America | | | 10,000 | 167,000 |
Patrick Industries, Inc. * | | | 14,395 | 172,596 |
Rock of Ages Corp. * | | | 1,430 | 7,036 |
Texas Industries, Inc. (a) | | | 80 | 6,042 |
United States Lime & Minerals,Inc. * | | | 4,400 | 135,344 |
| | | | 10,629,854 |
Consumer Durables 0.1% | | | |
Universal Electronics, Inc. * | | 44,109 | 1,228,877 |
| | Number of | Value |
Security | | Shares | ($) |
| | | |
Drugs & Pharmaceuticals 1.9% | | |
Geopharma, Inc. * | | 3,710 | 16,324 |
King Pharmaceuticals, Inc. (a)* | 331,715 | 6,524,834 |
Natural Alternative International,Inc. * | | 16,211 | 130,012 |
NBTY, Inc. (a)* | | 154,015 | 8,168,955 |
Nutraceutical International Corp. * | 500 | 8,250 |
Perrigo Co. (a) | | 102,609 | 1,812,075 |
Schiff Nutrition International, | | |
Inc. * | | 16,960 | 116,515 |
Sciele Pharma, Inc. (a) | | 32,054 | 759,039 |
Theragenics Corp. * | | 1,930 | 12,082 |
| | | 17,548,086 |
Electric Utilities 4.6% | | | |
Alliant Energy Corp. (a) | | 210,823 | 9,449,087 |
Central Vermont Public Service Corp. | | 2,820 | 81,272 |
CH Energy Group, Inc. (a) | 5,376 | 261,758 |
Cleco Corp. | | 121,670 | 3,142,736 |
Northeast Utilities (a) | | 307,247 | 10,068,484 |
OGE Energy Corp. | | 101,090 | 3,922,292 |
Pepco Holdings, Inc. | | 232,550 | 6,748,601 |
Pinnacle West Capital Corp. | 3,436 | 165,787 |
Portland General Electric Co. (a) | 5,860 | 171,112 |
Puget Energy, Inc. | | 26,570 | 682,318 |
Unisource Energy Corp. | | 46,280 | 1,737,814 |
Unitil Corp. | | 2,580 | 70,099 |
Westar Energy, Inc. (a) | | 239,343 | 6,586,719 |
| | | 43,088,079 |
Financial Investments 0.6% | | | |
Aaron Rents, Inc. (a) | | 13,580 | 359,055 |
Ampal-American Israel Corp.,Class A * | | 3,260 | 14,311 |
California First National Bancorp | 2,138 | 28,115 |
Compass Diversified Trust (a) | 1,203 | 20,174 |
ePlus, Inc. * | | 17,060 | 181,689 |
Jackson Hewitt Tax Service, Inc. | 38,728 | 1,246,267 |
KMG America Corp. * | | 2,690 | 12,455 |
Marvel Entertainment, Inc. (a)* | 1,100 | 30,525 |
MVC Capital, Inc. * | | 340 | 5,321 |
PICO Holdings, Inc. (a)* | | 17,159 | 732,861 |
Rent-A-Center, Inc. * | | 21,081 | 589,846 |
SRS Labs, Inc. * | | 9,758 | 135,929 |
Trinity Industries, Inc. (a) | | 45,542 | 1,909,121 |
UTEK Corp. (a) | | 18,150 | 239,580 |
Willis Lease Finance Corp. (a)* | 21,670 | 223,418 |
| | | 5,728,667 |
Forest Products & Paper 0.1% | | |
CSS Industries, Inc. | | 4,100 | 153,668 |
Lydall, Inc. * | | 41,980 | 667,062 |
Nashua Corp. * | | 5,700 | 50,730 |
Packaging Corp. of America | 5,450 | 132,980 |
Rock-Tenn Co., Class A | | 340 | 11,288 |
| | | 1,015,728 |
Furniture & Household Items 2.6% | | |
A.T. Cross Co., Class A * | 3,803 | 33,466 |
Acuity Brands, Inc. | | 56,600 | 3,081,304 |
AEP Industries, Inc. * | | 19,703 | 847,229 |
44 Laudus Funds Annual Report
See financial notes
.
Laudus Rosenberg U.S. Discovery Fund |
| | Number of | Value |
Security | | Shares | ($) |
| | | |
AZZ, Inc. * | | 6,530 | 274,260 |
Bassett Furniture Industries, Inc. | 16,230 | 238,906 |
Chase Corp. | | 1,300 | 42,263 |
Communications Systems, Inc. | 10,040 | 104,215 |
Constar International, Inc. (a)* | 31,440 | 278,244 |
Ethan Allen Interiors, Inc. (a) | 111,939 | 3,955,924 |
Flexsteel Industries, Inc. | | 100 | 1,534 |
GameTech International, Inc. * | 31,230 | 381,631 |
Genlyte Group, Inc. * | | 1,894 | 133,622 |
Griffon Corp. (a)* | | 93,640 | 2,317,590 |
Hasbro, Inc. | | 620 | 17,744 |
Herman Miller, Inc. | | 76,755 | 2,570,525 |
Hillenbrand Industries, Inc. (a) | 4,600 | 273,102 |
Hooker Furniture Corp. | | 160 | 3,208 |
JAKKS Pacific, Inc. (a)* | | 71,809 | 1,716,235 |
K2, Inc. * | | 11,580 | 140,002 |
La-z-boy, Inc. (a) | | 102,239 | 1,265,719 |
Mity Enterprises, Inc. * | | 610 | 11,651 |
Movado Group, Inc. (a) | | 61,330 | 1,806,169 |
National Presto Industries, Inc. (a) | 13,510 | 832,756 |
Preformed Line Products Co. (a) | 4,200 | 155,358 |
RC2 Corp. * | | 10,300 | 416,017 |
Spartech Corp. | | 10,040 | 294,574 |
Steelcase Inc., Class A | | 96,773 | 1,924,815 |
Thomas & Betts Corp. * | | 16,592 | 810,021 |
Tredegar Corp. | | 800 | 18,232 |
UFP Technologies, Inc. * | | 2,270 | 10,624 |
Virco Manufacturing Corp. * | 920 | 6,210 |
West Pharmaceutical Services,Inc. (a) | | 3,740 | 173,648 |
| | | 24,136,798 |
Gas & Other Public Utilities 1.1% | | |
American States Water Co. (a) | 9,740 | 359,114 |
Artesian Resources Corp., Class A | 5,942 | 122,405 |
California Water Service Group | 14,674 | 562,308 |
Clean Harbors, Inc. (a)* | | 7,403 | 334,764 |
Delta Natural Gas Co., Inc. | 6,223 | 155,575 |
Energy West, Inc. | | 210 | 2,992 |
Florida Public Utilities Co. | | 8,640 | 107,136 |
Industrial Services of America,Inc. (a)* | | 900 | 5,985 |
Nicor, Inc. (a) | | 108,740 | 5,265,191 |
RGC Resources, Inc. | | 3,037 | 86,099 |
SJW Corp. (a) | | 28,840 | 1,167,443 |
Southern Union Co. | | 9,513 | 289,100 |
The Laclede Group, Inc. (a) | 21,350 | 663,558 |
Waste Industries USA, Inc. (a) | 24,567 | 674,855 |
WGL Holdings, Inc. (a) | | 18,750 | 599,625 |
| | | 10,396,150 |
Government Aircraft & Defense 0.7% | | |
Armor Holdings, Inc. (a)* | | 90,824 | 6,115,180 |
Health Care & Hospital 1.7% | | | |
Almost Family, Inc. * | | 12,800 | 318,720 |
Amedisys, Inc. (a)* | | 30,540 | 990,412 |
American Shared Hospital Services | | 13,430 | 79,237 |
AMERIGROUP Corp. * | | 3,970 | 120,688 |
Gentiva Health Services, Inc. * | 32,300 | 651,491 |
Hanger Orthopedic Group, Inc. * | 6,240 | 72,821 |
| | Number of | Value |
Security | | Shares | ($) |
| | | |
IntegraMed America, Inc. * | 7,255 | 108,462 |
Kindred Healthcare, Inc. (a)* | 26,460 | 867,359 |
Manor Care, Inc. (a) | | 164,193 | 8,925,531 |
MedCath Corp. * | | 26,177 | 714,632 |
MEDTOX Scientific, Inc. * | 17,670 | 325,128 |
National Dentex Corp. * | | 5,840 | 82,227 |
National Healthcare Corp. (a) | 19,244 | 981,059 |
NovaMed, Inc. * | | 33,749 | 218,694 |
Res-Care, Inc. * | | 67,585 | 1,182,738 |
| | | 15,639,199 |
Information & Services 5.6% | | | |
Ablest, Inc. * | | 1,510 | 11,151 |
ABM Industries, Inc. (a) | | 720 | 19,001 |
Bioanalytical Systems, Inc. * | 410 | 2,759 |
Carriage Services, Inc. (a)* | 8,870 | 71,758 |
Cass Information Systems, Inc. (a) | 112 | 3,781 |
CDI Corp. (a) | | 38,539 | 1,114,548 |
Ceridian Corp. * | | 7,450 | 259,558 |
Convergys Corp. * | | 92,740 | 2,356,523 |
Corrections Corp. of America (a)* | 144,667 | 7,639,864 |
CPI Corp. | | 20,200 | 1,060,702 |
Ecology & Environment, Inc. | 4,050 | 48,114 |
Exponent, Inc. * | | 49,520 | 987,924 |
Forrester Research, Inc. * | | 40,484 | 1,148,126 |
Gartner, Inc. (a)* | | 18,350 | 439,483 |
ICT Group, Inc. (a)* | | 21,617 | 378,298 |
Jones Lang LaSalle, Inc. (a) | 6,467 | 674,379 |
Kelly Services, Inc., Class A (a) | 69,460 | 2,236,612 |
Layne Christensen Co. (a)* | 27,595 | 1,005,010 |
Metal Management, Inc. | | 86,840 | 4,012,008 |
Monro Muffler Brake, Inc. | | 26,447 | 928,290 |
MPS Group, Inc. * | | 191,574 | 2,710,772 |
National Technical Systems, Inc. * | 12,880 | 78,182 |
Nobel Learning Communities,Inc. * | | 16,300 | 246,782 |
PAREXEL International Corp. (a)* | 82,787 | 2,977,848 |
PDI, Inc. * | | 10,824 | 103,045 |
RCM Technologies, Inc. * | | 10,095 | 71,977 |
Schnitzer Steel Industries, Inc.,Class A | | 63,781 | 2,562,083 |
Security National Financial Corp.,Class A * | | 1,515 | 7,196 |
Spherion Corp. * | | 157,600 | 1,390,032 |
SRI/Surgical Express, Inc. * | 8,659 | 43,641 |
Stewart Enterprises, Inc.,Class A (a) | | 327,992 | 2,643,616 |
TeleTech Holdings, Inc. (a)* | 108,755 | 3,990,221 |
The Dun & Bradstreet Corp. | 55,770 | 5,086,224 |
URS Corp. * | | 115,565 | 4,921,913 |
Viad Corp. | | 14,850 | 573,210 |
Volt Information Sciences,Inc. (a)* | | 37,339 | 977,908 |
Westaff, Inc. (a)* | | 1,580 | 9,038 |
| | | 52,791,577 |
Instruments 5.1% | | | |
1-800 CONTACTS, Inc. * | | 640 | 10,752 |
Align Technology, Inc. (a)* | 8,898 | 141,122 |
Allied Healthcare Products, Inc. * | 19,700 | 119,283 |
Angeion Corp. * | | 10,614 | 156,026 |
Astro-Med, Inc. | | 8,726 | 95,986 |
See financial notes.
Laudus Funds Annual Report 45
Laudus Rosenberg U.S. Discovery Fund |
Portfolio Holdings continued | | |
| | |
| Number of | Value |
Security | Shares | ($) |
| | |
Atrion Corp. | 1,111 | 102,012 |
Bio-Rad Laboratories, Inc., | | |
Class A * | 11,950 | 834,588 |
Bruker BioSciences Corp. * | 62,386 | 656,301 |
Cholestech Corp. * | 5,079 | 87,562 |
Coherent, Inc. (a)* | 102,561 | 3,255,286 |
Data I/O Corp. * | 200 | 712 |
Datascope Corp. (a) | 33,275 | 1,204,222 |
Esterline Technologies Corp. (a)* | 7,530 | 309,257 |
FARO Technologies, Inc. * | 7,410 | 213,927 |
Fei Co. (a) | 43,119 | 1,554,871 |
Hurco Cos., Inc. * | 16,570 | 710,024 |
Immucor, Inc. | 160,642 | 4,727,694 |
Input/Output, Inc. (a) | 143,980 | 1,984,044 |
K-Tron International, Inc. * | 2,400 | 172,152 |
Mesa Laboratories, Inc. | 2,188 | 41,474 |
Mettler-Toledo International, Inc. * | 6,864 | 614,808 |
MOCON, Inc. | 3,253 | 41,834 |
New Brunswick Scientific Co., | | |
Inc. * | 7,124 | 57,491 |
O.I. Corp. | 4,685 | 53,760 |
Oakley, Inc. | 31,259 | 629,556 |
Orthofix International N.V. * | 8,913 | 455,009 |
OSI Systems, Inc. (a)* | 16,160 | 427,270 |
Perceptron, Inc. * | 21,070 | 189,630 |
PerkinElmer, Inc. | 268,401 | 6,500,672 |
Span-America Medical Systems, | | |
Inc. | 7,600 | 120,916 |
Steris Corp. (a) | 130,985 | 3,478,962 |
Teleflex, Inc. | 128,880 | 8,772,862 |
Tollgrade Communications, Inc. * | 31,031 | 389,749 |
Trimble Navigation Ltd. * | 42,930 | 1,152,241 |
Universal Security Instruments, | | |
Inc. (a)* | 6,959 | 239,042 |
Varian, Inc. * | 35,430 | 2,064,152 |
Viasys Healthcare, Inc. (a)* | 97,900 | 3,327,621 |
Vicon Industries, Inc. * | 2,890 | 28,756 |
Vital Signs, Inc. (a) | 9,168 | 476,553 |
Waters Corp. * | 4,030 | 233,740 |
Zoll Medical Corp * | 60,998 | 1,625,597 |
Zygo Corp. * | 39,407 | 630,906 |
| | 47,888,422 |
Insurance 8.7% | | |
Alleghany Corp. (a)* | 653 | 243,886 |
American Equity Investment Life | | |
Holding Co. | 38,260 | 502,354 |
American Financial Group, Inc. | 263,059 | 8,954,528 |
American National Insurance Co. | 15,033 | 1,923,172 |
American Physicians Service | | |
Group, Inc. * | 7,700 | 135,866 |
American Safety Insurance | | |
Holdings Ltd. * | 3,490 | 66,519 |
Arch Capital Group Ltd. * | 119,186 | 8,129,677 |
Argonaut Group, Inc. * | 12,667 | 409,904 |
Aspen Insurance Holdings Ltd. | 230,904 | 6,051,994 |
Baldwin & Lyons, Inc., Class B (a) | 4,275 | 108,799 |
Delphi Financial Group, Inc., | | |
Class A | 17,699 | 712,031 |
Endurance Specialty Holdings | | |
Ltd. (a) | 182,800 | 6,533,272 |
| Number of | Value |
Security | Shares | ($) |
| | |
FBL Financial Group, Inc., | | |
Class A (a) | 1,300 | 50,869 |
Great American Financial | | |
Resources, Inc. | 26,160 | 640,397 |
Harleysville Group, Inc. (a) | 4,070 | 132,234 |
HCC Insurance Holdings, Inc. (a) | 36,400 | 1,121,120 |
Horace Mann Educators Corp. | 94,580 | 1,943,619 |
Investors Title Co. | 2,411 | 121,346 |
IPC Holdings Ltd. (a) | 78,436 | 2,262,879 |
Kansas City Life Insurance Co. (a) | 7,343 | 330,435 |
Max Re Capital Ltd. | 110,101 | 2,805,373 |
Meadowbrook Insurance Group, | | |
Inc. (a)* | 48,311 | 530,938 |
Mercer Insurance Group, Inc. | 6,190 | 123,119 |
National Western Life Insurance | | |
Co., Class A * | 3,398 | 831,830 |
NYMAGIC, Inc. (a) | 13,390 | 546,981 |
Odyssey Re Holdings Corp. (a) | 3,390 | 133,261 |
Old Republic International | | |
Corp. (a) | 154,760 | 3,423,291 |
Partnerre Ltd. (a) | 109,440 | 7,501,017 |
Philadelphia Consolidated Holding | | |
Corp. (a)* | 114,626 | 5,042,398 |
Presidential Life Corp. | 42,187 | 831,928 |
ProCentury Corp. (a) | 36,600 | 849,120 |
Radian Group, Inc. | 63,642 | 3,492,673 |
Reinsurance Group of America, | | |
Inc. (a) | 96,640 | 5,578,061 |
RenaissanceRe Holdings Ltd. (a) | 101,076 | 5,067,951 |
RTW, Inc. * | 1,900 | 15,523 |
Selective Insurance Group, Inc. (a) | 20,374 | 518,722 |
The Midland Co. (a) | 5,465 | 231,825 |
Unico American Corp. * | 10,910 | 138,230 |
United America Indemnity Ltd., | | |
Class A * | 26,483 | 614,406 |
Wesco Financial Corp. | 2,110 | 970,600 |
Zenith National Insurance | | |
Corp. (a) | 43,815 | 2,071,135 |
| | 81,693,283 |
IT Hardware 5.0% | | |
Advanced Energy Industries, | | |
Inc. (a)* | 78,821 | 1,658,394 |
Amtech Systems, Inc. (a)* | 3,460 | 25,189 |
Aviza Technology, Inc. * | 4,884 | 35,214 |
Avocent Corp. (a)* | 15,873 | 428,095 |
AVX Corp. (a) | 38,310 | 582,312 |
Axcelis Technologies, Inc. (a)* | 3,140 | 23,990 |
CTS Corp. | 51,835 | 716,360 |
Cymer, Inc. * | 35,067 | 1,457,034 |
Digi International, Inc. (a)* | 7,050 | 89,535 |
EMS Technologies, Inc. * | 40,545 | 781,302 |
Espey Manufacturing & | | |
Electronics Corp. | 3,600 | 70,740 |
Exar Corp. * | 107,321 | 1,420,930 |
Globecomm Systems, Inc. * | 28,188 | 301,612 |
Harmonic, Inc. * | 430 | 4,223 |
Imation Corp. | 110,998 | 4,482,099 |
Integrated Device Technology, | | |
Inc. * | 100,246 | 1,545,793 |
inTEST Corp. * | 4,286 | 19,287 |
46 Laudus Funds Annual Report
See financial notes.
Laudus Rosenberg U.S. Discovery Fund |
| | Number of | Value |
Security | | Shares | ($) |
| | | |
Kimball International, Inc., | | | |
Class B (a) | | 768 | 14,807 |
Lattice Semiconductor Corp. * | | 860 | 5,031 |
LSI Logic Corp. (a)* | | 996,444 | 10,402,875 |
Merix Corp. (a)* | | 4,860 | 39,949 |
MKS Instruments, Inc. (a)* | | 65,943 | 1,682,865 |
ON Semiconductor Corp. (a)* | | 28,827 | 257,137 |
Oplink Communications, Inc. * | | 48,891 | 878,571 |
Pericom Semiconductor Corp. (a)* | 38,051 | 372,139 |
RF Micro Devices, Inc. (a)* | | 553,980 | 3,451,295 |
Rudolph Technologies, Inc. (a)* | | 73,598 | 1,283,549 |
Semitool, Inc. (a)* | | 76,033 | 988,429 |
SonicWALL, Inc. (a)* | | 202,447 | 1,692,457 |
Spectrum Control, Inc. * | | 31,270 | 384,621 |
Standard Microsystems Corp. * | | 26,903 | 821,618 |
Technitrol, Inc. | | 152,370 | 3,990,570 |
Viasat, Inc. (a) | | 1,820 | 60,005 |
Vishay Intertechnology, Inc. (a)* | | 513,840 | 7,183,483 |
White Electronic Designs Corp. * | 2,198 | 14,639 |
| | | 47,166,149 |
Land & Water Transportation 1.0% | | | |
B & H Ocean Carriers Ltd. * | | 2,390 | 43,737 |
GulfMark Offshore, Inc. * | | 10,294 | 449,333 |
Hub Group, Inc., Class A * | | 14,316 | 415,021 |
International Shipholding Corp. * | | 1,400 | 25,704 |
Pacer International, Inc. (a) | | 15,112 | 407,117 |
Saia, Inc. * | | 4,276 | 101,555 |
SEACOR Holdings, Inc. (a)* | | 53,626 | 5,276,799 |
Trico Marine Services, Inc. (a)* | | 20,120 | 749,671 |
U.S. Xpress Enterprises, Inc., | | | |
Class A * | | 28,389 | 489,994 |
Werner Enterprises, Inc. (a) | | 67,702 | 1,230,145 |
| | | 9,189,076 |
Mainframe & Minicomputers 0.1% | | | |
Omnicell, Inc. * | | 63,800 | 1,334,696 |
Metal Products & Machinery 3.8% | | | |
AGCO Corp. (a)* | | 69,895 | 2,584,018 |
Allied Motion Technologies, Inc. * | 6,681 | 42,692 |
Astec Industries, Inc. * | | 52,700 | 2,121,175 |
Baldor Electric Co. (a) | | 2,800 | 105,672 |
Bonso Electronic International, | | | |
Inc. | | 11,533 | 47,170 |
Brooks Automation, Inc. (a)* | | 6,050 | 103,758 |
Chart Industries, Inc. * | | 2,593 | 47,089 |
Chicago Rivet & Machine Co. | | 420 | 9,303 |
CompX International, Inc. | | 5,800 | 93,554 |
Eastern Co. | | 13,940 | 378,889 |
Electro Scientific Industries, | | | |
Inc. (a)* | | 22,909 | 440,769 |
EnPro Industries, Inc. * | | 64,300 | 2,318,015 |
Evans & Sutherland Computer | | | |
Corp. * | | 6,153 | 19,382 |
FSI International, Inc. (a)* | | 60 | 268 |
Gardner Denver, Inc. * | | 40,940 | 1,426,759 |
Gerber Scientific, Inc. (a)* | | 76,620 | 812,938 |
Goodman Global, Inc. (a)* | | 333 | 5,867 |
Hardinge, Inc. | | 10,201 | 266,858 |
Kadant, Inc. * | | 50,900 | 1,290,824 |
Kennametal, Inc. | | 45,109 | 3,049,820 |
| | Number of | Value |
Security | | Shares | ($) |
| | | |
Key Technology, Inc. * | | 420 | 6,636 |
Lincoln Electric Holdings, Inc. (a) | 16,908 | 1,007,040 |
Littelfuse, Inc. * | | 320 | 12,992 |
Material Sciences Corp. * | 38,892 | 388,142 |
MFRI, Inc. * | | 5,616 | 104,121 |
Newport Corp. (a) | | 14,260 | 233,436 |
NN, Inc. (a) | | 10,609 | 132,506 |
Nordson Corp. (a) | | 1,390 | 64,579 |
North American Galvanizing & | | |
Coatings, Inc. * | | 21,162 | 108,349 |
P & F Industries, Inc., Class A * | 3,250 | 40,690 |
Powell Industries, Inc. (a)* | 1,720 | 55,040 |
Q.E.P. Co., Inc. * | | 1,679 | 10,091 |
Regal Beloit Corp. (a) | | 76,330 | 3,540,185 |
Robbins & Myers, Inc. (a) | 39,480 | 1,472,209 |
Rofin-Sinar Technologies, Inc. * | 720 | 42,610 |
RTI International Metals, Inc. (a)* | 7,370 | 670,744 |
SL Industries, Inc. * | | 10,470 | 157,574 |
SPX Corp. | | 38,000 | 2,667,600 |
Standex International Corp. (a) | 16,690 | 475,832 |
Tennant Co. | | 5,920 | 186,421 |
The L.S. Starrett Co., Class A | 5,020 | 90,491 |
The Manitowoc Co., Inc. | | 10,258 | 651,691 |
The Middleby Corp. (a)* | | 866 | 114,173 |
Twin Disc, Inc. | | 3,360 | 143,472 |
Varian Semiconductor Equipment | | |
Associates, Inc. (a)* | | 67,562 | 3,606,460 |
Veeco Instruments, Inc. (a) | 93,254 | 1,818,453 |
Velcro Industries N.V. | | 17,743 | 306,776 |
Watts Water Technologies, Inc., | | |
Class A (a) | | 18,593 | 707,092 |
Woodward Governor Co. | | 26,610 | 1,095,534 |
| | | 35,075,759 |
Miscellaneous Finance 2.7% | | | |
A.G. Edwards, Inc. | | 199,160 | 13,777,889 |
Cohen & Steers, Inc. | | 2,090 | 90,037 |
Knight Capital Group, Inc., | | |
Class A (a)* | | 348,063 | 5,513,318 |
Raymond James Financial, Inc. | 128,265 | 3,817,166 |
SWS Group, Inc. (a) | | 63,156 | 1,566,900 |
Value Line, Inc. (a) | | 2,407 | 115,055 |
| | | 24,880,365 |
Oil & Coal Resources 0.6% | | | |
Mariner Energy, Inc. * | | 183,266 | 3,505,879 |
Rosetta Resources, Inc. (a)* | 46,922 | 963,778 |
Teton Energy Corp. * | | 99,210 | 480,176 |
Unit Corp. (a)* | | 11,920 | 603,033 |
| | | 5,552,866 |
Oil Distribution 0.7% | | | |
Adams Resources & Energy, Inc. | 9,259 | 339,435 |
Tesoro Corp. (a) | | 28,607 | 2,873,001 |
Western Refining, Inc. (a) | 78,272 | 3,054,174 |
World Fuel Services Corp. | 13,170 | 609,244 |
| | | 6,875,854 |
Oil Drilling & Services | 2.5% | | |
Atwood Oceanics, Inc. * | | 84,700 | 4,971,043 |
Basic Energy Services, Inc. (a)* | 15,260 | 355,558 |
Dawson Geophysical Co. * | 300 | 14,859 |
See financial notes.
Laudus Funds Annual Report 47
Laudus Rosenberg U.S. Discovery Fund |
Portfolio Holdings continued | | | |
| | | | |
| | | Number of | Value |
Security | | | Shares | ($) |
| | | | |
Global Industries Ltd. * | | | 15,370 | 281,117 |
Helmerich & Payne, Inc. | | | 16,980 | 515,173 |
Lufkin Industries, Inc. (a) | | | 29,340 | 1,648,321 |
Superior Energy Services, Inc. * | | 137,442 | 4,737,626 |
T-3 Energy Services, Inc * | | | 4,800 | 96,576 |
Tidewater, Inc. (a) | | | 181,780 | 10,648,673 |
W-H Energy Services, Inc. * | | | 2,870 | 134,144 |
| | | | 23,403,090 |
Photo-optical, Micros & Office Machinery 0.8% | |
Baldwin Technology Co., Inc., | | | |
Class A * | | | 43,210 | 216,050 |
Key Tronic Corp. (a)* | | | 10,258 | 42,058 |
Komag, Inc. (a)* | | | 47,800 | 1,564,494 |
Printronix, Inc. | | | 380 | 5,263 |
STEC, Inc. (a)* | | | 124,954 | 879,676 |
VASCO Data Security | | | | |
International, Inc. * | | | 346 | 6,183 |
VeriFone Holdings, Inc. (a)* | | | 139,919 | 5,139,225 |
| | | | 7,852,949 |
Publishing, Broadcasting & Cinema 0.4% | | |
Alloy, Inc. * | | | 1,920 | 22,810 |
Bowne & Co., Inc. | | | 21,340 | 335,678 |
Champion Industries, Inc. (a) | | 7,808 | 64,494 |
Franklin Covey Co. * | | | 53,390 | 421,781 |
Media General, Inc., Class A (a) | | 8,270 | 315,583 |
Regent Communications, Inc. (a)* | 12,716 | 40,946 |
Scholastic Corp. * | | | 61,124 | 1,900,956 |
Source Interlink Cos., Inc. (a)* | | 46,766 | 313,800 |
Tufco Technologies, Inc. * | | | 2,242 | 18,317 |
World Wrestling Entertainment, | | | |
Inc., Class A | | | 4,630 | 75,469 |
| | | | 3,509,834 |
Real Estate Development 0.4% | | | | |
American Spectrum Realty, Inc. * | 300 | 8,106 |
AMREP Corp. (a)* | | | 4,645 | 358,826 |
Avatar Holdings, Inc. (a)* | | | 10,709 | 765,051 |
ILX Resorts, Inc. | | | 5,160 | 47,988 |
J.W. Mays, Inc. * | | | 500 | 10,750 |
Service Corp. International | | | 166,230 | 1,971,488 |
Stratus Properties, Inc. * | | | 710 | 23,870 |
United Capital Corp. * | | | 8,880 | 302,897 |
Wellsford Real Properties, Inc. * | | 16,610 | 129,807 |
| | | | 3,618,783 |
Real Estate Investment Trusts 6.5% | | | |
American Campus Communities, | | | |
Inc. (a) | | | 3,710 | 112,376 |
American First Apartment | | | | |
Investors, Inc. (a) | | | 1,300 | 26,377 |
Ashford Hospitality Trust | | | 145,500 | 1,737,270 |
Associated Estates Realty Corp. | | 57,780 | 814,120 |
CBL & Associates Properties, Inc. | 110 | 4,932 |
Digital Realty Trust, Inc. | | | 7,480 | 298,452 |
Eagle Hospitality Properties Trust, | | |
Inc. (a) | | | 61,950 | 690,742 |
| | | | | |
Extra Space Storage, Inc. (a) | | 159,071 | 3,012,805 |
Franklin Street Properties Corp. (a) | | | 20,210 | 387,628 |
Gladstone Commercial Corp. | | 2,710 | 54,336 |
| | | | |
| Number of | Value |
Security | Shares | ($) |
| | |
Highland Hospitality Corp. | 158,943 | 2,829,185 |
Home Properties, Inc. | 26,000 | 1,373,060 |
HRPT Properties Trust (a) | 655,080 | 8,057,484 |
Innkeepers USA Trust | 20,575 | 334,961 |
iStar Financial, Inc. | 87,767 | 4,110,129 |
Kite Realty Group Trust (a) | 26,350 | 525,682 |
Lasalle Hotel Properties (a) | 94,270 | 4,370,357 |
LTC Properties, Inc. | 32,580 | 844,148 |
Medical Properties Trust, Inc. (a) | 136,000 | 1,997,840 |
Mission West Properties, Inc. | 33,650 | 486,579 |
Monmouth Capital Corp. | 3,030 | 16,756 |
Monmouth Real Estate | | |
Investment Corp., Class A | 56,990 | 491,254 |
National Retail Properties, Inc. | 136,288 | 3,296,807 |
Omega Healthcare Investor, Inc. | 166,890 | 2,862,163 |
One Liberty Properties, Inc. | 26,650 | 607,886 |
Ramco-Gershenson Properties | | |
Trust | 18,900 | 674,919 |
Republic Property Trust (a) | 29,910 | 343,666 |
Spirit Finance Corp. | 248,567 | 3,703,648 |
Strategic Hotel & Resorts, Inc. | 204,986 | 4,688,030 |
Sunstone Hotel Investors, Inc. | 211,391 | 5,762,519 |
Supertel Hospitality, Inc. | 31,979 | 244,000 |
Urstadt Biddle Properties, Inc., | | |
Class A | 2,780 | 54,377 |
Weingarten Realty Investors (a) | 79,557 | 3,783,731 |
Winston Hotels, Inc. | 77,944 | 1,171,498 |
Winthrop Realty Trust | 122,391 | 809,005 |
| | 60,578,722 |
Restaurants, Hotels & Theaters 3.1% | | |
Analogic Corp. | 14,289 | 898,492 |
Avalon Holdings Corp., Class A * | 1,600 | 12,752 |
Benihana, Inc. * | 7,446 | 210,350 |
Bob Evans Farms, Inc. (a) | 34,884 | 1,288,964 |
Brinker International, Inc. | 135,899 | 4,443,897 |
Buffalo Wild Wings, Inc. (a)* | 2,248 | 143,198 |
Burger King Holdings, Inc. | 77,770 | 1,679,832 |
CBRL Group, Inc. (a) | 109,064 | 5,049,663 |
CEC Entertainment, Inc. * | 6,340 | 263,364 |
Churchill Downs, Inc. | 1,000 | 45,390 |
Dollar Thrifty Automotive Group,Inc. (a)* | 760 | 38,790 |
Flanigan’s Enterprises, Inc. * | 931 | 10,288 |
Friendly Ice Cream Corp. * | 5,860 | 87,138 |
Frisch’s Restaurants, Inc. (a) | 4,660 | 174,750 |
Interstate Hotels & Resorts, Inc. * | 96,200 | 607,022 |
J. Alexander’s Corp. | 10,580 | 116,909 |
Jack in the Box, Inc. * | 41,287 | 2,854,170 |
Live Nation, Inc. * | 182,508 | 4,026,126 |
Marcus Corp. | 43,460 | 1,010,880 |
Mexican Restaurants, Inc. * | 8,834 | 84,718 |
Nathan’s Famous, Inc. * | 5,324 | 79,860 |
O’Charley’s, Inc. * | 280 | 5,401 |
Red Lion Hotels Corp. * | 34,520 | 429,429 |
Silverleaf Resorts, Inc. * | 49,240 | 228,474 |
Speedway Motorsports, Inc. (a) | 35,510 | 1,376,012 |
Star Buffet, Inc. | 3,900 | 32,565 |
The Steak n Shake Co. * | 4,170 | 69,931 |
Vail Resorts, Inc. (a)* | 64,440 | 3,501,025 |
| | 28,769,390 |
48 Laudus Funds Annual Report
See financial notes.
Laudus Rosenberg U.S. Discovery Fund |
| Number of | Value |
Security | Shares | ($) |
| | |
Retail 6.0% | | |
1-800-FLOWERS.COM, Inc., | | |
Class A (a)* | 80,900 | 629,402 |
American Eagle Outfitters, Inc. (a) | 88,200 | 2,645,118 |
Arden Group, Inc., Class A (a) | 220 | 29,370 |
Big Lots, Inc. (a)* | 339,606 | 10,622,876 |
Books-A-Million, Inc. (a) | 9,862 | 140,435 |
Cabela’s, Inc. * | 72,470 | 1,797,981 |
CarMax, Inc. * | 25,160 | 617,426 |
Cash America International, Inc. | 38,880 | 1,594,080 |
Charlotte Russe Holding, Inc. | 19,519 | 563,514 |
Charming Shoppes, Inc. (a)* | 202,581 | 2,623,424 |
Collegiate Pacific, Inc. (a) | 22,660 | 176,748 |
Cost-U-Less, Inc. * | 7,770 | 69,852 |
Deb Shops, Inc. | 3,806 | 103,067 |
Dick’s Sporting Goods, Inc. * | 2,170 | 126,424 |
Dillard’s, Inc., Class A (a) | 89,356 | 2,924,622 |
EZCORP, Inc., Class A * | 113,106 | 1,666,051 |
First Cash Financial Services,Inc. * | 30,144 | 671,608 |
Gottschalks, Inc. * | 22,237 | 317,322 |
GSI Commerce, Inc. (a)* | 32,139 | 726,020 |
Hastings Entertainment, Inc. (a)* | 26,860 | 163,846 |
Haverty Furniture Cos., Inc. (a) | 80,070 | 1,120,980 |
Ingles Markets, Inc., Class A | 27,765 | 1,133,923 |
Insight Enterprises, Inc. (a)* | 61,392 | 1,103,828 |
Jennifer Convertibles, Inc. * | 1,290 | 6,011 |
Longs Drug Stores Corp. | 105,930 | 5,470,225 |
Mothers Work, Inc. (a)* | 800 | 26,512 |
OfficeMax, Inc. | 47,051 | 2,481,470 |
PC Connection, Inc. (a)* | 200 | 2,860 |
PC Mall, Inc. (a)* | 32,090 | 319,937 |
RadioShack Corp. (a) | 14,470 | 391,124 |
Restoration Hardware, Inc. (a)* | 99,600 | 653,376 |
Retail Ventures, Inc. * | 23,540 | 495,517 |
REX Stores Corp. * | 10,920 | 178,651 |
Ruddick Corp. (a) | 1,380 | 41,510 |
Rush Enterprises, Inc., | | |
Class A (a)* | 11,768 | 226,063 |
Rush Enterprises, Inc., Class B * | 32,497 | 588,521 |
Saks, Inc. * | 120,361 | 2,508,323 |
Shoe Carnival, Inc. * | 29,500 | 982,350 |
Shutterfly, Inc. * | 6,190 | 99,288 |
Spartan Stores, Inc. | 79,874 | 2,140,623 |
Systemax, Inc. (a)* | 19,776 | 370,405 |
The Bon-Ton Stores, Inc. (a) | 21,200 | 1,192,288 |
The Buckle, Inc. (a) | 750 | 26,775 |
The Cato Corp., Class A (a) | 86,060 | 2,012,943 |
The Great Atlantic & Pacific Tea | | |
Co., Inc. * | 59,400 | 1,970,892 |
The Men’s Wearhouse, Inc. (a) | 6,330 | 297,827 |
Trans World Entertainment | | |
Corp. * | 77,740 | 441,563 |
Village Super Market, Inc., | | |
Class A | 1,000 | 95,490 |
Weis Markets, Inc. (a) | 31,490 | 1,407,603 |
Zones, Inc. * | 1,110 | 11,378 |
| | 56,007,442 |
Software 6.8% | | |
American Software, Inc., Class A | 16,950 | 136,447 |
Ansoft Corp. (a)* | 25,060 | 792,898 |
| Number of | Value |
Security | Shares | ($) |
| | |
Aspen Technology, Inc. | 48,660 | 632,580 |
Black Box Corp. (a) | 47,851 | 1,748,475 |
Blackbaud, Inc. (a) | 21,552 | 526,300 |
BMC Software, Inc. * | 543,900 | 16,746,681 |
Captaris, Inc. * | 56,771 | 328,704 |
CIBER, Inc. * | 76,840 | 604,731 |
Computer Task Group, Inc. * | 9,085 | 40,973 |
CSP, Inc. * | 7,852 | 72,474 |
Edgewater Technology, Inc. (a)* | 33,993 | 286,901 |
Emdeon Corp. (a) | 734,728 | 11,116,435 |
First American Corp. | 103,113 | 5,229,891 |
Goldleaf Financial Solutions, Inc. * | 8,400 | 55,272 |
Harris Interactive, Inc. (a)* | 40,688 | 245,349 |
HMS Holdings Corp. (a)* | 18,264 | 399,982 |
Inforte Corp. * | 19,069 | 66,169 |
Keynote Systems, Inc. * | 4,830 | 64,819 |
Lawson Software, Inc. (a) | 99,063 | 801,420 |
Lightbridge, Inc. * | 71,447 | 1,255,324 |
Mentor Graphics Corp. | 5,060 | 82,680 |
Moldflow Corp. * | 4,594 | 69,048 |
Move, Inc. * | 10,710 | 59,333 |
Ness Technologies, Inc. * | 1,832 | 23,413 |
NetManage, Inc. * | 2,380 | 12,495 |
NetScout Systems, Inc. (a)* | 23,411 | 211,870 |
PC-Tel, Inc. * | 43,613 | 443,544 |
Perot Systems Corp., Class A * | 208,860 | 3,732,328 |
SAVVIS, Inc. (a)* | 95,731 | 4,583,600 |
SPSS, Inc. * | 16,620 | 599,982 |
Sybase, Inc. * | 243,961 | 6,167,334 |
Synopsys, Inc. (a)* | 207,156 | 5,433,702 |
Syntel, Inc. (a) | 14,401 | 498,995 |
Taleo Corp., Class A (a)* | 41,470 | 687,573 |
TechTeam Global, Inc. * | 1,210 | 15,125 |
THQ, Inc. * | 360 | 12,308 |
TSR, Inc. | 4,099 | 17,298 |
| | 63,802,453 |
Textiles & Apparel 3.3% | | |
Crocs, Inc. (a)* | 18,447 | 871,621 |
Culp, Inc. * | 4,260 | 30,161 |
Cutter & Buck, Inc. | 3,080 | 36,498 |
Decorator Industries, Inc. | 3,640 | 25,480 |
G-III Apparel Group Ltd. * | 39,740 | 757,047 |
Guess?, Inc. * | 148,960 | 6,031,391 |
Interface, Inc., Class A | 136,925 | 2,189,431 |
LaCrosse Footwear, Inc. * | 2,350 | 36,190 |
Liz Claiborne, Inc. | 47,686 | 2,043,345 |
Perry Ellis International, Inc. * | 26,890 | 860,211 |
Phillips-Van Heusen Corp. (a) | 133,490 | 7,849,212 |
R.G. Barry Corp. * | 6,730 | 70,127 |
Skechers U.S.A., Inc., Class A * | 61,000 | 2,047,770 |
Steven Madden Ltd. | 71,657 | 2,092,384 |
Stride Rite Corp. | 105,567 | 1,624,676 |
The Gymboree Corp. * | 61,560 | 2,466,709 |
Weyco Group, Inc. (a) | 12,484 | 324,334 |
Wolverine World Wide, Inc. | 48,120 | 1,374,788 |
| | 30,731,375 |
Wholesale 3.6% | | |
Anixter International, Inc. (a) | 24,884 | 1,640,851 |
Applied Industrial Technologies, | | |
Inc. | 71,827 | 1,762,634 |
See financial notes.
Laudus Funds Annual Report 49
Laudus Rosenberg U.S. Discovery Fund |
Portfolio Holdings continued | | |
| | |
| Number of | Value |
Security | Shares | ($) |
| | |
Arrow Electronics, Inc. * | 247,291 | 9,335,235 |
Avnet, Inc. * | 417,640 | 15,093,510 |
Brown Shoe Co., Inc. | 61,905 | 2,600,010 |
Coast Distribution System, Inc. | 10,030 | 77,732 |
Delta Apparel, Inc. | 2,790 | 48,546 |
En Pointe Technologies, Inc. * | 610 | 2,080 |
Huttig Building Products, Inc. * | 13,618 | 82,389 |
IKON Office Solutions, Inc. | 8,800 | 126,456 |
Industrial Distribution Group, | | |
Inc. * | 16,083 | 200,877 |
Kaman Corp. | 2,762 | 64,382 |
Keystone Automotive Industries, | | |
Inc. (a)* | 7,287 | 245,572 |
Lawson Products, Inc. (a) | 3,368 | 127,580 |
Man Sang Holdings, Inc. * | 9,370 | 56,220 |
NACCO Industries, Inc., Class A | 10,707 | 1,471,249 |
Park-Ohio Holdings Corp. (a)* | 5,390 | 99,715 |
Richardson Electronics Ltd. | 51,200 | 478,208 |
TESSCO Technologies, Inc. * | 13,095 | 356,053 |
Traffix, Inc. | 8,296 | 45,960 |
| | 33,915,259 |
Total Common Stock (Cost $761,034,449) | 928,439,355 |
Security | Face Amount | Value |
Rate, Maturity Date | ($) | ($) |
| | |
Short-Term Investment 0.8% of net assets | |
| | |
Repurchase Agreement 0.8% | | |
Fixed Income Clearing Corp. | | |
dated 03/30/07, due 04/02/07 at | | |
5.00%, with a maturity value of | | |
$7,524,134 (fully collateralized | | |
by Federal Home Loan Bank | | |
with a value of $7,671,563.) | 7,521,000 | 7,521,000 |
Total Short-Term Investment | | |
(Cost $7,521,000) | | 7,521,000 |
| | |
End of Investments. | | |
At 03/31/07 the tax basis cost of the fund’s investments was $769,008,508 and the unrealized appreciation and depreciation were $177,305,903 and ($10,354,056), respectively, with a net unrealized appreciation of $166,951,847.
| Number of | Value |
Security | Shares | ($) |
| | |
Collateral Invested for Securities on Loan 7.8% of net assets |
| | |
State Street Navigator Security | | |
Lending Prime Portfolio | 72,805,635 | 72,805,635 |
| | |
End of collateral invested for securities on loan. | |
| | |
* Non-income producing security. | | |
(a) All or a portion of this security is on loan. | |
50 Laudus Funds Annual Report
See financial notes.
Laudus Rosenberg U.S. Small Capitalization Fund |
Portfolio Holdings as of March 31, 2007 | |
| | | |
| | Cost | Value |
Holdings by Category | ($) | ($) |
| | | |
99.3% | Common Stock | 767,896,335 | 1,010,613,511 |
—% | Short-Term Investment | 501,000 | 501,000 |
| | | |
99.3% | Total Investments | 768,397,335 | 1,011,114,511 |
8.9% | Collateral Invested for | | |
| Securities on Loan | 90,803,224 | 90,803,224 |
(8.2)% | Other Assets and | | |
| Liabilities | | (83,888,094) |
| | | |
100.0% | Net Assets | | 1,018,029,641 |
| Number of | Value |
Security | Shares | ($) |
| | |
Common Stock 99.3% of net assets | |
| | |
Agriculture, Food & Beverage 1.9% | | |
Flowers Foods, Inc. (a) | 233,484 | 7,044,212 |
Imperial Sugar Co. (a) | 11,360 | 380,901 |
J & J Snack Foods Corp. (a) | 16,508 | 651,901 |
National Beverage Corp. (a)* | 65,490 | 1,148,695 |
Penford Corp. | 3,415 | 68,778 |
Seaboard Corp. (a) | 4,460 | 10,079,600 |
Seneca Foods Corp., Class B * | 400 | 11,224 |
Tasty Baking Co. (a) | 470 | 4,103 |
| | 19,389,414 |
Airlines 1.8% | | |
AirNet Systems, Inc. * | 36,300 | 116,523 |
Alaska Air Group, Inc. (a)* | 257,500 | 9,810,750 |
Pinnacle Airlines Corp. (a)* | 10,710 | 185,176 |
Republic Airways Holdings, | | |
Inc. (a)* | 77,148 | 1,771,318 |
SkyWest, Inc. (a) | 253,861 | 6,811,091 |
| | 18,694,858 |
Autos 0.3% | | |
Aftermarket Technology Corp. * | 95,219 | 2,311,917 |
Spartan Motors, Inc. (a) | 15,951 | 370,223 |
Supreme Industries, Inc., | | |
Class A (a) | 17,130 | 100,211 |
| | 2,782,351 |
Banks & Credit Institutions 4.3% | | |
1st Source Corp. | 24,681 | 645,902 |
Advanta Corp., Class A | 148,677 | 5,958,974 |
Advanta Corp., Class B | 25,735 | 1,128,222 |
American Community | | |
Bancshares, Inc. | 8,100 | 91,530 |
Auburn National Bancorp, Inc. | 100 | 2,888 |
BancFirst Corp. (a) | 39,169 | 1,815,483 |
Bank of Granite Corp. (a) | 953 | 17,078 |
BankUnited Financial Corp., | | |
Class A (a) | 13,517 | 286,696 |
Banner Corp. | 870 | 36,149 |
Berkshire Hills Bancorp, Inc. (a) | 3,079 | 103,608 |
Beverly Hills Bancorp, Inc. | 138,600 | 1,053,360 |
BNCCorp, Inc. * | 10,667 | 175,472 |
BOE Financial Services of | | |
Virginia, Inc. | 301 | 9,409 |
Britton & Koontz Capital Corp. | 5,473 | 103,987 |
C&F Financial Corp. | 180 | 7,911 |
| Number of | Value |
Security | Shares | ($) |
| | |
Camco Financial Corp. | 540 | 6,934 |
Carrollton Bancorp | 100 | 1,769 |
Carver Bancorp, Inc. | 22,600 | 378,550 |
Central Bancorp, Inc. | 320 | 9,744 |
Centrue Financial Corp. | 12,120 | 234,764 |
CFS Bancorp, Inc. (a) | 24,552 | 368,034 |
Codorus Valley Bancorp, Inc. | 281 | 5,347 |
Community Bank Shares of | | |
Indiana, Inc. | 1,030 | 22,377 |
Community Capital Corp. | 3,588 | 72,460 |
Community Financial Corp. | 4,350 | 52,809 |
Community Shores Bank Corp. * | 180 | 2,227 |
Community West Bancshares | 11,100 | 175,602 |
CompuCredit Corp. (a)* | 45,458 | 1,419,199 |
Consumer Portfolio Services, | | |
Inc. * | 39,625 | 243,694 |
Cooperative Bankshares, Inc. | 433 | 7,123 |
Corus Bankshares, Inc. (a) | 49,415 | 843,020 |
Cowlitz Bancorp * | 36,907 | 627,419 |
Crescent Banking Co. | 1,473 | 63,884 |
Delta Financial Corp. (a) | 65,087 | 538,269 |
Desert Community Bank | 39,358 | 747,802 |
Dollar Financial Corp. * | 61 | 1,543 |
Downey Financial Corp. (a) | 120 | 7,745 |
ECB Bancorp, Inc. | 2,089 | 69,982 |
Elmira Savings Bank, FSB | 11,999 | 317,734 |
Exchange National Bancshares, | | |
Inc. | 4,080 | 147,696 |
Farmers Capital Bank Corp. (a) | 1,815 | 53,325 |
Federal Agricultural Mortgage | | |
Corp., Class C (a) | 34,590 | 940,848 |
Fidelity Bancorp, Inc. | 60 | 1,116 |
Fidelity Southern Corp. | 9,457 | 180,061 |
First Bancorp of Indiana, Inc. | 3,391 | 59,682 |
First Bancshares, Inc. * | 12,121 | 204,542 |
First BancTrust Corp. | 12,550 | 148,467 |
First California Financial Group, | | |
Inc. * | 13,770 | 174,190 |
First Citizens BancShares, Inc., | | |
Class A | 13,450 | 2,703,450 |
First Defiance Financial Corp. | 3,756 | 107,797 |
First Federal Bancshares of | | |
Arkansas, Inc. | 14,584 | 344,766 |
First Federal Bankshares, Inc. | 5,999 | 128,679 |
First Financial Service Corp. | 109 | 3,127 |
First Mariner Bancorp, Inc. * | 4,540 | 69,008 |
First Place Financial Corp. | 70,703 | 1,516,579 |
First Regional Bancorp (a)* | 22,413 | 665,666 |
First West Virginia Bancorp, Inc. | 330 | 6,683 |
FNB Corp. of North Carolina | 9,544 | 159,862 |
FNB Corp. of Virginia (a) | 700 | 25,081 |
Franklin Bank Corp. (a)* | 196,222 | 3,506,487 |
Glen Burnie Bancorp | 360 | 6,417 |
Great Pee Dee Bancorp, Inc. | 1,560 | 23,985 |
Greene County Bancshares, Inc. | 108 | 3,662 |
GS Financial Corp. | 8,660 | 177,746 |
Guaranty Federal Bancshares, | | |
Inc. | 4,019 | 117,757 |
Habersham Bancorp, Inc. | 25,078 | 575,540 |
Hanmi Financial Corp. (a) | 722 | 13,761 |
HF Financial Corp. | 25,416 | 463,842 |
Hingham Institution for Savings | 9,400 | 323,830 |
See financial notes.
Laudus Funds Annual Report 51
Laudus Rosenberg U.S. Small Capitalization Fund |
Portfolio Holdings continued | | |
| | |
| Number of | Value |
Security | Shares | ($) |
| | |
HMN Financial, Inc. | 17,130 | 579,679 |
Horizon Bancorp | 6,123 | 164,770 |
Intervest Bancshares Corp. (a)* | 39,259 | 1,126,733 |
Irwin Financial Corp. (a) | 19,020 | 354,533 |
ITLA Capital Corp. | 8,108 | 421,778 |
Lincoln Bancorp | 2,000 | 37,900 |
LSB Financial Corp. | 4,076 | 107,769 |
MASSBANK Corp. | 12,262 | 402,194 |
Meta Financial Group, Inc. | 2,000 | 63,000 |
MFB Corp. | 3,400 | 114,240 |
MidWestOne Financial Group, | | |
Inc. | 22,442 | 392,062 |
Monarch Community Bancorp, | | |
Inc. | 1,800 | 21,078 |
NBT Bancorp, Inc. | 9,120 | 213,682 |
New Hampshire Thrift | | |
Bancshares, Inc. | 10,030 | 156,769 |
North Central Bancshares, Inc. | 300 | 12,027 |
North Valley Bancorp | 13,096 | 329,102 |
Northeast Bancorp | 100 | 1,865 |
Northway Financial, Inc. | 14,700 | 479,881 |
OceanFirst Financial Corp. | 6,280 | 108,958 |
Park Bancorp, Inc. | 12,608 | 430,248 |
Parkvale Financial Corp. | 28,980 | 846,506 |
Peoples Bancorp of North | | |
Carolina | 1,599 | 42,853 |
Peoples Bancorp, Inc. | 900 | 17,627 |
Peoples BancTrust Co., Inc. | 14,700 | 279,741 |
Peoples Community Bancorp, | | |
Inc. | 2,700 | 45,846 |
Pinnacle Bancshares, Inc. | 1,830 | 27,642 |
Premier Financial Bancorp, Inc. | 2,300 | 37,421 |
Princeton National Bancorp, Inc. | 157 | 4,710 |
Provident Community | | |
Bancshares, Inc. | 400 | 8,344 |
Provident Financial Holdings, Inc. | 40,331 | 1,109,909 |
QCR Holdings, Inc. (a) | 4,225 | 65,319 |
Republic First Bancorp, Inc. * | 34,597 | 445,609 |
Royal Bancshares of | | |
Pennsylvania, Class A (a) | 209 | 4,964 |
Sierra Bancorp (a) | 3,090 | 86,705 |
Simmons First National Corp., | | |
Class A (a) | 2,600 | 78,182 |
South Street Financial Corp. | 393 | 3,360 |
Southern Missouri Bancorp, Inc. | 12,548 | 193,867 |
Southwest Bancorp, Inc. | 41,470 | 1,065,364 |
Team Financial, Inc. | 16,278 | 246,612 |
Teche Holding Co. | 3,900 | 172,380 |
TF Financial Corp. (a) | 10,266 | 313,113 |
The Washington Savings Bank,F.S.B. | 12,850 | 109,225 |
Timberland Bancorp, Inc. | 20,500 | 722,625 |
United Bancshares, Inc. | 11,438 | 184,952 |
United Community Financial Corp. (a) | 25,781 | 284,880 |
United Security Bancshares,Inc. (a) | 1,180 | 34,727 |
Unity Bancorp, Inc. | 14,004 | 166,087 |
Wainwright Bank & Trust Co. | 52,304 | 668,445 |
Willow Financial Bancorp, Inc. (a) | 5,282 | 68,138 |
| | Number of | Value |
Security | | Shares | ($) |
| | | |
WSFS Financial Corp. | | 10,204 | 657,954 |
WVS Financial Corp. | | 252 | 4,334 |
| | | 44,024,061 |
Basic Minerals & Metals 3.0% | | | |
AK Steel Holding Corp. * | | 37,200 | 870,108 |
Brush Engineered Materials, | | |
Inc. (a)* | | 450 | 21,811 |
Chaparral Steel Co. | | 137,722 | 8,011,289 |
CommScope, Inc. (a)* | | 169,600 | 7,275,840 |
General Cable Corp. (a)* | | 49,733 | 2,657,234 |
Northwest Pipe Co. * | | 43,927 | 1,749,612 |
OM Group, Inc. (a)* | | 118,532 | 5,296,010 |
Superior Essex, Inc. (a)* | | 119,549 | 4,144,764 |
Synalloy Corp. | | 1,000 | 27,920 |
Universal Stainless & Alloy | | | |
Products, Inc. * | | 1,040 | 49,369 |
| | | 30,103,957 |
Beer, Liquor, & Tobacco 0.0% | | |
MGP Ingredients, Inc. (a) | | 470 | 9,574 |
Universal Corp. (a) | | 300 | 18,405 |
| | | 27,979 |
Biotechnology 0.3% | | | |
Applera Corp. — Celera Group * | 68,048 | 966,282 |
Digene Corp. (a)* | | 38,293 | 1,624,006 |
Harvard Bioscience, Inc. * | | 108,142 | 521,244 |
| | | 3,111,532 |
Cellular & Wireless 0.0% | | | |
USA Mobility, Inc. (a) | | 21,910 | 436,666 |
Chemicals & Rubber 2.8% | | | |
A. Schulman, Inc. (a) | | 323,637 | 7,624,888 |
Arch Chemicals, Inc. (a) | | 150,004 | 4,683,125 |
Bairnco Corp. | | 14,680 | 197,446 |
CF Industries Holdings, Inc. (a) | 174,494 | 6,726,744 |
Hercules, Inc. * | | 333,590 | 6,518,348 |
Innospec, Inc. | | 25,240 | 1,454,834 |
LSB Industries, Inc. (a)* | | 10,200 | 158,814 |
NewMarket Corp. | | 1,800 | 73,206 |
Stepan Co. (a) | | 20,920 | 549,150 |
Terra Industries, Inc. * | | 5,780 | 101,150 |
Tronox, Inc., Class A | | 26,270 | 378,288 |
| | | 28,465,993 |
Commercial Aircraft & Components | 0.3% | |
Ducommun, Inc. * | | 11,810 | 303,871 |
Sequa Corp., Class A (a)* | | 11,030 | 1,321,063 |
TransDigm Group, Inc. * | | 370 | 13,461 |
Triumph Group, Inc. (a) | | 28,340 | 1,568,336 |
| | | 3,206,731 |
Communications Utilities 2.7% | | | |
Atlantic Tele-Network, Inc. (a) | 67,050 | 1,752,017 |
CT Communications, Inc. (a) | 172,300 | 4,152,430 |
D&E Communications, Inc. | | 50,654 | 674,711 |
Gilat Satellite Networks Ltd. * | 229,200 | 1,890,900 |
Golden Telecom, Inc. | | 168,629 | 9,338,674 |
Mediacom Communications | | | |
Corp., Class A (a)* | | 297,967 | 2,425,451 |
52 Laudus Funds Annual Report
See financial notes.
Laudus Rosenberg U.S. Small Capitalization Fund |
| | Number of | Value |
Security | | Shares | ($) |
| | | |
Premiere Global Services, Inc. * | 1,620 | 18,177 |
United Online, Inc. (a) | | 517,065 | 7,254,422 |
| | | 27,506,782 |
Construction & Homebuilding1.2% | | |
Comfort Systems USA, Inc. | 164,100 | 1,965,918 |
EMCOR Group, Inc. (a)* | | 2,900 | 171,042 |
Horizon Offshore, Inc. (a)* | 2,555 | 36,945 |
Infrasource Services, Inc. (a)* | 7,290 | 222,564 |
Insituform Technologies, Inc., | | |
Class A (a)* | | 62,000 | 1,288,980 |
Meadow Valley Corp. (a)* | 21,781 | 282,282 |
Perini Corp. (a)* | | 227,280 | 8,377,541 |
Skyline Corp. | | 5,230 | 176,460 |
U.S. Home Systems, Inc. * | 1,465 | 18,679 |
| | | 12,540,411 |
Construction Materials 0.4% | | | |
Ameron International Corp. (a) | 52,780 | 3,476,091 |
Continental Materials Corp. (a)* | 6,600 | 188,430 |
Oil-Dri Corp. of America | | 8,475 | 141,532 |
Patrick Industries, Inc. * | | 38,697 | 463,977 |
| | | 4,270,030 |
Consumer Durables 0.3% | | |
Universal Electronics, Inc. * | 110,184 | 3,069,726 |
Drugs & Pharmaceuticals 1.8% | |
E-Z-EM, Inc. * | | 13,463 | 216,485 |
Geopharma, Inc. * | | 11,115 | 48,906 |
Lifecore Biomedical, Inc. * | 10 | 188 |
Natural Alternative International, | | |
Inc. (a)* | | 35,826 | 287,325 |
NBTY, Inc. (a)* | | 115,753 | 6,139,539 |
Nutraceutical International | | |
Corp. * | | 23,853 | 393,574 |
Perrigo Co. (a) | | 287,668 | 5,080,217 |
Schiff Nutrition International, | | |
Inc. * | | 134,150 | 921,610 |
Sciele Pharma, Inc. (a)* | | 213,229 | 5,049,263 |
Theragenics Corp. * | | 6,950 | 43,507 |
| | | 18,180,614 |
Electric Utilities 2.3% | | | |
Avista Corp. | | 95,316 | 2,309,507 |
Central Vermont Public Service | | |
Corp. | | 2,560 | 73,779 |
CH Energy Group, Inc. | | 148,449 | 7,227,982 |
Cleco Corp. | | 1,560 | 40,295 |
El Paso Electric Co. * | | 21,110 | 556,248 |
Portland General Electric Co. (a) | 4,210 | 122,932 |
The Empire District Electric Co. | 13,010 | 322,648 |
UIL Holdings Corp. (a) | | 76,331 | 2,648,686 |
Unisource Energy Corp. (a) | 262,613 | 9,861,118 |
Unitil Corp. | | 200 | 5,434 |
| | | 23,168,629 |
Financial Investments 1.4% | | |
Aaron Rents, Inc. (a) | | 147,045 | 3,887,870 |
Ampal-American Israel Corp., | | |
| | | | |
| | Number of | Value |
Security | | Shares | ($) |
| | | |
California First National | | | |
Bancorp (a) | | 36,431 | 479,068 |
Compass Diversified Trust | | 660 | 11,068 |
Electro Rent Corp. * | | 39,645 | 570,888 |
Enstar Group Ltd. (a)* | | 112 | 11,048 |
ePlus, Inc. * | | 30,534 | 325,187 |
Iconix Brand Group, Inc. (a)* | | 24,573 | 501,289 |
Jackson Hewitt Tax Service, Inc. | 89,046 | 2,865,500 |
KMG America Corp. * | | 56,250 | 260,437 |
Macrovision Corp. (a)* | | 9,669 | 242,208 |
MVC Capital, Inc. * | | 850 | 13,302 |
PICO Holdings, Inc. (a)* | | 51,670 | 2,206,826 |
Rent-A-Center, Inc. (a)* | | 45,052 | 1,260,555 |
SRS Labs, Inc. * | | 32,260 | 449,382 |
Willis Lease Finance Corp. * | | 77,928 | 803,438 |
| | | 13,918,006 |
Forest Products & Paper 0.6% | | | |
American Woodmark Corp. (a) | | 16,246 | 597,203 |
Cenveo, Inc. * | | 25,470 | 618,921 |
CSS Industries, Inc. | | 4,210 | 157,791 |
Lydall, Inc. * | | 84,410 | 1,341,275 |
Nashua Corp. * | | 2,410 | 21,449 |
Rock-Tenn Co., Class A (a) | | 99,600 | 3,306,720 |
| | | 6,043,359 |
Furniture & Household Items 3.5% | | |
A.T. Cross Co., Class A * | | 1,040 | 9,152 |
Acuity Brands, Inc. (a) | | 97,590 | 5,312,800 |
AEP Industries, Inc. (a)* | | 16,754 | 720,422 |
American Biltrite, Inc. * | | 19,310 | 179,776 |
Bassett Furniture Industries, Inc. | 103,716 | 1,526,700 |
Chase Corp. | | 8,700 | 282,837 |
Chromcraft Revington, Inc. * | | 45,690 | 439,538 |
Communications Systems, Inc. | | 59,900 | 621,762 |
Constar International, Inc. (a)* | | 79,440 | 703,044 |
Ethan Allen Interiors, Inc. (a) | | 3,750 | 132,525 |
Flexsteel Industries, Inc. | | 20,710 | 317,691 |
GameTech International, Inc. (a)* | 13,009 | 158,970 |
Genlyte Group, Inc. (a)* | | 67,043 | 4,729,884 |
Griffon Corp. (a)* | | 187,234 | 4,634,042 |
Herman Miller, Inc. | | 5,770 | 193,237 |
Hooker Furniture Corp. (a) | | 23,269 | 466,543 |
JAKKS Pacific, Inc. (a)* | | 225,800 | 5,396,620 |
La-Z-Boy, Inc. (a) | | 19,570 | 242,277 |
Movado Group, Inc. (a) | | 175,100 | 5,156,695 |
National Presto Industries, Inc. | | 14,390 | 887,000 |
Preformed Line Products Co. (a) | 965 | 35,695 |
RC2 Corp. (a)* | | 193 | 7,795 |
Tredegar Corp. (a) | | 10,280 | 234,281 |
UFP Technologies, Inc. * | | 2,550 | 11,934 |
West Pharmaceutical Services, | | | |
Inc. (a) | | 67,873 | 3,151,343 |
| | | 35,552,563 |
| | | | |
Gas & Other Public Utilities 0.6% | | |
American States Water Co. (a) | | 5,880 | 216,796 |
Artesian Resources Corp., | | | |
Class A | | 6,890 | 141,934 |
Delta Natural Gas Co., Inc. | | 499 | 12,475 |
Energy West, Inc. | | 1,710 | 24,367 |
Florida Public Utilities Co. | | 600 | 7,440 |
See financial notes.
Laudus Funds Annual Report 53
Laudus Rosenberg U.S. Small Capitalization Fund |
Portfolio Holdings continued | | |
| | | |
| | Number of | Value |
Security | | Shares | ($) |
| | | |
Industrial Services of America, | | |
Inc. (a)* | | 1,807 | 12,016 |
RGC Resources, Inc. | | 2,500 | 70,875 |
SJW Corp. (a) | | 30,240 | 1,224,115 |
The Laclede Group, Inc. (a) | 72,850 | 2,264,178 |
Waste Industries USA, Inc. | 43,974 | 1,207,966 |
WGL Holdings, Inc. (a) | | 31,220 | 998,416 |
| | | 6,180,578 |
Health Care & Hospital 1.8% | | | |
Almost Family, Inc. * | | 36,872 | 918,113 |
Amedisys, Inc. * | | 8,456 | 274,228 |
American Shared Hospital | | | |
Services | | 47,400 | 279,660 |
AMERIGROUP Corp. (a)* | | 34,550 | 1,050,320 |
Gentiva Health Services, Inc. * | 64,929 | 1,309,618 |
Hanger Orthopedic Group, Inc. * | 56,853 | 663,475 |
IntegraMed America, Inc. (a)* | 27,516 | 411,364 |
Kindred Healthcare, Inc. (a)* | 113,780 | 3,729,708 |
MedCath Corp. * | | 65,764 | 1,795,357 |
MEDTOX Scientific, Inc. * | 12,950 | 238,280 |
National Dentex Corp. * | | 49,700 | 699,776 |
National Healthcare Corp. (a) | 47,557 | 2,424,456 |
NovaMed, Inc. * | | 63,891 | 414,014 |
Psychemedics Corp. | | 28,614 | 485,007 |
Res-Care, Inc. (a)* | | 189,081 | 3,308,917 |
Sun Healthcare Group, Inc. * | 5,560 | 68,666 |
| | | 18,070,959 |
Information & Services 7.3% | | | |
Ablest, Inc. * | | 2,560 | 18,906 |
Carriage Services, Inc. (a)* | 42,150 | 340,993 |
CDI Corp. (a) | | 116,700 | 3,374,964 |
CPI Corp. (a) | | 10,520 | 552,405 |
Ecology & Environment, Inc. | 25,210 | 299,495 |
Exponent, Inc. (a)* | | 105,200 | 2,098,740 |
Forrester Research, Inc. (a)* | 28,431 | 806,303 |
ICT Group, Inc. (a)* | | 44,667 | 781,672 |
Infinity Pharmaceuticals, Inc. (a)* | 2,700 | 32,508 |
Kelly Services, Inc., Class A (a) | 223,895 | 7,209,419 |
Kendle International, Inc. (a)* | 117,201 | 4,162,980 |
Kforce, Inc. * | | 7,320 | 100,796 |
Layne Christensen Co. (a)* | 56,162 | 2,045,420 |
Metal Management, Inc. | | 143,095 | 6,610,989 |
Monro Muffler Brake, Inc. | | 99,882 | 3,505,858 |
MPS Group, Inc. (a)* | | 824,508 | 11,666,788 |
National Technical Systems, | | |
Inc. * | | 9,626 | 58,430 |
Nobel Learning Communities, | | |
Inc. * | | 4,980 | 75,397 |
Parexel International Corp. (a)* | 154,283 | 5,549,560 |
PDI, Inc. * | | 26,253 | 249,929 |
RCM Technologies, Inc. * | | 103,793 | 740,044 |
Schnitzer Steel Industries, Inc., | | |
Class A (a) | | 175,191 | 7,037,422 |
Security National Financial Corp., | | |
Class A * | | 39,411 | 187,202 |
Spherion Corp. (a)* | | 434,213 | 3,829,759 |
SRI/Surgical Express, Inc. * | 3,322 | 16,743 |
Stewart Enterprises, Inc., | | | |
Class A | | 113,957 | 918,493 |
TeleTech Holdings, Inc. (a)* | 332,800 | 12,210,432 |
| Number of | Value |
Security | Shares | ($) |
| | |
The Geo Group, Inc. * | 1,230 | 55,744 |
Viad Corp. (a) | 4,784 | 184,662 |
Volt Information Sciences, | | |
Inc. (a)* | 12,420 | 325,280 |
VSE Corp. | 8,441 | 347,432 |
Westaff, Inc. (a)* | 5,840 | 33,405 |
| | 75,428,170 |
Instruments 4.4% | | |
1-800 CONTACTS, Inc. (a)* | 1,397 | 23,470 |
Allied Healthcare Products, Inc. * | 78,652 | 476,238 |
Angeion Corp. (a)* | 28,109 | 413,202 |
Astro-Med, Inc. | 14,800 | 162,800 |
Atrion Corp. | 12,770 | 1,172,541 |
Bio-Rad Laboratories, Inc., | | |
Class A * | 28,700 | 2,004,408 |
Bruker BioSciences Corp. (a)* | 159,411 | 1,677,004 |
Cardiac Science Corp. * | 210 | 1,922 |
Cholestech Corp. * | 20,314 | 350,213 |
Coherent, Inc. (a)* | 17,682 | 561,227 |
Datascope Corp. (a) | 145,114 | 5,251,676 |
Enpath Medical, Inc. * | 5,964 | 59,640 |
Esterline Technologies Corp. (a)* | 4,060 | 166,744 |
FEI Co. (a)* | 152,673 | 5,505,388 |
Frequency Electronics, Inc. | 1,450 | 15,834 |
Hurco Cos., Inc. (a)* | 3,190 | 136,692 |
II-VI, Inc. (a)* | 51,671 | 1,749,063 |
Immucor, Inc. (a)* | 221,040 | 6,505,207 |
Input/Output, Inc. (a)* | 100,848 | 1,389,686 |
IntriCon Corp. * | 14,660 | 86,494 |
K-Tron International, Inc. * | 25,210 | 1,808,313 |
Kewaunee Scientific Corp. | 25,868 | 275,494 |
Mesa Laboratories, Inc. | 1,700 | 32,224 |
New Brunswick Scientific Co., | | |
Inc. * | 51,549 | 416,000 |
O.I. Corp. | 29,264 | 335,804 |
Oakley, Inc. (a) | 76,816 | 1,547,074 |
Orthofix International N.V. * | 3,777 | 192,816 |
Perceptron, Inc. * | 41,657 | 374,913 |
Schmitt Industries, Inc. * | 6,864 | 52,304 |
Span-America Medical Systems, | | |
Inc. | 27,300 | 434,343 |
Tollgrade Communications, Inc. * | 4,094 | 51,421 |
Varian, Inc. * | 9,496 | 553,237 |
Viasys Healthcare, Inc. * | 273,560 | 9,298,304 |
Vicon Industries, Inc. * | 35,120 | 349,444 |
Zoll Medical Corp. (a)* | 38,504 | 1,026,132 |
Zygo Corp. * | 5,686 | 91,033 |
Insurance 8.1% | | |
Affirmative Insurance Holdings, | | |
Inc. | 6,333 | 109,561 |
American Equity Investment Life | | |
Holding Co. (a) | 77,852 | 1,022,197 |
American Physicians Service | | |
Group, Inc. * | 22,300 | 393,483 |
American Safety Insurance | | |
Holdings Ltd. * | 76,900 | 1,465,714 |
Argonaut Group, Inc. (a)* | 53,751 | 1,739,382 |
Delphi Financial Group, Inc., | | |
Class A | 358,125 | 14,407,369 |
54 Laudus Funds Annual Report
See financial notes.
Laudus Rosenberg U.S. Small Capitalization Fund |
| Number of | Value |
Security | Shares | ($) |
| | |
FBL Financial Group, Inc., | | |
Class A | 42,089 | 1,646,943 |
FPIC Insurance Group, Inc. (a)* | 83,400 | 3,725,478 |
Great American Financial | | |
Resources, Inc. (a) | 84,200 | 2,061,216 |
Hallmark Financial Services, | | |
Inc. * | 6,562 | 79,006 |
Harleysville Group, Inc. (a) | 22,319 | 725,144 |
Horace Mann Educators Corp. | 402,421 | 8,269,752 |
IPC Holdings Ltd. (a) | 307,576 | 8,873,568 |
Kansas City Life Insurance | | |
Co. (a) | 38,701 | 1,741,545 |
LandAmerica Financial Group, | | |
Inc. (a) | 88,698 | 6,555,669 |
Max Re Capital Ltd. | 290,910 | 7,412,387 |
Meadowbrook Insurance Group, | | |
Inc. (a)* | 26,950 | 296,180 |
Mercer Insurance Group, Inc. | 16,687 | 331,904 |
National Western Life Insurance | | |
Co., Class A * | 24,363 | 5,964,062 |
NYMAGIC, Inc. (a) | 31,310 | 1,279,013 |
Ohio Casualty Corp. | 950 | 28,453 |
Presidential Life Corp. | 91,863 | 1,811,538 |
RTW, Inc. (a)* | 36,000 | 294,120 |
SCPIE Holdings, Inc. (a)* | 4,300 | 97,610 |
Selective Insurance Group, | | |
Inc. (a) | 102,434 | 2,607,970 |
The Midland Co. (a) | 5,166 | 219,142 |
The Phoenix Cos., Inc. | 96,637 | 1,341,322 |
Unico American Corp. * | 50,686 | 642,192 |
United America Indemnity Ltd., | | |
Class A * | 222,190 | 5,154,808 |
Wesco Financial Corp. | 3,500 | 1,610,000 |
Zenith National Insurance | | |
Corp. (a) | 11,420 | 539,823 |
| | 82,446,551 |
IT Hardware 6.1% | | |
AMIS Holdings, Inc. * | 77,920 | 853,224 |
Amtech Systems, Inc. * | 18,980 | 138,174 |
Avocent Corp. (a)* | 99,343 | 2,679,281 |
Axcelis Technologies, Inc. (a)* | 4 | 31 |
CTS Corp. (a) | 23,900 | 330,298 |
Cymer, Inc. (a)* | 40,468 | 1,681,445 |
Digi International, Inc. * | 106,385 | 1,351,089 |
EMS Technologies, Inc. * | 133,302 | 2,568,730 |
Espey Manufacturing & | | |
Electronics Corp. | 21,600 | 424,440 |
Exar Corp. (a)* | 248,117 | 3,285,069 |
Globecomm Systems, Inc. * | 50,780 | 543,346 |
Harmonic, Inc. * | 19,801 | 194,446 |
Imation Corp. | 259,730 | 10,487,897 |
inTEST Corp. * | 9,170 | 41,265 |
Kimball International, Inc., | | |
Class B | 2,041 | 39,350 |
Lattice Semiconductor Corp. * | 105,047 | 614,525 |
Merix Corp. (a)* | 134,189 | 1,103,034 |
Merrimac Industries, Inc. * | 33,600 | 323,904 |
MKS Instruments, Inc. (a)* | 282,773 | 7,216,367 |
Oplink Communications, Inc. * | 76,544 | 1,375,496 |
Orbital Sciences Corp. (a)* | 40,870 | 765,904 |
Pericom Semiconductor Corp. * | 80,495 | 787,241 |
| | Number of | Value |
Security | | Shares | ($) |
| | | |
RF Micro Devices, Inc. (a)* | | 1,169,314 | 7,284,826 |
Rudolph Technologies, Inc. (a)* | | 158,589 | 2,765,792 |
Semitool, Inc. (a)* | | 168,552 | 2,191,176 |
SonicWALL, Inc. (a)* | | 36,309 | 303,543 |
Spectrum Control, Inc. * | | 95,516 | 1,174,847 |
Standard Microsystems | | | |
Corp. (a)* | | 105,865 | 3,233,117 |
Symmetricom, Inc. * | | 6,220 | 51,626 |
Technitrol, Inc. (a) | | 308,000 | 8,066,520 |
TriQuint Semiconductor, Inc. * | | 23,060 | 115,300 |
ViaSat, Inc. (a)* | | 7,370 | 242,989 |
White Electronic Designs Corp. * | 450 | 2,997 |
| | | 62,237,289 |
Land & Water Transportation 1.0% | | | |
B & H Ocean Carriers Ltd. * | | 10,410 | 190,503 |
GulfMark Offshore, Inc. (a)* | | 57,920 | 2,528,208 |
Hub Group, Inc., Class A * | | 119,247 | 3,456,971 |
International Shipholding Corp. * | 2,310 | 42,412 |
Pacer International, Inc. (a) | | 43,160 | 1,162,730 |
Saia, Inc. (a)* | | 96 | 2,280 |
Trico Marine Services, Inc. (a)* | | 54,658 | 2,036,557 |
U.S. Xpress Enterprises, Inc., | | | |
Class A (a)* | | 26,075 | 450,054 |
Werner Enterprises, Inc. (a) | | 400 | 7,268 |
| | | 9,876,983 |
Mainframe & Minicomputers 0.2% | | | |
Omnicell, Inc. * | | 121,132 | 2,534,081 |
Metal Products & Machinery 5.1% | | | |
Allied Motion Technologies, | | | |
Inc. * | | 44,926 | 287,077 |
Astec Industries, Inc. (a)* | | 20,930 | 842,432 |
Bonso Electronic International, | | | |
Inc. | | 51,296 | 209,801 |
Chicago Rivet & Machine Co. | | 5,110 | 113,187 |
CompX International, Inc. (a) | | 6,610 | 106,619 |
Eastern Co. | | 1,350 | 36,693 |
Electro Scientific Industries, | | | |
Inc. (a)* | | 200 | 3,848 |
EnPro Industries, Inc. (a)* | | 209,137 | 7,539,389 |
Evans & Sutherland Computer | | | |
Corp. * | | 63,701 | 200,658 |
EXX, Inc., Class A * | | 2,200 | 6,930 |
Gerber Scientific, Inc. (a)* | | 141,900 | 1,505,559 |
Hardinge, Inc. | | 85,092 | 2,226,007 |
Kadant, Inc. (a)* | | 57,470 | 1,457,439 |
Material Sciences Corp. * | | 7,310 | 72,954 |
MFRI, Inc. * | | 857 | 15,889 |
Newport Corp. (a)* | | 13,686 | 224,040 |
NN, Inc. (a) | | 9,761 | 121,915 |
North American Galvanizing & | | | |
Coatings, Inc. * | | 7,500 | 38,400 |
P & F Industries, Inc., Class A * | 9,350 | 117,062 |
Q.E.P. Co., Inc. * | | 7,748 | 46,565 |
Regal Beloit Corp. (a) | | 239,960 | 11,129,345 |
Robbins & Myers, Inc. (a) | | 21,170 | 789,429 |
Rofin-Sinar Technologies, | | | |
Inc. (a)* | | 5,702 | 337,444 |
RTI International Metals, Inc. (a)* | 14,740 | 1,341,487 |
Sauer-Danfoss, Inc. (a) | | 2,760 | 83,076 |
See financial notes.
Laudus Funds Annual Report 55
Laudus Rosenberg U.S. Small Capitalization Fund |
Portfolio Holdings continued | | |
| | | |
| | Number of | Value |
Security | | Shares | ($) |
| | | |
SL Industries, Inc. * | | 35,980 | 541,499 |
Standex International Corp. | 88,160 | 2,513,442 |
Tech/Ops Sevcon, Inc. | | 300 | 2,055 |
The Middleby Corp. (a)* | | 17,271 | 2,277,009 |
Twin Disc, Inc. | | 63,000 | 2,690,100 |
Varian Semiconductor Equipment | | |
Associates, Inc. (a)* | | 310 | 16,548 |
Veeco Instruments, Inc. (a)* | 255,427 | 4,980,826 |
Velcro Industries N.V. | | 875 | 15,129 |
Watts Water Technologies, Inc., | | |
Class A | | 2,270 | 86,328 |
Woodward Governor Co. | | 253,722 | 10,445,735 |
| | | 52,421,916 |
Miscellaneous Finance 1.7% | | | |
Cohen & Steers, Inc. (a) | | 35,924 | 1,547,606 |
Knight Capital Group, Inc., | | |
Class A (a)* | | 703,373 | 11,141,428 |
SWS Group, Inc. (a) | | 184,828 | 4,585,583 |
| | | 17,274,617 |
Oil & Coal Resources 0.5% | | |
Mariner Energy, Inc. (a)* | | 211,844 | 4,052,576 |
PrimeEnergy, Corp. (a)* | | 6,800 | 395,488 |
Rosetta Resources, Inc. (a)* | 19,430 | 399,092 |
Teton Energy Corp. * | | 21,468 | 103,905 |
| | | 4,951,061 |
Oil Distribution 1.0% | | | |
Adams Resources & Energy, Inc. | 32,070 | 1,175,686 |
Western Refining, Inc. (a) | 229,511 | 8,955,519 |
| | | 10,131,205 |
Oil Drilling & Services 1.7% | | | |
Atwood Oceanics, Inc. (a)* | 75,560 | 4,434,616 |
Basic Energy Services, Inc. (a)* | 119,820 | 2,791,806 |
Bronco Drilling Co., Inc. (a)* | 16,301 | 270,108 |
Dawson Geophysical Co. (a)* | 54,968 | 2,722,565 |
Global Industries Ltd. (a)* | 114,390 | 2,092,193 |
Lufkin Industries, Inc. (a) | | 70,856 | 3,980,690 |
Oil States International, Inc. * | 31,850 | 1,022,066 |
T-3 Energy Services, Inc * | 2,535 | 51,004 |
W-H Energy Services, Inc. * | 3,275 | 153,074 |
| | | 17,518,122 |
Photo-optical, Micros & Office Machinery 0.4% | |
Baldwin Technology Co., Inc., | | |
Class A * | | 100,427 | 502,135 |
Interphase Corp. (a)* | | 18,740 | 209,138 |
Printronix, Inc. | | 51,505 | 713,344 |
STEC, Inc. (a)* | | 281,460 | 1,981,479 |
VASCO Data Security | | | |
International, Inc. (a)* | | 16,452 | 293,997 |
| | | 3,700,093 |
Publishing, Broadcasting & Cinema 1.1% | | |
Alloy, Inc. * | | 7,070 | 83,992 |
Champion Industries, Inc. | 20,690 | 170,899 |
Consolidated Graphics, Inc. (a)* | 620 | 45,911 |
| | | | |
Franklin Covey Co. (a)* | | 189,350 | 1,495,865 |
Media General, Inc., Class A (a) | 112,430 | 4,290,329 |
Regent Communications, Inc. * | 24,014 | 77,325 |
| Number of | Value |
Security | Shares | ($) |
| | |
Scholastic Corp. * | 92,658 | 2,881,664 |
Source Interlink Cos., Inc. (a)* | 260,720 | 1,749,431 |
Tufco Technologies, Inc. * | 17,915 | 146,365 |
| | 10,941,781 |
Real Estate Development 0.7% | | |
AMREP Corp. (a)* | 29,256 | 2,260,026 |
Avatar Holdings, Inc. (a)* | 36,534 | 2,609,989 |
ILX Resorts, Inc. | 28,300 | 263,190 |
J.W. Mays, Inc. * | 17,100 | 367,650 |
Stratus Properties, Inc. * | 1,440 | 48,413 |
United Capital Corp. * | 7,750 | 264,353 |
Wellsford Real Properties, Inc. * | 27,053 | 211,419 |
| | 6,025,040 |
Real Estate Investment Trusts 6.3% | | |
American Campus Communities, | | |
Inc. (a) | 6,160 | 186,586 |
Ashford Hospitality Trust (a) | 479,346 | 5,723,391 |
Associated Estates Realty | | |
Corp. (a) | 22,680 | 319,561 |
Digital Realty Trust, Inc. (a) | 10,611 | 423,379 |
Eagle Hospitality Properties | | |
Trust, Inc. | 41,223 | 459,636 |
Extra Space Storage, Inc. (a) | 20,210 | 382,777 |
Franklin Street Properties | | |
Corp. (a) | 9,910 | 190,074 |
Gladstone Commercial Corp. | 3,560 | 71,378 |
Highland Hospitality Corp. (a) | 461,320 | 8,211,496 |
Innkeepers USA Trust | 8,910 | 145,055 |
LaSalle Hotel Properties (a) | 160,671 | 7,448,708 |
LTC Properties, Inc. (a) | 187,670 | 4,862,530 |
Medical Properties Trust, Inc. (a) | 122,354 | 1,797,380 |
Mission West Properties, Inc. | 113,700 | 1,644,102 |
Monmouth Capital Corp. | 930 | 5,143 |
Monmouth Real Estate | | |
Investment Corp., Class A | 28,300 | 243,946 |
National Health Investors, Inc. (a) | 99,234 | 3,109,994 |
National Retail Properties, Inc. | 262,856 | 6,358,487 |
One Liberty Properties, Inc. | 17,900 | 408,299 |
Presidential Realty Corp., Class B | 650 | 4,891 |
Republic Property Trust | 65,310 | 750,412 |
Spirit Finance Corp. | 355,773 | 5,301,018 |
Strategic Hotel & Resorts, | | |
Inc. (a) | 176,464 | 4,035,732 |
Sunstone Hotel Investors, Inc. | 301,683 | 8,223,879 |
Supertel Hospitality, Inc. | 61,059 | 465,880 |
Winston Hotels, Inc. * | 82,071 | 1,233,527 |
Winthrop Realty Trust | 268,250 | 1,773,132 |
| | 63,780,393 |
Restaurants, Hotels & Theaters 3.3% | | |
Analogic Corp. | 720 | 45,274 |
Ark Restaurants Corp. | 29,872 | 1,011,765 |
Avalon Holdings Corp., Class A * | 1,360 | 10,839 |
Benihana, Inc. * | 10,604 | 299,563 |
Benihana, Inc., Class A * | 66,609 | 1,887,699 |
Bob Evans Farms, Inc. (a) | 192,590 | 7,116,200 |
Buffalo Wild Wings, Inc. (a)* | 2,343 | 149,249 |
CBRL Group, Inc. (a) | 102,782 | 4,758,807 |
CEC Entertainment, Inc. * | 1,620 | 67,295 |
Churchill Downs, Inc. (a) | 1,640 | 74,440 |
56 Laudus Funds Annual Report
See financial notes.
Laudus Rosenberg U.S. Small Capitalization Fund |
| Number of | Value |
Security | Shares | ($) |
| | |
Friendly Ice Cream Corp. (a)* | 18,220 | 270,931 |
Frisch’s Restaurants, Inc. | 27,500 | 1,031,250 |
Interstate Hotels & Resorts, | | |
Inc. * | 207,290 | 1,308,000 |
J. Alexander’s Corp. | 28,530 | 315,256 |
Live Nation, Inc. (a)* | 171,850 | 3,791,011 |
Marcus Corp. | 141,000 | 3,279,660 |
Max & Erma’s Restaurants, | | |
Inc. * | 4,223 | 38,007 |
Mexican Restaurants, Inc. * | 4,060 | 38,935 |
Nathan’s Famous, Inc. * | 35,277 | 529,155 |
Red Lion Hotels Corp. * | 570 | 7,091 |
Silverleaf Resorts, Inc. * | 7,300 | 33,872 |
Speedway Motorsports, Inc. | 2,050 | 79,438 |
Star Buffet, Inc. | 8,323 | 69,497 |
The Steak n Shake Co. (a)* | 75,730 | 1,269,992 |
Trump Entertainment Resorts, | | |
Inc. (a)* | 14 | 253 |
Vail Resorts, Inc. (a)* | 67,387 | 3,661,136 |
WMS Industries, Inc. * | 68,113 | 2,672,754 |
| | 33,817,369 |
Retail 5.0% | | |
1-800-FLOWERS.COM, Inc., | | |
Class A (a)* | 259,953 | 2,022,434 |
Books-A-Million, Inc. (a) | 947 | 13,485 |
Cabela’s, Inc. * | 15,850 | 393,239 |
Cash America International, | | |
Inc. (a) | 59,621 | 2,444,461 |
Charlotte Russe Holding, Inc. (a)* | 86,398 | 2,494,310 |
Charming Shoppes, Inc. (a)* | 12,036 | 155,866 |
Collegiate Pacific, Inc. (a) | 45,230 | 352,794 |
Cost-U-Less, Inc. * | 38,049 | 342,061 |
EZCORP, Inc., Class A (a)* | 322,473 | 4,750,027 |
First Cash Financial Services, | | |
Inc. * | 12,810 | 285,407 |
Gottschalks, Inc. (a)* | 35,030 | 499,878 |
GSI Commerce, Inc. (a)* | 12,767 | 288,407 |
Hastings Entertainment, Inc. * | 81,590 | 497,699 |
Haverty Furniture Cos., Inc. (a) | 113,134 | 1,583,876 |
Insight Enterprises, Inc. (a)* | 186,747 | 3,357,711 |
Jennifer Convertibles, Inc. * | 9,280 | 43,245 |
Longs Drug Stores Corp. (a) | 116,293 | 6,005,371 |
Mothers Work, Inc. (a)* | 3,434 | 113,803 |
Restoration Hardware, Inc. (a)* | 260,753 | 1,710,540 |
Retail Ventures, Inc. (a)* | 20,630 | 434,261 |
REX Stores Corp. * | 51,540 | 843,194 |
Ruddick Corp. (a) | 15,310 | 460,525 |
Rush Enterprises, Inc., | | |
Class A (a)* | 88,253 | 1,695,340 |
Rush Enterprises, Inc., Class B * | 12,100 | 219,131 |
Shoe Carnival, Inc. * | 15,068 | 501,764 |
Spartan Stores, Inc. | 168,244 | 4,508,939 |
Sport Chalet, Inc., Class A * | 55,408 | 603,393 |
Sport Chalet, Inc., Class B * | 4,499 | 48,567 |
Stage Stores, Inc. | 115,824 | 2,699,857 |
Systemax, Inc. (a)* | 37,588 | 704,023 |
The Bon-Ton Stores, Inc. (a) | 51,900 | 2,918,856 |
The Great Atlantic & Pacific Tea | | |
Co., Inc. (a)* | 153,520 | 5,093,794 |
Trans World Entertainment | | |
Corp. * | 34,268 | 194,642 |
| | Number of | Value |
Security | | Shares | ($) |
| | | |
Village Super Market, Inc., | | |
Class A (a) | | 17,092 | 1,632,115 |
Weis Markets, Inc. (a) | | 33,900 | 1,515,330 |
| | | 51,428,345 |
Soaps & Cosmetics 0.0% | | | |
Cascade International, | | | |
Inc. (a)(b)(c)* | | 39,200 | — |
Software 7.8% | | | |
Allscripts Healthcare Solutions, | | |
Inc. (a)* | | 153,350 | 4,111,313 |
American Software, Inc., | | |
Class A (a) | | 221,600 | 1,783,880 |
Ansoft Corp. (a)* | | 91,080 | 2,881,771 |
Aspen Technology, Inc. (a)* | 68,100 | 885,300 |
Black Box Corp. (a) | | 168,550 | 6,158,817 |
Blackbaud, Inc. (a) | | 1,116 | 27,253 |
Captaris, Inc. (a)* | | 181,333 | 1,049,918 |
CIBER, Inc. (a)* | | 98,220 | 772,991 |
Computer Task Group, Inc. * | 61,378 | 276,815 |
CSP, Inc. (a)* | | 19,892 | 183,603 |
Edgewater Technology, Inc. (a)* | 111,194 | 938,477 |
Goldleaf Financial Solutions, | | |
Inc. * | | 18,800 | 123,704 |
Harris Interactive, Inc. (a)* | 213,300 | 1,286,199 |
HMS Holdings Corp. (a)* | 926 | 20,279 |
Inforte Corp. * | | 27,245 | 94,540 |
Interwoven, Inc. * | | 2,240 | 37,856 |
Keynote Systems, Inc. * | 940 | 12,615 |
Lawson Software, Inc. (a)* | 324,231 | 2,623,029 |
Lightbridge, Inc. * | | 115,724 | 2,033,271 |
Mentor Graphics Corp. (a)* | 674,800 | 11,026,232 |
Moldflow Corp. * | | 91,950 | 1,382,008 |
Move, Inc. * | | 92,170 | 510,622 |
Ness Technologies, Inc. (a)* | 21,474 | 274,438 |
NetManage, Inc. * | | 13,856 | 72,744 |
NetScout Systems, Inc. (a)* | 87,319 | 790,237 |
PC-Tel, Inc. * | | 148,770 | 1,512,991 |
Perficient, Inc. (a)* | | 61,622 | 1,218,883 |
Perot Systems Corp., | | | |
Class A (a)* | | 715,100 | 12,778,837 |
Quality Systems, Inc. (a)* | 28,200 | 1,128,000 |
Quest Software, Inc. (a)* | 350 | 5,695 |
SAVVIS, Inc. (a)* | | 206,304 | 9,877,836 |
Smith Micro Software, Inc. (a)* | 116,707 | 2,174,251 |
SPSS, Inc. (a)* | | 114,017 | 4,116,014 |
Sybase, Inc. (a)* | | 77,160 | 1,950,605 |
Syntel, Inc. (a) | | 15,749 | 545,703 |
Taleo Corp., Class A (a)* | 114,580 | 1,899,736 |
Technology Solutions Co. * | 2,559 | 19,986 |
TechTeam Global, Inc. * | 21,882 | 273,525 |
The TriZetto Group, Inc. (a)* | 72,436 | 1,449,444 |
THQ, Inc. * | | 17,056 | 583,145 |
TSR, Inc. | | 51,100 | 215,642 |
| | | 79,108,205 |
Textiles & Apparel 3.7% | | | |
Crocs, Inc. * | | 12,000 | 567,000 |
Culp, Inc. * | | 53,280 | 377,222 |
Cutter & Buck, Inc. | | 6,724 | 79,679 |
Deckers Outdoor Corp. * | 49,850 | 3,540,347 |
See financial notes.
Laudus Funds Annual Report 57
Laudus Rosenberg U.S. Small Capitalization Fund |
Portfolio Holdings continued | | |
| | |
| Number of | Value |
Security | Shares | ($) |
| | |
Decorator Industries, Inc. | 710 | 4,970 |
G-III Apparel Group Ltd. (a)* | 75,640 | 1,440,942 |
Guess?, Inc. | 244,900 | 9,916,001 |
Hallwood Group, Inc. (a)* | 1,331 | 139,090 |
Interface, Inc., Class A | 350,800 | 5,609,292 |
LaCrosse Footwear, Inc. * | 1,188 | 18,295 |
Skechers U.S.A., Inc., Class A * | 71,390 | 2,396,562 |
Steven Madden Ltd. (a)* | 145,039 | 4,235,139 |
Stride Rite Corp. (a) | 80,480 | 1,238,587 |
The Gymboree Corp. * | 147,350 | 5,904,315 |
UniFirst Corp. (a) | 56,860 | 2,181,718 |
Weyco Group, Inc. | 1,673 | 43,465 |
| | 37,692,624 |
Wholesale 2.6% | | |
Agilysys, Inc. (a) | 18,860 | 423,784 |
Applied Industrial Technologies, | | |
Inc. (a) | 16,365 | 401,597 |
Bell Microproducts, Inc. (a)* | 1,385 | 8,864 |
Brown Shoe Co., Inc. (a) | 285,870 | 12,006,540 |
Coast Distribution System, Inc. | 28,890 | 223,898 |
Delta Apparel, Inc. | 43,940 | 764,556 |
Huttig Building Products, Inc. * | 10,690 | 64,675 |
IKON Office Solutions, Inc. (a) | 164,810 | 2,368,320 |
Industrial Distribution Group, | | |
Inc. * | 97,800 | 1,221,522 |
Kaman Corp. | 9,140 | 213,053 |
Lawson Products, Inc. (a) | 1,208 | 45,759 |
Man Sang Holdings, Inc. * | 200 | 1,200 |
NACCO Industries, Inc., | | |
Class A (a) | 46,415 | 6,377,885 |
Nu Horizons Electronics | | |
Corp. (a)* | 41,750 | 439,627 |
Nu Skin Enterprises, Inc., | | |
Class A (a) | 290 | 4,791 |
Park-Ohio Holdings Corp. * | 600 | 11,100 |
Richardson Electronics Ltd. | 24,740 | 231,072 |
TESSCO Technologies, Inc. * | 43,821 | 1,191,493 |
Traffix, Inc. | 1,160 | 6,426 |
| | 26,006,162 |
Total Common Stock (Cost $767,896,335) | | 1,010,613,511 |
| | | |
Security | Face Amount | Value |
Rate, Maturity Date | ($) | ($) |
| | |
Short-Term Investment 0.0% of net assets | |
| | |
Repurchase Agreement 0.0% | | |
Fixed Income Clearing Corp. | | |
dated 03/30/07, due 04/02/07 | | |
at 5.00%, with a maturity | | |
value of $501,209 (fully | | |
collateralized by Federal | | |
National Mortgage Association | | |
with a value of $513,825.) | 501,000 | 501,000 |
Total Short-Term Investment | | |
(Cost $501,000) | | 501,000 |
| | |
End of Investments. | | |
| | |
At 03/31/07 the tax basis cost of the fund’s investments was |
$768,875,666 and the unrealized gains and losses were | |
$257,598,744 and ($15,359,899), respectively, with a net | |
unrealized appreciation of $242,238,845. | |
| | Number of | Value |
Security | Shares | ($) |
| | | |
Collateral Invested for Securities on Loan 8.9% of net assets |
| | | |
State Street Navigator Security | | |
Lending Prime Portfolio | 90,803,224 | 90,803,224 |
| | | |
End of collateral invested for securities on loan. | |
| | | |
* | Non-income producing security. | | |
(a) | All or a portion of this security is on loan. | |
(b) | Fair-valued by management. | | |
(c) | Bankrupt security/delisted. | | |
| | | | | | | | |
58 Laudus Funds Annual Report
See financial notes.
Laudus Rosenberg International Equity Fund |
Portfolio Holdings as of March 31, 2007 | |
| | | |
| | Cost | Value |
Holdings by Category | ($) | ($) |
| | | |
97.9% | Common Stock | 107,410,263 | 127,031,334 |
—% | Rights | — | — |
97.9% | Total Investments | 107,410,263 | 127,031,334 |
2.1% | Other Assets and | | |
| Liabilities | | 2,777,720 |
100.0% | Net Assets | | 129,809,054 |
| | | Number of | Value |
Security | | | Shares | ($) |
| | | | |
Common Stock 97.9% of net assets | | |
| | | | |
Australia 5.7% | | | | |
| | | | |
Airlines 0.1% | | | | |
Qantas Airways Ltd. | | | 50,100 | 212,112 |
Banks & Credit Institutions 2.0% | | | |
Australia and New Zealand Banking | | |
Group Ltd. | | | 31,100 | 746,297 |
Commonwealth Bank of Australia | 18,400 | 747,085 |
National Australia Bank Ltd. | | 26,100 | 851,181 |
St. George Bank Ltd. | | | 2,100 | 59,385 |
Westpac Banking Corp. | | | 6,800 | 144,798 |
| | | | 2,548,746 |
Basic Minerals & Metals 1.5% | | | |
BHP Billiton Ltd. | | | 22,600 | 547,438 |
BlueScope Steel Ltd. | | | 25,300 | 214,595 |
Felix Resources Ltd. | | | 8,500 | 34,291 |
Independence Group NL | | | 6,100 | 24,448 |
Jabiru Metals Ltd. * | | | 5,700 | 5,714 |
Jubilee Mines NL | | | 6,700 | 94,584 |
Kagara Zinc Ltd. | | | 3,200 | 13,245 |
Minara Resources Ltd. | | | 20,200 | 120,264 |
Mincor Resources NL | | | 7,600 | 18,818 |
OneSteel Ltd. | | | 18,785 | 78,245 |
Perilya Ltd. | | | 10,900 | 31,782 |
Rio Tinto Ltd. | | | 7,800 | 496,428 |
Sally Malay Mining Ltd. * | | | 9,600 | 30,488 |
Smorgon Steel Group Ltd. | | | 22,680 | 37,376 |
Zinifex Ltd. | | | 20,600 | 262,185 |
| | | | 2,009,901 |
Beer, Liquor, & Tobacco 0.0% | | | |
Foster’s Group Ltd. | | | 6,000 | 33,192 |
Lion Nathan Ltd. | | | 2,500 | 17,879 |
| | | | 51,071 |
Cellular & Wireless 0.3% | | | | |
Telstra Corp., Ltd. | | | 91,000 | 343,317 |
Construction & | | | | |
Homebuilding 0.1% | | | | |
Leighton Holdings Ltd. | | | 6,000 | 162,503 |
Construction Materials 0.0% | | | |
Adelaide Brighton Ltd. | | | 5,800 | 16,069 |
Information & Services 0.0% | | | |
WorleyParsons Ltd. | | | 2,000 | 44,567 |
| | Number of | Value |
Security | | Shares | ($) |
| | | |
Insurance 0.3% | | | |
Insurance Australia Group Ltd. | 8,500 | 40,261 |
QBE Insurance Group Ltd. | | 6,900 | 175,743 |
Suncorp-Metway Ltd. | | 7,893 | 132,532 |
| | | 348,536 |
Miscellaneous Finance 0.1% | | |
ASX Ltd. | | 2,500 | 88,827 |
Oil Distribution 0.0% | | | |
Caltex Australia Ltd. | | 700 | 13,467 |
Publishing, Broadcasting & | | |
Cinema 0.1% | | | |
West Australian Newspapers | | |
Holdings Ltd. | | 6,100 | 77,013 |
Real Estate Development0.2% | | | |
Lend Lease Corp., Ltd. | | 13,700 | 221,190 |
Real Estate Investment | | | |
Trusts 0.2% | | | |
Westfield Group | | 15,100 | 250,918 |
Restaurants, Hotels & | | | |
Theaters 0.2% | | | |
Amalgamated Holdings Ltd. | 2,575 | 13,520 |
TABCORP Holdings Ltd. | | 17,700 | 236,094 |
| | | 249,614 |
Retail 0.5% | | | |
Coles Group Ltd. | | 1,600 | 21,006 |
Goodman Fielder Ltd. | | 39,600 | 78,158 |
Woolworths Ltd. | | 23,800 | 522,646 |
| | | 621,810 |
Wholesale 0.1% | | | |
Sims Group Ltd. | | 5,300 | 99,904 |
| | | 7,359,565 |
Austria 0.9% | | | |
| | | |
Basic Minerals & Metals 0.1% | | | |
Boehler-Uddeholm AG | | 164 | 15,803 |
Voestalpine AG | | 1,212 | 87,944 |
| | | 103,747 |
Communications Utilities 0.4% | | | |
Telekom Austria AG | | 20,000 | 502,548 |
Forest Products & Paper 0.0% | | | |
Mayr-Melnhof Karton AG | | 103 | 22,993 |
Real Estate Development 0.4% | | | |
Conwert Immobilien Invest AG * | 2,210 | 48,624 |
Immofinanz Immobilien Analagen | | |
AG * | | 28,000 | 450,300 |
| | | 498,924 |
| | | 1,128,212 |
See financial notes.
Laudus Funds Annual Report 59
Laudus Rosenberg International Equity Fund |
Portfolio Holdings continued | | |
| | | | |
| | | Number of | Value |
Security | | | Shares | ($) |
| | | | |
Belgium 1.8% | | | | |
| | | | |
Banks & Credit Institutions 1.3% | | | |
Fortis | | | 36,400 | 1,663,599 |
Instruments 0.1% | | | | |
Agfa Gevaert N.V. | | | 8,000 | 181,099 |
Restaurants, Hotels & | | | | |
Theaters 0.0% | | | | |
S.A. D’Ieteren N.V. | | | 117 | 48,202 |
Retail 0.4% | | | | |
Delhaize Group | | | 4,800 | 442,935 |
| | | | 2,335,835 |
China 0.1% | | | | |
| | | | |
Miscellaneous Finance 0.1% | | | |
BOC Hong Kong (Holdings) Ltd. | 32,000 | 77,431 |
Denmark 0.9% | | | | |
| | | | |
Banks & Credit Institutions 0.7% | | | |
Danske Bank A/S | | | 19,477 | 902,914 |
Beer, Liquor, & Tobacco 0.2% | | | |
Carlsberg A/S | | | 2,418 | 262,692 |
| | | | 1,165,606 |
Finland 1.0% | | | | |
| | | | |
Basic Minerals & Metals 0.2% | | | |
Outokumpu Oyj | | | 7,200 | 247,829 |
Chemicals & Rubber 0.1% | | | | |
Kemira Oyj | | | 8,967 | 205,225 |
Forest Products & Paper 0.4% | | | |
UPM-Kymmene Oyj | | | 21,692 | 554,090 |
IT Hardware 0.3% | | | | |
Elcoteq Network Corp., Class A | 1,600 | 16,873 |
Nokia Oyj | | | 14,291 | 329,294 |
| | | | 346,167 |
| | | | 1,353,311 |
France 10.6% | | | | |
| | | | |
Airlines 0.3% | | | | |
Air France-KLM | | | 8,400 | 384,202 |
Autos 1.2% | | | | |
PSA Peugeot Citroen | | | 9,600 | 676,885 |
Renault S.A. | | | 7,300 | 855,546 |
Societe Fonciere Financiere et de | | |
Participations (FFP) | | | 270 | 74,252 |
| | | | 1,606,683 |
Banks & Credit Institutions 1.1% | | | |
BNP Paribas | | | 11,800 | 1,234,223 |
Societe Generale | | | 1,000 | 172,909 |
| | | | 1,407,132 |
Basic Minerals & Metals 0.0% | | | |
Nexans S.A. | | | 280 | 37,259 |
Cellular & Wireless 1.1% | | | | |
Vivendi | | | 36,000 | 1,467,221 |
| | | | | Number of | Value |
Security | | | | | Shares | ($) |
| | | | | | |
Chemicals & Rubber 0.6% | | | | | |
Compagnie Generale des | | | | | |
Etablissements Michelin, Class B | 6,600 | 729,717 |
Communications Utilities 0.6% | | | |
France Telecom S.A. | | | | 28,800 | 763,168 |
Construction Materials 0.9% | | | | |
Ciments Francais S.A. | | | | 417 | 88,758 |
Compagnie de Saint-Gobain | | | 10,400 | 1,021,092 |
| | | | | | 1,109,850 |
Drugs & Pharmaceuticals 1.2% | | | |
Sanofi-Aventis | | | | | 18,566 | 1,615,505 |
Insurance 0.3% | | | | | | |
CNP Assurances | | | | | 3,456 | 404,434 |
Integrated Oil Companies 0.5% | | | |
Total S.A. | | | | | 8,700 | 607,790 |
IT Hardware 0.5% | | | | | | |
Alcatel-Lucent | | | | | 32,000 | 378,050 |
STMicroelectronics N.V. | | | | 12,423 | 239,209 |
| | | | | | 617,259 |
Metal Products & Machinery 0.1% | | | |
Valeo S.A. | | | | | 3,200 | 188,235 |
Miscellaneous Finance 1.0% | | | | |
Credit Agricole S.A. | | | | | 24,800 | 969,363 |
Natixis | | | | | 12,101 | 296,218 |
| | | | | | 1,265,581 |
Publishing, Broadcasting & | | | |
Cinema 0.0% | | | | | | |
Havas S.A. | | | | | 1,726 | 9,984 |
Real Estate Development 0.0% | | | |
Fonciere des Regions | | | | 66 | 12,409 |
Nexity | | | | | 142 | 12,201 |
| | | | | | 24,610 |
Restaurants, Hotels & | | | | | |
Theaters 0.5% | | | | | | |
Club Mediterranee S.A. * | | | 3,000 | 176,378 |
Pierre & Vacances | | | | | 800 | 110,253 |
Sodexho Alliance S.A. | | | | 4,800 | 352,257 |
| | | | | | 638,888 |
Software 0.2% | | | | | | |
Atos Origin S.A. * | | | | | 2,217 | 149,250 |
Cap Gemini S.A. | | | | | 900 | 68,502 |
| | | | | | 217,752 |
Textiles & Apparel 0.5% | | | | | |
Christian Dior S.A. | | | | | 5,400 | 658,431 |
| | | | | | 13,753,701 |
Germany 7.2% | | | | | | |
| | | | | | |
Autos 1.6% | | | | | | |
DaimlerChrysler AG— Reg’d | | | | 23,400 | 1,914,475 |
Volkswagen AG | | | | | 1,105 | 165,835 |
| | | | | | 2,080,310 |
Basic Minerals & Metals 0.3% | | | |
ThyssenKrupp AG | | | | | 8,700 | 431,861 |
60 Laudus Funds Annual Report
See financial notes.
Laudus Rosenberg International Equity Fund |
| | | | Number of | Value |
Security | | | | Shares | ($) |
| | | | | |
Chemicals & Rubber 2.0% | | | | | |
BASF AG | | | | 5,000 | 562,635 |
Bayer AG | | | | 25,877 | 1,656,824 |
Lanxess * | | | | 6,000 | 310,414 |
| | | | | 2,529,873 |
Drugs & Pharmaceuticals 0.1% | | | |
Altana AG | | | | 1,200 | 78,053 |
Electric Utilities 1.0% | | | | | |
E.ON AG | | | | 9,846 | 1,340,374 |
Government Aircraft & | | | | | |
Defense 0.0% | | | | | |
Rheinmetall AG | | | | 129 | 12,042 |
Insurance 0.2% | | | | | |
Allianz AG — Reg’d | | | | 1,400 | 286,426 |
IT Hardware 0.5% | | | | | |
Infineon Technologies AG * | | | 41,000 | 638,478 |
Metal Products & Machinery 0.2% | | | |
Siemens AG — Reg’d | | | | 2,800 | 299,880 |
Miscellaneous Finance 1.3% | | | | |
Deutsche Bank AG — Reg’d | | | | 12,500 | 1,683,167 |
| | | | | 9,380,464 |
Greece 0.4% | | | | | |
| | | | | |
Agriculture, Food & | | | | | |
Beverage 0.2% | | | | | |
Coca Cola Hellenic Bottling Co., S.A. | 7,358 | 310,542 |
Banks & Credit Institutions 0.1% | | | |
Bank of Greece | | | | 479 | 62,696 |
Communications Utilities 0.1% | | | |
Hellenic Telecommunications | | | |
Organization S.A. (OTE) * | | | 4,500 | 122,748 |
| | | | | 495,986 |
Hong Kong 1.8% | | | | | |
| | | | | |
Banks & Credit Institutions 0.2% | | | |
Hang Seng Bank Ltd. | | | | 15,600 | 221,616 |
Basic Minerals & Metals 0.0% | | | |
China Oriental Group Co., Ltd. | | 110,000 | 36,356 |
Communications Utilities 0.1% | | | |
PCCW Ltd. | | | | 157,000 | 94,179 |
Electric Utilities 0.3% | | | | | |
CLP Holdings Ltd. | | | | 54,500 | 398,093 |
Hongkong Electric Holdings Ltd. | 5,500 | 28,200 |
| | | | | 426,293 |
Land & Water | | | | | |
Transportation 0.0% | | | | | |
Transport International Holdings Ltd. | 400 | 2,171 |
Miscellaneous Finance 0.2% | | | | |
Guoco Group Ltd. | | | | 10,000 | 140,569 |
Jardine Strategic Holdings Ltd. | | 11,000 | 141,247 |
| | | | | 281,816 |
Real Estate Development 0.9% | | | |
Cheung Kong (Holdings) Ltd. | | 24,000 | 303,414 |
Great Eagle Holdings Ltd. | | | 14,000 | 47,305 |
| | | | | | |
| | | Number of | Value |
Security | | | Shares | ($) |
| | | | |
Hang Lung Group Ltd. | | | 37,000 | 130,683 |
Hang Lung Properties Ltd. | | 78,000 | 216,547 |
Henderson Investment Ltd. | | 1,909 | 3,892 |
Henderson Land Development Co., | | |
Ltd. | | | 28,000 | 163,265 |
Hopson Development Holdings Ltd. | 12,000 | 30,007 |
Kerry Properties Ltd. | | | 23,500 | 120,524 |
New World Development Co., Ltd. | 3,000 | 6,775 |
Pacific Century Premium | | | | |
Developments Ltd. | | | 115,000 | 36,347 |
Swire Pacific Ltd. | | | 2,500 | 28,041 |
Wheelock & Co., Ltd. | | | 61,000 | 136,840 |
Wheelock Properties (S) Ltd. | | 5,000 | 5,279 |
| | | | 1,228,919 |
Retail 0.1% | | | | |
Esprit Holdings Ltd. | | | 6,500 | 76,167 |
| | | | 2,367,517 |
Ireland 0.8% | | | | |
| | | | |
Agriculture, Food & | | | | |
Beverage 0.1% | | | | |
Kerry Group plc | | | 2,342 | 65,463 |
Banks & Credit Institutions 0.7% | | | |
Allied Irish Banks plc (AIB) | | 31,500 | 932,438 |
| | | | 997,901 |
Italy 3.7% | | | | |
| | | | |
Autos 0.6% | | | | |
Fiat S.p.A. * | | | 31,327 | 794,082 |
Banks & Credit Institutions 0.2% | | | |
UniCredito Italiano S.p.A. | | | 24,000 | 228,534 |
Chemicals & Rubber 0.2% | | | | |
Pirelli & C. S.p.A. * | | | 200,000 | 221,193 |
Communications Utilities 0.1% | | | |
Telecom Italia S.p.A. | | | 30,000 | 85,714 |
Construction Materials 0.2% | | | |
Italcementi S.p.A. | | | 7,252 | 217,792 |
Italmobiliare S.p.A. | | | 743 | 86,034 |
| | | | 303,826 |
Electric Utilities 0.9% | | | | |
C.I.R. S.p.A. — Compagnie Industriali | | |
Riunite | | | 3,549 | 14,154 |
Edison S.p.A. | | | 53,969 | 156,474 |
Enel S.p.A. | | | 96,194 | 1,030,186 |
| | | | 1,200,814 |
Forest Products & Paper 0.1% | | | |
IFIL-Investments S.p.A. | | | 17,323 | 169,778 |
Gas & Other Public Utilities 0.0% | | | |
Iride S.p.A. | | | 15,770 | 53,418 |
Government Aircraft & | | | | |
Defense 0.5% | | | | |
Finmeccanica S.p.A. | | | 19,200 | 577,143 |
Integrated Oil Companies 0.6% | | | |
Eni S.p.A. | | | 24,500 | 797,277 |
See financial notes.
Laudus Funds Annual Report 61
Laudus Rosenberg International Equity Fund |
Portfolio Holdings continued | | |
| | | |
| | Number of | Value |
Security | | Shares | ($) |
| | | |
Metal Products & Machinery 0.1% | | |
Danieli S.p.A. — Officine | | | |
Meccanishe Danieli & C. | | 4,353 | 102,550 |
Publishing, Broadcasting & | | | |
Cinema 0.1% | | | |
Mondadori (Arnoldo) Editore S.p.A. | 16,000 | 167,376 |
Real Estate Development 0.1% | | |
Immobiliare Lombarda S.p.A. * | 429,535 | 127,308 |
| | | 4,829,013 |
Japan 21.9% | | | |
| | | |
Agriculture, Food & | | | |
Beverage 0.0% | | | |
Mikuni Coca-Cola Bottling Co., Ltd. | 1,700 | 17,769 |
Airlines 0.0% | | | |
Japan Airlines Corp. * | | 3,000 | 6,233 |
Autos 3.5% | | | |
Fuji Heavy Industries Ltd. | | 40,000 | 207,164 |
Futaba Industrial Co., Ltd. | | 1,500 | 36,278 |
HI-LEX Corp. | | 400 | 6,556 |
Honda Motor Co., Ltd. | | 30,100 | 1,048,854 |
Kanto Auto Works Ltd. | | 3,700 | 46,904 |
Kawasaki Heavy Industries Ltd. | 22,000 | 92,803 |
Mazda Motor Corp. | | 6,000 | 33,087 |
Mitsuba Corp. | | 3,000 | 23,447 |
Nissan Motor Co., Ltd. | | 77,200 | 824,758 |
Nissan Shatai Co., Ltd. | | 9,000 | 45,737 |
Suzuki Motor Corp. | | 10,900 | 282,087 |
Topre Corp. | | 2,600 | 23,650 |
Toyota Auto Body Co., Ltd. | | 5,700 | 107,069 |
Toyota Motor Corp. | | 22,400 | 1,434,516 |
Yamaha Motor Co., Ltd. | | 11,800 | 329,580 |
| | | 4,542,490 |
Banks & Credit Institutions 0.6% | | | |
Daishi Bank Ltd. | | 10,000 | 42,256 |
Kagoshima Bank Ltd. | | 2,000 | 14,535 |
Mizuho Financial Group, Inc. | | 74 | 475,352 |
Orient Corp. * | | 1,000 | 1,699 |
San-in Godo Bank Ltd. | | 3,000 | 28,343 |
Shiga Bank Ltd. | | 5,000 | 34,628 |
Takefuji Corp. | | 3,500 | 140,172 |
The Eighteenth Bank Ltd. | | 11,000 | 51,304 |
The Mie Bank Ltd. | | 7,000 | 34,572 |
| | | 822,861 |
Basic Minerals & Metals 2.1% | | | |
JFE Holdings, Inc. | | 10,900 | 643,613 |
Kobe Steel Ltd. | | 117,000 | 470,145 |
Maruichi Steel Tube Ltd. | | 3,900 | 120,946 |
Nakayama Steel Works Ltd. | | 5,000 | 19,218 |
Nippon Steel Corp. | | 118,000 | 828,613 |
Nisshin Steel Co., Ltd. | | 43,000 | 184,814 |
Osaka Steel Co., Ltd. | | 1,700 | 32,503 |
Sumitomo Electric Industries Ltd. | 3,100 | 46,957 |
Sumitomo Metal Mining Co., Ltd. | 14,000 | 269,191 |
Tokyo Steel Manufacturing Co., Ltd. | 700 | 10,297 |
Yodogawa Steel Works Ltd. | | 8,000 | 49,202 |
| | | 2,675,499 |
| | Number of | Value |
Security | | Shares | ($) |
| | | |
Beer, Liquor, & Tobacco 1.0% | | |
Asahi Breweries Ltd. | | 22,600 | 361,980 |
Japan Tobacco, Inc. | | 103 | 504,938 |
Kirin Brewery Co., Ltd. | | 28,000 | 404,164 |
| | | 1,271,082 |
Cellular & Wireless 0.8% | | | |
KDDI Corp. | | 98 | 779,596 |
NTT DoCoMo, Inc. | | 131 | 241,330 |
| | | 1,020,926 |
Chemicals & Rubber 1.5% | | | |
Bridgestone Corp. | | 21,600 | 429,249 |
Dainippon Ink & Chemicals, Inc. | 47,000 | 186,177 |
Kaneka Corp. | | 21,000 | 199,787 |
Mitsubishi Chemical Holdings Corp. | 12,500 | 106,228 |
Mitsui Chemicals, Inc. | | 14,000 | 121,991 |
Sakai Chemical Industry Co., Ltd. | 3,000 | 21,595 |
Sumitomo Chemical Co., Ltd. | 48,000 | 361,718 |
Teijin Ltd. | | 51,000 | 286,642 |
Toagosei Co., Ltd. | | 14,000 | 58,075 |
Tosoh Corp. | | 36,000 | 185,427 |
| | | 1,956,889 |
Communications Utilities 0.6% | | | |
Nippon Telegraph & Telephone Corp. (NTT) | | 150 | 792,359 |
Rakuten, Inc. | | 58 | 27,485 |
| | | 819,844 |
Construction & Homebuilding 0.0% | | | |
Maeda Corp. | | 2,000 | 7,275 |
Nippo Corp. | | 1,000 | 7,755 |
| | | 15,030 |
Construction Materials 0.0% | | | |
Asahi Glass Co., Ltd. | | 1,000 | 14,032 |
Maeda Road Construction Co., Ltd. | 5,000 | 39,411 |
| | | 53,443 |
Consumer Durables 0.8% | | | |
Matsushita Electric Industrial Co., | | |
Ltd. | | 49,000 | 987,568 |
Drugs & Pharmaceuticals 1.0% | | | |
Astellas Pharma, Inc. | | 13,600 | 584,559 |
Cawachi Ltd. | | 1,300 | 35,161 |
Daiichi Sankyo Co., Ltd. | | 10,500 | 321,352 |
Dainippon Sumitomo Pharma Co.,Ltd. | | 4,000 | 42,690 |
Kaken Pharmaceutical Co., Ltd. | 5,000 | 40,679 |
Nippon Shinyaku Co., Ltd. | | 3,000 | 25,277 |
Ono Pharmaceutical Co., Ltd. | 1,300 | 72,747 |
Taisho Pharmaceutical Co., Ltd. | 9,000 | 164,930 |
Torii Pharmaceutical Co., Ltd. | 1,200 | 20,242 |
| | | 1,307,637 |
Electric Utilities 0.6% | | | |
Hokkaido Electric Power Co., Inc. | 9,300 | 246,742 |
Kyushu Electric Power Co., Inc. | 13,400 | 380,880 |
The Chugoku Electric Power Co.,Inc. | | 7,500 | 167,619 |
| | | 795,241 |
| | | | |
62 Laudus Funds Annual Report
See financial notes.
Laudus Rosenberg International Equity Fund |
| | Number of | Value |
Security | | Shares | ($) |
| | | |
Financial Investments 0.6% | | | |
Mitsubishi UFJ Financial Group, Inc. | 67 | 754,870 |
Furniture & Household | | | |
Items 0.3% | | | |
Sankyo Co., Ltd. | | 5,400 | 236,724 |
Sumitomo Bakelite Co., Ltd. | 14,000 | 100,939 |
| | | 337,663 |
Gas & Other Public Utilities 0.4% | | |
Osaka Gas Co., Ltd. | | 93,000 | 360,332 |
Tokyo Gas Co., Ltd. | | 19,000 | 105,603 |
| | | 465,935 |
Government Aircraft & | | | |
Defense 0.0% | | | |
Mitsui Engineering & Shipbuilding | | |
Co., Ltd. | | 3,000 | 12,665 |
Information & Services 0.0% | | | |
Autobacs Seven Co., Ltd. | 300 | 10,721 |
TKC Corp. | | 700 | 12,217 |
| | | 22,938 |
Instruments 0.0% | | | |
Hitachi Medical Corp. | | 2,000 | 20,389 |
Insurance 0.9% | | | |
Millea Holdings, Inc. | | 9,200 | 339,021 |
Mitsui Sumitomo Insurance Co., Ltd. | 42,000 | 525,161 |
Nissay Dowa General Insurance Co., | | |
Ltd. | | 1,000 | 6,349 |
Sompo Japan Insurance, Inc. | 28,000 | 347,733 |
| | | 1,218,264 |
IT Hardware 0.5% | | | |
Alps Electric Co., Ltd. | | 4,500 | 52,548 |
Brother Industries Ltd. | | 4,000 | 54,009 |
Dainippon Screen Mfg. Co., Ltd. | 16,000 | 120,619 |
Japan Aviation Electronics Industry | | |
Ltd. | | 6,000 | 74,690 |
Seiko Epson Corp. | | 7,700 | 226,085 |
Sumitomo Wiring Systems Ltd. | 2,000 | 45,408 |
Toshiba Tec Corp. | | 16,000 | 95,567 |
| | | 668,926 |
Land & Water | | | |
Transportation 0.4% | | | |
Nankai Electric Railway Co., Ltd. | 1,000 | 3,366 |
Nippon Konpo Unyu Soko Co., Ltd. | 4,000 | 55,877 |
Seino Transportation Co., Ltd. | 12,000 | 113,079 |
West Japan Railway Co. | | 75 | 345,700 |
| | | 518,022 |
Metal Products & Machinery 1.0% | | |
Bosch Corp. | | 23,000 | 103,988 |
Fuji Machine Manufacturing Co., | | |
Ltd. | | 2,400 | 38,865 |
Heiwa Corp. | | 2,200 | 27,156 |
Hitachi Construction Machinery Co., | | |
Ltd. | | 2,300 | 61,955 |
Hitachi Ltd. | | 28,000 | 217,637 |
Mitsubishi Heavy Industries Ltd. | 97,000 | 625,497 |
| Number of | Value |
Security | Shares | ($) |
| | |
Sega Sammy Holdings, Inc. | 6,400 | 149,174 |
Sekisui Jushi Corp. | 3,000 | 23,589 |
Toyo Seikan Kaisha Ltd. | 3,000 | 60,266 |
| | 1,308,127 |
Miscellaneous Finance 1.2% | | |
Daiwa Securities Group, Inc. | 38,000 | 456,664 |
Mitsubishi UFJ Securities Co., Ltd. | 28,000 | 318,107 |
Nikko Cordial Corp. | 25,500 | 362,178 |
Okasan Holdings, Inc. | 11,000 | 85,498 |
Shinko Securities Co., Ltd. | 2,000 | 10,081 |
Shinsei Bank Ltd. | 70,000 | 334,720 |
| | 1,567,248 |
Oil Distribution 0.3% | | |
Cosmo Oil Co., Ltd. | 13,000 | 54,270 |
Nippon Mining Holdings, Inc. | 43,000 | 368,544 |
| | 422,814 |
Photo-optical, Micros & Office | | |
Machinery 1.1% | | |
Eizo Nanao Corp. | 800 | 26,387 |
Fuji Photo Film Co., Ltd. | 14,000 | 572,641 |
Konica Minolta Holdings, Inc. | 28,000 | 366,846 |
NEC Corp. | 72,000 | 384,833 |
Riso Kagaku Corp. | 600 | 12,147 |
| | 1,362,854 |
Publishing, Broadcasting & | | |
Cinema 0.6% | | |
Dai Nippon Printing Co., Ltd. | 22,000 | 345,288 |
Fuji Television Network, Inc. | 29 | 67,046 |
Hakuhodo DY Holdings, Inc. | 1,310 | 91,459 |
Toppan Printing Co., Ltd. | 29,000 | 302,074 |
| | 805,867 |
Real Estate Development 0.6% | | |
Hankyu Hanshin Holdings, Inc. | 60,000 | 362,540 |
Iida Home Max | 1,800 | 31,690 |
Sekisui House Ltd. | 23,000 | 357,110 |
Towa Real Estate Development Co., | | |
Ltd. * | 2,000 | 10,779 |
| | 762,119 |
Restaurants, Hotels & | | |
Theaters 0.0% | | |
Fields Corp. | 20 | 32,158 |
H.I.S. Co., Ltd. | 700 | 20,086 |
| | 52,244 |
Retail 0.2% | | |
Aichi Toyota Motor Co., Ltd. | 2,000 | 38,922 |
AOKI Holdings, Inc. | 1,000 | 19,036 |
Aoyama Trading Co., Ltd. | 4,100 | 129,830 |
Daiichikosho Co., Ltd. | 2,800 | 31,592 |
| | 219,380 |
Software 0.3% | | |
Fujitsu Business Systems Ltd. | 200 | 3,105 |
Fujitsu Ltd. | 56,000 | 371,554 |
| | 374,659 |
See financial notes.
Laudus Funds Annual Report 63
Laudus Rosenberg International Equity Fund |
Portfolio Holdings continued | | |
| | | | |
| | | Number of | Value |
Security | | | Shares | ($) |
| | | | |
Textiles & Apparel 0.1% | | | | |
Japan Wool Textile Co., Ltd. | | 3,000 | 26,218 |
Kurabo Industries Ltd. | | | 9,000 | 24,925 |
Onward Kashiyama Co., Ltd. | | 8,000 | 110,967 |
Tokyo Style Co., Ltd. | | | 1,000 | 10,931 |
| | | | 173,041 |
Trading Company 0.8% | | | | |
Mitsubishi Corp. | | | 34,900 | 805,670 |
Sojitz Corp. | | | 47,100 | 195,721 |
| | | | 1,001,391 |
Wholesale 0.1% | | | | |
Kamei Corp. | | | 2,000 | 15,642 |
Ryosan Co., Ltd. | | | 1,900 | 48,757 |
Trusco Nakayama Corp. | | | 300 | 6,063 |
| | | | 70,462 |
| | | | 28,432,390 |
Netherlands 3.7% | | | | |
| | | | |
Agriculture, Food & | | | | |
Beverage 1.3% | | | | |
CSM N.V. | | | 2,474 | 88,499 |
Unilever N.V. | | | 53,200 | 1,553,772 |
| | | | 1,642,271 |
Banks & Credit Institutions 0.4% | | | |
ABN AMRO Holding N.V. | | | 5,500 | 236,985 |
ING Groep N.V. | | | 6,000 | 253,842 |
| | | | 490,827 |
Basic Minerals & Metals 0.0% | | | |
Mittal Steel Co. N.V. | | | 250 | 13,391 |
Chemicals & Rubber 0.5% | | | | |
Akzo Nobel N.V. | | | 9,321 | 708,014 |
Furniture & Household | | | | |
Items 0.0% | | | | |
Hunter Douglas N.V. | | | 135 | 11,911 |
Information & Services 1.1% | | |
Koninklijke (Royal) Philips Electronics | | |
N.V. | | | 36,336 | 1,384,972 |
Oil & Coal Resources 0.3% | | | | |
Koninklijke DSM N.V. | | | 10,400 | 466,714 |
Wholesale 0.1% | | | | |
Buhrmann N.V. | | | 6,000 | 80,587 |
Univar N.V. | | | 316 | 17,658 |
| | | | 98,245 |
| | | | 4,816,345 |
New Zealand 0.0% | | | | |
| | | | |
Airlines 0.0% | | | | |
Air New Zealand Ltd. | | | 21,500 | 35,884 |
Norway 0.3% | | | | |
| | | | |
Integrated Oil Companies 0.3% | | | |
Statoil A.S.A. | | | 16,100 | 434,711 |
| | | Number of | Value |
Security | | | Shares | ($) |
| | | | |
Portugal 0.4% | | | | |
| | | | |
Banks & Credit Institutions 0.2% | | | |
Banco Espirito Santo, S.A. | | | | |
(BES) Reg’d | | | 16,000 | 305,802 |
Electric Utilities 0.2% | | | | |
EDP — Energias de Portugal, S.A. | 40,745 | 219,410 |
| | | | 525,212 |
Singapore 1.0% | | | | |
| | | | |
Airlines 0.2% | | | | |
Singapore Airlines Ltd. | | | 22,000 | 240,026 |
Autos 0.1% | | | | |
Jardine Cycle & Carriage Ltd. | | 13,000 | 101,576 |
Cellular & Wireless 0.0% | | | | |
MobileOne Ltd. | | | 5,000 | 7,227 |
Commercial Aircraft & | | | | |
Components 0.1% | | | | |
Singapore Technologies Engineering | | |
Ltd. (ST Engg) | | | 34,000 | 74,261 |
Electric Utilities 0.1% | | | | |
SembCorp Industries Ltd. | | | 39,000 | 130,754 |
Financial Investments 0.0% | | | | |
Kim Eng Holdings Ltd. | | | 12,000 | 12,625 |
Land & Water | | | | |
Transportation 0.0% | | | | |
K1 Ventures Ltd. * | | | 112,000 | 24,318 |
Miscellaneous Finance 0.3% | | | | |
DBS Group Holdings Ltd. | | | 30,000 | 422,199 |
Real Estate Development 0.2% | | | |
Fraser & Neave Ltd. | | | 16,000 | 53,678 |
Guocoland Ltd. | | | 24,000 | 66,467 |
Ho Bee Investment Ltd. | | | 33,000 | 49,109 |
Wheelock Properties (S) Ltd. | | 24,000 | 51,081 |
Wing Tai Holdings Ltd. | | | 32,000 | 66,770 |
| | | | 287,105 |
Restaurants, Hotels & | | | | |
Theaters 0.0% | | | | |
Hotel Plaza Ltd. | | | 12,000 | 18,242 |
| | | | 1,318,333 |
Spain 4.6% | | | | |
| | | | |
Airlines 0.2% | | | | |
Iberia Lineas Aereas de Espana S.A. | 44,277 | 236,807 |
Banks & Credit Institutions 1.9% | | | |
Banco Bilbao Vizcaya Argentaria S.A. | 10,400 | 255,376 |
Banco Santander Central Hispano | | |
S.A. | | | 119,000 | 2,124,401 |
| | | | 2,379,777 |
Communications Utilities 1.5% | | | |
Telefonica S.A. | | | 89,100 | 1,973,099 |
Integrated Oil Companies 0.8% | | | |
Repsol YPF S.A. | | | 31,800 | 1,071,553 |
64 Laudus Funds Annual Report
See financial notes.
Laudus Rosenberg International Equity Fund |
| | | | | Number of | Value |
Security | | | | | Shares | ($) |
| | | | | | |
Restaurants, Hotels & | | | | | |
Theaters 0.2% | | | | | | |
Sol Melia S.A. | | | | | 11,512 | 277,123 |
| | | | | | 5,938,359 |
Sweden 2.1% | | | | | | |
| | | | | | |
Airlines 0.1% | | | | | | |
SAS AB * | | | | | 6,702 | 123,399 |
Autos 0.9% | | | | | | |
Volvo AB | | | | | 13,500 | 1,140,552 |
Basic Minerals & Metals 0.3% | | | |
Boliden AB | | | | | 16,817 | 371,442 |
Cellular & Wireless 0.7% | | | | | | |
TeliaSonera AB | | | | | 102,000 | 884,910 |
Communications Utilities 0.1% | | | |
Tele2 AB, Class B | | | | | 12,000 | 197,090 |
| | | | | | 2,717,393 |
Switzerland 7.4% | | | | | | |
| | | | | | |
Agriculture, Food & | | | | | | |
Beverage 1.4% | | | | | | |
Nestle S.A. — Reg’d | | | | | 4,500 | 1,753,553 |
Airlines 0.0% | | | | | | |
Swissair Group (a) (b) | | | | | 30 | — |
Autos 0.1% | | | | | | |
Rieter Holding AG — Reg’d | | | | 360 | 179,774 |
Banks & Credit Institutions 0.2% | | | |
Banque Cantonale Vaudoise (BCV) — | | |
Reg’d | | | | | 417 | 198,167 |
Basic Minerals & Metals 0.0% | | | |
Georg Fischer AG — Reg’d. * | | | | 65 | 47,029 |
Chemicals & Rubber0.4% | | | | | |
Ciba Specialty Chemicals AG— | | | | |
Reg’d | | | | | 5,600 | 369,729 |
Clariant AG — Reg’d * | | | | | 8,690 | 149,476 |
| | | | | | 519,205 |
Communications Utilities 0.0% | | | |
Swisscom AG — Reg’d | | | | | 132 | 47,790 |
Construction Materials 0.7% | | | | |
Holcim Ltd. — Reg’d | | | | | 8,600 | 865,303 |
Drugs & Pharmaceuticals 1.2% | | | |
Novartis AG — Reg’d | | | | | 15,600 | 871,510 |
Roche Holdings AG | | | | | 4,000 | 710,545 |
| | | | | | 1,582,055 |
Insurance 1.5% | | | | | | |
Baloise Holding AG — Reg’d | | | | 1,200 | 125,302 |
Swiss Life Holding — Reg’d * | | | 1,760 | 442,911 |
Zurich Financial Services AG— | | | | |
Reg’d | | | | | 4,800 | 1,388,044 |
| | | | | | 1,956,257 |
Metal Products & Machinery 0.1% | | | |
Bucher Industries AG— Reg’d | | | | 840 | 113,441 |
| | | Number of | Value |
Security | | | Shares | ($) |
| | | | |
Miscellaneous Finance 1.8% | | | |
Credit Suisse Group — Reg’d | 4,181 | 300,985 |
UBS AG — Reg’d | | | 33,900 | 2,021,522 |
| | | | 2,322,507 |
Retail 0.0% | | | | |
Charles Vogele Holding AG * | 107 | 11,740 |
| | | | 9,596,821 |
United Kingdom 21.6% | | | | |
| | | | |
Agriculture, Food & | | | |
Beverage 1.3% | | | | |
Tate & Lyle plc | | | 30,100 | 341,432 |
Unilever plc | | | 43,199 | 1,304,613 |
| | | | 1,646,045 |
Autos 0.3% | | | | |
GKN plc | | | 49,951 | 374,657 |
Banks & Credit Institutions 4.3% | | |
Barclays plc | | | 20,800 | 294,939 |
HBOS plc | | | 71,798 | 1,484,373 |
HSBC Holdings plc | | 61,200 | 1,071,688 |
Lloyds TSB Group plc | | 17,000 | 187,765 |
Royal Bank of Scotland Group plc | 63,300 | 2,478,099 |
| | | | 5,516,864 |
Basic Minerals & Metals 1.7% | | | |
Anglo American plc | | 29,400 | 1,552,536 |
Kazakhmys plc | | | 20,561 | 475,671 |
Rio Tinto plc | | | 3,200 | 182,732 |
| | | | 2,210,939 |
Beer, Liquor, & Tobacco 1.2% | | | |
Imperial Tobacco Group plc | | 23,000 | 1,031,574 |
Scottish & Newcastle plc | | 46,000 | 544,835 |
| | | | 1,576,409 |
Cellular & Wireless 0.8% | | | |
Vodafone Group plc | | 406,000 | 1,085,588 |
Construction Materials 0.0% | | | |
Cookson Group plc | | 2,518 | 30,812 |
Drugs & Pharmaceuticals 1.1% | | | |
AstraZeneca plc | | | 5,400 | 291,109 |
GlaxoSmithKline plc | | 42,000 | 1,159,335 |
| | | | 1,450,444 |
Electric Utilities 0.3% | | | | |
British Energy Group plc * | | 33,000 | 316,903 |
International Power plc | | 1,319 | 10,310 |
| | | | 327,213 |
Furniture & Household | | | |
Items 0.4% | | | | |
Smiths Group plc | | | 27,775 | 561,475 |
Gas & Other Public Utilities 0.1% | | |
United Utilities plc | | 4,665 | 69,506 |
Government Aircraft & | | | |
Defense 0.8% | | | | |
BAE Systems plc | | | 116,789 | 1,058,686 |
See financial notes.
Laudus Funds Annual Report 65
Laudus Rosenberg International Equity Fund |
Portfolio Holdings continued | | |
| | | | |
| | | Number of | Value |
Security | | | Shares | ($) |
| | | | |
Insurance 2.8% | | | | |
Aviva plc | | | 82,600 | 1,220,490 |
Brit Insurance Holdings plc | | 8,632 | 54,774 |
Friends Provident plc | | | 105,000 | 398,199 |
Old Mutual plc | | | 234,000 | 757,913 |
Prudential plc | | | 87,000 | 1,229,355 |
| | | | 3,660,731 |
Integrated Oil Companies 3.8% | | | |
BP plc | | | 96,427 | 1,042,251 |
Royal Dutch Shell plc, Class A | 67,600 | 2,248,983 |
Royal Dutch Shell plc, Class B | 47,400 | 1,576,959 |
| | | | 4,868,193 |
Miscellaneous Finance 0.9% | | | |
Investec plc | | | 22,253 | 288,469 |
Legal & General Group plc | | 288,000 | 904,000 |
| | | | 1,192,469 |
Publishing, Broadcasting & | | |
Cinema 0.2% | | | | |
Trinity Mirror plc | | | 17,257 | 180,290 |
WPP Group plc | | | 5,099 | 77,422 |
| | | | 257,712 |
Real Estate Development 0.0% | | | |
Enterprise Inns plc | | | 3,057 | 40,293 |
Restaurants, Hotels & | | | | |
Theaters 1.3% | | | | |
Compass Group plc | | | 116,000 | 776,940 |
Greene King plc | | | 2,686 | 58,301 |
Luminar plc | | | 877 | 13,029 |
Millennium & Copthorne Hotel plc | 8,198 | 109,804 |
Punch Taverns plc | | | 14,800 | 363,438 |
Whitbread plc * | | | 2,684 | 99,940 |
William Hill plc | | | 25,200 | 315,724 |
| | | | 1,737,176 |
Retail 0.2% | | | | |
Tesco plc | | | 23,000 | 201,288 |
Software 0.1% | | | | |
LogicaCMG plc | | | 29,901 | 104,844 |
| | | | 27,971,344 |
Total Common Stock (Cost $107,410,263) | 127,031,334 |
| Number of | Value |
Security | Shares | ($) |
| | | |
Rights 0.0% of net assets | | | |
| | | |
Austria 0.0% | | | |
Conwert Immobilien Invest AG * | 567 | | — |
Total Rights (Cost $—) | | | — |
| | | |
End of Investments. | | | |
| | | |
At 03/31/07 the tax basis cost of the fund’s investments was | |
$108,029,605, and the unrealized appreciation and depreciation | |
were $20,615,086 and ($1,613,357), respectively, with a net | |
unrealized appreciation of $19,001,729. | | | |
| | | |
At 03/31/07, the prices of certain foreign securities held by the | |
fund aggregating $125,471,106 were adjusted from their closing |
market prices following the guidelines adopted by the fund’s | |
Board of Trustees. | | | |
| | Amount | | Amount | |
| | of | | of | Unrealized |
| Currency | Currency | Currency | Currency | Gains / |
Expiration | to be | to be | to be | to be | Losses |
Date | Received | Received | Delivered | Delivered | ($) |
| | | | | |
Forward Foreign Currency Contract 1.2% of net assets | |
04/04/2007 | USD | 1,533,625 | JPY | 180,891,000 | (2,517) |
| | | | | |
* | Non-income producing security. | | |
(a) | Bankrupt security/delisted. | | | |
(b) | Fair-valued by Management. | | | |
66 Laudus Funds Annual Report
See financial notes.
Laudus Rosenberg International Equity Fund |
Portfolio Holdings as of March 31, 2007 | |
| | | |
| | Cost | Value |
Holdings by Category | ($) | ($) |
| | | |
95.7% | Common Stock | 59,606,638 | 67,724,126 |
1.5% | Preferred Stock | 940,867 | 1,045,029 |
—% | Rights | — | 10,575 |
1.4% | Short-Term Investment | 983,000 | 983,000 |
| | | |
98.6% | Total Investments | 61,530,505 | 69,762,730 |
1.4% | Other Assets and | | |
| Liabilities | | 981,868 |
| | | |
100.0% | Net Assets | | 70,744,598 |
| | | Number of | Value |
Security | | | Shares | ($) |
| | | | |
Common Stock 95.7% of net assets | | |
| | | | |
Argentina 0.2% | | | | |
Communications Utilities 0.2% | | |
Telecom Argentina S.A. ADR * | | 4,100 | 87,494 |
Telefonica de Argentina S.A. ADR | 1,300 | 24,570 |
| | | | 112,064 |
| | | | 112,064 |
Australia 5.4% | | | | |
Airlines 0.2% | | | | |
Qantas Airways Ltd. | | | 35,400 | 149,876 |
Banks & Credit Institutions 0.9% | | | |
St. George Bank Ltd. | | | 5,800 | 164,016 |
Suncorp-Metway Ltd. | | | 26,879 | 451,327 |
| | | | 615,343 |
Basic Minerals & Metals 0.8% | | | | |
BlueScope Steel Ltd. | | | 24,700 | 209,505 |
Jubilee Mines NL | | | 4,800 | 67,762 |
Minara Resources Ltd. | | | 14,100 | 83,947 |
OneSteel Ltd. | | | 5,100 | 21,243 |
Zinifex Ltd. | | | 16,500 | 210,002 |
| | | | 592,459 |
Beer, Liquor, & Tobacco 0.6% | | | | |
Foster’s Group Ltd. | | | 64,500 | 356,819 |
Lion Nathan Ltd. | | | 9,100 | 65,078 |
| | | | 421,897 |
Chemicals & Rubber 0.3% | | | |
Orica Ltd. | | | 10,600 | 217,018 |
Construction & Homebuilding 0.2% | | | |
Leighton Holdings Ltd. | | | 5,000 | 135,419 |
Construction Materials 0.3% | | | | |
Adelaide Brighton Ltd. | | | 20,500 | 56,796 |
Boral Ltd. | | | 23,000 | 153,121 |
| | | | 209,917 |
Forest Products & Paper 0.0% | | | | |
PaperlinX Ltd. | | | 1,500 | 5,049 |
Furniture & Household Items 0.3% | | | |
Amcor Ltd. | | | 29,300 | 178,635 |
Information & Services 0.0% | | | | |
WorleyParsons Ltd. | | | 700 | 15,599 |
| | | Number of | Value |
Security | | | Shares | ($) |
| | | | |
Insurance 0.4% | | | | |
Insurance Australia Group Ltd. | 60,000 | 284,194 |
Miscellaneous Finance 0.3% | | | |
ASX Ltd. | | | 6,300 | 223,843 |
Oil Distribution 0.0% | | | | |
Caltex Australia Ltd. | | | 900 | 17,315 |
Publishing, Broadcasting & Cinema 0.1% | | |
West Australian Newspapers | | |
Holdings Ltd. | | | 6,200 | 78,276 |
Real Estate Development 0.3% | | | |
Lend Lease Corp., Ltd. | | | 13,900 | 224,419 |
Restaurants, Hotels & Theaters 0.2% | | |
TABCORP Holdings Ltd. | | | 9,800 | 130,719 |
Retail 0.3% | | | | |
Coles Group Ltd. | | | 10,500 | 137,850 |
Goodman Fielder Ltd. | | | 19,500 | 38,487 |
| | | | 176,337 |
Textiles & Apparel 0.1% | | | | |
Pacific Brands Ltd. | | | 20,600 | 51,093 |
Wholesale 0.1% | | | | |
Sims Group Ltd. | | | 5,300 | 99,904 |
| | | | 3,827,312 |
Austria 1.6% | | | | |
Basic Minerals & Metals 0.9% | | | |
Boehler-Uddeholm AG | | | 2,800 | 269,811 |
Voestalpine AG | | | 4,800 | 348,291 |
| | | | 618,102 |
Real Estate Development 0.7% | | | |
Conwert Immobilien Invest AG * | 2,500 | 55,005 |
Immofinanz Immobilien | | | | |
Analagen AG * | | | 20,000 | 321,643 |
Meinl European Land Ltd. * | | 4,800 | 133,562 |
| | | | 510,210 |
| | | | 1,128,312 |
Belgium 1.1% | | | | |
Basic Minerals & Metals 0.1% | | | |
Umicore | | | 400 | 71,398 |
Instruments 0.3% | | | | |
Agfa Gevaert N.V. | | | 8,000 | 181,099 |
Real Estate Development 0.1% | | | |
Cofinimmo | | | 400 | 83,377 |
Restaurants, Hotels & Theaters 0.1% | | |
S.A. D’Ieteren N.V. | | | 210 | 86,516 |
Retail 0.5% | | | | |
Delhaize Group | | | 4,200 | 387,568 |
| | | | 809,958 |
Brazil 0.5% | | | | |
Basic Minerals & Metals 0.1% | | | |
Companhia Siderurgica Nacional S.A. | | |
(CSN) | | | 1,700 | 73,312 |
Sider Paulista Cos. | | | 600 | 34,918 |
| | | | 108,230 |
See financial notes.
Laudus Funds Annual Report 67
Laudus Rosenberg International Discovery Fund |
Portfolio Holdings continued | | | |
| | | | |
| | | Number of | Value |
Security | | | Shares | ($) |
| | | | |
Beer, Liquor, & Tobacco 0.1% | | | | |
Souza Cruz S.A. | | | 3,400 | 68,485 |
Chemicals & Rubber 0.1% | | | | |
Copesul-Companhia Petroquinica do | | |
Sul | | | 2,600 | 45,746 |
Commercial Aircraft & Components 0.1% | | |
Empresa Brasileira de Aeronautica | | |
S.A. (Embraer) | | | 3,400 | 38,764 |
Gas & Other Public Utilities 0.1% | | | |
Companhia de Saneamento Basico do | | |
Estado de Sao Paulo * | | | 668,000 | 89,648 |
| | | | 350,873 |
Canada 5.1% | | | | |
Agriculture, Food & Beverage 0.6% | | | |
Saputo, Inc. | | | 10,200 | 408,000 |
Banks & Credit Institutions 0.6% | | | |
National Bank of Canada | | | 7,500 | 405,890 |
Basic Minerals & Metals 1.1% | | | | |
Agnico-Eagle Mines Ltd. | | | 2,060 | 72,854 |
Aur Resources, Inc. | | | 1,050 | 22,100 |
Gerdau Ameristeel Corp. | | | 2,700 | 31,993 |
Inmet Mining Corp. | | | 4,400 | 242,010 |
IPSCO, Inc. | | | 872 | 114,466 |
Sherritt International Corp. | | | 3,940 | 56,788 |
Teck Cominco Ltd., Class B | | | 2,950 | 205,670 |
| | | | 745,881 |
Chemicals & Rubber 0.5% | | | | |
Methanex Corp. | | | 7,904 | 176,154 |
Potash Corp. of Saskatchewan, Inc. | 1,000 | 159,463 |
| | | | 335,617 |
Commercial Aircraft & Components 0.0% | | |
ACE Aviation Holdings, Inc., Class A * | 1,300 | 34,299 |
Communications Utilities 0.3% | | | |
Telus Corp. | | | 3,850 | 192,150 |
Drugs & Pharmaceuticals 0.1% | | | |
Biovail Corp. | | | 3,980 | 87,046 |
Electric Utilities 0.5% | | | | |
ATCO Ltd., Class I | | | 2,210 | 89,970 |
Canadian Utilities Ltd. | | | 7,900 | 291,297 |
| | | | 381,267 |
Government Aircraft & Defense 0.1% | |
Bombardier, Inc. * | | | 16,100 | 64,986 |
Insurance 0.1% | | | | |
Industrial Alliance Insurance and | | | |
Financial Services, Inc. | | | 3,322 | 102,178 |
IT Hardware 0.4% | | | | |
Celestica, Inc. * | | | 1,500 | 9,160 |
Nortel Networks Corp. * | | | 11,899 | 285,184 |
| | | | 294,344 |
Oil & Coal Resources 0.1% | | | |
Talisman Energy, Inc. | | | 5,000 | 87,743 |
Oil Drilling & Services 0.2% | | | |
Trican Well Service Ltd. | | | 5,450 | 107,867 |
| | | | | |
| | Number of | Value |
Security | | Shares | ($) |
| | | |
Publishing, Broadcasting & Cinema 0.1% | |
CanWest Global Communications | | |
Corp. * | | 2,500 | 23,950 |
Corus Entertainment, Inc., Class B | 1,000 | 38,155 |
| | | 62,105 |
Real Estate Development 0.2% | | |
MI Developments, Inc., Class A | 4,300 | 160,752 |
Retail 0.2% | | | |
Alimentation Couche-Tard, Inc., | | |
Class B | | 945 | 19,760 |
Sobeys, Inc. | | 3,920 | 123,932 |
| | | 143,692 |
| | | 3,613,817 |
Chile 0.5% | | | |
Agriculture, Food & Beverage 0.1% | | |
Embotelladora Andina S.A. Series A | | |
ADR | | 1,817 | 32,506 |
Embotelladora Andina S.A. Series B | | |
ADR | | 2,000 | 39,000 |
| | | 71,506 |
Airlines 0.1% | | | |
Lan Airlines S.A. ADR | | 1,527 | 105,210 |
Banks & Credit Institutions 0.1% | | |
Banco de Chile ADR | | 1,800 | 88,848 |
Beer, Liquor, & Tobacco 0.1% | | |
Compania Cervecerias Unidas S.A. | | |
ADR | | 2,000 | 62,840 |
Electric Utilities 0.1% | | | |
Empresa Nacional de Electricidad S.A. | | |
ADR | | 697 | 27,978 |
Enersis S.A. ADR | | 1,600 | 26,064 |
| | | 54,042 |
Insurance 0.0% | | | |
Administradora de Fondos de | | |
Pensiones Provida S.A. ADR | 266 | 6,836 |
| | | 389,282 |
China 1.8% | | | |
Basic Minerals & Metals 0.5% | | | |
Aluminum Corp. of China Ltd., | | |
Class H | | 158,000 | 163,870 |
Angang Steel Co., Ltd., Class H | 50,000 | 86,463 |
Jiangxi Copper Co., Ltd., Class H | 81,000 | 97,254 |
| | | 347,587 |
Beer, Liquor, & Tobacco 0.1% | | | |
Beijing Enterprise Holdings Ltd. | 26,000 | 66,077 |
Drugs & Pharmaceuticals 0.1% | | | |
Shanghai Industrial Holdings Ltd. | 31,000 | 71,329 |
Electric Utilities 0.1% | | | |
Datang International Power | | | |
Generation Co., Ltd., Class H | 62,000 | 58,487 |
Insurance 0.1% | | | |
PICC Property & Casualty Co., Ltd., | | |
Class H * | | 134,000 | 76,399 |
68 Laudus Funds Annual Report
See financial notes.
Laudus Rosenberg International Discovery Fund |
| | | Number of | Value |
Security | | | Shares | ($) |
| | | | |
Land & Water Transportation 0.4% | | |
China COSCO Holdings Co., Ltd., | | |
Class H | | | 117,000 | 114,561 |
China International Marine Containers | | |
(Group) Co., Ltd., Class B | | 40,800 | 89,448 |
Sinotrans Ltd., Class H | | | 168,000 | 66,936 |
| | | | 270,945 |
Oil & Coal Resources 0.1% | | | |
Yanzhou Coal Mining Co., Ltd., | | |
Class H | | | 108,000 | 103,570 |
Real Estate Development 0.1% | | | |
Guangzhou Investment Co., Ltd. | 250,000 | 61,189 |
Software 0.1% | | | | |
Lenovo Group Ltd. | | | 222,000 | 81,007 |
Textiles & Apparel0.1% | | | | |
Weiqiao Textile Co., Ltd., Class H | 45,000 | 65,029 |
Wholesale 0.1% | | | | |
TPV Technology Ltd. | | | 78,000 | 49,698 |
| | | | 1,251,317 |
Denmark 1.5% | | | | |
Agriculture, Food & Beverage 0.3% | | |
Danisco A/S | | | 3,000 | 235,352 |
Beer, Liquor, & Tobacco0.4% | | | |
Carlsberg A/S, Class B | | | 2,700 | 293,329 |
Drugs & Pharmaceuticals0.2% | | | |
H. Lundbeck A/S | | | 6,793 | 158,147 |
Insurance 0.3% | | | | |
Codan A/S (The Codan Group) | 2,000 | 188,937 |
Metal Products & Machinery 0.3% | | |
Vestas Wind Systems A/S * | 3,600 | 200,681 |
| | | | 1,076,446 |
Egypt 0.1% | | | | |
Cellular & Wireless 0.1% | | | | |
Egyptian Co. for Mobile Services | 1,800 | 49,754 |
Finland 1.1% | | | | |
Basic Minerals & Metals 0.4% | | | |
Outokumpu Oyj | | | 8,000 | 275,366 |
Forest Products & Paper 0.1% | | | |
Stora Enso Oyj, Class R | | 2,394 | 41,580 |
UPM-Kymmene Oyj | | | 600 | 15,326 |
| | | | 56,906 |
Insurance 0.2% | | | | |
Sampo Oyj, Class A | | | 5,500 | 167,599 |
Retail 0.4% | | | | |
Kesko Oyj, Class B | | | 5,100 | 273,094 |
| | | | 772,965 |
France 6.2% | | | | |
Airlines 0.5% | | | | |
Air France-KLM | | | 8,000 | 365,907 |
| | | | | Number of | Value |
Security | | | | | Shares | ($) |
| | | | | | |
Autos 0.3% | | | | | | |
PSA Peugeot Citroen | | | | | 2,400 | 169,221 |
Societe Fonciere Financiere et de | | | |
Participations (FFP) | | | | | 232 | 63,802 |
| | | | | | 233,023 |
Basic Minerals & Metals 0.2% | | | | |
Eramet | | | | | 63 | 13,188 |
Nexans S.A. | | | | | 1,000 | 133,068 |
| | | | | | 146,256 |
Chemicals & Rubber 0.7% | | | | | |
Compagnie Generale des | | | | | |
Etablissements Michelin, Class B | | 4,200 | 464,365 |
Communications Utilities 0.6% | | | | |
Eutelsat Communications * | | | 4,800 | 108,810 |
Publicis Groupe | | | | | 6,800 | 328,235 |
| | | | | | 437,045 |
Construction Materials 0.3% | | | | |
Ciments Francais S.A. | | | | | 1,120 | 238,390 |
Government Aircraft & Defense 0.4% | | | |
Thales S.A. | | | | | 4,400 | 256,555 |
Insurance 0.3% | | | | | | |
CNP Assurances | | | | | 1,600 | 187,238 |
Land & Water Transportation 0.0% | | | |
Financiere de l’Odet | | | | | 24 | 11,037 |
Miscellaneous Finance 0.2% | | | | |
Natixis | | | | | 5,400 | 132,186 |
Publishing, Broadcasting & Cinema 0.6% | | |
Havas S.A. | | | | | 24,000 | 138,834 |
Thomson | | | | | 15,300 | 294,754 |
| | | | | | 433,588 |
Real Estate Development 0.4% | | | | |
Fonciere des Regions | | | | | 900 | 169,209 |
Nexity | | | | | 1,200 | 103,109 |
| | | | | | 272,318 |
Restaurants, Hotels & Theaters 0.5% | | | |
Sodexho Alliance S.A. | | | | | 5,100 | 374,272 |
Software 1.0% | | | | | | |
Atos Origin S.A. * | | | | | 3,600 | 242,354 |
Cap Gemini S.A. | | | | | 5,700 | 433,847 |
| | | | | | 676,201 |
Textiles & Apparel 0.2% | | | | | | |
Christian Dior S.A. | | | | | 1,306 | 159,243 |
| | | | | | 4,387,624 |
Germany 3.2% | | | | | | |
Basic Minerals & Metals 0.3% | | | | |
ThyssenKrupp AG | | | | | 4,800 | 238,268 |
Chemicals & Rubber 0.4% | | | | | |
Lanxess * | | | | | 5,100 | 263,852 |
Commercial Aircraft & Components 0.2% | | |
MTU Aero Engines Holding AG | | 2,349 | 141,178 |
Electric Utilities 0.0% | | | | | | |
MVV Energie AG | | | | | 292 | 11,078 |
| | | | | | | |
See financial notes.
Laudus Funds Annual Report 69
Laudus Rosenberg International Discovery Fund |
Portfolio Holdings continued | | |
| | | |
| | Number of | Value |
Security | | Shares | ($) |
| | | |
Information & Services 0.4% | | | |
TUI AG | | 11,802 | 291,766 |
Insurance 0.3% | | | |
AMB Generali Holding AG | | 1,264 | 197,778 |
IT Hardware 0.6% | | | |
Infineon Technologies AG * | | 27,000 | 420,461 |
Photo-optical, Micros & Office Machinery 0.2% | |
Heidelberger Druckmaschinen AG | 3,809 | 174,872 |
Retail 0.4% | | | |
KarstadtQuelle AG * | | 7,000 | 257,414 |
Wholesale 0.4% | | | |
GEA Group AG | | 10,677 | 296,444 |
| | | 2,293,111 |
Greece 0.6% | | | |
Communications Utilities0.3% | | | |
Hellenic Telecommunications | | | |
Organization S.A. (OTE) * | | 6,000 | 163,664 |
Electric Utilities 0.3% | | | |
Public Power Corp. S.A. (PPC) | | 8,497 | 208,229 |
Oil Distribution 0.0% | | | |
Hellenic Petroleum S.A. | | 1,462 | 20,759 |
| | | 392,652 |
Hong Kong 3.1% | | | |
Airlines 0.1% | | | |
Cathay Pacific Airways Ltd. | | 31,000 | 78,985 |
Electric Utilities 0.3% | | | |
CLP Holdings Ltd. | | 3,500 | 25,565 |
Hongkong Electric Holdings Ltd. | 28,500 | 146,125 |
| | | 171,690 |
Gas & Other Public Utilities 0.1% | | | |
Guangdong Investment Ltd. | | 132,000 | 70,250 |
IT Hardware 0.1% | | | |
Vtech Holdings Ltd. | | 9,000 | 64,760 |
Land & Water Transportation 0.0% | | |
Transport International Holdings Ltd. | 2,400 | 13,022 |
Miscellaneous Finance 0.2% | | | |
Guoco Group Ltd. | | 8,000 | 112,455 |
Jardine Strategic Holdings Ltd. | | 4,000 | 51,363 |
| | | 163,818 |
Real Estate Development 2.1% | | | |
Citic Pacific Ltd. | | 44,000 | 162,375 |
Great Eagle Holdings Ltd. | | 20,000 | 67,579 |
Hang Lung Group Ltd. | | 46,000 | 162,471 |
Hang Lung Properties Ltd. | | 47,000 | 130,483 |
Henderson Investment Ltd. | | 24,000 | 48,931 |
Henderson Land Development Co., | | |
Ltd. | | 31,000 | 180,758 |
Hongkong Land Holdings Ltd. | | 9,000 | 41,800 |
Hopewell Holdings Ltd. | | 29,000 | 112,929 |
Hopson Development Holdings Ltd. | 30,000 | 75,019 |
Kerry Properties Ltd. | | 27,500 | 141,038 |
New World Development Co., Ltd. | 76,000 | 171,646 |
| | | | |
| | | | Number of | Value |
Security | | | | Shares | ($) |
| | | | | |
The Wharf Holdings Ltd. | | | 26,000 | 96,089 |
Wheelock & Co., Ltd. | | | | 54,000 | 121,137 |
| | | | | 1,512,255 |
Restaurants, Hotels & Theaters 0.1% | | |
Hongkong & Shanghai Hotels Ltd. | 25,500 | 40,217 |
Shangri-La Asia Ltd. | | | | 22,000 | 54,471 |
| | | | | 94,688 |
Retail 0.1% | | | | | |
Dairy Farm International Holdings Ltd. | 6,300 | 24,570 |
Esprit Holdings Ltd. | | | | 2,500 | 29,295 |
| | | | | 53,865 |
| | | | | 2,223,333 |
Hungary 0.3% | | | | | |
Communications Utilities 0.3% | | | |
Magyar Telekom Nyrt | | | | 42,000 | 211,137 |
India 2.0% | | | | | |
Autos 0.3% | | | | | |
Maruti Udyog Ltd. | | | | 4,580 | 85,007 |
Tata Motors Ltd. | | | | 6,230 | 103,600 |
| | | | | 188,607 |
Banks & Credit Institutions 0.1% | | | |
Bajaj Auto Ltd. | | | | 780 | 43,433 |
Bank of India | | | | 12,220 | 46,831 |
| | | | | 90,264 |
Basic Minerals & Metals 0.6% | | | |
Hindalco Industries Ltd. | | | | 20,600 | 61,631 |
Hindustan Zinc Ltd. | | | | 6,280 | 81,277 |
National Aluminium Co., Ltd. | | 4,960 | 26,528 |
Steel Authority Of India Ltd. | | 34,990 | 91,962 |
Sterlite Industries (India) Ltd. | | 7,830 | 83,687 |
Tata Steel Ltd. | | | | 7,960 | 82,195 |
| | | | | 427,280 |
Construction Materials 0.2% | | | | | |
ACC Ltd. | | | | 3,070 | 51,568 |
Grasim Industries Ltd. | | | | 1,270 | 61,263 |
Ultra Tech Cement Ltd. | | | | 2,230 | 39,221 |
| | | | | 152,052 |
Consumer Durables 0.0% | | | | | |
Hero Honda Motors Ltd. | | | 600 | 9,555 |
Financial Investments 0.2% | | | | |
Mahindra & Mahindra Ltd. | | | 5,810 | 103,662 |
Metal Products & Machinery 0.2% | | | |
Bharat Heavy Electricals Ltd. | | 2,120 | 109,674 |
Larsen & Toubro Ltd. GDR | | | 1,500 | 54,750 |
| | | | | 164,424 |
Oil & Coal Resources 0.0% | | | | |
Neyveli Lignite Corp., Ltd. * | | 1,470 | 1,689 |
Oil Distribution 0.2% | | | | | |
Gail India Ltd. | | | | 9,980 | 60,325 |
Mangalore Refinery & Petrochemicals | | |
Ltd. | | | | 74,800 | 58,175 |
| | | | | 118,500 |
| | | | | | |
70 Laudus Funds Annual Report
See financial notes.
Laudus Rosenberg International Discovery Fund |
| | | | | Number of | Value |
Security | | | | | Shares | ($) |
| | | | | | |
Restaurants, Hotels & Theaters 0.0% | | | |
Indian Hotels Co., Ltd. | | | | | 4,623 | 15,243 |
Software 0.2% | | | | | | |
HCL Technologies Ltd. | | | | | 10,260 | 68,522 |
Satyam Computer Services Ltd. | | | 4,720 | 50,626 |
| | | | | | 119,148 |
| | | | | | 1,390,424 |
Indonesia 0.7% | | | | | | |
Agriculture, Food & Beverage 0.1% | | | | |
PT Astra Agro Lestari Tbk. | | | | 41,000 | 56,414 |
Banks & Credit Institutions 0.2% | | | | |
PT Bank Central Asia Tbk. | | | | 199,000 | 110,733 |
Basic Minerals & Metals 0.1% | | | | | |
PT International Nickel Indonesia Tbk. | | | |
(INCO) | | | | | 16,000 | 94,967 |
Beer, Liquor, & Tobacco 0.1% | | | | | |
PT Hanjaya Mandala Sampoerna Tbk | | 23,000 | 33,011 |
Construction Materials 0.1% | | | | | |
PT Bank Rakyat Indonesia | | | | 185,000 | 101,778 |
Wholesale 0.1% | | | | | | |
PT Astra International Tbk | | | | 47,000 | 67,676 |
| | | | | | 464,579 |
Ireland 0.6% | | | | | | |
Agriculture, Food & Beverage 0.3% | | | | |
Kerry Group plc, Class A | | | | | 9,000 | 251,566 |
Publishing, Broadcasting & Cinema 0.3% | | |
Independent News & Media plc | | | 45,000 | 204,949 |
| | | | | | 456,515 |
Israel 1.3% | | | | | | |
Banks & Credit Institutions 1.1% | | | | |
Bank Hapoalim B.M. | | | | | 55,000 | 263,650 |
Bank Leumi Le-Israel | | | | | 70,000 | 251,290 |
First International Bank Of Israel Ltd. | | | |
(FIBI) * | | | | | 6,000 | 74,025 |
Israel Discount Bank, Series A * | | | 44,000 | 92,469 |
Mizrahi Tefahot Bank Ltd. | | | | 9,000 | 66,602 |
| | | | | | 748,036 |
Communications Utilities 0.1% | | | | |
Bezeq Israeli Telecommunication | | | | |
Corp., Ltd. | | | | | 48,000 | 73,902 |
Insurance 0.1% | | | | | | |
Clal Insurance Enterprise Holdings | | | |
Ltd. | | | | | 3,000 | 85,144 |
| | | | | | 907,082 |
Italy 3.7% | | | | | | |
Autos 0.4% | | | | | | |
Fiat S.p.A | | | | | 10,000 | 253,482 |
Banks & Credit Institutions 0.1% | | | | |
Unione di Banche Italiane S.c.p.A | | 1,400 | 41,524 |
Chemicals & Rubber 0.3% | | | | | | |
Pirelli & C. S.p.A. | | | | | 211,934 | 234,392 |
| | | | | | | |
| | | | Number of | Value |
Security | | | | Shares | ($) |
| | | | | |
Construction Materials 0.8% | | | | |
Buzzi Unicem S.p.A. | | | | 8,400 | 255,936 |
Italcementi S.p.A. | | | | 9,800 | 294,313 |
| | | | | 550,249 |
Consumer Durables 0.0% | | | | | |
Indesit Co. S.p.A. | | | | 1,000 | 21,319 |
Electric Utilities 0.6% | | | | | |
ACEA S.p.A. | | | | 10,000 | 187,583 |
ASM S.p.A. | | | | 33,000 | 214,264 |
Cofide S.p.A. — Compagnia | | | | |
Finanziaria De Benedetti | | | 25,209 | 43,768 |
| | | | | 445,615 |
Forest Products & Paper 0.4% | | | | |
IFIL — Investments S.p.A. | | | 24,000 | 235,217 |
Gas & Other Public Utilities 0.1% | | |
Hera S.p.A. | | | | 2,801 | 11,817 |
Iride S.p.A. | | | | 21,000 | 71,134 |
| | | | | 82,951 |
Government Aircraft & Defense 0.5% | | | |
Finmeccanica S.p.A. | | | | 12,254 | 368,350 |
Oil Distribution 0.2% | | | | | |
ERG S.p.A. | | | | 5,513 | 151,703 |
Publishing, Broadcasting & Cinema | 0.2% | |
Mediaset S.p.A. | | | | 12,000 | 131,063 |
Real Estate Development 0.1% | | | | |
Immobiliare Grande Distribuzione | | 8,000 | 44,423 |
Immobiliare Lombarda S.p.A. * | | 134,679 | 39,917 |
| | | | | 84,340 |
| | | | | 2,600,205 |
Japan 20.5% | | | | | |
Agriculture, Food & Beverage 0.4% | | | |
Nisshin Seifun Group, Inc. | | | 20,500 | 208,229 |
Yamazaki Baking Co., Ltd. | | | 7,000 | 63,651 |
| | | | | 271,880 |
Autos 2.2% | | | | | |
Daihatsu Motor Co., Ltd. | | | | 7,000 | 66,513 |
Fuji Heavy Industries Ltd. | | | | 59,000 | 305,566 |
Hino Motors Ltd. | | | | 44,000 | 233,869 |
Kawasaki Heavy Industries Ltd. | | 87,000 | 366,993 |
Koito Manufacturing Co., Ltd. | | 9,000 | 123,207 |
Mazda Motor Corp. | | | | 19,000 | 104,775 |
Yamaha Motor Co., Ltd. | | | | 11,900 | 332,373 |
| | | | | 1,533,296 |
Banks & Credit Institutions 0.3% | | |
Higo Bank Ltd. | | | | 3,000 | 20,326 |
Orient Corp. * | | | | 24,000 | 40,783 |
Yamaguchi Financial Group, Inc. | | 13,000 | 174,440 |
| | | | | 235,549 |
Basic Minerals & Metals 2.8% | | | | |
Fujikura Ltd. | | | | 27,000 | 189,576 |
Kobe Steel Ltd. | | | | 114,000 | 458,089 |
Maruichi Steel Tube Ltd. | | | | 4,400 | 136,451 |
Mitsui Mining & Smelting Co., Ltd. | 16,000 | 87,510 |
Nisshin Steel Co., Ltd. | | | | 58,000 | 249,284 |
See financial notes.
Laudus Funds Annual Report 71
Laudus Rosenberg International Discovery Fund |
Portfolio Holdings continued | | | | |
| | | | | |
| | | | Number of | Value |
Security | | | | Shares | ($) |
| | | | | |
Sumitomo Electric Industries Ltd. | | 21,500 | 325,668 |
Sumitomo Metal Mining Co., Ltd. | | 25,000 | 480,698 |
Tokyo Steel Manufacturing Co., Ltd. | 5,400 | 79,436 |
| | | | | 2,006,712 |
Beer, Liquor, & Tobacco 0.5% | | | | |
Asahi Breweries Ltd. | | | | 22,800 | 365,184 |
Chemicals & Rubber 2.2% | | | | | |
Asahi Kasei Corp. | | | | 59,000 | 427,782 |
Daicel Chemical Industries Ltd. | | 4,000 | 27,213 |
Dainippon Ink & Chemicals, Inc. | | 16,000 | 63,380 |
Kaneka Corp. | | | | 30,000 | 285,410 |
Mitsui Chemicals, Inc. | | | | 39,000 | 339,832 |
Teijin Ltd. | | | | 64,000 | 359,708 |
Tosoh Corp. | | | | 11,000 | 56,658 |
| | | | | 1,559,983 |
Communications Utilities 0.0% | | | | |
Rakuten, Inc. | | | | 68 | 32,224 |
Drugs & Pharmaceuticals 0.7% | | | | |
Ono Pharmaceutical Co., Ltd. | | 3,500 | 195,856 |
Taisho Pharmaceutical Co., Ltd. | | 16,000 | 293,209 |
| | | | | 489,065 |
Electric Utilities 0.4% | | | | | |
Hokkaido Electric Power Co., Inc. | | 2,300 | 61,022 |
Kyushu Electric Power Co., Inc. | | 5,300 | 150,647 |
The Chugoku Electric Power Co., Inc. | 3,900 | 87,162 |
| | | | | 298,831 |
Financial Investments 0.2% | | | | |
Hitachi Capital Corp. | | | | 8,800 | 175,127 |
Furniture & Household Items 1.3% | | |
Kokuyo Co., Ltd. | | | | 10,500 | 138,781 |
Matsushita Electric Works Ltd. | | 10,000 | 114,264 |
NAMCO BANDAI Holdings, Inc. | | 20,400 | 317,219 |
Sankyo Co., Ltd. | | | | 7,100 | 311,248 |
Sumitomo Bakelite Co., Ltd. | | 8,000 | 57,679 |
| | | | | 939,191 |
Gas & Other Public Utilities 0.5% | | | |
Osaka Gas Co., Ltd. | | | | 89,000 | 344,833 |
Government Aircraft & Defense 0.2% | | | |
Mitsui Engineering & Shipbuilding | | | |
Co., Ltd. | | | | 32,000 | 135,095 |
Instruments 0.1% | | | | | |
Nikon Corp. | | | | 5,000 | 104,941 |
Insurance 0.7% | | | | | |
Aioi Insurance Co., Ltd. | | | | 51,000 | 354,421 |
NIPPONKOA Insurance Co., Ltd. | | 15,000 | 128,188 |
| | | | | 482,609 |
IT Hardware 1.1% | | | | | |
Alps Electric Co., Ltd. | | | | 13,000 | 151,806 |
Brother Industries Ltd. | | | | 20,000 | 270,045 |
Seiko Epson Corp. | | | | 11,600 | 340,595 |
| | | | | 762,446 |
| | Number of | Value |
Security | | Shares | ($) |
| | | | |
Land & Water Transportation 0.8% | | | | |
Seino Transportation Co., Ltd. | | | 18,000 | 169,618 |
West Japan Railway Co. | | | 79 | 364,138 |
| | | | 533,756 |
Mainframe & Minicomputers 0.4% | | | | |
NEC Corp. | | | 49,000 | 261,900 |
Metal Products & Machinery 0.7% | | | | |
Bosch Corp. | | | 33,000 | 149,200 |
Hitachi Construction Machinery Co., | | | |
Ltd. | | | 6,900 | 185,865 |
Sega Sammy Holdings, Inc. | | | 3,200 | 74,587 |
Toyo Seikan Kaisha Ltd. | | | 5,600 | 112,497 |
| | | | 522,149 |
Miscellaneous Finance 1.0% | | | | |
Mitsubishi UFJ Securities Co., Ltd. | | 21,000 | 238,580 |
Okasan Holdings, Inc. | | | 13,000 | 101,043 |
Shinko Securities Co., Ltd. | | | 2,000 | 10,081 |
Shinsei Bank Ltd. | | | 71,000 | 339,502 |
| | | | 689,206 |
Oil Distribution 0.5% | | | | |
Nippon Mining Holdings, Inc. | | | 37,500 | 321,405 |
Photo-optical, Micros & Office Machinery 0.6% | | |
Konica Minolta Holdings, Inc. * | | | 31,000 | 406,151 |
Publishing, Broadcasting & Cinema 0.7% | | | |
Dentsu, Inc. | | | 27 | 75,280 |
Fuji Television Network, Inc. | | | 4 | 9,248 |
Hakuhodo DY Holdings, Inc. | | | 2,940 | 205,259 |
Toppan Printing Co., Ltd. | | | 9,000 | 93,747 |
TV Asahi Corp. | | | 73 | 146,456 |
| | | | 529,990 |
Real Estate Development 1.1% | | | |
Daito Trust Construction Co., Ltd. | | 8,000 | 374,814 |
Hankyu Hanshin Holdings, Inc. | | | 61,000 | 368,583 |
| | | | 743,397 |
Retail 0.5% | | | | |
Aoyama Trading Co., Ltd. | | | 5,300 | 167,829 |
FamilyMart Co., Ltd. | | | 7,600 | 210,976 |
| | | | 378,805 |
Textiles & Apparel 0.3% | | | | |
Onward Kashiyama Co., Ltd. | | | 14,000 | 194,191 |
Trading Company 0.3% | | | | |
Sojitz Corp. * | | | 47,300 | 196,552 |
| | | | 14,514,468 |
Malaysia 1.2% | | | | |
Agriculture, Food & Beverage 0.1% | | | | |
PPB Group Berhad | | | 20,000 | 36,982 |
Banks & Credit Institutions 0.1% | | | |
Hong Leong Credit Berhad | | | 11,000 | 18,275 |
RHB Capital Berhad | | | 59,000 | 81,522 |
| | | | 99,797 |
Cellular & Wireless 0.2% | | | | |
Maxis Communications Berhad | | | 35,000 | 120,346 |
| | | | | |
72 Laudus Funds Annual Report
See financial notes.
Laudus Rosenberg International Discovery Fund |
| | | | | Number of | Value |
Security | | | | | Shares | ($) |
| | | | | | |
Communications Utilities 0.1% | | | | |
Digi.com Berhad | | | | | 16,000 | 86,586 |
Electric Utilities 0.1% | | | | | | |
Tenaga Nasional Berhad | | | | | 24,000 | 79,150 |
Financial Investments 0.1% | | | | | |
Hong Leong Bank Berhad | | | | 27,000 | 46,794 |
Oil Distribution 0.1% | | | | | | |
Petronas Dagangan Berhad | | | | 24,000 | 42,657 |
Restaurants, Hotels & Theaters 0.2% | | | |
Genting Berhad | | | | | 16,000 | 183,877 |
Wholesale 0.2% | | | | | | |
Sime Darby Berhad | | | | | 58,000 | 135,521 |
| | | | | | 831,710 |
Mexico 1.1% | | | | | | |
Agriculture, Food & Beverage 0.2% | | | |
Embotelladoras Arca S.A. | | | | 3,900 | 14,316 |
Grupo Bimbo S.A. de C.V., Series A | 17,300 | 86,984 |
Grupo Continental S.A. | | | | | 6,700 | 14,446 |
| | | | | | 115,746 |
Banks & Credit Institutions 0.2% | | | |
Grupo Financiero Banorte S.A. de | | | |
C.V., Class O | | | | | 35,900 | 170,422 |
Basic Minerals & Metals 0.3% | | | | | |
Grupo Mexico SAB de C.V., Series B | 36,700 | 171,227 |
Industrias CH S.A., Series B * | | | 12,400 | 52,338 |
| | | | | | 223,565 |
Retail 0.3% | | | | | | |
Controladora Comercial Mexicana | | | |
S.A. de C.V. | | | | | 21,300 | 60,186 |
Grupo Carso S.A. de C.V., Series A1 | 19,100 | 69,560 |
Organizacion Soriana S.A.B de C.V., | | |
Series B | | | | | 16,200 | 48,432 |
| | | | | | 178,178 |
Textiles & Apparel 0.1% | | | | | |
Alfa S.A., Series A | | | | | 14,000 | 103,355 |
| | | | | | 791,266 |
Netherlands 1.5% | | | | | | |
Agriculture, Food & Beverage 0.2% | | | |
CSM N.V. CVA | | | | | 4,091 | 146,342 |
Chemicals & Rubber 0.6% | | | | | | |
Koninklijke DSM N.V. | | | | | 8,784 | 394,194 |
Furniture & Household Items 0.2% | | | |
Hunter Douglas N.V. | | | | | 2,000 | 176,463 |
Information & Services 0.3% | | | | | | |
Vedior N.V. CVA | | | | | 10,400 | 231,795 |
Wholesale 0.2% | | | | | | |
Buhrmann N.V. | | | | | 10,000 | 134,312 |
| | | | | | 1,083,106 |
New Zealand 0.1% | | | | | | |
Airlines 0.1% | | | | | | |
Air New Zealand Ltd. | | | | | 50,000 | 83,451 |
| | | Number of | Value |
Security | | | Shares | ($) |
| | | | |
Philippines 0.2% | | | | |
Agriculture, Food & Beverage 0.1% | | | |
JG Summit Holding, Inc. | | | 210,000 | 55,309 |
| | | | |
Banks & Credit Institutions 0.1% | | | |
Bank of the Philippine Islands | | 8,000 | 10,832 |
Metropolitan Bank & Trust Co. | | 50,000 | 64,383 |
| | | | 75,215 |
| | | | 130,524 |
Poland 1.6% | | | | |
Banks & Credit Institutions 0.3% | | | |
Bank Handlowy w Warszawie S.A. | 6,000 | 200,161 |
Basic Minerals & Metals 0.4% | | | | |
KGHM Polska Miedz S.A. | | | 8,100 | 271,052 |
Communications Utilities 0.3% | | | |
Telekomunikacja Polska S.A. | | 31,500 | 257,761 |
Oil Distribution 0.6% | | | | |
Grupa Lotos S.A. * | | | 6,000 | 88,079 |
Polski Koncern Naftowy Orlen S.A. * | 20,000 | 327,217 |
| | | | 415,296 |
| | | | 1,144,270 |
Portugal 0.4% | | | | |
Banks & Credit Institutions 0.4% | | | |
Banco Espirito Santo, S.A. | | | | |
(BES) Reg’d | | | 16,000 | 305,802 |
Russia 0.6% | | | | |
Basic Minerals & Metals 0.2% | | | | |
Mechel ADR | | | 4,900 | 162,925 |
Communications Utilities 0.4% | | | |
Rostelecom ADR | | | 5,000 | 259,450 |
Oil & Coal Resources 0.0% | | | | |
Tatneft GDR | | | 300 | 28,500 |
| | | | 450,875 |
Singapore 1.0% | | | | |
Agriculture, Food & Beverage 0.0% | | | |
Asia Food & Properties Ltd. | | 66,000 | 30,195 |
Airlines 0.2% | | | | |
Singapore Airlines Ltd. | | | 11,000 | 120,013 |
Autos 0.1% | | | | |
Jardine Cycle & Carriage Ltd. | | 7,000 | 54,695 |
Commercial Aircraft & Components | 0.1% | |
Singapore Technologies Engineering | | |
Ltd. (ST Engg) | | | 31,000 | 67,709 |
Electric Utilities 0.2% | | | | |
Sembcorp Industries Ltd. | | | 43,000 | 144,164 |
Insurance 0.1% | | | | |
Great Eastern Holding Ltd. | | | 4,000 | 51,793 |
See financial notes.
Laudus Funds Annual Report 73
Laudus Rosenberg International Discovery Fund |
Portfolio Holdings continued | | | |
| | | | | |
| | | | Number of | Value |
Security | | | | Shares | ($) |
| | | | | |
Real Estate Development 0.3% | | | |
Fraser & Neave Ltd. | | | | 41,000 | 137,551 |
Wheelock Properties (S) Ltd. | | | 18,000 | 38,311 |
Wing Tai Holdings Ltd. | | | | 31,000 | 64,683 |
| | | | | 240,545 |
| | | | | 709,114 |
South Africa 2.0% | | | | | |
Banks & Credit Institutions 0.4% | | | |
Nedbank Group Ltd. | | | | 16,000 | 309,642 |
Basic Minerals & Metals 0.9% | | | | | |
African Rainbow Minerals Ltd. * | | 12,000 | 169,670 |
AngloGold Ashanti Ltd. | | | | 1,500 | 66,799 |
Harmony Gold Mining Co., Ltd. * | 10,558 | 146,603 |
Mittal Steel South Africa Ltd. | | | 16,000 | 260,858 |
| | | | | 643,930 |
Communications Utilities 0.4% | | | |
Telkom South Africa Ltd. | | | | 14,000 | 319,605 |
Insurance 0.3% | | | | | |
Liberty Group Ltd. | | | | 14,000 | 158,865 |
Sanlam Ltd. | | | | 7,607 | 20,877 |
| | | | | 179,742 |
| | | | | 1,452,919 |
South Korea 2.9% | | | | | |
Agriculture, Food & Beverage 0.1% | | | |
Lotte Confectionery Co., Ltd. | | | 70 | 89,492 |
Autos 0.0% | | | | | |
Hyundai Mobis | | | | 240 | 20,593 |
Banks & Credit Institutions 0.1% | | | |
Woori Finance Holdings Co., Ltd. | 3,760 | 90,937 |
Basic Minerals & Metals 0.1% | | | | | |
Korea Zinc Co., Ltd. | | | | 730 | 77,502 |
Beer, Liquor, & Tobacco 0.1% | | | | |
KT&G Corp. | | | | 990 | 64,605 |
Chemicals & Rubber 0.1% | | | | | |
Hanwha Chemical Corp. | | | | 2,690 | 41,747 |
Communications Utilities 0.4% | | | |
KT Corp. | | | | 2,700 | 120,985 |
KT Freetel Co., Ltd. | | | | 4,360 | 121,817 |
LS Cable Ltd. | | | | 1,310 | 57,117 |
| | | | | 299,919 |
Government Aircraft & Defense 0.8% | | |
Hyundai Heavy Industries Co., Ltd. | 1,410 | 280,555 |
Hyundai Mipo Dockyard Co., Ltd. | 570 | 104,692 |
Samsung Heavy Industries Co., Ltd. | 6,460 | 171,566 |
| | | | | 556,813 |
Metal Products & Machinery 0.3% | | | |
Doosan Corp. * | | | | 1,150 | 93,817 |
Doosan Infracore Co., Ltd. | | | | 5,090 | 129,466 |
| | | | | 223,283 |
Oil Distribution 0.5% | | | | | |
SK Corp. | | | | 3,760 | 368,259 |
Retail 0.2% | | | | | |
Shinsegae Co., Ltd. | | | | 220 | 126,074 |
| | | | Number of | Value |
Security | | | | Shares | ($) |
| | | | | |
Wholesale 0.2% | | | | | |
Hanwha Corp. | | | | 2,430 | 98,579 |
| | | | | 2,057,803 |
Spain 1.8% | | | | | |
Airlines 0.4% | | | | | |
Iberia Lineas Aereas de Espana S.A. | 54,000 | 288,809 |
Construction Materials 0.3% | | | | |
Cementos Portland Valderrivas, S.A. | 1,200 | 181,421 |
Gas & Other Public Utilities 0.4% | | |
Enagas, S.A. | | | | 11,900 | 307,219 |
Land & Water Transportation 0.2% | | |
Altadis, S.A. | | | | 2,700 | 173,169 |
Restaurants, Hotels & Theaters 0.5% | | | |
NH Hoteles, S.A. | | | | 5,600 | 128,968 |
Sol Melia, S.A. | | | | 8,100 | 194,987 |
�� | | | | | 323,955 |
| | | | | 1,274,573 |
Sweden 1.2% | | | | | |
Basic Minerals & Metals 0.5% | | | | |
Boliden AB * | | | | 15,000 | 331,310 |
Communications Utilities 0.4% | | | | |
Tele2 AB, Class B | | | | 18,000 | 295,635 |
Government Aircraft & Defense 0.2% | | | |
Saab AB, Series B | | | | 6,000 | 161,925 |
Real Estate Development 0.1% | | | | |
Castellum AB | | | | 756 | 10,920 |
Kungsleden AB | | | | 1,165 | 20,959 |
| | | | | 31,879 |
| | | | | 820,749 |
Switzerland 2.3% | | | | | |
Banks & Credit Institutions 0.1% | | |
Verwaltungs-und Privat-Bank AG | | 280 | 68,750 |
Basic Minerals & Metals 0.2% | | | | |
Georg Fischer AG-Reg’d. * | | | 160 | 115,763 |
Chemicals & Rubber 0.3% | | | | | |
Clariant AG-Reg’d * | | | | 13,000 | 223,612 |
Drugs & Pharmaceuticals 0.3% | | | | |
Ciba Specialty Chemicals AG-Reg’d | 3,300 | 217,876 |
Electric Utilities 0.0% | | | | | |
Energiedienst Holding AG-Reg’d * | | 52 | 26,240 |
Information & Services 0.1% | | | | |
Kuoni Reisen Holding AG-Reg’d * | | 136 | 81,582 |
Insurance 1.3% | | | | | |
Baloise Holding AG-Reg’d | | | 2,800 | 292,371 |
Helvetia Holding AG | | | | 540 | 231,947 |
Swiss Life Holding-Reg’d | | | | 1,440 | 362,382 |
| | | | | 886,700 |
| | | | | 1,620,523 |
Taiwan 3.3% | | | | | |
Autos 0.1% | | | | | |
China Motor Corp. | | | | 48,600 | 42,642 |
| | | | | | |
74 Laudus Funds Annual Report
See financial notes.
Laudus Rosenberg International Discovery Fund |
| | | | Number of | Value |
Security | | | | Shares | ($) |
| | | | | |
Banks & Credit Institutions 0.4% | | | |
China Development Financial Holding | | |
Corp. | | | | 392,000 | 174,538 |
Hua Nan Financial Holdings Co., Ltd. | 189,000 | 141,359 |
| | | | | 315,897 |
Basic Minerals & Metals 0.1% | | | |
Walsin Lihwa Corp. * | | | | 146,000 | 74,627 |
Cellular & Wireless 0.1% | | | | |
Taiwan Mobile Co., Ltd. | | | | 105,000 | 112,479 |
Chemicals & Rubber 0.7% | | | | | |
Formosa Chemicals & Fibre Corp. | 109,730 | 210,053 |
Formosa Plastics Corp. | | | | 155,000 | 293,610 |
| | | | | 503,663 |
Communications Utilities 0.1% | | | |
Far Eastern Textile Ltd. | | | | 3,000 | 2,574 |
Far EasTone Telecommunications Co., | | |
Ltd. | | | | 65,000 | 73,855 |
| | | | | 76,429 |
Construction Materials 0.1% | | | |
Taiwan Cement Corp. | | | | 89,000 | 74,834 |
IT Hardware 0.9% | | | | | |
Advanced Semiconductor | | | | |
Engineering, Inc. * | | | | 50,000 | 59,430 |
Lite-On Technology Corp. | | | 437 | 563 |
Nan Ya Plastics Corp. | | | | 96,000 | 179,515 |
Nanya Technology Corp. | | | 30,000 | 25,009 |
Powerchip Semiconductor Corp. | 219,119 | 130,949 |
ProMOS Technologies, Inc. * | | | 283,000 | 109,652 |
Vanguard International Semiconductor | | |
Corp. | | | | 71,379 | 60,045 |
Winbond Electronics Corp. * | | | 190,000 | 67,301 |
| | | | | 632,464 |
Mainframe & Minicomputers 0.2% | | | |
Compal Electronics, Inc. | | | 33,320 | 28,147 |
Inventec Co., Ltd. | | | | 24,000 | 19,112 |
Quanta Computer, Inc. | | | | 45,550 | 69,329 |
| | | | | 116,588 |
Photo-optical, Micros & Office Machinery 0.6% | |
Acer, Inc. | | | | 82,460 | 157,915 |
Asustek Computer, Inc. | | | | 64,000 | 150,273 |
Wistron Corp. | | | | 59,000 | 89,249 |
| | | | | 397,437 |
| | | | | 2,347,060 |
Thailand 0.8% | | | | | |
Banks & Credit Institutions 0.5% | | | |
Bangkok Bank Public Co., Ltd. | | 50,000 | 154,203 |
Kasikornbank Public Co., Ltd. | | | 60,000 | 111,285 |
Krung Thai Bank Public Co., Ltd. | 209,000 | 72,227 |
| | | | | 337,715 |
Cellular & Wireless 0.1% | | | | |
Total Access Communication Public | | |
Co., Ltd. * | | | | 15,000 | 67,660 |
Oil & Coal Resources 0.1% | | | | | |
Banpu Public Co., Ltd. | | | | 7,000 | 40,035 |
| | | | | | |
| | | | Number of | Value |
Security | | | | Shares | ($) |
| | | | | |
Oil Distribution 0.1% | | | | |
PTT Exploration & Production Public | | |
Co., Ltd. | | | | 36,000 | 92,545 |
| | | | | 537,955 |
Turkey 0.9% | | | | | |
| | | | | |
Autos 0.4% | | | | | |
Koc Holding A/S * | | | | 56,000 | 250,205 |
Oil Distribution 0.5% | | | | |
Petrol Ofisi A/S | | | | 21,000 | 89,166 |
Tupras-Turkiye Petrol Rafinerileri A/S | 12,000 | 266,057 |
| | | | | 355,223 |
| | | | | 605,428 |
United Kingdom 11.7% | | | | |
Agriculture, Food & Beverage 0.4% | | | |
Tate & Lyle plc | | | | 23,709 | 268,937 |
Autos 0.4% | | | | | |
GKN plc | | | | 38,000 | 285,018 |
Banks & Credit Institutions 0.0% | | |
Intermediate Capital Group plc | | 58 | 2,226 |
Basic Minerals & Metals 0.6% | | | | |
Antofagasta plc | | | | 24,078 | 245,758 |
Kazakhmys plc | | | | 8,887 | 205,597 |
| | | | | 451,355 |
Beer, Liquor, & Tobacco 0.5% | | | | |
Scottish & Newcastle plc | | | 29,000 | 343,483 |
Cellular & Wireless 0.3% | | | | | |
The Carphone Warehouse plc | | 38,000 | 208,129 |
Communications Utilities 0.1% | | | | |
Cable & Wireless | | | | 12,000 | 39,484 |
COLT Telecom Group S.A. * | | 18,000 | 63,172 |
| | | | | 102,656 |
Construction Materials 0.0% | | | |
Cookson Group plc | | | | 2,523 | 30,874 |
Electric Utilities 1.0% | | | | |
British Energy Group plc * | | | 32,000 | 307,300 |
Internationall Power plc | | | 49,000 | 382,993 |
| | | | | 690,293 |
Forest Products & Paper 0.1% | | | | |
DS Smith plc | | | | 18,000 | 79,101 |
Furniture & Household Items 0.5% | | | |
Smiths Group plc | | | | 17,279 | 349,297 |
Gas & Other Public Utilities 0.6% | | |
Kelda Group plc | | | | 8,821 | 163,165 |
Northumbrian Water Group plc | | 20,000 | 122,400 |
United Utilities plc | | | | 11,200 | 166,875 |
| | | | | 452,440 |
Government Aircraft & Defense 0.1% | | | |
Vt Group plc | | | | 9,000 | 87,085 |
Information & Services 0.4% | | | |
Group 4 Securicor plc | | | 63,000 | 249,361 |
See financial notes.
Laudus Funds Annual Report 75
Laudus Rosenberg International Discovery Fund |
Portfolio Holdings continued | | | |
| | | | |
| | | Number of | Value |
Security | | | Shares | ($) |
| | | | |
Insurance 1.5% | | | | |
Amlin plc | | | 32,000 | 178,208 |
Brit Insurance Holdings plc | | | 16,000 | 101,527 |
Friends Provident plc | | | 84,000 | 318,559 |
Old Mutual | | | 48,000 | 155,469 |
Resolution plc | | | 24,800 | 302,586 |
| | | | 1,056,349 |
Miscellaneous Finance0.6% | | | | |
Investec plc | | | 19,200 | 248,893 |
Legal & General Gp | | | 48,000 | 150,666 |
| | | | 399,559 |
Publishing, Broadcasting & Cinema 0.3% | | |
Trinity Mirror plc | | | 17,488 | 182,704 |
Real Estate Development 0.6% | | | | |
Enterprise Inns plc | | | 24,579 | 323,963 |
Mapeley Ltd. | | | 877 | 67,046 |
Minerva plc * | | | 3,000 | 22,589 |
Shaftesbury plc | | | 2,766 | 41,258 |
| | | | 454,856 |
Real Estate Investment Trusts 0.6% | | | |
Brixton plc | | | 14,000 | 140,231 |
Hammerson plc | | | 8,322 | 284,539 |
| | | | 424,770 |
Restaurants, Hotels & Theaters 2.4% | |
Compass Group | | | 32,000 | 214,328 |
Greene King plc | | | 10,800 | 234,418 |
Marston’s plc | | | 9,838 | 85,482 |
Millennium & Copthorne Hotel plc | 14,501 | 194,226 |
Punch Taverns plc | | | 13,000 | 319,237 |
Whitbread plc | | | 9,300 | 346,290 |
William Hill plc | | | 21,600 | 270,620 |
| | | | 1,664,601 |
Retail 0.2% | | | | |
Alliance Boots plc | | | 3,656 | 73,909 |
Pendragon plc | | | 30,000 | 71,387 |
| | | | 145,296 |
Software 0.5% | | | | |
Dimension Data Holdings plc | | 70,583 | 69,689 |
Logicacmg | | | 72,921 | 255,689 |
| | | | 325,378 |
| | | | 8,253,768 |
Total Common Stock (Cost $59,606,638) | 67,724,126 |
| | | | |
Preferred Stock 1.5% of net assets | | |
| | | | |
Brazil 1.4% | | | | |
Acesita S.A. | | | 2,100 | 74,040 |
Aracruz Celulose S.A. | | | 21,500 | 111,554 |
Brasil Telecom Participacoes S.A. * | 1,575,000 | 14,142 |
Centrais Eletricas Brasileiras S.A. | | 1,368,000 | 29,746 |
Companhia Brasileira de Petroleo | | | |
Ipiranga | | | 1,400 | 17,090 |
Companhia Energetica de Minas | | | |
| | | | | |
| Number of | Value |
Security | Shares | ($) |
| | |
Companhia Paranaense de Energia-Copel * | 5,964,000 | 69,473 |
Elektro-Eletricidade e Servicos S.A. | 3,812,000 | 23,775 |
Eletropaulo Metropolitana S.A. * | 1,116,679 | 52,032 |
Gerdau S.A. | 4,400 | 80,641 |
Tele Norte Leste Participacoes S.A. | 11,000 | 152,429 |
Telemar Norte Leste S.A. | 2,700 | 55,434 |
Usinas Siderurgicas de Minas Gerais S.A. | 2,900 | 140,447 |
Votorantim Celulose e Papel S.A. * | 3,800 | 69,681 |
| | 957,399 |
Columbia 0.1% | | |
BanColombia S.A. ADR | 3,100 | 85,839 |
United Kingdom 0.0% | | |
Rolls-Royce Group plc * | 888,000 | 1,791 |
Total Preferred Stock (Cost $940,867) | | 1,045,029 |
| | |
Rights 0.0% of net assets | | |
| | |
Citic Pacific Ltd. (a)* | 2,200 | — |
Conwert Immobilien Invest AG * | 2,500 | — |
Suncorp-Metway Ltd. * | 2,466 | 10,575 |
Total Rights (Cost $ — ) | | 10,575 |
| | |
| | |
| Face | |
Security | Amount | Value |
Rate, Maturity Date | ($) | ($) |
| | |
Short-Term Investment 1.4% of net assets | |
| | |
Repurchase Agreement 1.4% | | |
Fixed Income Clearing Corp. dated | | |
03/30/07, due 04/02/07 at 5.00%, | | |
with a maturity value of $983,410 | | |
(fully collateralized by Federal | | |
Home Loan Bank with a value of | | |
$1,007,219) | 983,000 | 983,000 |
Total Short-Term Investment | | |
(Cost $983,000) | | 983,000 |
End of Investments. | | |
| | |
At 03/31/07, the tax basis cost of the fund’s investments was |
$61,931,534 and the unrealized appreciation and depreciation was |
$9,055,176 and ($1,223,980), respectively, with a net unrealized |
appreciation of $7,831,196. | | |
At 03/31/07, the prices of certain foreign securities held by the |
fund aggregating $61,619,946 were adjusted from their closing |
market prices following the guidelines adopted by the fund’s |
Board of Trustees. | | |
* Non-income producing security. | | |
(a) Fair-valued by Management. | | |
ADR — American Depositary Receipt | | |
CVA — Dutch Certificate | | |
GDR — Global Depositary Receipt | | |
| | | | |
76 Laudus Funds Annual Report
See financial notes.
Laudus Rosenberg International Small Capitalization Fund |
Portfolio Holdings as of March 31, 2007 | |
| | | |
| | Cost | Value |
Holdings by Category | ($) | ($) |
| | | |
96.8% | Common Stock | 1,528,627,990 | 1,869,932,546 |
0.1% | Preferred Stock | 1,621,605 | 2,433,143 |
0.1% | Rights | — | 1,033,254 |
—% | Warrants | — | 39,371 |
1.7% | Short-Term | | |
| Investment | 33,108,000 | 33,108,000 |
| | | |
98.7% | Total Investments | 1,563,357,595 | 1,906,546,314 |
7.6% | Collateral Invested for | | |
| Securities on Loan | 146,492,602 | 146,492,602 |
(6.3)% | Other Assets and | | |
| Liabilities | | (122,047,248) |
| | | |
100.0% | Net Assets | | 1,930,991,668 |
| | Number of | Value |
Security | | Shares | ($) |
| | | |
Common Stock 96.8% of net assets | |
| | | |
Australia 4.3% | | | |
| | | |
Agriculture, Food & Beverage 0.2% | | |
ABB Grain Ltd. | | 269,671 | 1,683,906 |
Forest Enterprises Australia | | | |
Ltd. | | 291,389 | 173,221 |
Futuris Corp., Ltd. | | 749,505 | 1,309,016 |
Ridley Corp., Ltd. | | 914,900 | 834,862 |
| | | 4,001,005 |
Banks & Credit Institutions 0.0% | | |
Bendigo Bank Ltd. | | 53,732 | 738,079 |
Basic Minerals & Metals 1.6% | | | |
Ausdrill Ltd. | | 556,300 | 897,411 |
BlueScope Steel Ltd. | | 25,300 | 214,595 |
Consolidated Rutile Ltd. | | 374,075 | 207,295 |
Equigold NL | | 502,059 | 663,294 |
Felix Resources Ltd. | | 351,965 | 1,419,919 |
Independence Group NL | | 362,364 | 1,452,341 |
Jabiru Metals Ltd. * | | 641,876 | 643,429 |
Jubilee Mines NL | | 236,600 | 3,340,096 |
Macmahon Holdings Ltd. | | 1,699,900 | 1,167,717 |
Minara Resources Ltd. | | 540,059 | 3,215,327 |
Mincor Resources NL | | 872,984 | 2,161,607 |
Onesteel Ltd. | | 564,800 | 2,352,561 |
Perilya Ltd. | | 534,800 | 1,559,359 |
Portman Ltd. * | | 106,301 | 423,304 |
Sally Malay Mining Ltd. * | | 585,881 | 1,860,672 |
Smorgon Steel Group Ltd. | | 1,422,508 | 2,344,259 |
Sons Of Gwalia Ltd. (a)(b)(c)* | | 58,024 | — |
Straits Resources Ltd. | | 440,822 | 1,332,798 |
Zinifex Ltd. | | 413,900 | 5,267,874 |
| | | 30,523,858 |
Chemicals & Rubber 0.2% | | | |
| | | | |
Incitec Pivot Ltd. | | 79,900 | 3,192,598 |
Construction & Homebuilding 0.1% |
| |
Leighton Holdings Ltd. | | 1,800 | 48,751 |
Sunland Group Ltd. | | 643,700 | 1,746,901 |
| | | 1,795,652 |
Construction Materials 0.1% | | |
Adelaide Brighton Ltd. | | 670,150 | 1,856,685 |
| | | Number of | Value |
Security | | | Shares | ($) |
| | | | |
Financial Investments 0.0% | | | |
National Hire Group Ltd. | | | 72,200 | 93,396 |
Forest Products & Paper 0.2% | | | |
PaperlinX Ltd. | | | 1,123,870 | 3,782,971 |
Gas & Other Public Utilities 0.1% | | | |
Hastings Diversified Utilities Fund | | | 49,400 | 129,060 |
Transpacific Industries Group Ltd. | | | 243,440 | 2,118,698 |
| | | | 2,247,758 |
Government Aircraft & Defense0.0% | | |
Austal Ltd. | | | 4,900 | 12,482 |
Information & Services 0.2% | | | | |
Coffey International Ltd. | | | 25,700 | 81,375 |
Credit Corp Group Ltd. | | | 3,800 | 31,442 |
Monadelphous Group Ltd. | | 153,684 | 1,319,547 |
Programmed Maintenance Services Ltd. | | | 8,200 | 34,159 |
WorleyParsons Ltd. | | | 120,300 | 2,680,723 |
| | | | 4,147,246 |
Land & Water Transportation 0.0% | | |
K & S Corp., Ltd. | | | 4,444 | 13,941 |
Miscellaneous Finance 0.1% | | | | |
IOOF Holdings Ltd. | | | 224,900 | 1,811,517 |
Oil & Coal Resources 0.0% | | | |
New Hope Corp., Ltd. | | | 480,937 | 594,457 |
Publishing, Broadcasting & Cinema 0.3% | | |
Austereo Group Ltd. | | | 664,205 | 1,100,235 |
Seven Network Ltd. | | | 71,500 | 659,801 |
Village Roadshow Ltd. | | | 111,739 | 298,016 |
West Australian Newspapers Holdings Ltd. | | | 327,870 | 4,139,384 |
| | | | 6,197,436 |
Real Estate Development 0.3% | | | |
Lend Lease Corp., Ltd. | | | 289,500 | 4,674,055 |
Port Bouvard Ltd. | | | 103,200 | 212,546 |
| | | | 4,886,601 |
Restaurants, Hotels & Theaters 0.0% | | |
Amalgamated Holdings Ltd. | | 118,887 | 624,192 |
Retail 0.3% | | | | |
David Jones Ltd. | | | 560,500 | 2,059,695 |
Goodman Fielder Ltd. | | | 1,161,814 | 2,293,046 |
Just Group Ltd. | | | 277,628 | 934,285 |
Specialty Fashion Group Ltd. | | 60,318 | 95,298 |
| | | | 5,382,324 |
Software 0.1% | | | | |
HPAL Ltd. | | | 325,379 | 509,877 |
Iress Market Technology Ltd. | | 158,276 | 1,036,201 |
Oakton Ltd. | | | 47,825 | 171,898 |
UXC Ltd. | | | 604,692 | 845,014 |
| | | | 2,562,990 |
Textiles & Apparel 0.2% | | | | |
| | | | | |
Pacific Brands Ltd. | | | 1,157,300 | 2,870,386 |
See financial notes.
Laudus Funds Annual Report 77
Laudus Rosenberg International Small Capitalization Fund |
Portfolio Holdings continued | | |
| | | | |
| | | Number of | Value |
Security | | | Shares | ($) |
| | | | |
Wholesale 0.3% | | | | |
Alesco Corp., Ltd. | | | 27,468 | 277,339 |
Crane Group Ltd. | | | 108,400 | 1,436,308 |
Housewares International | | | |
Ltd. * | | | 3,353 | 7,292 |
Sims Group Ltd. | | | 202,873 | 3,824,129 |
| | | | 5,545,068 |
| | | | 82,880,642 |
Austria 2.0% | | | | |
| | | | |
Agriculture, Food & Beverage0.0% | | |
Agrana Beteiligungs AG | | 2,589 | 261,187 |
Airlines 0.0% | | | | |
Austrian Airlines/ | | | | |
Osterreichische Luftverkehrs | | |
AG * | | | 11,918 | 172,316 |
Basic Minerals & Metals1.3% | | | |
Boehler-uddeholm Ag | | | 118,181 | 11,388,047 |
Voestalpine AG (a) | | | 171,519 | 12,445,533 |
| | | | 23,833,580 |
Communications Utilities0.1% | | | |
Telekom Austria AG | | | 66,400 | 1,668,459 |
Forest Products & Paper0.1% | | | |
Mayr-Melnhof Karton AG | | 5,583 | 1,246,342 |
Real Estate Development0.5% | | | |
Conwert Immobilien Invest | | | |
AG * | | | 66,243 | 1,457,464 |
Immofinanz Immobilien | | | |
Analagen AG * | | | 540,000 | 8,684,363 |
| | | | 10,141,827 |
Software 0.0% | | | | |
Brain Force Holding AG | | 4,740 | 21,362 |
S&T System Integration & | | | |
Technology Distribution AG * | 4,341 | 330,539 |
| | | | 351,901 |
Textiles & Apparel0.0% | | | | |
Linz Textil Holding AG* | | | 158 | 35,881 |
Wolford AG * | | | 2,744 | 137,310 |
| | | | 173,191 |
Wholesale 0.0% | | | | |
Ottakringer Brauerei AG | | 564 | 64,444 |
| | | | 37,913,247 |
Belgium 1.5% | | | | |
| | | | |
Agriculture, Food & Beverage0.0% | | |
Sipef N.V. | | | 69 | 24,397 |
Basic Minerals & Metals0.1% | | | |
Bekaert N.V. | | | 6,680 | 911,818 |
Chemicals & Rubber0.2% | | | | |
Solvay Sa | | | 4,258 | 656,577 |
Tessenderlo Chemie N.V. | | 66,754 | 3,271,856 |
| | | | 3,928,433 |
| | | | Number of | Value |
Security | | | | Shares | ($) |
| | | | | |
Commercial Aircraft & Components 0.0% | | |
Societe Anonyme Belge de | | | | |
Constructions Aeronautques | | | |
(SABCA) | | | | 681 | 18,194 |
Financial Investments0.0% | | | | | |
Econocom Group | | | | 61,677 | 659,130 |
Instruments 0.4% | | | | | |
Agfa Gevaert N.V. | | | | 265,000 | 5,998,909 |
Ion Bearn Applications * | | | | 39,216 | 1,144,144 |
| | | | | 7,143,053 |
Metal Products & Machinery 0.0% | | | |
Jensen Group N.V. * | | | | 31,418 | 255,140 |
Real Estate Development 0.3% | | | | |
Cofinimmo | | | | 22,600 | 4,710,782 |
Compagnie Immobiliere de | | | | | |
Belgique S.A. | | | | 2,428 | 154,145 |
Intervest Offices | | | | 7,416 | 318,723 |
Wereldhave Belgium | | | | 35 | 3,038 |
| | | | | 5,186,688 |
Restaurants, Hotels & Theaters | 0.2% | |
S.A. D’Ieteren N.V. | | | | 8,310 | 3,423,581 |
Retail 0.3% | | | | | |
Brantano Group N.V. | | | | 4,261 | 200,929 |
Delhaize Group | | | | 69,956 | 6,455,404 |
| | | | | 6,656,333 |
Software 0.0% | | | | | |
Dolmen Computer Applications | | | |
N.V. | | | | 9,172 | 147,858 |
Wholesale 0.0% | | | | | |
SAPEC S.A. | | | | 2,737 | 363,949 |
| | | | | 28,718,574 |
Canada 5.7% | | | | | |
| | | | | |
Agriculture, Food & Beverage 0.1% | | | |
Saputo, Inc. | | | | 50,440 | 2,017,600 |
Airlines 0.1% | | | | | |
ACE Aviation Holdings, Inc., | | | | |
Class A * | | | | 72,300 | 1,907,542 |
Transat A.T., Inc., Class A | | | | 17,300 | 528,066 |
| | | | | 2,435,608 |
Banks & Credit Institutions 0.1% | | | |
Laurentian Bank of Canada | | | | 60,408 | 1,747,620 |
Basic Minerals & Metals 1.6% | | | | |
Agnico-Eagle Mines Ltd. | | | | 44,060 | 1,558,224 |
Algoma Steel, Inc. * | | | | 82,100 | 3,716,367 |
Aur Resources, Inc. | | | | 210,400 | 4,428,514 |
FNX Mining Co., Inc. * | | | | 100,442 | 2,201,111 |
Gerdau Ameristeel Corp. | | | | 175,260 | 2,076,706 |
Inmet Mining Corp. | | | | 136,100 | 7,485,795 |
IPSCO, Inc. | | | | 26,574 | 3,488,341 |
Northgate Minerals Corp. * | | | 70,600 | 248,889 |
Sherritt International Corp. | | | | 323,821 | 4,667,286 |
Teck Cominco Ltd., Class B | | | 38 | 2,649 |
Yamana Gold, Inc. | | | | 108,493 | 1,568,426 |
| | | | | 31,442,308 |
78 Laudus Funds Annual Report
See financial notes.
Laudus Rosenberg International Small Capitalization Fund |
| | | | | Number of | Value |
Security | | | | | Shares | ($) |
| | | | | | |
Beer, Liquor, & Tobacco 0.0% | | | | |
Rothmans, Inc. | | | | | 50 | 890 |
Biotechnology 0.1% | | | | | | |
QLT, Inc. * | | | | | 203,143 | 1,580,099 |
Chemicals & Rubber 0.2% | | | | | |
Agrium, Inc. | | | | | 400 | 15,366 |
Methanex Corp. | | | | | 185,503 | 4,134,250 |
| | | | | | 4,149,616 |
Communications Utilities 0.1% | | | |
Cogeco Cable, Inc. | | | | | 24,130 | 864,249 |
Drugs & Pharmaceuticals 0.1% | | | |
Angiotech Pharmaceuticals, | | | | |
Inc. * | | | | | 237,913 | 1,283,844 |
Axcan Pharma, Inc. * | | | | | 57,000 | 944,487 |
Patheon, Inc. * | | | | | 8,375 | 34,095 |
| | | | | | 2,262,426 |
Electric Utilities 0.3% | | | | | | |
ATCO Ltd., Class I | | | | | 158,900 | 6,468,861 |
Forest Products & Paper 0.1% | | | | |
Canfor Pulp Income Fund | | | | 74 | 912 |
Cascades, Inc. | | | | | 137,280 | 1,385,285 |
Intertape Polymer Group, Inc. * | | 133,100 | 547,618 |
| | | | | | 1,933,815 |
Furniture & Household Items 0.0% | | | |
Dorel Industries, Inc., Class B | | 5,500 | 178,411 |
Gas & Other Public Utilities 0.0% | | |
Newalta Income Fund | | | | | 28,500 | 639,121 |
Health Care & Hospital 0.0% | | | | |
MDS, Inc. | | | | | 3,010 | 56,967 |
Information & Services 0.1% | | | | |
FirstService Corp. * | | | | | 82,978 | 2,285,579 |
Insurance 0.2% | | | | | | |
Industrial Alliance Insurance | | | | |
and Financial Services, Inc. | | 137,289 | 4,222,722 |
Kingsway Financial Services, | | | |
Inc. | | | | | 12,190 | 228,173 |
Northbridge Financial Corp. | | | 1,700 | 48,210 |
| | | | | | 4,499,105 |
IT Hardware 0.1% | | | | | | |
Celestica, Inc. * | | | | | 177,550 | 1,084,216 |
Metal Products & Machinery 0.3% | | | |
Groupe Laperriere & Verreault, | | | |
Inc., Class A * | | | | | 62,361 | 1,593,460 |
Husky Injection Molding | | | | | |
Systems Ltd. | | | | | 45,360 | 302,531 |
Linamar Corp. | | | | | 197,584 | 2,702,340 |
Martinrea International, Inc. * | | | 101,170 | 1,301,320 |
| | | | | | 5,899,651 |
Miscellaneous Finance 0.3% | | | | |
Canaccord Capital, Inc. | | | | | 123,941 | 2,374,686 |
Dundee Corp., Class A* | | | | | 35,770 | 1,652,329 |
Dundee Wealth Management, | | | |
Inc. | | | | | 135,290 | 1,857,381 |
| | | | | | 5,884,396 |
| | | Number of | Value |
Security | | | Shares | ($) |
| | | | |
Oil & Coal Resources0.2% | | | | |
Canetic Resources Trust | | | 204,412 | 2,645,228 |
Oil Drilling & Services0.5% | | | | |
Flint Energy Services Ltd. * | | | 94,071 | 2,036,236 |
Real Resources, Inc. * | | | 60,962 | 516,949 |
Tesco Corp. * | | | 85,451 | 2,274,499 |
Trican Well Service Ltd. | | | 220,400 | 4,362,183 |
| | | | 9,189,867 |
Publishing, Broadcasting & Cinema 0.5% | | |
Astral Media, Inc. | | | 940 | 32,731 |
CanWest Global | | | | |
Communications Corp. * | | | 160,514 | 1,537,709 |
Corus Entertainment, Inc., | | | | |
Class B | | | 119,000 | 4,540,450 |
Torstar Corp., Class B | | | 4,283 | 73,121 |
Transcontinental, Inc., Class A | | 215,158 | 3,982,613 |
| | | | 10,166,624 |
Real Estate Development 0.0% | | | | |
BPO Properties Ltd. | | | 2,929 | 175,029 |
MI Developments, Inc., | | | | |
Class A | | | 900 | 33,646 |
| | | | 208,675 |
Real Estate Investment Trusts 0.1% | | | |
Canadian Real Estate | | | | |
Investment Trust | | | 28,290 | 759,627 |
Dundee Real Estate | | | | |
Investment Trust | | | 53,483 | 1,839,130 |
| | | | 2,598,757 |
Retail 0.3% | | | | |
Alimentation Couche-Tard, Inc., | | | |
Class B | | | 10 | 209 |
Empire Co., Ltd., Class A | | | 22,500 | 781,507 |
Leon’s Furniture Ltd. | | | 43,000 | 1,862,278 |
Sobeys, Inc. | | | 92,103 | 2,911,875 |
| | | | 5,555,869 |
Soaps & Cosmetics 0.1% | | | | |
CCL Industries, Inc., Class B | | 60,620 | 1,950,657 |
Software 0.2% | | | | |
CGI Group, Inc. * | | | 20,140 | 174,099 |
Open Text Corp. * | | | 148,200 | 3,297,755 |
| | | | 3,471,854 |
| | | | 111,218,069 |
China 0.5% | | | | |
| | | | |
Banks & Credit Institutions 0.0% | | | |
Industrial and Commercial Bank | | | |
of China (Asia) Ltd. | | | 8,000 | 17,481 |
Basic Minerals & Metals 0.0% | | | | |
Jiangxi Copper Co., Ltd., | | | | |
Class H | | | 18,000 | 21,612 |
Drugs & Pharmaceuticals 0.1% | | | | |
Shanghai Industrial Holdings | | | |
Ltd. | | | 692,000 | 1,592,254 |
Tong Ren Tang Technologies | | | |
Co., Ltd., Shares H | | | 77,000 | 136,140 |
| | | | 1,728,394 |
See financial notes.
Laudus Funds Annual Report 79
Laudus Rosenberg International Small Capitalization Fund |
Portfolio Holdings continued | | | | |
| | | | | |
| | | Number of | Value |
Security | | | Shares | ($) |
| | | | | |
Electric Utilities 0.1% | | | | | |
Huadian Power International | | | | | |
Co., Shares H | | | 3,224,000 | 1,153,604 |
Government Aircraft & Defense0.0% | | | |
COSCO International Holdings | | | | |
Ltd. | | | 500,000 | 262,499 |
Information & Services0.0% | | | | | |
Shenzhen Expressway Co., | | | | | |
Ltd., Shares H | | | 74,000 | 46,437 |
Land & Water Transportation0.1% | | | | |
GZI Transportation Ltd. | | | 614,000 | 359,191 |
Sichuan Expressway Co., Ltd. | | | 6,015,000 | 1,354,107 |
Sinotrans Ltd., Class H | | | 428,000 | 170,527 |
| | | | | 1,883,825 |
Metal Products & Machinery 0.1% | | | | |
Harbin Power Equipment Co., | | | | | |
Ltd. | | | 1,552,000 | 1,748,741 |
Miscellaneous Finance 0.0% | | | | | |
Shenyin Wanguo HK Ltd. | | | 595,000 | 174,084 |
Photo-optical, Micros & Office Machinery 0.0% | | |
Great Wall Technology Co., | | | | | |
Ltd., Class H | | | 2,072,000 | 641,327 |
Software 0.0% | | | | | |
Digital China Holdings Ltd. | | | 119,000 | 46,655 |
Textiles & Apparel 0.1% | | | | | |
Weiqiao Textile Co., Ltd., | | | | | |
Class H | | | 927,000 | 1,339,605 |
| | | | | 9,064,264 |
Denmark 0.6% | | | | | |
| | | | | |
Agriculture, Food & Beverage 0.1% | | | | |
Danisco A/S (a) | | | 12,400 | 972,787 |
Harboes Bryggeri A/S | | | | 315 | 12,353 |
Hedegaard A/S | | | | 943 | 103,937 |
| | | | | 1,089,077 |
Banks & Credit Institutions 0.0% | | | | |
Ostjydsk Bank A/S | | | | 982 | 226,477 |
Beer, Liquor, & Tobacco 0.4% | | | | | |
Carlsberg A/S, Class B (a) | | | 62,697 | 6,811,431 |
Construction & Homebuilding 0.0% | | | | |
Ove Arkil Holding A/S | | | | 899 | 169,749 |
Forest Products & Paper 0.0% | | | | |
Brodrene Hartmann A/S | | | 4,029 | 149,523 |
ITH Industri Invest A/S | | | | 245 | 9,993 |
| | | | | 159,516 |
Information & Services 0.0% | | | | | |
Per Aarsleff A/S, Class B | | | 7,416 | 704,801 |
Land & Water Transportation 0.0% | | | | |
DFDS A/S (a) | | | 6,009 | 808,270 |
Metal Products & Machinery 0.0% | | | | |
GPV Industri A/S | | | 4,000 | 214,012 |
Publishing, Broadcasting & Cinema 0.0% | | | |
SKAKO Industries A/S | | | 4,500 | 244,454 |
| | | | | | | |
| | | | Number of | Value |
Security | | | | Shares | ($) |
| | | | | |
Real Estate Development 0.1% | | | |
Keops A/S (a)* | | | | 170,044 | 644,670 |
Nordicom A/S | | | | 2,455 | 311,825 |
| | | | | 956,495 |
Wholesale 0.0% | | | | | |
Sanistaal A/S, Class B | | | | 4,394 | 818,238 |
| | | | | 12,202,520 |
Finland 2.0% | | | | | |
| | | | | |
Agriculture, Food & Beverage 0.0% | | |
Lannen Tehtaat Oyi (a) | | | | 13,978 | 429,740 |
Airlines 0.2% | | | | | |
Finnair Oyj (a) | | | | 203,814 | 3,548,050 |
Banks & Credit Institutions 0.0% | | | |
OKO Bank plc (OKO Pankki | | | | |
Oyj), Series A (a) | | | | 44,596 | 759,814 |
Basic Minerals & Metals 0.5% | | | |
Outokumpu Oyj (a) | | | | 108,752 | 3,743,325 |
Rautaruukki Oyj (a) | | | | 127,363 | 5,934,146 |
| | | | | 9,677,471 |
Chemicals & Rubber 0.4% | | | | | |
Kemira GrowHow Oyj | | | | 74,658 | 1,008,066 |
Kemira Oyj (a) | | | | 266,797 | 6,106,107 |
| | | | | 7,114,173 |
Financial Investments 0.0% | | | | |
Norvestia Oyj, Class B | | | | 18,989 | 208,607 |
Forest Products & Paper 0.1% | | | |
Huhtamaki Oyj (a) | | | | 138,554 | 2,300,135 |
Instruments 0.1% | | | | | |
Larox Oyj (a) | | | | 28,589 | 343,567 |
Vaisala Oyj, Shares A (a) | | | | 18,932 | 884,655 |
| | | | | 1,228,222 |
IT Hardware 0.0% | | | | | |
Elcoteq Network Corp., | | | | | |
Class A (a) | | | | 1,894 | 19,973 |
Okmetic Oyj * | | | | 60,000 | 307,807 |
| | | | | 327,780 |
Metal Products & Machinery 0.0% | | |
Kyro Oyj | | | | 2,544 | 13,767 |
Miscellaneous Finance 0.0% | | | | |
Neomarkka Oyj (a) | | | | 21,000 | 229,178 |
Real Estate Development 0.2% | | | |
Citycon Oyj | | | | 169,466 | 1,329,255 |
Sponda Oyj (a) | | | | 142,677 | 2,466,296 |
Technopolis Ojy (a) | | | | 52,496 | 534,091 |
| | | | | 4,329,642 |
Retail 0.4% | | | | | |
Kesko Oyj, Class B (a) | | | | 157,604 | 8,439,344 |
Software 0.1% | | | | | |
SysOpen Digia Oyi | | | | 11,788 | 57,212 |
TietoEnator Oyj (a) | | | | 35,014 | 1,018,890 |
| | | | | 1,076,102 |
| | | | | 39,682,025 |
| | | | | | |
80 Laudus Funds Annual Report
See financial notes.
Laudus Rosenberg International Small Capitalization Fund |
| | | | Number of | Value |
Security | | | | Shares | ($) |
| | | | | |
France 10.2% | | | | | |
| | | | | |
Agriculture, Food & Beverage0.1% | | |
Bongrain S.A. | | | | 4,174 | 391,380 |
Evialis | | | | 8,700 | 418,794 |
Rougier S.A. | | | | 883 | 192,696 |
Sucriere de Pithiviers Le Vieil | | 306 | 290,325 |
| | | | | 1,293,195 |
Airlines 0.9% | | | | | |
Air France-KLM (a) | | | | 370,400 | 16,941,484 |
Autos 1.0% | | | | | |
Plastic Omnium S.A. | | | | 6,932 | 342,806 |
PSA Peugeot Citroen (a) | | | | 169,930 | 11,981,567 |
Societe Fonciere Financiere et | | | |
de Participations (FFP) | | | 25,473 | 7,005,261 |
| | | | | 19,329,634 |
Banks & Credit Institutions 0.0% | | |
Caisse Regionale du Credit | | | | |
Agricole Mutuel Loire Haute- | | | |
Loire | | | | 815 | 71,747 |
Basic Minerals & Metals 0.4% | | | | |
Eramet | | | | 35,749 | 7,483,474 |
Chemicals & Rubber 1.4% | | | | | |
Compagnie Generale des | | | | |
Etablissements Michelin, | | | | |
Class B (a) | | | | 252,600 | 27,928,254 |
Societe Anonyme d’Explosifs | | | |
et de Produits Chimiques | | | 572 | 309,085 |
| | | | | 28,237,339 |
Communications Utilities 0.2% | | | |
Avenir Telecom * | | | | 14,017 | 45,028 |
Net2S * | | | | 21,350 | 90,394 |
Publicis Groupe (a) | | | | 74,400 | 3,591,273 |
| | | | | 3,726,695 |
Construction & Homebuilding 0.0% | | |
Compagnie Industrielle et | | | | |
Financiere d’ Entreprises | | | 598 | 158,370 |
Construction Materials 0.2% | | | | |
Ciments Francais S.A. | | | | 15,923 | 3,389,181 |
Drugs & Pharmaceuticals 0.0% | | | |
Boiron S.A. | | | | 3,084 | 85,455 |
Financial Investments 0.0% | | | | |
IDI | | | | 1,217 | 55,402 |
Societe Alsacienne et Lorraine | | | |
de Valeurs d’Entreprises et | | | |
de Participations | | | | 3,835 | 547,862 |
| | | | | 603,264 |
Forest Products & Paper 0.4% | | | | |
Sequana Capital | | | | 236,053 | 7,173,068 |
Government Aircraft & Defense 0.3% | | |
Beneteau | | | | 40,016 | 4,834,216 |
Societe Industrielle D’Aviations | | | |
Latecoere S.A. | | | | 6,185 | 187,140 |
Thales S.A. (a) | | | | 26,800 | 1,562,651 |
| | | | | 6,584,007 |
| | | | | | |
| | Number of | Value |
Security | | Shares | ($) |
| | | | |
Information & Services 0.0% | | | |
A Novo * | | | 102,365 | 104,828 |
Ginger * | | | 8,835 | 262,407 |
Groupe Crit | | | 4,174 | 195,120 |
Groupe Diffusion Plus | | 85 | 3,407 |
Tessi S.A. | | | 3,864 | 242,113 |
| | | | 807,875 |
Insurance 0.5% | | | |
CNP Assurances (a) | | 88,100 | 10,309,784 |
IT Hardware 0.1% | | | |
Radiall S.A. | | | 3,329 | 458,459 |
Wavecom S.A. | * | | 48,792 | 1,104,013 |
| | | | 1,562,472 |
Land & Water Transportation 0.1% | | | |
Financiere de l’Odet | | 1,700 | 781,809 |
Touax | | | 13,000 | 471,981 |
| | | | 1,253,790 |
Metal Products & Machinery 0.5% | | | |
Constructions Industrielles dela | | | |
Mediterranee S.A. | | 1,056 | 179,160 |
Gevelot | | | 3,516 | 277,114 |
Securidev S.A. | | | 356 | 12,175 |
Valeo S.A. (a) | | | 155,202 | 9,129,511 |
| | | | 9,597,960 |
Miscellaneous Finance 0.8% | | | |
ABC Arbitrage | | | 16,943 | 126,958 |
Natixis | | | 583,542 | 14,284,417 |
Viel et Compagnie | | 70,040 | 467,815 |
| | | | 14,879,190 |
Publishing, Broadcasting & Cinema 0.3% | | |
Havas S.A. (a) | | | 1,149,306 | 6,648,444 |
Real Estate Development 0.8% | | | |
Fonciere des Murs | | 83 | 13,083 |
Fonciere Des Regions | | 48,498 | 9,118,098 |
Icade Fonciere des Pimonts | | | |
S.A. | | | 40 | 9,347 |
Nexity | | | 71,360 | 6,131,565 |
| | | | 15,272,093 |
Restaurants, Hotels & Theaters 0.8% | | |
Club Mediterranee S.A. * | | 225 | 13,228 |
Compagnie des Alpes | | 2,065 | 198,614 |
Groupe Flo * | | | 44,837 | 627,360 |
Pierre & Vacances | | 3,129 | 431,228 |
Sodexho Alliance S.A. (a) | | 185,200 | 13,591,232 |
| | | | 14,861,662 |
Software 1.4% | | | |
Atos Origin S.A. (a)* | | 138,685 | 9,336,350 |
Cap Gemini S.A. (a) | | 208,500 | 15,869,681 |
Esi Group * | | | 19,800 | 313,863 |
GFI Informatique | | 37,935 | 362,016 |
Jet Multimedia | | | 29,279 | 577,467 |
Lectra | | | 5,256 | 44,334 |
XRT | | | 110,000 | 228,332 |
| | | | 26,732,043 |
| | | | | | |
See financial notes.
Laudus Funds Annual Report 81
Laudus Rosenberg International Small Capitalization Fund |
Portfolio Holdings continued | | | |
| | | | | | |
| | | | Number of | Value |
Security | | | | Shares | ($) |
| | | | | | |
Wholesale 0.0% | | | | | | |
Guillin Emballages | | | | | 400 | 37,117 |
| | | | | | 197,039,343 |
Germany 4.6% | | | | | | |
| | | | | | |
Agriculture, Food & Beverage 0.1% | | | |
Frosta AG | | | | | 10,062 | 219,862 |
Suedzucker AG (a) | | | | | 74,826 | 1,428,134 |
| | | | | | 1,647,996 |
Autos 0.0% | | | | | | |
Grammer AG | | | | | 3,054 | 94,962 |
Basic Minerals & Metals 0.1% | | | | |
Euromicron AG | | | | | 1,897 | 46,518 |
Leoni AG | | | | | 1,305 | 54,052 |
Norddeutsche Affinerie AG (a) | | 57,754 | 1,836,215 |
| | | | | | 1,936,785 |
Beer, Liquor, & Tobacco 0.0% | | | | |
Sektkellerei Schloss | | | | | | |
Wachenheim AG | | | | | 23,575 | 326,722 |
Cellular & Wireless 0.1% | | | | |
Drillisch AG | | | | | 108,870 | 1,148,941 |
Funkwerk AG | | | | | 12,971 | 344,529 |
| | | | | | 1,493,470 |
Chemicals & Rubber 0.6% | | | | | |
Lanxess (a)* | | | | | 217,071 | 11,230,306 |
Commercial Aircraft & Components 0.5% | | |
MTU Aero Engines Holding AG | | 147,300 | 8,852,941 |
Construction Materials 0.0% | | | | |
Augusta Technologie AG* | | | | 18,872 | 370,337 |
Drugs & Pharmaceuticals 0.0% | | | | |
Altana AG | | | | | 8,853 | 575,840 |
Electric Utilities 0.2% | | | | | |
MVV Energie AG | | | | | 90,209 | 3,422,362 |
Forest Products & Paper 0.0% | | | | |
Westag & Getalit AG | | | | | 2,631 | 68,887 |
Government Aircraft & Defense 0.1% | | |
Rheinmetall AG | | | | | 26,676 | 2,490,135 |
Health Care & Hospital 0.0% | | | | |
Maternus-Kliniken AG* | | | | | 5,738 | 14,564 |
Information & Services 0.1% | | | | |
D. Logistics AG (a)* | | | | | 114,503 | 286,241 |
Rucker AG | | | | | 28,950 | 329,011 |
TUI AG (a) | | | | | 44,952 | 1,111,292 |
| | | | | | 1,726,544 |
Instruments 0.5% | | | | | | |
Fresenius AG (a) | | | | | 119,232 | 9,653,937 |
Insurance 0.1% | | | | | | |
AMB Generali Holding AG | | | 2,086 | 326,396 |
Wuerttembergische | | | | | | |
Lebensversicherung AG | | | 32,600 | 1,846,465 |
| | | | | | 2,172,861 |
| | | | | | | | |
| | Number of | Value |
Security | | Shares | ($) |
| | | |
IT Hardware 1.0% | | | |
ADCapital AG | | 498 | 7,563 |
Elmos Semiconductor AG * | | 9,868 | 110,901 |
Infineon Technologies AG * | | 1,302,403 | 20,281,839 |
| | | 20,400,303 |
Metal Products & Machinery 0.3% | | |
Duerr AG * | | 53,317 | 1,759,948 |
Gesco AG | | 8,232 | 422,900 |
Gildemeister AG (a) | | 170,000 | 2,969,660 |
| | | 5,152,508 |
Photo-optical, Micros & Office Machinery 0.4% | |
Heidelberger Druckmaschinen | | | |
AG | | 163,122 | 7,488,956 |
Koenig & Bauer AG | | 9,040 | 344,856 |
| | | 7,833,812 |
Restaurants, Hotels & Theaters 0.0% | | |
IFA Hotel & Touristik AG * | | 25,000 | 335,966 |
Retail 0.3% | | | |
Hornback Baumarkt | | | |
Aktiengesellschaft | | 37,600 | 2,564,172 |
KarstadtQuelle AG (a)* | | 70,682 | 2,599,216 |
| | | 5,163,388 |
Software 0.1% | | | |
Bechtle AG | | 15,839 | 464,430 |
ComBOTS AG (a)* | | 5,459 | 80,694 |
Computerlinks AG | | 16,576 | 319,566 |
Mensch + Maschine | | 7,903 | 53,860 |
PC-Ware AG | | 12,805 | 228,098 |
REALTECH AG | | 13,166 | 190,828 |
syzygy AG | | 37,013 | 198,253 |
| | | 1,535,729 |
Wholesale 0.1% | | | |
Herlitz AG * | | 8,321 | 36,746 |
INTERSEROH AG | | 29,687 | 1,562,621 |
| | | 1,599,367 |
| | | 88,099,722 |
Greece 0.3% | | | |
| | | |
Banks & Credit Institutions 0.2% | | |
Bank of Greece | | 26,314 | 3,444,189 |
Communications Utilities 0.1% | | |
Hellenic Telecommunications | | | |
Organization S.A. (OTE) * | | 49,110 | 1,339,589 |
Restaurants, Hotels & Theaters 0.0% | | |
Opap Sa | | 15,038 | 571,583 |
| | | 5,355,361 |
Hong Kong 1.7% | | | |
| | | |
Banks & Credit Institutions 0.1% | | |
Dah Sing Financial Group | | 103,200 | 897,900 |
Fubon Bank (Hong Kong) Ltd. | | 108,000 | 62,612 |
Liu Chong Hing Bank Ltd. | | 185,000 | 487,988 |
Wing Lung Bank Ltd. | | 95,200 | 1,051,340 |
| | | 2,499,840 |
| | | | |
82 Laudus Funds Annual Report
See financial notes.
Laudus Rosenberg International Small Capitalization Fund |
| | Number of | Value |
Security | | Shares | ($) |
| | | |
Basic Minerals & Metals 0.0% | | | |
China Oriental Group Co., Ltd. | 25,000 | 8,263 |
Cellular & Wireless 0.0% | | | |
SmarTone Telecommunications | | |
Holdings Ltd. | | 103,000 | 118,634 |
Consumer Durables 0.0% | | | |
Alco Holdings Ltd. | | 122,000 | 63,032 |
Financial Investments 0.0% | | | |
Peregrine Investment Holdings | | |
Ltd. (b)(c)* | | 84,000 | — |
Furniture & Household Items 0.1% | | |
Chow Sang Sang Holdings | | | |
International Ltd. | | 28,000 | 18,902 |
EganaGoldpfeil (Holdings) Ltd. | 2,788,000 | 1,957,869 |
| | | 1,976,771 |
Information & Services 0.0% | | | |
USI Holdings Ltd. (c) | | 722,727 | 419,013 |
Wai Kee Holdings Ltd. | | 74,000 | 28,404 |
| | | 447,417 |
IT Hardware 0.2% | | | |
Moulin Global Eyecare Holdings | | |
Ltd. (b)(c)* | | 268,000 | — |
Truly International Holdings Ltd. | 1,300,760 | 1,206,392 |
Vtech Holdings Ltd. | | 357,000 | 2,568,790 |
| | | 3,775,182 |
Land & Water Transportation 0.2% | | |
Jinhui Holdings Ltd. * | | 939,000 | 391,246 |
Transport International Holdings | | |
Ltd. | | 427,200 | 2,317,968 |
| | | 2,709,214 |
Metal Products & Machinery 0.0% | | |
Chen Hsong Holdings Ltd. | | 126,000 | 81,877 |
Miscellaneous Finance 0.2% | | | |
Allied Properties (H.K.) Ltd. | | 404,000 | 444,344 |
COL Capital Ltd. | | 480,000 | 207,122 |
Guoco Group Ltd. | | 268,000 | 3,767,258 |
Hongkong Chinese Ltd. | | 180,000 | 33,321 |
| | | 4,452,045 |
Photo-optical, Micros & Office Machinery 0.0% | |
Proview International Holdings | | |
Ltd. | | 1,908,000 | 260,539 |
Publishing, Broadcasting & Cinema 0.1% | | |
eSun Holdings Ltd. * | | 1,710,000 | 1,359,089 |
Next Media Ltd. | | 926,000 | 318,227 |
| | | 1,677,316 |
Real Estate Development 0.6% | | | |
Allied Group Ltd. | | 207,600 | 572,663 |
Associated International Hotels | | |
Ltd. * | | 4,000 | 6,149 |
Chevalier International Holdings | | |
Ltd. | | 356,000 | 364,421 |
China Motor Bus Co., Ltd. | | 4,000 | 30,689 |
Coastal Greenland Ltd. | | 1,268,000 | 177,908 |
Goldlion Holdings Ltd. | | 300,000 | 62,444 |
Great Eagle Holdings Ltd. | | 5,000 | 16,895 |
| | | | |
| Number of | Value |
Security | | Shares | ($) |
| | | |
HKC Holdings Ltd. | | 1,574,000 | 276,643 |
Hong Kong Ferry (Holdings) | | | |
Co., Ltd. | | 294,280 | 328,320 |
Hopewell Holdings Ltd. | | 21,000 | 81,777 |
Hopson Development Holdings | | | |
Ltd. | | 948,000 | 2,370,588 |
Keck Seng Investments | | 340,000 | 159,698 |
Kerry Properties Ltd. | | 571,000 | 2,928,468 |
Lippo Ltd. | | 21,000 | 8,289 |
Melbourne Enterprises Ltd. | | 2,000 | 11,609 |
New World China Land Ltd. | | 832,400 | 499,707 |
Pacific Century Premium | | | |
Developments Ltd. | | 1,464,000 | 462,713 |
Shanghai Real Estate Ltd. | | 78,000 | 19,441 |
Tai Cheung Holdings Ltd. | | 1,423,520 | 871,245 |
Wheelock Properties (S) Ltd. | | 1,364,000 | 1,440,256 |
Wing On Co. International Ltd. | | 256,500 | 425,609 |
| | | 11,115,532 |
Restaurants, Hotels & Theaters 0.1% | | |
Harbour Centre Development | | | |
Ltd. | | 180,000 | 317,911 |
Hongkong & Shanghai Hotels | | | |
Ltd. | | 952,192 | 1,501,740 |
| | | 1,819,651 |
Software 0.0% | | | |
SUNeVision Holdings Ltd. | | 1,050,280 | 145,172 |
Wholesale 0.1% | | | |
Champion Technology Holdings | | | |
Ltd. | | 4,363,582 | 869,428 |
Tan Chong International Ltd. | | 1,236,000 | 300,557 |
| | | 1,169,985 |
| | | 32,320,470 |
Ireland 1.0% | | | |
| | | |
Agriculture, Food & Beverage 0.4% | | | |
Kerry Group plc, Class A | | 306,263 | 8,560,589 |
IT Hardware 0.0% | | | |
Vislink plc | | 263,135 | 507,240 |
Oil & Coal Resources 0.1% | | | |
Dragon Oil plc * | | 314,975 | 1,110,805 |
Publishing, Broadcasting & Cinema 0.4% | | |
Independent News & Media | | | |
plc (a) | | 1,603,000 | 7,300,760 |
Software 0.0% | | | |
Iona Technologies plc * | | 29,976 | 181,366 |
Wholesale 0.1% | | | |
DCC plc | | 41,105 | 1,443,856 |
| | | 19,104,616 |
Italy 4.7% | | | |
| | | |
Agriculture, Food & Beverage 0.0% | | | |
Centrale del Latte di Torino & C | | | |
S.p.A. | | 9,679 | 59,955 |
La Doria S.p.A. | | 107,874 | 352,429 |
| | | 412,384 |
| | | | |
See financial notes.
Laudus Funds Annual Report 83
Laudus Rosenberg International Small Capitalization Fund |
Portfolio Holdings continued | | | |
| | | | |
| | Number of | Value |
Security | | Shares | ($) |
| | | | |
Banks & Credit Institutions 0.0% | | |
Meliorbanca S.p.A. | | | 28,174 | 157,939 |
Basic Minerals & Metals 0.0% | | | | |
KME Group * | | | 1,191,104 | 957,894 |
Chemicals & Rubber 0.5% | | | |
Montefibre S.p.A. * | | | 431,574 | 485,509 |
Pirelli & C. S.p.A. (a) | | | 8,037,000 | 8,888,641 |
| | | | 9,374,150 |
Construction & Homebuilding 0.1% | | | |
Vianini Lavori S.p.A. | | | 134,442 | 2,054,706 |
Construction Materials 0.9% | | | | |
Buzzi Unicem S.p.A. (a) | | | 99,221 | 3,023,121 |
Italcementi S.p.A. (a) | | | 267,899 | 8,045,527 |
Italmobiliare S.p.A. | | | 50,802 | 5,882,528 |
| | | | 16,951,176 |
Electric Utilities 0.6% | | | | |
ACEA S.p.A. | | | 169,809 | 3,185,329 |
C.I.R. S.p.A. — Compagnie | | | | |
Industriali Riunite (a) | | | 1,620,000 | 6,460,690 |
Cofide S.p.A. — Compagnia | | | |
Finanziaria De Benedetti | | | 769,882 | 1,336,666 |
| | | | 10,982,685 |
Forest Products & Paper 1.1% | | | | |
IFIL — Investments S.p.A. (a) | | 2,122,709 | 20,804,089 |
Furniture & Household Items 0.0% | | | |
Targetti Sankey S.p.A. | | | 61,225 | 499,567 |
Gas & Other Public Utilities 0.2% | | |
Acegas-APS S.p.A. | | | 61,646 | 768,940 |
ACSM Como S.p.A | | | 47,000 | 147,472 |
Iride S.p.A. | | | 666,154 | 2,256,493 |
| | | | 3,172,905 |
Government Aircraft & Defense 0.5% | | |
Finmeccanica S.p.A. (a) | | | 344,800 | 10,364,533 |
Information & Services 0.0% | | | | |
Cam Finanziaria S.p.A. (a) | | | 90,636 | 202,197 |
I Grandi Viaggi S.p.A. | | | 88,636 | 317,166 |
| | | | 519,363 |
Instruments 0.0% | | | | |
Gefran S.p.A. | | | 52,276 | 381,302 |
Insurance 0.0% | | | | |
Ergo Previdenza S.p.A. | | | 7,640 | 54,653 |
Land & Water Transportation 0.0% | | | |
Autostrade Meridionali S.p.A. | | 216 | 9,575 |
Navigazione Montanari S.p.A. | | 2,161 | 11,486 |
| | | | 21,061 |
Metal Products & Machinery 0.2% | | |
Danieli S.p.A. — Officine | | | | |
Meccanishe Danieli & C. (a) | | 143,186 | 3,373,241 |
Miscellaneous Finance 0.0% | | | | |
Mittel S.p.A. | | | 1,230 | 10,481 |
| | | | | | |
| | Number of | Value |
Security | | | Shares | ($) |
| | | | |
Publishing, Broadcasting & Cinema 0.2% | | |
A.S. Roma S.p.A. * | | | 111,113 | 94,063 |
Mondadori (Arnoldo) Editore S.p.A. (a) | | 376,000 | 3,933,337 |
Monrif S.p.A. | | | 242,871 | 387,056 |
Telecom Italia Media S.p.A. (a) | | 907,930 | 394,548 |
| | | | 4,809,004 |
Real Estate Development 0.1% | | | |
Beni Stabili S.p.A. (a) | | | 729,001 | 1,215,357 |
IPI S.p.A. | | | 9,935 | 92,949 |
Vittoria Assicurazioni S.p.A. | | 4,787 | 79,294 |
| | | | 1,387,600 |
Retail 0.2% | | | | |
Gruppo Coin S.p.A. * | | | 383,923 | 2,913,065 |
Soaps & Cosmetics 0.0% | | | | |
Mirato S.p.A. | | | 32,755 | 403,955 |
Software 0.1% | | | | |
Banco di Sardegna S.p.A. | | 1,532 | 41,712 |
Digital Bros S.p.A. | | | 2,330 | 20,938 |
Engineering Ingegneria | | | |
Informatica S.p.A. | | | 29,038 | 1,371,139 |
| | | | 1,433,789 |
| | | | 91,039,542 |
Japan 17.3% | | | | |
| | | | |
Agriculture, Food & Beverage 0.8% | | | |
Coca-Cola Central Japan Co.,Ltd. (a) | | 291 | 2,260,829 |
DyDo Drinco, Inc. (a) | | | 46,600 | 1,900,463 |
Fuji Oil Co., Ltd. | | | 137,000 | 1,148,212 |
Itoham Foods, Inc. | | | 88,000 | 402,204 |
Mikuni Coca-Cola Bottling Co., | | | |
Ltd. | | | 110,500 | 1,154,992 |
Morinaga & Co., Ltd. (a) | | 671,000 | 1,574,917 |
Morinaga Milk Industry Co., | | | |
Ltd. | | | 47,000 | 231,656 |
Nichiwa Sangyo Co., Ltd. | | 17,000 | 66,840 |
Nippon Flour Mills Co., Ltd. | | 574,000 | 2,316,005 |
Nisshin Seifun Group, Inc. (a) | | 241,500 | 2,453,043 |
Q.P. | | | 1,000 | 9,061 |
Tokatsu Foods Co., Ltd. | | 36,000 | 185,714 |
Yamazaki Baking Co., Ltd. | | 127,000 | 1,154,799 |
Yonekyu Corp. | | | 17,000 | 172,263 |
| | | | 15,030,998 |
Autos 1.0% | | | | |
Aichi Machine Industry Co., | | | |
Ltd. (a) | | | 331,000 | 853,033 |
Calsonic Kansei Corp. (a) | | 72,000 | 345,483 |
Daido Metal Co., Ltd. (a) | | 37,000 | 239,212 |
Fuji Heavy Industries Ltd. | | 523,000 | 2,708,665 |
Futaba Industrial Co., Ltd. (a) | | 123,200 | 2,979,635 |
HI-LEX Corp. | | | 26,700 | 437,588 |
Hino Motors Ltd. (a) | | | 152,000 | 807,911 |
Kanto Auto Works Ltd. (a) | | 197,200 | 2,499,887 |
Kyokuto Kaihatsu Kogyo Co.,Ltd. | | 66,000 | 540,111 |
Mitsuba Corp. | | | 129,000 | 1,008,236 |
Nissan Shatai Co., Ltd. | | 182,000 | 924,900 |
84 Laudus Funds Annual Report
See financial notes.
Laudus Rosenberg International Small Capitalization Fund |
| | Number of | Value |
Security | | Shares | ($) |
| | | |
Pacific Industrial Co., Ltd. | | 65,000 | 435,912 |
Press Kogyo Co., Ltd. | | 34,000 | 167,423 |
Sanden Corp. (a) | | 275,000 | 1,201,280 |
Topre Corp. | | 129,600 | 1,178,845 |
Topy Industries Ltd. | | 683,000 | 2,739,395 |
Unipres Corp. | | 117,800 | 869,096 |
Yorozu Corp. (a) | | 19,900 | 280,464 |
| | | 20,217,076 |
Banks & Credit Institutions 1.0% | | | |
Aichi Bank Ltd. (a) | | 22,300 | 2,446,672 |
Akita Bank Ltd. | | 250,000 | 1,277,561 |
Daishi Bank Ltd. | | 562,000 | 2,374,801 |
Higo Bank Ltd. | | 29,000 | 196,487 |
Hyakugo Bank Ltd. | | 374,000 | 2,397,397 |
Kita-Nippon Bank Ltd. | | 11,600 | 516,700 |
Kyushu-Shinwa Holdings, Inc. * | | 705,000 | 1,032,669 |
Miyazaki Bank Ltd. | | 21,000 | 93,186 |
Orient Corp. (a)* | | 205,000 | 348,353 |
San-in Godo Bank Ltd. | | 46,000 | 434,589 |
Shiga Bank Ltd. | | 251,000 | 1,738,312 |
Shinki Co., Ltd. | | 86,700 | 244,654 |
Taiko Bank Ltd. | | 71,000 | 216,344 |
The Bank of Iwate Ltd. | | 14,000 | 807,763 |
The Chukyo Bank Ltd. | | 89,000 | 283,509 |
The Eighteenth Bank Ltd. | | 50,000 | 233,198 |
The Kumamoto Family Bank | | | |
Ltd. (c)* | | 48,000 | 85,132 |
The Mie Bank Ltd. | | 363,000 | 1,792,811 |
Toho Bank Ltd. | | 344,000 | 1,487,976 |
Tomato Bank Ltd. | | 46,000 | 101,292 |
Yamagata Bank Ltd. | | 112,000 | 595,886 |
| | | 18,705,292 |
Basic Minerals & Metals 2.7% | | |
Ahresty Corp. | | 49,300 | 1,331,384 |
Asahi Industries Co., Ltd. | | 205 | 447,761 |
Chubu Steel Plate Co., Ltd. | | 106,500 | 1,290,647 |
Daiki Aluminium Industry Co., | | | |
Ltd. | | 167,000 | 1,142,513 |
Dowa Mining | | 391,000 | 3,956,478 |
Fujikura Ltd. (a) | | 333,000 | 2,338,100 |
Godo Steel Ltd. (a) | | 504,000 | 2,685,200 |
Hitachi Cable Ltd. (a) | | 411,000 | 2,330,869 |
Mitsui Mining & Smelting Co., | | | |
Ltd. (a) | | 446,000 | 2,439,333 |
Nakayama Steel Works Ltd. (a) | 454,000 | 1,744,997 |
Nichia Steel Works Ltd. | | 154,000 | 661,716 |
Nippon Light Metal (a) | | 1,179,000 | 3,332,902 |
Nisshin Steel Co., Ltd. (a) | | 1,216,000 | 5,226,365 |
Osaka Steel Co., Ltd. (a) | | 128,200 | 2,451,102 |
Pacific Metals Co., Ltd. (a) | | 248,000 | 3,452,289 |
Sanyo Special Steel Co., | | | |
Ltd. (a) | | 394,000 | 2,768,506 |
Showa Electric Wire & Cable | | | |
Co., Ltd. (a) | | 261,000 | 364,403 |
Sumitomo Pipe & Tube Co., | | | |
Ltd. | | 98,000 | 711,117 |
The Furukawa Electric Co., Ltd. | 1,000 | 6,078 |
Tokyo Steel Manufacturing Co., | | |
Ltd. (a) | | 195,400 | 2,874,399 |
Tokyo Tekko Co., Ltd. | | 174,000 | 1,364,237 |
Toyo Kohan Co., Ltd. | | 295,000 | 1,184,554 |
| | Number of | Value |
Security | | Shares | ($) |
| | | | |
Yamato Kogyo Co., Ltd. | | 139,900 | 4,382,500 |
Yodogawa Steel Works Ltd. (a) | | 460,000 | 2,829,098 |
| | | | 51,316,548 |
Beer, Liquor, & Tobacco 0.2% | | | |
Asahi Breweries Ltd. | | | 232,400 | 3,722,313 |
Mercian Corp. | | | 84,000 | 225,740 |
Oenon Holdings, Inc. (a) | | 112,000 | 298,089 |
| | | | 4,246,142 |
Chemicals & Rubber 0.9% | | | | |
Adeka Corp. (a) | | | 139,700 | 1,609,791 |
Arakawa Chemical Industries Ltd. | | | 18,200 | 226,343 |
Atomix Co., Ltd. | | | 3,000 | 9,445 |
Daicel Chemical Industries Ltd. (a) | | | 94,000 | 639,508 |
Dainippon Ink & Chemicals,Inc. | | | 617,000 | 2,444,073 |
Kureha Chemical Industry Co.,Ltd. | | | 409,000 | 2,053,695 |
Nippon Shokubai Co., Ltd. (a) | | 5,000 | 53,828 |
Sakai Chemical Industry Co.,Ltd. | | | 183,000 | 1,317,272 |
SOFT99 Corp. | | | 21,000 | 181,071 |
Sumitomo Rubber Industries Ltd. | | | 281,700 | 3,074,764 |
Teijin Ltd. (a) | | | 454,000 | 2,551,678 |
Toagosei Co., Ltd. | | | 137,000 | 568,305 |
Tokyo Ohka Kogyo Co., Ltd. (a) | | 108,300 | 2,705,569 |
Tosoh Corp. | | | 2,000 | 10,302 |
Toyo Ink Manufacturing Co.,Ltd. | | | 198,000 | 738,685 |
| | | | 18,184,329 |
Commercial Aircraft & Components 0.1% | | |
Jalux., Inc. | | | 2,600 | 48,973 |
Sumitomo Precision Products | | | |
Co., Ltd. | | | 197,000 | 1,109,264 |
| | | | 1,158,237 |
Communications Utilities 0.1% | | | |
eAccess Ltd. (a) | | | 314 | 208,550 |
GMO Internet, Inc. | | | 42,800 | 347,040 |
JSAT Corp. (c) | | | 483 | 1,127,164 |
| | | | 1,682,754 |
Construction & Homebuilding 0.3% | | | |
C-Cube Corp. | | | 58,700 | 223,901 |
Daiichi Kensetu Corp. | | | 25,000 | 186,589 |
Hazama Corp. | | | 1,100 | 1,480 |
Koatsu Kogyo Co., Ltd. | | 16,000 | 51,949 |
Kodensha Co., Ltd. | | | 8,000 | 24,812 |
Maeda Corp. (a) | | | 5,000 | 18,188 |
Nippo Corp. (a) | | | 4,000 | 31,019 |
Nippon Dentsu Co., Ltd. | | 12,000 | 42,212 |
Nippon Road Co., Ltd. (a) | | 331,000 | 640,759 |
Nishimatsu Construction Co., | | | |
Ltd. (a) | | | 93,000 | 300,281 |
Ohmoto Gumi Co., Ltd. | | 13,000 | 82,771 |
Oki Wintech Co., Ltd. | | | 34,000 | 148,379 |
PanaHome Corp. (a) | | | 333,000 | 2,207,744 |
| | | | | |
See financial notes.
Laudus Funds Annual Report 85
Laudus Rosenberg International Small Capitalization Fund |
Portfolio Holdings continued | | | |
| | | | |
| | | Number of | Value |
Security | | | Shares | ($) |
| | | | |
Sanyo Engineering & | | | | |
Construction, Inc. | | | 4,000 | 19,635 |
Seibu Electric Industry Co., Ltd. | 83,000 | 436,022 |
Taisei Oncho Co., Ltd. | | | 45,000 | 174,410 |
Taisei Rotec Corp. (a) | | | 191,000 | 360,929 |
Techno Ryowa Ltd. | | | 400 | 3,039 |
Tsuchiya Home Co., Ltd. | | | 2,700 | 6,676 |
Wakachiku Construction Co., | | |
Ltd. (a) | | | 9,000 | 9,432 |
Yondenko Corp. | | | 63,000 | 341,957 |
Yurtec Corp. | | | 43,000 | 227,323 |
Zenitaka Corp. | | | 32,000 | 78,731 |
| | | | 5,618,238 |
Construction Materials 0.3% | | | |
Maeda Road Construction Co., | | |
Ltd. (a) | | | 152,000 | 1,198,099 |
Mitani Sekisan Co., Ltd. | | | 1,300 | 8,692 |
Nihon Yamamura Glaaa Co., | | | |
Ltd. | | | 444,000 | 1,331,752 |
Sankyo Rikagaku Co., Ltd. | | 4,000 | 43,064 |
Sumitomo Osaka Cement Co., | | |
Ltd. | | | 34,000 | 101,816 |
Taiheiyo Cement Corp. (a) | | 594,000 | 2,615,284 |
| | | | 5,298,707 |
Consumer Durables 0.0% | | | | |
Tohoku Pioneer Corp. | | | 10,200 | 146,768 |
Zojirushi Corp. | | | 2,000 | 19,168 |
| | | | 165,936 |
Drugs & Pharmaceuticals 0.5% | | | |
Cawachi Ltd. | | | 69,700 | 1,885,195 |
Kaken Pharmaceutical Co., | | | |
Ltd. (a) | | | 324,000 | 2,636,018 |
Kyorin Co., Ltd. (a) | | | 37,000 | 469,808 |
Mochida Pharmaceutical Co., | | |
Ltd. | | | 7,000 | 67,309 |
Nippon Shinyaku Co., Ltd. | | 174,000 | 1,466,053 |
Nissui Pharmaceutical Co., Ltd. | 5,000 | 40,040 |
Seikagaku Corp. | | | 45,900 | 490,780 |
Sumitomo Seika Chemicals | | | |
Co., Ltd. | | | 215,000 | 1,220,323 |
Torii Pharmaceutical Co., Ltd. | 91,600 | 1,545,174 |
| | | | 9,820,700 |
Electric Utilities 0.1% | | | | |
The Okinawa Electric Power | | |
Co., Inc. | | | 25,190 | 1,572,027 |
Financial Investments 0.2% | | | |
Gecoss Corp. (a) | | | 64,900 | 384,227 |
Hitachi Capital Corp. (a) | | | 116,100 | 2,310,487 |
Sankyo Frontier Co., Ltd. | | 40,000 | 141,053 |
Sanyo Electric Credit Co.,Ltd. (a) | | | 30,000 | 819,452 |
| | | | 3,655,219 |
Forest Products & Paper 0.0% | | | |
Daio Paper Corp. (a) | | | 5,000 | 39,953 |
Nihon Decoluxe Co., Ltd. | | 2,000 | 11,880 |
| | | | 51,833 |
| | | | |
| | Number of | Value |
Security | | Shares | ($) |
| | | |
Furniture & Household Items 0.3% | | |
Citizen Watch Co., Ltd. | | 35,100 | 328,768 |
Hodogaya Chemical Co., Ltd. | | 191,000 | 655,931 |
Paramount Bed Co., Ltd. (a) | | 13,300 | 261,604 |
Roland Corp. | | 62,700 | 1,443,673 |
Sumitomo Bakelite Co., Ltd. (a) | | 324,000 | 2,336,016 |
Tachikawa Corp. | | 60,600 | 380,120 |
Toso Co., Ltd. | | 29,000 | 88,969 |
| | | 5,495,081 |
Gas & Other Public Utilities 0.0% | | |
Keiyo Gas Co., Ltd. | | 49,000 | 253,975 |
Otaki Gas Co., Ltd. | | 19,000 | 100,691 |
| | | 354,666 |
Government Aircraft & Defense 0.2% | | |
Mitsui Engineering & | | | |
Shipbuilding Co., Ltd. (a) | | 1,037,000 | 4,377,933 |
Information & Services 0.4% | | | |
Autobacs Seven Co., Ltd. | | 26,700 | 954,205 |
BML, Inc. (a) | | 25,000 | 508,597 |
Chodai Co., Ltd. | | 20,500 | 86,537 |
CTI Engineering Co., Ltd. | | 53,500 | 398,209 |
Eight Consultants Co., Ltd. | | 8 | 24,494 |
Eikoh, Inc. | | 33,400 | 139,796 |
Ichishin Co., Ltd. | | 24,500 | 100,024 |
Itohchu Enex Co., Ltd. | | 3,300 | 25,029 |
Johnan Academic Preparatory | | | |
Institute, Inc. | | 27,000 | 71,098 |
Keiiyu Co., Ltd. | | 40,600 | 280,713 |
NEC Networks & System Integration Corp. | | 184,400 | 2,330,008 |
Nippon Koei Co., Ltd. (a) | | 280,000 | 849,086 |
Original Engineering Consultants Co., Ltd. | | 14,000 | 48,814 |
Secom Joshinetsu Co., Ltd. | | 12,000 | 275,823 |
TKC Corp. | | 100,000 | 1,745,238 |
Wesco, Inc. | | 56,700 | 197,705 |
| | | 8,035,376 |
Instruments 0.2% | | | |
Fukuda Denshi Co., Ltd. | | 100 | 3,522 |
Furuno Electric Co., Ltd. | | 16,200 | 145,609 |
Hitachi Medical Corp. | | 102,000 | 1,039,842 |
Nipro Corp. (a) | | 105,000 | 2,047,094 |
Shimadzu Corp. | | 13,000 | 112,479 |
| | | 3,348,546 |
Insurance 0.1% | | | |
The Fuji Fire & Marine Insurance Co., Ltd. (a) | | 484,000 | 1,989,139 |
IT Hardware 1.0% | | | |
Alps Electric Co., Ltd. (a) | | 183,400 | 2,141,628 |
Brother Industries Ltd. | | 250,000 | 3,375,562 |
Dainippon Screen Mfg. Co.,Ltd. (a) | | 360,000 | 2,713,936 |
Futaba Corp. (a) | | 81,700 | 1,944,344 |
Hitachi Kokusai Electric, Inc. | | 14,000 | 161,808 |
Nippon Antenna Co., Ltd. | | 17,900 | 144,099 |
Pioneer Corp. (a) | | 47,200 | 615,218 |
Shindengen Electric Manufacturing Co., Ltd. | | 270,000 | 1,203,624 |
| | | | |
86 Laudus Funds Annual Report
See financial notes.
Laudus Rosenberg International Small Capitalization Fund |
| Number of | Value |
Security | Shares | ($) |
| | |
Shinkawa Ltd. | 71,100 | 1,638,963 |
Tamura Corp. | 288,000 | 1,300,125 |
Teikoku Tsushin Kogyo Co., | | |
Ltd. | 4,000 | 19,356 |
Toshiba Tec Corp. | 626,000 | 3,739,047 |
| | 18,997,710 |
Land & Water Transportation 0.6% | | |
Fukuyama Transporting Co., | | |
Ltd. (a) | 116,000 | 468,873 |
Isewan Terminal Service Co., | | |
Ltd. | 75,000 | 470,409 |
K.R.S. Corp. | 7,000 | 92,801 |
Kawanishi Warehouse Co., Ltd. | 4,000 | 40,691 |
Keisei Electric Railway Co., | | |
Ltd. (a) | 457,000 | 2,945,445 |
Meiko Trans Co., Ltd. | 26,000 | 324,786 |
Nankai Electric Railway Co., | | |
Ltd. | 122,000 | 410,637 |
Nippon Konpo Unyu Soko Co., | | |
Ltd. | 227,000 | 3,171,060 |
Seino Transportation Co., Ltd. | 272,000 | 2,563,119 |
Tokyo Kisen Co., Ltd. | 10,000 | 75,377 |
West Japan Railway Co. | 383 | 1,765,375 |
| | 12,328,573 |
Mainframe & Minicomputers 0.1% | | |
NEC Corp. (a) | 255,000 | 1,362,949 |
Metal Products & Machinery 1.4% | | |
ABILIT Corp. (a) | 2,300 | 13,297 |
Aida Engineering Ltd. | 17,000 | 119,033 |
Asahi Diamond Industrial Co., | | |
Ltd. (a) | 191,000 | 1,392,435 |
Bosch Corp. | 547,000 | 2,473,114 |
Corona Corp. (a) | 49,100 | 839,844 |
Ebara Corp. (a) | 48,000 | 226,360 |
Fuji Electric Holdings Co., Ltd. | 523,000 | 2,418,081 |
Fuji Machine Manufacturing | | |
Co., Ltd. (a) | 153,800 | 2,490,566 |
Fujitec Co., Ltd. | 192,000 | 1,313,215 |
Glory Ltd. | 38,500 | 748,296 |
Hakuto Co., Ltd. | 300 | 4,626 |
Heiwa Corp. (a) | 86,500 | 1,067,737 |
Hokkan Holdings, Ltd. | 11,000 | 35,256 |
Ishikawajima Transportation | | |
Machinery Co., Ltd. | 18,000 | 84,089 |
Kioritz Corp. | 247,000 | 750,360 |
Komori Corp. | 165,000 | 3,830,710 |
Nakano Refrigerators Co., Ltd. | 2,000 | 21,512 |
Nippon Thompson Co., Ltd. | 257,000 | 2,374,805 |
Nireco Corp. | 700 | 6,470 |
Nissei Plastic Industrial Co., | | |
Ltd. | 52,600 | 341,184 |
Oiles Corp. | 18,480 | 404,630 |
Piolax, Inc. | 8,800 | 173,805 |
Sanso Electric Co., Ltd. | 30,000 | 101,815 |
Sekisui Jushi Corp. | 138,000 | 1,085,107 |
ShinMaywa Industries Ltd. | 378,000 | 1,950,945 |
Sinko Kogyo Co., Ltd. | 88,000 | 350,808 |
Sintokogio Ltd. | 125,500 | 1,798,446 |
| Number of | Value |
Security | Shares | ($) |
| | |
Tsurumi Manufacturing Co., | | |
Ltd. | 5,000 | 49,895 |
Wakita & Co., Ltd. | 50,000 | 376,386 |
| | 26,842,827 |
Miscellaneous Finance 0.5% | | |
Aizawa Securities Co., Ltd. | 14,400 | 121,647 |
Matsui Securities Co., Ltd. (a) | 6,000 | 52,396 |
Mito Securities Co., Ltd. | 167,000 | 851,270 |
Mitsubishi UFJ Securities Co., | | |
Ltd. (a) | 48,000 | 545,326 |
Okasan Holdings, Inc. (a) | 261,000 | 2,028,623 |
Osaka Securities Finance Co.,Ltd. | 130,300 | 569,987 |
RECRM RESEARCH Co., Ltd. | 463 | 774,529 |
Shinsei Bank Ltd. | 671,000 | 3,208,534 |
Takagi Securities Co., Ltd. | 56,000 | 248,767 |
Toyo Securities Co., Ltd. | 198,000 | 908,768 |
| | 9,309,847 |
Oil Distribution 0.0% | | |
AOC Holdings, Inc. | 31,800 | 516,498 |
Cosmo Oil Co., Ltd. | 29,000 | 121,063 |
| | 637,561 |
Photo-optical, Micros & Office Machinery 0.5% | |
Eizo Nanao Corp. (a) | 52,300 | 1,725,076 |
Japan Digital Laboratory Co., | | |
Ltd. | 96,800 | 1,540,684 |
Konica Minolta Holdings, Inc. | 326,500 | 4,277,683 |
Noritsu Koki Co., Ltd. (a) | 62,100 | 1,116,127 |
Riso Kagaku Corp. (a) | 43,600 | 882,685 |
Tamron Co., Ltd. | 400 | 8,456 |
| | 9,550,711 |
Publishing, Broadcasting & Cinema 0.2% | |
Chubu-Nippon Broadcasting | | |
Co., Ltd. | 300 | 3,781 |
Hakuhodo Dy Holdings, Inc. (a) | 29,480 | 2,058,181 |
Kadokawa Group Holdings, | | |
Inc. (a) | 74,000 | 2,414,723 |
RKB Mainichi Broadcasting | | |
Corp. | 12,000 | 106,811 |
| | 4,583,496 |
Real Estate Development 0.6% | | |
Airport Facilities Co., Ltd. (a) | 180,800 | 1,140,591 |
Aoki Marine Co., Ltd. | 5,000 | 17,826 |
Cosmos Initia Co., Ltd. | 59,000 | 427,693 |
Cowboy Co., Ltd. | 58,000 | 126,854 |
Hankyu Hanshin Holdings,Inc. (a) | 7,000 | 42,296 |
Hosoda Corp. | 55,000 | 263,989 |
Iida Home Max (a) | 40,700 | 716,544 |
Japan Airport Terminal Co., Ltd. | 231,900 | 3,372,863 |
Keihanshin Real Estate Co.,Ltd. | 45,000 | 324,415 |
Meiwa Estate Co., Ltd. (a) | 80,900 | 1,250,092 |
Nisshin Fudosan Co., Ltd. | 68,700 | 894,352 |
SUNCITY Co., Ltd. (a) | 350 | 192,447 |
Takara Leben Co., Ltd. | 60,200 | 850,214 |
The Sankei Building Co., Ltd. | 1,600 | 15,322 |
| | | |
See financial notes.
Laudus Funds Annual Report 87
Laudus Rosenberg International Small Capitalization Fund |
Portfolio Holdings continued | | |
| | | |
| | Number of | Value |
Security | | Shares | ($) |
| | | |
Towa Real Estate Development Co., Ltd. (a)* | 371,500 | 2,002,218 |
Yuraku Real Estate Co., Ltd. | 93,000 | 542,414 |
| | | 12,180,130 |
Restaurants, Hotels & Theaters 0.5% | | |
BMB Corp. | | 40,100 | 163,376 |
Daisyo Corp. | | 71,900 | 932,750 |
Fields Corp. | | 848 | 1,363,494 |
Friendly Corp. | | 5,000 | 21,848 |
Gourmet Kineya Co., Ltd. | 45,000 | 366,209 |
H.I.S. Co., Ltd. | | 95,700 | 2,746,104 |
Matsuya Foods Co., Ltd. | 4,300 | 58,834 |
Royal Holdings Co., Ltd. (a) | 143,400 | 1,807,107 |
Shidax Corp. | | 1,144 | 1,065,471 |
Tokyo Dome Corp. (a) | 42,000 | 227,418 |
| | | 8,752,611 |
Retail 0.9% | | | |
Aichi Toyota Motor Co., Ltd. | 20,000 | 389,215 |
AOKI Holdings, Inc. | | 85,600 | 1,629,467 |
Aoyama Trading Co., Ltd. | 103,600 | 3,280,585 |
Blue Grass Co., Ltd. | | 12,600 | 148,481 |
Chiyoda Co., Ltd. (a) | | 17,500 | 428,161 |
Daiichikosho Co., Ltd. | 200,000 | 2,256,583 |
Daiwa Co., Ltd. | | 96,000 | 228,401 |
Haruyama Trading Co., Ltd. (a) | 21,900 | 209,953 |
Heiwado Co., Ltd. | | 142,600 | 2,225,332 |
Izumiya Co., Ltd. | | 313,000 | 2,411,935 |
Jeans Mate Corp. | | 24,400 | 240,425 |
Kasumi Co., Ltd. | | 92,000 | 507,248 |
Maxvalu Nishinihon Co., Ltd. | 8,900 | 116,703 |
Ministop Co., Ltd. | | 10,200 | 176,213 |
Okuwa Co., Ltd. | | 121,000 | 1,719,983 |
Poplar Co., Ltd. | | 2,300 | 18,684 |
Uny Co., Ltd. (a) | | 156,000 | 2,136,046 |
| | | 18,123,415 |
Soaps & Cosmetics 0.0% | | | |
ADERANS Co., Ltd. | | 85 | 2,061 |
Software 0.1% | | | |
Daikoku Denki Co., Ltd. | 7,600 | 137,942 |
Fujitsu Business Systems Ltd. | 76,900 | 1,193,975 |
Japan Process Development Co., Ltd. | 9,600 | 83,399 |
TIS, Inc. (a) | | 33,900 | 803,028 |
| | | 2,218,344 |
Textiles & Apparel 0.5% | | | |
Fuji Corp. | | 11,000 | 110,290 |
Fujix Ltd. | | 9,000 | 51,064 |
Ichikawa Co., Ltd. | | 79,000 | 352,092 |
Japan Wool Textile Co., Ltd. | 235,000 | 2,053,772 |
Jichodo Co., Ltd. | | 6,000 | 60,676 |
King Co., Ltd. | | 45,000 | 162,141 |
Kurabo Industries Ltd. (a) | 790,000 | 2,187,865 |
Morishita Co., Ltd. | | 7,000 | 73,956 |
Nisshinbo Industries, Inc. (a) | 14,000 | 174,777 |
Onward Kashiyama Co., Ltd. | 85,000 | 1,179,019 |
Sazaby, Inc. | | 29,500 | 801,465 |
Tokyo Style Co., Ltd. | | 250,000 | 2,732,698 |
| | | Number of | Value |
Security | | | Shares | ($) |
| | | | |
Trading Company 0.2% | | | | |
Sojitz Corp. (a)* | | | 1,086,700 | 4,515,700 |
Wholesale 0.8% | | | | |
Daiwabo Information System Co., Ltd. | | | 2,500 | 34,296 |
Denkyosha Co., Ltd. | | | 17,000 | 144,117 |
Fujitsu Devices, Inc. | | | 1,000 | 13,625 |
Inabata & Co., Ltd. | | | 18,900 | 151,580 |
Japan Pulp & Paper Co.,Ltd. (a) | | | 506,000 | 1,972,295 |
Kamei Corp. | | | 93,000 | 727,337 |
Kanaden Corp. | | | 91,000 | 590,677 |
Kato Sangyo Co., Ltd. | | | 52,900 | 696,788 |
Kojima Co., Ltd. (a) | | | 80,400 | 684,810 |
Macnica, Inc. | | | 37,700 | 1,112,587 |
Mitani Corp. | | | 10,200 | 126,478 |
Mitsuuroko Co., Ltd. | | | 65,000 | 458,732 |
Nagahori Corp. | | | 57,000 | 225,768 |
Nagase & Co., Ltd. | | | 97,000 | 1,218,904 |
Onoken Co., Ltd. | | | 57,300 | 821,038 |
Ryoden Trading Co., Ltd. | | | 159,000 | 1,319,868 |
Ryosan Co., Ltd. (a) | | | 107,400 | 2,756,065 |
Sanshin Electronics Co., Ltd. | 6,200 | 77,819 |
Senshu Electric Co., Ltd. | | | 200 | 5,006 |
Shinko Shoji Co., Ltd. | | | 200 | 3,913 |
Sinanen Co., Ltd. | | | 93,000 | 471,555 |
TEN ARROWS Co., Ltd. | | | 6,700 | 43,933 |
Tokiwa Yakuhin Co., Ltd. | | | 10,000 | 43,633 |
Totech Corp. | | | 25,000 | 220,440 |
Trusco Nakayama Corp. (a) | | 13,900 | 280,939 |
Tsuzuki Densan Co., Ltd. | | | 22,500 | 109,976 |
Uchida Yoko Co., Ltd. | | | 108,000 | 513,854 |
Uehara Sei Shoji Co., Ltd. | | 38,000 | 190,065 |
| | | | 15,016,098 |
| | | | 334,686,625 |
Malaysia 0.0% | | | | |
| | | | |
Real Estate Development 0.0% | | | |
Rekapacific Berhad (b)(c)* | | 24,000 | — |
Netherlands 3.3% | | | | |
| | | | |
Agriculture, Food & Beverage 0.5% | | |
CSM N.V. | | | 182,800 | 6,539,067 |
Koninklijke Wessanen N.V. (a) | 220,026 | 3,324,987 |
| | | | 9,864,054 |
Banks & Credit Institutions 0.1% | | |
Kas Bank N.V. | | | 54,000 | 1,734,773 |
Basic Minerals & Metals 0.0% | | | |
Draka Holding N.V. (a)* | | | 3,500 | 127,673 |
Chemicals & Rubber 0.8% | | | | |
Koninklijke DSM N.V. (a) | | | 333,748 | 14,977,383 |
Forest Products & Paper 0.0% | | | |
Crown Van Gelder N.V. | | | 9,758 | 243,898 |
Furniture & Household Items | 0.4% | |
Hunter Douglas N.V. | | | 86,303 | 7,614,645 |
Information & Services 0.5% | | | |
Vedior N.V. | | | 462,902 | 10,317,157 |
| | | | | |
88 Laudus Funds Annual Report
See financial notes.
Laudus Rosenberg International Small Capitalization Fund |
| | | Number of | Value |
Security | | | Shares | ($) |
| | | | |
IT Hardware 0.2% | | | | |
ASM International N.V. * | | | 155,564 | 3,466,268 |
Metal Products & Machinery 0.0% | | | |
BE Semiconductor Industries | | | |
N.V. (a)* | | | 70,783 | 467,342 |
Koninklijke Nedschroef Holding | | | |
N.V. | | | 5,084 | 396,282 |
| | | | 863,624 |
Miscellaneous Finance 0.0% | | | | |
Van der Moolen Holding | | | | |
N.V. (a) | | | 86,141 | 461,666 |
Publishing, Broadcasting & Cinema | 0.0% | |
DOCdata N.V. | | | 26,000 | 228,523 |
Real Estate Development 0.2% | | | |
Nieuwe Steen Investments | | | | |
N.V. | | | 117,818 | 3,473,090 |
Retail 0.0% | | | | |
Macintosh Retail Group N.V. | | 1,291 | 52,068 |
Stern Groep N.V. | | | 6,200 | 332,173 |
| | | | 384,241 |
Software 0.2% | | | | |
Getronics N.V. (a) | | | 354,000 | 3,250,552 |
Wholesale 0.4% | | | | |
Buhrmann N.V. (a) | | | 301,000 | 4,042,789 |
Univar N.V. | | | 55,609 | 3,107,345 |
| | | | 7,150,134 |
| | | | 64,157,681 |
New Zealand 0.2% | | | | |
| | | | |
Agriculture, Food & Beverage 0.0% | | | |
AFFCO Holdings Ltd. | | | 887,761 | 241,483 |
Sanford Ltd. | | | 17,957 | 62,059 |
| | | | 303,542 |
Airlines 0.1% | | | | |
Air New Zealand Ltd. | | | 494,885 | 825,975 |
Land & Water Transportation 0.1% | | | |
Mainfreight Ltd. | | | 201,682 | 1,052,171 |
Tourism Holdings Ltd. | | | 217,789 | 360,428 |
| | | | 1,412,599 |
Restaurants, Hotels & Theaters 0.0% | | |
Millennium & Capthorne Hotels | | | |
New Zealand Ltd. | | | 1,147,522 | 635,054 |
Retail 0.0% | | | | |
Hallenstein Glasson Holdings | | | |
Ltd. | | | 52,084 | 186,213 |
| | | | 3,363,383 |
Norway 0.5% | | | | |
| | | | |
Banks & Credit Institutions 0.0% | | | |
Sparebanken Vest | | | 7,022 | 226,880 |
Government Aircraft & Defense | 0.3% | |
Aker Yards A/S (a) | | | 262,000 | 4,525,936 |
Kongsberg Gruppen A/S | | | 55,613 | 1,694,923 |
| | | | 6,220,859 |
| | | Number of | Value |
Security | | | Shares | ($) |
| | | | |
Land & Water Transportation 0.2% | | |
Fosen Trafikklag A.S.A. | | | 187 | 20,459 |
Stolt-Nielsen S.A. (a) | | | 94,184 | 2,766,659 |
| | | | 2,787,118 |
Miscellaneous Finance 0.0% | | | | |
Skiens Aktiemolle A.S.A. | | 8,622 | 177,311 |
| | | | 9,412,168 |
Portugal 0.4% | | | | |
| | | | |
Banks & Credit Institutions 0.4% | | |
Banco Espirito Santo, S.A. | | | |
(BES) Reg’d | | | 403,298 | 7,708,075 |
Forest Products & Paper 0.0% | | | |
Corticeira Amorim S.A. | | | 7,338 | 20,532 |
Real Estate Development 0.0% | | |
Teixeira Duarte — Engenharia | | | |
Construcoes S.A. | | | 45,792 | 165,408 |
Restaurants, Hotels & Theaters 0.0% | | |
Ibersol SGPS S.A. | | | 35,747 | 496,627 |
| | | | 8,390,642 |
Singapore 1.0% | | | | |
| | | | |
Agriculture, Food & Beverage 0.1% | | |
Asia Food & Properties Ltd. | | 2,182,000 | 998,263 |
Cerebos Pacific Ltd. | | | 32,000 | 69,917 |
Golden Agri-Resources Ltd. | | 702,180 | 813,999 |
| | | | 1,882,179 |
Autos 0.1% | | | | |
Jardine Cycle & Carriage Ltd. | | 286,000 | 2,234,664 |
Financial Investments 0.1% | | | | |
Chuan Hup Holdings Ltd. | | 129,000 | 28,854 |
Kim Eng Holdings Ltd. | | | 1,121,513 | 1,179,884 |
Metro Holdings Ltd. | | | 1,734,000 | 982,304 |
| | | | 2,191,042 |
Furniture & Household Items 0.0% | | |
HTL International Holdings Ltd. | | 667,000 | 398,895 |
IT Hardware 0.0% | | | | |
Elec & Eltek International Co., | | | |
Ltd. | | | 37,000 | 95,982 |
STATS ChipPAC Ltd. * | | | 361,000 | 434,588 |
WBL Corp., Ltd. | | | 19,160 | 58,208 |
| | | | 588,778 |
Land & Water Transportation 0.1% | | |
K1 Ventures Ltd. * | | | 5,665,000 | 1,230,027 |
Neptune Orient Lines Ltd. | | 24,000 | 51,199 |
SBS Transit Ltd. | | | 128,500 | 243,310 |
Singapore Shipping Corp., Ltd. | | 613,000 | 153,474 |
| | | | 1,678,010 |
Metal Products & Machinery 0.0% | | |
Amtek Engineering Ltd. | | | 148,120 | 66,937 |
Kingboard Copper Foil Holdings | | | |
Ltd. | | | 293,000 | 83,721 |
| | | | 150,658 |
| | | | | |
See financial notes.
Laudus Funds Annual Report 89
Laudus Rosenberg International Small Capitalization Fund |
Portfolio Holdings continued | | | |
| | | | |
| | | Number of | Value |
Security | | | Shares | ($) |
| | | | |
Miscellaneous Finance 0.1% | | | | |
G.K. Goh Holdings Ltd. | | | 496,083 | 343,088 |
UOB-Kay Hian Holdings Ltd. | | 1,457,850 | 1,477,589 |
| | | | 1,820,677 |
Oil Distribution 0.0% | | | | |
Singapore Petroleum Co., Ltd. | | 141,000 | 448,970 |
Real Estate Development 0.4% | | | |
Bonvests Holdings Ltd. | | | 7,000 | 9,166 |
China Merchants Holdings | | | | |
Pacific Ltd. | | | 10,000 | 5,327 |
Guocoland Ltd. | | | 422,000 | 1,168,714 |
Haw Par Corp., Ltd. | | | 210,000 | 993,356 |
Ho Bee Investment Ltd. | | | 1,003,000 | 1,492,620 |
MCL Land Ltd. | | | 23,000 | 40,166 |
UOL Group Ltd. | | | 75,000 | 251,924 |
Wheelock Properties (S) Ltd. | | 253,000 | 538,476 |
Wing Tai Holdings Ltd. | | | 1,028,000 | 2,144,970 |
| | | | 6,644,719 |
Restaurants, Hotels & Theaters 0.1% | | |
Hotel Grand Central Ltd. | | | 133,000 | 90,196 |
Hotel Plaza Ltd. | | | 402,000 | 611,118 |
Low Keng Huat (Singapore) | | | |
Ltd. | | | 335,000 | 475,780 |
Stamford Land Corp., Ltd. | | | 660,000 | 178,126 |
| | | | 1,355,220 |
| | | | 19,393,812 |
South Korea 3.2% | | | | |
| | | | |
Agriculture, Food & Beverage 0.2% | | |
Dongwon F&B Co., Ltd. | | | 8,173 | 536,874 |
Lotte Confectionery Co., Ltd. | | 2,111 | 2,698,833 |
Namyang Dairy Products Co., | | | |
Ltd. | | | 655 | 575,899 |
Nong Shim Holdings Co., Ltd. | | 790 | 65,419 |
Ottogi Corp. | | | 30 | 2,807 |
Samyang Corp. | | | 1,178 | 72,642 |
Samyang Genex Co., Ltd. | | | 6,570 | 652,949 |
TS Corp. | | | 7,400 | 277,928 |
| | | | 4,883,351 |
Airlines 0.0% | | | | |
Korea Airport Service Co., Ltd. | | 12,910 | 676,272 |
Banks & Credit Institutions 0.3% | | |
Daegu Bank | | | 143,280 | 2,595,218 |
Pusan Bank | | | 290,160 | 4,303,462 |
| | | | 6,898,680 |
Basic Minerals & Metals 0.2% | | | | |
KISWIRE Ltd. | | | 27,650 | 876,209 |
Korea Iron & Steel Co., Ltd. | | 17,020 | 697,588 |
Korea Zinc Co., Ltd. | | | 27,950 | 2,967,374 |
| | | | 4,541,171 |
| | | | | |
| | | Number of | Value |
Security | | | Shares | ($) |
| | | | |
Chemicals & Rubber 0.2% | | | | |
Cheil Industries, Inc. | | | 59,880 | 2,398,112 |
Honam Petrochemical Corp. | | 4,780 | 413,273 |
Korea Kumho Petrochemical | | | |
Co., Ltd. (KKPC) | | | 23,260 | 809,659 |
Korean Petrochemical Industrial | | | |
Co., Ltd. | | | 3,550 | 163,765 |
| | | | 3,784,809 |
Communications Utilities 0.3% | | | |
LG Dacom Corp. | | | 31,980 | 753,984 |
LG Telecom Ltd. * | | | 180,580 | 2,046,341 |
LS Cable Ltd. | | | 62,330 | 2,717,652 |
| | | | 5,517,977 |
Construction & Homebuilding 0.2% | | |
Kolon Engineering & | | | | |
Construction Co., Ltd. | | | 8,510 | 139,564 |
Kyeryong Construction | | | | |
Industrial Co., Ltd. | | | 17,170 | 695,181 |
Poonglim Industrial Co., Ltd. | | 52,010 | 399,053 |
Sam Whan Corp. | | | 30,140 | 754,911 |
Sambu Construction Co., Ltd. | | 28,810 | 1,068,069 |
Sungjee Construction Co., Ltd. | | 19,410 | 411,034 |
Sungwon Corp. * | | | 51,270 | 272,096 |
| | | | 3,739,908 |
Construction Materials 0.1% | | | | |
Asia Cement Co., Ltd. | | | 19,410 | 1,031,569 |
Hyundai Cement Co., Ltd. | | 10,980 | 411,983 |
| | | | 1,443,552 |
Drugs & Pharmaceuticals 0.1% | | | |
Choongwae Pharma Corp. | | 5,150 | 223,760 |
Daewoong Co., Ltd. | | | 13,880 | 354,292 |
Handok Pharmaceuticals Co., | | | |
Ltd. | | | 3,970 | 67,671 |
Il Dong Pharmaceutical Co., | | | |
Ltd. | | | 31,993 | 1,322,840 |
Ilsung Pharmaceuticals Co., | | | |
Ltd. | | | 2,155 | 207,263 |
| | | | 2,175,826 |
Electric Utilities 0.0% | | | | |
YESCO Co., Ltd. | | | 3,580 | 111,495 |
Financial Investments 0.0% | | | | |
Green Cross Holdings Corp. | | 5,182 | 377,303 |
Gas & Other Public Utilities 0.1% | |
E1 Corp. | | | 11,680 | 693,118 |
KyungDong City Gas Co., Ltd. | | 410 | 15,184 |
Pusan City Gas Co., Ltd. | | | 3,000 | 69,670 |
Samchully Co., Ltd. | | | 7,900 | 1,152,166 |
Seoul City Gas Co., Ltd. | | | 8,380 | 615,831 |
| | | | 2,545,969 |
Government Aircraft & Defense 0.2% | | |
Hyundai Mipo Dockyard Co., | | | |
Ltd. | | | 19,630 | 3,605,462 |
Information & Services 0.1% | | | | |
KCC Engineering & | | | | |
Construction Co., Ltd. | | | 22,562 | 981,661 |
90 Laudus Funds Annual Report
See financial notes.
Laudus Rosenberg International Small Capitalization Fund |
| | | Number of | Value |
Security | | | | Shares | ($) |
| | | | | |
Instruments 0.1% | | | | | |
INTOPS Co., Ltd. | | | | 33,570 | 985,431 |
Insurance 0.2% | | | | | |
First Fire & Marine Insurance | | | |
Co., Ltd. * | | | | 107,530 | 546,771 |
Korean Reinsurance Co. | | | 199,501 | 2,612,550 |
| | | | | 3,159,321 |
IT Hardware 0.0% | | | | | |
Sam Young Electronics Co., | | | |
Ltd. | | | | 13,930 | 118,930 |
Land & Water Transportation 0.0% | | | |
Korea Line Corp. | | | | 7,860 | 501,395 |
Sebang Co., Ltd. | | | | 2,220 | 23,509 |
| | | | | 524,904 |
Metal Products & Machinery 0.3% | | | |
Doosan Corp. * | | | | 48,940 | 3,992,512 |
SFA Engineering Corp. | | | 29,719 | 1,105,170 |
| | | | | 5,097,682 |
Miscellaneous Finance 0.1% | | | | |
Shinyoung Securities Co., Ltd. | | 21,540 | 1,085,242 |
Oil Distribution 0.0% | | | | |
Daesung Industrial Co., Ltd. | | 4,200 | 396,429 |
Publishing, Broadcasting & Cinema 0.0% | | |
Daekyo Co., Ltd. | | | | 60 | 5,140 |
Real Estate Development 0.1% | | | |
Halla Engineering & | | | | | |
Construction Corp. | | | | 52,450 | 1,221,273 |
Restaurants, Hotels & Theaters 0.0% | | |
Paradise Co., Ltd. | | | | 179,342 | 690,960 |
Retail 0.0% | | | | | |
GS Home Shopping, Inc. | | | 4,000 | 290,152 |
Soaps & Cosmetics 0.1% | | | | |
Pacific Corp. | | | | 9,180 | 1,347,881 |
Software 0.1% | | | | | |
Daou Technology Inc. | | | | 122,640 | 1,038,275 |
Textiles & Apparel 0.0% | | | | |
Ilshin Spinning Co., Ltd. | | | 1,547 | 85,177 |
Wholesale 0.2% | | | | | |
Dong Ah Tire & Rubber Co., | | | |
Ltd. | | | | 6,440 | 37,354 |
Hanwha Corp. | | | | 88,360 | 3,584,546 |
Youngone Corp. | | | | 31,770 | 167,407 |
| | | | | 3,789,307 |
| | | | | 61,119,540 |
Spain 2.2% | | | | | |
| | | | | |
Airlines 0.5% | | | | | |
Iberia Lineas Aereas de Espana | | | |
S.A. (a) | | | | 1,914,000 | 10,236,672 |
Construction Materials 0.5% | | | | |
Cementos Portland Valderrivas | | | |
S.A. (a) | | | | 58,285 | 8,811,793 |
Electric Utilities 0.1% | | | | |
Union Fenosa SA | | | | 13,159 | 711,864 |
| | | | | | |
| | | | Number of | Value |
Security | | | | Shares | ($) |
| | | | | |
Forest Products & Paper 0.0% | | | | |
Iberpapel Gestion S.A. | | | | 10,870 | 298,981 |
Gas & Other Public Utilities 0.1% | | | |
Enagas S.A. (a) | | | | 83,803 | 2,163,516 |
Instruments 0.0% | | | | | |
Indo Internacional S.A. | | | | 24,259 | 322,768 |
Metal Products & Machinery 0.2% | | | |
Construcciones y Auxiliar de | | | |
Ferrocarriles S.A. | | | | 10,053 | 3,049,277 |
Publishing, Broadcasting & Cinema 0.1% | | |
Gestevision Telecinco S.A. (a) | | 70,056 | 2,030,818 |
Restaurants, Hotels & Theaters 0.7% | | |
NH Hoteles S.A. (a)* | | | | 279,000 | 6,425,335 |
Sol Melia S.A. | | | | 321,503 | 7,739,380 |
| | | | | 14,164,715 |
Textiles & Apparel 0.0% | | | | |
Tavex Algodonera S.A. (a) | | | 103,292 | 473,850 |
Wholesale 0.0% | | | | | |
Unipapel S.A. | | | | 11,036 | 361,752 |
| | | | | 42,626,006 |
Sweden 2.7% | | | | | |
| | | | | |
Airlines 0.4% | | | | | |
SAS AB (a)* | | | | 360,000 | 6,628,431 |
Autos 0.2% | | | | | |
Haldex AB | | | | 7,858 | 189,283 |
Trelleborg AB | | | | 133,524 | 3,477,812 |
| | | | | 3,667,095 |
Basic Minerals & Metals 0.5% | | | | |
Boliden AB (a)* | | | | 426,062 | 9,410,566 |
Profilgruppen AB | | | | 3,615 | 42,487 |
| | | | | 9,453,053 |
Cellular & Wireless 0.0% | | | | |
Partnertech AB | | | | 6,597 | 107,981 |
Chemicals & Rubber 0.0% | | | | |
Geveko AB | | | | 10,708 | 463,848 |
Communications Utilities 0.5% | | | | |
Tele2 AB, Class B (a) | | | | 510,000 | 8,376,322 |
Financial Investments 0.0% | | | | | |
Havsfrun AB, Shares B | | | | 7,429 | 38,620 |
Novestra AB | | | | 66,151 | 150,017 |
| | | | | 188,637 |
Forest Products & Paper 0.0% | | | | |
Rorvik Timber AB, Shares B * | | 4,599 | 38,105 |
Government Aircraft & Defense 0.3% | | |
Saab AB, Series B | | | | 213,000 | 5,748,334 |
Land & Water Transportation 0.0% | | | |
Rederi AB Transatlantic | | | | 65,778 | 490,060 |
Metal Products & Machinery 0.0% | | |
AB Traction, Shares B | | | | 10,017 | 110,628 |
Midway Holdings AB | | | | 472 | 5,521 |
| | | | | 116,149 |
| | | | | | |
See financial notes.
Laudus Funds Annual Report 91
Laudus Rosenberg International Small Capitalization Fund |
Portfolio Holdings continued | | |
| | | |
| | Number of | Value |
Security | | Shares | ($) |
| | | |
Miscellaneous Finance 0.0% | | | |
Svolder AB | | 12,946 | 148,428 |
Real Estate Development 0.8% | | | |
Castellum AB | | 433,187 | 6,257,106 |
Fabege AB | | 226,337 | 5,683,063 |
HEBA Fastighets AB | | 600 | 17,486 |
Home Properties AB | | 3,078 | 43,464 |
Hufvudstaden AB, Shares A | | 10,124 | 115,988 |
Kungsleden AB | | 189,491 | 3,409,114 |
Lennart Wallenstam Byggnads | | |
AB | | 3,434 | 73,512 |
| | | 15,599,733 |
Restaurants, Hotels & Theaters 0.0% | | |
Cherryforetagen AB * | | 4,292 | 26,671 |
Software 0.0% | | | |
Addnode AB * | | 34,730 | 146,250 |
IBS AB * | | 4,816 | 17,337 |
Observer AB * | | 14,464 | 65,764 |
| | | 229,351 |
Wholesale 0.0% | | | |
OEM International AB | | 10,977 | 330,131 |
| | | 51,612,329 |
Switzerland 8.1% | | | |
| | | |
Agriculture, Food & Beverage 0.1% | | |
Emmi AG — Reg’d | | 15,116 | 1,930,557 |
Groupe Minoteries S.A. | | 844 | 169,985 |
| | | 2,100,542 |
Autos 0.3% | | | |
Rieter Holding AG — Reg’d | | 10,153 | 5,070,111 |
Banks & Credit Institutions 0.6% | |
Banque Cantonale de Geneve | 8,832 | 2,150,080 |
Banque Cantonale Vaudoise | | | |
(BCV) — Reg’d | | 10,365 | 4,925,658 |
Graubunder Kantonalbank | | 913 | 806,398 |
Verwaltungs-und Privat-Bank | | |
AG | | 16,145 | 3,964,166 |
| | | 11,846,302 |
Basic Minerals & Metals 0.4% | | | |
Georg Fischer AG — Reg’d. * | | 10,560 | 7,640,385 |
UMS Schweizerische | | | |
Metallwerke Holding AG* | | 18,631 | 415,167 |
| | | 8,055,552 |
Chemicals & Rubber 0.5% | | | |
Clariant AG — Reg’d * | | 518,000 | 8,910,063 |
Communications Utilities 0.1% | | | |
Ascom Holding AG | | 39,850 | 695,972 |
Mobilezone Holding AG | | 129,000 | 784,249 |
| | | 1,480,221 |
Construction Materials 0.2% | | | |
Forbo Holding AG — Reg’d* | | 7,335 | 3,265,045 |
sia Abrasives Holding AG — | | |
Reg’d | | 43 | 16,583 |
Vetropack Holding S.A. | | 546 | 750,834 |
| | Number of | Value |
Security | | Shares | ($) |
| | | |
Drugs & Pharmaceuticals 0.6% | | |
Ciba Specialty Chemicals AG — | | |
Reg’d | | 133,899 | 8,840,425 |
Schweizerhall Holding AG | 10,924 | 1,708,069 |
Siegfried Holding AG | | 8,385 | 1,235,292 |
| | | 11,783,786 |
Electric Utilities 0.4% | | |
Elektrizitaets-Gesellschaft | | |
Laufenburg AG | | 4,178 | 4,843,243 |
Energiedienst Holding AG — | | |
Reg’d * | | 4,536 | 2,288,941 |
Romande Energie Holding S.A. | 331 | 488,594 |
| | | 7,620,778 |
Forest Products & Paper 0.1% | | |
CPH Chemie & Papier Holding | | |
AG | | 102 | 226,639 |
Harwanne Compagnie de | | |
participations industielles et | | |
financieres S.A. | | 1,710 | 429,270 |
Industrieholding Cham AG | 2,117 | 801,399 |
| | | 1,457,308 |
Furniture & Household Items 0.2% | | |
Daetwyler Holding AG | 445 | 2,653,191 |
Swatch Group | | 1,993 | 528,002 |
| | | 3,181,193 |
Information & Services 0.2% | | |
Kuoni Reisen Holding AG — | | |
Reg’d * | | 6,591 | 3,953,740 |
Instruments 0.1% | | | |
Carlo Gavazzi Holding AG * | 2,007 | 453,439 |
Comet Holding AG | | 2,000 | 472,781 |
Inficon Holding AG | | 8,287 | 1,347,527 |
| | | 2,273,747 |
Insurance 2.5% | | | |
Baloise Holding AG, Reg’d | 145,000 | 15,140,642 |
Helvetia Holding AG | | 18,857 | 8,099,663 |
Schweiz Natl-Vers-Ges | 3,206 | 2,509,099 |
Swiss Life Holding — Reg’d | | 88,320 | 22,226,097 |
Vaudoise Assurances Holding | | |
S.A. — Reg’d | | 4,741 | 857,532 |
| | | 48,833,033 |
IT Hardware 0.1% | | | |
Huber & Suhner AG | | 11,243 | 2,335,223 |
Schaffner Holding AG* | | 660 | 124,666 |
SEZ Holding AG * | | 6,476 | 215,095 |
| | | 2,674,984 |
Land & Water Transportation 0.0% | | |
Jungfraubahn Holding AG | 19,849 | 771,270 |
Metal Products & Machinery 0.5% | | |
Bucher Industries AG— Reg’d | | 31,196 | 4,212,997 |
Conzzeta Holding AG | | 1,075 | 2,084,188 |
Feintool International Holding | | |
AG (a) | | 1,932 | 763,489 |
Phoenix Mecano AG | | 560 | 268,206 |
92 Laudus Funds Annual Report
See financial notes.
Laudus Rosenberg International Small Capitalization Fund |
| | | Number of | Value |
Security | | | Shares | ($) |
| | | | |
Tornos S.A. * | | | 45,000 | 674,260 |
WMH Walter Meier AG, | | | |
Class A — Reg’d | | 4,831 | 845,961 |
| | | | 8,849,101 |
Real Estate Development 0.7% | | | |
Allreal Holding AG— Reg’d | | | 12,408 | 1,584,359 |
Flughafen Zuerich AG — Reg’d | 13,588 | 5,267,897 |
Intershop Holdings AG | | 6,982 | 1,805,830 |
LO Holding Lausanne-Ouchy S.A. | | | 181 | 177,427 |
MCH Messe Schweiz Holdings AG | | | 1,293 | 643,487 |
Pax-Anlage AG | | | 60 | 38,469 |
PSP Swiss Property AG * | | 37,600 | 2,292,204 |
Zueblin Immobilien Holding | | | |
AG * | | | 84,889 | 877,119 |
| | | | 12,686,792 |
Retail 0.1% | | | | |
Charles Vogele Holding AG* | | 20,648 | 2,265,549 |
Software 0.0% | | | | |
Crealogix Holding AG * | | 137 | 10,665 |
Kardex AG * | | | 17,835 | 756,442 |
| | | | 767,107 |
Wholesale 0.4% | | | | |
Also Holding — Reg’d | | 15,840 | 877,838 |
Bobst Group AG | | | 60,400 | 3,697,260 |
Eichhof Holding AG | | 420 | 692,890 |
Metraux Services Holding AG | 1,633 | 295,574 |
Valora Holding AG | | | 11,250 | 3,213,772 |
| | | | 8,777,334 |
| | | | 157,390,975 |
United Kingdom 18.7% | | | | |
| | | | |
Agriculture, Food & Beverage 0.9% | | |
Anglo-Eastern Plantations plc | 24,668 | 151,566 |
Carr’s Milling Industries plc | | 27,358 | 292,294 |
Nichols plc | | | 53,309 | 322,203 |
Robert Wiseman Dairies plc | | 38,319 | 346,113 |
Tate & Lyle plc | | | 1,407,761 | 15,968,571 |
Uniq plc | | | 35,866 | 135,747 |
| | | | 17,216,494 |
Autos 0.6% | | | | |
GKN plc | | | 1,565,681 | 11,743,364 |
Banks & Credit Institutions 0.1% | | |
Hitachi Capital UK plc | | 93,010 | 416,105 |
Intermediate Capital Group plc | 123 | 4,720 |
Kensington Group plc | | 69,366 | 909,881 |
NETeller plc (a)(c)* | | | 184,264 | 538,633 |
| | | | 1,869,339 |
Basic Minerals & Metals 1.5% | | | |
Antofagasta plc | | | 2,069,037 | 21,118,136 |
Avocet Mining plc* | | | 288,000 | 713,964 |
Bodycote International plc | | 842,812 | 5,153,290 |
Castings plc | | | 97,863 | 519,965 |
Golden Prospect plc | | 380,000 | 461,828 |
| | | | 27,967,183 |
| | | | Number of | Value |
Security | | | | Shares | ($) |
| | | | | |
Chemicals & Rubber 0.0% | | | | |
Elementis plc | | | | 372,704 | 659,216 |
Commercial Aircraft & Components 0.3% | | |
Meggitt plc | | | | 676,101 | 3,968,197 |
Rolls-Royce Group plc | * | | | 29,895 | 291,606 |
Senior plc | | | | 641,343 | 1,019,118 |
| | | | | 5,278,921 |
Communications Utilities 1.3% | | | |
Cable & Wireless | | | | 6,651,000 | 21,883,989 |
COLT Telecom Group S.A. (a)* | | 325,917 | 1,143,821 |
Eckoh Technologies plc * | | | 960,000 | 193,636 |
Kingston Communications | | | |
(Hull) plc | | | | 1,165,693 | 1,791,512 |
Thus Group plc | | | | 1,622 | 5,890 |
| | | | | 25,018,848 |
Construction Materials 0.2% | | | | |
Cookson Group plc | | | | 288,257 | 3,527,375 |
Drugs & Pharmaceuticals 0.0% | | | |
Goldshield Group plc | | | | 67,220 | 226,047 |
Electric Utilities 1.8% | | | | | |
British Energy Group plc* | | | 1,670,000 | 16,037,227 |
International Power plc | | | | 2,339,058 | 18,282,492 |
| | | | | 34,319,719 |
Forest Products & Paper 0.1% | | | |
DS Smith plc | | | | 366,234 | 1,609,410 |
Furniture & Household Items 0.4% | | | |
British Polythene Industries plc | | 28,873 | 285,555 |
Carclo plc | | | | 184,000 | 396,483 |
F.W. Thorpe plc | | | | 35,881 | 446,598 |
Galiform plc * | | | | 1,789,736 | 5,485,407 |
Volex Group plc * | | | | 78,379 | 223,645 |
| | | | | 6,837,688 |
Gas & Other Public Utilities 0.0% | | |
Shanks Group plc | | | | 33,280 | 175,945 |
Government Aircraft & Defense 0.2% | | |
Chemring Group plc | | | | 228 | 8,350 |
E2V Technologies plc | | | | 25,620 | 195,688 |
Trafficmaster plc * | | | | 252,362 | 339,715 |
Vt Group plc | | | | 398,329 | 3,854,255 |
| | | | | 4,398,008 |
Information & Services 1.0% | | | | |
AMEC plc | | | | 659,095 | 6,890,142 |
Anite Group plc | | | | 866,101 | 1,395,786 |
Christie Group plc | | | | 52,243 | 258,558 |
Communisis plc | | | | 397,462 | 500,573 |
Creston plc | | | | 114,869 | 412,234 |
Glotel plc | | | | 132,000 | 155,995 |
Group 4 Securicor plc | | | | 492,718 | 1,950,236 |
Harvey Nash Group plc * | | | 189,717 | 280,926 |
Interior Services Group plc | | 90,000 | 561,449 |
Keller Group plc | | | | 194,073 | 3,524,431 |
Macfarlane Group plc | | | | 19,235 | 11,514 |
Management Consulting Group plc | | | | 416,977 | 379,943 |
Metnor Group plc | | | | 44,000 | 363,659 |
MICE Group plc | | | | 648,992 | 308,462 |
| | | | | | | |
See financial notes.
Laudus Funds Annual Report 93
Laudus Rosenberg International Small Capitalization Fund |
Portfolio Holdings continued | | | |
| | | | |
| | Number of | Value |
Security | | | Shares | ($) |
| | | | |
Next Fifteen Communications | | | |
plc | | | 156,902 | 293,835 |
Nord Anglia Education plc * | | 127,950 | 807,377 |
Opsec Security Group plc * | | 82,113 | 150,250 |
Tenon Group plc | | | 416,000 | 521,635 |
Tribal Group plc | | | 133,542 | 320,764 |
Waterman Group plc | | | 104,000 | 375,544 |
| | | | 19,463,313 |
Instruments 0.0% | | | | |
Dialight plc | | | 108,000 | 443,996 |
Oxford Instruments plc | | | 69,597 | 339,131 |
| | | | 783,127 |
Insurance 2.2% | | | | |
Brit Insurance Holdings plc | | 854,898 | 5,424,712 |
Chaucer Holdings plc | | | 873,000 | 1,620,962 |
Friends Provident plc | | | 4,614,802 | 17,501,047 |
Old Mutual plc | | | 4,101,000 | 13,282,902 |
Resolution plc | | | 437,600 | 5,339,181 |
| | | | 43,168,804 |
IT Hardware 0.1% | | | | |
Filtronic plc (a) | | | 197,424 | 521,129 |
TT electronics plc | | | 292,356 | 1,378,634 |
Zetex plc | | | 338,707 | 598,481 |
| | | | 2,498,244 |
Land & Water Transportation 0.0% | | | |
Braemar Seascope Group plc | | 64,440 | 513,508 |
Clarkson plc | | | 14,765 | 281,836 |
Ocean Wilsons Holdings Ltd. | | 1,461 | 23,198 |
| | | | 818,542 |
Mainframe & Minicomputers 0.0% | | | |
Psion plc | | | 37,934 | 126,156 |
Metal Products & Machinery 0.1% | | | |
Alumasc Group plc | | | 90,871 | 394,594 |
Delta plc | | | 131,334 | 354,049 |
Eleco plc | | | 126,539 | 240,636 |
Trifast plc | | | 275,125 | 436,227 |
Wagon plc | | | 103,148 | 273,648 |
| | | | 1,699,154 |
Miscellaneous Finance 0.6% | | | | |
Investec plc | | | 960,029 | 12,445,008 |
Photo-optical, Micros & Office Machinery 0.0% | |
Laird Group plc | | | 9,678 | 104,105 |
Publishing, Broadcasting & Cinema 0.5% | | |
Media Square plc | | | 269,519 | 53,037 |
Trinity Mirror plc | | | 846,058 | 8,839,082 |
| | | | 8,892,119 |
Real Estate Development 1.9% | | | |
Enterprise Inns plc | | | 1,696,800 | 22,364,631 |
Mapeley Ltd. | | | 53,750 | 4,109,133 |
Minerva plc * | | | 465,052 | 3,501,695 |
Rugby Estates plc | | | 11,400 | 136,548 |
Shaftesbury plc | | | 396,550 | 5,915,093 |
Warner Estate Holdings plc | | 29,632 | 472,732 |
| | | | 36,499,832 |
| | | Number of | Value |
Security | | | Shares | ($) |
| | | | |
Real Estate Investment Trusts 0.5% | | |
British Land Co Plc | | | 99,748 | 3,008,762 |
Brixton plc | | | 706,000 | 7,071,620 |
| | | | 10,080,382 |
Restaurants, Hotels & Theaters 3.1% | | |
Compass Group plc | | | 1,828,000 | 12,243,505 |
Greene King plc | | | 351,631 | 7,632,291 |
Luminar plc | | | 1,176 | 17,472 |
Marston’s plc | | | 532,800 | 4,629,482 |
Millennium & Copthorne Hotel plc | | | 618,628 | 8,285,883 |
Punch Taverns plc | | | 144,500 | 3,548,436 |
Regent Inns plc * | | | 369,770 | 792,757 |
Sportech plc * | | | 1,777,556 | 550,929 |
Ultimate Leisure Group plc | | 90,000 | 336,502 |
Whitbread plc | | | 342,568 | 12,755,693 |
William Hill plc | | | 757,600 | 9,491,752 |
| | | | 60,284,702 |
Retail 0.2% | | | | |
Alliance Boots plc | | | 51,392 | 1,038,936 |
Amstrad plc | | | 136,313 | 386,894 |
Jacques Vert plc * | | | 281,723 | 127,509 |
Jessops plc | | | 214,138 | 63,198 |
John David Group plc | | 122,000 | 1,050,940 |
Smiths News plc | | | 198,961 | 544,460 |
Woolworths Group plc | | 607,322 | 367,308 |
| | | | 3,579,245 |
Soaps & Cosmetics 0.1% | | | |
McBride plc | | | 241,592 | 1,137,090 |
Software 0.9% | | | | |
Alphameric plc | | | 356,395 | 346,523 |
Computacenter plc | | | 436,666 | 2,394,652 |
Dimension Data Holdings plc | 3,734,795 | 3,687,486 |
Horizon Technology Group plc * | | | 77,652 | 118,044 |
Intec Telecom Systems plc* | | 1,048,000 | 867,451 |
InTechnology plc * | | | 350,000 | 268,696 |
Kewill Systems plc* | | | 16,027 | 24,916 |
Logica CMG plc | | | 2,044,910 | 7,170,237 |
Microgen plc | | | 200,943 | 201,094 |
Morse plc | | | 434,485 | 793,013 |
Northgate Information | | | |
Solutions plc | | | 494,987 | 809,242 |
RM plc | | | 39,188 | 146,713 |
| | | | 16,828,067 |
Textiles & Apparel 0.0% | | | | |
Alexon Group plc | | | 88,568 | 363,427 |
Low & Bonar plc | | | 45,358 | 124,961 |
Marchpole Holdings plc | | 7,895 | 25,891 |
| | | | 514,279 |
Wholesale 0.1% | | | | |
Acal plc | | | 82,250 | 648,960 |
Dawson Holdings plc | | 194,763 | 413,925 |
Fayrewood plc | | | 71,615 | 147,442 |
James Latham plc | | | 72,000 | 320,208 |
| | | | 1,530,535 |
| | | | 361,300,261 |
| | | | | |
94 Laudus Funds Annual Report
See financial notes.
Laudus Rosenberg International Small Capitalization Fund |
| | Number of | Value |
Security | | Shares | ($) |
| | | |
United States 0.1% | | |
| | | |
Forest Products & Paper 0.1% | | |
Domtar Corp. * | | 202,200 | 1,840,729 |
Total Common Stock (Cost $1,528,627,990) | 1,869,932,546 |
| | | |
| | | |
Preferred Stock 0.1% of net assets | |
| | | |
Austria 0.0% | | | |
MIBA AG | | 1,600 | 242,804 |
Germany 0.1% | | | |
Jungheinrich AG (a) | 47,379 | 1,728,156 |
Villeroy & Boch AG (a) | 17,648 | 351,729 |
| | | 2,079,885 |
United Kingdom 0.0% | | | |
Rolls-Royce Group plc * | 54,759,999 | 110,454 |
Total Preferred Stock (Cost $1,621,605) | 2,433,143 |
| | | |
Rights 0.1% of net assets | | |
| | | |
Austria 0.0% | | | |
Conwert Immobilien Invest | | |
AG * | | 66,243 | — |
Belgium 0.0% | | | |
Carrieres Unies Porphyre * | 11 | — |
Japan 0.0% | | | |
Dowa Mining * | | 391,000 | 198,586 |
Sweden 0.0% | | | |
Fabege Ab * | | 226,337 | 174,425 |
United Kingdom | 0.1% | | |
Meggit plc * | | 338,050 | 660,243 |
Total Rights (Cost $ — ) | | 1,033,254 |
| | | |
Warrants 0.0% of net assets | | |
| | | |
Hong Kong 0.0% | | | |
Champion Technology Holdings | | |
Ltd. * | | 992,339 | 39,371 |
Total Warrants (Cost $ — ) | | 39,371 |
| | | | |
Security | Face Amount | Value |
Rate, Maturity Date | ($) | ($) |
| | |
Short-Term Investment 1.7% of net assets | |
| | |
Repurchase Agreement 1.7% | | |
Fixed Income Clearing Corp. | | |
dated 03/30/07, due 04/02/07 | | |
at 5.00%, with a maturity | | |
value of $33,121,795 (fully | | |
collateralized by Federal | | |
Home Loan Bank with a | | |
value of $33,770,531.) | 33,108,000 | 33,108,000 |
| | | |
Total Short-Term Investment | | |
(Cost $33,108,000) | | 33,108,000 |
| | |
End of Investments. | | |
| | |
At 03/31/07 the tax basis cost of the fund’s investments was |
$1,577,902,473 and the unrealized appreciation and depreciation |
were $365,059,527 and ($36,415,686), respectively, with a net |
unrealized appreciation of $328,643,841. | |
| | |
| Number of | Value |
Security | Shares | ($) |
| | |
Collateral Invested for Securities on Loan 7.6% of net assets | |
State Street Navigator Security | | |
Lending Prime Portfolio | 146,492,602 | 146,492,602 |
| | |
End of collateral invested for securities on loan. | |
| | |
At 03/31/07, the prices of certain foreign securities held by the |
fund aggregating $1,709,168,468 were adjusted from their closing |
market prices following the guidelines adopted by the fund’s |
board of trustees. | | |
* Non-income producing security. | | |
(a) All or a portion of this security is on loan. | |
(b) Bankrupt security/delisted. | | |
(c) Fair-valued by Management. | | |
See financial notes.
Laudus Funds Annual Report 95
Laudus Rosenberg U.S. Large/Mid Capitalization Long/Short Equity Fund |
Portfolio Holdings as of March 31, 2007 | |
| | | | | |
| | | Cost/Proceeds | Value |
Holdings by Category | | | | ($) | ($) |
| | | | | |
95.7% Common Stock | | | 15,894,523 | 18,495,591 |
3.6% Short-Term Investment | | | | 692,469 | 692,469 |
| | | | | |
99.3% Total Investments | | | 16,586,992 | 19,188,060 |
(94.8)% Short Sales | | | | (18,328,050) | (18,323,387) |
95.5% Deposits with broker | | | |
and custodian bank for securities sold short | | 18,463,415 | 18,463,415 |
0.0% Other Assets and | | | | |
Liabilities | | | | | (4,830) |
| | | | | |
100.0% Net Assets | | | | | 19,323,258 |
| | | | | |
| | | | | | |
| | | | Number of | Value |
Security | | | | Shares | ($) |
| | | | | |
Common Stock (a) 95.7% of net assets | |
| | | | | |
Agriculture, Food & Beverage 2.7% | | | |
General Mills, Inc. | | | | 3,300 | 192,126 |
Kellogg Co. | | | | 4,800 | 246,864 |
The Pepsi Bottling Group, Inc. | | 2,850 | 90,887 |
| | | | | 529,877 |
Airlines 0.6% | | | | | |
FedEx Corp. | | | | 1,000 | 107,430 |
Banks & Credit Institutions 6.4% | | | |
Bank of America Corp. | | | | 14,500 | 739,790 |
Comerica, Inc. | | | | 3,400 | 201,008 |
Harley-Davidson, Inc. | | | | 4,800 | 282,000 |
Northern Trust Corp. | | | | 200 | 12,028 |
| | | | | 1,234,826 |
Basic Minerals & Metals 2.2% | | | | |
Allegheny Technologies, Inc. | | | 200 | 21,338 |
Nucor Corp. | | | | 6,060 | 394,688 |
| | | | | 416,026 |
Biotechnology 2.0% | | | | | |
Celgene Corp. * | | | | 7,500 | 393,450 |
Cellular & Wireless 1.7% | | | | |
NII Holdings, Inc. * | | | | 4,470 | 331,585 |
Chemicals & Rubber 1.5% | | | | | |
The Sherwin-Williams Co. | | | 4,500 | 297,180 |
Communications Utilities 5.5% | | | |
AT&T Corp. | | | | 22,700 | 895,061 |
Google, Inc., Class A * | | | | 205 | 93,923 |
Level 3 Communications, Inc. * | | 10,900 | 66,490 |
| | | | | 1,055,474 |
Electric Utilities 6.3% | | | | | |
Consolidated Edison, Inc. | | | 4,500 | 229,770 |
Edison International | | | | 8,250 | 405,323 |
PG&E Corp. | | | | 12,100 | 584,067 |
| | | | | 1,219,160 |
| | | | | | |
| | | Number of | Value |
Security | | | Shares | ($) |
| | | | |
Forest Products & Paper 1.5% | | | |
3M Co. | | | 110 | 8,407 |
International Paper Co. | | | 7,920 | 288,288 |
| | | | 296,695 |
Health Care & Hospital 1.1% | | | | |
Health Net, Inc. * | | | 200 | 10,762 |
Humana, Inc. * | | | 3,400 | 197,268 |
| | | | 208,030 |
Information & Services 2.6% | | | | |
Accenture Ltd., Class A | | | 7,530 | 290,206 |
Manpower, Inc. | | | 1,360 | 100,327 |
The Dun & Bradstreet Corp. | | 1,295 | 118,104 |
| | | | 508,637 |
Instruments 3.5% | | | | |
Honeywell International, Inc. | | 11,800 | 543,508 |
Waters Corp. * | | | 2,300 | 133,400 |
| | | | 676,908 |
Insurance 11.9% | | | | |
ACE Ltd. | | | 10,200 | 582,012 |
Everest Re Group Ltd. | | | 1,800 | 173,106 |
Loews Corp. | | | 15,000 | 681,450 |
The Allstate Corp. | | | 13,620 | 818,017 |
The Chubb Corp. | | | 600 | 31,002 |
XL Capital Ltd., Class A | | | 200 | 13,992 |
| | | | 2,299,579 |
Integrated Oil Companies 1.6% | | | |
Exxon Mobil Corp. | | | 3,920 | 295,764 |
Hess Corp. | | | 400 | 22,188 |
| | | | 317,952 |
IT Hardware 7.6% | | | | |
Amphenol Corp., Class A | | | 1,900 | 122,683 |
Avaya, Inc. * | | | 11,400 | 134,634 |
Cisco Systems, Inc. * | | | 17,800 | 454,434 |
Flextronics International Ltd. * | | 4,700 | 51,418 |
Harris Corp. | | | 2,710 | 138,074 |
L-3 Communications Holdings, Inc. | 2,500 | 218,675 |
MEMC Electronic Materials, Inc. * | 5,600 | 339,248 |
| | | | 1,459,166 |
Land & Water Transportation 4.2% | | | |
Union Pacific Corp. | | | 7,900 | 802,245 |
Mainframe & Minicomputers 1.1% | | | |
Apple, Inc. * | | | 2,290 | 212,764 |
Metal Products & Machinery 1.8% | | | |
Parker Hannifin Corp. | | | 3,740 | 322,799 |
Terex Corp. * | | | 400 | 28,704 |
| | | | 351,503 |
Miscellaneous Finance 4.7% | | | | |
Chicago Mercantile Exchange | | | |
Holdings, Inc., Class A | | | 616 | 327,995 |
Merrill Lynch & Co., Inc. | | | 7,200 | 588,024 |
| | | | 916,019 |
| | | | | |
96 Laudus Funds Annual Report
See financial notes.
Laudus Rosenberg U.S. Large/Mid Capitalization Long/Short Equity Fund |
| | | Number of | Value |
Security | | | Shares | ($) |
| | | | |
Oil & Coal Resources 0.9% | | | | |
XTO Energy, Inc. | | | 3,300 | 180,873 |
Oil Drilling & Services 1.1% | | | | |
ENSCO International, Inc. | 3,100 | 168,640 |
Noble Corp. | | | 620 | 48,782 |
| | | | 217,422 |
Publishing, Broadcasting & Cinema 1.0% | | |
CBS Corp., Class B | | | 6,050 | 185,070 |
Restaurants, Hotels & Theaters 1.2% | | |
McDonald’s Corp. | | | 3,960 | 178,398 |
Yum! Brands, Inc. | | | 800 | 46,208 |
| | | | 224,606 |
Retail 6.8% | | | | |
Abercrombie & Fitch Co., Class A | 2,900 | 219,472 |
American Eagle Outfitters, Inc. | 3,600 | 107,964 |
AutoZone, Inc. * | | | 1,900 | 243,466 |
CarMax, Inc. * | | | 1,000 | 24,540 |
CVS/Caremark Corp. | | | 980 | 33,457 |
Federated Department Stores, Inc. | 3,100 | 139,655 |
J.C. Penney Co., Inc. | | | 4,035 | 331,515 |
Nordstrom, Inc. | | | 4,140 | 219,172 |
| | | | 1,319,241 |
Soaps & Cosmetics 0.9% | | | |
The Clorox Co. | | | 2,790 | 177,695 |
Software 12.1% | | | | |
BMC Software, Inc. * | | | 8,400 | 258,636 |
Cadence Design Systems, Inc. * | 5,953 | 125,370 |
Cognizant Technology Solutions | | |
Corp., Class A * | | | 4,593 | 405,424 |
Computer Sciences Corp. * | 4,600 | 239,798 |
International Business Machines | | |
Corp. | | | 8,300 | 782,358 |
Intuit, Inc. * | | | 7,100 | 194,256 |
Oracle Corp. * | | | 18,000 | 326,340 |
| | | | 2,332,182 |
| Number of | Value |
Security | Shares | ($) |
| | |
Wholesale 1.2% | | |
W.W. Grainger, Inc. | 2,900 | 223,996 |
Total Common Stock (Cost $15,894,523) | 18,495,591 |
| | |
| | |
| Face Amount | Value |
Security | ($) | ($) |
| | |
Short-Term Investment (a) 3.6% of net assets | | |
| | |
Repurchase Agreement 3.6% | |
Custodian Trust Company, dated | |
03/30/07, due 04/02/07 at 5.10% | |
with a maturity value of | | |
$692,763 (fully collateralized by | |
U.S. Treasury Bond with a value | |
of $718,285) | 692,469 | 692,469 |
Total Short-Term Investment | |
(Cost $692,469) | | 692,469 |
| | |
End of Investments. | | |
| | |
At 3/31/07 the tax basis cost of the fund’s investments was |
$16,681,100 and the unrealized appreciation and depreciation was |
$2,622,567 and ($115,607), respectively, with a net unrealized |
appreciation of $2,506,960. | | |
* Non-income producing security. | |
(a) All long positions are pledged as collateral for securities sold |
short. | | |
| | | | |
See financial notes.
Laudus Funds Annual Report 97
Laudus Rosenberg U.S. Large/Mid Capitalization Long/Short Equity Fund |
Portfolio Holdings continued | | |
| | | | | |
| | | | Number of | Value |
Security | | | | Shares | ($) |
| | | | | |
Short Sales 94.8% of net assets | | |
| | | | | |
Agriculture, Food & Beverage 3.1% | | | |
PepsiCo, Inc. | | | | 4,200 | 266,952 |
Wm. Wrigley Jr. Co. | | | | 6,375 | 324,679 |
| | | | | 591,631 |
Banks & Credit Institutions 6.8% | | | |
American Express Co. | | | | 5,100 | 287,640 |
Commerce Bancorp, Inc. | | | | 6,800 | 226,984 |
Fifth Third Bancorp | | | | 1,440 | 55,714 |
Ford Motor Co. | | | | 63,600 | 501,804 |
Sovereign Bancorp, Inc. | | | | 9,800 | 249,312 |
| | | | | 1,321,454 |
Biotechnology 3.2% | | | | | |
Amgen, Inc. * | | | | 9,000 | 502,920 |
Genentech, Inc. * | | | | 1,400 | 114,968 |
| | | | | 617,888 |
Chemicals & Rubber 2.8% | | | | | |
The Dow Chemical Co. | | | | 11,720 | 537,479 |
Communications Utilities 3.9% | | | |
Virgin Media, Inc. | | | | 190 | 4,797 |
Yahoo! Inc. * | | | | 24,200 | 757,218 |
| | | | | 762,015 |
Construction & Homebuilding 0.7% | | | |
Pulte Homes, Inc. | | | | 5,130 | 135,740 |
Drugs & Pharmaceuticals 3.3% | | | |
Allergan, Inc. | | | | 2,200 | 243,804 |
Eli Lilly and Co. | | | | 7,500 | 402,825 |
| | | | | 646,629 |
Electric Utilities 7.1% | | | | | |
CenterPoint Energy, Inc. | | | | 5,410 | 97,055 |
Dominion Resources, Inc. | | | | 3,580 | 317,797 |
Duke Energy Corp. | | | | 19,000 | 385,510 |
The AES Corp. * | | | | 1,060 | 22,811 |
TXU Corp. | | | | 8,600 | 551,260 |
| | | | | 1,374,433 |
Furniture & Household Items 0.9% | | | |
Newell Rubbermaid, Inc. | | | | 5,700 | 177,213 |
Health Care & Hospital 1.0% | | | | |
UnitedHealth Group, Inc. | | | | 3,700 | 195,989 |
Information & Services 1.1% | | | | |
Apollo Group, Inc., Class A * | | | 4,900 | 215,110 |
Instruments 1.9% | | | | | |
Medtronic, Inc. | | | | 4,000 | 196,240 |
St. Jude Medical, Inc. * | | | | 4,300 | 161,723 |
| | | | | 357,963 |
Insurance 2.6% | | | | | |
The Progressive Corp. | | | | 22,800 | 497,496 |
| | | Number of | Value |
Security | | | Shares | ($) |
| | | | |
IT Hardware 13.0% | | | | |
Advanced Micro Devices, Inc. * | | 490 | 6,399 |
Altera Corp. * | | | 12,800 | 255,872 |
Analog Devices, Inc. | | | 10,100 | 348,349 |
Broadcom Corp., Class A * | | 4,030 | 129,242 |
Intel Corp. | | | 34,400 | 658,072 |
KLA-Tencor Corp. | | | 6,600 | 351,912 |
Linear Technology Corp. | | | 12,400 | 391,716 |
Maxim Integrated Products, Inc. | | 1,100 | 32,340 |
QUALCOMM, Inc. | | | 7,300 | 311,418 |
Xilinx, Inc. | | | 1,200 | 30,876 |
| | | | 2,516,196 |
Land & Water Transportation 2.6% | | | |
United Parcel Service, Inc., Class B | 7,020 | 492,102 |
Mainframe & Minicomputers 1.6% | | |
Dell, Inc. * | | | 13,700 | 317,977 |
Metal Products & Machinery 3.5% | | |
The Procter & Gamble Co. | | 10,600 | 669,496 |
Miscellaneous Finance 2.6% | | | | |
E*TRADE Financial Corp. * | | 5,180 | 109,919 |
Legg Mason, Inc. | | | 4,200 | 395,682 |
| | | | 505,601 |
Oil & Coal Resources 3.4% | | | | |
EOG Resources, Inc. | | | 3,000 | 214,020 |
Southwestern Energy Co. * | | 5,400 | 221,292 |
Ultra Petroleum Corp. * | | | 4,200 | 223,146 |
| | | | 658,458 |
Photo-optical, Micros & Office Machinery 0.0% | | |
Lexmark International, Inc., | | | |
Class A * | | | 100 | 5,846 |
Publishing, Broadcasting & Cinema 0.6% | | |
The Interpublic Group of Cos., | | | |
Inc. * | | | 9,000 | 110,790 |
Real Estate Investment Trusts 7.6% | | | |
Boston Properties, Inc. | | | 2,600 | 305,240 |
Equity Residential | | | 9,500 | 458,185 |
General Growth Properties, Inc. | | 6,700 | 432,619 |
Plum Creek Timber Co., Inc. | | 6,800 | 268,056 |
| | | | 1,464,100 |
Restaurants, Hotels & Theaters 1.2% | | |
Starbucks Corp. * | | | 7,500 | 235,200 |
Retail 8.7% | | | | |
Amazon.com, Inc. * | | | 11,050 | 439,680 |
Bed, Bath & Beyond, Inc. * | | 1,901 | 76,363 |
Costco Wholesale Corp. | | | 3,500 | 188,440 |
eBay, Inc. * | | | 21,020 | 696,813 |
The Home Depot, Inc. | | | 450 | 16,533 |
Walgreen Co. | | | 900 | 41,301 |
Whole Foods Market, Inc. | | 4,860 | 217,971 |
| | | | 1,677,101 |
| | | | | |
98 Laudus Funds Annual Report
See financial notes.
Laudus Rosenberg U.S. Large/Mid Capitalization Long/Short Equity Fund |
| Number of | Value |
Security | Shares | ($) |
| | |
Soaps & Cosmetics 0.1% | | |
Johnson & Johnson | 300 | 18,078 |
Software 11.5% | | |
Adobe Systems, Inc. * | 12,400 | 517,080 |
Autodesk, Inc. * | 6,200 | 233,120 |
Citrix Systems, Inc. * | 2,940 | 94,168 |
Electronic Arts, Inc. * | 8,500 | 428,060 |
Microsoft Corp. | 29,300 | 816,591 |
VeriSign, Inc. * | 5,270 | 132,383 |
| | 2,221,402 |
Total Short Sales (Proceeds $18,328,050) | | 18,323,387 |
| | |
End of short sale positions. | | |
| | |
* Non-income producing security. | | |
| | | | |
See financial notes.
Laudus Funds Annual Report 99
Laudus Rosenberg Global Long/Short Equity Fund |
Portfolio Holdings as of March 31, 2007 | |
| | | |
| | Cost/Proceeds | Value |
Holdings by Category | ($) | ($) |
| | | |
96.2% | Common Stock | 17,051,955 | 19,874,593 |
—% | Preferred Stock | 800 | 836 |
0.1% | Rights | — | 5,587 |
5.7% | Short-Term Investment | 1,180,359 | 1,180,359 |
102.0% | Total Investments | 18,233,114 | 21,061,375 |
(95.5)% | Short Sales | (18,939,163) | (19,721,130) |
69.6% | Deposits with broker | | |
| and custodian bank for | | |
| securities sold short | 14,388,573 | 14,388,573 |
23.9% | Other Assets and Liabilities | | 4,931,248 |
100.0% | Net Assets | | 20,660,066 |
| | | | Number of | Value |
Security | | | | Shares | ($) |
| | | | | |
Common Stock (a) 96.2% of net assets | |
| | | | | |
Austria 0.5% | | | | | |
Communications Utilities 0.1% | | | | |
Telekom Austria AG | | | | 400 | 10,051 |
Metal Products & Machinery 0.1% | | | |
Andritz AG | | | | 80 | 20,066 |
Real Estate Development 0.3% | | | | |
Immofinanz Immobilien Analagen AG * | | | | 3,600 | 57,896 |
Meinl European Land Ltd. * | | | 400 | 11,130 |
| | | | | 69,026 |
| | | | | 99,143 |
Belgium 1.3% | | | | | |
Banks & Credit Institutions 0.2% | | | |
Fortis | | | | 1,200 | 54,779 |
Basic Minerals & Metals 0.2% | | | | | |
Umicore | | | | 200 | 35,699 |
Instruments 0.3% | | | | | |
Agfa Gevaert N.V. | | | | 2,450 | 55,462 |
Restaurants, Hotels & Theaters 0.3% | | | |
S.A. D’Ieteren N.V. | | | | 160 | 65,917 |
Retail 0.3% | | | | | |
Delhaize Group | | | | 645 | 59,519 |
| | | | | 271,376 |
Denmark 0.9% | | | | | |
Banks & Credit Institutions 0.3% | | | |
Danske Bank A/S | | | | 1,100 | 50,994 |
Beer, Liquor, & Tobacco 0.2% | | | | |
Carlsberg A/S, Class B | | | | 400 | 43,456 |
Metal Products & Machinery 0.4% | | | |
Vestas Wind Systems A/S * | | | 1,500 | 83,617 |
| | | | | 178,067 |
Finland 0.5% | | | | | |
Basic Minerals & Metals 0.3% | | | | | |
Outokumpu Oyj | | | | 1,500 | 51,631 |
Chemicals & Rubber 0.2% | | | | | |
Kemira Oyj | | | | 1,800 | 41,196 |
| | | | | 92,827 |
| | | | | | | |
| | | | | Number of | Value |
Security | | | | | Shares | ($) |
| | | | | | |
France 4.0% | | | | | | |
Airlines 0.3% | | | | | | |
Air France-KLM | | | | | 1,200 | 54,886 |
Autos 0.4% | | | | | | |
PSA Peugeot Citroen | | | | | 996 | 70,227 |
Societe Fonciere Financiere et de | | | |
Participations (FFP) | | | | | 81 | 22,275 |
| | | | | | 92,502 |
Chemicals & Rubber 0.1% | | | | | |
Compagnie Generale des | | | | | |
Etablissements Michelin, Class B | | 120 | 13,268 |
Communications Utilities 0.3% | | | | |
Publicis Groupe | | | | | 1,200 | 57,924 |
Construction Materials 0.3% | | | | |
Compagnie de Saint-Gobain | | | 660 | 64,800 |
Government Aircraft & Defense 0.3% | | | |
Beneteau | | | | | 134 | 16,188 |
Thales S.A. | | | | | 900 | 52,477 |
| | | | | | 68,665 |
Insurance 0.2% | | | | | | |
CNP Assurances | | | | | 400 | 46,809 |
Land & Water Transportation 0.1% | | | |
Financiere de l’Odet | | | | | 26 | 11,957 |
Metal Products & Machinery 0.2% | | | |
Valeo S.A. | | | | | 600 | 35,294 |
Miscellaneous Finance 0.3% | | | | |
Natixis | | | | | 2,400 | 58,749 |
Publishing, Broadcasting & Cinema 0.3% | | |
Havas S.A. | | | | | 6,000 | 34,708 |
Thomson | | | | | 2,000 | 38,530 |
| | | | | | 73,238 |
Real Estate Development 0.2% | | | | |
Nexity | | | | | 400 | 34,370 |
Restaurants, Hotels & Theaters 0.2% | | | |
Sodexho Alliance S.A. | | | | | 690 | 50,637 |
Software 0.5% | | | | | | |
Atos Origin S.A. * | | | | | 800 | 53,857 |
Cap Gemini S.A. | | | | | 600 | 45,668 |
| | | | | | 99,525 |
Textiles & Apparel 0.3% | | | | | | |
Christian Dior S.A. | | | | | 600 | 73,159 |
| | | | | | 835,783 |
Germany 2.0% | | | | | | |
Autos 0.4% | | | | | | |
Bayerische Motoren Werke | | | | |
(BMW) AG | | | | | 900 | 53,095 |
Volkswagen AG | | | | | 136 | 20,410 |
| | | | | | 73,505 |
Basic Minerals & Metals 0.3% | | | | |
ThyssenKrupp AG | | | | | 1,313 | 65,176 |
Chemicals & Rubber 0.2% | | | | | |
Lanxess * | | | | | 900 | 46,562 |
100 Laudus Funds Annual Report
See financial notes.
Laudus Rosenberg Global Long/Short Equity Fund |
| | | | Number of | Value |
Security | | | | Shares | ($) |
| | | | | | |
Commercial Aircraft & Components 0.2% | | | |
MTU Aero Engines Holding AG | | | 800 | 48,081 |
Electric Utilities 0.2% | | | | | | |
MVV Energie AG | | | | | 1,000 | 37,938 |
IT Hardware 0.3% | | | | | | |
Infineon Technologies AG * | | | | 3,600 | 56,062 |
Photo-optical, Micros & Office Machinery 0.1% | | | |
Heidelberger Druckmaschinen AG | | | 600 | 27,546 |
Retail 0.2% | | | | | | |
KarstadtQuelle AG * | | | | | 1,100 | 40,451 |
Wholesale 0.1% | | | | | | |
GEA Group AG | | | | | 600 | 16,659 |
| | | | | | 411,980 |
Ireland 0.5% | | | | | | |
Agriculture, Food & Beverage 0.2% | | | | |
Kerry Group plc, Class A | | | | | 1,800 | 50,313 |
Construction Materials 0.3% | | | | | |
CRH plc | | | | | 1,200 | 51,459 |
| | | | | | 101,772 |
Italy 2.4% | | | | | | |
Autos 0.4% | | | | | | |
Fiat S.p.A. * | | | | | 3,000 | 76,044 |
Chemicals & Rubber 0.2% | | | | | | |
Pirelli & C. S.p.A. | | | | | 36,000 | 39,815 |
Construction Materials 0.4% | | | | | |
Buzzi Unicem S.p.A. | | | | | 1,995 | 60,785 |
Italcementi S.p.A. | | | | | 700 | 21,022 |
| | | | | | 81,807 |
Consumer Durables 0.1% | | | | | |
Indesit Co. S.p.A. | | | | | 1,000 | 21,319 |
Electric Utilities 0.4% | | | | | | |
ACEA S.p.A. | | | | | 2,000 | 37,517 |
C.I.R. S.p.A.-Compagnie Industriali | | | | |
Riunite | | | | | 12,000 | 47,857 |
| | | | | | 85,374 |
Forest Products & Paper 0.3% | | | | | |
IFIL-Investments S.p.A. | | | | | 6,000 | 58,804 |
Government Aircraft & Defense 0.2% | | | |
Finmeccanica S.p.A. | | | | | 1,800 | 54,107 |
Oil Distribution 0.2% | | | | | | |
ERG S.p.A. | | | | | 1,600 | 44,028 |
Real Estate Development 0.2% | | | | | |
Risanamento S.p.A. | | | | | 4,000 | 42,019 |
| | | | | | 503,317 |
Japan 23.9% | | | | | | |
Agriculture, Food & Beverage 0.1% | | | | |
Yamazaki Baking Co., Ltd. | | | | 3,000 | 27,279 |
Autos 1.7% | | | | | | |
Fuji Heavy Industries Ltd. | | | | | 19,000 | 98,403 |
Kawasaki Heavy Industries Ltd. | | | 23,000 | 97,021 |
Mazda Motor Corp. | | | | | 10,000 | 55,145 |
| | | | | | | |
| | | Number of | Value |
Security | | | Shares | ($) |
| | | | |
Toyota Auto Body Co., Ltd. | | 700 | 13,149 |
Yamaha Motor Co., Ltd. | | | 2,900 | 80,998 |
| | | | 344,716 |
Banks & Credit Institutions 0.3% | | |
Hyakugo Bank Ltd. | | | 7,000 | 44,871 |
Shiga Bank Ltd. | | | 2,000 | 13,851 |
| | | | 58,722 |
Basic Minerals & Metals 2.6% | | | | |
Fujikura Ltd. | | | 7,000 | 49,149 |
Hitachi Cable Ltd. | | | 7,000 | 39,698 |
JFE Holdings, Inc. | | | 1,600 | 94,475 |
Kobe Steel Ltd. | | | 23,000 | 92,422 |
Nippon Steel Corp. | | | 17,000 | 119,377 |
Nisshin Steel Co., Ltd. | | | 27,000 | 116,046 |
Tokyo Steel Manufacturing Co., Ltd. | 2,000 | 29,421 |
| | | | 540,588 |
Beer, Liquor, & Tobacco 1.4% | | | |
Asahi Breweries Ltd. | | | 4,300 | 68,872 |
Japan Tobacco, Inc. | | | 26 | 127,460 |
Kirin Brewery Co., Ltd. | | | 6,000 | 86,607 |
| | | | 282,939 |
Cellular & Wireless 0.5% | | | | |
KDDI Corp. | | | 12 | 95,461 |
Chemicals & Rubber 3.1% | | | |
Daicel Chemical Industries Ltd. | 11,000 | 74,836 |
Dainippon Ink & Chemicals, Inc. | 23,000 | 91,108 |
Kaneka Corp. | | | 8,000 | 76,109 |
Mitsubishi Chemical Holdings Corp. * | 13,000 | 110,477 |
Mitsubishi Gas Chemical Co., Inc. | 6,000 | 57,321 |
Sumitomo Chemical Co., Ltd. | 16,000 | 120,573 |
Teijin Ltd. | | | 21,000 | 118,029 |
| | | | 648,453 |
Communications Utilities 0.5% | | | |
Nippon Telegraph & Telephone Corp. | | |
(NTT) | | | 21 | 110,930 |
Construction Materials 0.1% | | | |
Asahi Glass Co., Ltd. | | | 2,000 | 28,064 |
Consumer Durables 0.5% | | | |
Matsushita Electric Industrial Co., | | |
Ltd. | | | 5,000 | 100,772 |
Drugs & Pharmaceuticals 0.6% | | | |
Taisho Pharmaceutical Co., Ltd. | 7,000 | 128,279 |
Electric Utilities 0.3% | | | | |
Hokkaido Electric Power Co., Inc. | 2,100 | 55,716 |
The Chugoku Electric Power Co., Inc. | 700 | 15,644 |
| | | | 71,360 |
Furniture & Household Items 0.5% | | |
Matsushita Electric Works Ltd. | 2,000 | 22,853 |
Sankyo Co., Ltd. | | | 1,800 | 78,908 |
| | | | 101,761 |
Gas & Other Public Utilities 0.5% | | |
Osaka Gas Co., Ltd. | | | 24,000 | 92,989 |
See financial notes.
Laudus Funds Annual Report 101
Laudus Rosenberg Global Long/Short Equity Fund |
Portfolio Holdings continued | | | |
| | | | |
| | Number of | Value |
Security | | Shares | ($) |
| | | | |
Insurance 1.1% | | | | |
Aioi Insurance Co., Ltd. | | | 9,000 | 62,545 |
Mitsui Sumitomo Insurance Co., Ltd. | | 5,000 | 62,519 |
Sompo Japan Insurance Inc. | | | 8,000 | 99,352 |
| | | | 224,416 |
IT Hardware 0.7% | | | | |
Dainippon Screen Mfg. Co., Ltd. | | 5,000 | 37,694 |
Futaba Corp. | | | 1,100 | 26,178 |
Seiko Epson Corp. | | | 2,000 | 58,723 |
Toshiba Tec Corp. | | | 5,000 | 29,865 |
| | | | 152,460 |
Land & Water Transportation 0.8% | | | | |
Seino Transportation Co., Ltd. | | | 7,000 | 65,963 |
West Japan Railway Co. | | | 21 | 96,796 |
| | | | 162,759 |
Mainframe & Minicomputers 0.5% | | | | |
NEC Corp. | | | 19,000 | 101,553 |
Metal Products & Machinery 1.9% | | | | |
Bosch Corp. | | | 5,000 | 22,606 |
Fuji Electric Holdings Co., Ltd. | | | 10,000 | 46,235 |
Heiwa Corp. | | | 1,800 | 22,219 |
Hitachi Ltd. | | | 16,000 | 124,364 |
Mitsubishi Heavy Industries Ltd. | | 19,000 | 122,520 |
Sega Sammy Holdings, Inc. | | | 2,400 | 55,940 |
| | | | 393,884 |
Miscellaneous Finance 1.1% | | | | |
Daiwa Securities Group, Inc. | | | 10,000 | 120,174 |
Mitsubishi UFJ Securities Co., Ltd. * | | 2,000 | 22,722 |
Shinsei Bank Ltd. | | | 19,000 | 90,853 |
| | | | 233,749 |
Oil Distribution 0.2% | | | | |
Cosmo Oil Co., Ltd. | | | 8,000 | 33,397 |
Photo-optical, Micros & Office Machinery | 1.3% | |
Fuji Photo Film Co., Ltd. | | | 3,100 | 126,799 |
Konica Minolta Holdings, Inc. | | | 9,500 | 124,466 |
Noritsu Koki Co., Ltd. | | | 700 | 12,581 |
| | | | 263,846 |
Publishing, Broadcasting & Cinema 1.5% | | | |
Dai Nippon Printing Co., Ltd. | | | 7,000 | 109,864 |
Dentsu, Inc. | | | 20 | 55,763 |
Hakuhodo DY Holdings, Inc. | | | 650 | 45,381 |
Nippon Television Network Corp. | | 90 | 14,826 |
Toppan Printing Co., Ltd. | | | 7,000 | 72,914 |
TV Asahi Corp. | | | 5 | 10,031 |
| | | | 308,779 |
Real Estate Development 0.6% | | | |
Sekisui House Ltd. | | | 8,000 | 124,212 |
Software 0.4% | | | | |
Fujitsu Ltd. | | | 14,000 | 92,888 |
Textiles & Apparel 0.6% | | | | |
Onward Kashiyama Co., Ltd. | | | 6,000 | 83,225 |
Tokyo Style Co., Ltd. | | | 3,000 | 32,792 |
| | | | | Number of | Value |
Security | | | | | Shares | ($) |
| | | | | | |
Trading Company0.5% | | | | | | |
Mitsubishi Corp. | | | | | 4,400 | 101,575 |
| | | | | | 4,941,848 |
Netherlands 1.4% | | | | | | |
Agriculture, Food & Beverage 0.1% | | | |
CSM N.V. | | | | | 800 | 28,617 |
Chemicals & Rubber 0.2% | | | | | |
Koninklijke DSM N.V. | | | | | 900 | 40,389 |
Furniture & Household Items 0.2% | | | |
Hunter Douglas N.V. | | | | | 408 | 35,999 |
Information & Services 0.3% | | | | |
Koninklijke BAM Groep N.V. | | | 244 | 5,784 |
Vedior N.V. | | | | | 2,100 | 46,805 |
| | | | | | 52,589 |
Instruments 0.4% | | | | | | |
Koninklijke (Royal) Philips Electronics | | |
N.V. | | | | | 2,000 | 76,231 |
Orthofix International N.V. * | | | 300 | 15,315 |
| | | | | | 91,546 |
Oil Drilling & Services 0.1% | | | |
Schlumberger Ltd. | | | | | 130 | 8,983 |
Wholesale 0.1% | | | | | | |
Buhrmann N.V. | | | | | 2,000 | 26,862 |
| | | | | | 284,985 |
Spain 1.4% | | | | | | |
Airlines 0.2% | | | | | | |
Iberia Lineas Aereas de Espana S.A. | 8,000 | 42,786 |
Construction Materials 0.2% | | | | |
Cementos Portland Valderrivas S.A. | 300 | 45,355 |
Gas & Other Public Utilities 0.2% | | |
Enagas S.A. | | | | | 1,800 | 46,470 |
Integrated Oil Companies 0.4% | | | | |
Repsol YPF S.A. | | | | | 2,400 | 80,872 |
Restaurants, Hotels & Theaters 0.4% | | | |
NH Hoteles S.A. * | | | | | 1,600 | 36,848 |
Sol Melia S.A. | | | | | 1,642 | 39,527 |
| | | | | | 76,375 |
| | | | | | 291,858 |
Sweden 1.3% | | | | | | |
| | | | | | |
Airlines 0.2% | | | | | | |
SAS AB * | | | | | 2,000 | 36,825 |
Autos 0.2% | | | | | | |
Volvo AB | | | | | 600 | 50,691 |
Basic Minerals & Metals 0.3% | | | | |
Boliden AB * | | | | | 2,500 | 55,218 |
Cellular & Wireless 0.3% | | | | | |
TeliaSonera AB | | | | | 6,000 | 52,053 |
Communications Utilities 0.3% | | | | |
Tele2 AB, Class B | | | | | 4,000 | 65,697 |
| | | | | | 260,484 |
| | | | | | | | |
102 Laudus Funds Annual Report
See financial notes.
Laudus Rosenberg Global Long/Short Equity Fund |
| | | | Number of | Value |
Security | | | | Shares | ($) |
| | | | | |
Switzerland 2.5% | | | | | |
Autos 0.3% | | | | | |
Rieter Holding AG — Reg’d | | | 105 | 52,434 |
Chemicals & Rubber 0.2% | | | | | |
Clariant AG — Reg’d * | | | | 2,000 | 34,402 |
Construction Materials 0.3% | | | | |
Holcim Ltd. — Reg’d | | | | 608 | 61,175 |
Drugs & Pharmaceuticals 0.2% | | | | |
Ciba Specialty Chemicals AG — Reg’d | | 612 | 40,406 |
Electric Utilities 0.3% | | | | | |
Elektrizitaets-Gesellschaft Laufenburg | | |
AG | | | | 21 | 24,344 |
Motor-Columbus Ltd. | | | | 5 | 42,176 |
| | | | | 66,520 |
Insurance 1.0% | | | | | |
Baloise Holding AG, Reg’d | | | 408 | 42,602 |
Helvetia Holding AG | | | | 120 | 51,544 |
Swiss Life Holding — Reg’d * | | 240 | 60,397 |
Zurich Financial Services AG — Reg’d | 210 | 60,727 |
| | | | | 215,270 |
Real Estate Development 0.2% | | | | |
PSP Swiss Property AG * | | | 800 | 48,770 |
| | | | | 518,977 |
United Kingdom 5.3% | | | | | |
Agriculture, Food & Beverage 0.2% | | | |
Tate & Lyle plc | | | | 3,150 | 35,731 |
Autos 0.1% | | | | | |
GKN plc | | | | 4,000 | 30,002 |
Basic Minerals & Metals 0.2% | | | | |
Kazakhmys plc | | | | 2,000 | 46,269 |
Cellular & Wireless 0.2% | | | | |
The Carphone Warehouse Group plc | 6,000 | 32,863 |
Communications Utilities 0.3% | | | | |
Cable & Wireless | | | | 12,000 | 39,484 |
COLT Telecom Group S.A. * | | 9,000 | 31,586 |
| | | | | 71,070 |
Construction Materials 0.1% | | | | |
Cookson Group plc | | | | 2,205 | 26,982 |
Electric Utilities 0.2% | | | | | |
International Power plc | | | | 6,000 | 46,897 |
Furniture & Household Items 0.3% | | | |
Smiths Group plc | | | | 3,000 | 60,645 |
Government Aircraft & Defense 0.4% | | | |
BAE Systems plc | | | | 8,000 | 72,520 |
Information & Services 0.2% | | | | |
Group 4 Securicor plc | | | | 9,000 | 35,623 |
Insurance 1.0% | | | | | |
Aviva plc | | | | 4,900 | 72,402 |
Brit Insurance Holdings plc | | | 4,000 | 25,382 |
Friends Provident plc | | | | 9,120 | 34,586 |
Old Mutual plc | | | | 63 | 204 |
Prudential plc | | | | 4,800 | 67,827 |
| | | | | 200,401 |
| | | Number of | Value |
Security | | | Shares | ($) |
| | | | |
Miscellaneous Finance 0.3% | | | | |
Legal & General Group plc | | | 18,000 | 56,500 |
Publishing, Broadcasting & Cinema 0.6% | | |
Aegis Group plc | | | 12,000 | 35,360 |
Trinity Mirror plc | | | 2,100 | 21,940 |
WPP Group plc | | | 3,921 | 59,535 |
| | | | 116,835 |
Real Estate Investment Trusts 0.1% | | | |
Brixton plc | | | 3,000 | 30,049 |
Restaurants, Hotels & Theaters 0.8% | |
Compass Group plc | | | 10,000 | 66,978 |
Greene King plc | | | 1,400 | 30,387 |
Millennium & Copthorne Hotel plc | 3,000 | 40,182 |
William Hill plc | | | 2,574 | 32,249 |
| | | | 169,796 |
Retail 0.1% | | | | |
Alliance Boots plc | | | 1,458 | 29,475 |
Software 0.2% | | | | |
Logica CMG plc | | | 9,000 | 31,557 |
| | | | 1,093,215 |
United States 48.3% | | | | |
| | | | |
Agriculture, Food & Beverage 1.1% | | | |
Bunge Ltd. | | | 340 | 27,955 |
Cal-Maine Foods, Inc. | | | 400 | 5,380 |
Campbell Soup Co. | | | 2,190 | 85,301 |
H.J. Heinz Co. | | | 210 | 9,895 |
Kellogg Co. | | | 1,100 | 56,573 |
Overhill Farms, Inc. * | | | 300 | 2,127 |
The Coca-Cola Co. | | | 960 | 46,080 |
The Pepsi Bottling Group, Inc. | | 80 | 2,551 |
| | | | 235,862 |
Airlines 0.5% | | | | |
Alaska Air Group, Inc. * | | | 33 | 1,257 |
AMR Corp. * | | | 1,300 | 39,585 |
FedEx Corp. | | | 500 | 53,715 |
Midwest Air Group, Inc. * | | | 400 | 5,404 |
Pinnacle Airlines Corp. * | | | 400 | 6,916 |
| | | | 106,877 |
Autos 0.3% | | | | |
General Motors Corp. | | | 1,600 | 49,024 |
Spartan Motors, Inc. | | | 400 | 9,284 |
| | | | 58,308 |
Banks & Credit Institutions 1.5% | | | |
Bank of America Corp. | | | 4,600 | 234,692 |
Dollar Financial Corp. * | | | 500 | 12,650 |
The Bank of New York Co., Inc. | | 390 | 15,814 |
The First Marblehead Corp. | | | 900 | 40,401 |
| | | | 303,557 |
Basic Minerals & Metals 0.2% | | | |
Allegheny Technologies, Inc. | | | 100 | 10,669 |
Brush Engineered Materials, Inc. * | 300 | 14,541 |
General Cable Corp. * | | | 140 | 7,480 |
| | | | 32,690 |
See financial notes.
Laudus Funds Annual Report 103
Laudus Rosenberg Global Long/Short Equity Fund |
Portfolio Holdings continued | | | | |
| | | Number of | Value |
Security | | | Shares | ($) |
| | | | |
Beer, Liquor, & Tobacco 0.3% | | | |
Anheuser-Busch Cos., Inc. | | | 1,400 | 70,644 |
Biotechnology 1.6% | | | | |
Celgene Corp. * | | | 3,600 | 188,856 |
Gilead Sciences, Inc. * | | | 1,800 | 137,700 |
| | | | 326,556 |
Cellular & Wireless 0.9% | | | | |
NII Holdings, Inc. * | | | 2,400 | 178,032 |
Chemicals & Rubber 1.1% | | | | |
Albemarle Corp. | | | 900 | 37,206 |
Hercules, Inc. * | | | 1,400 | 27,356 |
LSB Industries, Inc. * | | | 300 | 4,671 |
Monsanto Co. | | | 2,100 | 115,416 |
PPG Industries, Inc. | | | 476 | 33,468 |
| | | | 218,117 |
Commercial Aircraft & Components 0.1% | | |
Ladish Co., Inc. * | | | 300 | 11,292 |
The Boeing Co. | | | 180 | 16,004 |
| | | | 27,296 |
Communications Utilities 3.7% | | | |
American Tower Corp., Class A * | 2,300 | 89,585 |
AT&T Corp. | | | 5,510 | 217,259 |
Comcast Corp., Class A * | | | 6,536 | 169,609 |
Knology, Inc. * | | | 500 | 7,915 |
Level 3 Communications, Inc. * | | 2,201 | 13,426 |
Qwest Communications International, Inc. * | | 16,300 | 146,537 |
The DIRECTV Group, Inc. * | | | 5,600 | 129,192 |
The Knot, Inc. | | | 18 | 388 |
| | | | 773,911 |
Construction & Homebuilding 0.0% | | | |
U.S. Home Systems, Inc. * | | | 200 | 2,550 |
Consumer Durables 0.4% | | | | |
Harley-Davidson, Inc. | | | 1,300 | 76,375 |
Syntax-Brillian Corp. * | | | 100 | 840 |
Universal Electronics, Inc. * | | | 200 | 5,572 |
| | | | 82,787 |
Drugs & Pharmaceuticals 1.2% | | | |
Abbott Laboratories | | | 1,400 | 78,120 |
Allergan, Inc. | | | 600 | 66,492 |
Bradley Pharmaceuticals, Inc. * | | 300 | 5,757 |
NBTY, Inc. * | | | 670 | 35,537 |
Pfizer, Inc. | | | 2,400 | 60,624 |
| | | | 246,530 |
Electric Utilities 1.3% | | | | |
Consolidated Edison, Inc. | | | 1,500 | 76,590 |
Edison International | | | 3,300 | 162,129 |
ITC Holdings Corp. | | | 500 | 21,645 |
| | | | 260,364 |
Financial Investments 0.1% | | | | |
Iconix Brand Group, Inc. * | | | 100 | 2,040 |
NexCen Brands, Inc. * | | | 800 | 7,936 |
SRS Labs, Inc. * | | | 230 | 3,204 |
| | | | 13,180 |
| | | Number of | Value |
Security | | | Shares | ($) |
| | | | |
Forest Products & Paper 0.7% | | | |
Cenveo, Inc. * | | | 900 | 21,870 |
International Paper Co. | | | 3,400 | 123,760 |
| | | | 145,630 |
Furniture & Household Items 0.3% | | | |
AZZ, Inc. * | | | 200 | 8,400 |
Fossil, Inc. * | | | 800 | 21,176 |
GameTech International, Inc. * | | 400 | 4,888 |
Hasbro, Inc. | | | 770 | 22,037 |
Virco Manufacturing Corp. * | | 300 | 2,025 |
| | | | 58,526 |
Gas & Other Public Utilities 0.4% | | |
Hanover Compressor Co. * | | 7 | 156 |
The Williams Cos., Inc. | | | 2,900 | 82,534 |
| | | | 82,690 |
Government Aircraft & Defense 0.1% | | | |
Garmin Ltd. | | | 200 | 10,830 |
Smith & Wesson Holding Corp. * | | 700 | 9,163 |
| | | | 19,993 |
Health Care & Hospital 0.4% | | | | |
Almost Family, Inc. * | | | 200 | 4,980 |
AMERIGROUP Corp. * | | | 670 | 20,368 |
Brookdale Senior Living, Inc. | | 100 | 4,466 |
Health Net, Inc. * | | | 3 | 161 |
Humana, Inc. * | | | 900 | 52,218 |
MEDTOX Scientific, Inc. * | | 200 | 3,680 |
Sun Healthcare Group, Inc. * | | 320 | 3,952 |
| | | | 89,825 |
Information & Services 1.1% | | | | |
Accenture Ltd., Class A | | | 1,100 | 42,394 |
Arbitron, Inc. | | | 400 | 18,780 |
Cass Information Systems, Inc. | | 160 | 5,402 |
Corrections Corp. of America * | | 700 | 36,967 |
CPI Corp. | | | 300 | 15,753 |
Manpower, Inc. | | | 100 | 7,377 |
Parexel International Corp. * | | 500 | 17,985 |
Rainmaker Systems, Inc. * | | 400 | 3,360 |
Standard Parking Corp. * | | | 300 | 10,611 |
The Dun & Bradstreet Corp. | | 543 | 49,522 |
The Geo Group, Inc. * | | | 200 | 9,064 |
Thomas Group, Inc. | | | 200 | 2,384 |
Volt Information Sciences, Inc. * | | 450 | 11,785 |
| | | | 231,384 |
Instruments 1.2% | | | | |
Align Technology, Inc. * | | | 1,000 | 15,860 |
Angeion Corp. * | | | 200 | 2,940 |
Baxter International, Inc. | | | 2,100 | 110,607 |
Bovie Medical Corp. * | | | 400 | 2,840 |
Bruker BioSciences Corp. * | | 1,600 | 16,832 |
Cholestech Corp. * | | | 200 | 3,448 |
Faro Technologies, Inc. * | | | 300 | 8,661 |
FEI Co. | | | 470 | 16,948 |
II-VI, Inc. * | | | 437 | 14,792 |
K-Tron International, Inc. * | | 150 | 10,760 |
NumereX Corp, Class A * | | 400 | 4,076 |
104 Laudus Funds Annual Report
See financial notes.
Laudus Rosenberg Global Long/Short Equity Fund |
| | Number of | Value |
Security | | Shares | ($) |
| | | |
Waters Corp. * | | 740 | 42,920 |
Zoll Medical Corp. * | | 300 | 7,995 |
| | | 258,679 |
Insurance 3.1% | | | |
ACE Ltd. | | 3,100 | 176,886 |
Ambassadors International, Inc. | | 300 | 13,842 |
CorVel Corp. * | | 300 | 9,075 |
Everest Re Group Ltd. | | 500 | 48,085 |
Genworth Financial, Inc., Class A | 2,600 | 90,844 |
Loews Corp. | | 3,900 | 177,177 |
The Allstate Corp. | | 1,290 | 77,477 |
Tower Group, Inc. | | 400 | 12,888 |
Wellcare Health Plans, Inc. * | | 500 | 42,625 |
| | | 648,899 |
Integrated Oil Companies 0.2% | | | |
Hess Corp. | | 820 | 45,485 |
IT Hardware 4.5% | | | |
Agere Systems, Inc. * | | 1,600 | 36,192 |
Amphenol Corp., Class A | | 1,200 | 77,484 |
Anadigics, Inc. * | | 900 | 10,638 |
Avaya, Inc. * | | 1,060 | 12,519 |
Avici Systems, Inc. * | | 300 | 3,426 |
Aviza Technology, Inc. * | | 300 | 2,163 |
Cisco Systems, Inc. * | | 17,930 | 457,753 |
Comtech Group, Inc. * | | 500 | 8,740 |
Globecomm Systems, Inc. * | | 300 | 3,210 |
Harmonic, Inc. * | | 1,200 | 11,784 |
Harris Corp. | | 866 | 44,123 |
Harris Stratex Networks, Inc., | | | |
Class A * | | 450 | 8,635 |
L-3 Communications Holdings, Inc. | 700 | 61,229 |
MEMC Electronic Materials, Inc. * | 2,600 | 157,508 |
Novellus Systems, Inc. * | | 1,000 | 32,020 |
Simclar, Inc. * | | 200 | 1,212 |
SonicWALL, Inc. * | | 1,100 | 9,196 |
| | | 937,832 |
Land & Water Transportation 1.2% | | | |
Union Pacific Corp. | | 2,380 | 241,689 |
Mainframe & Minicomputers 1.3% | | | |
Apple, Inc. * | | 1,500 | 139,365 |
Cray, Inc. * | | 500 | 6,895 |
Omnicell, Inc. * | | 500 | 10,460 |
Sun Microsystems * | | 17,000 | 102,170 |
| | | 258,890 |
Metal Products & Machinery 2.0% | | | |
AGCO Corp. * | | 1,000 | 36,970 |
American Standard Cos., Inc. | | 1,200 | 63,624 |
Energizer Holdings, Inc. * | | 100 | 8,533 |
Key Technology, Inc. * | | 200 | 3,160 |
MFRI, Inc. * | | 200 | 3,708 |
Parker Hannifin Corp. | | 1,140 | 98,393 |
PG&E Corp. | | 1,750 | 84,473 |
Robbins & Myers, Inc. | | 300 | 11,187 |
Terex Corp. * | | 500 | 35,880 |
The Middleby Corp. * | | 160 | 21,094 |
| | | Number of | Value |
Security | | | Shares | ($) |
| | | | | |
Varian Semiconductor Equipment | | | | |
Associates, Inc. * | | | | 600 | 32,028 |
Zoltek Cos., Inc. * | | | | 400 | 13,972 |
| | | | | 413,022 |
Miscellaneous Finance 1.8% | | | | |
Chicago Mercantile Exchange | | | | |
Holdings, Inc., Class A | | | | 240 | 127,791 |
Cohen & Steers, Inc. | | | | 600 | 25,848 |
Diamond Hill Investment Group * | | | 200 | 19,502 |
International Assets Holding Corp. * | | 300 | 8,379 |
Merrill Lynch & Co., Inc. | | | | 2,200 | 179,674 |
U.S. Global Investors, Inc., Class A * | | 420 | 10,819 |
| | | | | 372,013 |
Oil & Coal Resources 0.4% | | | | | |
Equitable Resources, Inc. | | | | 200 | 9,664 |
XTO Energy, Inc. | | | | 1,200 | 65,772 |
| | | | | 75,436 |
Oil Distribution 0.2% | | | | | |
Holly Corp. | | | | 600 | 35,580 |
Oil Drilling & Services 1.4% | | | | | |
Dawson Geophysical Co. * | | | | 150 | 7,429 |
ENSCO International, Inc. | | | | 1,000 | 54,400 |
GlobalSantaFe Corp. | | | | 1,200 | 74,016 |
McDermott International, Inc. * | | | 700 | 34,286 |
Noble Corp. | | | | 70 | 5,508 |
Omni Energy Services Corp. * | | | 300 | 3,054 |
Transocean, Inc. * | | | | 1,400 | 114,380 |
| | | | | 293,073 |
Photo-optical, Micros & Office Machinery 0.6% | | |
Brocade Communications Systems, | | | |
Inc. * | | | | 3,000 | 28,560 |
EMC Corp. * | | | | 900 | 12,465 |
Hauppauge Digital, Inc. * | | | | 300 | 2,049 |
Interphase Corp. * | | | | 200 | 2,232 |
Lexmark International, Inc., Class A * | | 300 | 17,538 |
Pitney Bowes, Inc. | | | | 1,300 | 59,007 |
Stec, Inc. * | | | | 900 | 6,336 |
VASCO Data Security International, | | | |
Inc. * | | | | 280 | 5,004 |
| | | | | 133,191 |
Publishing, Broadcasting & Cinema 1.3% | | | |
CBS Corp., Class B | | | | 3,000 | 91,770 |
Gannett Co., Inc. | | | | 860 | 48,409 |
Lamar Advertising Co., Class A * | | | 500 | 31,485 |
News Corp., Class A | | | | 2,904 | 67,141 |
The Walt Disney Co. | | | | 600 | 20,658 |
Triple Crown Media, Inc. * | | | | 200 | 1,678 |
| | | | | 261,141 |
Real Estate Development 0.1% | | | | | |
AMREP Corp. * | | | | 200 | 15,450 |
Real Estate Investment Trusts 0.1% | | | | |
Public Storage, Inc. | | | | 200 | 18,934 |
Restaurants, Hotels & Theaters 0.5% | | | |
McDonald’s Corp. | | | | 2,500 | 112,625 |
See financial notes.
Laudus Funds Annual Report 105
Laudus Rosenberg Global Long/Short Equity Fund |
Portfolio Holdings continued | | |
| | |
| Number of | Value |
Security | Shares | ($) |
| | |
Retail 5.1% | | |
Abercrombie & Fitch Co., Class A | 1,204 | 91,119 |
American Eagle Outfitters, Inc. | 1,600 | 47,984 |
AutoZone, Inc. * | 1,000 | 128,140 |
Big Lots, Inc. * | 1,000 | 31,280 |
Charlotte Russe Holding, Inc. * | 500 | 14,435 |
Federated Department Stores, Inc. | 1,200 | 54,060 |
J.C. Penney Co., Inc. | 2,300 | 188,968 |
Kohl’s Corp. * | 1,100 | 84,271 |
Medco Health Solutions, Inc. * | 1,500 | 108,795 |
Nordstrom, Inc. | 2,667 | 141,191 |
OfficeMax, Inc. | 700 | 36,918 |
PC Mall, Inc. * | 300 | 2,991 |
Priceline.com, Inc. * | 500 | 26,630 |
PriceSmart, Inc. * | 500 | 7,680 |
Sears Holdings Corp. * | 300 | 54,048 |
Spartan Stores, Inc. | 400 | 10,720 |
The Bon-Ton Stores, Inc. | 300 | 16,872 |
| | 1,046,102 |
Software 5.3% | | |
Akamai Technologies, Inc. * | 900 | 44,928 |
Allscripts Healthcare Solutions, Inc. * | 800 | 21,448 |
BMC Software, Inc. * | 2,500 | 76,975 |
Cadence Design Systems, Inc. * | 1,800 | 37,908 |
Captaris, Inc. * | 400 | 2,316 |
Cognizant Technology Solutions | | |
Corp., Class A * | 1,500 | 132,405 |
Computer Sciences Corp. * | 1,000 | 52,130 |
Datalink Corp. * | 300 | 2,349 |
GSE Systems, Inc. * | 300 | 1,905 |
i2 Technologies, Inc. * | 500 | 12,000 |
Internap Network Services Corp. * | 600 | 9,450 |
International Business Machines | | |
Corp. | 2,280 | 214,913 |
Internet Gold-Golden Lines Ltd. * | 400 | 5,008 |
Interwoven, Inc. * | 700 | 11,830 |
Intuit, Inc. * | 4,100 | 112,176 |
McAfee, Inc. * | 1,200 | 34,896 |
Mentor Graphics Corp. * | 1,200 | 19,608 |
Microsoft Corp. | 2,200 | 61,314 |
NEON Communications Group, Inc. * | 600 | 2,814 |
Nuance Communications, Inc. * | 1,600 | 24,496 |
Oracle Corp. * | 9,670 | 175,317 |
Scientific Learning Corp. * | 300 | 2,292 |
Smith Micro Software, Inc. * | 500 | 9,315 |
Taleo Corp., Class A * | 400 | 6,632 |
THQ, Inc. * | 800 | 27,352 |
Versant Corp. * | 200 | 3,390 |
| | 1,105,167 |
Textiles & Apparel 0.5% | | |
Deckers Outdoor Corp. * | 300 | 21,306 |
G-III Apparel Group Ltd. * | 220 | 4,191 |
Guess?, Inc. | 800 | 32,392 |
Interface, Inc., Class A | 800 | 12,792 |
Maidenform Brands, Inc. * | 400 | 9,228 |
R.G. Barry Corp. * | 200 | 2,084 |
The Gymboree Corp. * | 500 | 20,035 |
| | 102,028 |
| Number of | Value |
Security | Shares | ($) |
| | |
Wholesale 0.2% | | |
En Pointe Technologies, Inc. * | 200 | 682 |
KSW, Inc. * | 100 | 640 |
TESSCO Technologies, Inc. * | 200 | 5,438 |
The Aristotle Corp. * | 300 | 3,036 |
W.W. Grainger, Inc. | 500 | 38,620 |
| | 48,416 |
| | 9,988,961 |
Total Common Stock (Cost $17,051,955) | | 19,874,593 |
| | |
| | |
Preferred Stock (a) 0.0% of net assets | |
| | |
United Kingdom 0.0% | | |
Commercial Aircraft & Components 0.0% | | |
Rolls-Royce Group plc * | 414,400 | 836 |
Total Preferred Stock (Cost $800) | | 836 |
| | |
| | |
Rights (a) 0.1% of net assets | | |
| | |
Japan 0.1% | | |
Basic Minerals & Metals 0.1% | | |
Dowa Mining * | 11,000 | 5,587 |
Total Rights (Cost $—) | | 5,587 |
| | |
| Face | |
Security | Amount | Value |
Rate, Maturity Date | ($) | ($) |
| | |
Short-Term Investment (a) 5.7% of net assets | |
| | |
Repurchase Agreement 5.7% | | |
Custodian Trust Company, dated | | |
03/30/07, due 04/02/07 at 5.10%, | | |
with a maturity value of $1,180,861 | | |
(fully collateralized by U.S. Treasury | | |
Bill with a value of $1,232,904) | 1,180,359 | 1,180,359 |
Total Short-Term Investment | | |
(Cost $1,180,359) | | 1,180,359 |
| | |
| | | |
End of Investments. | | |
| | |
At 03/31/07 the tax basis cost of the fund’s investments was |
$18,392,812, and the unrealized appreciation and depreciation |
were $2,920,437 and ($251,874), respectively, with a net unreal- |
ized appreciation of $2,668,563. | | |
| | |
At 03/31/07, the prices of certain foreign securities held by the |
fund aggregating ($48,235) were adjusted from their closing |
market prices following the guidelines adopted by the fund’s |
board of trustees. | | |
| | |
* Non-income producing security. | | |
| | |
(a) All long positions are pledged as collateral for securities sold |
short. | | |
106 Laudus Funds Annual Report
See financial notes.
Laudus Rosenberg Global Long/Short Equity Fund |
| | Amount of | | Amount of | Unrealized |
| Currency | Currency | Currency | Currency | Gains / |
Expiration | to be | to be | to be | to be | Losses |
Date | Received | Received | Delivered | Delivered | ($) |
| | | | | |
Forward Foreign Currency Contracts | | |
07/19/2007 | JPY | 182,027,000 | USD | 1,566,561 | 2,964 |
07/19/2007 | USD | 5,981,804 | JPY | 695,057,000 | (86,567) |
| | | | | (83,603) |
| | | | | | |
See financial notes.
Laudus Funds Annual Report 107
Laudus Rosenberg Global Long/Short Equity Fund |
Portfolio Holdings continued | | |
| | | | | |
| | | | Number of | Value |
Security | | | | Shares | ($) |
| | | | | |
Short Sales 95.5% of net assets | | |
| | | | | |
Austria 0.3% | | | | | |
Electric Utilities 0.1% | | | | | |
Oesterreichische | | | | | |
Elektrizitaetswirtschafts AG | | 600 | 26,952 |
Insurance 0.2% | | | | | |
UNIQA Versicherungen AG | | 900 | 30,047 |
| | | | | 56,999 |
Denmark 0.8% | | | | | |
Construction Materials 0.2% | | | | |
FLSmidth & Co. A/S | | | 600 | 40,540 |
Drugs & Pharmaceuticals 0.4% | | | |
Alk-Abello A/S | | | | 200 | 36,991 |
Genmab A/S * | | | | 800 | 48,855 |
| | | | | 85,846 |
Land & Water Transportation 0.2% | | | |
DSV A/S | | | | 200 | 34,864 |
| | | | | 161,250 |
Finland 0.9% | | | | | |
Chemicals & Rubber 0.1% | | | | |
Nokian Renkaat Oyj | | | 840 | 23,075 |
Construction & Homebuilding 0.4% | | | |
Kone Oyj | | | | 800 | 45,678 |
YIT Oyj | | | | 1,200 | 41,521 |
| | | | | 87,199 |
Land & Water Transportation 0.1% | | | |
Cargotec Corp. | | | | 388 | 23,462 |
Metal Products & Machinery 0.1% | | | |
Wartsila Oyj Abp, Class B | | 420 | 26,079 |
Retail 0.2% | | | | | |
Stockmann Oyj Abp, Share B | | 800 | 34,923 |
| | | | | 194,738 |
France 3.6% | | | | | |
Agriculture, Food & Beverage 0.3% | | | |
Groupe Danone | | | | 417 | 68,227 |
Chemicals & Rubber 0.3% | | | | |
Air Liquide S.A. | | | | 273 | 66,440 |
Construction & Homebuilding 0.4% | | | |
Technip S.A. | | | | 300 | 21,826 |
Vinci S.A. | | | | 400 | 62,374 |
| | | | | 84,200 |
Information & Services 0.2% | | | | |
Financiere Marc de Lacharriere S.A. | 430 | 39,712 |
Instruments 0.2% | | | | |
Neopost S.A. | | | | 300 | 42,980 |
Insurance 0.4% | | | | | |
April Group | | | | 600 | 31,373 |
Euler Hermes S.A. | | | 312 | 43,937 |
| | | | | 75,310 |
| | | Number of | Value |
Security | | | Shares | ($) |
| | | | |
IT Hardware 0.2% | | | | |
Silicon-On-Insulator Technologies | | |
(SOITEC) * | | | 1,400 | 33,523 |
Oil Drilling & Services 0.2% | | | |
Bourbon S.A. | | | 600 | 42,019 |
Retail 0.2% | | | | |
Casino Guichard Perrachon S.A. | 400 | 40,550 |
Soaps & Cosmetics 0.4% | | | |
L’Oreal S.A. | | | 703 | 76,785 |
Textiles & Apparel 0.2% | | | |
Hermes International | | | 370 | 51,166 |
Wholesale 0.6% | | | | |
Essilor International S.A. | | 600 | 69,019 |
Pinault-Printemps-Redoute S.A. | 300 | 48,164 |
| | | | 117,183 |
| | | | 738,095 |
Germany 3.0% | | | | |
Airlines 0.1% | | | | |
Fraport AG | | | 243 | 17,823 |
Banks & Credit Institutions 0.4% | | |
Hypo Real Estate Holding AG | 668 | 42,636 |
IKB Deutsche Industriebank AG | 880 | 35,158 |
| | | | 77,794 |
Consumer Durables 0.2% | | | |
Rational AG | | | 210 | 40,729 |
Forest Products & Paper 0.1% | | |
Pfleiderer AG | | | 800 | 23,242 |
Furniture & Household Items 0.2% | | |
Bijou Brigitte Modische Accessoires | | |
AG | | | 180 | 41,815 |
Insurance 0.1% | | | | |
MLP AG | | | 1,200 | 30,298 |
Land & Water Transportation 0.4% | | |
Deutsche Post AG | | | 2,500 | 75,472 |
Metal Products & Machinery 0.2% | | |
Solarworld AG | | | 400 | 30,996 |
Miscellaneous Finance 0.4% | | | |
Deutsche Boerse AG | | | 313 | 71,731 |
Software 0.6% | | | | |
SAP AG | | | 1,600 | 71,314 |
United Internet AG — Reg’d | | 3,000 | 58,596 |
| | | | 129,910 |
Wholesale 0.3% | | | | |
Celesio AG | | | 600 | 37,716 |
Fielmann AG | | | 510 | 31,417 |
| | | | 69,133 |
| | | | 608,943 |
108 Laudus Funds Annual Report
See financial notes.
Laudus Rosenberg Global Long/Short Equity Fund |
| | | | Number of | Value |
Security | | | | Shares | ($) |
| | | | | |
Italy 1.9% | | | | | |
Banks & Credit Institutions 0.8% | | | |
Banca Monte dei Paschi di Siena | | | |
S.p.A. | | | | 9,000 | 56,439 |
Credito Emiliano S.p.A. | | | | 3,000 | 47,302 |
Mediobanca S.p.A. | | | | 2,400 | 53,491 |
| | | | | 157,232 |
Construction & Homebuilding 0.4% | | | |
Saipem S.p.A. | | | | 2,580 | 75,460 |
Insurance 0.7% | | | | | |
Alleanza Assicurazioni S.p.A. | | 4,000 | 51,170 |
Assicurazioni Generali S.p.A. | | 1,600 | 68,147 |
Mediolanum S.p.A | | | | 4,000 | 32,452 |
| | | | | 151,769 |
| | | | | 384,461 |
Japan 24.0% | | | | | |
Agriculture, Food & Beverage 0.1% | | | |
Ezaki Glico Co., Ltd. | | | | 2,000 | 23,724 |
Banks & Credit Institutions 3.2% | | | |
Aeon Credit Service Co., Ltd. | | 1,900 | 31,853 |
Credit Saison Co., Ltd. | | | | 800 | 26,229 |
Mizuho Trust & Banking Co., Ltd. | 27,000 | 59,562 |
Suruga Bank Ltd. | | | | 5,000 | 64,890 |
The Bank of Fukuoka Ltd. (b) | | 7,000 | 56,492 |
The Bank Of Yokohama, Ltd. | | 15,000 | 111,507 |
The Chiba Bank Ltd. | | | | 13,000 | 114,256 |
The Musashino Bank Ltd. | | | 100 | 5,343 |
The Shizuoka Bank Ltd. | | | | 7,000 | 74,303 |
The Sumitomo Trust & Banking Co., | | |
Ltd. | | | | 9,000 | 93,373 |
The Hiroshima Bank Ltd. | | | | 3,000 | 16,494 |
| | | | | 654,302 |
Basic Minerals & Metals 0.3% | | | | |
Mitsubishi Materials Corp. | | | 11,000 | 52,033 |
Beer, Liquor, & Tobacco 0.1% | | | | |
Takara Holdings, Inc. | | | | 4,000 | 28,217 |
Chemicals & Rubber 0.8% | | | | | |
Nissan Chemical Industries Ltd. | | 5,000 | 64,251 |
Shin-Etsu Chemical Co., Ltd. | | 1,500 | 91,265 |
| | | | | 155,516 |
Communications Utilities 0.5% | | | |
Softbank Corp. * | | | | 3,700 | 94,766 |
Construction & Homebuilding 2.3% | | | |
Chiyoda Corp. | | | | 4,000 | 87,369 |
JGC Corp. | | | | 5,000 | 81,794 |
Kajima Corp. | | | | 18,000 | 91,524 |
Nippon Sheet Glass Co., Ltd. | | 7,000 | 36,620 |
Obayashi Corp. | | | | 12,000 | 77,124 |
Shimizu Corp. | | | | 14,000 | 85,574 |
Taisei Corp. | | | | 5,000 | 18,470 |
| | | | | 478,475 |
Construction Materials 0.5% | | | | |
Ibiden Co., Ltd. | | | | 2,100 | 108,451 |
| | | Number of | Value |
Security | | | Shares | ($) |
| | | | |
Consumer Durables 1.1% | | | | |
Daikin Industries Ltd. | | | 3,700 | 128,355 |
Funai Electric Co., Ltd. | | 300 | 28,525 |
Sony Corp. | | | 1,600 | 80,863 |
| | | | 237,743 |
Drugs & Pharmaceuticals 0.3% | | |
Chugai Pharmaceutical Co., Ltd. | | 2,600 | 65,629 |
Financial Investments 0.6% | | | |
Mitsubishi UFJ Lease & Finance Co., | | |
Ltd. | | | 230 | 11,472 |
ORIX Corp. | | | 290 | 75,245 |
Square Enix Co., Ltd. | | | 1,100 | 28,263 |
| | | | 114,980 |
Forest Products & Paper 0.2% | | |
Uni-Charm Corp. | | | 800 | 50,503 |
Gas & Other Public Utilities 0.1% | | |
Toho Gas Co., Ltd. | | | 6,000 | 30,810 |
Information & Services 0.2% | | | |
Meitec Corp. | | | 200 | 6,443 |
Park24 Co., Ltd. | | | 2,600 | 34,877 |
| | | | 41,320 |
Instruments 0.8% | | | | |
Terumo Corp. | | | 2,800 | 108,711 |
Yokogawa Electric Corp. | | 4,300 | 65,661 |
| | | | 174,372 |
IT Hardware 3.9% | | | | |
Advantest Corp. | | | 1,600 | 70,885 |
Fanuc Ltd. | | | 1,100 | 101,921 |
Hirose Electric Co., Ltd. | | 400 | 47,886 |
Hoya Corp. | | | 2,400 | 79,290 |
Keyence Corp. | | | 450 | 101,248 |
Murata Manufacturing Co., Ltd. | | 1,400 | 101,677 |
Nidec Corp. | | | 1,200 | 77,015 |
Nidec Sankyo Corp. | | | 3,000 | 23,549 |
Sharp Corp. | | | 5,000 | 96,148 |
Tokyo Electron Ltd. | | | 1,400 | 97,514 |
| | | | 797,133 |
Land & Water Transportation 1.9% | | | |
Central Japan Railway Co. | | 6 | 68,125 |
Kintetsu Corp. | | | 19,000 | 59,740 |
Mitsui O.S.K. Lines Ltd. | | 9,000 | 99,651 |
Odakyu Electric Railway Co., Ltd. | 12,000 | 87,594 |
Yamato Holdings Co., Ltd. | | 5,000 | 80,459 |
| | | | 395,569 |
Mainframe & Minicomputers 0.4% | | | |
Casio Computer Co., Ltd. | | 4,100 | 89,368 |
Metal Products & Machinery 1.5% | | | |
Komatsu Ltd. | | | 4,500 | 94,244 |
Mitsubishi Electric Corp. | | 11,000 | 113,021 |
The Japan Steel Works Ltd. | | 3,000 | 35,936 |
Yaskawa Electric Corp. | | 5,000 | 58,967 |
| | | | 302,168 |
Oil Distribution 0.0% | | | |
Showa Shell Sekiyu K.K | | 600 | 7,329 |
See financial notes.
Laudus Funds Annual Report 109
Laudus Rosenberg Global Long/Short Equity Fund |
Portfolio Holdings continued | | | | |
| | | | | | |
| | | | Number of | Value |
Security | | | | Shares | ($) |
| | | | | | |
Photo-optical, Micros & Office Machinery 0.4% | | |
Canon, Inc. | | | | 1,500 | 80,541 |
Real Estate Development 0.5% | | | | |
Mitsubishi Estate Co., Ltd. | | | 3,000 | 98,112 |
Retail 1.3% | | | | | | |
Aeon Co., Ltd. | | | | 5,900 | 117,004 |
Don Quijote Co., Ltd. | | | | 4,200 | 81,896 |
Hikari Tsushin, Inc. | | | | 1,300 | 59,013 |
Izumi Co., Ltd. | | | | | 100 | 1,852 |
| | | | | | 259,765 |
Software 1.6% | | | | | | |
Konami Corp. | | | | 2,600 | 69,356 |
NTT Data Corp. | | | | | 23 | 116,457 |
Oracle Corp. | | | | 1,000 | 47,961 |
Otsuka Corp. | | | | | 400 | 38,225 |
Trend Micro, Inc. | | | | 2,500 | 68,091 |
| | | | | | 340,090 |
Trading Company 1.4% | | | | | |
Itochu Corp. | | | | 10,000 | 98,761 |
Mitsui & Co., Ltd. | | | | 4,000 | 75,279 |
Sumitomo Corp. | | | | 6,300 | 112,891 |
| | | | | | 286,931 |
| | | | | | 4,967,847 |
Netherlands 1.2% | | | | | | |
Agriculture, Food & Beverage 0.2% | | | | |
Royal Numico N.V. | | | | | 900 | 46,421 |
Information & Services 0.2% | | | | | | |
Fugro N.V. CVA | | | | | 600 | 30,469 |
Land & Water Transportation 0.2% | | | | |
Koninklijke Vopak N.V. | | | | | 660 | 37,387 |
Metal Products & Machinery 0.2% | | | | |
Aalberts Industries N.V. | | | | | 400 | 39,672 |
Oil Drilling & Services 0.0% | | | | | |
Schlumberger Ltd. | | | | | 130 | 8,983 |
Publishing, Broadcasting & Cinema .2% | | | |
Reed Elsevier N.V. | | | | 2,700 | 47,825 |
Real Estate Development 0.2% | | | | |
Rodamco Europe N.V. | | | | | 284 | 39,608 |
| | | | | | 250,365 |
Norway 1.1% | | | | | | |
Information & Services 0.2% | | | | | | |
Acergy S.A. * | | | | 2,000 | 42,328 |
Insurance 0.3% | | | | | | |
Storebrand A.S.A. | | | | 4,000 | 63,702 |
Oil Drilling & Services 0.3% | | | | | |
Seadrill Ltd. * | | | | 4,000 | 64,311 |
Publishing, Broadcasting & Cinema 0.3% | | | |
Schibsted A.S.A. | | | | 1,200 | 52,662 |
| | | | | | 223,003 |
Spain 1.5% | | | | | | |
Agriculture, Food & Beverage 0.1% | | | | |
Sos Cuetara S.A. | | | | 1,500 | 29,465 |
| | | | | | | |
| | | Number of | Value |
Security | | | Shares | ($) |
| | | | | |
Banks & Credit Institutions 0.3% | | | | |
Banco Espanol de Crecito S.A. | | | | |
(Banesto) | | | 2,800 | 67,165 |
Construction & Homebuilding 0.2% | | | | |
Acciona S.A. | | | | 160 | 34,782 |
Drugs & Pharmaceuticals 0.2% | | | | |
FAES FARMA S.A. | | | 1,600 | 40,817 |
Land & Water Transportation 0.2% | | | | |
Cintra Concesiones de | | | | | |
Infraestructuras de Transporte S.A. | 2,000 | 37,588 |
Metal Products & Machinery 0.3% | | | | |
Gamesa Corp. Tecnologica S.A. | | 1,800 | 65,544 |
Real Estate Development 0.2% | | | | |
Grupo Inmocaral S.A. * | | | 6,000 | 41,677 |
| | | | | 317,038 |
Sweden 1.1% | | | | | |
Metal Products & Machinery 0.4% | | | | |
Atlas Copco AB | | | 1,800 | 59,835 |
Sandvik AB | | | 1,400 | 24,933 |
| | | | | 84,768 |
Miscellaneous Finance 0.4% | | | | |
OMX AB | | | 1,600 | 33,343 |
Skandinaviska Enskilda Banken AB, | | | |
(SEB) Series A | | | 1,600 | 51,246 |
| | | | | 84,589 |
Publishing, Broadcasting & Cinema 0.3% | | | |
Modern Times Group AB, Class B * | 1,000 | 58,398 |
| | | | | 227,755 |
Switzerland 2.0% | | | | | |
Banks & Credit Institutions 0.2% | | | | |
Vontobel Holding AG | | | | 600 | 30,867 |
Drugs & Pharmaceuticals 0.2% | | | | |
Actelion Ltd. — Reg’d * | | | | 200 | 46,613 |
Information & Services 0.2% | | | | | |
SGS S.A. — Reg’d | | | | 40 | 47,884 |
Instruments 1.0% | | | | | |
Nobel Biocare Holding AG | | | | 180 | 65,656 |
Phonak Holding AG | | | | 600 | 46,066 |
Straumann Holding AG | | | | 140 | 40,150 |
Synthes, Inc. | | | | 400 | 49,527 |
| | | | | 201,399 |
Land & Water Transportation 0.2% | | | | |
Kuehne & Nagel International AG — | | | |
Reg’d | | | | 506 | 41,572 |
Photo-optical, Micros & Office Machinery 0.2% | | | |
Logitech International S.A. * | | 1,400 | 39,036 |
| | | | | 407,371 |
United Kingdom 6.6% | | | | | |
Agriculture, Food & Beverage 0.5% | | | | |
Cadbury Schweppes plc | | | 5,400 | 69,405 |
Premier Foods plc | | | 4,500 | 25,841 |
| | | | | 95,246 |
| | | | | | |
110 Laudus Funds Annual Report
See financial notes.
Laudus Rosenberg Global Long/Short Equity Fund |
| | | Number of | Value |
Security | | | Shares | ($) |
| | | | |
Autos 0.1% | | | | |
Tomkins plc | | | 4,200 | 22,053 |
Banks & Credit Institutions 0.6% | | |
Alliance & Leicester plc | | | 2,000 | 44,587 |
Northern Rock plc | | | 2,400 | 54,252 |
Standard Chartered plc | | | 1,027 | 29,668 |
| | | | 128,507 |
Construction & Homebuilding 0.7% | | | |
Barratt Developments plc | | | 670 | 14,551 |
Bellway plc | | | 975 | 30,545 |
Bovis Homes Group plc | | | 1,000 | 22,696 |
Persimmon plc | | | 1,600 | 44,316 |
Redrow plc | | | 2,025 | 25,981 |
| | | | 138,089 |
Electric Utilities 0.5% | | | | |
Drax Group plc | | | 2,240 | 34,656 |
National Grid plc | | | 4,200 | 66,279 |
| | | | 100,935 |
Financial Investments 0.1% | | | | |
Burberry Group plc | | | 2,400 | 30,852 |
Forest Products & Paper 0.2% | | | | |
Bunzl plc | | | 2,666 | 37,779 |
Information & Services 1.4% | | | | |
Hays | | | 12,000 | 36,985 |
Homeserve plc | | | 600 | 21,054 |
Intertek Group plc | | | 2,100 | 37,502 |
Michael Page International plc | | 3,000 | 31,658 |
Regus Group plc * | | | 15,000 | 43,827 |
Rentokil Initial plc | | | 9,000 | 28,946 |
Reuters Group plc | | | 5,365 | 49,302 |
Serco Group plc | | | 3,634 | 32,871 |
| | | | 282,145 |
Instruments 0.0% | | | | |
Smith & Nephew plc | | | 180 | 2,291 |
IT Hardware 0.2% | | | | |
ARM Holdings plc | | | 15,000 | 39,536 |
Land & Water Transportation 0.4% | | | |
Forth Ports plc | | | 300 | 12,242 |
Go-Ahead Group plc | | | 600 | 30,110 |
Stagecoach Group plc | | | 9,000 | 31,830 |
| | | | 74,182 |
Metal Products & Machinery 0.2% | | |
Rexam plc | | | 3,000 | 32,535 |
Oil & Coal Resources 0.8% | | | | |
BG Group plc | | | 4,970 | 71,693 |
Burren Energy plc | | | 1,400 | 21,971 |
Cairn Energy plc * | | | 975 | 29,886 |
Cairn Energy plc, Shares B * | | 1,200 | 7,084 |
Sibir Energy plc * | | | 2,200 | 20,448 |
Soco International plc * | | | 800 | 24,568 |
| | | | 175,650 |
Oil Drilling & Services 0.0% | | | | |
Petrofac Ltd. | | | 1,000 | 8,684 |
| | Number of | Value |
Security | | Shares | ($) |
| | | |
Publishing, Broadcasting & Cinema 0.4% | | |
Pearson plc | | 3,059 | 52,629 |
United Business Media plc | 2,200 | 34,335 |
| | | 86,964 |
Restaurants, Hotels & Theaters 0.3% | | |
InterContinental Hotels Group plc | 1,400 | 34,610 |
Ladbrokes plc | | 3,553 | 28,259 |
| | | 62,869 |
Wholesale 0.2% | | | |
Electrocomponents plc | | 4,000 | 22,722 |
Premier Farnell plc | | 5,400 | 21,726 |
| | | 44,448 |
| | | 1,362,765 |
United States 47.5% | | | |
Agriculture, Food & Beverage 1.4% | | |
Cuisine Solutions, Inc. * | | 300 | 2,166 |
The Coca-Cola Co. | | 500 | 24,000 |
The Hershey Co. | | 1,200 | 65,592 |
Wm. Wrigley Jr. Co. | | 3,875 | 197,354 |
| | | 289,112 |
Airlines 0.3% | | | |
Southwest Airlines Co. | | 4,300 | 63,210 |
Autos 0.9% | | | |
Ford Motor Co. | | 18,900 | 149,121 |
Oshkosh Truck Corp. | | 300 | 15,900 |
Tenneco, Inc. * | | 700 | 17,822 |
| | | 182,843 |
Banks & Credit Institutions 1.7% | | |
American Express Co. | | 1,500 | 84,600 |
Commerce Bancorp, Inc. | | 1,300 | 43,394 |
Fifth Third Bancorp | | 2,400 | 92,856 |
Sovereign Bancorp, Inc. | | 2,500 | 63,600 |
Washington Mutual, Inc. | | 1,764 | 71,230 |
| | | 355,680 |
Basic Minerals & Metals 0.4% | | | |
Dynamic Materials Corp. * | | 300 | 9,816 |
Meridian Gold, Inc. * | | 1,000 | 25,530 |
Newmont Mining Corp. | | 1,000 | 41,990 |
| | | 77,336 |
Beer, Liquor, & Tobacco 0.2% | | | |
Brown-Forman Corp., Class B | 700 | 45,892 |
Biotechnology 2.0% | | | |
Alexion Pharmaceuticals, Inc. * | 500 | 21,620 |
Altus Pharmaceuticals, Inc. * | 300 | 4,566 |
Amgen, Inc. * | | 2,700 | 150,876 |
CV Therapeutics, Inc. * | | 900 | 7,083 |
Encysive Pharmaceuticals, Inc. * | 900 | 2,439 |
Gen-Probe, Inc. * | | 600 | 28,248 |
Genentech, Inc. * | | 1,900 | 156,028 |
Keryx Biopharmaceuticals, Inc. * | 700 | 7,364 |
Vertex Pharmaceuticals, Inc. * | 1,178 | 33,031 |
| | | 411,255 |
Chemicals & Rubber 0.2% | | |
ADA-ES, Inc. * | | 200 | 2,750 |
American Vanguard Corp. | | 500 | 8,545 |
See financial notes.
Laudus Funds Annual Report 111
Laudus Rosenberg Global Long/Short Equity Fund |
Portfolio Holdings continued | | | |
| | | |
| | Number of | Value |
Security | | Shares | ($) |
| | | |
BioSphere Medical, Inc. * | | 300 | 2,208 |
Hexcel Corp. * | | 1,100 | 21,835 |
NewMarket Corp. | | 300 | 12,201 |
The Dow Chemical Co. | | 60 | 2,752 |
| | | 50,291 |
Communications Utilities 1.9% | | | |
A.D.A.M., Inc. * | | 200 | 1,272 |
Sohu.com, Inc. * | | 500 | 10,715 |
Yahoo! Inc. * | | 12,000 | 375,480 |
| | | 387,467 |
Construction & Homebuilding 1.1% | | |
D.R. Horton, Inc. | | 1,980 | 43,560 |
Fluor Corp. | | 200 | 17,944 |
Jacobs Engineering Group, Inc. * | 800 | 37,320 |
Lennar Corp., Class A | | 1,400 | 59,094 |
Pike Electric Corp. * | | 600 | 10,848 |
Pulte Homes, Inc. | | 2,120 | 56,095 |
| | | 224,861 |
Consumer Durables 0.3% | | | |
Fleetwood Enterprises, Inc. * | 1,100 | 8,701 |
Harman International Industries, Inc. | 500 | 48,040 |
| | | 56,741 |
Drugs & Pharmaceuticals 1.4% | | | |
Abbott Laboratories | | 1,400 | 78,120 |
Alkermes, Inc. * | | 1,200 | 18,528 |
Allergan, Inc. | | 100 | 11,082 |
Amylin Pharmaceuticals, Inc. * | 300 | 11,208 |
Barr Pharmaceuticals, Inc. * | | 700 | 32,445 |
Barrier Therapeutics, Inc. * | | 400 | 2,760 |
Cerus Corp. * | | 500 | 3,375 |
DUSA Pharmaceuticals, Inc. * | 400 | 1,432 |
Enzon Pharmaceuticals, Inc. * | 700 | 5,705 |
Forest Laboratories, Inc. * | | 1,700 | 87,448 |
Lannett Co., Inc. * | | 500 | 2,575 |
Metabasis Therapeutics, Inc. * | 100 | 735 |
Neurogen Corp. * | | 600 | 3,900 |
NPS Pharmaceuticals, Inc. * | 700 | 2,373 |
Rigel Pharmaceuticals, Inc. * | 400 | 4,344 |
ZymoGenetics, Inc. * | | 800 | 12,448 |
| | | 278,478 |
Electric Utilities 1.3% | | | |
Dominion Resources, Inc. | | 740 | 65,690 |
Duke Energy Corp. | | 5,600 | 113,624 |
TXU Corp. | | 1,500 | 96,150 |
| | | 275,464 |
Financial Investments 0.1% | | | |
Williams Scotsman International,Inc. * | | 700 | 13,762 |
Winmark Corp. * | | 195 | 3,900 |
| | | 17,662 |
Forest Products & Paper 0.6% | | | |
3M Co. | | 1,400 | 107,002 |
Caraustar Industries, Inc. * | | 500 | 3,140 |
Deltic Timber Corp. | | 200 | 9,592 |
| | | 119,734 |
| | | | Number of | Value |
Security | | | | Shares | ($) |
| | | | | |
Furniture & Household Items 1.3% | | | |
Cooper Industries Ltd., Class A | | | 700 | 31,493 |
HNI Corp. | | | | 400 | 18,372 |
Newell Rubbermaid, Inc. | | | | 1,746 | 54,283 |
Omnova Solutions, Inc. * | | | | 700 | 3,822 |
The Procter & Gamble Co. | | | 2,450 | 154,742 |
| | | | | 262,712 |
Gas & Other Public Utilities 0.2% | | | |
Casella Waste Systems, Inc., | | | | |
Class A * | | | | 500 | 4,880 |
Republic Services, Inc. | | | | 1,200 | 33,384 |
| | | | | 38,264 |
Government Aircraft & Defense 0.5% | | | |
GenCorp, Inc. * | | | | 900 | 12,456 |
LaBarge, Inc. * | | | | 250 | 3,250 |
Textron, Inc. | | | | 700 | 62,860 |
The Allied Defense Group, Inc. * | | 300 | 2,565 |
United Industrial Corp. | | | | 200 | 11,040 |
| | | | | 92,171 |
Health Care & Hospital 0.6% | | | | | |
Coventry Health Care, Inc. * | | | 900 | 50,445 |
DaVita, Inc. * | | | | 100 | 5,332 |
Quest Diagnostics, Inc. | | | | 1,200 | 59,844 |
Tenet Healthcare Corp. * | | | | 1,300 | 8,359 |
VistaCare, Inc., Class A * | | | | 300 | 2,610 |
| | | | | 126,590 |
Information & Services 1.0% | | | | | |
Administaff, Inc. | | | | 500 | 17,600 |
Arena Pharmaceuticals, Inc. * | | | 800 | 8,688 |
BearingPoint, Inc. * | | | | 2,400 | 18,384 |
deCODE genetics, Inc. * | | | | 900 | 3,285 |
Devcon International Corp. * | | | 200 | 980 |
Euronet Worldwide, Inc. * | | | 600 | 16,116 |
Exelixis, Inc. * | | | | 1,500 | 14,910 |
Global Cash Access Holdings, Inc. * | 1,200 | 20,028 |
Michael Baker Corp. * | | | | 100 | 2,430 |
Paychex, Inc. | | | | 1,800 | 68,166 |
The Corporate Executive Board Co. | 400 | 30,384 |
Universal Technical Institute, Inc. * | | 500 | 11,540 |
| | | | | 212,511 |
Instruments 1.3% | | | | | |
AngioDynamics, Inc. * | | | | 300 | 5,067 |
Boston Scientific Corp. * | | | | 600 | 8,724 |
Daxor Corp. * | | | | 200 | 2,650 |
Ixia * | | | | 1,100 | 10,230 |
Measurement Specialties, Inc. * | | 400 | 9,024 |
Medtronic, Inc. | | | | 1,500 | 73,590 |
OraSure Technologies, Inc. * | | | 700 | 5,145 |
Quidel Corp. * | | | | 400 | 4,800 |
Regeneration Technologies, Inc. * | | 400 | 2,900 |
Somanetics Corp. * | | | | 358 | 7,138 |
St. Jude Medical, Inc. * | | | | 3,400 | 127,874 |
Tektronix, Inc. | | | | 300 | 8,448 |
Varian Medical Systems, Inc. * | | | 210 | 10,015 |
| | | | | 275,605 |
112 Laudus Funds Annual Report
See financial notes.
Laudus Rosenberg Global Long/Short Equity Fund |
| | | Number of | Value |
Security | | | Shares | ($) |
| | | | |
Insurance 0.6% | | | | |
Brown & Brown, Inc. | | | 1,300 | 35,165 |
The Progressive Corp. | | | 4,070 | 88,807 |
| | | | 123,972 |
Integrated Oil Companies 0.1% | | | |
ConocoPhillips | | | 400 | 27,340 |
IT Hardware 6.5% | | | | |
Advanced Micro Devices, Inc. * | | 2,600 | 33,956 |
Altera Corp. * | | | 3,300 | 65,967 |
Broadcom Corp., Class A * | | | 4,100 | 131,487 |
Comverse Technology, Inc. * | | 1,500 | 32,025 |
HI/FN, Inc. * | | | 300 | 1,821 |
Intel Corp. | | | 19,760 | 378,009 |
Intervoice, Inc. * | | | 500 | 3,320 |
Kulicke and Soffa Industries, Inc. * | 1,000 | 9,250 |
Linear Technology Corp. | | | 4,700 | 148,473 |
Maxim Integrated Products, Inc. | | 4,000 | 117,600 |
Microchip Technology, Inc. | | | 120 | 4,263 |
Microsemi Corp. * | | | 1,000 | 20,810 |
National Semiconductor Corp. | | 2,000 | 48,280 |
Power-One, Inc. * | | | 1,300 | 7,436 |
Powerwave Technologies, Inc. * | 100 | 569 |
QUALCOMM, Inc. | | | 7,400 | 315,684 |
Rackable Systems, Inc. * | | | 500 | 8,485 |
Texas Instruments, Inc. | | | 600 | 18,060 |
Video Display Corp. * | | | 300 | 2,397 |
Virage Logic Corp. * | | | 400 | 2,908 |
| | | | 1,350,800 |
Land & Water Transportation 1.8% | | | |
C.H. Robinson Worldwide, Inc. | | 900 | 42,975 |
Heartland Express, Inc. | | | 1,400 | 22,232 |
Landstar Systems, Inc. | | | 200 | 9,168 |
Sirva, Inc. * | | | 1,100 | 3,927 |
United Parcel Service, Inc., Class B | 4,250 | 297,925 |
| | | | 376,227 |
Mainframe & Minicomputers 1.5% | | | |
Dell, Inc. * | | | 13,400 | 311,014 |
Metal Products & Machinery 1.2% | | | |
Actuant Corp., Class A | | | 400 | 20,324 |
Blount International, Inc. * | | | 100 | 1,245 |
Dover Corp. | | | 500 | 24,405 |
ITT Corp. | | | 1,000 | 60,320 |
Joy Global, Inc. | | | 800 | 34,320 |
Rockwell Automation, Inc. | | | 1,000 | 59,870 |
Shiloh Industries, Inc. * | | | 300 | 3,384 |
Zebra Technologies Corp., Class A * | 900 | 34,749 |
| | | | 238,617 |
Miscellaneous Finance 1.5% | | | | |
E*TRADE Financial Corp. * | | | 6,500 | 137,930 |
First Albany Cos., Inc. * | | | 300 | 480 |
GAMCO Investors, Inc., Class A | 200 | 8,666 |
Legg Mason, Inc. | | | 1,400 | 131,894 |
Nasdaq Stock Market, Inc. * | | | 1,000 | 29,410 |
| | | | 308,380 |
Oil & Coal Resources 1.3% | | | |
Clayton Williams Energy, Inc. * | | 300 | 8,511 |
Energy Partners, Ltd. * | | | 500 | 9,075 |
EOG Resources, Inc. | | | 410 | 29,250 |
| | | Number of | Value |
Security | | | Shares | ($) |
| | | | | |
Foundation Coal Holdings, Inc. | | | 200 | 6,868 |
Massey Energy Co. | | | 1,100 | 26,389 |
Plains Exploration & Production Co. * | | 700 | 31,598 |
Southwestern Energy Co. * | | 1,200 | 49,176 |
Ultra Petroleum Corp. * | | | 2,140 | 113,698 |
| | | | | 274,565 |
Oil Distribution 0.1% | | | | | |
Cheniere Energy, Inc. * | | | | 800 | 24,920 |
Oil Drilling & Services 0.0% | | | | | |
TGC Industries, Inc. * | | | | 300 | 2,583 |
Photo-optical, Micros & Office Machinery 0.5% | | | |
Eastman Kodak Co. | | | 1,470 | 33,163 |
Intermec, Inc. * | | | 1,000 | 22,340 |
SanDisk Corp. * | | | 1,200 | 52,560 |
| | | | | 108,063 |
Publishing, Broadcasting & Cinema 0.6% | | | |
John Wiley & Sons, Inc., Class A | | | 700 | 26,432 |
Outdoor Channel Holdings, Inc. * | | | 500 | 5,110 |
Sun-Times Media Group, Inc., Class A | 1,200 | 5,952 |
The Interpublic Group of Cos., Inc. * | 1,200 | 14,772 |
Viacom, Inc., Class B * | | | 1,200 | 49,332 |
XM Satellite Radio Holdings, Inc.,Class A * | 1,900 | 24,548 |
| | | | | 126,146 |
Real Estate Investment Trusts 1.6% | | | | |
Boston Properties, Inc. | | | | 700 | 82,180 |
Equity Residential | | | 2,900 | 139,867 |
Plum Creek Timber Co., Inc. | | 2,000 | 78,840 |
Regency Centers Corp. | | | | 325 | 27,154 |
| | | | | 328,041 |
Restaurants, Hotels & Theaters 0.7% | | | |
Boyd Gaming Corp. | | | | 700 | 33,348 |
Darden Restaurants, Inc. | | | 100 | 4,119 |
Isle of Capri Casinos, Inc. * | | | 500 | 12,810 |
Maui Land & Pineapple Co, Inc. * | | | 200 | 7,230 |
Max & Erma’s Restaurants, Inc. * | | | 200 | 1,800 |
MoneyGram International, Inc. | | | 980 | 27,205 |
Nevada Gold & Casinos, Inc. * | | | 400 | 804 |
Pinnacle Entertainment, Inc. * | | | 600 | 17,442 |
Scientific Games, Class A * | | | 700 | 22,981 |
Texas Roadhouse, Inc., Class A * | | 1,000 | 14,250 |
| | | | | 141,989 |
| | | | | | |
Retail 4.6% | | | | | |
Amazon.com, Inc. * | | | 4,200 | 167,118 |
Barnes & Noble, Inc. | | | | 700 | 27,615 |
Bed, Bath & Beyond, Inc. * | | 1,400 | 56,238 |
Coldwater Creek, Inc. * | | | 1,100 | 22,308 |
eBay, Inc. * | | | 10,500 | 348,075 |
Fastenal Co. | | | 1,000 | 35,050 |
Gaiam, Inc., Class A * | | | | 100 | 1,574 |
Office Depot, Inc. * | | | | 900 | 31,626 |
PetMed Express, Inc. * | | | | 400 | 4,740 |
Shoe Pavilion, Inc. * | | | | 300 | 1,860 |
The Gap, Inc. | | | 4,000 | 68,840 |
The Home Depot, Inc. | | | 2,410 | 88,543 |
The Pantry, Inc. * | | | | 400 | 18,088 |
Tiffany & Co. | | | | 140 | 6,367 |
See financial notes.
Laudus Funds Annual Report 113
Laudus Rosenberg Global Long/Short Equity Fund |
Portfolio Holdings continued | | |
| | |
| Number of | Value |
Security | Shares | ($) |
| | |
Walgreen Co. | 1,600 | 73,424 |
Whole Foods Market, Inc. | 90 | 4,037 |
| | 955,503 |
Soaps & Cosmetics 0.4% | | |
Johnson & Johnson | 1,500 | 90,390 |
Software 4.8% | | |
Adept Technology, Inc. * | 200 | 1,550 |
Adobe Systems, Inc. * | 3,100 | 129,270 |
Aptimus, Inc. * | 200 | 680 |
Autobytel, Inc. * | 700 | 2,478 |
Autodesk, Inc. * | 2,600 | 97,760 |
Automatic Data Processing, Inc. | 1,200 | 58,080 |
CACI International, Inc., Class A * | 500 | 23,430 |
Citrix Systems, Inc. * | 200 | 6,406 |
Concur Technologies, Inc. * | 600 | 10,476 |
Electronic Arts, Inc. * | 2,900 | 146,044 |
First Data Corp. | 4,100 | 110,290 |
Innotrac Corp. * | 300 | 807 |
Lionbridge Technologies, Inc. * | 1,000 | 5,090 |
Logility, Inc. * | 100 | 814 |
Mediware Information Systems * | 300 | 2,718 |
Microsoft Corp. | 9,600 | 267,552 |
MSC.Software Corp. * | 700 | 9,625 |
National Instruments Corp. | 1,000 | 26,230 |
NAVTEQ Corp. * | 900 | 31,050 |
PLATO Learning, Inc. * | 100 | 420 |
Q-Med, Inc. * | 410 | 1,816 |
| | Number of | Value |
Security | | Shares | ($) |
| | | |
Radiant Systems, Inc. * | 500 | 6,515 |
Red Hat, Inc. * | | 480 | 11,007 |
Verisign, Inc. * | | 1,600 | 40,192 |
Websense Inc * | | 200 | 4,598 |
| | | 994,898 |
Textiles & Apparel 0.4% | | | |
Cintas Corp. | | 1,000 | 36,100 |
K-Swiss, Inc., Class A | 600 | 16,212 |
The Timberland Co., Class A * | 800 | 20,824 |
| | | 73,136 |
Wholesale 0.6% | | | |
Brightpoint, Inc. * | | 380 | 4,347 |
Express Scripts, Inc. * | 900 | 72,648 |
H&E Equipment Services, Inc. * | 500 | 10,750 |
Pomeroy IT Solutions, Inc. * | 100 | 902 |
WESCO International, Inc. * | 500 | 31,390 |
| | | 120,037 |
| | | 9,820,500 |
Total Short Sales | | | |
(Proceeds $18,939,163) | | 19,721,130 |
End of short sale positions. | | |
* Non-income producing security. | | |
(b) Fair-valued by Management. | | |
114 Laudus Funds Annual Report
See financial notes.
Laudus Rosenberg Value Long/Short Equity Fund |
Portfolio Holdings as of March 31, 2007 | |
| | | |
| | Cost/Proceeds | Value |
Holdings by Category | | ($) | ($) |
| | | |
93.0% Common Stock | | 247,794,675 | 302,181,168 |
5.6% Short-Term Investment | 18,114,959 | 18,114,959 |
98.6% Total Investments | | 265,909,634 | 320,296,127 |
(93.5)% Short Sales | | (305,578,183) | (303,890,759) |
93.3% Deposits with broker | | | |
and custodian bank for | | |
securities sold short | | 303,267,401 | 303,267,401 |
1.6% Other Assets and | | | |
Liabilities | | | 5,322,345 |
100.0% Net Assets | | | 324,995,114 |
| | | |
| | Number of | Value |
Security | | Shares | ($) |
| | | |
Common Stock (a) 93.0% of net assets | |
| | | |
Agriculture, Food & Beverage 1.6% | | |
Corn Products International, Inc. | | 33,730 | 1,200,451 |
Flowers Foods, Inc. | | 2,745 | 82,817 |
J & J Snack Foods Corp. | | 4,390 | 173,361 |
Monterey Gourmet Foods, Inc. * | | 12,820 | 54,870 |
National Beverage Corp. * | | 5,840 | 102,433 |
Omega Protein Corp. * | | 12,520 | 87,390 |
Penford Corp. | | 2,796 | 56,311 |
Ralcorp Holdings, Inc. * | | 23,140 | 1,487,902 |
Seaboard Corp. | | 400 | 904,000 |
Seneca Foods Corp., Class B * | | 3,200 | 89,792 |
Tasty Baking Co. | | 8,210 | 71,673 |
The Pepsi Bottling Group, Inc. | | 16,480 | 525,547 |
The Topps Co., Inc. | | 34,942 | 339,636 |
| | | 5,176,183 |
Airlines 1.0% | | | |
ABX Air, Inc. * | | 1,250 | 8,562 |
Air Methods Corp. * | | 840 | 20,177 |
AirNet Systems, Inc. * | | 2,060 | 6,613 |
Alaska Air Group, Inc. * | | 36,170 | 1,378,077 |
Mesa Air Group, Inc. * | | 35,200 | 265,056 |
Republic Airways Holdings, Inc. * | 13,700 | 314,552 |
SkyWest, Inc. | | 49,547 | 1,329,346 |
| | | 3,322,383 |
Autos 0.5% | | | |
Aftermarket Technology Corp. * | | 19,792 | 480,550 |
Autoliv, Inc. | | 18,140 | 1,035,975 |
Noble International, Ltd. | | 626 | 10,504 |
Spartan Motors, Inc. | | 7,173 | 166,485 |
Supreme Industries, Inc., Class A | 12,630 | 73,886 |
| | | 1,767,400 |
Banks & Credit Institutions 3.0% | | | |
1st Constitution Bancorp * | | 169 | 3,061 |
1st Independence Financial | | | |
Group, Inc. | | 60 | 1,015 |
| | | | |
1st Source Corp. | | 3,783 | 99,001 |
Advanta Corp., Class A | | 5,524 | 221,402 |
Advanta Corp., Class B | | 1,987 | 87,110 |
American Community Bancshares,Inc. | | 4,740 | 53,562 |
American National Bankshares,Inc. | | 4,800 | 109,872 |
Ameris Bancorp | | 2,735 | 66,953 |
| Number of | Value |
Security | Shares | ($) |
| | |
ASTA Funding, Inc. | 7,914 | 341,727 |
Banco Latinoamericano de Exportaciones, S.A., Class E | 5,020 | 83,533 |
BankUnited Financial Corp.,Class A | 2,349 | 49,822 |
Berkshire Hills Bancorp, Inc. | 150 | 5,047 |
Beverly Hills Bancorp, Inc. | 20,750 | 157,700 |
BNCCorp, Inc. * | 498 | 8,192 |
BOE Financial Services of Virginia,Inc. | 455 | 14,223 |
Britton & Koontz Capital Corp. | 200 | 3,800 |
C&F Financial Corp. | 130 | 5,713 |
Cadence Financial Corp. | 56 | 1,120 |
Carver Bancorp, Inc. | 400 | 6,700 |
Central Bancorp, Inc. | 450 | 13,702 |
Centrue Financial Corp. | 1,630 | 31,573 |
CFS Bancorp, Inc. | 1,865 | 27,956 |
Citizens First Bancorp, Inc. | 329 | 7,495 |
Codorus Valley Bancorp, Inc. | 2,559 | 48,698 |
Community Bank Shares of Indiana, Inc. | 2,209 | 47,991 |
Community Capital Corp. | 480 | 9,694 |
Community Financial Corp. | 3,600 | 43,704 |
Community Shores Bank Corp. * | 10 | 124 |
Community West Bancshares | 808 | 12,783 |
CompuCredit Corp. * | 6,786 | 211,859 |
Consumer Portfolio Services,Inc. * | 20,872 | 128,363 |
Corus Bankshares, Inc. | 17,485 | 298,294 |
Cowlitz Bancorp * | 100 | 1,700 |
Delta Financial Corp. | 15,150 | 125,290 |
Dollar Financial Corp. * | 12,650 | 320,045 |
Downey Financial Corp. | 330 | 21,298 |
ECB Bancorp, Inc. | 3,162 | 105,927 |
Exchange National Bancshares,Inc. | 420 | 15,204 |
Farmers Capital Bank Corp. | 240 | 7,051 |
Federal Agricultural Mortgage Corp., Class C | 7,430 | 202,096 |
Fidelity Southern Corp. | 510 | 9,710 |
First Bancshares, Inc. * | 200 | 3,375 |
First BancTrust Corp. | 400 | 4,732 |
First Capital, Inc. | 1,632 | 29,343 |
First Charter Corp. | 240 | 5,160 |
First Citizens BancShares, Inc.,Class A | 1,650 | 331,650 |
First Defiance Financial Corp. | 2,068 | 59,352 |
First Federal Bancshares of Arkansas, Inc. | 40 | 946 |
First Federal Bankshares, Inc. | 100 | 2,145 |
First Financial Service Corp. | 110 | 3,156 |
First Indiana Corp. | 13,300 | 290,605 |
First Keystone Finl, Inc. * | 220 | 4,334 |
First M&F Corp. | 42 | 773 |
First Mariner Bancorp, Inc. * | 3,091 | 46,983 |
First Merchants Corp. | 211 | 5,005 |
First Niles Financial, Inc. | 99 | 1,183 |
First Place Financial Corp. | 4,915 | 105,427 |
First United Corp. | 2,375 | 53,437 |
First West Virginia Bancorp, Inc. | 10 | 203 |
FNB Corp. of North Carolina | 5,020 | 84,085 |
FNB Corp. of Virginia | 100 | 3,583 |
See financial notes.
Laudus Funds Annual Report 115
Laudus Rosenberg Value Long/Short Equity Fund |
Portfolio Holdings continued | | |
| | |
| Number of | Value |
Security | Shares | ($) |
| | |
FNB Financial Services Corp. | 7,102 | 108,874 |
Franklin Bank Corp. * | 21,424 | 382,847 |
GB&T Bancshares, Inc. | 490 | 8,884 |
Great Pee Dee Bancorp, Inc. | 1 | 15 |
Great Southern Bancorp, Inc. | 10,445 | 305,830 |
Greene County Bancshares, Inc. | 100 | 3,391 |
Guaranty Federal Bancshares, | | |
Inc. | 190 | 5,567 |
Habersham Bancorp, Inc. | 1,250 | 28,687 |
HF Financial Corp. | 770 | 14,052 |
Hopfed Bancorp, Inc. | 60 | 958 |
Horizon Bancorp | 2,800 | 75,348 |
Intervest Bancshares Corp. * | 5,600 | 160,720 |
Irwin Financial Corp. | 5,030 | 93,759 |
ITLA Capital Corp. | 4,800 | 249,696 |
Lakeland Financial Corp. | 200 | 4,540 |
Leesport Financial Corp. | 4,662 | 100,792 |
Lincoln Bancorp | 8 | 152 |
LSB Financial Corp. | 1,504 | 39,766 |
Macatawa Bank Corp. | 280 | 5,152 |
MASSBANK Corp. | 400 | 13,120 |
Meta Financial Group, Inc. | 1,100 | 34,650 |
MFB Corp. | 600 | 20,160 |
MidWestOne Financial Group,Inc. | 3,100 | 54,157 |
MutualFirst Financial, Inc. | 2,810 | 55,301 |
National Bankshares, Inc. | 999 | 23,686 |
NBT Bancorp, Inc. | 6,219 | 145,711 |
North Central Bancshares, Inc. | 1,867 | 74,848 |
North Valley Bancorp | 2,800 | 70,364 |
Northeast Bancorp | 270 | 5,036 |
Northrim BanCorp, Inc. | 1,050 | 31,027 |
Northway Financial, Inc. | 400 | 13,058 |
OceanFirst Financial Corp. | 4,544 | 78,838 |
Pacific Premier Bancorp, Inc. * | 400 | 4,320 |
Parke Bancorp, Inc. | 2,223 | 40,859 |
Parkvale Financial Corp. | 630 | 18,402 |
Pinnacle Bancshares, Inc. | 100 | 1,511 |
Provident Community Bancshares,Inc. | 50 | 1,043 |
Provident Financial Holdings, Inc. | 3,189 | 87,761 |
Renasant Corp. | 1 | 12 |
Republic First Bancorp, Inc. * | 6,385 | 82,239 |
River Valley Bancorp | 393 | 7,015 |
Security Bank Corp. | 16,214 | 326,550 |
Shore Financial Corp. | 30 | 420 |
Simmons First National Corp.,Class A | 2,754 | 82,813 |
South Street Financial Corp. | 100 | 855 |
Southern Missouri Bancorp, Inc. | 130 | 2,009 |
Southwest Bancorp, Inc. | 5,700 | 146,433 |
Sterling Financial Corp. | 1,670 | 52,087 |
Superior Bancorp * | 9,910 | 107,028 |
Synovus Financial Corp. | 5,500 | 177,870 |
TF Financial Corp. | 2,540 | 77,470 |
The First Marblehead Corp. | 21,370 | 959,299 |
The Washington Savings Bank,F.S.B. | 6,400 | 54,400 |
TierOne Corp. | 16,946 | 458,220 |
Tower Financial Corp. | 300 | 5,052 |
| | Number of | Value |
Security | | Shares | ($) |
| | | |
United Bancshares, Inc. | 10 | 162 |
United Community Financial Corp. | | 6,933 | 76,610 |
United Security Bancshares, Inc. | 4,819 | 141,823 |
Unity Bancorp, Inc. | | 2,710 | 32,141 |
Vineyard National Bancorp Co. | 9,700 | 223,488 |
Wainwright Bank & Trust Co. | 4,841 | 61,868 |
Willow Financial Bancorp, Inc. | 367 | 4,734 |
WSFS Financial Corp. | | 4,300 | 277,264 |
| | | 9,766,331 |
Basic Minerals & Metals 4.0% | | |
Allegheny Technologies, Inc. | 33,000 | 3,520,770 |
Chaparral Steel Co. | | 840 | 48,863 |
Cleveland-Cliffs, Inc. | | 5,480 | 350,775 |
CommScope, Inc. * | | 410 | 17,589 |
Freeport-McMoran Copper & | | |
Gold, Inc., Class B | | 8,280 | 548,053 |
Friedman Industries, Inc. | 2,180 | 20,143 |
Precision Castparts Corp. | 16,293 | 1,695,287 |
Southern Copper Corp. | | 29,740 | 2,131,168 |
Steel Dynamics, Inc. | | 380 | 16,416 |
Superior Essex, Inc. * | | 3,057 | 105,986 |
Synalloy Corp. | | 2,600 | 72,592 |
United States Steel Corp. | 42,920 | 4,256,376 |
Universal Stainless & Alloy | | |
Products, Inc. * | | 1,399 | 66,411 |
| | | 12,850,429 |
Beer, Liquor, & Tobacco 0.1% | | |
MGP Ingredients, Inc. | | 1,130 | 23,018 |
The Boston Beer Co., Inc. * | 5,200 | 173,420 |
| | | 196,438 |
Biotechnology 1.6% | | | |
Anika Therapeutics, Inc. * | 9,563 | 118,103 |
Applera Corp. — Celera Group * | 59,588 | 846,150 |
Celgene Corp. * | | 73,438 | 3,852,558 |
Digene Corp. * | | 4,700 | 199,327 |
Harvard Bioscience, Inc. * | 30,270 | 145,901 |
| | | 5,162,039 |
Cellular & Wireless 1.2% | | | |
NII Holdings, Inc. * | | 52,837 | 3,919,449 |
USA Mobility, Inc. * | | 4,280 | 85,300 |
| | | 4,004,749 |
Chemicals & Rubber 2.7% | | | |
A. Schulman, Inc. | | 11,742 | 276,642 |
Bairnco Corp. | | 2,660 | 35,777 |
CF Industries Holdings, Inc. | 8,050 | 310,327 |
FMC Corp. | | 29,780 | 2,246,305 |
Hercules, Inc. * | | 98,914 | 1,932,780 |
Innospec, Inc. | | 10,400 | 599,456 |
Pioneer Cos., Inc. * | | 190 | 5,252 |
Stepan Co. | | 1,700 | 44,625 |
The Sherwin-Williams Co. | 51,800 | 3,420,872 |
| | | 8,872,036 |
116 Laudus Funds Annual Report
See financial notes.
Laudus Rosenberg Value Long/Short Equity Fund |
| | Number of | Value |
Security | | Shares | ($) |
| | | |
Commercial Aircraft & Components 0.1% | | |
Ducommun, Inc. * | | 5,410 | 139,199 |
Triumph Group, Inc. | | 3,240 | 179,302 |
| | | 318,501 |
Communications Utilities 1.2% | | |
Atlantic Tele-Network, Inc. | | 7,150 | 186,830 |
CT Communications, Inc. | | 14,797 | 356,608 |
D&E Communications, Inc. | | 13,095 | 174,425 |
Gilat Satellite Networks Ltd. * | | 32,999 | 272,242 |
Golden Telecom, Inc. | | 10,134 | 561,221 |
HickoryTech Corp. | | 1,740 | 12,058 |
Mediacom Communications | | | |
Corp., Class A * | | 55,000 | 447,700 |
PAETEC Holding Corp. * | | 1,003 | 10,511 |
Playboy Enterprises, Inc., | | | |
Class A * | | 20,310 | 205,131 |
Premiere Global Services, Inc. * | | 69,900 | 784,278 |
United Online, Inc. | | 57,106 | 801,197 |
| | | 3,812,201 |
Construction & Homebuilding 1.1% | | | |
Comfort Systems USA, Inc. | | 39,250 | 470,215 |
Granite Construction, Inc. | | 19,331 | 1,068,231 |
Horizon Offshore, Inc. * | | 1,840 | 26,606 |
Infrasource Services, Inc. * | | 11,950 | 364,833 |
Insituform Technologies, Inc., | | | |
Class A * | | 24,802 | 515,634 |
Meadow Valley Corp. * | | 3,780 | 48,989 |
Palm Harbor Homes, Inc. * | | 7,620 | 109,271 |
Perini Corp. * | | 17,200 | 633,992 |
Skyline Corp. | | 6,700 | 226,058 |
U.S. Home Systems, Inc. * | | 420 | 5,355 |
| | | 3,469,184 |
Construction Materials 0.1% | | | |
Ameron International Corp. | | 1,500 | 98,790 |
Continental Materials Corp. * | | 800 | 22,840 |
Martin Marietta Materials, Inc. | | 210 | 28,392 |
MDU Resources Group, Inc. | | 2,000 | 57,480 |
Oil-Dri Corp. of America | | 2,050 | 34,235 |
Patrick Industries, Inc. * | | 1,880 | 22,541 |
Rock of Ages Corp. * | | 1,170 | 5,757 |
U.S. Concrete, Inc. * | | 360 | 2,815 |
United States Lime & Minerals,Inc. * | | 100 | 3,076 |
Vulcan Materials Co. | | 1,000 | 116,480 |
| | | 392,406 |
Consumer Durables 0.2% | | | |
Arctic Cat, Inc. | | 13,900 | 270,911 |
Universal Electronics, Inc. * | | 10,789 | 300,582 |
Whirlpool Corp. | | 100 | 8,491 |
| | | 579,984 |
Drugs & Pharmaceuticals 1.8% | | |
Dade Behring Holdings, Inc. | | 1,850 | 81,123 |
Geopharma, Inc. * | | 3,530 | 15,532 |
King Pharmaceuticals, Inc. * | | 135,250 | 2,660,367 |
Natural Alternative International, Inc. * | | 520 | 4,170 |
NBTY, Inc. * | | 38,430 | 2,038,327 |
| | Number of | Value |
Security | | Shares | ($) |
| | | |
Nutraceutical International Corp. * | 11,800 | 194,700 |
Perrigo Co. | | 35,225 | 622,073 |
Schiff Nutrition International,Inc. * | | 8,650 | 59,426 |
Sciele Pharma, Inc. * | | 12,314 | 291,596 |
Theragenics Corp. * | | 1,480 | 9,265 |
| | | 5,976,579 |
Electric Utilities 1.5% | | | |
Alliant Energy Corp. | | 2,300 | 103,086 |
Central Vermont Public Service Corp. | | 200 | 5,764 |
CH Energy Group, Inc. | | 900 | 43,821 |
Northeast Utilities | | 66,293 | 2,172,421 |
OGE Energy Corp. | | 100 | 3,880 |
Pinnacle West Capital Corp. | 23,500 | 1,133,875 |
Portland General Electric Co. | 1,500 | 43,800 |
Puget Energy, Inc. | | 510 | 13,097 |
Unisource Energy Corp. | | 1,740 | 65,337 |
Unitil Corp. | | 1,100 | 29,887 |
Westar Energy, Inc. | | 41,500 | 1,142,080 |
| | | 4,757,048 |
Financial Investments 1.4% | | | |
Aaron Rents, Inc. | | 8,890 | 235,052 |
Ampal-American Israel Corp.,Class A * | | 1,860 | 8,165 |
California First National Bancorp | 3,243 | 42,645 |
Electro Rent Corp. * | | 4,474 | 64,426 |
Enstar Group Ltd. * | | 130 | 12,823 |
ePlus, Inc. * | | 3,652 | 38,894 |
Jackson Hewitt Tax Service, Inc. | 18,034 | 580,334 |
KMG America Corp. * | | 22,520 | 104,268 |
Macrovision Corp. * | | 15,892 | 398,095 |
PICO Holdings, Inc. * | | 6,277 | 268,091 |
SRS Labs, Inc. * | | 4,120 | 57,392 |
Trinity Industries, Inc. | | 57,330 | 2,403,273 |
United Rentals, Inc. * | | 7,752 | 213,180 |
UTEK Corp. | | 2,750 | 36,300 |
Willis Lease Finance Corp. * | 6,630 | 68,355 |
| | | 4,531,293 |
Forest Products & Paper 0.1% | | | |
CSS Industries, Inc. | | 390 | 14,617 |
Lydall, Inc. * | | 14,960 | 237,715 |
Nashua Corp. * | | 220 | 1,958 |
Packaging Corp. of America | 2,200 | 53,680 |
| | | 307,970 |
Furniture & Household Items 1.7% | | |
A.T. Cross Co., Class A * | | 300 | 2,640 |
Acuity Brands, Inc. | | 200 | 10,888 |
AEP Industries, Inc. * | | 4,064 | 174,752 |
American Biltrite, Inc. * | | 1,940 | 18,061 |
AZZ, Inc. * | | 4,380 | 183,960 |
Bassett Furniture Industries, Inc. | 4,350 | 64,032 |
Channell Commercial Corp. * | 6,023 | 23,972 |
Chase Corp. | | 1,600 | 52,016 |
Chromcraft Revington, Inc. * | 6,140 | 59,067 |
Communications Systems, Inc. | 4,200 | 43,596 |
Craftmade International, Inc. | 410 | 6,187 |
GameTech International, Inc. * | 1,160 | 14,175 |
See financial notes.
Laudus Funds Annual Report 117
Laudus Rosenberg Value Long/Short Equity Fund |
Portfolio Holdings continued | | |
| | | |
| | Number of | Value |
Security | | Shares | ($) |
| | | |
Genlyte Group, Inc. * | | 3,190 | 225,054 |
Herman Miller, Inc. | | 19,438 | 650,979 |
Hooker Furniture Corp. | | 3,279 | 65,744 |
JAKKS Pacific, Inc. * | | 16,891 | 403,695 |
K2, Inc. * | | 42,600 | 515,034 |
La-Z-Boy, Inc. | | 44,600 | 552,148 |
Mity Enterprises, Inc. * | | 564 | 10,772 |
Movado Group, Inc. | | 15,420 | 454,119 |
National Presto Industries, Inc. | 1,320 | 81,365 |
Preformed Line Products Co. | 500 | 18,495 |
RC2 Corp. * | | 3,590 | 145,000 |
Steelcase, Inc., Class A | | 74,100 | 1,473,849 |
Thomas & Betts Corp. * | | 4,154 | 202,798 |
Tredegar Corp. | | 860 | 19,599 |
Virco Manufacturing Corp. * | 1,310 | 8,843 |
| | | 5,480,840 |
Gas & Other Public Utilities 0.4% | | |
Artesian Resources Corp., Class A | 645 | 13,287 |
Florida Public Utilities Co. | | 1,800 | 22,320 |
Industrial Services of America, | | |
Inc. * | | 770 | 5,120 |
Middlesex Water Co. | | 590 | 10,850 |
Nicor, Inc. | | 9,330 | 451,759 |
SJW Corp. | | 8,380 | 339,222 |
Waste Industries USA, Inc. | 5,030 | 138,174 |
WGL Holdings, Inc. | | 4,760 | 152,225 |
| | | 1,132,957 |
Government Aircraft & Defense 0.1% | | |
Armor Holdings, Inc. * | | 2,920 | 196,603 |
Herley Industries, Inc. * | | 132 | 2,062 |
| | | 198,665 |
Health Care & Hospital 1.4% | | | |
Almost Family, Inc. * | | 3,800 | 94,620 |
Amedisys, Inc. * | | 1,400 | 45,402 |
American Shared Hospital | | |
Services | | 3,400 | 20,060 |
Gentiva Health Services, Inc. * | 13,845 | 279,254 |
Hanger Orthopedic Group, Inc. * | 18,400 | 214,728 |
Health Net, Inc. * | | 3,236 | 174,129 |
Humana, Inc. * | | 44,600 | 2,587,692 |
IntegraMed America, Inc. * | 4,925 | 73,629 |
Laboratory Corp. of America Holdings * | | 2 | 145 |
Manor Care, Inc. | | 3,132 | 170,256 |
MedCath Corp. * | | 8,901 | 242,997 |
MEDTOX Scientific, Inc. * | 3,190 | 58,696 |
National Dentex Corp. * | | 6,019 | 84,748 |
National Healthcare Corp. | | 790 | 40,274 |
NovaMed, Inc. * | | 14,098 | 91,355 |
RehabCare Group, Inc. * | | 80 | 1,270 |
Res-Care, Inc. * | | 20,969 | 366,957 |
Stratagene Corp. * | | 1,220 | 9,906 |
| | | 4,556,118 |
Information & Services 5.2% | | | |
Ablest, Inc. * | | 2,100 | 15,509 |
ABM Industries, Inc. | | 2,680 | 70,725 |
Albany Molecular Research, Inc. * | 23,350 | 229,998 |
Barrett Business Services, Inc. | 7,320 | 168,726 |
| Number of | Value |
Security | Shares | ($) |
| | |
Bioanalytical Systems, Inc. * | 1,250 | 8,413 |
Carriage Services, Inc. * | 1,770 | 14,319 |
Cass Information Systems, Inc. | 990 | 33,422 |
CBIZ, Inc. * | 1,030 | 7,313 |
CDI Corp. | 12,579 | 363,785 |
CompuDyne Corp. * | 2,460 | 14,932 |
Convergys Corp. * | 39,390 | 1,000,900 |
CPI Corp. | 5,570 | 292,481 |
Ecology & Environment, Inc. | 3,030 | 35,996 |
Exponent, Inc. * | 14,600 | 291,270 |
Forrester Research, Inc. * | 8,458 | 239,869 |
GP Strategies Corp. * | 12,690 | 115,479 |
IAC/InterActive Corp. * | 25,400 | 957,834 |
ICT Group, Inc. * | 1,395 | 24,413 |
Infinity Pharmaceuticals, Inc. * | 6,150 | 74,046 |
Kelly Services, Inc., Class A | 17,600 | 566,720 |
Kendle International, Inc. * | 12,687 | 450,642 |
Kforce, Inc. * | 30,300 | 417,231 |
Layne Christensen Co. * | 4,740 | 172,631 |
Manpower, Inc. | 1,940 | 143,114 |
Metal Management, Inc. | 20,258 | 935,920 |
Midas, Inc. * | 6,520 | 140,636 |
Monro Muffler Brake, Inc. | 10,520 | 369,252 |
MPS Group, Inc. * | 80,390 | 1,137,518 |
National Medical Health Card | | |
Systems, Inc. * | 1,930 | 29,857 |
National Technical Systems, Inc. * | 2,370 | 14,386 |
Nobel Learning Communities, | | |
Inc. * | 40 | 606 |
PAREXEL International Corp. * | 23,700 | 852,489 |
PDI, Inc. * | 13,870 | 132,042 |
RCM Technologies, Inc. * | 12,100 | 86,273 |
Refac Optical Group * | 140 | 837 |
Spherion Corp. * | 47,730 | 420,979 |
SRI/Surgical Express, Inc. * | 100 | 504 |
Stewart Enterprises, Inc., Class A | 95,353 | 768,545 |
TeleTech Holdings, Inc. * | 29,570 | 1,084,923 |
The Dun & Bradstreet Corp. | 24,580 | 2,241,696 |
The Geo Group, Inc. * | 6,360 | 288,235 |
URS Corp. * | 45,300 | 1,929,327 |
Viad Corp. | 6,550 | 252,830 |
Volt Information Sciences, Inc. * | 12,000 | 314,280 |
VSE Corp. | 2,395 | 98,578 |
| | 16,809,481 |
Instruments 4.6% | | |
1-800 CONTACTS, Inc. * | 370 | 6,216 |
Aetrium, Inc. * | 1,200 | 4,464 |
Allied Healthcare Products, Inc. * | 1,942 | 11,759 |
Angeion Corp. * | 2,596 | 38,161 |
Astro-Med, Inc. | 3,420 | 37,620 |
Atrion Corp. | 280 | 25,710 |
Bio-Rad Laboratories, Inc., | | |
Class A * | 14,590 | 1,018,966 |
Bruker BioSciences Corp. * | 33,708 | 354,608 |
Cardiac Science Corp. * | 8,408 | 76,933 |
Cholestech Corp. * | 5,360 | 92,406 |
Coherent, Inc. * | 24,710 | 784,295 |
CyberOptics Corp. * | 460 | 6,417 |
Datascope Corp. | 9,504 | 343,950 |
Edwards Lifesciences Corp. * | 800 | 40,560 |
Enpath Medical, Inc. * | 210 | 2,100 |
118 Laudus Funds Annual Report
See financial notes.
Laudus Rosenberg Value Long/Short Equity Fund |
| Number of | Value |
Security | Shares | ($) |
| | |
Esterline Technologies Corp. * | 22,800 | 936,396 |
FEI Co. * | 14,924 | 538,159 |
Frequency Electronics, Inc. | 6,910 | 75,457 |
Hurco Cos., Inc. * | 6,570 | 281,524 |
Immucor, Inc. * | 47,064 | 1,385,094 |
Input/Output, Inc. * | 42,320 | 583,170 |
IntriCon Corp. * | 850 | 5,015 |
K-Tron International, Inc. * | 2,300 | 164,979 |
Keithley Instruments, Inc. | 11,400 | 174,306 |
Kewaunee Scientific Corp. | 1,840 | 19,596 |
Mesa Laboratories, Inc. | 100 | 1,896 |
MOCON, Inc. | 4,900 | 63,014 |
New Brunswick Scientific Co., | | |
Inc. * | 520 | 4,196 |
O.I. Corp. | 1,200 | 13,770 |
Oakley, Inc. | 22,330 | 449,726 |
Orthofix International N.V. * | 7,332 | 374,299 |
Perceptron, Inc. * | 6,170 | 55,530 |
PerkinElmer, Inc. | 101,550 | 2,459,541 |
Schmitt Industries, Inc. * | 769 | 5,860 |
Sonic Innovations, Inc. * | 19,730 | 166,719 |
Span-America Medical Systems, | | |
Inc. | 2,600 | 41,366 |
Teleflex, Inc. | 34,930 | 2,377,685 |
Tollgrade Communications, Inc. * | 13,886 | 174,408 |
Varian, Inc. * | 1,740 | 101,372 |
Viasys Healthcare, Inc. * | 20,700 | 703,593 |
Vicon Industries, Inc. * | 80 | 796 |
Waters Corp. * | 13,560 | 786,480 |
Zoll Medical Corp. * | 1,080 | 28,782 |
Zygo Corp. * | 17,250 | 276,172 |
| | 15,093,066 |
Insurance 7.5% | | |
Alleghany Corp. * | 51 | 19,054 |
American Equity Investment Life | | |
Holding Co. | 9,072 | 119,115 |
American Financial Group, Inc. | 46,080 | 1,568,563 |
American National Insurance Co. | 3,081 | 394,152 |
American Safety Insurance | | |
Holdings Ltd. * | 5,000 | 95,300 |
Arch Capital Group Ltd. * | 34,769 | 2,371,593 |
Aspen Insurance Holdings Ltd. | 67,172 | 1,760,578 |
CNA Financial Corp. * | 44,530 | 1,918,798 |
Crawford & Co., Class B | 10,750 | 62,350 |
Endurance Specialty Holdings | | |
Ltd. | 59,994 | 2,144,186 |
Everest Re Group Ltd. | 13,700 | 1,317,529 |
FPIC Insurance Group, Inc. * | 9,000 | 402,030 |
Hallmark Financial Services, Inc. * | 880 | 10,595 |
HCC Insurance Holdings, Inc. | 73,291 | 2,257,363 |
Horace Mann Educators Corp. | 900 | 18,495 |
IPC Holdings Ltd. | 56,652 | 1,634,410 |
Kansas City Life Insurance Co. | 310 | 13,950 |
Max Re Capital Ltd. | 11,650 | 296,842 |
Meadowbrook Insurance Group, | | |
Inc. * | 1,120 | 12,309 |
Mercer Insurance Group, Inc. | 1,890 | 37,592 |
MGIC Investment Corp. | 560 | 32,995 |
National Western Life Insurance | | |
Co., Class A * | 950 | 232,560 |
NYMAGIC, Inc. | 2,290 | 93,547 |
| | Number of | Value |
Security | | Shares | ($) |
| | | |
Old Republic International Corp. | 11,750 | 259,910 |
PartnerRe Ltd. | | 35,400 | 2,426,316 |
Presidential Life Corp. | | 855 | 16,861 |
Radian Group, Inc. | | 22,300 | 1,223,824 |
Reinsurance Group of America, | | |
Inc. | | 23,700 | 1,367,964 |
RenaissanceRe Holdings Ltd. | 35,546 | 1,782,276 |
RTW, Inc. * | | 100 | 817 |
Unico American Corp. * | | 2,900 | 36,743 |
United America Indemnity Ltd., | | |
Class A * | | 11,055 | 256,476 |
Wesco Financial Corp. | | 600 | 276,000 |
| | | 24,461,093 |
Integrated Oil Companies 0.0% | | | |
Marathon Oil Corp. | | 113 | 11,168 |
IT Hardware 6.6% | | | |
American Technical Ceramics | | |
Corp. * | | 4,470 | 62,088 |
AMIS Holdings, Inc. * | | 2,100 | 22,995 |
Amtech Systems, Inc. * | | 1,680 | 12,231 |
Avici Systems, Inc. * | | 2,910 | 33,232 |
Avocent Corp. * | | 17,501 | 472,002 |
AVX Corp. | | 45,095 | 685,444 |
Axcelis Technologies, Inc. * | | 10,841 | 82,825 |
CTS Corp. | | 25,780 | 356,280 |
Cymer, Inc. * | | 30,613 | 1,271,970 |
Digi International, Inc. * | | 20,507 | 260,439 |
EMS Technologies, Inc. * | | 14,519 | 279,781 |
Emulex Corp. * | | 6,380 | 116,690 |
Espey Manufacturing & | | | |
Electronics Corp. | | 1,200 | 23,580 |
Exar Corp. * | | 27,676 | 366,430 |
Flextronics International Ltd. * | 3,450 | 37,743 |
Globecomm Systems, Inc. * | | 5,700 | 60,990 |
Harmonic, Inc. * | | 520 | 5,106 |
Harris Corp. | | 1,035 | 52,733 |
Imation Corp. | | 820 | 33,112 |
Integrated Device Technology, | | |
Inc. * | | 148,697 | 2,292,908 |
International Rectifier Corp. * | 55,440 | 2,118,363 |
L-3 Communications Holdings, | | |
Inc. | | 40 | 3,499 |
Lattice Semiconductor Corp. * | 39,446 | 230,759 |
LSI Logic Corp. * | | 263,491 | 2,750,846 |
MEMC Electronic Materials, Inc. * | 11,000 | 666,380 |
Merix Corp. * | | 21,500 | 176,730 |
Merrimac Industries, Inc. * | | 800 | 7,712 |
Micron Technology, Inc. * | | 192 | 2,319 |
MKS Instruments, Inc. * | | 35,200 | 898,304 |
Novellus Systems, Inc. * | | 50,071 | 1,603,274 |
Oplink Communications, Inc. * | 15,759 | 283,189 |
Orbital Sciences Corp. * | | 54,400 | 1,019,456 |
Performance Technologies, Inc. * | 3 | 15 |
Pericom Semiconductor Corp. * | 7,205 | 70,465 |
RF Micro Devices, Inc. * | | 172,285 | 1,073,336 |
Rudolph Technologies, Inc. * | 22,641 | 394,859 |
Semitool, Inc. * | | 21,370 | 277,810 |
SonicWALL, Inc. * | | 57,264 | 478,727 |
Spectrum Control, Inc. * | | 7,900 | 97,170 |
Standard Microsystems Corp. * | 4,421 | 135,017 |
See financial notes.
Laudus Funds Annual Report 119
Laudus Rosenberg Value Long/Short Equity Fund |
Portfolio Holdings continued | | |
| | | |
| | Number of | Value |
Security | | Shares | ($) |
| | | |
Symmetricom, Inc. * | | 17,210 | 142,843 |
Technitrol, Inc. | | 5,410 | 141,688 |
Tekelec * | | 4,963 | 73,998 |
Trans Lux Corp. | | 1,200 | 8,820 |
TriQuint Semiconductor, Inc. * | | 118,468 | 592,340 |
Vishay Intertechnology, Inc. * | | 107,390 | 1,501,312 |
White Electronic Designs Corp. * | 5,599 | 37,289 |
| | | 21,315,099 |
Land & Water Transportation 2.0% | | | |
B & H Ocean Carriers Ltd. * | | 6,070 | 111,081 |
Covenant Transport, Inc., | | | |
Class A * | | 2,455 | 27,054 |
Frozen Food Express Industries, | | | |
Inc. | | 343 | 2,854 |
GulfMark Offshore, Inc. * | | 16,175 | 706,039 |
Hub Group, Inc., Class A * | | 13,238 | 383,770 |
P.A.M. Transportation Services, | | | |
Inc. * | | 5,368 | 110,688 |
Pacer International, Inc. | | 31,551 | 849,984 |
Royal Caribbean Cruises Ltd. | | 1,620 | 68,299 |
Ryder System, Inc. | | 44,070 | 2,174,414 |
Saia, Inc. * | | 14,144 | 335,920 |
SEACOR Holdings, Inc. * | | 12,830 | 1,262,472 |
Trico Marine Services, Inc. * | | 6,336 | 236,079 |
U.S. Xpress Enterprises, Inc., | | | |
Class A * | | 9,369 | 161,709 |
| | | 6,430,363 |
Mainframe & Minicomputers 0.0% | | | |
Omnicell, Inc. * | | 3,900 | 81,588 |
Metal Products & Machinery 4.0% | | | |
Acme United Corp. | | 360 | 5,004 |
AGCO Corp. * | | 73,980 | 2,735,041 |
Allied Motion Technologies, Inc. * | 4,871 | 31,126 |
Astec Industries, Inc. * | | 16,047 | 645,892 |
Asyst Technologies, Inc. * | | 29,209 | 205,339 |
Bonso Electronic International, | | | |
Inc. | | 2,830 | 11,575 |
Electro Scientific Industries, Inc. * | 14,944 | 287,522 |
EnPro Industries, Inc. * | | 20,400 | 735,420 |
Evans & Sutherland Computer | | | |
Corp. * | | 2,600 | 8,190 |
FSI International, Inc. * | | 33,200 | 148,404 |
Gehl Co. * | | 11,100 | 281,718 |
Gerber Scientific, Inc. * | | 21,619 | 229,377 |
Goodman Global, Inc. * | | 920 | 16,210 |
Hardinge, Inc. | | 3,900 | 102,024 |
Kadant, Inc. * | | 14,100 | 357,576 |
Kennametal, Inc. | | 19,760 | 1,335,974 |
Lifetime Brands, Inc. | | 11,064 | 231,127 |
Lincoln Electric Holdings, Inc. | | 500 | 29,780 |
Material Sciences Corp. * | | 15,780 | 157,484 |
MFRI, Inc. * | | 100 | 1,854 |
Newport Corp. * | | 36,797 | 602,367 |
NN, Inc. | | 10,089 | 126,012 |
P & F Industries, Inc., Class A * | 700 | 8,764 |
Q.E.P. Co., Inc. * | | 2,240 | 13,462 |
Regal Beloit Corp. | | 14,620 | 678,076 |
Robbins & Myers, Inc. | | 6,290 | 234,554 |
| Number of | Value |
Security | Shares | ($) |
| | |
SPX Corp. | 4,740 | 332,748 |
Standex International Corp. | 6,700 | 191,017 |
Tennant Co. | 6,400 | 201,536 |
Terex Corp. * | 16,966 | 1,217,480 |
The L.S. Starrett Co., Class A | 160 | 2,880 |
Twin Disc, Inc. | 540 | 23,058 |
Varian Semiconductor Equipment Associates, Inc. * | 4,002 | 213,627 |
Veeco Instruments, Inc. * | 29,700 | 579,150 |
Velcro Industries N.V. | 100 | 1,729 |
Wabtec Corp. | 1,100 | 37,939 |
Watts Water Technologies, Inc.,Class A | 26,089 | 992,165 |
| | 13,013,201 |
Miscellaneous Finance 2.5% | | |
A.G. Edwards, Inc. | 44,700 | 3,092,346 |
Chicago Mercantile Exchange | | |
Holdings, Inc., Class A | 259 | 137,907 |
Cohen & Steers, Inc. | 7,876 | 339,298 |
Knight Capital Group, Inc.,Class A * | 98,800 | 1,564,992 |
Raymond James Financial, Inc. | 70,300 | 2,092,128 |
SEI Investments Co. | 100 | 6,023 |
SWS Group, Inc. | 19,365 | 480,446 |
Value Line, Inc. | 300 | 14,340 |
Waddell & Reed Financial, Inc., | | |
Class A | 12,020 | 280,306 |
| | 8,007,786 |
Oil & Coal Resources 1.0% | | |
Callon Petroleum Co. * | 18,044 | 244,857 |
Mariner Energy, Inc. * | 53,010 | 1,014,081 |
PrimeEnergy, Corp. * | 202 | 11,748 |
Rosetta Resources, Inc. * | 16,190 | 332,543 |
Teton Energy Corp. * | 2,700 | 13,068 |
Unit Corp. * | 35,117 | 1,776,569 |
VAALCO Energy, Inc. * | 710 | 3,678 |
| | 3,396,544 |
Oil Distribution 0.8% | | |
Adams Resources & Energy, Inc. | 3,383 | 124,021 |
Holly Corp. | 780 | 46,254 |
Tesoro Corp. | 18,525 | 1,860,466 |
Western Refining, Inc. | 16,120 | 629,002 |
World Fuel Services Corp. | 980 | 45,335 |
| | 2,705,078 |
Oil Drilling & Services 3.2% | | |
Basic Energy Services, Inc. * | 7,620 | 177,546 |
Bronco Drilling Co., Inc. * | 14,900 | 246,893 |
Dawson Geophysical Co. * | 1,570 | 77,762 |
ENSCO International, Inc. | 64,360 | 3,501,184 |
Global Industries Ltd. * | 9,420 | 172,292 |
Helmerich & Payne, Inc. | 16,615 | 504,099 |
Rowan Cos., Inc. | 26,937 | 874,645 |
Superior Energy Services, Inc. * | 65,690 | 2,264,334 |
Tidewater, Inc. | 46,300 | 2,712,254 |
120 Laudus Funds Annual Report
See financial notes.
Laudus Rosenberg Value Long/Short Equity Fund |
| | Number of | Value |
Security | | Shares | ($) |
| | | |
Photo-optical, Micros & Office Machinery 0.7% | |
Baldwin Technology Co., Inc., | | | |
Class A * | | 15,900 | 79,500 |
Brocade Communications | | | |
Systems, Inc. * | | 78,602 | 748,291 |
Concord Camera Corp. * | | 1,080 | 5,044 |
Komag, Inc. * | | 24,200 | 792,066 |
Printronix, Inc. | | 1,150 | 15,928 |
STEC, Inc. * | | 42,749 | 300,953 |
VeriFone Holdings, Inc. * | | 13,150 | 482,999 |
| | | 2,424,781 |
Publishing, Broadcasting & Cinema 1.4% | | |
Alloy, Inc. * | | 5,330 | 63,320 |
American Greetings Corp., | | | |
Class A | | 24,320 | 564,467 |
Bowne & Co., Inc. | | 8,700 | 136,851 |
Champion Industries, Inc. | | 1,540 | 12,720 |
Consolidated Graphics, Inc. * | | 9,900 | 733,095 |
Franklin Covey Co. * | | 19,150 | 151,285 |
Media General, Inc., Class A | | 11,940 | 455,630 |
Monster Worldwide, Inc. * | | 4,748 | 224,913 |
Paxar Corp. * | | 26,590 | 763,133 |
Regent Communications, Inc. * | | 4,481 | 14,429 |
Saga Communications, Inc., | | | |
Class A * | | 18,780 | 182,729 |
Scholastic Corp. * | | 31,991 | 994,920 |
Source Interlink Cos., Inc. * | | 33,301 | 223,450 |
The Standard Register Co. | | 410 | 5,187 |
Tufco Technologies, Inc. * | | 221 | 1,806 |
| | | 4,527,935 |
Real Estate Development 1.0% | | | |
AMREP Corp. * | | 1,130 | 87,293 |
Avatar Holdings, Inc. * | | 3,864 | 276,044 |
Griffin Land & Nurseries, Inc. * | | 710 | 25,205 |
ILX Resorts, Inc. | | 1,900 | 17,670 |
J.W. Mays, Inc. * | | 2,600 | 55,900 |
Patriot Transportation Holding, | | | |
Inc. * | | 673 | 60,308 |
Service Corp. International | | 212,145 | 2,516,040 |
Stratus Properties, Inc. * | | 460 | 15,465 |
The Intergroup Corp. * | | 330 | 6,575 |
United Capital Corp. * | | 720 | 24,559 |
Wellsford Real Properties, Inc. * | | 2,360 | 18,443 |
| | | 3,103,502 |
Real Estate Investment Trusts 6.7% | | | |
American Campus Communities,Inc. | | 1,930 | 58,460 |
American First Apartment Investors, Inc. | | 410 | 8,319 |
Ashford Hospitality Trust | | 52,760 | 629,954 |
Associated Estates Realty Corp. | | 1,790 | 25,221 |
CBL & Associates Properties, Inc. | 53,423 | 2,395,487 |
Cedar Shopping Centers, Inc. | | 24,350 | 394,470 |
Eagle Hospitality Properties Trust,Inc. | | 16,710 | 186,317 |
Extra Space Storage, Inc. | | 43,230 | 818,776 |
Franklin Street Properties Corp. | | 44,272 | 849,137 |
Gladstone Commercial Corp. | | 660 | 13,233 |
Highland Hospitality Corp. | | 35,361 | 629,426 |
| Number of | Value |
Security | Shares | ($) |
| | |
Home Properties, Inc. | 4,280 | 226,027 |
Hospitality Properties Trust | 19,330 | 904,644 |
HRPT Properties Trust | 181,806 | 2,236,214 |
Income Opportunity Realty Investors * | 590 | 3,540 |
Innkeepers USA Trust | 16,207 | 263,850 |
iStar Financial, Inc. | 57,487 | 2,692,116 |
Kite Realty Group Trust | 16,000 | 319,200 |
LaSalle Hotel Properties | 10,030 | 464,991 |
Lexington Realty Trust | 44,546 | 941,257 |
LTC Properties, Inc. | 9,840 | 254,954 |
Medical Properties Trust, Inc. | 32,230 | 473,459 |
Mission West Properties, Inc. | 10,440 | 150,962 |
Monmouth Capital Corp. | 3,830 | 21,180 |
Monmouth Real Estate Investment Corp., Class A | 18,189 | 156,789 |
National Health Investors, Inc. | 776 | 24,320 |
National Retail Properties, Inc. | 42,020 | 1,016,464 |
One Liberty Properties, Inc. | 4,810 | 109,716 |
Ramco-Gershenson Properties Trust | 8,490 | 303,178 |
Republic Property Trust | 14,980 | 172,120 |
Roberts Realty Investors, Inc. * | 1,000 | 7,900 |
Spirit Finance Corp. | 88,843 | 1,323,761 |
Strategic Hotel & Resorts, Inc. | 56,210 | 1,285,523 |
Sunstone Hotel Investors, Inc. | 50,390 | 1,373,631 |
Supertel Hospitality, Inc. | 11,680 | 89,118 |
Universal Health Realty Income Trust | 80 | 2,860 |
Urstadt Biddle Properties, Inc.,Class A | 25,375 | 496,335 |
Winston Hotels, Inc. * | 21,600 | 324,648 |
Winthrop Realty Trust | 34,430 | 227,582 |
| | 21,875,139 |
Restaurants, Hotels & Theaters 2.6% | | |
Analogic Corp. | 4,300 | 270,384 |
Avalon Holdings Corp., Class A * | 100 | 797 |
Back Yard Burgers, Inc. * | 570 | 3,158 |
Benihana, Inc., Class A * | 8,454 | 239,586 |
Bob Evans Farms, Inc. | 17,743 | 655,604 |
Brinker International, Inc. | 12,300 | 402,210 |
Burger King Holdings, Inc. | 22,490 | 485,784 |
Canterbury Park Holding Corp. * | 3,900 | 55,185 |
CBRL Group, Inc. | 23,469 | 1,086,615 |
CEC Entertainment, Inc. * | 8,900 | 369,706 |
Champps Entertainment, Inc. * | 290 | 1,641 |
Churchill Downs, Inc. | 370 | 16,794 |
Dover Motorsports, Inc. | 4,700 | 24,675 |
Famous Dave’s of America, Inc. * | 110 | 1,988 |
Friendly Ice Cream Corp. * | 5,910 | 87,882 |
Frisch’s Restaurants, Inc. | 4,500 | 168,750 |
Interstate Hotels & Resorts, Inc. * | 30,000 | 189,300 |
J. Alexander’s Corp. | 1,290 | 14,255 |
Jack in the Box, Inc. * | 1,950 | 134,803 |
Live Nation, Inc. * | 56,800 | 1,253,008 |
Marcus Corp. | 19,640 | 456,826 |
Max & Erma’s Restaurants, Inc. * | 2,300 | 20,700 |
McCormick & Schmick’s Seafood Restaurants, Inc. * | 12,200 | 327,082 |
Mexican Restaurants, Inc. * | 2,543 | 24,387 |
Nathan’s Famous, Inc. * | 450 | 6,750 |
See financial notes.
Laudus Funds Annual Report 121
Laudus Rosenberg Value Long/Short Equity Fund |
Portfolio Holdings continued | | |
| | |
| Number of | Value |
Security | Shares | ($) |
| | |
O’Charley’s, Inc. * | 21,040 | 405,862 |
Red Lion Hotels Corp. * | 19,400 | 241,336 |
Rubio’s Restaurants, Inc. * | 10 | 114 |
Silverleaf Resorts, Inc. * | 6,500 | 30,160 |
Speedway Motorsports, Inc. | 5,780 | 223,975 |
Star Buffet, Inc. | 2,700 | 22,545 |
The Steak n Shake Co. * | 26,000 | 436,020 |
Trump Entertainment Resorts,Inc. * | 624 | 11,276 |
WMS Industries, Inc. * | 18,031 | 707,536 |
| | 8,376,694 |
Retail 5.0% | | |
1-800-FLOWERS.COM, Inc., | | |
Class A * | 25,266 | 196,569 |
Arden Group, Inc., Class A | 772 | 103,062 |
Asbury Automotive Group, Inc. | 890 | 25,142 |
AutoNation, Inc. * | 55,600 | 1,180,944 |
Big Lots, Inc. * | 85,280 | 2,667,558 |
Cabela’s, Inc. * | 610 | 15,134 |
Cache, Inc. * | 4,680 | 83,070 |
Cash America International, Inc. | 10,280 | 421,480 |
Charlotte Russe Holding, Inc. * | 10,795 | 311,652 |
Charming Shoppes, Inc. * | 88,658 | 1,148,121 |
Collegiate Pacific, Inc. | 9,370 | 73,086 |
Cost-U-Less, Inc. * | 2,570 | 23,104 |
Deb Shops, Inc. | 770 | 20,852 |
Dillard’s, Inc., Class A | 300 | 9,819 |
Dollar Tree Stores, Inc. * | 1,249 | 47,762 |
EZCORP, Inc., Class A * | 16,710 | 246,138 |
Finlay Enterprises, Inc. * | 1,000 | 5,810 |
First Cash Financial Services, | | |
Inc. * | 4,580 | 102,042 |
Gottschalks, Inc. * | 6,970 | 99,462 |
GSI Commerce, Inc. * | 9,809 | 221,585 |
Hastings Entertainment, Inc. * | 3,280 | 20,008 |
Haverty Furniture Cos., Inc. | 20,790 | 291,060 |
Insight Enterprises, Inc. * | 8,860 | 159,303 |
Jennifer Convertibles, Inc. * | 1,640 | 7,642 |
Kirkland’s, Inc. * | 16,368 | 81,349 |
Longs Drug Stores Corp. | 8,550 | 441,522 |
Nordstrom, Inc. | 170 | 9,000 |
OfficeMax, Inc. | 48,840 | 2,575,822 |
PC Connection, Inc. * | 515 | 7,365 |
PC Mall, Inc. * | 520 | 5,184 |
Priceline.com, Inc. * | 7,700 | 410,102 |
Restoration Hardware, Inc. * | 30,471 | 199,890 |
REX Stores Corp. * | 7,150 | 116,974 |
Ruddick Corp. | 440 | 13,235 |
Rush Enterprises, Inc., Class A * | 3,123 | 59,993 |
Rush Enterprises, Inc., Class B * | 6,430 | 116,447 |
Shoe Carnival, Inc. * | 6,420 | 213,786 |
Shoe Pavilion, Inc. * | 8,630 | 53,506 |
Spartan Stores, Inc. | 15,320 | 410,576 |
Sport Chalet, Inc., Class A * | 5,940 | 64,687 |
Sport Chalet, Inc., Class B * | 1,000 | 10,795 |
Systemax, Inc. * | 5,352 | 100,243 |
The Bon-Ton Stores, Inc. | 6,700 | 376,808 |
The Cato Corp., Class A | 27,720 | 648,371 |
The Great Atlantic & Pacific Tea | | |
Co., Inc. * | 18,870 | 626,107 |
The Men’s Wearhouse, Inc. | 34,200 | 1,609,110 |
| | Number of | Value |
Security | | Shares | ($) |
| | | |
Trans World Entertainment Corp. * | | 31,520 | 179,034 |
Village Super Market, Inc.,Class A | | 1,500 | 143,235 |
Weis Markets, Inc. | | 6,040 | 269,988 |
Zones, Inc. * | | 9,120 | 93,480 |
| | | 16,317,014 |
Soaps & Cosmetics 0.0% | | | |
Parlux Fragrances, Inc. * | 12,870 | 71,815 |
The Estee Lauder Cos., Inc., | | |
Class A | | 1,550 | 75,717 |
| | | 147,532 |
Software 6.7% | | | |
American Software, Inc., Class A | 7,000 | 56,350 |
Aspen Technology, Inc. * | 47,283 | 614,679 |
Black Box Corp. | | 13,196 | 482,182 |
BMC Software, Inc. * | 107,210 | 3,300,996 |
Cadence Design Systems, Inc. * | 21,973 | 462,751 |
Captaris, Inc. * | | 12,620 | 73,070 |
CIBER, Inc. * | | 47,484 | 373,699 |
Cognizant Technology Solutions Corp., Class A * | 17,591 | 1,552,758 |
Computer Task Group, Inc. * | 7,655 | 34,524 |
CSP, Inc. * | | 1,220 | 11,261 |
Dynamics Research Corp. * | 7,190 | 81,966 |
Edgewater Technology, Inc. * | 9,580 | 80,855 |
Emdeon Corp. * | | 179,832 | 2,720,858 |
Goldleaf Financial Solutions, Inc. * | 3,600 | 23,688 |
Harris Interactive, Inc. * | 52,060 | 313,922 |
Inforte Corp. * | | 7,170 | 24,880 |
INX, Inc. * | | 140 | 1,427 |
Lawson Software, Inc. * | 105,403 | 852,710 |
Lightbridge, Inc. * | | 21,531 | 378,300 |
MapInfo Corp. * | | 110 | 2,214 |
Mentor Graphics Corp. * | 69,500 | 1,135,630 |
Moldflow Corp. * | | 9,900 | 148,797 |
Move, Inc. * | | 9,840 | 54,514 |
Ness Technologies, Inc. * | 19,403 | 247,970 |
NetManage, Inc. * | | 70 | 368 |
NetScout Systems, Inc. * | 21,070 | 190,683 |
PC-Tel, Inc. * | | 23,600 | 240,012 |
Perot Systems Corp., Class A * | 7,360 | 131,523 |
Saba Software, Inc. * | 6,050 | 39,597 |
SAVVIS, Inc. * | | 28,926 | 1,384,977 |
SPSS, Inc. * | | 17,074 | 616,371 |
Sybase, Inc. * | | 75,340 | 1,904,595 |
Synopsys, Inc. * | | 90,934 | 2,385,199 |
Taleo Corp., Class A * | 14,053 | 232,999 |
TechTeam Global, Inc. * | 4,670 | 58,375 |
THQ, Inc. * | | 32,334 | 1,105,499 |
TSR, Inc. | | 3,200 | 13,504 |
Tyler Technologies, Inc. * | 902 | 11,455 |
Versant Corp. * | | 290 | 4,916 |
Vignette Corp. * | | 18,260 | 339,088 |
| | | 21,689,162 |
Textiles & Apparel 2.2% | | | |
Culp, Inc. * | | 12,300 | 87,084 |
Cutter & Buck, Inc. | | 9,500 | 112,575 |
Decorator Industries, Inc. | 40 | 280 |
122 Laudus Funds Annual Report
See financial notes.
Laudus Rosenberg Value Long/Short Equity Fund |
| Number of | Value |
Security | Shares | ($) |
| | |
G-III Apparel Group Ltd. * | 7,880 | 150,114 |
Interface, Inc., Class A | 16,350 | 261,436 |
Jaclyn, Inc. * | 460 | 5,189 |
LaCrosse Footwear, Inc. * | 2,884 | 44,414 |
Liz Claiborne, Inc. | 23,223 | 995,106 |
Perry Ellis International, Inc. * | 9,631 | 308,096 |
Phillips-Van Heusen Corp. | 47,510 | 2,793,588 |
Polo Ralph Lauren Corp. | 2,310 | 203,626 |
R.G. Barry Corp. * | 310 | 3,230 |
Skechers U.S.A., Inc., Class A * | 14,870 | 499,186 |
Stride Rite Corp. | 18,370 | 282,714 |
The Dixie Group, Inc. * | 5,730 | 68,932 |
The Gymboree Corp. * | 30,377 | 1,217,206 |
Weyco Group, Inc. | 2,423 | 62,950 |
| | 7,095,726 |
Wholesale 2.5% | | |
Anixter International, Inc. * | 100 | 6,594 |
Arrow Electronics, Inc. * | 3,850 | 145,337 |
Avnet, Inc. * | 99,567 | 3,598,351 |
Bell Microproducts, Inc. * | 29,223 | 187,027 |
Brown Shoe Co., Inc. | 16,185 | 679,770 |
Coast Distribution System, Inc. | 1,700 | 13,175 |
Delta Apparel, Inc. | 4,880 | 84,912 |
Educational Development Corp. | 3,300 | 25,773 |
En Pointe Technologies, Inc. * | 2,100 | 7,161 |
Huttig Building Products, Inc. * | 20,400 | 123,420 |
IKON Office Solutions, Inc. | 200 | 2,874 |
Industrial Distribution Group, | | |
Inc. * | 3,810 | 47,587 |
Kaman Corp. | 490 | 11,422 |
Keystone Automotive Industries, | | |
Inc. * | 8,240 | 277,688 |
Lawson Products, Inc. | 800 | 30,304 |
Man Sang Holdings, Inc. * | 2,220 | 13,320 |
NACCO Industries, Inc., Class A | 150 | 20,612 |
Nu Horizons Electronics Corp. * | 18,005 | 189,593 |
| Number of | Value |
Security | Shares | ($) |
| | |
Nu Skin Enterprises, Inc., Class A | 23,729 | 392,003 |
Park-Ohio Holdings Corp. * | 2,677 | 49,524 |
Performance Food Group Co. * | 6,521 | 201,303 |
Richardson Electronics Ltd. | 18,081 | 168,877 |
TESSCO Technologies, Inc. * | 1,245 | 33,852 |
Traffix, Inc. | 565 | 3,130 |
W.W. Grainger, Inc. | 23,600 | 1,822,864 |
| | 8,136,473 |
Total Common Stock (Cost $247,794,675) | | 302,181,168 |
| | |
| | |
| | | |
Security | Face Amount | Value |
Rate, Maturity Date | ($) | ($) |
| | |
Short-Term Investment (a) 5.6% of net assets | |
| | |
Repurchase Agreement 5.6% | | |
Custodian Trust Company, dated | | |
03/30/07, due 4/02/07 at | | |
5.10% with a maturity value of | | |
$18,122,658 (fully collateralized | | |
by U.S. Treasury Bond with a | | |
value of $18,610,050) | 18,114,959 | 18,114,959 |
Total Short-Term Investment | | |
(Cost $18,114,959) | | 18,114,959 |
| | |
End of Investments. | | |
| | |
At 03/31/07 the tax basis cost of the fund’s investments was |
$266,602,429 and the unrealized gains and losses were |
$57,848,904 and ($4,155,206), respectively, with a net unrealized |
appreciation of $53,693,698. | | |
* Non-income producing security. | | |
(a) All long positions are pledged as collateral for securities sold |
short. | | |
See financial notes.
Laudus Funds Annual Report 123
Laudus Rosenberg Value Long/Short Equity Fund |
Portfolio Holdings continued | | |
| | | |
| | Number of | Value |
Security | | Shares | ($) |
| | | |
Short Sales (93.5)% of net assets | | |
| | | |
Agriculture, Food & Beverage 0.6% | | | |
Cagle’s, Inc., Class A * | | 1,760 | 13,024 |
Chiquita Brands International, Inc. | 37,700 | 528,554 |
Cuisine Solutions, Inc. * | | 1,900 | 13,718 |
Del Monte Foods Co. | | 1,620 | 18,598 |
Farmer Brothers Co. | | 7,400 | 167,980 |
McCormick & Co., Inc. | | 700 | 26,964 |
Pilgrim’s Pride Corp., Class B | | 2,380 | 78,992 |
Sanderson Farms, Inc. | | 16,600 | 615,196 |
Tyson Foods, Inc., Class A | | 17,910 | 347,633 |
| | | 1,810,659 |
Airlines 0.3% | | | |
JetBlue Airways Corp. * | | 98,400 | 1,132,584 |
Autos 1.2% | | | |
Accuride Corp. * | | 560 | 8,176 |
Commercial Vehicle Group, Inc. * | 20,825 | 423,045 |
Gentex Corp. | | 120,300 | 1,954,875 |
Proliance International, Inc. * | | 13,000 | 49,140 |
Tenneco, Inc. * | | 38,956 | 991,820 |
Wabash National Corp. | | 27,530 | 424,512 |
| | | 3,851,568 |
Banks & Credit Institutions 6.6% | | | |
Accredited Home Lenders Holding | | |
Co. * | | 21,000 | 194,670 |
Astoria Financial Corp. | | 79,500 | 2,113,905 |
Capitol Federal Financial | | 16,876 | 638,082 |
Cash Systems, Inc. * | | 13,490 | 79,861 |
Centerline Holding Co. * | | 720 | 13,932 |
Citizens Banking Corp. | | 51,853 | 1,149,062 |
Commerce Bancorp, Inc. | | 35,450 | 1,183,321 |
Encore Capital Group, Inc. * | | 2,790 | 27,733 |
Flagstar Bancorp, Inc. | | 560 | 6,692 |
IndyMac Bancorp, Inc. | | 52,000 | 1,666,600 |
Investors Bancorp, Inc. * | | 500 | 7,220 |
Kearny Financial Corp. | | 16,156 | 232,323 |
Municipal Mortgage & Equity, | | | |
L.L.C. | | 25,044 | 713,754 |
Nelnet, Inc., Class A | | 18,900 | 453,033 |
New York Community Bancorp, | | | |
Inc. | | 170,460 | 2,998,391 |
Pacific Capital Bancorp | | 23,243 | 746,565 |
Popular, Inc. | | 145,200 | 2,404,512 |
Southern Community Financial | | | |
Corp. | | 63 | 646 |
Sovereign Bancorp, Inc. | | 125,288 | 3,187,327 |
UCBH Holdings, Inc. | | 122 | 2,272 |
Valley National Bancorp | | 88,310 | 2,229,828 |
Wauwatosa Holdings, Inc. * | | 10,179 | 177,929 |
Webster Financial Corp. | | 23 | 1,104 |
Westamerica Bancorp | | 24,670 | 1,188,354 |
Yardville National Bancorp | | 4,804 | 174,433 |
| | | 21,591,549 |
| | Number of | Value |
Security | | Shares | ($) |
| | | |
Basic Minerals & Metals 1.9% | | |
American Superconductor Corp. * | 11,200 | 150,864 |
Century Aluminum Co. * | | 9,680 | 453,799 |
Dynamic Materials Corp. | | 12,200 | 399,184 |
Lone Star Technologies, Inc. * | 27,400 | 1,809,222 |
Meridian Gold, Inc. * | | 85,200 | 2,175,156 |
Olin Corp. | | 66,910 | 1,133,455 |
Titanium Metals Corp. * | | 721 | 25,876 |
| | | 6,147,556 |
Biotechnology 4.1% | | | |
Alexion Pharmaceuticals, Inc. * | 32,198 | 1,392,242 |
Altus Pharmaceuticals, Inc. * | 7,300 | 111,106 |
ARIAD Pharmaceuticals, Inc. * | 42,200 | 189,478 |
ArQule, Inc. * | | 38,696 | 288,672 |
CV Therapeutics, Inc. * | | 40,000 | 314,800 |
Cypress Bioscience, Inc. * | | 29,387 | 223,341 |
CYTOGEN Corp. * | | 2,393 | 4,978 |
Dyax Corp. * | | 22,556 | 92,931 |
Encysive Pharmaceuticals, Inc. * | 54,364 | 147,326 |
Geron Corp. * | | 43,693 | 305,851 |
Human Genome Sciences, Inc. * | 117,350 | 1,246,257 |
Idenix Pharmaceuticals, Inc. * | 100 | 730 |
ImClone Systems, Inc. * | | 52,763 | 2,151,148 |
Keryx Biopharmaceuticals, Inc. * | 36,770 | 386,820 |
Kosan Biosciences, Inc. * | | 8,170 | 44,935 |
Medarex, Inc. * | | 106,961 | 1,384,075 |
Myriad Genetics, Inc. * | | 34,200 | 1,178,532 |
Neurocrine Biosciences, Inc. * | 35,400 | 442,500 |
Onyx Pharmaceuticals, Inc. * | 27,600 | 685,584 |
Progenics Pharmaceuticals, Inc. * | 9,544 | 226,002 |
Seattle Genetics, Inc. * | | 17,000 | 139,230 |
Vertex Pharmaceuticals, Inc. * | 79,698 | 2,234,732 |
| | | 13,191,270 |
Cellular & Wireless 1.0% | | | |
Centennial Communications | | | |
Corp. * | | 23,600 | 194,228 |
Dobson Communications Corp., | | |
Class A * | | 143,254 | 1,230,552 |
Leap Wireless International, Inc. * | 27,168 | 1,792,544 |
Rural Cellular Corp. * | | 14,600 | 174,616 |
| | | 3,391,940 |
Chemicals & Rubber 0.9% | | | |
American Vanguard Corp. | | 17,600 | 300,784 |
BioSphere Medical, Inc. * | | 19,597 | 144,234 |
Calgon Carbon Corp. * | | 30,500 | 253,455 |
Chemtura Corp. | | 400 | 4,372 |
Georgia Gulf Corp. | | 33,400 | 541,414 |
Hexcel Corp. * | | 84,210 | 1,671,569 |
Valhi, Inc. | | 1,510 | 19,932 |
Westlake Chemical Corp. | | 3,790 | 102,898 |
| | | 3,038,658 |
Commercial Aircraft & Components | 0.0% | |
CPI Aerostructures, Inc. * | | 700 | 4,802 |
Communications Utilities 1.2% | | | |
Crown Media Holdings, Inc., | | |
Class A * | | 4,799 | 25,579 |
EarthLink, Inc. * | | 127,500 | 937,125 |
124 Laudus Funds Annual Report
See financial notes.
Laudus Rosenberg Value Long/Short Equity Fund |
| | Number of | Value |
Security | | Shares | ($) |
| | | |
EchoStar Communications Corp., | | |
Class A * | | 14,735 | 639,941 |
iPCS, Inc. * | | 8,800 | 428,610 |
j2 Global Communications, Inc. * | 7,652 | 212,113 |
SBA Communications Corp., | | |
Class A * | | 17,960 | 530,718 |
Sohu.com, Inc. * | | 20,100 | 430,743 |
Virgin Media, Inc. | | 20,897 | 527,649 |
Windstream Corp. | | 8,540 | 125,453 |
| | | 3,857,931 |
Construction & Homebuilding 2.4% | | |
California Coastal Communities, | | |
Inc. * | | 1,476 | 29,948 |
Centex Corp. | | 49,634 | 2,073,709 |
KB Home | | 53,500 | 2,282,845 |
M.D.C. Holdings, Inc. | | 31,810 | 1,529,107 |
Pulte Homes, Inc. | | 28,888 | 764,376 |
Sterling Construction Co., Inc. * | 1,500 | 28,590 |
The Ryland Group, Inc. | | 14,970 | 631,584 |
Toll Brothers, Inc. * | | 20,600 | 564,028 |
| | | 7,904,187 |
Construction Materials 0.3% | | | |
Headwaters, Inc. * | | 40,600 | 887,110 |
Nanophase Technologies Corp. * | 7,600 | 44,612 |
| | | 931,722 |
Consumer Durables 0.9% | | |
Brunswick Corp. | | 78,000 | 2,484,300 |
Fleetwood Enterprises, Inc. * | 62,700 | 495,957 |
Marine Products Corp. | | 3,820 | 36,557 |
| | | 3,016,814 |
Drugs & Pharmaceuticals 2.3% | | |
Adams Respiratory Therapeutics, | | |
Inc. * | | 23,800 | 800,394 |
Adolor Corp. * | | 23,500 | 205,625 |
Alkermes, Inc. * | | 9,060 | 139,886 |
Amylin Pharmaceuticals, Inc. * | 49,000 | 1,830,640 |
Atherogenics, Inc. * | | 7,800 | 21,918 |
Bioenvision, Inc. * | | 29,700 | 121,473 |
Cytokinetics, Inc. * | | 42 | 292 |
Dendreon Corp. (b) * | | 19,600 | 253,428 |
DepoMed, Inc. * | | 100 | 357 |
Enzon Pharmaceuticals, Inc. * | 41,310 | 336,677 |
Indevus Pharmaceuticals, Inc. * | 1,800 | 12,726 |
Inspire Pharmaceuticals, Inc. * | 16,700 | 95,190 |
Isis Pharmaceuticals, Inc. * | 27,176 | 251,922 |
Martek Biosciences Corp. * | 8,370 | 172,589 |
Metabasis Therapeutics, Inc. * | 19,960 | 146,706 |
MGI Pharma, Inc. * | | 1,513 | 33,997 |
Nektar Therapeutics * | | 4,618 | 60,311 |
Neurogen Corp. * | | 10,560 | 68,640 |
NitroMed, Inc. * | | 5,700 | 17,784 |
NPS Pharmaceuticals, Inc. * | 25,300 | 85,767 |
Panacos Pharmaceuticals, Inc. * | 2,000 | 9,260 |
PDL BioPharma, Inc. * | | 2,200 | 47,740 |
Penwest Pharmaceuticals Co. * | 16,735 | 168,689 |
Pharmion Corp. * | | 16,071 | 422,507 |
Repros Therapeutics, Inc. * | 8,500 | 81,023 |
| | | Number of | Value |
Security | | | Shares | ($) |
| | | | |
Rigel Pharmaceuticals, Inc. * | | | 19,899 | 216,103 |
ViroPharma, Inc. * | | | 61,321 | 879,956 |
Xenoport, Inc. * | | | 18,059 | 503,124 |
ZymoGenetics, Inc. * | | | 31,927 | 496,784 |
| | | | 7,481,508 |
Electric Utilities 0.3% | | | | |
Dynegy, Inc., Class A * | | | 110,620 | 1,024,341 |
Environmental Power Corp. * | | | 9,380 | 65,660 |
| | | | 1,090,001 |
Financial Investments 0.7% | | | | |
InterDigital Communications | | | | |
Corp. * | | | 45,455 | 1,439,560 |
Marlin Business Services, Inc. * | | 292 | 6,389 |
Mitcham Industries, Inc. * | | | 9,595 | 140,567 |
Williams Scotsman International, | | | |
Inc. * | | | 29,100 | 572,106 |
Winmark Corp. * | | | 116 | 2,320 |
| | | | 2,160,942 |
Forest Products & Paper 2.1% | | | |
Deltic Timber Corp. | | | 9,190 | 440,752 |
Louisiana-Pacific Corp. | | | 94,620 | 1,898,077 |
Pope & Talbot, Inc. * | | | 4,670 | 31,523 |
Rayonier, Inc. | | | 58,290 | 2,506,470 |
Smurfit-Stone Container Corp. * | | 164,428 | 1,851,459 |
| | | | 6,728,281 |
Furniture & Household Items 1.5% | | | |
Bally Technologies, Inc. * | | | 46,400 | 1,094,112 |
Fiberstars, Inc. * | | | 12,600 | 71,190 |
Kinetic Concepts, Inc. * | | | 20,933 | 1,060,047 |
Newell Rubbermaid, Inc. | | | 68,214 | 2,120,773 |
Omnova Solutions, Inc. * | | | 9,230 | 50,570 |
Progressive Gaming International | | | |
Corp. * | | | 30,400 | 136,800 |
Russ Berrie and Co., Inc. * | | | 10,730 | 151,293 |
Sealy Corp. | | | 3,900 | 68,172 |
| | | | 4,752,957 |
Gas & Other Public Utilities 0.1% | | | |
American Ecology Corp. | | | 10,102 | 194,060 |
Cadiz, Inc. * | | | 410 | 10,509 |
TRC Cos., Inc. * | | | 1,480 | 14,933 |
| | | | 219,502 |
Government Aircraft & Defense 0.0% | | |
Innovative Solutions & Support, | | | |
Inc. * | | | 2,846 | 72,061 |
Health Care & Hospital 0.9% | | | | |
Advocat, Inc. * | | | 5,060 | 64,193 |
Array BioPharma, Inc. * | | | 38,000 | 482,600 |
Enzo Biochem, Inc. * | | | 23,600 | 355,888 |
Health Management Associates, | | | |
Inc., Class A | | | 67,142 | 729,833 |
HealthTronics, Inc. * | | | 10,500 | 56,213 |
Nighthawk Radiology Holdings, | | | |
Inc. * | | | 7,000 | 127,330 |
See financial notes.
Laudus Funds Annual Report 125
Laudus Rosenberg Value Long/Short Equity Fund |
Portfolio Holdings continued | | |
| | | |
| | Number of | Value |
Security | | Shares | ($) |
| | | |
Psychiatric Solutions, Inc. * | 15,776 | 635,931 |
Tenet Healthcare Corp. * | | 81,700 | 525,331 |
VistaCare, Inc., Class A * | | 7,500 | 65,250 |
| | | 3,042,569 |
Information & Services 5.3% | | | |
Arbinet-thexchange, Inc. * | 2,900 | 18,328 |
Arena Pharmaceuticals, Inc. * | 58,700 | 637,482 |
Asset Acceptance Capital Corp. * | 2,360 | 36,509 |
BearingPoint, Inc. * | | 173,850 | 1,331,691 |
Career Education Corp. * | | 86,600 | 2,641,300 |
ChoicePoint, Inc. * | | 50,300 | 1,882,729 |
Corinthian Colleges, Inc. * | 60,548 | 832,535 |
deCODE genetics, Inc. * | | 43,200 | 157,680 |
DynCorp International, Inc., | | |
Class A * | | 1,310 | 19,768 |
Emeritus Corp. * | | 5,160 | 174,150 |
Euronet Worldwide, Inc. * | 24,601 | 660,783 |
Evergreen Energy, Inc. * | | 50,860 | 334,150 |
Exelixis, Inc. * | | 83,970 | 834,662 |
Global Cash Access Holdings, | | |
Inc. * | | 39,130 | 653,080 |
Iron Mountain, Inc. * | | 37,695 | 984,970 |
Jupitermedia Corp. * | | 19,300 | 127,766 |
Maxygen, Inc. * | | 27,910 | 311,197 |
Nuvelo, Inc. * | | 46,200 | 170,016 |
PeopleSupport, Inc. * | | 4,858 | 55,624 |
Rentech, Inc. * | | 77,700 | 243,978 |
Senomyx, Inc. * | | 18,750 | 232,125 |
Strayer Education, Inc. | | 10,732 | 1,341,500 |
Syntroleum Corp. * | | 11,500 | 35,880 |
The Advisory Board Co. * | | 16,900 | 855,478 |
The Corporate Executive Board | | |
Co. | | 27,500 | 2,088,900 |
Universal Technical Institute, Inc. * | 21,300 | 491,604 |
UTI Worldwide, Inc. | | 6,400 | 157,312 |
| | | 17,311,197 |
Instruments 4.1% | | | |
ATS Medical, Inc. * | | 500 | 1,030 |
Bausch & Lomb, Inc. | | 38,720 | 1,980,915 |
Caliper Life Sciences, Inc. * | 2,700 | 15,255 |
Cantel Medical Corp. * | | 10,490 | 161,441 |
CAS Medical Systems, Inc. * | 900 | 6,300 |
Cepheid, Inc. * | | 51,709 | 614,303 |
Clinical Data, Inc. * | | 81 | 1,681 |
Cyberonics, Inc. * | | 17,700 | 332,406 |
Daxor Corp. * | | 200 | 2,650 |
Dexcom, Inc. * | | 16,849 | 132,433 |
Endologix, Inc. * | | 28,030 | 110,158 |
I-Flow Corp. * | | 22,151 | 326,506 |
Intuitive Surgical, Inc. * | | 24,700 | 3,002,779 |
LoJack Corp. * | | 19,900 | 377,702 |
Luminex Corp. * | | 19,070 | 261,640 |
Measurement Specialties, Inc. * | 13,493 | 304,402 |
Mentor Corp. | | 33,200 | 1,527,200 |
Millipore Corp. * | | 38,400 | 2,782,848 |
NMT Medical, Inc. * | | 8,260 | 112,336 |
OraSure Technologies, Inc. * | 47,500 | 349,125 |
Photon Dynamics, Inc. * | | 18,500 | 233,285 |
RAE Systems, Inc. * | | 9,600 | 27,552 |
Regeneration Technologies, Inc. * | 30,559 | 221,553 |
| Number of | Value |
Security | Shares | ($) |
| | |
STAAR Surgical Co. * | 8,486 | 46,758 |
Synergetics USA, Inc. * | 7,510 | 26,886 |
ThermoGenesis Corp. * | 28,700 | 104,468 |
Varian Medical Systems, Inc. * | 2,700 | 128,763 |
Vnus Medical Technologies * | 15,800 | 158,316 |
| | 13,350,691 |
Insurance 2.3% | | |
Brown & Brown, Inc. | 91,300 | 2,469,665 |
First Acceptance Corp. * | 17,940 | 187,832 |
United Fire & Casualty Co. | 117 | 4,110 |
White Mountains Insurance Group | | |
Ltd. | 3,811 | 2,158,932 |
Willis Group Holdings Ltd. | 64,990 | 2,572,304 |
| | 7,392,843 |
IT Hardware 7.2% | | |
ADTRAN, Inc. | 53,875 | 1,311,856 |
Advanced Micro Devices, Inc. * | 95,020 | 1,240,961 |
Altera Corp. * | 142,166 | 2,841,898 |
Bookham, Inc. * | 25,300 | 57,431 |
California Micro Devices Corp. * | 210 | 983 |
Carrier Access Corp. * | 14,785 | 75,551 |
Comarco, Inc. * | 7,730 | 70,343 |
DDi Corp. * | 19,068 | 130,425 |
EFJ, Inc. * | 17,500 | 93,450 |
Energy Conversion Devices, Inc. * | 30,600 | 1,069,164 |
Foundry Networks, Inc. * | 110,656 | 1,501,602 |
Ikanos Communications, Inc. * | 20,600 | 160,062 |
Intervoice, Inc. * | 38,200 | 253,648 |
Itron, Inc. * | 22,490 | 1,462,750 |
IXYS Corp. * | 27,504 | 281,366 |
KLA-Tencor Corp. | 30,700 | 1,636,924 |
Kulicke and Soffa Industries, Inc. * | 52,049 | 481,453 |
Leadis Technology, Inc. * | 13,400 | 53,600 |
Metalink Ltd. * | 2,600 | 17,524 |
Microchip Technology, Inc. | 49,091 | 1,744,203 |
Nam Tai Electronics, Inc. | 22,494 | 291,297 |
Nanometrics, Inc. * | 17,985 | 120,500 |
National Semiconductor Corp. | 6,790 | 163,911 |
Netlogic Microsystems, Inc. * | 100 | 2,662 |
Novatel Wireless, Inc. * | 2,813 | 45,121 |
O2Micro International Ltd. — | | |
ADR * | 26,910 | 212,589 |
OmniVision Technologies, Inc. * | 33,300 | 431,568 |
Plexus Corp. * | 44,600 | 764,890 |
Power-One, Inc. * | 68,360 | 391,019 |
Powerwave Technologies, Inc. * | 80,000 | 455,200 |
Rackable Systems, Inc. * | 26,829 | 455,288 |
Rambus, Inc. * | 81,915 | 1,740,694 |
RELM Wireless Corp. * | 360 | 1,440 |
Sigmatel, Inc. * | 31,300 | 98,282 |
Silicon Laboratories, Inc. * | 10,600 | 317,152 |
Sparton Corp. * | 1,000 | 8,160 |
Staktek Holdings, Inc. * | 16,070 | 52,228 |
Synaptics, Inc. * | 22,780 | 582,712 |
Teradyne, Inc. * | 156,400 | 2,586,856 |
Universal Display Corp. * | 4,800 | 72,432 |
Virage Logic Corp. * | 10,521 | 76,488 |
Vyyo, Inc. * | 6,500 | 53,365 |
Xilinx, Inc. | 1,940 | 49,916 |
| | 23,458,964 |
126 Laudus Funds Annual Report
See financial notes.
Laudus Rosenberg Value Long/Short Equity Fund |
| | | Number of | Value |
Security | | | Shares | ($) |
| | | | |
Land & Water Transportation 2.2% | | | |
Arkansas Best Corp. | | | 1,780 | 63,279 |
Con-way, Inc. | | | 40,800 | 2,033,472 |
Forward Air Corp. | | | 12,800 | 420,864 |
Genesee & Wyoming, Inc., | | | |
Class A * | | | 34,600 | 920,706 |
Heartland Express, Inc. | | | 43,995 | 698,641 |
Landstar System, Inc. | | | 1,617 | 74,123 |
Marten Transport Ltd. * | | | 1,500 | 23,820 |
Quality Distribution, Inc. * | | 9,332 | 80,722 |
Rural/Metro Corp. * | | | 23,200 | 175,160 |
Sirva, Inc. * | | | 23,300 | 83,181 |
The Greenbrier Cos., Inc. | | | 11,380 | 303,846 |
Trailer Bridge, Inc. * | | | 12,900 | 113,391 |
USA Truck, Inc. * | | | 6,283 | 97,638 |
YRC Worldwide, Inc. * | | | 51,402 | 2,067,388 |
| | | | 7,156,231 |
Mainframe & Minicomputers 0.5% | | | |
Palm, Inc. * | | | 88,500 | 1,604,505 |
Metal Products & Machinery 4.4% | | | |
Actuant Corp., Class A | | | 26,600 | 1,351,546 |
Blount International, Inc. * | | 35,340 | 439,983 |
Briggs & Stratton Corp. | | | 44,950 | 1,386,707 |
Bucyrus International, Inc., Class A | 206 | 10,609 |
Columbus McKinnon Corp. * | | 17,300 | 387,347 |
Drew Industries, Inc. * | | | 12,900 | 369,972 |
Environmental Tectonics Corp. * | 5,200 | 19,968 |
Flow International Corp. * | | 6,196 | 66,545 |
Freightcar America, Inc. | | | 11,200 | 539,504 |
Joy Global, Inc. | | | 42,642 | 1,829,342 |
Omega Flex, Inc. * | | | 1,810 | 40,852 |
Pentair, Inc. | | | 72,900 | 2,271,564 |
Plug Power, Inc. * | | | 36,700 | 115,972 |
The Black & Decker Corp. | | 33,800 | 2,758,756 |
Ultralife Batteries, Inc. * | | | 12,800 | 138,240 |
Zebra Technologies Corp., | | | |
Class A * | | | 64,000 | 2,471,040 |
| | | | 14,197,947 |
Miscellaneous Finance 2.4% | | | | |
Calamos Asset Management, Inc., | | |
Class A | | | 20,963 | 467,894 |
E*TRADE Financial Corp. * | | 92,728 | 1,967,688 |
GAMCO Investors, Inc., Class A | 90 | 3,900 |
Jefferies Group, Inc. | | | 88,790 | 2,570,471 |
Nasdaq Stock Market, Inc. * | | 70,906 | 2,085,345 |
optionsXpress Holdings, Inc. | | 1,865 | 43,902 |
Sanders Morris Harris Group, Inc. | 13,300 | 141,645 |
Stifel Financial Corp. * | | | 70 | 3,101 |
Thomas Weisel Partners Group,Inc. * | | | 7,400 | 140,748 |
W.P. Stewart & Co., Ltd. | | | 45,400 | 457,178 |
| | | | 7,881,872 |
Oil & Coal Resources 2.9% | | | |
Atlas America, Inc. * | | | 7,595 | 429,042 |
Carrizo Oil & Gas, Inc. * | | | 3,092 | 108,096 |
Clayton Williams Energy, Inc. * | | 5,627 | 159,638 |
CREDO Petroleum Corp. * | | 160 | 2,181 |
| Number of | Value |
Security | Shares | ($) |
| | |
Delta Petroleum Corp. * | 48,000 | 1,102,080 |
Double Eagle Petroleum Co. * | 3,900 | 70,239 |
Edge Petroleum Corp. * | 18,600 | 232,872 |
Encore Acquisition Co. * | 30,521 | 738,303 |
Foundation Coal Holdings, Inc. | 8,040 | 276,094 |
FX Energy, Inc. * | 35,300 | 267,574 |
Infinity Energy Resources, Inc. * | 350 | 1,186 |
Massey Energy Co. | 17,300 | 415,027 |
Pogo Producing Co. | 51,600 | 2,481,960 |
Quicksilver Resources, Inc. * | 44,300 | 1,761,811 |
Southwestern Energy Co. * | 19,700 | 807,306 |
Warren Resources, Inc. * | 42,646 | 555,677 |
| | 9,409,086 |
Oil Distribution 1.3% | | |
Alon USA Energy, Inc. | 1,855 | 67,151 |
Cheniere Energy, Inc. * | 42,400 | 1,320,760 |
Kinder Morgan Management, | | |
LLC * | 55,218 | 2,829,370 |
| | 4,217,281 |
Oil Drilling & Services 0.8% | | |
Parker Drilling Co. * | 2,130 | 20,001 |
Patterson-UTI Energy, Inc. | 106,587 | 2,391,812 |
TGC Industries, Inc. * | 17,100 | 147,231 |
| | 2,559,044 |
Photo-optical, Micros & Office Machinery 0.6% | |
Ampex Corp., Class A * | 580 | 11,467 |
Avid Technology, Inc. * | 23,600 | 823,168 |
Dot Hill Systems Corp. * | 6,120 | 22,338 |
Echelon Corp. * | 24,800 | 261,392 |
FalconStor Software, Inc. * | 139 | 1,448 |
Immersion Corp. * | 25,550 | 230,461 |
Intermec, Inc. * | 4,910 | 109,689 |
Lexmark International, Inc., | | |
Class A * | 5,770 | 337,314 |
Mobility Electronics, Inc. * | 20,500 | 63,755 |
X-Rite, Inc. | 7,890 | 102,176 |
| | 1,963,208 |
Publishing, Broadcasting & Cinema | 3.0% | |
Acco Brands Corp. * | 6,640 | 159,958 |
Central European Media | | |
Enterprises Ltd., Class A * | 339 | 30,001 |
CKX, Inc. * | 20,900 | 231,990 |
DreamWorks Animation SKG, Inc.,Class A * | 10,232 | 312,895 |
Nexstar Broadcasting Group, Inc., | | |
Class A * | 10,262 | 98,618 |
R.H. Donnelley Corp. * | 40,050 | 2,839,144 |
Sun-Times Media Group, Inc., | | |
Class A | 41,418 | 205,433 |
The Interpublic Group of Cos., | | |
Inc. * | 189,280 | 2,330,037 |
The New York Times Co., Class A | 61,000 | 1,434,110 |
XM Satellite Radio Holdings, Inc., | | |
Class A * | 156,034 | 2,015,959 |
Young Broadcasting, Inc., Class A * | 3,146 | 12,710 |
See financial notes.
Laudus Funds Annual Report 127
Laudus Rosenberg Value Long/Short Equity Fund |
Portfolio Holdings continued | | |
| | |
| Number of | Value |
Security | Shares | ($) |
| | |
Real Estate Development 0.5% | | |
Consolidated-Tomoka Land Co. | 5,500 | 414,975 |
Forest City Enterprises, Inc., | | |
Class A | 11,780 | 779,600 |
Levitt Corp., Class A | 16,800 | 156,408 |
Tejon Ranch Co. * | 4,700 | 222,310 |
The St. Joe Co. | 1,000 | 52,310 |
| | 1,625,603 |
Real Estate Investment Trusts 8.2% | | |
Alexandria Real Estate Equities,Inc. | 8,480 | 851,137 |
AMB Property Corp. | 14,200 | 834,818 |
Apartment Investment &Management Co., Class A | 27,949 | 1,612,378 |
BRE Properties, Class A | 39,709 | 2,507,623 |
Camden Property Trust | 36,240 | 2,548,034 |
Developers Diversified Realty Corp. | 48,850 | 3,072,665 |
EastGroup Properties, Inc. | 1,960 | 100,019 |
Essex Property Trust, Inc. | 86 | 11,135 |
FelCor Lodging Trust, Inc. | 8,230 | 213,733 |
First Industrial Realty Trust, Inc. | 13,443 | 608,968 |
General Growth Properties, Inc. | 840 | 54,239 |
Glimcher Realty Trust | 32,440 | 876,529 |
Kilroy Realty Corp. | 25,580 | 1,886,525 |
Plum Creek Timber Co., Inc. | 74,800 | 2,948,616 |
Regency Centers Corp. | 32,000 | 2,673,600 |
UDR, Inc. | 86,114 | 2,636,811 |
Ventas, Inc. | 51,600 | 2,173,908 |
Washington Real Estate Investment Trust | 31,100 | 1,163,762 |
| | 26,774,500 |
Restaurants, Hotels & Theaters | 3.1% | |
AMERCO * | 9,141 | 639,779 |
Applebee’s International, Inc. | 94 | 2,329 |
Boyd Gaming Corp. | 17,230 | 820,837 |
Buca, Inc. * | 12,779 | 70,284 |
Isle of Capri Casinos, Inc. * | 15,880 | 406,846 |
Magna Entertainment Corp.,Class A * | 15,200 | 55,328 |
MoneyGram International, Inc. | 74,095 | 2,056,877 |
Nevada Gold & Casinos, Inc. * | 11,200 | 22,512 |
P.F. Chang’s China Bistro, Inc. * | 15,300 | 640,764 |
Peet’s Coffee & Tea, Inc. * | 8,570 | 236,703 |
Red Robin Gourmet Burgers, Inc. * | 10,556 | 409,784 |
Regal Entertainment Group,Class A | 60,450 | 1,201,142 |
Ruth’s Chris Steak House, Inc. * | 5,900 | 120,124 |
Scientific Games, Corp., Class A * | 63,200 | 2,074,856 |
Six Flags, Inc. * | 45,170 | 271,472 |
Texas Roadhouse, Inc., Class A * | 13,918 | 198,331 |
The Cheesecake Factory, Inc. * | 20,381 | 543,154 |
Triarc Cos., Inc., Class B | 12,140 | 208,687 |
Westwood One, Inc. | 8,630 | 59,288 |
| | 10,039,097 |
Retail 5.0% | | |
99 Cents Only Stores * | 37,610 | 553,995 |
Advance Auto Parts, Inc. | 200 | 7,710 |
Amazon.com, Inc. * | 69,000 | 2,745,510 |
| Number of | Value |
Security | Shares | ($) |
| | |
Borders Group, Inc. | 56,400 | 1,151,688 |
Celebrate Express, Inc. * | 5,900 | 52,333 |
Chico’s FAS, Inc. * | 12,800 | 312,704 |
Design Within Reach, Inc. * | 5,000 | 28,700 |
Dollar General Corp. | 27,000 | 571,050 |
Guitar Center, Inc. * | 7,400 | 333,888 |
MarineMax, Inc. * | 800 | 18,532 |
New York & Co., Inc. * | 8,800 | 138,952 |
Pacific Sunwear of California, Inc. * | 65,200 | 1,358,116 |
PetMed Express, Inc. * | 18,600 | 220,410 |
Pier 1 Imports, Inc. | 84,600 | 584,586 |
The Finish Line, Inc., Class A | 38,400 | 483,840 |
The Pantry, Inc. * | 21,700 | 981,274 |
The Pep Boys-Manny, Moe & Jack | 51,800 | 988,862 |
Tiffany & Co. | 48,621 | 2,211,283 |
Tractor Supply Co. * | 9,500 | 489,250 |
United Retail Group, Inc. * | 14,100 | 169,482 |
Urban Outfitters, Inc. * | 91,100 | 2,415,061 |
Whole Foods Market, Inc. | 5,974 | 267,934 |
| | 16,085,160 |
Software 7.0% | | |
Accelrys, Inc. * | 1,710 | 10,910 |
Activision, Inc. * | 161,640 | 3,061,462 |
Affiliated Computer Services, Inc.,Class A * | 2,600 | 153,088 |
Aptimus, Inc. * | 5,800 | 19,720 |
Astea International, Inc. * | 1,500 | 8,370 |
Autodesk, Inc. * | 65,305 | 2,455,468 |
Blackboard, Inc. * | 754 | 25,357 |
Citrix Systems, Inc. * | 180 | 5,765 |
Cogent, Inc. * | 34,380 | 462,411 |
Computer Programs and Systems,Inc. | 9,100 | 244,062 |
Concur Technologies, Inc. * | 31,700 | 553,482 |
Emageon, Inc. * | 14,000 | 154,000 |
eResearch Technology, Inc. * | 33,400 | 262,524 |
Global Payments, Inc. | 8,400 | 286,104 |
Internet Capital Group, Inc. * | 3,640 | 38,948 |
Kronos, Inc. * | 28,080 | 1,502,280 |
Mercury Computer Systems, Inc. * | 17,300 | 239,951 |
NAVTEQ Corp. * | 74,600 | 2,573,700 |
Net 1 UEPS Technologies, Inc. * | 45,179 | 1,124,053 |
Online Resources Corp. * | 2,467 | 28,296 |
Opsware, Inc. * | 3,300 | 23,925 |
PlanetOut, Inc. * | 14,500 | 49,300 |
Q-Med, Inc. * | 15,286 | 67,717 |
Red Hat, Inc. * | 6,020 | 138,039 |
RightNow Technologies, Inc. * | 15,390 | 252,088 |
Salesforce.com, Inc. * | 30,230 | 1,294,449 |
SM&A * | 1,329 | 9,436 |
SRA International, Inc., Class A * | 24,500 | 596,820 |
Streamline Health Solutions * | 10,100 | 42,622 |
SupportSoft, Inc. * | 12,600 | 71,064 |
Take-Two Interactive Software,Inc. * | 61,500 | 1,238,610 |
The BISYS Group, Inc. * | 105,761 | 1,212,021 |
Transaction Systems Architects,Inc. * | 36,400 | 1,178,996 |
Unisys Corp. * | 273 | 2,301 |
VeriSign, Inc. * | 115,907 | 2,911,584 |
128 Laudus Funds Annual Report
See financial notes.
Laudus Rosenberg Value Long/Short Equity Fund |
| | Number of | Value |
Security | | Shares | ($) |
| | | |
Visicu, Inc. * | | 7,800 | 60,840 |
Websense, Inc. * | | 9,510 | 218,635 |
WebSideStory, Inc. * | 17,800 | 230,510 |
| | | 22,808,908 |
Textiles & Apparel 1.1% | | | |
Ashworth, Inc. * | | 14,494 | 109,720 |
K-Swiss, Inc., Class A | 24,100 | 651,182 |
Phoenix Footwear Group, Inc. * | 1,780 | 8,099 |
The Timberland Co., Class A * | 47,800 | 1,244,234 |
Under Armour, Inc. * | 19,400 | 995,220 |
Volcom, Inc. * | | 11,756 | 403,936 |
| | | 3,412,391 |
Wholesale 2.3% | | | |
BlueLinx Holdings, Inc. | 10,800 | 113,312 |
Brightpoint, Inc. * | | 49,100 | 561,704 |
Central European Distribution | | |
Corp. * | | 28,700 | 835,457 |
| Number of | Value |
Security | Shares | ($) |
| | |
H&E Equipment Services, Inc. * | 12,000 | 258,000 |
Lazare Kaplan International, Inc. * | 8,740 | 70,444 |
Nash Finch Co. | 12 | 413 |
Owens & Minor, Inc. | 990 | 36,363 |
Patterson Cos., Inc. * | 71,100 | 2,523,339 |
UAP Holding Corp. | 33,679 | 870,602 |
WESCO International, Inc. * | 36,360 | 2,282,681 |
| | 7,552,315 |
Total Short Sales | | |
(Proceeds $305,578,183) | | 303,890,759 |
| | |
End of short sale positions. | | |
* Non-income producing security. | | |
(b) Fair-valued by Management. | | |
ADR — American Depositary Receipt | | |
See financial notes.
Laudus Funds Annual Report 129
Financial Statements
Statement of Assets and Liabilities as of 3/31/07
| Laudus Rosenberg | Laudus Rosenberg | Laudus Rosenberg |
| U.S. Large | U.S. Large | U.S. Large |
| Capitalization | Capitalization | Capitalization |
| Fund | Growth Fund | Value Fund |
Assets: | | | | | | |
Total investments, at cost1 | $92,244,139 | $69,070,731 | $5,574,417 |
Investments, at value1 | $104,326,475 | $77,114,283 | $6,576,131 |
Repurchase agreements, at amortized cost | | 40,000 | | — | | — |
Total Investments | 104,366,475 | 77,114,283 | 6,576,131 |
Deposits with broker and custodian bank for securities sold | — | | — | | — |
short | | | | | |
Collateral invested for securities on loan | | — | | 6,243,025 | | — |
Cash | | 3,767 | | — | | — |
Foreign currency, at value2 | | — | | — | | — |
Unrealized gain on foreign currency contracts | | — | | — | | — |
Dividends and interest receivable | | 91,651 | | 68,376 | | 8,973 |
Receivable for fund shares sold | | 68,267 | | 86,600 | | 1,989 |
Receivable for securities sold short | | — | | — | | — |
Receivable for investments sold | 1,605,088 | 2,486,146 | 1,629,254 |
Reclaims receivable | | — | | — | | — |
Receivable from Adviser | | — | | — | | 9,423 |
Prepaid expenses | | 5,509 | | 3,271 | | 418 |
Total Assets | 106,140,757 | 86,001,701 | 8,226,188 |
Liabilities: | | | | | | |
Securities sold short, proceeds | $ | — | $ | — | $ | — |
Securities sold short | | — | | — | | — |
Unrealized loss on foreign currency contracts | | — | | — | | — |
Payable to custodian | | — | | 1,229,310 | 1,557,904 |
Payable for fund shares redeemed | | 21,733 | | 35,750 | | — |
Payable for cover securities sold short | | — | | — | | — |
Payable for investments purchased | | 999,755 | | 678,439 | | 48,437 |
Collateral held for securities on loan | | — | | 6,243,025 | | — |
Accrued expenses and other liabilities: | | | | | | |
Trustees’ retirement plan | | 4,728 | | 1,237 | | 157 |
Dividends payable on securities sold short | | — | | — | | — |
Adviser fees | | 74,236 | | 48,880 | | — |
Transfer agent fees | | 1,510 | | 1,305 | | 1,277 |
Distribution and shareholder service fees | | 2,982 | | 560 | | 108 |
Trustees’ fees | | 810 | | 439 | | 570 |
Administration and fund accounting fee | | 4,731 | | 3,624 | | 3,091 |
Other accrued expenses | | 35,725 | | 36,274 | | 15,895 |
Total Liabilities | 1,146,210 | | 8,278,843 | 1,627,439 |
Net Assets | $104,994,547 | $77,722,858 | $6,598,749 |
Net Assets Consist of: | | | | | | |
Capital | $86,887,795 | $71,710,252 | $5,056,253 |
Undistributed net investment income/(loss)* | | 163,419 | | 61,427 | | 20,127 |
Accumulated net realized gains/(losses) on investments | 5,820,997 | (2,092,373) | | 520,655 |
Net unrealized appreciation/(depreciation) on investments | 12,122,336 | | 8,043,552 | 1,001,714 |
Net Assets | $104,994,547 | $77,722,858 | $6,598,749 |
Institutional Shares: | | | | | | |
Net Assets | $94,921,017 | $75,481,115 | $6,058,297 |
Shares Outstanding | 7,187,870 | | 7,729,953 | | 475,434 |
Net Asset Value, Offering Price and Redemption Price per | $13.21 | $9.76 | $12.74 |
Share | | | |
Adviser Shares: | | | | | | |
Net Assets | $ | — | $ | — | $ | — |
Shares Outstanding | | — | | — | | — |
Net Asset Value, Offering Price and Redemption Price per | $— | $— | $— |
Share | | | |
Investor Shares: | | | | | | |
Net Assets | $10,073,530 | $ | 2,241,743 | $ | 540,452 |
Shares Outstanding | | 762,330 | | 228,090 | | 42,557 |
Net Asset Value, Offering Price and Redemption Price per | $ | 13.21 | $ | 9.83 | $ | 12.70 |
Share | | | | | | |
1 Includes securities on loan for Laudus Rosenberg U.S. Large Capitalization Growth Fund, Laudus Rosenberg U.S. Discovery Fund, Laudus Rosenberg U.S. Small Capitalization Fund and Laudus Rosenberg International Small Capitalization Fund of $6,102,606, $70,971,484, $88,385,432 and $139,234,977 respectively.
2 Foreign currency at cost for Laudus Rosenberg International Equity Fund, Laudus Rosenberg International Discovery Fund, Laudus Rosenberg International Small Capitalization Fund, and Laudus Rosenberg Global Long/Short Equity Fund was $1,110,333, $1,137,755, $13,156,595, and $5,030,634, respectively.
130 Laudus Funds Annual Report
See the accompanying notes to the financial statements.
Financial Statements—Statement of Assets and Liabilities continued
| | Laudus Rosenberg | | | | |
Laudus Rosenberg | U.S. Small | Laudus Rosenberg | Laudus Rosenberg |
U.S. Discovery | Capitalization | International | International |
Fund | Fund | Equity Fund | Discovery Fund |
| | | | | | | |
| $768,555,449 | | $768,397,335 | $107,410,263 | $61,530,505 |
| $928,439,355 | $1,010,613,511 | $127,031,334 | $68,779,730 |
| 7,521,000 | | 501,000 | | — | | 983,000 |
| 935,960,355 | 1,011,114,511 | 127,031,334 | 69,762,730 |
| — | | — | | — | | — |
| 72,805,635 | | 90,803,224 | | — | | — |
| 1,156,595 | | 946 | | — | | 3,665 |
| — | | — | | 1,112,978 | | 1,139,637 |
| — | | — | | — | | — |
| 813,622 | | 1,049,340 | | 579,658 | | 239,979 |
| 1,080,632 | | 1,755,383 | | 351,829 | | 118,010 |
| — | | — | | — | | — |
| 7,649,034 | | 16,062,374 | | 6,414,290 | | 864,631 |
| — | | — | | 22,810 | | 4,432 |
| — | | — | | — | | — |
| 50,946 | | 62,319 | | 5,873 | | 2,195 |
1,019,516,819 | 1,120,848,097 | 135,518,772 | 72,135,279 |
| $— | | $— | $ | — | $ | — |
| — | | — | | — | | — |
| — | | — | | 2,517 | | — |
| — | | — | | 5,057,050 | | — |
| 340,033 | | 947,939 | | 989 | | 37,837 |
| — | | — | | — | | — |
| 10,179,892 | | 9,798,597 | | 464,793 | | 1,289,285 |
| 72,805,635 | | 90,803,224 | | — | | — |
| | | | | | | |
| 38,727 | | 117,362 | | 3,214 | | 395 |
| — | | — | | — | | — |
| 710,939 | | 806,596 | | 125,947 | | 36,071 |
| 6,129 | | 6,541 | | 1,469 | | 1,342 |
| 85,356 | | 162,926 | | 18,368 | | 10,758 |
| 1,034 | | 1,305 | | 623 | | 579 |
| 7,009 | | 7,483 | | 6,309 | | 5,939 |
| 112,156 | | 166,483 | | 28,439 | | 8,475 |
| 84,286,910 | | 102,818,456 | | 5,709,718 | | 1,390,681 |
| $935,229,909 | $1,018,029,641 | $129,809,054 | $70,744,598 |
| | | | | | | |
| $749,201,862 | | $720,292,467 | $105,155,093 | $59,702,610 |
| (24,032) | | (57,016) | | 327,367 | | 245,660 |
| 18,647,173 | | 55,077,014 | | 4,699,984 | | 2,560,867 |
| 167,404,906 | | 242,717,176 | | 19,626,610 | | 8,235,461 |
| $935,229,909 | $1,018,029,641 | $129,809,054 | $70,744,598 |
| | | | | | | |
| $718,185,259 | | $699,920,974 | $ | 68,398,249 | $19,173,027 |
| 36,264,729 | | 55,689,888 | | 5,036,378 | | 1,591,624 |
| $19.80 | | $12.57 | $ | 13.58 | $ | 12.05 |
| | | | | | | |
| $— | | $48,923,481 | $ | — | $ | — |
| — | | 3,962,805 | | — | | — |
| $— | | $12.35 | $ | — | $ | — |
| $217,044,650 | | $269,185,186 | $ | 61,410,805 | $51,571,571 |
| 11,081,982 | | 22,020,508 | | 4,534,827 | | 4,285,090 |
| $19.59 | | $12.22 | $ | 13.54 | $ | 12.04 |
| | | | | | | | |
Laudus Rosenberg | Laudus Rosenberg | | | | |
International | U.S. Large/Mid | | | | |
Small | Capitalization | Laudus Rosenberg | Laudus Rosenberg |
Capitalization | Long/Short | Global Long/Short | Value Long/Short |
Fund | Equity Fund | Equity Fund | Equity Fund |
$1,563,357,595 | $16,586,992 | $18,233,114 | $265,909,634 |
$1,873,438,314 | $18,495,591 | $19,881,016 | $302,181,168 |
| 33,108,000 | | 692,469 | | 1,180,359 | | 18,114,959 |
1,906,546,314 | 19,188,060 | 21,061,375 | 320,296,127 |
| — | 18,463,415 | 14,388,573 | 303,267,401 |
| 146,492,602 | | — | | — | | — |
| 343 | | — | | — | | — |
| 13,214,467 | | — | | 5,110,977 | | — |
| — | | — | | 2,964 | | — |
| 6,018,382 | | 52,932 | | 69,871 | | 736,235 |
| 4,098,902 | | 127,073 | | 57,573 | | 1,513,576 |
| — | | — | | 143,715 | | 7,237,339 |
| 20,628,120 | | 659,257 | | 512,068 | | 6,782,988 |
| 193,294 | | — | | 24,248 | | — |
| — | | — | | — | | — |
| 86,703 | | 1,508 | | 444 | | 15,655 |
2,097,279,127 | 38,492,245 | 41,371,808 | 639,849,321 |
$ | — | $18,328,050 | $18,939,163 | $305,578,183 |
| — | $18,323,387 | 19,721,130 | 303,890,759 |
| — | | — | | 86,567 | | — |
| — | | — | | 185,166 | | — |
| 1,482,592 | | 14,812 | | 37,210 | | 666,279 |
| — | | — | | 220,981 | | 5,111,573 |
| 16,039,517 | | 753,103 | | 341,145 | | 4,317,495 |
| 146,492,602 | | — | | — | | — |
| | | | | | | |
| 69,896 | | 2,317 | | 2,163 | | 14,677 |
| — | | 23,079 | | 39,826 | | 329,120 |
| 1,515,097 | | 10,387 | | 27,838 | | 409,038 |
| 15,751 | | 1,851 | | 1,607 | | 3,800 |
| 308,775 | | 1,499 | | 2,129 | | 22,517 |
| 1,180 | | 599 | | 581 | | 829 |
| 12,926 | | 3,218 | | 9,164 | | 6,548 |
| 349,123 | | 34,735 | | 36,235 | | 81,572 |
| 166,287,459 | 19,168,987 | 20,711,742 | 314,854,207 |
$1,930,991,668 | $19,323,258 | $20,660,066 | $324,995,114 |
| | | | | | | |
$1,473,923,391 | $18,431,312 | $19,104,531 | $353,049,909 |
| 9,402,286 | | 153,264 | | 228,620 | | 1,212,644 |
| 104,396,692 | | (1,867,049) | | (716,263) | | (85,341,356) |
| 343,269,299 | | 2,605,731 | | 2,043,178 | | 56,073,917 |
$1,930,991,668 | $19,323,258 | $20,660,066 | $324,995,114 |
| | | | | | | |
$1,048,829,039 | $10,175,728 | $17,004,700 | $260,595,548 |
| 46,265,419 | | 838,115 | | 1,390,939 | | 24,247,756 |
$ | 22.67 | $ | 12.14 | $ | 12.23 | $ | 10.75 |
| | | | | | | |
$ | — | $ | — | $ | — | $ | — |
| — | | — | | — | | — |
$ | — | $ | — | $ | — | $ | — |
$ | 882,162,629 | $ | 9,147,530 | $ | 3,655,366 | $ | 64,399,566 |
| 39,416,530 | | 750,454 | | 301,533 | | 6,059,779 |
$ | 22.38 | $ | 12.19 | $ | 12.12 | $ | 10.63 |
See the accompanying notes to the financial statements.
Laudus Funds Annual Report 131
Financial Statements
Statement of Operations for the year ended 3/31/07
| Laudus | Laudus | Laudus | |
| Rosenberg | Rosenberg | Rosenberg | Laudus |
| U.S. Large | U.S. Large | U.S. Large | Rosenberg |
| Capitalization | Capitalization | Capitalization | U.S. Discovery |
| Fund | Growth Fund | Value Fund | Fund |
Investment Income: | | | | | |
Dividends1 | $ 1,682,443 | $ | 710,278 | $ 162,609 | $10,000,622 |
Interest | 60,263 | | 38,531 | 3,290 | 455,646 |
Securities lending | — | | 6,024 | — | 280,700 |
Total investment income | 1,742,706 | | 754,833 | 165,899 | 10,736,968 |
Expenses: | | | | | |
Adviser fees | 722,534 | | 440,259 | 56,360 | 8,486,860 |
Distribution and shareholder service fees | | | | | |
(Investor Shares) | 25,202 | | 5,029 | 1,070 | 639,781 |
Service fees (Adviser Shares) | — | | — | — | — |
Professional fees | 49,520 | | 42,238 | 20,944 | 116,882 |
Custodian fees | 35,009 | | 11,408 | 4,491 | 69,104 |
Overdraft charges | 7,430 | | 228 | 115 | 31,452 |
Fund accounting and administration fees | 37,669 | | 41,366 | 34,363 | 73,088 |
Registration and filing fees | 42,295 | | 45,848 | 38,789 | 93,966 |
Sub-accounting fees (Investor Shares) | 12,409 | | 2,430 | 606 | 334,405 |
Shareholder report fee | 17,318 | | 10,867 | 1,218 | 152,242 |
Transfer agent fees | 19,490 | | 16,108 | 15,644 | 107,785 |
Trustees’ fees | 4,877 | | 6,252 | 4,196 | 17,143 |
Trustees’ retirement plan | 609 | | 363 | 48 | 6,012 |
Recouped by adviser | 32,605 | | 2,112 | 74 | — |
Dividend expense for securities sold short | — | | — | — | — |
Other expenses | 4,548 | | 1,426 | 1,492 | 19,883 |
Total expenses before custody credits and | | | | | |
waivers/reimbursements | 1,011,515 | | 625,934 | 179,410 | 10,148,603 |
Less custody credits | (19) | | (17) | (18) | (109) |
Less expenses waived/reimbursed by the | (20,097) | | (38,530) | (103,613) | (26,377) |
Adviser2 | | | | | |
Net expenses | 991,399 | | 587,387 | 75,779 | 10,122,117 |
Net investment income | 751,307 | | 167,446 | 90,120 | 614,851 |
Realized and Unrealized Gains/(Losses) on | | | | | |
Investments | | | | | |
Net realized gains/(losses) on securities and | | | | | |
foreign currency transactions | 6,522,821 | (1,019,951) | 667,997 | 42,825,956 |
Net realized losses on securities sold short | — | | — | — | — |
Change in unrealized | | | | | |
appreciation/(depreciation) on | | | | | |
investments | 3,731,397 | 4,581,034 | 206,286 | 4,928,724 |
Net realized and unrealized gains/(losses) | | | | | |
on investments | 10,254,218 | 3,561,083 | 874,283 | 47,754,680 |
Change in Net Assets Resulting from | $11,005,525 | $ 3,728,529 | $ 964,403 | $48,369,531 |
Operations | | | | |
* For the period May 31, 2006 (commencement of operations) through March 31, 2007.
1 Net of foreign withholding tax for Laudus Rosenberg U.S. Large Capitalization Fund, Laudus Rosenberg International Equity Fund, Laudus Rosenberg International Discovery Fund, Laudus Rosenberg International Small Capitalization Fund, and Laudus Rosenberg Global Long/ Short Equity Fund was $27, $181,187 $92,569, $2,875,885, and $31,711, respectively.
2 Includes reimbursement of sub-accounting fees on Investor Shares.
132 Laudus Funds Annual Report
See the accompanying notes to the financial statements.
Financial Statements—Statement of Operations continued
Laudus Rosenberg | | |
U.S. Small | Laudus Rosenberg | Laudus Rosenberg |
Capitalization | International | International |
Fund | Equity Fund | Discovery Fund* |
| | | |
| | | |
| $11,159,907 | $ 2,565,865 | $ 1,059,707 |
| 399,149 | 98,619 | 65,443 |
| 540,021 | — | — |
| 12,099,077 | 2,664,484 | 1,125,150 |
| | | |
| 10,332,828 | 864,393 | 469,113 |
| | | |
| 713,458 | 128,048 | 85,588 |
| 121,370 | — | — |
| 112,757 | 55,149 | 22,449 |
| 86,628 | 101,792 | 154,750 |
| 47,855 | 160 | 1,200 |
| 38,333 | 75,362 | 55,300 |
| 54,517 | 45,657 | 31,981 |
| 295,039 | 57,383 | 49,656 |
| 189,541 | 19,071 | 7,563 |
| 81,069 | 21,588 | 15,200 |
| 28,423 | 6,215 | 7,477 |
| 7,365 | 629 | 349 |
| — | 216,860 | 22 |
| — | — | — |
| (61,671) | (40,232) | 4,053 |
| | | |
| 12,047,512 | 1,552,075 | 904,701 |
| (554) | (12) | (4,288) |
| — | (35,568) | (167,493) |
| 12,046,958 | 1,516,495 | 732,920 |
| 52,119 | 1,147,989 | 392,230 |
| | | |
| | | |
| | | |
| 150,336,455 | 6,877,363 | 2,870,405 |
| — | — | — |
| | | |
(145,392,179) | 11,549,757 | 8,235,461 |
| | | |
| 4,944,276 | 18,427,120 | 11,105,866 |
| $4,996,395 | $19,575,109 | $11,498,096 |
| | | | |
Laudus Rosenberg | Laudus Rosenberg | | | | |
International | U.S. Large/Mid | Laudus Rosenberg | Laudus Rosenberg |
Small | Capitalization | Global | Value |
Capitalization | Long/Short | Long/Short | Long/Short |
Fund | Equity Fund | Equity Fund | Equity Fund |
| | | | | | |
| | | | | | |
$ 35,156,979 | $ | 409,507 | $ | 502,158 | $ | 2,725,914 |
916,148 | | 1,364,595 | 1,042,744 | | 13,692,103 |
1,345,979 | | — | | — | | — |
37,419,106 | | 1,774,102 | 1,544,902 | | 16,418,017 |
| | | | | | |
15,538,325 | | 278,672 | | 494,486 | | 4,327,917 |
| | | | | | |
1,985,119 | | 29,269 | | 18,981 | | 168,325 |
— | | — | | — | | — |
181,293 | | 48,738 | | 43,824 | | 68,970 |
1,018,370 | | 16,605 | | 31,021 | | 89,785 |
61,073 | | — | | — | | — |
199,030 | | 34,000 | | 106,103 | | 73,836 |
136,737 | | 39,189 | | 31,541 | | 79,128 |
927,368 | | 12,934 | | 8,250 | | 59,341 |
263,703 | | 4,073 | | 1,257 | | 49,859 |
259,456 | | 25,075 | | 19,571 | | 55,876 |
29,242 | | 6,239 | | 4,582 | | 11,908 |
10,103 | | 182 | | 216 | | 1,818 |
— | | 5,160 | | 11,774 | | 24,328 |
— | | 400,088 | | 470,253 | | 3,813,316 |
20,284 | | 1,285 | | (353) | | 385 |
| | | | | | |
20,630,103 | | 901,509 | 1,241,506 | | 8,824,792 |
(2,684) | | — | | — | | — |
— | | (120,745) | | (92,459) | | (2,516) |
20,627,419 | | 780,764 | 1,149,047 | | 8,822,276 |
16,791,687 | | 993,338 | | 395,855 | | 7,595,741 |
| | | | | | |
| | | | | | |
| | | | | | |
208,560,905 | | 3,242,455 | | 917,421 | | 17,740,743 |
— | (2,648,980) | | (87,831) | (38,074,847) |
| | | | | | |
82,283,173 | | (363,200) | (1,068,460) | | 22,006,563 |
| | | | | | |
290,844,078 | | 230,275 | | (238,870) | | 1,672,459 |
$307,635,765 | $ 1,223,613 | $ | 156,985 | $ | 9,268,200 |
See the accompanying notes to the financial statements.
Laudus Funds Annual Report 133
Financial Statements
Statement of Changes in Net Assets
| | Laudus Rosenberg | Laudus Rosenberg |
| | U.S. Large | U.S. Large |
| | Capitalization Fund | Capitalization |
| | | Growth Fund |
| | Year | Year | Year | Year |
| | Ended | Ended | Ended | Ended |
| | March 31, | March 31, | March 31, | March 31, |
| | 2007 | | 2006 | | 2007 | | 2006 |
Operations: | | | | | | | | |
Net investment income/(loss) | $751,307 | $360,927 | $ | 167,446 | $ | 48,395 |
Net realized gains/(losses) from investments | 6,522,821 | 4,948,673 | (1,019,951) | | 27,807 |
Change in unrealized appreciation/(depreciation) | | | | |
from investments | 3,731,397 | 1,301,859 | 4,581,034 | 2,884,447 |
Change in net assets resulting from operations | 11,005,525 | 6,611,459 | 3,728,529 | 2,960,649 |
Distributions to Shareholders from: | | | | | | | | |
Net investment income | | | | | | | | |
Institutional Shares | | (668,604) | (303,600) | | (135,787) | | (22,348) |
Adviser Shares | | — | | — | | — | | — |
Investor Shares | | (40,997) | (42,138) | | — | | — |
| | (709,601) | (345,738) | | (135,787) | | (22,348) |
Net realized gains on investments | | | | | | | | |
Institutional Shares | | (3,045,475) | (3,529,019) | | — | | — |
Adviser Shares | | — | | — | | — | | — |
Investor Shares | | (320,576) | (668,587) | | — | | — |
| | (3,366,051) | (4,197,606) | | — | | — |
Return of capital | | | | | | | | |
Institutional Shares | | — | | — | | — | | — |
Adviser Shares | | — | | — | | — | | — |
Investor Shares | | — | | — | | — | | — |
| | — | | — | | — | | — |
Change in net assets resulting from distributions | | (4,075,652) | (4,543,344) | | (135,787) | | (23,348) |
Capital Transactions: | | | | | | | | |
Proceeds from shares issued | | | | | | | | |
Institutional Shares | | 58,578,093 | 26,291,073 | 36,913,996 | | 39,279,438 |
Adviser Shares | | — | | — | | — | | — |
Investor Shares | | 2,449,618 | 8,190,489 | 1,064,127 | | 673,860 |
| | 61,027,711 | 34,481,562 | 37,978,123 | | 39,953,298 |
Distributions reinvested | | | | | | | | |
Institutional Shares | | 2,813,571 | 3,546,531 | | 54,198 | | 23,347 |
Adviser Shares | | — | | — | | — | | — |
Investor Shares | | 344,240 | 706,567 | | — | | — |
| | 3,157,811 | 4,253,098 | | 54,198 | | 23,347 |
Value of shares redeemed | | | | | | | | |
Institutional Shares1 | (27,058,789) | (21,993,309) | (9,389,918) | (2,637,973) |
Adviser Shares | | — | | — | | — | | — |
Investor Shares | (3,384,025) | (1,832,689) | | (747,706) | | (989,955) |
| (30,442,814) | (23,825,998) | (10,137,624) | (3,627,928) |
Change in net assets from capital transactions | | 33,742,708 | 14,908,662 | 27,894,697 | | 36,348,717 |
Change in net assets | | 40,672,581 | 16,976,777 | 31,487,439 | | 39,286,018 |
| | | | | | | | | |
Net Assets: | | | | | | | | |
Beginning of period | | 64,321,966 | 47,345,189 | 46,235,419 | | 6,949,401 |
End of period | $104,994,547 | $64,321,966 | $77,722,858 | $46,235,419 |
Undistributed net investment income/(loss) | $163,419 | $121,713 | $61,427 | $29,768 |
* For the period May 2, 2005 (commencement of operations) through March 31, 2006.
1 Amounts for the Institutional Shares of the Laudus Rosenberg U.S. Discovery Fund included $37,419,391 for shares redeemed in-kind during the year ended March 31, 2006.
2 This amount reflects a portion of the distribution made from realized gains which for tax purposes are reclassified as a return of capital.
134 Laudus Funds Annual Report
See the accompanying notes to the financial statements.
Financial Statements—Statements of Changes in Net Assets continued
Laudus Rosenberg | | | | |
U.S. Large | Laudus Rosenberg |
Capitalization Value Fund | U.S. Discovery Fund |
Year Ended | Period Ended | Year Ended | Year Ended |
March 31, | March 31, | March 31, | March 31, |
2007 | 2006* | 2007 | 2006 |
| | | | | | | |
| | | | | | | |
$ | 90,120 | $ | 99,135 | $ | 614,851 | $ | 194,636 |
| 667,997 | | 184,484 | | 42,825,956 | | 11,893,542 |
| 206,286 | | 795,428 | | 4,928,724 | | 127,182,922 |
| 964,403 | 1,079,047 | | 48,369,531 | | 139,271,100 |
| | | | | | | |
| | | | | | | |
| (148,373) | | (10,558) | | (1,053,017) | | — |
| — | | — | | — | | — |
| (10,519) | | — | | — | | — |
| (158,892) | | (10,558) | | (1,053,017) | | — |
| | | | | | | |
| (276,428) | | (33,243) | | (17,334,529) | | (4,990,426) |
| — | | — | | — | | — |
| (21,234) | | (599) | | (5,813,751) | | (2,263,795) |
| (297,662) | | (33,842) | | (23,148,280) | | (7,254,221) |
| | | | | | | |
| — | | — | | — | | (5,003,953)2 |
| — | | — | | — | | — |
| — | | — | | — | | (2,269,931)2 |
| — | | — | | — | | (7,273,884) |
| (456,554) | | (44,400) | | (24,201,297) | | (14,528,105) |
| | | | | | | |
| | | | | | | |
| 321,271 | 5,730,362 | | 168,801,668 | | 419,607,853 |
| — | | — | | — | | — |
| 702,787 | | 203,857 | | 71,671,762 | | 224,972,095 |
1,024,058 | 5,934,219 | | 240,473,430 | | 644,579,948 |
| | | | | | | |
| 419,345 | | 43,801 | | 17,849,454 | | 9,736,549 |
| — | | — | | — | | — |
| 28,972 | | 599 | | 5,684,793 | | 4,524,500 |
| 448,317 | | 44,400 | | 23,534,247 | | 14,261,049 |
| | | | | | | |
(1,857,508) | | (101,212) | (164,345,008) | | (97,053,288) |
| — | | — | | — | | — |
| (363,352) | | (72,669) | (146,485,470) | | (43,374,609) |
(2,220,860) | | (173,881) | (310,830,478) | (140,427,897) |
| (748,485) | 5,804,738 | | (46,822,801) | | 518,413,100 |
| (240,636) | 6,839,385 | | (22,654,567) | | 643,156,095 |
| | | | | | | |
6,839,385 | | — | | 957,884,476 | | 314,728,381 |
$ 6,598,749 | $6,839,385 | $ 935,229,909 | $ 957,884,476 |
$ | 20,127 | $ | 88,899 | $ | (24,032) | $ | (32,005) |
| Laudus Rosenberg | | Laudus Rosenberg |
| U.S. Small Capitalization Fund | | International Equity Fund |
| Year Ended | | Year Ended | | Year Ended | Year Ended |
| March 31, | | March 31, | | March 31, | | March 31, |
| 2007 | | 2006 | | 2007 | | 2006 |
| | | | | | | |
$ | 52,119 | $ | (963,291) | $ | 1,147,989 | $ | 379,616 |
| 150,336,455 | | 129,828,692 | | 6,877,363 | | 2,216,620 |
| (145,392,179) | | 88,529,661 | | 11,549,757 | | 4,491,113 |
| 4,996,395 | | 217,395,062 | | 19,575,109 | | 7,087,349 |
| | | | | | | |
| | | | | | | |
| — | | — | | (627,740) | | (199,844) |
| — | | — | | — | | — |
| — | | — | | (408,740) | | (113,876) |
| — | | — | | (1,036,480) | | (313,720) |
| | | | | | | |
| (95,202,915) | | (112,927,744) | | (1,295,067) | | — |
| (5,940,043) | | (5,842,269) | | — | | — |
| (33,618,626) | | (38,754,189) | | (1,092,235) | | — |
| (134,761,584) | | (157,524,202) | | (2,387,302) | | — |
| | | | | | | |
| — | | — | | — | | — |
| — | | — | | — | | — |
| — | | — | | — | | — |
| — | | — | | — | | — |
| (134,761,584) | | (157,524,202) | | (3,423,782) | | (313,720) |
| | | | | | | |
| | | | | | | |
| 118,380,094 | | 117,465,558 | | 48,370,879 | | 2,808,525 |
| 14,915,237 | | 15,001,645 | | — | | — |
| 59,760,279 | | 53,810,720 | | 48,191,782 | | 8,369,324 |
| 193,055,610 | | 186,277,923 | | 96,562,661 | 11,177,849 |
| | | | | | | |
| 88,113,447 | | 105,856,770 | | 746,719 | | 199,754 |
| 4,445,580 | | 4,545,331 | | — | | — |
| 27,639,151 | | 32,837,156 | | 1,436,598 | | 113,797 |
| 120,198,178 | | 143,239,257 | | 2,183,317 | | 313,551 |
| | | | | | | |
| (334,677,200) | | (297,001,646) | | (11,984,261) | | (1,250,508) |
| (14,904,487) | | (12,610,680) | | — | | — |
| (96,464,540) | | (86,444,438) | | (13,615,518) | | (5,088,188) |
| (446,046,227) | | (396,056,764) | | (25,599,779) | | (6,338,696) |
| (132,792,439) | | (66,539,584) | | 73,146,199 | | 5,152,704 |
| (262,557,628) | | (6,668,724) | | 89,297,526 | 11,926,333 |
| | | | | | | |
1,280,587,269 | 1,287,255,993 | | 40,511,528 | 28,585,195 |
$1,018,029,641 | $1,280,587,269 | $129,809,054 | $40,511,528 |
$ | (57,016) | $ | (137,207) | $ | 327,367 | $ | 84,630 |
See the accompanying notes to the financial statements.
Laudus Funds Annual Report 135
Financial Statements
Statement of Changes in Net Assets continued
| Laudus | | |
| Rosenberg | | |
| International | | Laudus Rosenberg |
| Discovery | | International Small |
| Fund | | Capitalization Fund |
| Period Ended | Year Ended | | Year Ended |
| March 31, | March 31, | | March 31, |
| 2007** | 2007 | | 2006 |
Operations: | | | | | | |
Net investment income/(loss) | $392,230 | $16,791,687 | $5,554,481 |
Net realized gains/(losses) from investments | 2,870,405 | 208,560,905 | | 102,872,084 |
Change in unrealized appreciation/(depreciation) from | 8,235,461 | 82,283,173 | 185,695,003 |
investments | | | |
Change in net assets resulting from operations | 11,498,096 | 307,635,765 | | 294,121,568 |
Distributions to Shareholders from: | | | | | | |
Net investment income | | | | | | |
Institutional Shares | (109,953) | (14,345,867) | | (1,827,823) |
Adviser Shares | | — | | — | | — |
Investor Shares | (233,195) | (10,736,773) | | (1,346,742) |
| (343,148) | (25,082,640) | | (3,174,565) |
Net realized gains on investments | | | | | | |
Institutional Shares | (30,335) | (79,486,024) | | (20,302,476) |
Adviser Shares | | — | | — | | — |
Investor Shares | (82,625) | (74,164,191) | | (31,601,336) |
| (112,960) | (153,650,215) | | (51,903,812) |
Return of capital | | | | | | |
Institutional Shares | | — | | — | | — |
Adviser Shares | | — | | — | | — |
Investor Shares | | — | | — | | — |
| | — | | — | | — |
Change in net assets resulting from distributions | (456,108) | (178,732,855) | | (55,078,377) |
Capital Transactions: | | | | | | |
Proceeds from shares issued | | | | | | |
Institutional Shares | 18,758,287 | 430,184,421 | | 426,872,058 |
Adviser Shares | | — | | — | | — |
Investor Shares | 53,586,133 | 215,540,881 | | 492,233,451 |
| 72,344,420 | 645,725,302 | | 919,105,509 |
Distributions reinvested | | | | | | |
Institutional Shares | 118,690 | 77,822,309 | | 21,387,217 |
Adviser Shares | | — | | — | | — |
Investor Shares | 281,821 | 72,673,365 | | 31,911,673 |
| 400,511 | 150,495,674 | | 53,298,890 |
Value of shares redeemed | | | | | | |
Institutional Shares | (2,722,783) | (226,039,438) | (123,787,707) |
Adviser Shares | | — | | — | | — |
Investor Shares | (10,319,538) | (270,496,667) | (211,668,183) |
| (13,042,321) | (496,536,105) | (335,455,890) |
Change in net assets from capital transactions | 59,702,610 | 299,684,871 | | 636,948,509 |
Change in net assets | 70,744,598 | 428,587,781 | | 875,991,700 |
Net Assets: | | | | | | |
Beginning of period | | — | 1,502,403,887 | | 626,412,187 |
End of period | $70,744,598 | $1,930,991,668 | $1,502,403,887 |
Undistributed net investment income/(loss) | $245,660 | $ | 9,402,286 | $ | 4,390,201 |
** For the period May 31, 2006 (commencement of operations) through March 31, 2007.
136 Laudus Funds Annual Report
See the accompanying notes to the financial statements.
Financial Statements—Statements of Changes in Net Assets continued
Laudus Rosenberg | | | | |
U.S. Large/Mid Capitalization | Laudus Rosenberg |
Long/Short Equity Fund | Global Long/Short Equity Fund |
Year Ended | Year Ended | Year Ended | Year Ended |
March 31, | March 31, | March 31, | March 31, |
2007 | 2006 | 2007 | 2006 |
| | | | | | | |
| | | | | | | |
$ | 993,338 | $ | 557,508 | $ | 395,855 | $ | 90,873 |
| 593,475 | | 2,128,670 | | 829,590 | | 1,626,336 |
| (363,200) | | (1,069,485) | | (1,068,460) | | 108,253 |
| 1,223,613 | | 1,616,693 | | 156,985 | | 1,825,462 |
| | | | | | | |
| | | | | | | |
| (606,556) | | (251,087) | | (519,119) | | (200,738) |
| — | | — | | — | | — |
| (404,695) | | (135,244) | | (72,914) | | (69,731) |
| (1,011,251) | | (386,331) | | (592,033) | | (270,469) |
| | | | | | | |
| — | | — | | — | | — |
| — | | — | | — | | — |
| — | | — | | — | | — |
| — | | — | | — | | — |
| | | | | | | |
| — | | — | | — | | — |
| — | | — | | — | | — |
| — | | — | | — | | — |
| — | | — | | — | | — |
| (1,011,251) | | (386,331) | | (592,033) | | (270,469) |
| | | | | | | |
| | | | | | | |
| 4,377,140 | | 9,306,425 | | 8,649,114 | 14,201,601 |
| — | | — | | — | | — |
| 6,488,812 | | 7,010,365 | | 3,276,912 | | 9,096,950 |
| 10,865,952 | | 16,316,790 | | 11,926,026 | 23,298,551 |
| | | | | | | |
| 596,728 | | 251,087 | | 515,345 | | 200,606 |
| — | | — | | — | | — |
| 378,487 | | 133,900 | | 68,086 | | 69,446 |
| 975,215 | | 384,987 | | 583,431 | | 270,052 |
| | | | | | | |
(14,443,250) | | (3,189,183) | (20,143,179) | | (2,435,287) |
| — | | — | | — | | — |
| (9,554,813) | | (8,611,151) | (10,409,599) | | (4,783,293) |
(23,998,063) | (11,800,334) | (30,552,778) | | (7,218,580) |
(12,156,896) | | 4,901,443 | (18,043,321) | 16,350,023 |
(11,944,534) | | 6,131,805 | (18,478,369) | 17,905,016 |
| | | | | | | |
| 31,267,792 | | 25,135,987 | | 39,138,435 | 21,233,419 |
$ 19,323,258 | $ 31,267,792 | $ 20,660,066 | $39,138,435 |
$ | 153,264 | $ | 171,177 | $ | 228,620 | $ | (347,272) |
| | | | | | | | |
Laudus Rosenberg |
Value Long/Short Equity Fund |
Year Ended | Year Ended |
March 31, | March 31, |
2007 | 2006 |
| | | |
| | | |
| $7,595,741 | | $2,691,459 |
| (20,334,104) | | (4,800,032) |
| 22,006,563 | | 7,375,303 |
| 9,268,200 | | 5,266,730 |
| | | |
| | | |
| (5,816,661) | | (1,577,788) |
| — | | — |
| (1,317,915) | | (362,192) |
| (7,134,576) | | (1,939,980) |
| | | |
| — | | — |
| — | | — |
| — | | — |
| — | | — |
| | | |
| — | | — |
| — | | — |
| — | | — |
| — | | — |
| (7,134,576) | | (1,939,980) |
| | | |
| | | |
| 145,201,890 | 111,120,458 |
| — | | — |
| 29,892,979 | | 45,167,332 |
| 175,094,869 | 156,287,790 |
| | | |
| 5,200,711 | | 1,550,181 |
| — | | — |
| 1,166,200 | | 342,604 |
| 6,366,911 | | 1,892,785 |
| | | |
| (80,914,601) | | (28,990,015) |
| — | | — |
| (29,975,740) | | (18,131,133) |
(110,890,341) | | (47,121,148) |
| 70,571,439 | 111,059,427 |
| 72,705,063 | 114,386,177 |
| | | |
| 252,290,051 | 137,903,874 |
$ 324,995,114 | $252,290,051 |
| $1,212,644 | | $751,479 |
See the accompanying notes to the financial statements.
Laudus Funds Annual Report 137
Financial Statements
Statement of Changes in Net Assets continued
| | Laudus Rosenberg | Laudus Rosenberg | Laudus Rosenberg |
| | U.S. Large | U.S. Large | U.S. Large |
| | Capitalization | Capitalization | Capitalization |
| | Fund | Growth Fund | Value Fund |
| | Year | Year | Year | Year | Year | Period |
| | Ended | Ended | Ended | Ended | Ended | Ended |
| | March 31, | March 31, | March 31, | March 31, | March 31, | March 31, |
| | 2007 | 2006 | 2007 | 2006 | 2007 | 2006* |
Shares sold: | | | | | | | |
Institutional | | 4,683,826 | 2,130,792 | 3,933,323 | 4,453,595 | 26,453 | 568,445 |
Adviser | — | — | — | — | — | — |
Investor | 196,259 | 666,482 | 114,333 | 74,734 | 56,943 | 18,680 |
| | 4,880,085 | 2,797,274 | 4,047,656 | 4,528,329 | 83,396 | 587,125 |
Issued upon reinvestment of | | | | | | |
distributions: | | | | | | |
Institutional | | 214,123 | 296,038 | 5,570 | 2,583 | 33,361 | 3,900 |
Adviser | — | — | — | — | — | — |
Investor | 26,158 | 58,881 | — | — | 2,311 | 53 |
| | 240,281 | 354,919 | 5,570 | 2,583 | 35,672 | 3,953 |
Shares redeemed: | | | | | | |
Institutional1 | (2,106,330) | (1,810,387) | (1,005,648) | (285,643) | (147,151) | (9,574) |
Adviser | — | — | — | — | — | — |
Investor | (271,271) | (150,073) | (80,219) | (113,020) | (28,940) | (6,490) |
| | (2,377,601) | (1,960,460) | (1,085,867) | (398,663) | (176,091) | (16,064) |
Change in shares: | | | | | | |
Institutional | | 2,791,619 | 616,443 | 2,933,245 | 4,170,535 | (87,337) | 562,771 |
Adviser | — | — | — | — | — | — |
Investor | (48,854) | 575,290 | 34,114 | (38,286) | 30,314 | 12,243 |
| | 2,742,765 | 1,191,733 | 2,967,359 | 4,132,249 | (57,023) | 575,014 |
* For the period May 2, 2005 (commencement of operations) through March 31, 2006.
** For the period May 31, 2006 (commencement of operations) through March 31, 2007.
1 Amounts for the Institutional Shares of the Laudus Rosenberg U.S. Discovery Fund included 2,459,060 for shares redeemed in-kind during the year ended March 31, 2006.
138 Laudus Funds Annual Report
See the accompanying notes to the financial statements.
Financial Statements—Statements of Changes in Net Assets continued
Laudus Rosenberg | Laudus Rosenberg |
U.S. Discovery Fund | U.S. Small Capitalization Fund |
Year Ended | Year Ended | Year Ended | Year Ended |
March 31, | March 31, | March 31, | March 31, |
2007 | 2006 | 2007 | 2006 |
| | | |
| | | |
8,954,963 | 24,316,701 | 9,025,809 | 8,625,498 |
— | — | 1,173,536 | 1,104,116 |
3,821,131 | 13,483,409 | 4,688,425 | 4,038,568 |
12,776,094 | 37,800,110 | 14,887,770 | 13,768,182 |
| | | |
931,114 | 561,184 | 7,100,197 | 8,328,621 |
— | — | 364,392 | 362,178 |
299,515 | 262,747 | 2,288,009 | 2,637,523 |
1,230,629 | 823,931 | 9,752,598 | 11,328,322 |
| | | |
(8,657,298) | (5,907,480) | (25,741,760) | (21,868,787) |
— | — | (1,172,771) | (940,102) |
(7,948,553) | (2,505,790) | (7,593,651) | (6,436,504) |
(16,605,851) | (8,413,270) | (34,508,182) | (29,245,393) |
| | | |
1,228,779 | 18,970,405 | (9,615,754) | (4,914,668) |
— | — | 365,157 | 526,192 |
(3,827,907) | 11,240,366 | (617,217) | 239,587 |
(2,599,128) | 30,210,771 | (9,867,814) | (4,148,889) |
| | Laudus Rosenberg |
Laudus Rosenberg | International |
International | Equity Fund | Discovery Fund |
Year Ended | Year Ended | Period Ended |
March 31, | March 31, | March 31, |
2007 | 2006 | 2007** |
| | |
| | |
4,057,376 | 267,947 | 1,838,230 |
— | — | — |
3,942,327 | 789,417 | 5,240,229 |
7,999,703 | 1,057,364 | 7,078,459 |
| | |
57,930 | 18,564 | 10,560 |
— | — | — |
111,624 | 10,586 | 25,073 |
169,554 | 29,150 | 35,633 |
| | |
(917,509) | (119,864) | (257,166) |
— | — | — |
(1,117,813) | (500,810) | (980,212) |
(2,035,322) | (620,674) | (1,237,378) |
| | |
3,197,797 | 166,647 | 1,591,624 |
— | — | — |
2,936,138 | 299,193 | 4,285,090 |
6,133,935 | 465,840 | 5,876,714 |
See the accompanying notes to the financial statements.
Laudus Funds Annual Report 139
Financial Statements
Statement of Changes in Net Assets continued
| Laudus Rosenberg | Laudus Rosenberg |
| International Small | U.S. Large/Mid Capitalization |
| Capitalization Fund | Long/Short Equity Fund |
| Year Ended | Year Ended | Year Ended | Year Ended |
| March 31, | March 31, | March 31, | March 31, |
| 2007 | 2006 | 2007 | 2006 |
Shares sold: | | | | |
Institutional | 20,193,658 | 22,977,000 | 358,962 | 788,858 |
Investor | 10,203,670 | 27,951,465 | 528,308 | 595,036 |
| 30,397,328 | 50,928,465 | 887,270 | 1,383,894 |
Issued upon reinvestment | | | |
of distributions: | | | |
Institutional | 3,719,996 | 1,162,349 | 49,603 | 21,479 |
Investor | 3,514,186 | 1,752,426 | 31,306 | 11,415 |
| 7,234,182 | 2,914,775 | 80,909 | 32,894 |
Shares redeemed: | | | | |
Institutional | (10,934,748) | (6,873,202) | (1,185,354) | (272,078) |
Investor | (13,086,640) | (12,177,417) | (779,458) | (754,930) |
| (24,021,388) | (19,050,619) | (1,964,812) | (1,027,008) |
Change in shares: | | | | |
Institutional | 12,978,906 | 17,266,147 | (776,789) | 538,259 |
Investor | 631,216 | 17,526,474 | (219,844) | (148,479) |
| 13,610,122 | 34,792,621 | (996,633) | 389,780 |
140 Laudus Funds Annual Report
See the accompanying notes to the financial statements.
Financial Statements—Statements of Changes in Net Assets continued
Laudus Rosenberg | Laudus Rosenberg |
Global Long/Short | Value Long/Short |
Equity Fund | Equity Fund |
Year Ended | Year Ended | Year Ended | Year Ended |
March 31, | March 31, | March 31, | March 31, |
2007 | 2006 | 2007 | 2006 |
| | | |
| | | |
707,333 | 1,182,558 | 13,615,380 | 10,562,660 |
270,497 | 769,500 | 2,806,789 | 4,340,766 |
977,830 | 1,952,058 | 16,422,169 | 14,903,426 |
| | | |
42,981 | 16,773 | 497,676 | 147,076 |
5,722 | 5,875 | 112,676 | 32,848 |
48,703 | 22,648 | 610,352 | 179,924 |
| | | |
(1,657,449) | (204,380) | (7,619,121) | (2,752,771) |
(868,009) | (412,483) | (2,836,891) | (1,752,709) |
(2,525,458) | (616,863) | (10,456,012) | (4,505,480) |
| | | |
(907,135) | 994,951 | 6,493,935 | 7,956,965 |
(591,790) | 362,892 | 82,574 | 2,620,905 |
(1,498,925) | 1,357,843 | 6,576,509 | 10,577,870 |
See the accompanying notes to the financial statements.
Laudus Funds Annual Report 141
Financial Statements
Financial Highlights as of 3/31/07

Institutional Shares | | | | | | | | | | |
U.S. Large Capitalization Fund | | | | | | | | | | |
For the year ended March 31, 2007 | $12.35 | $ 0.10(6) | $ | 1.27 | $ 1.37 | $(0.09) | $(0.42) | $ | — | $(0.51) |
For the year ended March 31, 2006 | 11.79 | 0.10(6) | | 1.62 | 1.72 | (0.09) | (1.07) | | — | (1.16) |
For the year ended March 31, 2005 | 10.92 | 0.11(6) | | 0.94 | 1.05 | (0.09) | (0.09) | | — | (0.18) |
For the year ended March 31, 2004 | 8.28 | 0.06(6) | | 2.62 | 2.68 | (0.04) | — | | — | (0.04) |
June 19, 2002 to March 31, 2003(1) | 10.00 | 0.05(6) | | (1.73) | (1.68) | (0.04) | — | | — | (0.04) |
U.S. Large Capitalization Growth | | | | | | | | | | |
Fund | | | | | | | | | | |
For the year ended March 31, 2007 | 9.26 | 0.03(6) | | 0.49 | 0.52 | (0.02) | — | | — | (0.02) |
For the year ended March 31, 2006 | 8.07 | 0.02(6) | | 1.18 | 1.20 | (0.01) | — | | — | (0.01) |
For the year ended March 31, 2005 | 7.84 | 0.04(6) | | 0.23 | 0.27 | (0.04) | — | | — | (0.04) |
For the year ended March 31, 2004 | 5.95 | 0.06(6) | | 1.89 | 1.95 | (0.06) | — | | — | (0.06) |
For the year ended March 31, 2003 | 7.77 | 0.07(6) | | (1.83) | (1.76) | (0.06) | — | | — | (0.06) |
U.S. Large Capitalization Value | | | | | | | | | | |
Fund | | | | | | | | | | |
For the year ended March 31, 2007 | 11.89 | 0.15(6) | | 1.45 | 1.60 | (0.26) | (0.49) | | — | (0.75) |
May 2, 2005 to March 31, 2006(1) | 10.00 | 0.18(6) | | 1.79 | 1.97 | (0.02) | (0.06) | | — | (0.08) |
U.S. Discovery Fund | | | | | | | | | | |
For the year ended March 31, 2007 | 19.23 | 0.03 | | 1.05 | 1.08 | (0.03) | (0.48) | | — | (0.51) |
For the year ended March 31, 2006 | 15.96 | 0.02 | | 3.58 | 3.60 | — | (0.16) | (0.17) | (0.33) |
For the year ended March 31, 2005 | 14.71 | 0.03(6) | | 1.44 | 1.47 | (0.04) | (0.18) | | — | (0.22) |
For the year ended March 31, 2004 | 9.55 | 0.06(6) | | 5.26 | 5.32 | (0.04) | (0.12) | | — | (0.16) |
For the year ended March 31, 2003 | 11.10 | 0.04(6) | | (1.57) | (1.53) | (0.02) | — | | — | (0.02) |
U.S. Small Capitalization Fund | | | | | | | | | | |
For the year ended March 31, 2007 | 14.07 | 0.02 | | 0.11 | 0.13 | — | (1.63) | | — | (1.63) |
For the year ended March 31, 2006 | 13.50 | —(7) | | 2.43 | 2.43 | — | (1.86) | | — | (1.86) |
For the year ended March 31, 2005 | 13.82 | 0.03(6) | | 1.27 | 1.30 | (0.03) | (1.59) | | — | (1.62) |
For the year ended March 31, 2004 | 8.98 | 0.05 | | 5.03 | 5.08 | (0.04) | (0.20) | | — | (0.24) |
For the year ended March 31, 2003 | 11.18 | 0.03(6) | | (1.93) | (1.90) | (0.03) | (0.27) | | — | (0.30) |
International Equity Fund | | | | | | | | | | |
For the year ended March 31, 2007 | 11.80 | 0.07 | | 2.08 | 2.15 | (0.12) | (0.25) | | — | (0.37) |
For the year ended March 31, 2006 | 9.63 | 0.14 | | 2.15 | 2.29 | (0.12) | — | | — | (0.12) |
For the year ended March 31, 2005 | 8.46 | 0.09(6) | | 1.12 | 1.21 | (0.04) | — | | — | (0.04) |
For the year ended March 31, 2004 | 5.56 | 0.08(6) | | 2.90 | 2.98 | (0.08) | — | | — | (0.08) |
For the year ended March 31, 2003 | 7.09 | 0.08(6) | | (1.55) | (1.47) | (0.07) | — | | — | (0.07) |
International Discovery Fund | | | | | | | | | | |
May 31, 2006 to March 31, 2007(1) | 10.00 | 0.09(6) | | 2.06 | 2.15 | (0.08) | (0.02) | | — | (0.10) |
International Small Capitalization Fund | | | | | | | | | | |
For the year ended March 31, 2007 | 20.97 | 0.26 | | 3.90 | 4.16 | (0.38) | (2.08) | | — | (2.46) |
For the year ended March 31, 2006 | 16.89 | 0.13 | | 4.95 | 5.08 | (0.08) | (0.92) | | — | (1.00) |
For the year ended March 31, 2005 | 13.94 | 0.08(6) | | 3.53 | 3.61 | (0.04) | (0.62) | | — | (0.66) |
For the year ended March 31, 2004 | 7.92 | 0.07(6) | | 6.04 | 6.11 | (0.09) | — | | — | (0.09) |
For the year ended March 31, 2003 | 8.48 | 0.09(6) | | (0.56) | (0.47) | (0.11) | — | | — | (0.11) |
U.S. Large/Mid Capitalization Long/Short Equity Fund | | | | | | | | | | |
For the year ended March 31, 2007 | 12.08 | 0.60 | | —(7) | 0.60 | (0.54) | — | | — | (0.54) |
For the year ended March 31, 2006 | 11.44 | 0.25 | | 0.58 | 0.83 | (0.19) | — | | — | (0.19) |
For the year ended March 31, 2005 | 10.80 | (0.01)(6) | 0.65 | 0.64 | — | — | | — | — | |
For the year ended March 31, 2004 | 11.51 | (0.06)(6) | (0.65) | (0.71) | — | — | | — | — | |
For the year ended March 31, 2003 | 10.22 | —(6),(7) | | 1.31 | 1.31 | (0.03) | — | | — | (0.03) | |
Global Long/Short Equity Fund | | | | | | | | | | | |
For the year ended March 31, 2007 | 12.31 | 0.15(6) | | 0.06 | 0.21 | (0.29) | — | | — | (0.29) | |
For the year ended March 31, 2006 | 11.62 | 0.05(6) | | 0.75 | 0.80 | (0.11) | — | | — | (0.11) | |
For the year ended March 31, 2005 | 11.30 | (0.12)(6) | | 0.44 | 0.32 | — | — | | — | — | |
| | | | | | | | | | | | | |
For the year ended March 31, 2004 | 11.87 | (0.12)(6) | (0.45) | (0.57) | — | — | — | — |
For the year ended March 31, 2003 | 10.15 | (0.03)(6) | | 1.73 | 1.70 | — | — | — | — |
Value Long/Short Equity Fund | | | | | | | | | | |
For the year ended March 31, 2007 | 10.66 | 0.24 | | 0.09 | 0.33 | (0.24) | — | — | (0.24) |
For the year ended March 31, 2006 | 10.51 | 0.16(6) | | 0.09 | 0.25 | (0.10) | — | — | (0.10) |
For the year ended March 31, 2005 | 9.87 | (0.03)(6) | | 0.67 | 0.64 | — | — | — | — |
For the year ended March 31, 2004 | 10.48 | (0.05)(6) | (0.56) | (0.61) | — | — | | — | — |
For the year ended March 31, 2003 | 8.96 | (0.02)(6) | | 1.54 | 1.52 | — | — | — | — |
| | | | | | | | | | | |
(1) From the commencement of operations. (2) Not annualized for periods less than one year. (3) Annualized for periods less than one year.
(4) Includes interest expense and dividend expense on securities sold short.
(5) Portfolio turnover is calculated on the basis of the Fund as a whole without distinguishing between the classes of shares issued. (6) Calculated based on the average shares outstanding during the period.
(7) Amount less than $0.005.
(8) Exclusive of nonrecurring account fees, extraordinary expenses, interest expense, and dividends on securities sold short.
(9) The ratios of Expenses before Waivers/Reimbursements and Expenses Net of Waivers/Reimbursements have been adjusted from 3.57% and 2.78%, respectively, to more appropriately reflect expenses incurred for the period.
(10) The ratio of net operating expenses for the Laudus Rosenberg U.S. Large Capitalization Fund would have been 0.99% if overdraft expenses had not been included.
142 Laudus Funds Annual Report
See the accompanying notes to the financial statements.
Financial Statements—Financial Highlights continued

$ | —(7) | $13.21 | 11.10% | $ | 94,921 | 0.81% | 1.01% | 1.00% | 1.00%(10) | 144.21% |
| — | 12.35 | 14.90 | | 54,296 | 0.80 | 1.14 | 1.01 | 0.99 | 144.32 |
| — | 11.79 | 9.66 | | 44,559 | 0.96 | 1.23 | 0.99 | 0.99 | 127.89 |
| —(7) | 10.92 | 32.33 | | 44,301 | 0.62 | 1.47 | 1.00 | 1.00 | 141.5 |
| — | 8.28 | (16.78) | | 14,479 | 0.80 | 2.73 | 0.99 | 0.99 | 100.79 |
| | | | | | | | | | |
| —(7) | 9.76 | 5.62 | | 75,481 | 0.30 | 1.05 | 0.99 | 0.99 | 70.73 |
| — | 9.26 | 14.85 | | 44,426 | 0.27 | 1.34 | 0.99 | 0.99 | 78.70 |
| —(7) | 8.07 | 3.42 | | 5,056 | 0.53 | 2.34 | 0.99 | 0.99 | 77.81 |
| —(7) | 7.84 | 32.84 | | 5,006 | 0.80 | 2.59 | 0.80 | 0.80 | 177.43 |
| — | 5.95 | (22.68) | | 3,418 | 1.03 | 4.55 | 0.75 | 0.75 | 68.73 |
| | | | | | | | | | |
| —(7) | 12.74 | 13.55 | | 6,058 | 1.22 | 2.37 | 0.99 | 0.99 | 107.77 |
| — | 11.89 | 19.83 | | 6,694 | 1.82 | 2.41 | 0.49 | 0.49 | 81.30 |
| | | | | | | | | | |
| —(7) | 19.80 | 5.71 | | 718,185 | 0.17 | 0.97 | 0.97 | 0.97 | 85.69 |
| — | 19.23 | 22.80 | | 673,599 | 0.15 | 1.09 | 1.09 | 1.09 | 88.63 |
| —(7) | 15.96 | 9.98 | | 256,444 | 0.23 | 1.20 | 1.14 | 1.14 | 62.60 |
| —(7) | 14.71 | 55.90 | | 98,077 | 0.49 | 1.46 | 1.14 | 1.14 | 93.08 |
| — | 9.55 | (13.83) | | 18,589 | 0.38 | 3.71 | 1.15 | 1.15 | 98.65 |
| | | | | | | | | | |
| —(7) | 12.57 | 1.11 | | 699,921 | 0.10 | 0.95 | 0.95 | 0.95 | 76.00 |
| — | 14.07 | 19.46 | | 918,813 | 0.02 | 1.04 | 1.04 | 1.04 | 69.26 |
| —(7) | 13.50 | 9.36 | | 948,225 | 0.20 | 1.09 | 1.09 | 1.09 | 68.09 |
| —(7) | 13.82 | 56.83 | | 954,275 | 0.45 | 1.13 | 1.13 | 1.13 | 75.65 |
| — | 8.98 | (17.10) | | 487,020 | 0.33 | 1.29 | 1.15 | 1.15 | 70.83 |
| | | | | | | | | | |
| —(7) | 13.58 | 18.37 | | 68,398 | 1.09 | 1.34 | 1.34 | 1.34 | 64.19 |
| — | 11.80 | 23.86 | | 21,688 | 1.34 | 1.96 | 1.34 | 1.34 | 59.40 |
| —(7) | 9.63 | 14.36 | | 16,094 | 0.96 | 2.69 | 1.34 | 1.34 | 52.06 |
0.01 | 8.46 | 53.81 | | 9,914 | 1.12 | 4.32 | 1.35 | 1.35 | 107.02 |
0.01 | 5.56 | (20.66) | | 6,368 | 1.24 | 5.30 | 1.35 | 1.35 | 138.85 |
| | | | | | | | | | |
| —(7) | 12.05 | 21.90 | | 19,173 | 1.06 | 1.64 | 1.34 | 1.34 | 105.81 |
| | | | | | | | | | |
| —(7) | 22.67 | 20.82 | 1,048,829 | 1.21 | 1.10 | 1.10 | 1.10 | 91.82 |
| — | 20.97 | 30.90 | | 698,064 | 0.85 | 1.25 | 1.25 | 1.25 | 101.86 |
| —(7) | 16.89 | 26.52 | | 270,646 | 0.50 | 1.55 | 1.49 | 1.49 | 59.70 |
| —(7) | 13.94 | 77.37 | | 70,382 | 0.65 | 1.94 | 1.47 | 1.47 | 102.50 |
0.02 | 7.92 | (5.36) | | 20,562 | 1.09 | 2.60 | 1.50 | 1.50 | 129.34 |
| | | | | | | | | | |
| —(7) | 12.14 | 4.98 | | 10,176 | 3.68 | 3.07 | 2.67 | 1.24 | 168.86 |
| — | 12.08 | 7.29 | | 19,512 | 2.50 | 3.01 | 2.71 | 1.24 | 212.62 |
| —(7) | 11.44 | 5.93 | | 12,312 | (0.13) | 3.23 | 2.94 | 1.24 | 180.14 |
| —(7) | 10.80 | (6.17) | | 20,404 | (0.57) | 3.22 | 2.82 | 1.25 | 189.35 |
0.01 | 11.51 | 12.90 | | 26,736 | 0.01 | 3.59 | 2.67 | 1.25 | 185.66 |
| | | | | | | | | | |
| —(7) | 12.23 | 1.77 | | 17,005 | 1.27 | 3.68 | 3.40 | 1.99 | 233.95 |
| — | 12.31 | 6.91 | | 28,279 | 0.42 | 3.31 | 3.06 | 1.99 | 178.43 |
| — | 11.62 | 2.83 | | 15,140 | (1.04) | 4.38 | 3.82 | 1.99 | 152.24 |
| —(7) | 11.30 | (4.80) | | 12,527 | (1.11) | 3.69(9) | 2.91(9) | 1.81 | 175.85 |
0.02 | 11.87 | 16.95 | | 13,491 | (0.28) | 4.04 | 2.50 | 1.50 | 189.09 |
| | | | | | | | | | |
| —(7) | 10.75 | 3.19 | | 260,596 | 2.70 | 2.99 | 2.99 | 1.66 | 139.74 |
| — | 10.66 | 2.41 | | 189,254 | 1.51 | 2.89 | 2.89 | 1.74 | 121.80 |
| —(7) | 10.51 | 6.48 | | 102,974 | (0.28) | 3.04 | 2.98 | 1.74 | 111.19 |
| —(7) | 9.87 | (5.82) | | 95,541 | (0.46) | 2.88 | 2.77 | 1.75 | 76.36 |
| — | 10.48 | 16.96 | | 92,356 | (0.15) | 2.72 | 2.42 | 1.74 | 209.95 |
See the accompanying notes to the financial statements.
Laudus Funds Annual Report 143
Financial Statements
Financial Highlights as of 3/31/07

Adviser Shares | | | | | | | | | | | |
U.S. Small Capitalization Fund | | | | | | | | | | | |
For the year ended March 31, 2007 | $13.88 | $(0.02) | $ | 0.12 | $ 0.10 | $ | — | $(1.63) | $ | — | $(1.63) |
For the year ended March 31, 2006 | 13.38 | (0.02) | | 2.38 | 2.36 | | — | (1.86) | | — | (1.86) |
For the year ended March 31, 2005 | 13.71 | —(6),(7) | | 1.26 | 1.26 | | — | (1.59) | | — | (1.59) |
For the year ended March 31, 2004 | 8.91 | 0.02 | | 5.00 | 5.02 | (0.02) | (0.20) | | — | (0.22) |
For the year ended March 31, 2003 | 11.12 | 0.01(6) | | (1.93) | (1.92) | (0.02) | (0.27) | | — | (0.29) |
Investor Shares | | | | | | | | | | | |
U.S. Large Capitalization Fund | | | | | | | | | | | |
For the year ended March 31, 2007 | 12.36 | 0.07(6) | | 1.25 | 1.32 | (0.05) | (0.42) | | — | (0.47) |
For the year ended March 31, 2006 | 11.81 | 0.06(6) | | 1.63 | 1.69 | (0.07) | (1.07) | | — | (1.14) |
For the year ended March 31, 2005 | 10.96 | 0.08(6) | | 0.93 | 1.01 | (0.07) | (0.09) | | — | (0.16) |
For the year ended March 31, 2004 | 8.31 | 0.02(6) | | 2.63 | 2.65 | | — | — | | — | — |
July 31, 2002 to March 31, 2003(1) | 8.88 | 0.05(6) | | (0.62) | (0.57) | | — | — | | — | — |
U.S. Large Capitalization Growth | | | | | | | | | | | |
Fund | | | | | | | | | | | |
For the year ended March 31, 2007 | 9.33 | —(6),(7) | | 0.50 | 0.50 | | — | — | | — | — |
For the year ended March 31, 2006 | 8.15 | (0.01)(6) | | 1.19 | 1.18 | | — | — | | — | — |
For the year ended March 31, 2005 | 7.92 | 0.02(6) | | 0.23 | 0.25 | (0.02) | — | | — | (0.02) |
August 15, 2003 to March 31, 2004(1) | 6.95 | 0.09(6) | | 0.92 | 1.01 | (0.04) | — | | — | (0.04) |
U.S. Large Capitalization Value Fund | | | | | | | | | | | |
For the year ended March 31, 2007 | 11.87 | 0.11(6) | | 1.45 | 1.56 | (0.24) | (0.49) | | — | (0.73) |
May 2, 2005 to March 31, 2006(1) | 10.00 | 0.13(6) | | 1.80 | 1.93 | | — | (0.06) | | — | (0.06) |
U.S. Discovery Fund | | | | | | | | | | | |
For the year ended March 31, 2007 | 19.07 | (0.06) | | 1.06 | 1.00 | | — | (0.48) | | — | (0.48) |
For the year ended March 31, 2006 | 15.88 | (0.03) | | 3.55 | 3.52 | | — | (0.16) | (0.17) | (0.33) |
For the year ended March 31, 2005 | 14.66 | (0.05)(6) | | 1.47 | 1.42 | (0.02) | (0.18) | | — | (0.20) |
For the year ended March 31, 2004 | 9.53 | 0.01(6) | | 5.24 | 5.25 | | — | (0.12) | | — | (0.12) |
For the year ended March 31, 2003 | 11.08 | 0.02(6) | | (1.57) | (1.55) | | — | — | | — | — |
U.S. Small Capitalization Fund | | | | | | | | | | | |
For the year ended March 31, 2007 | 13.77 | (0.03) | | 0.11 | 0.08 | | — | (1.63) | | — | (1.63) |
For the year ended March 31, 2006 | 13.30 | (0.04) | | 2.37 | 2.33 | | — | (1.86) | | — | (1.86) |
For the year ended March 31, 2005 | 13.65 | (0.02)(6) | | 1.26 | 1.24 | | — | (1.59) | | — | (1.59) |
For the year ended March 31, 2004 | 8.88 | 0.01 | | 4.98 | 4.99 | (0.02) | (0.20) | | — | (0.22) |
For the year ended March 31, 2003 | 11.08 | —(6),(7) | | (1.92) | (1.92) | (0.01) | (0.27) | | — | (0.28) |
International Equity Fund | | | | | | | | | | | |
For the year ended March 31, 2007 | 11.77 | 0.14 | | 1.97 | 2.11 | (0.09) | (0.25) | | — | (0.34) |
For the year ended March 31, 2006 | 9.61 | 0.10 | | 2.14 | 2.24 | (0.08) | — | | — | (0.08) |
For the year ended March 31, 2005 | 8.47 | 0.06(6) | | 1.11 | 1.17 | (0.03) | — | | — | (0.03) |
For the year ended March 31, 2004 | 5.57 | 0.03(6) | | 2.93 | 2.96 | (0.08) | — | | — | (0.08) |
For the year ended March 31, 2003 | 7.05 | 0.07(6) | | (1.54) | (1.47) | (0.02) | — | | — | (0.02) |
International Discovery Fund | | | | | | | | | | | |
May 31, 2006 to March 31, 2007(1) | 10.00 | 0.06(6) | | 2.06 | 2.12 | (0.06) | (0.02) | | — | (0.08) |
International Small Capitalization | | | | | | | | | | | |
Fund | | | | | | | | | | | |
For the year ended March 31, 2007 | 20.74 | 0.20 | | 3.82 | 4.02 | (0.30) | (2.08) | | — | (2.38) |
For the year ended March 31, 2006 | 16.73 | 0.08 | | 4.89 | 4.97 | (0.04) | (0.92) | | — | (0.96) |
For the year ended March 31, 2005 | 13.83 | 0.03(6) | | 3.51 | 3.54 | (0.02) | (0.62) | | — | (0.64) |
For the year ended March 31, 2004 | 7.87 | 0.03(6) | | 6.01 | 6.04 | (0.08) | — | | — | (0.08) |
For the year ended March 31, 2003 | 8.43 | 0.08(6) | | (0.57) | (0.49) | (0.09) | — | | — | (0.09) |
U.S. Large/Mid Capitalization | | | | | | | | | | | |
Long/Short Equity Fund | | | | | | | | | | | |
For the year ended March 31, 2007 | 12.12 | 0.50 | | 0.05 | 0.55 | (0.49) | — | | — | (0.49) |
For the year ended March 31, 2006 | 11.46 | 0.22 | | 0.59 | 0.81 | (0.15) | — | | — | (0.15) |
For the year ended March 31, 2005 | 10.86 | (0.04)(6) | | 0.64 | 0.60 | | — | — | | — | — |
For the year ended March 31, 2004 | 11.61 | (0.10)(6) | | (0.65) | (0.75) | | — | — | | — | — |
For the year ended March 31, 2003 | 10.34 | (0.05)(6) | | 1.33 | 1.28 | (0.02) | — | | — | (0.02) |
Global Long/Short Equity Fund | | | | | | | | | | | |
For the year ended March 31, 2007 | 12.16 | 0.12(6) | | 0.05 | 0.17 | (0.21) | — | | — | (0.21) |
For the year ended March 31, 2006 | 11.49 | 0.01(6) | | 0.74 | 0.75 | (0.08) | — | | — | (0.08) |
For the year ended March 31, 2005 | 11.21 | (0.17)(6) | | 0.43 | 0.26 | | — | — | | — | — |
For the year ended March 31, 2004* | 11.81 | (0.17)(6) | | (0.43) | (0.60) | | — | — | | — | — |
For the year ended March 31, 2003 | 10.13 | (0.09)(6) | | 1.75 | 1.66 | | — | — | | — | — |
Value Long/Short Equity Fund | | | | | | | | | | | |
For the year ended March 31, 2007 | 10.55 | 0.26 | | 0.03 | 0.29 | (0.21) | — | | — | (0.21) |
For the year ended March 31, 2006 | 10.41 | 0.12(6) | | 0.10 | 0.22 | (0.08) | — | | — | (0.08) |
For the year ended March 31, 2005 | 9.81 | (0.06)(6) | | 0.66 | 0.60 | | — | — | | — | — |
For the year ended March 31, 2004 | 10.43 | (0.09)(6) | | (0.53) | (0.62) | | — | — | | — | — |
For the year ended March 31, 2003 | 8.95 | (0.05)(6) | | 1.53 | 1.48 | | — | — | | — | — |
(1) From the commencement of operations. (2) Not annualized for periods less than one year. (3) Annualized for periods less than one year.
(4) Includes interest expense and dividend expense on securities sold short.
(5) Portfolio turnover is calculated on the basis of the Fund as a whole without distinguishing between the classes of shares issued. (6) Calculated based on the average shares outstanding during the period.
(7) Amount less than $0.005.
(8) Exclusive of nonrecurring account fees, extraordinary expenses, interest expense, and dividends on securities sold short.
(9) The ratios of Expenses before Waivers/Reimbursements and Expenses Net of Waivers/Reimbursements have been adjusted from 3.89% and 3.11%, respectively, to more appropriately reflect expenses incurred for the period.
(10) The ratio of net operating expenses for the Laudus U.S. Large Capitalization Fund would have been 1.29% if overdraft expenses had not been included.
144 Laudus Funds Annual Report
See the accompanying notes to the financial statements.
Financial Statements—Financial Highlights continued
$ | —(7) | $12.35 | 0.90% | $ 48,923 | (0.14)% | 1.20% | 1.20% | 1.20% | 76.00% |
| — | 13.88 | 19.09 | 49,952 | (0.24) | 1.32 | 1.32 | 1.32 | 69.26 |
| —(7) | 13.38 | 9.12 | 41,104 | (0.01) | 1.31 | 1.31 | 1.31 | 68.09 |
| —(7) | 13.71 | 56.53 | 44,059 | 0.19 | 1.40 | 1.40 | 1.40 | 75.65 |
| — | 8.91 | (17.35) | 25,973 | 0.07 | 1.54 | 1.40 | 1.40 | 70.83 |
| | | | | | | | | |
| | | | | | | | | |
| —(7) | 13.21 | 10.69 | 10,074 | 0.52 | 1.38 | 1.30 | 1.30(10) | 144.21 |
| — | 12.36 | 14.57 | 10,026 | 0.50 | 1.52 | 1.34 | 1.33 | 144.32 |
| — | 11.81 | 9.22 | 2,786 | 0.69 | 1.58 | 1.35 | 1.35 | 127.89 |
| —(7) | 10.96 | 31.89 | 590 | 0.24 | 1.51 | 1.25 | 1.25 | 141.50 |
| — | 8.31 | (6.42) | 666 | 0.87 | 3.05 | 1.25 | 1.25 | 100.79 |
| | | | | | | | | |
| —(7) | 9.83 | 5.36 | 2,242 | (0.01) | 1.43 | 1.29 | 1.29 | 70.73 |
| — | 9.33 | 14.48 | 1,810 | (0.12) | 1.91 | 1.33 | 1.33 | 78.70 |
| —(7) | 8.15 | 3.14 | 1,894 | 0.21 | 2.68 | 1.32 | 1.32 | 77.81 |
| —(7) | 7.92 | 14.50 | 1,479 | 1.12 | 2.72 | 1.11 | 1.39 | 177.43 |
| | | | | | | | | |
| — | 12.70 | 13.22 | 540 | 0.90 | 2.75 | 1.29 | 1.29 | 107.77 |
| — | 11.87 | 19.33 | 145 | 1.31 | 2.78 | 0.96 | 0.96 | 81.30 |
| | | | | | | | | |
| —(7) | 19.59 | 5.34 | 217,045 | (0.21) | 1.35 | 1.34 | 1.34 | 85.69 |
| — | 19.07 | 22.40 | 284,285 | (0.20) | 1.43 | 1.43 | 1.43 | 88.63 |
| —(7) | 15.88 | 9.70 | 58,284 | (0.30) | 1.55 | 1.49 | 1.49 | 62.60 |
| —(7) | 14.66 | 55.22 | 2,581 | 0.04 | 1.63 | 1.40 | 1.40 | 93.08 |
| — | 9.53 | (13.99) | 104 | 0.20 | 6.18 | 1.40 | 1.40 | 98.65 |
| | | | | | | | | |
| —(7) | 12.22 | 0.75 | 269,185 | (0.25) | 1.30 | 1.30 | 1.30 | 76.00 |
| — | 13.77 | 18.98 | 311,822 | (0.33) | 1.39 | 1.39 | 1.39 | 69.26 |
| —(7) | 13.30 | 9.00 | 297,927 | (0.15) | 1.43 | 1.43 | 1.43 | 68.09 |
| —(7) | 13.65 | 56.40 | 272,481 | 0.11 | 1.47 | 1.47 | 1.47 | 75.65 |
| — | 8.88 | (17.42) | 136,293 | (0.02) | 1.63 | 1.49 | 1.49 | 70.83 |
| | | | | | | | | |
| —(7) | 13.54 | 18.08 | 61,411 | 1.17 | 1.71 | 1.64 | 1.64 | 64.19 |
| — | 11.77 | 23.41 | 18,824 | 1.02 | 2.33 | 1.72 | 1.72 | 59.40 |
| —(7) | 9.61 | 13.79 | 12,491 | 0.65 | 2.96 | 1.72 | 1.72 | 52.06 |
0.02 | 8.47 | 53.61 | 2,881 | 0.45 | 4.46 | 1.59 | 1.59 | 107.02 |
0.01 | 5.57 | (20.73) | 17 | 1.06 | 5.27 | 1.60 | 1.60 | 138.85 |
| | | | | | | | | |
| —(7) | 12.04 | 21.62 | 51,572 | 0.75 | 2.03 | 1.64 | 1.64 | 105.81 |
| | | | | | | | | |
| —(7) | 22.38 | 20.35 | 882,163 | 0.87 | 1.47 | 1.47 | 1.47 | 91.82 |
| — | 20.74 | 30.48 | 804,340 | 0.42 | 1.60 | 1.60 | 1.60 | 101.86 |
| —(7) | 16.73 | 26.16 | 355,766 | 0.20 | 1.88 | 1.83 | 1.83 | 59.70 |
| —(7) | 13.83 | 76.91 | 82,780 | 0.28 | 2.18 | 1.75 | 1.75 | 102.50 |
0.02 | 7.87 | (5.53) | 16,834 | 0.99 | 2.93 | 1.78 | 1.78 | 129.34 |
| | | | | | | | | |
0.01 | 12.19 | 4.68 | 9,148 | 3.40 | 3.46 | 2.98 | 1.54 | 168.86 |
| — | 12.12 | 7.09 | 11,755 | 2.14 | 3.31 | 3.02 | 1.59 | 212.62 |
| —(7) | 11.46 | 5.52 | 12,824 | (0.33) | 3.55 | 3.26 | 1.61 | 180.14 |
| —(7) | 10.86 | (6.46) | 8,693 | (0.93) | 3.51 | 3.12 | 1.55 | 189.35 |
0.01 | 11.61 | 12.49 | 16,251 | (0.45) | 3.91 | 3.07 | 1.54 | 185.66 |
| | | | | | | | | |
| —(7) | 12.12 | 1.45 | 3,655 | 0.98 | 4.04 | 3.78 | 2.29 | 233.95 |
| — | 12.16 | 6.58 | 10,859 | 0.10 | 3.68 | 3.41 | 2.29 | 178.43 |
0.02 | 11.49 | 2.50 | 6,094 | (1.57) | 4.80 | 4.27 | 2.34 | 152.24 |
| —(7) | 11.21 | (5.08) | 8,533 | (1.50) | 4.01(9) | 3.23(9) | 2.14 | 175.85 |
0.02 | 11.81 | 16.58 | 9,474 | (0.80) | 4.42 | 2.92 | 1.80 | 189.09 |
| | | | | | | | | |
| —(7) | 10.63 | 2.81 | 64,400 | 2.41 | 3.28 | 3.28 | 1.99 | 139.74 |
| — | 10.55 | 2.08 | 63,036 | 1.17 | 3.22 | 3.22 | 2.06 | 121.80 |
| —(7) | 10.41 | 6.12 | 34,930 | (0.55) | 3.37 | 3.30 | 2.06 | 111.19 |
| —(7) | 9.81 | (5.94) | 34,081 | (0.90) | 3.18 | 3.06 | 2.05 | 76.36 |
| — | 10.43 | 16.54 | 38,473 | (0.43) | 2.97 | 2.69 | 2.02 | 209.95 |
See the accompanying notes to the financial statements.
Laudus Funds Annual Report 145
Financial Statements
Notes to Financial Statements as of 3/31/07
1. Organization.
Laudus Trust, (the ‘‘Trust’’) was established as a Massachusetts business trust under the laws of Massachusetts on April 1, 1988. The Trust is an open-end diversified management investment company consisting of twelve portfolios, eleven of which were operational, as of March 31, 2007 (individually, a ‘‘Fund’’ and collectively the ‘‘Funds’’);
Laudus Rosenberg U.S. Large Capitalization Fund,
Laudus Rosenberg U.S. Large Capitalization Growth Fund,
Laudus Rosenberg U.S. Large Capitalization Value Fund,
Laudus Rosenberg U.S. Discovery Fund,
Laudus Rosenberg U.S. Small Capitalization Fund,
Laudus Rosenberg International Equity Fund,
Laudus Rosenberg International Discovery Fund,
Laudus Rosenberg International Small Capitalization Fund,
Laudus Rosenberg U.S. Large/Mid Capitalization Long/Short Equity Fund,
Laudus Rosenberg Global Long/Short Equity Fund,
Laudus Rosenberg Value Long/Short Equity Fund.
As of March 31, 2007, the Laudus Rosenberg U.S. Long/Short Equity Fund was not operational. As of October 15, 2004 and May 1, 2006 the Laudus Rosenberg U.S. Small Capitalization Fund and the Laudus Rosenberg U.S. Discovery Fund, respectively, were closed to new investors. The Laudus Rosenberg International Small Capitalization Fund closed to new investors on December 31, 2005, and as of May 31, 2007, the Fund will close to all investors, except the Fund will continue to offer shares to certain qualified retirement plans and through reinvestment of dividends and capital gains. As of May 31, 2006, the Laudus Rosenberg International Discovery Fund commenced operation.
Each Fund is authorized to issue an unlimited number of Institutional Shares and Investor Shares of no par value, and the Laudus Rosenberg U.S. Small Capitalization Fund is also authorized to issue an unlimited number of Adviser Shares of no par value. Each class of shares generally has identical rights and preferences, except that each class is subject to different eligibility conditions, bears different distribution and sub-transfer agent expenses, and has separate voting rights on matters pertaining solely to that class of shares.
Under the Funds’ organizational documents, its officers and trustees are indemnified against certain liabilities arising out of the performance of their duties to the Funds. In addition, in the normal course of business, the Funds enter into contracts with their vendors and others that provide for general indemnifications. The Funds’ maximum exposure under these arrangements is unknown, as this would involve future claims that may be made against the Funds. However, based on experience, the Funds expect that risk of loss to be remote.
2. Significant Accounting Policies.
The preparation of financial statements in conformity with accounting principles generally accepted in the United States of America requires management to make estimates and assumptions that affect the reported amounts and disclosures in the financial statements. Actual amounts could differ from those estimates. The following is a summary of significant accounting policies followed by the Trust in the preparation of its financial statements.
Security Valuation
Each Fund uses approved pricing services to provide values for its portfolio securities. Current market values are generally determined by the approved pricing services as follows: securities traded on stock exchanges are valued at the last-quoted sales price on the exchange on which such securities are primarily traded (closing values), or, lacking any sales, at the mean between the bid and ask prices; securities traded in the over-the-counter market are valued at the last sales price that day, or, if there are no sales that day, at the mean between the bid and ask prices. In addition, securities that are primarily traded on foreign exchanges are generally valued at the preceding closing values of such securities on their respective exchanges with these values then translated into U.S. dollars at the current exchange rate. Securities may be fair valued pursuant to procedures approved by the Funds’ Board of Trustees when approved pricing services do not provide a value for a security, a furnished price appears manifestly incorrect or events occur prior to the close of the New York Stock Exchange that materially affect the furnished price.
Other investment companies are valued at their respective net asset values as determined by those funds, in
146 Laudus Trust Annual Report
Financial Statements—Notes to Financial Statements as of 3/31/07
continued accordance with the Investment Company Act of 1940 for a given day.
Security Transactions and Related Investment Income
Changes in holdings of portfolio securities are reflected no later than on the first business day following the trade date. However, for financial reporting purposes, portfolio security transactions are reported on trade date. Net realized gains or losses from sales of securities are determined on the specific identification cost method. Interest income and expenses are recognized on the accrual basis. Dividend income, less foreign taxes withheld, (if any) and dividend expenses are recorded on the ex-dividend date. Interest income is recorded as earned.
Foreign Currency Transactions
The accounting records of the Funds are maintained in U.S. dollars. All monetary items denominated in foreign currencies are translated to U.S. dollars based upon the prevailing exchange rate at the close of each business day. Net realized gains and losses on foreign currency transactions represent net gains and losses from currency gains and losses realized between the trade and settlement dates on securities transactions, and the difference between the amount of net investment income accrued and the U.S. dollar amount actually received. Further, the effects of changes in foreign currency exchange rates on investments in securities are not segregated in the Statement of Operations from the effects of changes in market prices of those securities, but are included with the net realized gain or loss and unrealized appreciation or depreciation on investments.
Forward Foreign Currency Contracts
Forward foreign currency contracts are valued at the daily exchange rate of the underlying currency. The forward foreign currency contracts are adjusted by the daily exchange rate of the underlying currency and any gains or losses are recorded for financial statement purposes as unrealized appreciation or depreciation until the contractual settlement date. Gains or losses from the purchase or sale of forward foreign currency contracts are recorded as realized on the settlement date.
Foreign Securities
The Laudus Rosenberg International Equity Fund, Laudus Rosenberg International Discovery Fund, Laudus
Rosenberg International Small Capitalization Fund, and Laudus Rosenberg Global Long/Short Equity Fund pursue their respective objectives by investing in foreign securities. Investments in securities of foreign issuers involve certain risks that are less significant for investments in securities of U.S. issuers. These include risks of adverse changes in foreign economic, political, regulatory and other conditions, and changes in currency exchange rates or exchange control regulations (including currency blockage). The Funds may be unable to obtain and enforce judgments against foreign entities, and issuers of foreign securities are subject to different, and often less comprehensive, accounting, reporting and disclosure requirements than domestic issuers. Also, the securities of some foreign companies may be less liquid and at times more volatile than securities of comparable U.S. companies.
Real Estate Investment Trusts
Several Funds may own shares of real estate investment trusts (‘‘REITs’’) which report information on the source of their distributions annually. Certain distributions received from REITs during the year, which are known to be a return of capital, are recorded as a reduction to the cost of the individual REIT.
Repurchase Agreements
In a repurchase agreement, a Fund buys a security from another party (usually a financial institution) with the agreement that the security will be sold back in the future. The date, price and other conditions are all specified when the agreement is created.
The Funds’ repurchase agreements are currently fully collateralized by U.S. Government Securities. All collateral is held by the Funds’ Custodian (or, with tri-party agreements, the agent’s bank) and is monitored daily to ensure that its market value is at least equal to the repurchase price under the agreement.
Short Sales
The Laudus Rosenberg U.S. Large/Mid Capitalization Long/Short Equity Fund, Laudus Rosenberg Global Long/Short Equity Fund and Laudus Rosenberg Value Long/Short Equity Fund are authorized to engage in short sales. Short sales are transactions in which a Fund sells a security it does not own, in anticipation of a decline in the market value of that security. To complete such a transaction, the Fund must borrow the security to
Laudus Trust Annual Report 147
Financial Statements—Notes to Financial Statements as of 3/31/07
continued deliver to the buyer upon the short sale; the Fund is then obligated to replace the security borrowed by purchasing the security at current market value sometime in the future. The Fund will incur a loss if the price of the security increases between the date of the short sale and the date on which the Fund replaces the borrowed security. The Fund will realize a gain if the price of the security declines between those dates. The potential for losses associated with short positions is much greater than the original value of the securities sold short and may exceed the market value of securities sold short recorded in the Statement of Assets and Liabilities. Until the Fund replaces the borrowed security, the Fund will maintain a segregated account at the Custodian Bank with cash, U.S. Government Securities and/or securities held long by the portfolio to sufficiently cover its short position on a daily basis. The collateral for the securities sold short includes the Deposits with Broker and Custodian Bank as shown in the Statement of Assets and Liabilities and the securities held long as shown in the Statement of Portfolio Investments. Interest accrued or dividends paid on Securities Sold Short are recorded as an expense on the Fund’s records.
Securities Lending
Under the Securities Lending Program, securities held by the Laudus Rosenberg U.S. Large Capitalization Growth Fund, the Laudus Rosenberg U.S. Discovery Fund, the Laudus Rosenberg U.S. Small Capitalization Fund and the Laudus Rosenberg International Small Capitalization Fund are loaned by State Street Corporation, as agent, to certain brokers (the ‘‘Borrowers’’). The Borrowers provide cash or U.S. Government securities as collateral against loans in an amount at least equal to 100% of the market value of the loaned securities.
The cash collateral of securities loaned is invested in high quality, short-term investments such as money market funds and U.S. government securities. The investments of collateral are marked-to-market daily and the value of the collateral must be at least 100% of the market value of the loan securities each day.
At March 31, 2007, the following Funds had collateral and loans outstanding of:
| | | | Value of |
| | Value of | | Loaned |
| | Collateral | | Securities |
| | | | |
Laudus Rosenberg U.S. Large | | | | |
Capitalization Growth Fund | $ | 6,243,025 | $ | 6,102,606 |
Laudus Rosenberg U.S. Discovery Fund | | 72,805,635 | | 70,971,484 |
Laudus Rosenberg U.S. Small | | | | |
Capitalization Fund | | 90,803,224 | | 88,385,432 |
Laudus Rosenberg International | | | | |
Small Capitalization Fund | | 146,492,602 | | 139,234,977 |
Expense, Investment Income and Gain/Loss Allocation
Expenses directly attributable to a Fund are charged to that Fund; expenses not directly attributable to a Fund are allocated proportionately among each Fund within the Trust in relation to the net assets of each Fund or on another reasonable basis. Expenses specific to a class are charged to that class. Expenses other than class specific expenses are allocated daily to each class based upon the proportion of relative net assets or another reasonable basis. The investment income and expenses of the Fund (other than class specific expenses charged to a class) and realized and unrealized gains and losses on investments of the Fund are allocated to each class of shares based upon relative net assets on the date income is earned, or expenses and realized/unrealized gains and losses are incurred.
Distributions
Distributions to shareholders are recorded on the ex-dividend date. Distributions are made annually on a tax basis, which may differ from distribution amounts determined under accounting principles generally accepted in the United States of America. These differences are primarily due to differing treatments for foreign currency transactions, REITs, and wash sales for book and tax purposes.
Federal Income Taxes
It is the Funds’ policy to comply with the requirements of the Internal Revenue Code under Subchapter M, applicable to regulated investments companies, and to distribute substantially all of its taxable income, including any net realized gain on investments, to its shareholders. Therefore, no provisions are made for federal income taxes.
148 Laudus Trust Annual Report
Financial Statements—Notes to Financial Statements as of 3/31/07 continued
Custody Credit
Each fund has an arrangement with its custodian bank under which the fund receives a credit for its uninvested cash balance to offset its custody fees and accounting fees. The credit amounts are disclosed in the Statement of Operations as a reduction to the Funds’ total expenses.
New Accounting Standards
Financial Accounting Standards Board Interpretation (FIN) No. 48 — Accounting for Uncertainty in Income Taxes — an Interpretation of SFAS No. 109, was issued in July 2006 and is effective for fiscal years beginning after December 15, 2006. A Fund with a fiscal year ending March 31 will implement FIN 48 no later than September 28, 2007, and it will apply to all open tax years. This Interpretation provides new requirements for the recognition, measurement, and disclosure in the financial statements of a tax position taken or expected to be taken in a tax return when there is uncertainty about whether that tax position will ultimately be sustained. We have not yet completed our evaluation of the impact, if any, of adopting FIN 48 on the Funds’ financial statements.
In September 2006, the Financial Accounting Standards Board (FASB) issued Statement of Financial Accounting Standards No. 157, ‘‘Fair Value Measurements’’ (SFAS No. 157). SFAS No. 157 defines fair value, establishes a framework for measuring fair value in accordance with generally accepted accounting principles and expands disclosure about fair value measurements. SFAS No. 157 is effective for fiscal years beginning after November 15, 2007. Management is currently evaluating the impact the adoption of SFAS No. 157 will have on the Funds’ financial statement disclosures.
3. Management, Administration, Fund Accounting, Distribution and Shareholder Service Agreements.
The Trust’s Board of Trustees oversees the general conduct of the Trust and the Funds.
Charles Schwab Investment Management, Inc. (‘‘CSIM’’ or the ‘‘Manager’’) is the investment adviser of the Funds and manages the Funds’ business, subject to the supervision of the Board of Trustees. AXA Rosenberg Investment Management LLC (‘‘AXA Rosenberg’’), the Funds’ sub-adviser, provides day-to-day portfolio management services to the Funds, subject to the supervision of CSIM.
The Funds pay CSIM an advisory fee for these services on a monthly basis. CSIM — and not the Funds — pays a portion of the advisory fees it receives to AXA Rosenberg in return for its services.
The table below sets forth the advisory fee rates payable to CSIM by each Fund.
| Agreement Rate* |
| |
Laudus Rosenberg U.S. Large | |
Capitalization Fund | 1st $1 billion-0.75% |
| $1 billion to $2 billion-0.70% |
| Over $2 billion-0.675% |
Laudus Rosenberg U.S. Large | |
Capitalization Growth Fund | 1st $1 billion-0.75% |
| $1 billion to $2 billion-0.70% |
| Over $2 billion-0.675% |
Laudus Rosenberg U.S. Large | |
Capitalization Value Fund | 1st $1 billion-0.75% |
| $1 billion to $2 billion-0.70% |
| Over $2 billion-0.675% |
Laudus Rosenberg U.S. Discovery | |
Fund | 1st $1 billion-0.90% |
| Over $1 billion-0.85% |
Laudus Rosenberg U.S. Small | |
Capitalization Fund | 0.90% |
Laudus Rosenberg International | |
Equity Fund | 1st $1 billion-0.85% |
| $1 billion to $2 billion-0.80% |
| Over $2 billion-0.775% |
Laudus Rosenberg International | |
Discovery Fund | 1st $1 billion-1.00% |
| Over $1 billion-0.95% |
Laudus Rosenberg International | |
Small Capitalization Fund | 1st $500 million-1.00% |
| Over $500 million-0.95% |
Laudus Rosenberg U.S. Large/Mid | |
Capitalization Long/Short Equity | |
Fund | 1st $500 million-1.00% |
| Over $500 million-0.95% |
Laudus Rosenberg Global Long/ | |
Short Equity Fund | 1st $500 million-1.50% |
| Over $500 million-1.45% |
Laudus Rosenberg Value Long/ | |
Short Equity Fund | 1st $500 million-1.50% |
| Over $500 million-1.45% |
* The advisory fee payable to CSIM varies based on fund assets.
The Funds may, from time to time, execute portfolio trades with affiliated brokers/dealers. For the period ended March 31, 2007, the Funds paid no brokerage fees on the execution of portfolio trades with affiliated brokers/dealers.
CSIM has contractually agreed, until at least July 30, 2009, to waive its management fee and bear certain expenses and fees of each Fund. As such, CSIM further
Laudus Trust Annual Report 149
Financial Statements—Notes to Financial Statements as of 3/31/07 continued agrees to reimburse the Funds to limit the annual expenses, exclusive of nonrecurring account fees, fees on securities transactions such as exchange fees, dividends and interest on securities sold short, service fees, interest (overdraft charges), taxes brokerage commissions, other expenditures which are capitalized in accordance with generally accepted accounting principles, and other extraordinary expenses not incurred in the ordinary course of the Fund’s business as follows:
| Institutional | Investor |
| Shares | Shares |
| | |
Laudus Rosenberg U.S. Large | | |
Capitalization Fund | 0.99% | 1.29% |
Laudus Rosenberg U.S. Large | | |
Capitalization Growth Fund | 0.99% | 1.29% |
Laudus Rosenberg U.S. Large | | |
Capitalization Value Fund | 0.99% | 1.29% |
Laudus Rosenberg U.S. Discovery | | |
Fund | 1.14% | 1.44% |
Laudus Rosenberg U.S. Small | | |
Capitalization Fund** | 1.14% | 1.44% |
Laudus Rosenberg International | | |
Equity Fund | 1.34% | 1.64% |
Laudus Rosenberg International | | |
Discovery Fund | 1.34% | 1.65% |
Laudus Rosenberg International | | |
Small Capitalization Fund | 1.49% | 1.79% |
Laudus Rosenberg U.S. Large/Mid | | |
Capitalization Long/Short Equity | | |
Fund | 1.24% | 1.54% |
Laudus Rosenberg Global Long/ | | |
Short Equity Fund | 1.99% | 2.29% |
Laudus Rosenberg Value Long/Short | | |
Equity Fund | 1.74% | 2.04% |
** There is no Expense Limit for Adviser Shares of the Laudus |
Rosenberg U.S. Small Capitalization Fund. | |
Any amounts waived or reimbursed in a particular fiscal year will be subject to repayment through the next two fiscal years, to the extent that the repayment will not cause the Fund’s net expenses to exceed the current limit (as stated in CSIM’s contractual undertaking) during the respective year. As of March 31, 2007, the balance of recoupable expenses is as follows:
| Expires | Expires |
| 3/31/08 | 3/31/09 |
| | | | |
Laudus Rosenberg U.S. Large Capitalization | | | | |
Fund | $ | 70,081 | $ | 7,039 |
Laudus Rosenberg U.S. Large Capitalization | | | | |
Growth Fund | | 76,630 | | 36,418 |
Laudus Rosenberg U.S. Large Capitalization | | | | |
Value Fund | 105,744 | | 103,539 |
Laudus Rosenberg U.S. Discovery Fund | | 2,314 | | 26,377 |
Laudus Rosenberg U.S. Small Capitalization | | | | |
Fund | | — | | — |
Laudus Rosenberg International Equity | | | | |
Fund | 197,117 | | 31,150 |
Laudus Rosenberg International Discovery | | | | |
Fund | | — | | 167,471 |
Laudus Rosenberg International Small | | | | |
Capitalization Fund | | — | | — |
Laudus Rosenberg U.S. Large/Mid | | | | |
Capitalization Long/Short Equity Fund | | 70,537 | | 115,585 |
Laudus Rosenberg Global Long/Short | | | | |
Equity Fund | | 71,341 | | 80,685 |
Laudus Rosenberg Value Long/Short Equity | | | | |
Fund | | 3,296 | | 2,516 |
Effective October 1, 2005, State Street Bank & Trust Company serves as the Trust’s administrator and assisted the Trust in all aspects of its administration and operation. Prior to October 1, 2005, BISYS
Fund Services Ohio, Inc. (‘‘BISYS’’) performed these services.
Effective October 1, 2005, State Street Bank & Trust Company also serves as the Trust’s fund accountant. Prior to October 1, 2005, BISYS performed these services.
Effective October 10, 2005, Boston Financial Data Services, Inc. performs transfer agent services. Prior to October 10, 2005, BISYS performed these services. The Trust has a Distribution and Shareholder Service Plan with respect to its Investor Shares pursuant to Rule 12b-1 under the 1940 Act. The Investor Shares of the Fund are sold on a continuous basis by the Trust’s Distributor. Effective October 1, 2005, ALPS
Distributors, Inc. serves as the Distributor. Prior to October 1, 2005, Laudus Distributor, Inc. served as the Distributor. Under the Distribution and Shareholder Services Plan, the Funds pay distribution and shareholder servicing fees in connection with the sale and servicing of the Investor Shares. The annual Distribution and Shareholder Service Fee consists of up to 0.25% of the
150 Laudus Trust Annual Report
Financial Statements—Notes to Financial Statements as of 3/31/07
continued respective average daily net assets of the Investor Shares. In addition, the Trustees have authorized each Fund to pay up to 0.15% of its average daily net assets attributable to Investor Shares for sub-transfer agent and sub-accounting services in connection with such shares. Various service organizations act as servicing agents of the Adviser Shares of the Laudus Rosenberg U.S. Small Capitalization Fund. Such shares are subject to an annual Service Fee of up to 0.25% of the average daily net assets attributable to such shares in accordance with a Service Plan adopted by the Trust. In addition, the Trustees have authorized the Fund to pay up to 0.05% of its average daily net assets attributable to Adviser Shares for the transfer and sub-accounting services in connection with such shares.
The Board of Trustees may include people who are officers and/or directors of other fund families affiliated to the investment adviser. Federal securities law limits the percentage of the ‘‘interested persons’’ who may serve on a trust’s board, and the Laudus Funds are in compliance with these limitations. The Funds did not pay any of the interested persons for their services as trustees, but did pay non-interested persons (independent trustees), as noted in each Fund’s Statement of Operations.
In addition, a retirement plan has been instituted for all of the Independent Trustees of the Trust. Under the terms of the Retirement Plan, upon retirement or other termination from service from the Trust (other than termination for cause), a retiring Independent Trustee who has served as Independent Trustee for at least five years shall be paid a lump sum cash payment (the ‘‘Retirement Payment’’). The Retirement Payment shall be equal to $10,000 for each year that the Trustee has served as an Independent Trustee of the Trust, including years of service prior to the adoption of the Retirement Plan. However, beginning April 1, 2005, each Independent Trustee is permitted to make a one-time election to have the $10,000 attributable to service for the coming year adjusted up or down at the end of each subsequent year based on the unweighted average performance of Institutional Shares of each Fund of the
Trust. Each Independent Trustee also was given the opportunity to make a one-time election to have previously accrued benefits fluctuate beginning April 1, 2005, based on performance of the Funds as described in the previous sentence. As a result, the amount of the Retirement Payment payable to any Independent Trustee may increase or decrease based upon performance of the Funds. The portion of the total Retirement Payment owed to an Independent Trustee upon his or her retirement that is payable by any Fund will be determined based on the relative net assets of the Funds of the Trust. The Trust did not pay any pension or retirement benefits for its Trustees.
At a regular board meeting held on September 29, 2006, the Trustees voted to close the Retirement Plan to new participants, including the Independent Trustees first elected by shareholder vote on June 26, 2006 and to freeze the account balance of each participant who was a participant prior to June 26, 2006 (a ‘‘Current Participant’’). However, each Current Participant shall receive a one-half credit under the Retirement Plan for service during the plan year ending March 31, 2007 and the previously accrued benefits for which an Independent Trustee had previously elected to have adjusted for performance of the Funds would continue to be adjusted for performance as provided under the Retirement Plan. All other terms of the Retirement Plan, including without limitation provisions relating to vesting and payment upon termination of service, remain in effect.
4. Redemption Fee.
For the Funds, certain shares purchased that were redeemed or exchanged in less than 30 days, are assessed a fee of 2% of the current net asset value of the shares. The fee, which is applied to shares redeemed or exchanged in the order in which they are purchased, is retained by the Fund and is intended to limit short-term trading in the Funds, or to the extent short-term trading persists, to impose the costs of that activity on the shareholders who engage in it. Such amounts are net of the value of shares redeemed on the Statement of
Laudus Trust Annual Report 151
Financial Statements—Notes to Financial Statements as of 3/31/07 continued
Changes in Net Assets. For the period ended March 31, 2007, redemption fees assessed were as follows:
| Redemption |
| Fees |
| | |
Laudus Rosenberg U.S. Large Capitalization Fund | $ | 2,002 |
Laudus Rosenberg U.S. Large Capitalization Growth Fund | | 1,118 |
Laudus Rosenberg U.S. Large Capitalization Value Fund | | 358 |
Laudus Rosenberg U.S. Discovery Fund | | 60,262 |
Laudus Rosenberg U.S. Small Capitalization Fund | | 30,427 |
Laudus Rosenberg International Equity Fund | | 20,146 |
Laudus Rosenberg International Discovery Fund | | 20,436 |
Laudus Rosenberg International Small Capitalization Fund | 102,195 |
Laudus Rosenberg U.S. Large/Mid Capitalization Long/Short Equity Fund | | 8,813 |
Laudus Rosenberg Global Long/Short Equity Fund | | 1,500 |
Laudus Rosenberg Value Long/Short Equity Fund | | 36,207 |
| | | |
5. Security Purchases and Sales.
For the period ended March 31, 2007, purchases and sales of securities (excluding short-term securities) were as follows:
| | Purchases | | Sales |
| | | | |
Laudus Rosenberg U.S. Large Capitalization Fund | $ | 166,713,030 | $ | 135,564,031 |
Laudus Rosenberg U.S. Large | | | | |
Capitalization Growth Fund | | 69,507,024 | | 41,293,300 |
Laudus Rosenberg U.S. Large | | | | |
Capitalization Value Fund | | 7,872,004 | | 8,788,390 |
Laudus Rosenberg U.S. | | | | |
Discovery Fund | | 799,150,566 | | 863,399,111 |
Laudus Rosenberg U.S. Small | | | | |
Capitalization Fund | | 864,087,665 | 1,136,902,326 |
Laudus Rosenberg | | | | |
International Equity Fund | | 132,786,001 | | 62,417,269 |
Laudus Rosenberg International | | | | |
Discovery Fund | | 115,105,472 | | 56,702,618 |
Laudus Rosenberg | | | | |
International Small | | | | |
Capitalization Fund | | 1,604,016,672 | 1,459,986,676 |
Laudus Rosenberg U.S. Large/ | | | | |
Mid Capitalization Long/Short | | | | |
Equity Fund | | 71,898,196 | | 44,154,762 |
Laudus Rosenberg Global | | | | |
Long/ Short Equity Fund | | 120,045,201 | | 71,599,183 |
Laudus Rosenberg Value Long/ | | | | |
Short Equity Fund | | 735,865,426 | | 377,164,377 |
6. Line of Credit
The custodian has established a loan agreement for a maximum amount of 10% of total net assets for the Laudus Rosenberg Value Long/Short Equity Fund for temporary purposes. In addition, the Laudus Rosenberg U.S. Large Capitalization Fund, Laudus Rosenberg U.S. Large Capitalization Growth Fund, Laudus Rosenberg U.S. Large Capitalization Value Fund, Laudus Rosenberg U.S. Discovery Fund, Laudus Rosenberg U.S. Small Capitalization Fund, Laudus Rosenberg International Equity Fund, Laudus Rosenberg International Discovery Fund and Laudus Rosenberg International Small Capitalization Fund had access to an uncommitted line of credit up to a maximum of $100,000,000, as established by the Funds’ custodian. Interest is calculated based on the market rates at the time of borrowing. There were no borrowings on the line of credit for the period ended March 31, 2007.
152 Laudus Trust Annual Report
Financial Statements—Notes to Financial Statements as of 3/31/07 continued
7. Federal Income Taxes
Reclassifications
Permanent book and tax basis differences may result in reclassifications to capital accounts and other accounts as required. Such adjustments have no impact on net assets or the results of operations. As of March 31, 2007, the funds made the following reclassifications:

Laudus Rosenberg U.S. Large | $ | — | $ | — | $ | — |
Capitalization Fund | | | | | | |
Laudus Rosenberg U.S. Large | | — | | — | | — |
Capitalization Growth Fund | | | | | | |
Laudus Rosenberg U.S. Large | | — | | — | | — |
Capitalization Value Fund | | | | | | |
Laudus Rosenberg U.S. Discovery Fund | | 446,139 | (446,139) | | — |
Laudus Rosenberg U.S. Small | | 28,072 | | — | | (28,072) |
Capitalization Fund | | | | | | |
Laudus Rosenberg International Equity Fund | | 131,228 | | 357,161 | | (488,389) |
Laudus Rosenberg International Discovery Fund | | 196,578 | (196,578) | | — |
Laudus Rosenberg International Small | 13,303,038 | (13,303,038) | | — |
Capitalization Fund | | | | | |
Laudus Rosenberg U.S. Large/Mid Capitalization | | | | | |
Long/Short Equity Fund | | — | | — | | — |
Laudus Rosenberg | | 772,070 | (772,070) | | — |
Global Long/Short Equity Fund | | | | | | |
Laudus Rosenberg Value | | — | | — | | — |
Long/Short Equity Fund | | | | | | |
| | | | | | | | |
The tax character of distributions paid during the fiscal year ended March 31, 2007 was as follows: |
|
| | Ordinary | Long-Term | Total |
| | Income | Capital Gains | Distributions Paid |
| | | | | | |
Laudus Rosenberg U.S. Large Capitalization Fund | $ | 1,126,178 | $ | 2,949,474 | $ | 4,075,652 |
Laudus Rosenberg U.S. Large Capitalization Growth Fund | | 135,787 | | — | | 135,787 |
Laudus Rosenberg U.S. Large Capitalization Value Fund | | 318,229 | | 138,325 | | 456,554 |
Laudus Rosenberg U.S. Discovery Fund | | 606,878 | 23,594,419 | | 24,201,297 |
Laudus Rosenberg U.S. Small Capitalization Fund | | — | 134,761,584 | | 134,761,584 |
Laudus Rosenberg International Equity Fund | | 1,036,481 | 2,387,301 | | 3,423,782 |
Laudus Rosenberg International Discovery Fund | | 456,108 | | — | | 456,108 |
Laudus Rosenberg International Small Capitalization Fund | | 94,586,998 | 84,145,857 | | 178,732,855 |
Laudus Rosenberg U.S. Large/Mid Capitalization | | | | | | |
Long/Short Equity Fund | | 1,011,251 | | — | | 1,011,251 |
Laudus Rosenberg Global Long/Short Equity Fund | | 592,033 | | — | | 592,033 |
Laudus Rosenberg Value Long/Short Equity Fund | | 7,134,576 | | — | | 7,134,576 |
| | | | | | | |
Laudus Trust Annual Report 153
Financial Statements—Notes to Financial Statements as of 3/31/07 continued
The tax character of distributions paid during the fiscal year ended March 31, 2006 was as follows: |
| | | | Total | | | |
| | Ordinary | Long-Term | Taxable | Return of | | Total |
| | Income | Capital Gains | Distributions | Capital | Distributions Paid |
| | | | | | | | | | |
Laudus Rosenberg U.S. Large Capitalization | | | | | | | | | | |
Fund | $ | 794,781 | $ | 3,748,563 | $ | 4,543,344 | $ | — | $ | 4,543,344 |
Laudus Rosenberg U.S. Large Capitalization | | | | | | | | | | |
Growth Fund | | 23,348 | | — | | 23,348 | | — | | 23,348 |
Laudus Rosenberg U.S. Large Capitalization | | | | | | | | | | |
Value Fund | | 44,078 | | 322 | | 44,400 | | — | | 44,400 |
Laudus Rosenberg U.S. Discovery Fund | | — | | 7,254,221 | | 7,254,221 | 7,273,884 | | 14,528,105 |
Laudus Rosenberg U.S. Small Capitalization | | | | | | | | | | |
Fund | | 2,130,940 | 155,393,262 | 157,524,202 | | — | | 157,524,202 |
Laudus Rosenberg International Equity Fund | | 313,720 | | — | | 313,720 | | — | | 313,720 |
Laudus Rosenberg International Discovery | | | | | | | | | | |
Fund | | — | | — | | — | | — | | — |
Laudus Rosenberg International Small | | | | | | | | | | |
Capitalization Fund | 27,375,525 | 27,702,852 | 55,078,377 | | — | | 55,078,377 |
Laudus Rosenberg U.S. Large/Mid | | | | | | | | | | |
Capitalization Long/Short Equity Fund | | 386,331 | | — | | 386,331 | | — | | 386,331 |
Laudus Rosenberg Global Long/Short Equity | | | | | | | | | | |
Fund | | 270,469 | | — | | 270,469 | | — | | 270,469 |
Laudus Rosenberg Value Long/Short Equity | | | | | | | | | | |
Fund | | 1,939,980 | | — | | 1,939,980 | | — | | 1,939,980 |
As of March 31, 2007, the following is the net capital loss carry forward, which is available to offset |
future realized gains. |
| | | | | | | Expires | | | |
| 2008 | 2009 | 2010 | 2011 | 2012 | 2013 | 2014 | 2015 | Total |
| | | | | | | | | | | | | | | | | | | | |
Laudus Rosenberg U.S. | | | | | | | | | | | | | | | | | | | | |
Large Capitalization Fund | $ | — | $ | | — | $ | — | $ | — | $ | | — | $ | — | $— | $ | | — | | $— |
Laudus Rosenberg U.S. | | | | | | | | | | | | | | | | | | | | |
Large Capitalization | | | | | | | | | | | | | | | | | | | | |
Growth Fund | | — | | | — | 148,863 | 451,611 | | | — | 193,612 | — | | 883,199 | 1,677,285 |
Laudus Rosenberg U.S. | | | | | | | | | | | | | | | | | | | | |
Large Capitalization | | | | | | | | | | | | | | | | | | | | |
Value Fund | | — | | | — | | — | | — | | | — | | — | — | | | — | | — |
Laudus Rosenberg U.S. | | | | | | | | | | | | | | | | | | | | |
Discovery Fund | | — | | | — | | — | | — | | | — | | — | — | | | — | | — |
Laudus Rosenberg U.S. | | | | | | | | | | | | | | | | | | | | |
Small Capitalization Fund | | — | | | — | | — | | — | | | — | | — | — | | | — | | — |
Laudus Rosenberg | | | | | | | | | | | | | | | | | | | | |
International Equity Fund | | — | | | — | | — | | — | | | — | | — | — | | | — | | — |
Laudus Rosenberg | | | | | | | | | | | | | | | | | | | | |
International Discovery | | — | | | — | | — | | — | | | — | | — | — | | | — | | — |
Fund | | | | | | | | | | | | | | | | | | | | |
Laudus Rosenberg | | | | | | | | | | | | | | | | | | | | |
International Small | | | | | | | | | | | | | | | | | | | | |
Capitalization Fund | | — | | | — | | — | | — | | | — | | — | — | | | — | | — |
Laudus Rosenberg U.S. | | | | | | | | | | | | | | | | | | | | |
Large/ Mid Capitalization | | | | | | | | | | | | | | | | | | | | |
Long/Short Equity Fund | | — | | | — | | — | | — | 1,387,824 | 385,118 | — | | | — | 1,772,942 |
Laudus Rosenberg Global | | | | | | | | | | | | | | | | | | | | |
Long/Short Equity Fund | | — | | | — | | — | | — | 430,603 | 177,288 | — | | | — | 607,891 |
Laudus Rosenberg Value | | | | | | | | | | | | | | | | | | | | |
Long/Short Equity Fund | 26,836,920 | 11,040,106 | | — | | — | 20,890,232 | | — | — | 13,099,020 | 71,866,278 |
154 Laudus Trust Annual Report
Financial Statements—Notes to Financial Statements as of 3/31/07 continued
Net losses incurred after October 31 and within the taxable year are deemed to arise on the first business day of the Funds’ next taxable year. For the year ended March 31, 2007, the Funds deferred to April 1, 2007 post October losses of:
| Capital | Currency s |
| Losses | Losses |
Laudus Rosenberg U.S. Large Capitalization Fund | $ | — | $— |
Laudus Rosenberg U.S. Large Capitalization Growth Fund | | — | — |
Laudus Rosenberg U.S. Large Capitalization Value Fund | | — | — |
Laudus Rosenberg U.S. Discovery Fund | | — | — |
Laudus Rosenberg U.S. Small Capitalization Fund | | — | — |
Laudus Rosenberg International Equity Fund | | — | — |
Laudus Rosenberg International Discovery Fund | | — | — |
Laudus Rosenberg International Small Capitalization Fund | | — | — |
Laudus Rosenberg U.S. Large/Mid Capitalization Long/Short Equity Fund | | — | — |
Laudus Rosenberg Global Long/Short Equity Fund | | — | — |
Laudus Rosenberg Value Long/Short Equity Fund | 12,782,282 | — |
The funds utilized capital loss carryforward during the year end March 31, 2007 in the amount of: |
| Capital Losses |
| Utilized |
| |
Laudus Rosenberg U.S. Large Capitalization Fund | $ — |
Laudus Rosenberg U.S. Large Capitalization Growth Fund | — |
Laudus Rosenberg U.S. Large Capitalization Value Fund | — |
Laudus Rosenberg U.S. Discovery Fund | — |
Laudus Rosenberg U.S. Small Capitalization Fund | — |
Laudus Rosenberg International Equity Fund | 7,313 |
Laudus Rosenberg International Discovery Fund | — |
Laudus Rosenberg International Small Capitalization Fund | — |
Laudus Rosenberg U.S. Large/Mid Capitalization Long/Short Equity Fund | 514,914 |
Laudus Rosenberg Global Long/Short Equity Fund | 182,043 |
Laudus Rosenberg Value Long/Short Equity Fund | — |
As of March 31, 2007, the components of distributable earnings/accumulated(losses) on a tax basis were as |
follows: |
| | | Undistributed | | | |
| Undistributed | Long-Term | Accumulated | Net |
| Ordinary | Capital | Capital and | Unrealized |
| Income | Gains | Other Losses | Appreciation |
| | | | | | | |
Laudus Rosenberg U.S. Large Capitalization Fund | $ | 2,773,625 | $ 3,442,906 | $ | (4,727) | $ | 11,894,948 |
Laudus Rosenberg U.S. Large Capitalization Growth Fund | | 62,663 | — | (1,678,522) | | 7,628,463 |
Laudus Rosenberg U.S. Large Capitalization Value Fund | | 136,488 | 421,928 | | (157) | | 984,236 |
Laudus Rosenberg U.S. Discovery Fund | | — | 19,075,466 | | 734 | 166,951,847 |
Laudus Rosenberg U.S. Small Capitalization Fund | | 42,653 | 55,524,544 | | (68,868) | 242,238,845 |
Laudus Rosenberg International Equity Fund | | 3,985,898 | 1,661,491 | | (3,214) | | 19,009,785 |
Laudus Rosenberg International Discovery Fund | | 3,207,951 | — | | (395) | | 7,834,432 |
Laudus Rosenberg International Small Capitalization Fund | 66,689,898 | 61,723,853 | | (69,897) | 328,724,421 |
Laudus Rosenberg U.S. Large/Mid Capitalization | | | | | | | |
Long/Short Equity Fund | | 155,581 | — | (1,775,258) | | 2,511,623 |
Laudus Rosenberg Global Long/Short Equity Fund | | 198,506 | — | | (610,054) | | 1,967,082 |
Laudus Rosenberg Value Long/Short Equity Fund | | 1,227,321 | — | (84,663,237) | | 55,381,122 |
| | | | | | | | |
Laudus Trust Annual Report 155
Financial Statements—Notes to Financial Statements as of 3/31/07 continued
The difference between book basis and tax basis unrealized appreciation/(depreciation) is attributable primarily to: tax deferral of losses on wash sales, the realization for tax purposes of unrealized gains/(losses) on certain derivative instruments, and unrealized gains/(losses) on investments in passive foreign investment companies.
Other Tax Information (unaudited)
For corporate shareholders, the following percentage of the total ordinary income dividends paid during the fiscal year ended March 31, 2007, qualify for the corporate dividends received deduction for the following Funds:
| Dividends |
| Received Deduction |
| |
Laudus Rosenberg U.S. Large Capitalization Fund | 58.13% |
Laudus Rosenberg U.S. Large Capitalization Growth Fund | 100.00% |
Laudus Rosenberg U.S. Large Capitalization Value Fund | 48.31% |
Laudus Rosenberg U.S. Discovery Fund | 100.00% |
Laudus Rosenberg U.S. Small Capitalization Fund | —% |
Laudus Rosenberg International Equity Fund | —% |
Laudus Rosenberg International Discovery Fund | —% |
Laudus Rosenberg International Small Capitalization Fund | —% |
Laudus Rosenberg U.S. Large/Mid Capitalization Long/Short Equity Fund | 42.20% |
Laudus Rosenberg Global Long/Short Equity Fund | 19.52% |
Laudus Rosenberg Value Long/Short Equity Fund | 25.49% |
The Laudus Rosenberg International Equity Fund, Laudus Rosenberg International Discovery Fund, Laudus Rosenberg International Small Capitalization Fund, and Laudus Rosenberg Global Long/Short Equity Fund may elect to pass on the benefits of the foreign tax credit $176,045, $82,881 $2,702,844 and $31,481 respectively, to its shareholders for the year ended March 31, 2007.
For the fiscal year March 31, 2007, certain dividends paid by the Funds may be subject to maximum tax rate of 15% as provided by the Jobs and Growth Tax Relief Reconciliation Act of 2003. The Funds intend to designate the maximum allowable as taxed at a maximum rate of 15%. Complete information will be reported in conjunction with your 2007 Form 1099-DIV.
For the year ended March 31, 2007, the Funds designate the following amounts of qualified dividend income:
| Qualified |
| Dividend |
| Income |
| | |
Laudus Rosenberg U.S. Large Capitalization Fund | $ | 1,635,997 |
Laudus Rosenberg U.S. Large Capitalization Growth Fund | | 167,858 |
Laudus Rosenberg U.S. Large Capitalization Value Fund | | 157,566 |
Laudus Rosenberg U.S. Discovery Fund | | 606,878 |
Laudus Rosenberg U.S. Small Capitalization Fund | | — |
Laudus Rosenberg International Equity Fund | | 2,437,829 |
Laudus Rosenberg International Discovery Fund | | 852,775 |
Laudus Rosenberg International Small Capitalization Fund | 33,175,895 |
Laudus Rosenberg U.S. Large/Mid Capitalization Long/Short Equity Fund | | 386,642 |
Laudus Rosenberg Global Long/Short Equity Fund | | 467,677 |
Laudus Rosenberg Value Long/Short Equity Fund | | 1,899,088 |
156 Laudus Trust Annual Report
Report of Independent Registered Public Accounting Firm
To the Board of Trustees and Shareholders of Laudus Trust
In our opinion, the accompanying statements of assets and liabilities, including the schedules of portfolio investments and schedules of securities sold short, and the related statements of operations and of changes in net assets and the financial highlights present fairly, in all material respects, the financial position of Laudus Rosenberg U.S. Large Capitalization Fund, Laudus Rosenberg U.S. Large Capitalization Growth Fund, Laudus Rosenberg U.S. Large Capitalization Value Fund, Laudus Rosenberg U.S. Discovery Fund, Laudus Rosenberg U.S. Small Capitalization Fund, Laudus Rosenberg International Equity Fund, Laudus Rosenberg International Small Capitalization Fund, Laudus Rosenberg International Discovery Fund, Laudus Rosenberg U.S. Large/Mid Capitalization Long/Short Equity Fund, Laudus Rosenberg Global Long/Short Equity Fund, and Laudus Rosenberg Value Long/ Short Equity Fund (the ‘‘Funds’’) at March 31, 2007, the results of each of their operations for the period then ended, and the changes in each of their net assets and the financial highlights for each of the periods presented, in conformity with accounting principles generally accepted in the United States of America. These financial statements and financial highlights (hereafter referred to as ‘‘financial statements’’) are the responsibility of the Funds’ management; our responsibility is to express an opinion on these financial statements based on our audits. We conducted our audits of these financial statements in accordance with the standards of the Public Company Accounting Oversight Board (United States). Those standards require that we plan and perform the audits to obtain reasonable assurance about whether the financial statements are free of material misstatement. An audit includes examining, on a test basis, evidence supporting the amounts and disclosures in the financial statements, assessing the accounting principles used and significant estimates made by management, and evaluating the overall financial statement presentation. We believe that our audits, which included confirmation of securities at March 31, 2007 by correspondence with the custodian and brokers, provide a reasonable basis for our opinion.
PricewaterhouseCoopers LLP
San Francisco, California
May 18, 2007
Laudus Trust Annual Report 157
Trustees and Officers
The tables below provide information about the trustees and officers for the Laudus Trust, which includes the funds covered in this report. The ‘‘Fund Complex’’ includes The Charles Schwab Family of Funds, Schwab Investments, Schwab Capital Trust, Schwab Annuity Portfolios, Laudus Trust, Laudus Variable Insurance Trust, Excelsior Funds, Inc., Excelsior Tax-Exempt Funds, Inc., and Excelsior Funds Trust. As of March 31, 2007, the Fund Complex included 95 funds.
At a meeting of the Board held on September 28-29, 2006, the Trustees voted to adopt a retirement policy for all independent trustees that requires an independent trustee to retire no later than December 31st of the year in which he or she reaches age seventy-two.
The address for all trustees and officers is 101 Montgomery Street, San Francisco, CA 94104. You can find more information about the trustees and officers in the Statement of Additional Information, which is available free by calling 1-866-452-8387.
Independent Trustees | | | |
| | Number of | |
Name, | | Portfolios in | |
Year of Birth, | | Fund | |
(Term of Office and | Principal Occupation(s) | Complex | |
Length of Time Served) | During the Past Five Years | Overseen | Other Directorships |
| | | |
Mariann Byerwalter | Chairman of JDN Corporate | 95 | Board 1 – Director, Redwood Trust, |
1960 | Advisory LLC. From1996 to 2001, | | Inc. |
(Trustee of Laudus | Vice President for Business Affairs | | |
Trust since 2004) | and Chief Financial Officer | | Board 2 – Director, PMI Group, Inc. |
| of Stanford University,and in | | |
| 2001, Special Advisor to the | | |
| President of Stanford University. | | |
William A. Hasler | Retired. Dean Emeritus of the Haas | 95 | Board 1 – Director, Aphton Corporation. |
1941 | School of Business, University of | | Board 2 – Director, Mission West |
(Trustee of Laudus | California, Berkeley. Until February | | Properties. Board 3 – Director, TOUSA. |
Trust since 2004) | 2004, Co-Chief Executive Officer, | | Board 4 – Director, Harris-Stratex |
| Aphton Corp. (bio-pharmaceuticals). | | Networks. Board 5 – Director, Genitope |
| | | Corp. Board 6 – Director, Solectron |
| | | Corporation where he is also Non- |
| | | Executive Chairman. Board 7 – Director, |
| | | Ditech Communications Corporation. |
Nils Hakansson | Sylvan C. Coleman Professor of | 38 | None. |
1937 | Finance and Accounting Emeritus, | | |
(Trustee of Laudus | Haas School of Business, University | | |
Trust since June | of California Berkeley, since 2003. | | |
1998) | From July 1977to January 2003, | | |
| Sylvan C. Coleman Professor of | | |
| Finance and Accounting,Haas | | |
| School of Business, University of | | |
| California, Berkeley (higher | | |
| education). | | |
Rodman L. Drake | Co-Founder of Baringo Capital LLC | 38 | Board 1 – Director and Chairman, |
1943 | (since 2002); President, Continuation | | Hyperion Total Return Fund, Inc. and |
(Trustee of Laudus | Investments Group, Inc. (from 1997 | | Hyperion Strategic Mortgage Income |
Trust since June | To 2001). | | Fund Inc. Board 2 – Director, Jackson |
2006) | | | Hewitt Tax Service Inc. Board 3 – |
| | | Director, Student Loan Corporation. |
| | | Board 4 – Celgene Corp. |
| | | |
Morrill Melton Hall, Jr. | Chairman (since 1984) and Chief | 38 | None. |
1944 | Executive Officer (since 1991), | | |
(Trustee of Laudus | Comprehensive Health Services, Inc. | | |
Trust since June | (health care management and | | |
2006) | administration). | | |
158 Laudus Trust Annual Report
Trustees and Officers continued
Independent Trustees | | | |
| | Number of | |
Name, | | Portfolios in | |
Year of Birth, | | Fund | |
(Term of Office and | Principal Occupation(s) | Complex | |
Length of Time Served) | During the Past Five Years | Overseen | Other Directorships |
| | | |
Jonathan Piel | Cable television producer and | 38 | None. |
1938 | website designer; Editor, Scientific | | |
(Trustee of Laudus | American (1984-1986), and Vice | | |
Trust since June | President,Scientific American Inc., | | |
2006) | (1986-1994);Director, National | | |
| Institute of Social Sciences; | | |
| Member, Advisory Board, The | | |
| Stone Age Institute, | | |
| Bloomington,Indiana. | | |
John D. Collins | Retired. Consultant, KPMG, LLP | 38 | Board 1 – Director, Mrs. Fields Famous |
1938 | (from July 1999 to June 2000); | | Brands LLC. |
(Trustee of Laudus | Partner,KPMG, LLP (from March | | |
Trust since June | 1962 to June 1999). | | |
2006) | | | |
Laudus Trust Annual Report 159
Trustees and Officers continued
Interested Trustees | | | |
Name, | | Number of | |
Year of Birth, | | Portfolios in | |
(Term of Office and | Principal Occupation(s) | Fund Complex | |
Length of Time Served) | During the Past Five Years | Overseen | Other Directorships |
| | | |
Randall W. Merk1 | Executive Vice President, Charles | 95 | None. |
1954 | Schwab & Co., Inc. (2002-present); | | |
(Trustee of Laudus | President, Schwab Financial Products, | | |
Trust since June | Charles Schwab & Co., Inc. (2002- | | |
2006) | present); Director, Charles Schwab | | |
| Asset Management (Ireland) Limited; | | |
| Director, Charles Schwab Bank, N.A. | | |
| (since 2006). Prior to September 2002, | | |
| President and Chief Investment Officer, | | |
| American Century Investment | | |
| Management, and Director, American | | |
| Century Companies, Inc. | | |
160 Laudus Trust Annual Report
Trustees and Officers continued
Officers | | |
Name, | | |
Year of Birth, | | |
(Term of Office and | | |
Length of Time Served)2 | Position with the Trust | Principal Occupation(s) |
| | |
Evelyn Dilsaver, 1955 | President & Chief | President, Chief Executive Officer, and Director, Charles Schwab |
(Officer of Laudus Trust | Executive Officer | Investment Management, Inc.; Executive Vice President, Charles |
since 09/05) | | Schwab & Co., Inc.; President and Chief Executive Officer, The |
| | Charles Schwab Family of Funds, Schwab Investments, Schwab |
| | Capital Trust, and Schwab Annuity Portfolios; President, |
| | Excelsior Funds Inc., Excelsior Tax-Exempt Funds, Inc., and |
| | Excelsior Funds Trust; President, Mutual Fund Division, UST |
| | Advisers, Inc. From June 2003 to July 2004, Senior Vice |
| | President, Asset Management Products and Services, Charles |
| | Schwab & Co., Inc. Prior to June 2003, Executive Vice President, |
| | Chief Financial Officer, and Chief Administrative Officer, U.S. |
| | Trust, a subsidiary of The Charles Schwab Corporation. |
| | |
George Pereira, 1964 | Chief Financial Officer | Senior Vice President and Chief Financial Officer, Charles |
(Officer of Laudus Trust | | Schwab Investment Management, Inc.; Treasurer and Principal |
since 06/06) | | Financial Officer, The Charles Schwab Family of Funds, Schwab |
| | Investments,Schwab Capital Trust, and Schwab Annuity |
| | Portfolios; Treasurer,Chief Financial Officer and Chief Accounting |
| | Officer, Excelsior Funds Inc., Excelsior Tax-Exempt Funds, Inc., |
| | and Excelsior Funds Trust;Chief Financial Officer, Mutual Fund |
| | Division, UST Advisors, Inc.;Director, Charles Schwab Worldwide |
| | Funds, PLC and Charles Schwab Asset Management (Ireland) |
| | Limited. From December 1999to November 2004, Sr. Vice |
| | President, Financial Reporting, Charles Schwab & Co., Inc. |
| | |
Jeffrey M. Mortimer, | Vice President & Chief | Senior Vice President and Chief Investment Officer – Equities, |
1963 | Investment Officer | Charles Schwab Investment Management, Inc., and The Charles |
(Officer of Laudus Trust | | Schwab Family of Funds, Schwab Investments, Schwab Capital |
since 06/04) | | Trust,and Schwab Annuity Portfolios. Prior to May 2004; Vice |
| | President and Sr. Portfolio Manager, Charles Schwab Investment |
| | Management,Inc. |
| | |
Catherine MacGregor, | Chief Legal Officer & | Vice President, Charles Schwab & Co., Inc. and Charles Schwab |
1964 | Vice President | Investment Management, Inc.; since 2006, Chief Counsel, |
(Officer of Laudus Trust | | Laudus Trust and Laudus Variable Insurance Trust; Vice |
since 12/05) | | President, The Charles Schwab Family of Funds, Schwab |
| | Investments, Schwab Capital Trust, and Schwab Annuity |
| | Portfolios; until July 2005, Senior Associate, Paul Hastings |
| | Janofsky & Walker LLP. |
Randall Fillmore, 1960 | Chief Compliance | Senior Vice President and Chief Compliance Officer, Charles |
(Officer of Laudus Trust | Officer | Schwab Investment Management, Inc; Senior Vice President, |
since 09/04) | | Charles Schwab & Co., Inc.; Chief Compliance Officer, The |
| | Charles Schwab Family of Funds, Schwab Investments, Schwab |
| | Capital Trust, and Schwab Annuity Portfolios; Chief Compliance |
| | Officer, Excelsior Funds, Inc., Excelsior Tax-Exempt Funds, Inc., |
| | and Excelsior Funds Trust. From 2002 to 2003, Vice President, |
| | Charles Schwab & Co.,Inc. and Charles Schwab Investment |
| | Management, Inc. From 2000 to 2002, Vice President, Internal |
| | Audit, Charles Schwab & Co., Inc. |
Laudus Trust Annual Report 161
Trustees and Officers continued
Officers | | |
Name, | | |
Year of Birth, | | |
(Term of Office and | | |
Length of Time Served)2 | Position with the Trust | Principal Occupation(s) |
| | |
Daniel Kern, 1961 | Vice President | Vice President, Investment Operations, Charles Schwab |
(Officer of Laudus Trust | | Investment Management, Inc.; Assistant Treasurer, The Charles |
since 03/04) | | Schwab Family of Funds, Schwab Investments, Schwab Capital |
| | Trust, and Schwab Annuity Portfolios. Until September 2005, |
| | Assistant Treasurer,Laudus Trust and Laudus Variable Insurance |
| | Trust. Until December 2004, Vice President, Internal Audit, |
| | Charles Schwab Corporation.Prior to January 2003, Managing |
| | Director and Principal, Montgomery Asset Management. |
| | |
Bill Thomas, 1962 | Vice President | Senior Vice President, Distribution, Charles Schwab Investment |
(Officer of Laudus Trust | | Management, Inc. Until May 2000, Managing Director, Scudder |
since 06/04) | | Kemper Investments |
| | |
Michael Haydel, 1972 | Vice President & AML | Vice President, Asset Management Client Services, Charles |
(Officer of Laudus Trust | Officer | Schwab & Co., Inc. Until March 2004, Director, Charles Schwab |
since 06/05) | | &Co., Inc. |
| | |
Aleda Anderson, 1966 | Vice President | Vice President, Distribution Services, Charles Schwab |
(Officer of Laudus Trust | | Investment Management, Inc.; until December 2005, Director, |
since 06/06) | | Asset Management Strategic Alliances, Charles Schwab & Co., |
| | Inc.; until 2001, Research Associate, Office of Corporate |
| | Counsel, Charles Schwab & Co., Inc. |
| | |
Cathy Sabo, 1964 | Vice President | Vice President, Compliance, Charles Schwab Investment, |
(Officer of Laudus Trust | | Management, Inc.; Vice President, Schwab Funds; until |
since 12/05) | | September 2004, Vice President, Client, Sales & Services |
| | Controls, Charles Schwab & Co., Inc. |
1 In addition to his employment with the investment adviser or an affiliate, Mr. Merk owns stock of The Charles Schwab Corporation. Mr. Merk is Interested Trustees because he is an employee of Schwab and U.S. Trust, respectively.
2 The President, Treasurer and Secretary hold office until their respective successors are chosen and qualified or until he or she sooner dies, resigns, is removed or becomes disqualified. Each other officer serves at the pleasure of the Board.
162 Laudus Trust Annual Report
Definitions, Terms and Other Information
90 Day T-bill is a short-term discounted, government debt instrument of 90 days or less, issued in $10,000 denominations that pay its face value at maturity. The government issues Treasury bills weekly.
Alpha is a measure of a fund’s risk-adjusted return. Alpha can be used to directly measure the value added or subtracted by a fund’s manager. It is calculated by measuring the difference between a fund’s actual returns and its expected performance given its level of market risk as measured by beta.
Beta is a measure of the volatility of a stock relative to the overall market. A beta of less than one indicates lower historical risk than the market; a beta of more than one indicates higher historical risk than the market.
GDP, or Gross Domestic Product, is the market value of the goods and services produced by labor and property in the United States.
The S&P/Citigroup Global ex US Broad Market Index (BMI) $2-$10 Billion Cap Range is an absolute size benchmark that divides the investable region into capitalization bands of between $2 billion and $10 billion. It is a subset of the Broad Market Index (BMI), which includes companies in approximately 52 developed and emerging markets with more than $100 million of free float capitalization.
The S&P/Citigroup World ex US Extended Market Index (EMI) is a float-adjusted index which measures the performance of small companies (approximately the bottom 20% by market capitalization) in 25 developed equity markets.
The Standard & Poor’s 500 (S&P 500) Index is an unmanaged index measuring large-cap U.S. stock market performance, and includes a representative sample of leading companies in leading industries.
The Russell 1000 Growth Index measures the performance of those Russell 1000 companies with higher price-to-book ratios and higher forecasted growth values.
The Russell 1000 Value Index measures the performance of those Russell 1000 companies with lower valuation ratios such as price-to-book and price-to-earnings ratios.
The Russell 2000 Index measures the performance of the 2,000 smallest companies in the Russell 3000 Index, and represents approximately 8% of the total market capitalization of the Russell 3000 Index.
The Russell 2500TM Index measures the performance of the 2,500 smallest companies in the Russell 3000 Index, and represents approximately 16% of the total market capitalization of the Russell 3000 Index.
The Russell 3000 Growth Index measures the performance of those Russell 3000 Index companies with higher price-to-book ratios and higher forecasted growth values. The stocks in this index are also members of either the Russell 1000 Growth or the Russell 2000 Growth indexes.
The Russell 3000 Value Index measures the performance of those Russell 3000 Index companies with lower price-to-book ratios and lower forecasted growth values. The stocks in this index are also members of either the Russell 1000 Value or the Russell 2000 Value indexes.
Price to earnings ratio is the price of a stock divided by its historical earnings per share.
Price to book ratio compares the stock’s market value to the value of the total assets less the total liabilities. Price to cash flow ratio is the price of a stock dividend by its reported cash flow per share.
Relative strength is the rate that a stock falls relative to other stocks in a falling market or rises relative to other stocks in a rising market.
Return on equity represents the amount earned on a company’s common stock investment for a given period, calculated by dividing common stock equity into net income for the period after preferred stock dividends but before common stock dividends.
Trading Activity is one of several risk factors commonly used to attribute a portfolio’s return relative to its benchmark. Specifically, trading activity measures a stock’s trailing 12 month trading volume relative to its total shares outstanding. It measures how actively traded a stock has been in the last 12 months.
Proxy Voting
A description of the policies and procedures that the Fund uses to determine how to vote proxies relating to portfolio securities is available without charge, upon request by visiting www.laudus.com, the Securities and Exchange Commission’s website at www.sec.gov, or by contacting Laudus Funds at 866.452.8387.
Information regarding how the Fund voted proxies relating to portfolio securities during the most recent 12-month period ended June 30 is available without charge, upon request by visiting www.laudus.com, or the Securities and Exchange Commission’s website at www.sec.gov.
Quarterly Disclosure of Portfolio Holdings
The Fund files its complete schedule of portfolio holdings with the SEC for the first and third quarters of each fiscal year on Form N-Q. The Fund’s Forms N-Q are available on the SEC’s website at www.sec.gov and may be reviewed and copied at the SEC’s Public Reference Room in Washington, DC. Call 1-800-SEC-0330 for information on the operation of the Public Reference Room. The information filed on a fund’s most recent Form N-Q is also available at www.laudus.com.
Laudus Trust Annual Report 163
(This page intentionally left blank)
C O M M A N D P E R F O R M A N C E TM |
Manager
Charles Schwab Investment Management, Inc.
101 Montgomery Street
San Francisco, California 94104
Shareholder Services
1.866.452.8387 Investment Professionals
1.800.447.3332 Individual Investors
www.laudus.com
This report is for the information of the shareholders of the Laudus Trust.
Its use in connection with any offering of the Trust’s shares is authorized only in case of concurrent or prior delivery of the current prospectus.
REG 34765-04

