UNITED STATES
SECURITIES AND EXCHANGE COMMISSION
Washington, D.C. 20549
FORM N-CSR
CERTIFIED SHAREHOLDER REPORT
OF
REGISTERED MANAGEMENT INVESTMENT COMPANIES
Investment Company Act file number: 811-22114
| Name of Registrant: | | Vanguard Montgomery Funds |
| Address of Registrant: | | P.O. Box 2600 |
| | | Valley Forge, PA 19482 |
| Name and address of agent for service: | | Tonya T. Robinson, Esquire |
| | | P.O. Box 876 |
| | | Valley Forge, PA 19482 |
Registrant’s telephone number, including area code: (610) 669-1000
Date of fiscal year end: December 31
Date of reporting period: January 1, 2024—December 31, 2024
Item 1: Reports to Shareholders.
TABLE OF CONTENTS
Vanguard Market Neutral Fund
Annual Shareholder Report | December 31, 2024
This annual shareholder report contains important information about Vanguard Market Neutral Fund (the "Fund") for the period of January 1, 2024, to December 31, 2024. You can find additional information about the Fund at https://personal1.vanguard.com/ngf-next-gen-form-webapp/fund-literature. You can also request this information by contacting us at 800-662-7447.
What were the Fund costs for the last year?
(based on a hypothetical $10,000 investment)
| Share Class Name | Costs of a $10,000 investment | Costs paid as a percentage of a $10,000 investment |
|---|
| Investor Shares | $144 | 1.40% |
|---|
How did the Fund perform during the reporting period?
For the 12 months ended December 31, 2024, the Fund outperformed its benchmark.
U.S. economic growth hovered around 3% on a year-over-year basis for much of the period, and consumer price inflation trended lower, falling below 3% in July. The Federal Reserve began cutting short-term interest rates in September, which boosted stock returns, as did the prospect of tax cuts and deregulation under the incoming administration.
The Fund’s relative performance benefited from its positions in six of 11 economic sectors, most notably consumer staples, real estate, and financials. The largest performance drags owed to industrials, health care, and communication services.
At the individual stock level, roughly 50% of the approximately 800 stocks the Fund held during the period helped its relative performance, while roughly 40% detracted and 10% had no impact. Even modest levels of short-term outperformance can compound into strong long-term results.
The Fund outpaced its benchmark for the decade ended December 31, 2024.
How did the Fund perform over the past 10 years?
Keep in mind that the Fund's past performance does not indicate how the Fund will perform in the future. Updated performance information is available on our website at vanguard.com/performance or by calling Vanguard toll-free at 800-662-7447. The graph and returns shown do not reflect taxes that a shareholder would pay on fund distributions or on the sale of fund shares.
Cumulative Performance: December 31, 2014, Through December 31, 2024
Initial Investment of $50,000
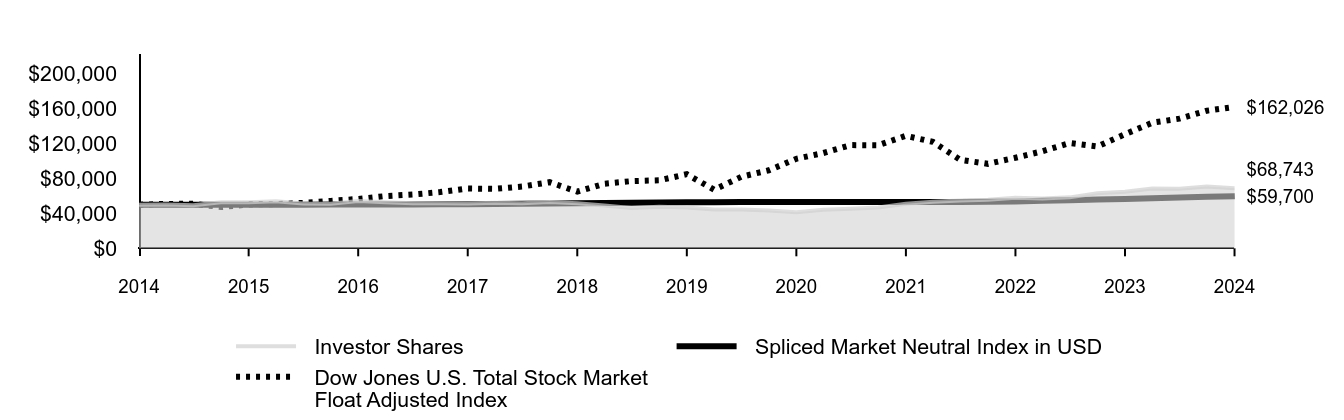
| Investor Shares | Spliced Market Neutral Index in USD | Dow Jones U.S. Total Stock Market Float Adjusted Index |
|---|
| 2014 | $50,000 | $50,000 | $50,000 |
|---|
| 2015 | $50,087 | $50,000 | $50,901 |
|---|
| 2015 | $49,435 | $50,000 | $50,961 |
|---|
| 2015 | $52,913 | $50,000 | $47,257 |
|---|
| 2015 | $52,704 | $50,005 | $50,220 |
|---|
| 2016 | $54,009 | $50,030 | $50,680 |
|---|
| 2016 | $51,400 | $50,062 | $52,005 |
|---|
| 2016 | $50,965 | $50,097 | $54,311 |
|---|
| 2016 | $54,083 | $50,139 | $56,558 |
|---|
| 2017 | $52,775 | $50,199 | $59,834 |
|---|
| 2017 | $51,684 | $50,291 | $61,634 |
|---|
| 2017 | $51,509 | $50,419 | $64,449 |
|---|
| 2017 | $51,437 | $50,560 | $68,527 |
|---|
| 2018 | $52,220 | $50,736 | $68,113 |
|---|
| 2018 | $51,734 | $50,958 | $70,751 |
|---|
| 2018 | $53,059 | $51,213 | $75,779 |
|---|
| 2018 | $51,743 | $51,502 | $64,897 |
|---|
| 2019 | $49,028 | $51,809 | $74,009 |
|---|
| 2019 | $46,265 | $52,127 | $77,035 |
|---|
| 2019 | $47,602 | $52,420 | $77,911 |
|---|
| 2019 | $46,793 | $52,662 | $84,951 |
|---|
| 2020 | $44,493 | $52,867 | $67,144 |
|---|
| 2020 | $44,447 | $52,938 | $81,976 |
|---|
| 2020 | $43,435 | $52,955 | $89,415 |
|---|
| 2020 | $41,377 | $52,968 | $102,613 |
|---|
| 2021 | $44,292 | $52,977 | $109,230 |
|---|
| 2021 | $45,218 | $52,981 | $118,283 |
|---|
| 2021 | $46,699 | $52,986 | $118,142 |
|---|
| 2021 | $50,992 | $52,992 | $128,940 |
|---|
| 2022 | $53,263 | $53,007 | $121,978 |
|---|
| 2022 | $54,746 | $53,084 | $101,441 |
|---|
| 2022 | $55,674 | $53,322 | $96,812 |
|---|
| 2022 | $57,864 | $53,788 | $103,760 |
|---|
| 2023 | $57,121 | $54,391 | $111,276 |
|---|
| 2023 | $58,382 | $55,073 | $120,615 |
|---|
| 2023 | $63,053 | $55,832 | $116,647 |
|---|
| 2023 | $64,947 | $56,616 | $130,798 |
|---|
| 2024 | $68,559 | $57,393 | $143,938 |
|---|
| 2024 | $68,264 | $58,179 | $148,600 |
|---|
| 2024 | $70,720 | $58,976 | $157,754 |
|---|
| 2024 | $68,743 | $59,700 | $162,026 |
|---|
Average Annual Total Returns
| | 1 Year | 5 Years | 10 Years |
|---|
| Investor Shares | 5.84% | 8.00% | 3.23% |
|---|
| Spliced Market Neutral Index in USD | 5.45% | 2.54% | 1.79% |
|---|
| Dow Jones U.S. Total Stock Market Float Adjusted Index | 23.88% | 13.78% | 12.48% |
|---|
This table reflects the Fund's investments, including short-term investments and other assets and liabilities.
Portfolio Composition % of Net Assets
(as of December 31, 2024)
| Long Portfolio | Short Portfolio |
| Communication Services | 3.7% | 4.2% |
| Consumer Discretionary | 10.0% | 10.3% |
| Consumer Staples | 5.0% | 4.8% |
| Energy | 4.5% | 4.2% |
| Financials | 21.9% | 21.7% |
| Health Care | 11.3% | 10.8% |
| Industrials | 16.2% | 17.0% |
| Information Technology | 12.2% | 12.5% |
| Materials | 3.4% | 3.3% |
| Real Estate | 5.6% | 5.4% |
| Utilities | 3.6% | 3.7% |
| Other Assets and Liabilities—Net | 2.6% | 2.1% |
Fund Statistics
(as of December 31, 2024)
| Fund Net Assets (in millions) | $431 |
|---|
| Number of Portfolio Holdings | 461 |
|---|
| Portfolio Turnover Rate | 104% |
|---|
| Total Investment Advisory Fees (in thousands) | $124 |
|---|
Where can I find additional information about the Fund?
Additional information about the Fund, including its prospectus, financial information, holdings, and proxy voting information is available at https://personal1.vanguard.com/ngf-next-gen-form-webapp/fund-literature.
Connect with Vanguard® • vanguard.com
Fund Information • 800-662-7447
Direct Investor Account Services • 800-662-2739
Text Telephone for People Who Are Deaf or Hard of Hearing •
800-749-7273
© 2025 The Vanguard Group, Inc.
All rights reserved.
Vanguard Marketing Corporation, Distributor.
AR634
Vanguard Market Neutral Fund
Institutional Shares (VMNIX)
Annual Shareholder Report | December 31, 2024
This annual shareholder report contains important information about Vanguard Market Neutral Fund (the "Fund") for the period of January 1, 2024, to December 31, 2024. You can find additional information about the Fund at https://personal1.vanguard.com/ngf-next-gen-form-webapp/fund-literature. You can also request this information by contacting us at 800-662-7447.
What were the Fund costs for the last year?
(based on a hypothetical $10,000 investment)
| Share Class Name | Costs of a $10,000 investment | Costs paid as a percentage of a $10,000 investment |
|---|
| Institutional Shares | $138 | 1.34% |
|---|
How did the Fund perform during the reporting period?
For the 12 months ended December 31, 2024, the Fund outperformed its benchmark.
U.S. economic growth hovered around 3% on a year-over-year basis for much of the period, and consumer price inflation trended lower, falling below 3% in July. The Federal Reserve began cutting short-term interest rates in September, which boosted stock returns, as did the prospect of tax cuts and deregulation under the incoming administration.
The Fund’s relative performance benefited from its positions in six of 11 economic sectors, most notably consumer staples, real estate, and financials. The largest performance drags owed to industrials, health care, and communication services.
At the individual stock level, roughly 50% of the approximately 800 stocks the Fund held during the period helped its relative performance, while roughly 40% detracted and 10% had no impact. Even modest levels of short-term outperformance can compound into strong long-term results.
The Fund outpaced its benchmark for the decade ended December 31, 2024.
How did the Fund perform over the past 10 years?
Keep in mind that the Fund's past performance does not indicate how the Fund will perform in the future. Updated performance information is available on our website at vanguard.com/performance or by calling Vanguard toll-free at 800-662-7447. The graph and returns shown do not reflect taxes that a shareholder would pay on fund distributions or on the sale of fund shares.
Cumulative Performance: December 31, 2014, Through December 31, 2024
Initial Investment of $5,000,000
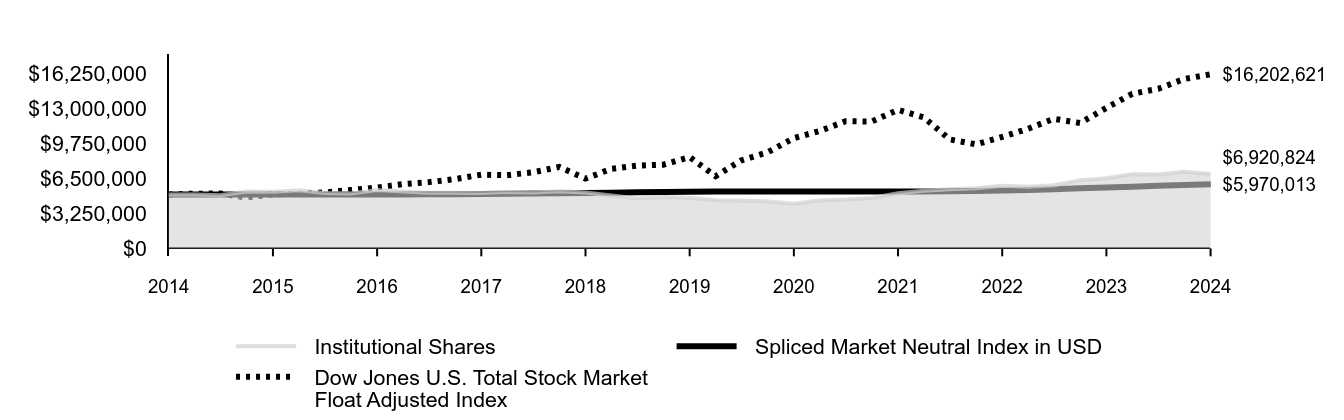
| Institutional Shares | Spliced Market Neutral Index in USD | Dow Jones U.S. Total Stock Market Float Adjusted Index |
|---|
| 2014 | $5,000,000 | $5,000,000 | $5,000,000 |
|---|
| 2015 | $5,008,734 | $5,000,000 | $5,090,054 |
|---|
| 2015 | $4,943,231 | $5,000,000 | $5,096,078 |
|---|
| 2015 | $5,296,943 | $5,000,000 | $4,725,720 |
|---|
| 2015 | $5,275,991 | $5,000,500 | $5,022,045 |
|---|
| 2016 | $5,407,126 | $5,003,001 | $5,067,957 |
|---|
| 2016 | $5,149,228 | $5,006,246 | $5,200,452 |
|---|
| 2016 | $5,105,516 | $5,009,749 | $5,431,090 |
|---|
| 2016 | $5,418,471 | $5,013,855 | $5,655,796 |
|---|
| 2017 | $5,287,932 | $5,019,927 | $5,983,419 |
|---|
| 2017 | $5,178,133 | $5,029,075 | $6,163,391 |
|---|
| 2017 | $5,164,957 | $5,041,913 | $6,444,880 |
|---|
| 2017 | $5,156,777 | $5,056,027 | $6,852,694 |
|---|
| 2018 | $5,236,638 | $5,073,645 | $6,811,260 |
|---|
| 2018 | $5,187,739 | $5,095,770 | $7,075,085 |
|---|
| 2018 | $5,321,100 | $5,121,250 | $7,577,897 |
|---|
| 2018 | $5,190,321 | $5,150,207 | $6,489,745 |
|---|
| 2019 | $4,917,750 | $5,180,945 | $7,400,938 |
|---|
| 2019 | $4,639,303 | $5,212,722 | $7,703,509 |
|---|
| 2019 | $4,778,526 | $5,242,042 | $7,791,070 |
|---|
| 2019 | $4,698,504 | $5,266,226 | $8,495,073 |
|---|
| 2020 | $4,467,663 | $5,286,650 | $6,714,437 |
|---|
| 2020 | $4,463,024 | $5,293,789 | $8,197,568 |
|---|
| 2020 | $4,365,598 | $5,295,492 | $8,941,465 |
|---|
| 2020 | $4,154,494 | $5,296,790 | $10,261,256 |
|---|
| 2021 | $4,448,576 | $5,297,745 | $10,922,971 |
|---|
| 2021 | $4,541,936 | $5,298,130 | $11,828,254 |
|---|
| 2021 | $4,691,311 | $5,298,609 | $11,814,249 |
|---|
| 2021 | $5,126,357 | $5,299,227 | $12,894,041 |
|---|
| 2022 | $5,350,869 | $5,300,712 | $12,197,836 |
|---|
| 2022 | $5,505,221 | $5,308,354 | $10,144,127 |
|---|
| 2022 | $5,594,090 | $5,332,186 | $9,681,223 |
|---|
| 2022 | $5,816,908 | $5,378,806 | $10,375,952 |
|---|
| 2023 | $5,742,901 | $5,439,149 | $11,127,602 |
|---|
| 2023 | $5,874,922 | $5,507,260 | $12,061,484 |
|---|
| 2023 | $6,346,425 | $5,583,167 | $11,664,700 |
|---|
| 2023 | $6,534,361 | $5,661,628 | $13,079,813 |
|---|
| 2024 | $6,895,246 | $5,739,254 | $14,393,774 |
|---|
| 2024 | $6,870,443 | $5,817,880 | $14,860,033 |
|---|
| 2024 | $7,123,434 | $5,897,631 | $15,775,361 |
|---|
| 2024 | $6,920,824 | $5,970,013 | $16,202,621 |
|---|
Average Annual Total Returns
| | 1 Year | 5 Years | 10 Years |
|---|
| Institutional Shares | 5.91% | 8.05% | 3.30% |
|---|
| Spliced Market Neutral Index in USD | 5.45% | 2.54% | 1.79% |
|---|
| Dow Jones U.S. Total Stock Market Float Adjusted Index | 23.88% | 13.78% | 12.48% |
|---|
This table reflects the Fund's investments, including short-term investments and other assets and liabilities.
Portfolio Composition % of Net Assets
(as of December 31, 2024)
| Long Portfolio | Short Portfolio |
| Communication Services | 3.7% | 4.2% |
| Consumer Discretionary | 10.0% | 10.3% |
| Consumer Staples | 5.0% | 4.8% |
| Energy | 4.5% | 4.2% |
| Financials | 21.9% | 21.7% |
| Health Care | 11.3% | 10.8% |
| Industrials | 16.2% | 17.0% |
| Information Technology | 12.2% | 12.5% |
| Materials | 3.4% | 3.3% |
| Real Estate | 5.6% | 5.4% |
| Utilities | 3.6% | 3.7% |
| Other Assets and Liabilities—Net | 2.6% | 2.1% |
Fund Statistics
(as of December 31, 2024)
| Fund Net Assets (in millions) | $431 |
|---|
| Number of Portfolio Holdings | 461 |
|---|
| Portfolio Turnover Rate | 104% |
|---|
| Total Investment Advisory Fees (in thousands) | $124 |
|---|
Where can I find additional information about the Fund?
Additional information about the Fund, including its prospectus, financial information, holdings, and proxy voting information is available at https://personal1.vanguard.com/ngf-next-gen-form-webapp/fund-literature.
Connect with Vanguard® • vanguard.com
Fund Information • 800-662-7447
Institutional Investor Services • 800-523-1036
Text Telephone for People Who Are Deaf or Hard of Hearing •
800-749-7273
© 2025 The Vanguard Group, Inc.
All rights reserved.
Vanguard Marketing Corporation, Distributor.
AR734
Item 2: Code of Ethics.
The Registrant has adopted a code of ethics that applies to the Registrant’s principal executive officer, principal financial officer, principal accounting officer or controller or persons performing similar functions. The Code of Ethics was amended during the reporting period covered by this report to make certain technical, non-material changes.
Item 3: Audit Committee Financial Expert.
All members of the Audit and Risk Committee have been determined by the Registrant’s Board of Trustees to be Audit Committee Financial Experts and to be independent: Mark Loughridge, Sarah Bloom Raskin, Peter F. Volanakis, and Tara Bunch.
Item 4: Principal Accountant Fees and Services.
Includes fees billed in connection with services to the Registrant only.
| | | Fiscal Year Ended
December 31,
2024 | | | Fiscal Year Ended
December 31,
2023 | |
| (a) Audit Fees. | | $ | 49,000 | | | $ | 48,000 | |
| (b) Audit-Related Fees. | | | 0 | | | | 0 | |
| (c) Tax Fees. | | | 0 | | | | 0 | |
| (d) All Other Fees. | | | 0 | | | | 0 | |
| Total. | | $ | 49,000 | | | $ | 48,000 | |
| (e) | (1) Pre-Approval Policies. The audit committee is responsible for pre-approving all audit and non-audit services provided by PwC to: (i) the Vanguard funds; and (ii) Vanguard, or any entity controlled by Vanguard that provides ongoing services to the Vanguard funds. All services provided to Vanguard entities by the independent auditor, whether or not they are subject to preapproval, must be disclosed to the audit committee. The audit committee chair may preapprove any permissible audit and non-audit services as long as any preapproval is brought to the attention of the full audit committee at the next scheduled meeting. |
(2) No percentage of the principal accountant’s fees or services were approved pursuant to the waiver provision of paragraph (c)(7)(i)(C) of Rule 2-01 of Regulation S-X.
| (f) | For the most recent fiscal year, over 50% of the hours worked under the principal accountant’s engagement were not performed by persons other than full-time, permanent employees of the principal accountant. |
| (g) | Aggregate Non-Audit Fees. |
Includes fees billed for non-audit services provided to the Registrant, other registered investment companies in the Vanguard complex, The Vanguard Group, Inc., and Vanguard Marketing Corporation.
| | | Fiscal Year Ended
December 31,
2024 | | | Fiscal Year Ended
December 31,
2023 | |
| Non-audit fees to the Registrant only, listed as (b) through (d) above. | | $ | 0 | | | $ | 0 | |
| | | | | | | | | |
| Non-audit Fees to other registered investment companies in the Vanguard complex, The Vanguard Group, Inc., and Vanguard Marketing Corporation. | | | | | | | | |
| Audit-Related Fees. | | $ | 3,802,420 | | | $ | 3,295,934 | |
| Tax Fees. | | $ | 2,062,604 | | | $ | 1,678,928 | |
| All Other Fees. | | $ | 293,000 | | | $ | 25,000 | |
| Total. | | $ | 6,158,024 | | | $ | 4,999,862 | |
| (h) | For the most recent fiscal year, the Audit and Risk Committee has determined that the provision of all non-audit services was consistent with maintaining the principal accountant’s independence. |
Item 5: Audit Committee of Listed Registrants.
The Registrant is a listed issuer as defined in rule 10A-3 under the Securities Exchange Act of 1934 (“Exchange Act”). The Registrant has a separately-designated standing audit committee established in accordance with Section 3(a)(58)(A) of the Exchange Act. The Registrant’s audit committee members are: Mark Loughridge, Sarah Bloom Raskin, Peter F. Volanakis, and Tara Bunch.
Item 6: Investments.
Not applicable. The complete schedule of investments is included in the financial statements filed under Item 7 of this Form.
Item 7: Financial Statements and Financial Highlights for Open-End Management Investment Companies.
Financial Statements
For the year ended December 31, 2024
Vanguard Market Neutral Fund
Contents
Financial Statements
| 1 |
Report of Independent Registered Public Accounting Firm
| 17 |
Tax information
| 18 |
| | |
Schedule of Investments
As of December 31, 2024
The fund files its complete schedule of portfolio holdings with the Securities and Exchange Commission (SEC) for the first and third quarters of each fiscal year as an exhibit to its reports on Form N-PORT. The fund’s Form N-PORT reports are available on the SEC’s website at www.sec.gov.
| | | Shares | Market
Value•
($000) |
| Common Stocks—Long Positions (97.4%) |
| Communication Services (3.7%) |
| 1 | Playtika Holding Corp. | 465,092 | 3,228 |
| *,1 | Clear Channel Outdoor Holdings Inc. | 1,560,288 | 2,137 |
| 1 | Telephone & Data Systems Inc. | 56,719 | 1,935 |
| *,1 | ZipRecruiter Inc. Class A | 256,624 | 1,858 |
| 1 | Alphabet Inc. Class C | 6,930 | 1,320 |
| *,1 | Match Group Inc. | 34,696 | 1,135 |
| * | Anterix Inc. | 35,208 | 1,080 |
| * | Spotify Technology SA | 2,157 | 965 |
| * | Cinemark Holdings Inc. | 18,160 | 563 |
| | Comcast Corp. Class A | 14,413 | 541 |
| | Meta Platforms Inc. Class A | 911 | 533 |
| *,1 | Liberty Latin America Ltd. Class C | 65,673 | 416 |
| * | Bandwidth Inc. Class A | 23,637 | 402 |
| | | | 16,113 |
| Consumer Discretionary (10.0%) |
| *,1 | Carnival Corp. | 146,496 | 3,651 |
| *,1 | frontdoor Inc. | 65,704 | 3,592 |
| 1 | Travel & Leisure Co. | 71,174 | 3,591 |
| *,1 | Norwegian Cruise Line Holdings Ltd. | 131,312 | 3,379 |
| *,1 | Mohawk Industries Inc. | 25,813 | 3,075 |
| * | Brinker International Inc. | 17,605 | 2,329 |
| * | Abercrombie & Fitch Co. Class A | 15,115 | 2,259 |
| 1 | General Motors Co. | 42,018 | 2,238 |
| *,1 | M / I Homes Inc. | 16,337 | 2,172 |
| *,1 | American Axle & Manufacturing Holdings Inc. | 343,810 | 2,004 |
| *,1 | Dave & Buster's Entertainment Inc. | 63,796 | 1,862 |
| * | Adtalem Global Education Inc. | 19,305 | 1,754 |
| *,1 | Expedia Group Inc. | 9,369 | 1,746 |
| *,1 | G-III Apparel Group Ltd. | 51,289 | 1,673 |
| * | Hovnanian Enterprises Inc. Class A | 11,775 | 1,576 |
| * | Warby Parker Inc. Class A | 45,696 | 1,106 |
| 1 | Perdoceo Education Corp. | 34,291 | 908 |
| *,1 | Chegg Inc. | 515,206 | 830 |
| | Macy's Inc. | 32,969 | 558 |
| | Strategic Education Inc. | 5,033 | 470 |
| * | National Vision Holdings Inc. | 45,046 | 469 |
| 1 | Gap Inc. | 19,049 | 450 |
| * | MGM Resorts International | 12,900 | 447 |
| | Toll Brothers Inc. | 3,539 | 446 |
| | Best Buy Co. Inc. | 5,097 | 437 |
| | | | 43,022 |
| Consumer Staples (5.0%) |
| 1 | PriceSmart Inc. | 40,179 | 3,703 |
| *,1 | United Natural Foods Inc. | 129,276 | 3,531 |
| *,1 | Maplebear Inc. | 74,223 | 3,074 |
| 1 | Coca-Cola Consolidated Inc. | 2,047 | 2,579 |
| 1 | SpartanNash Co. | 133,613 | 2,448 |
| | Turning Point Brands Inc. | 23,541 | 1,415 |
| * | Pilgrim's Pride Corp. | 29,003 | 1,316 |
| * | US Foods Holding Corp. | 17,567 | 1,185 |
| * | BellRing Brands Inc. | 12,563 | 947 |
| | Costco Wholesale Corp. | 859 | 787 |
| | Fresh Del Monte Produce Inc. | 13,111 | 435 |
| | | | 21,420 |
| Energy (4.5%) |
| 1 | Matador Resources Co. | 62,593 | 3,522 |
| 1 | SM Energy Co. | 85,362 | 3,309 |
| | Weatherford International plc | 42,390 | 3,036 |
| | | Shares | Market
Value•
($000) |
| | CONSOL Energy Inc. | 26,589 | 2,837 |
| 1 | Ardmore Shipping Corp. | 214,589 | 2,607 |
| 1 | Select Water Solutions Inc. | 109,937 | 1,456 |
| 1 | Scorpio Tankers Inc. | 23,494 | 1,167 |
| * | Tidewater Inc. | 9,246 | 506 |
| * | Oceaneering International Inc. | 18,948 | 494 |
| 1 | Archrock Inc. | 17,607 | 438 |
| | | | 19,372 |
| Financials (21.9%) |
| | Affiliated Managers Group Inc. | 20,098 | 3,717 |
| 1 | Janus Henderson Group plc | 85,973 | 3,656 |
| 1 | MGIC Investment Corp. | 153,672 | 3,644 |
| 1 | OFG Bancorp | 86,012 | 3,640 |
| *,1 | NMI Holdings Inc. | 98,909 | 3,636 |
| 1 | Bank of NT Butterfield & Son Ltd. | 98,237 | 3,591 |
| 1 | Zions Bancorp NA | 66,072 | 3,584 |
| * | Enova International Inc. | 37,374 | 3,583 |
| 1 | CNO Financial Group Inc. | 95,880 | 3,568 |
| 1 | BankUnited Inc. | 92,986 | 3,549 |
| 1 | Essent Group Ltd. | 64,349 | 3,503 |
| *,1 | Block Inc. (XNYS) | 40,475 | 3,440 |
| *,1 | Hamilton Insurance Group Ltd. Class B | 161,743 | 3,078 |
| 1 | Enact Holdings Inc. | 91,927 | 2,977 |
| * | Palomar Holdings Inc. | 27,550 | 2,909 |
| 1 | PROG Holdings Inc. | 68,357 | 2,889 |
| *,1 | Mr. Cooper Group Inc. | 29,731 | 2,854 |
| 1 | Associated Banc-Corp. | 107,843 | 2,577 |
| *,1 | LendingClub Corp. | 146,130 | 2,366 |
| 1 | KeyCorp. | 128,857 | 2,209 |
| | Hancock Whitney Corp. | 36,323 | 1,988 |
| | Citizens Financial Group Inc. | 43,698 | 1,912 |
| 1 | FNB Corp. | 127,863 | 1,890 |
| | SEI Investments Co. | 20,423 | 1,685 |
| 1 | Westamerica BanCorp | 31,237 | 1,639 |
| *,1 | PayPal Holdings Inc. | 19,115 | 1,631 |
| *,1 | Customers Bancorp Inc. | 32,638 | 1,589 |
| 1 | Central Pacific Financial Corp. | 52,860 | 1,536 |
| | Globe Life Inc. | 12,646 | 1,410 |
| * | SoFi Technologies Inc. | 72,492 | 1,116 |
| *,1 | Robinhood Markets Inc. Class A | 29,755 | 1,109 |
| 1 | Fulton Financial Corp. | 53,676 | 1,035 |
| | Citigroup Inc. | 14,567 | 1,025 |
| | Everest Group Ltd. | 2,631 | 954 |
| | Arch Capital Group Ltd. | 9,707 | 896 |
| | Veritex Holdings Inc. | 32,774 | 890 |
| | State Street Corp. | 8,389 | 823 |
| | Fidelis Insurance Holdings Ltd. | 44,610 | 809 |
| | Popular Inc. | 8,552 | 804 |
| | Webster Financial Corp. | 13,259 | 732 |
| | Intercontinental Exchange Inc. | 4,892 | 729 |
| | Voya Financial Inc. | 8,708 | 599 |
| | Hope Bancorp Inc. | 44,436 | 546 |
| 1 | Truist Financial Corp. | 11,742 | 509 |
| | Comerica Inc. | 7,840 | 485 |
| | Progressive Corp. | 1,922 | 461 |
| * | Flywire Corp. | 21,550 | 444 |
| | | | 94,216 |
| Health Care (11.3%) |
| *,1 | PTC Therapeutics Inc. | 78,085 | 3,525 |
| *,1 | Incyte Corp. | 47,081 | 3,252 |
| *,1 | BioCryst Pharmaceuticals Inc. | 425,981 | 3,203 |
| * | Tenet Healthcare Corp. | 23,781 | 3,002 |
| *,1 | Option Care Health Inc. | 118,808 | 2,756 |
| *,1 | CareDx Inc. | 125,478 | 2,686 |
| *,1 | Veracyte Inc. | 63,776 | 2,526 |
| *,1 | AdaptHealth Corp. | 242,199 | 2,306 |
| *,1 | Ironwood Pharmaceuticals Inc. | 476,865 | 2,113 |
| *,1 | Novocure Ltd. | 70,550 | 2,102 |
| *,1 | Vir Biotechnology Inc. | 263,642 | 1,935 |
| | | Shares | Market
Value•
($000) |
| *,1 | Ionis Pharmaceuticals Inc. | 47,319 | 1,654 |
| | Bristol-Myers Squibb Co. | 28,536 | 1,614 |
| | Universal Health Services Inc. Class B | 8,980 | 1,611 |
| *,1 | ACADIA Pharmaceuticals Inc. | 84,997 | 1,560 |
| *,1 | Health Catalyst Inc. | 175,900 | 1,244 |
| * | Ultragenyx Pharmaceutical Inc. | 24,539 | 1,032 |
| *,1 | Illumina Inc. | 7,484 | 1,000 |
| *,1 | REGENXBIO Inc. | 120,616 | 932 |
| *,1 | Fate Therapeutics Inc. | 447,612 | 739 |
| *,1 | Bioventus Inc. Class A | 68,966 | 724 |
| *,1 | Community Health Systems Inc. | 236,188 | 706 |
| *,1 | Pediatrix Medical Group Inc. | 51,283 | 673 |
| * | LivaNova plc | 12,937 | 599 |
| 1 | Embecta Corp. | 25,467 | 526 |
| *,1 | Amneal Pharmaceuticals Inc. | 64,120 | 508 |
| * | Phreesia Inc. | 19,193 | 483 |
| * | Travere Therapeutics Inc. | 27,747 | 483 |
| * | Align Technology Inc. | 2,291 | 478 |
| * | Exelixis Inc. | 14,003 | 466 |
| * | 10X Genomics Inc. Class A | 31,818 | 457 |
| * | Inmode Ltd. | 25,865 | 432 |
| *,1 | Omnicell Inc. | 9,386 | 418 |
| *,1 | Coherus Biosciences Inc. | 277,976 | 384 |
| *,1 | Nektar Therapeutics | 261,128 | 243 |
| *,1 | Mersana Therapeutics Inc. | 118,116 | 169 |
| *,1 | Editas Medicine Inc. | 118,506 | 150 |
| *,1 | Agenus Inc. | 33,574 | 92 |
| * | FibroGen Inc. | 36,712 | 19 |
| | | | 48,802 |
| Industrials (16.2%) |
| *,1 | Legalzoom.com Inc. | 473,114 | 3,553 |
| 1 | Primoris Services Corp. | 46,368 | 3,542 |
| *,1 | SkyWest Inc. | 34,758 | 3,480 |
| 1 | Griffon Corp. | 48,341 | 3,445 |
| | TransUnion | 36,305 | 3,366 |
| | Herc Holdings Inc. | 17,434 | 3,301 |
| *,1 | MRC Global Inc. | 254,602 | 3,254 |
| 1 | ABM Industries Inc. | 63,489 | 3,249 |
| 1 | Steelcase Inc. Class A | 270,947 | 3,203 |
| 1 | Owens Corning | 18,716 | 3,188 |
| *,1 | American Woodmark Corp. | 38,546 | 3,066 |
| *,1 | Lyft Inc. Class A | 218,745 | 2,822 |
| 1 | H&E Equipment Services Inc. | 50,531 | 2,474 |
| 1 | Interface Inc. | 99,143 | 2,414 |
| 1 | Golden Ocean Group Ltd. | 250,072 | 2,241 |
| * | MasTec Inc. | 14,276 | 1,943 |
| *,1 | Upwork Inc. | 112,470 | 1,839 |
| 1 | Pitney Bowes Inc. | 198,694 | 1,439 |
| * | Kirby Corp. | 13,366 | 1,414 |
| * | Sun Country Airlines Holdings Inc. | 89,661 | 1,307 |
| *,1 | Tutor Perini Corp. | 46,321 | 1,121 |
| *,1 | JELD-WEN Holding Inc. | 131,812 | 1,080 |
| *,1 | GMS Inc. | 11,798 | 1,001 |
| | Vertiv Holdings Co. Class A | 8,382 | 952 |
| *,1 | AZEK Co. Inc. | 19,795 | 940 |
| * | Innodata Inc. | 23,485 | 928 |
| * | Willdan Group Inc. | 24,318 | 926 |
| * | Uber Technologies Inc. | 15,282 | 922 |
| | Matson Inc. | 5,383 | 726 |
| * | Everus Construction Group Inc. | 9,527 | 626 |
| * | Blue Bird Corp. | 15,493 | 598 |
| * | Cimpress plc | 7,887 | 566 |
| | Eaton Corp. plc | 1,635 | 543 |
| | Arcosa Inc. | 5,347 | 517 |
| * | BlueLinx Holdings Inc. | 4,573 | 467 |
| | Equifax Inc. | 1,796 | 458 |
| * | Sterling Infrastructure Inc. | 2,662 | 448 |
| | Apogee Enterprises Inc. | 6,188 | 442 |
| *,1 | Masterbrand Inc. | 30,007 | 438 |
| | | Shares | Market
Value•
($000) |
| | Heidrick & Struggles International Inc. | 9,653 | 428 |
| 1 | ACCO Brands Corp. | 73,864 | 388 |
| | Cintas Corp. | 2,109 | 385 |
| *,1 | Builders FirstSource Inc. | 2,631 | 376 |
| | | | 69,816 |
| Information Technology (12.2%) |
| *,1 | CommScope Holding Co. Inc. | 654,431 | 3,410 |
| *,1 | RingCentral Inc. Class A | 95,059 | 3,328 |
| *,1 | Wix.com Ltd. | 15,006 | 3,219 |
| *,1 | BigCommerce Holdings Inc. Series 1 | 474,654 | 2,905 |
| *,1 | Penguin Solutions Inc. | 143,993 | 2,763 |
| *,1 | Semtech Corp. | 43,288 | 2,677 |
| *,1 | Kyndryl Holdings Inc. | 65,604 | 2,270 |
| *,1 | PROS Holdings Inc. | 98,502 | 2,163 |
| | QUALCOMM Inc. | 13,643 | 2,096 |
| * | Cirrus Logic Inc. | 21,038 | 2,095 |
| *,1 | MaxLinear Inc. | 104,789 | 2,073 |
| 1 | TD SYNNEX Corp. | 15,508 | 1,819 |
| *,1 | Extreme Networks Inc. | 106,726 | 1,787 |
| *,1 | Adtran Holdings Inc. | 197,770 | 1,647 |
| *,1 | Dropbox Inc. Class A | 54,438 | 1,635 |
| *,1 | Yext Inc. | 230,966 | 1,469 |
| * | AppLovin Corp. Class A | 4,291 | 1,390 |
| * | Western Digital Corp. | 22,664 | 1,351 |
| *,1 | Domo Inc. Class B | 162,437 | 1,150 |
| *,1 | TTM Technologies Inc. | 42,519 | 1,052 |
| 1 | Hewlett Packard Enterprise Co. | 48,695 | 1,040 |
| | NVIDIA Corp. | 6,955 | 934 |
| * | NETGEAR Inc. | 32,985 | 919 |
| | Microsoft Corp. | 2,030 | 856 |
| * | Impinj Inc. | 4,863 | 706 |
| *,1 | ACM Research Inc. Class A | 46,227 | 698 |
| * | Twilio Inc. Class A | 6,428 | 695 |
| * | Weave Communications Inc. | 35,327 | 562 |
| | Amkor Technology Inc. | 20,453 | 525 |
| | Lam Research Corp. | 6,930 | 501 |
| | Benchmark Electronics Inc. | 10,768 | 489 |
| * | Teradata Corp. | 15,671 | 488 |
| | Apple Inc. | 1,923 | 482 |
| * | Palantir Technologies Inc. Class A | 6,338 | 479 |
| * | Harmonic Inc. | 36,104 | 478 |
| | Sapiens International Corp. NV | 14,796 | 398 |
| | | | 52,549 |
| Materials (3.4%) |
| | CRH plc | 36,707 | 3,396 |
| | Louisiana-Pacific Corp. | 26,581 | 2,753 |
| | Kaiser Aluminum Corp. | 33,226 | 2,335 |
| *,1 | Constellium SE | 195,759 | 2,010 |
| *,1 | Coeur Mining Inc. | 305,208 | 1,746 |
| * | Clearwater Paper Corp. | 38,905 | 1,158 |
| 1 | Ardagh Metal Packaging SA | 189,165 | 569 |
| | Scotts Miracle-Gro Co. | 7,191 | 477 |
| 1 | Ryerson Holding Corp. | 22,562 | 418 |
| | | | 14,862 |
| Real Estate (5.6%) |
| 1 | Cousins Properties Inc. | 122,442 | 3,752 |
| 1 | American Assets Trust Inc. | 136,930 | 3,596 |
| 1 | Kite Realty Group Trust | 141,800 | 3,579 |
| 1 | Brixmor Property Group Inc. | 112,796 | 3,140 |
| 1 | Summit Hotel Properties Inc. | 354,673 | 2,429 |
| 1 | Paramount Group Inc. | 282,752 | 1,397 |
| 1 | RLJ Lodging Trust | 136,792 | 1,397 |
| 1 | Piedmont Office Realty Trust Inc. Class A | 149,833 | 1,371 |
| | EPR Properties | 18,569 | 822 |
| 1 | Newmark Group Inc. Class A | 61,392 | 786 |
| | Essex Property Trust Inc. | 2,661 | 760 |
| | SITE Centers Corp. | 49,468 | 756 |
| | | Shares | Market
Value•
($000) |
| | Xenia Hotels & Resorts Inc. | 27,840 | 414 |
| | | | 24,199 |
| Utilities (3.6%) |
| | Brookfield Infrastructure Corp. Class A | 84,917 | 3,397 |
| | Avista Corp. | 87,815 | 3,217 |
| 1 | Black Hills Corp. | 52,616 | 3,079 |
| | Vistra Corp. | 19,930 | 2,748 |
| | NRG Energy Inc. | 18,342 | 1,655 |
| | Portland General Electric Co. | 30,553 | 1,333 |
| | | | 15,429 |
| Total Common Stocks—Long Positions (Cost $376,109) | 419,800 |
| Temporary Cash Investments (1.1%) |
| Money Market Fund (1.1%) |
| 2 | Vanguard Market Liquidity Fund, 4.466% (Cost $4,736) | 47,369 | 4,737 |
| Common Stocks Sold Short (-97.9%) |
| Communication Services (-4.2%) |
| * | Take-Two Interactive Software Inc. | (19,246) | (3,543) |
| * | TKO Group Holdings Inc. | (24,614) | (3,498) |
| | Cogent Communications Holdings Inc. | (44,980) | (3,466) |
| * | Sphere Entertainment Co. | (83,336) | (3,360) |
| * | Lions Gate Entertainment Corp. Class A | (215,716) | (1,842) |
| * | Vivid Seats Inc. Class A | (282,931) | (1,310) |
| * | Gogo Inc. | (123,069) | (996) |
| | | | (18,015) |
| Consumer Discretionary (-10.3%) |
| | VF Corp. | (175,564) | (3,768) |
| | Lithia Motors Inc. | (9,963) | (3,561) |
| * | First Watch Restaurant Group Inc. | (185,245) | (3,447) |
| | Krispy Kreme Inc. | (327,665) | (3,254) |
| | Starbucks Corp. | (34,865) | (3,181) |
| | Cracker Barrel Old Country Store Inc. | (57,882) | (3,060) |
| * | LGI Homes Inc. | (31,879) | (2,850) |
| * | Portillo's Inc. Class A | (276,292) | (2,597) |
| | McDonald's Corp. | (7,881) | (2,285) |
| * | QuantumScape Corp. | (412,161) | (2,139) |
| * | Dream Finders Homes Inc. Class A | (90,562) | (2,107) |
| * | Airbnb Inc. Class A | (16,010) | (2,104) |
| * | Kura Sushi USA Inc. Class A | (22,873) | (2,072) |
| * | Rivian Automotive Inc. Class A | (122,021) | (1,623) |
| * | Asbury Automotive Group Inc. | (6,205) | (1,508) |
| * | Sweetgreen Inc. Class A | (25,859) | (829) |
| | A-Mark Precious Metals Inc. | (29,177) | (799) |
| | Churchill Downs Inc. | (5,074) | (677) |
| | Arhaus Inc. | (58,477) | (550) |
| * | DraftKings Inc. Class A | (13,862) | (516) |
| * | Savers Value Village Inc. | (46,513) | (477) |
| * | Amer Sports Inc. | (16,066) | (449) |
| | Service Corp. International | (5,397) | (431) |
| | | | (44,284) |
| Consumer Staples (-4.8%) |
| * | BJ's Wholesale Club Holdings Inc. | (36,378) | (3,250) |
| | Weis Markets Inc. | (45,993) | (3,115) |
| | Walgreens Boots Alliance Inc. | (307,060) | (2,865) |
| * | Grocery Outlet Holding Corp. | (181,335) | (2,830) |
| | Brown-Forman Corp. Class B | (58,953) | (2,239) |
| * | Dollar Tree Inc. | (15,708) | (1,177) |
| | Hershey Co. | (5,686) | (963) |
| | MGP Ingredients Inc. | (23,392) | (921) |
| * | Chefs' Warehouse Inc. | (16,430) | (810) |
| * | e.l.f. Beauty Inc. | (5,917) | (743) |
| | J & J Snack Foods Corp. | (4,448) | (690) |
| | Dollar General Corp. | (8,270) | (627) |
| * | Celsius Holdings Inc. | (19,767) | (521) |
| | | | (20,751) |
| | | Shares | Market
Value•
($000) |
| Energy (-4.2%) |
| * | NextDecade Corp. | (510,016) | (3,932) |
| | Chesapeake Energy Corp. | (39,248) | (3,907) |
| | Atlas Energy Solutions Inc. | (165,512) | (3,671) |
| | Core Laboratories Inc. | (161,053) | (2,788) |
| * | Uranium Energy Corp. | (349,763) | (2,340) |
| | Kodiak Gas Services Inc. | (23,669) | (967) |
| | Viper Energy Inc. | (9,725) | (477) |
| | | | (18,082) |
| Financials (-21.7%) |
| | FactSet Research Systems Inc. | (7,785) | (3,739) |
| | PJT Partners Inc. Class A | (23,143) | (3,652) |
| | Pinnacle Financial Partners Inc. | (31,298) | (3,580) |
| | Blue Owl Capital Inc. | (152,991) | (3,559) |
| | TPG Inc. | (56,073) | (3,524) |
| | TFS Financial Corp. | (279,039) | (3,505) |
| * | Encore Capital Group Inc. | (73,051) | (3,490) |
| | Glacier Bancorp Inc. | (68,096) | (3,420) |
| | ServisFirst Bancshares Inc. | (40,186) | (3,405) |
| | Stewart Information Services Corp. | (48,992) | (3,306) |
| * | Bancorp Inc. | (61,776) | (3,251) |
| | Visa Inc. Class A | (10,166) | (3,213) |
| | Lakeland Financial Corp. | (45,767) | (3,147) |
| | HA Sustainable Infrastructure Capital Inc. | (117,065) | (3,141) |
| | Franklin Resources Inc. | (154,614) | (3,137) |
| * | Rocket Cos. Inc. Class A | (268,905) | (3,028) |
| * | Triumph Financial Inc. | (31,738) | (2,884) |
| | First Financial Bankshares Inc. | (75,210) | (2,711) |
| * | Shift4 Payments Inc. Class A | (25,152) | (2,610) |
| | New York Community Bancorp Inc. | (265,329) | (2,476) |
| | P10 Inc. Class A | (186,837) | (2,356) |
| | FirstCash Holdings Inc. | (22,352) | (2,316) |
| | Bank of Hawaii Corp. | (30,494) | (2,172) |
| | Ryan Specialty Holdings Inc. | (33,637) | (2,158) |
| * | Baldwin Insurance Group Inc. | (55,656) | (2,157) |
| * | NCR Atleos Corp. | (55,351) | (1,878) |
| * | Oscar Health Inc. Class A | (135,985) | (1,828) |
| | City Holding Co. | (14,998) | (1,777) |
| | Arthur J Gallagher & Co. | (6,216) | (1,764) |
| | UWM Holdings Corp. | (258,826) | (1,519) |
| | OneMain Holdings Inc. | (25,907) | (1,351) |
| | Walker & Dunlop Inc. | (12,397) | (1,205) |
| | JPMorgan Chase & Co. | (4,694) | (1,125) |
| | First Citizens BancShares Inc. Class A | (382) | (807) |
| * | Ambac Financial Group Inc. | (60,155) | (761) |
| | Selective Insurance Group Inc. | (8,016) | (750) |
| | White Mountains Insurance Group Ltd. | (369) | (718) |
| * | Upstart Holdings Inc. | (11,403) | (702) |
| * | I3 Verticals Inc. Class A | (28,131) | (648) |
| * | Lemonade Inc. | (13,634) | (500) |
| | Capitol Federal Financial Inc. | (72,466) | (428) |
| | | | (93,698) |
| Health Care (-10.8%) |
| * | Liquidia Corp. | (340,257) | (4,001) |
| * | Scholar Rock Holding Corp. | (88,540) | (3,827) |
| * | Paragon 28 Inc. | (338,327) | (3,495) |
| * | Axsome Therapeutics Inc. | (39,655) | (3,355) |
| * | Alignment Healthcare Inc. | (294,795) | (3,316) |
| * | QuidelOrtho Corp. | (73,891) | (3,292) |
| * | Tarsus Pharmaceuticals Inc. | (44,864) | (2,484) |
| * | PROCEPT BioRobotics Corp. | (30,624) | (2,466) |
| * | Madrigal Pharmaceuticals Inc. | (7,410) | (2,286) |
| * | Neogen Corp. | (181,565) | (2,204) |
| * | Summit Therapeutics Inc. | (93,278) | (1,665) |
| * | Vaxcyte Inc. | (20,294) | (1,661) |
| * | Roivant Sciences Ltd. | (133,621) | (1,581) |
| * | Praxis Precision Medicines Inc. | (19,816) | (1,525) |
| * | Krystal Biotech Inc. | (8,737) | (1,369) |
| * | Schrodinger Inc. | (62,999) | (1,215) |
| | | Shares | Market
Value•
($000) |
| * | Mirum Pharmaceuticals Inc. | (28,948) | (1,197) |
| * | Nuvalent Inc. Class A | (13,700) | (1,072) |
| * | Soleno Therapeutics Inc. | (22,152) | (996) |
| * | Avadel Pharmaceuticals plc | (84,838) | (892) |
| * | Sana Biotechnology Inc. | (349,618) | (570) |
| * | agilon health Inc. | (257,157) | (489) |
| | Baxter International Inc. | (15,179) | (443) |
| * | Innoviva Inc. | (24,243) | (421) |
| * | PACS Group Inc. | (29,557) | (387) |
| * | Viking Therapeutics Inc. | (7,414) | (298) |
| | | | (46,507) |
| Industrials (-17.0%) |
| * | Frontier Group Holdings Inc. | (590,467) | (4,198) |
| * | Casella Waste Systems Inc. Class A | (35,537) | (3,760) |
| * | Rocket Lab USA Inc. | (146,552) | (3,733) |
| * | JetBlue Airways Corp. | (469,551) | (3,691) |
| | HEICO Corp. | (14,443) | (3,434) |
| | Insperity Inc. | (42,473) | (3,292) |
| * | Bloom Energy Corp. Class A | (145,151) | (3,224) |
| | VSE Corp. | (32,850) | (3,124) |
| * | U-Haul Holding Co. | (44,789) | (3,094) |
| * | Transcat Inc. | (27,319) | (2,889) |
| * | First Advantage Corp. | (151,788) | (2,843) |
| * | Ameresco Inc. Class A | (118,422) | (2,780) |
| * | ACV Auctions Inc. Class A | (128,686) | (2,780) |
| | Concentrix Corp. | (61,738) | (2,671) |
| * | AeroVironment Inc. | (16,873) | (2,597) |
| * | Boeing Co. | (14,422) | (2,553) |
| * | Mercury Systems Inc. | (49,469) | (2,078) |
| * | Sunrun Inc. | (215,304) | (1,992) |
| * | Xometry Inc. Class A | (45,251) | (1,930) |
| * | AerSale Corp. | (269,856) | (1,700) |
| | Alight Inc. Class A | (225,502) | (1,560) |
| | Vestis Corp. | (98,902) | (1,507) |
| | Southwest Airlines Co. | (39,460) | (1,327) |
| * | Montrose Environmental Group Inc. | (70,288) | (1,304) |
| * | RBC Bearings Inc. | (3,828) | (1,145) |
| | Cadre Holdings Inc. | (29,258) | (945) |
| * | Array Technologies Inc. | (135,290) | (817) |
| * | NEXTracker Inc. Class A | (21,648) | (791) |
| * | Amentum Holdings Inc. | (33,868) | (712) |
| * | Titan International Inc. | (101,434) | (689) |
| * | Saia Inc. | (1,449) | (660) |
| | John Bean Technologies Corp. | (4,626) | (588) |
| | FTAI Aviation Ltd. | (3,535) | (509) |
| * | Loar Holdings Inc. | (6,084) | (450) |
| | Heartland Express Inc. | (39,748) | (446) |
| * | 3D Systems Corp. | (128,955) | (423) |
| * | Clarivate plc | (81,488) | (414) |
| | Werner Enterprises Inc. | (11,168) | (401) |
| | | | (73,051) |
| Information Technology (-12.5%) |
| * | Astera Labs Inc. | (29,090) | (3,853) |
| * | Vertex Inc. Class A | (71,214) | (3,799) |
| * | Aspen Technology Inc. | (15,108) | (3,771) |
| | Adeia Inc. | (259,801) | (3,632) |
| * | Globant SA | (15,747) | (3,377) |
| * | NextNav Inc. | (210,872) | (3,281) |
| * | Enphase Energy Inc. | (45,260) | (3,109) |
| * | Mirion Technologies Inc. | (170,915) | (2,983) |
| | Crane NXT Co. | (48,675) | (2,834) |
| | Ubiquiti Inc. | (8,436) | (2,800) |
| * | Allegro MicroSystems Inc. | (113,635) | (2,484) |
| * | PAR Technology Corp. | (33,749) | (2,453) |
| | Power Integrations Inc. | (39,105) | (2,413) |
| * | SiTime Corp. | (10,473) | (2,247) |
| * | CCC Intelligent Solutions Holdings Inc. | (161,224) | (1,891) |
| * | Lumentum Holdings Inc. | (20,182) | (1,694) |
| * | Aurora Innovation Inc. | (217,511) | (1,370) |
| | | Shares | Market
Value•
($000) |
| * | Hut 8 Corp. | (48,785) | (1,000) |
| * | First Solar Inc. | (5,513) | (972) |
| * | Snowflake Inc. Class A | (4,599) | (710) |
| * | Viasat Inc. | (81,354) | (692) |
| | Clear Secure Inc. Class A | (24,298) | (647) |
| | Vishay Intertechnology Inc. | (37,155) | (629) |
| * | Novanta Inc. | (3,909) | (597) |
| * | indie Semiconductor Inc. Class A | (101,517) | (411) |
| * | Clearfield Inc. | (12,610) | (391) |
| | | | (54,040) |
| Materials (-3.3%) |
| | Albemarle Corp. | (35,912) | (3,092) |
| * | Novagold Resources Inc. | (871,771) | (2,903) |
| | FMC Corp. | (50,961) | (2,477) |
| * | Cleveland-Cliffs Inc. | (258,405) | (2,429) |
| | Ramaco Resources Inc. Class A | (135,482) | (1,390) |
| | Warrior Met Coal Inc. | (16,685) | (905) |
| * | Ivanhoe Electric Inc. | (95,202) | (719) |
| | Air Products and Chemicals Inc. | (1,511) | (438) |
| | | | (14,353) |
| Real Estate (-5.4%) |
| | Farmland Partners Inc. | (289,708) | (3,407) |
| | Rexford Industrial Realty Inc. | (79,475) | (3,073) |
| | National Storage Affiliates Trust | (80,173) | (3,039) |
| | Safehold Inc. | (155,052) | (2,865) |
| | WP Carey Inc. | (48,261) | (2,629) |
| | Essential Properties Realty Trust Inc. | (73,923) | (2,312) |
| | SBA Communications Corp. | (9,437) | (1,923) |
| | Uniti Group Inc. | (226,606) | (1,246) |
| * | Apartment Investment and Management Co. Class A | (115,674) | (1,052) |
| | Diversified Healthcare Trust | (323,553) | (744) |
| | Douglas Emmett Inc. | (31,182) | (579) |
| * | Opendoor Technologies Inc. | (312,997) | (501) |
| | | | (23,370) |
| Utilities (-3.7%) |
| | WEC Energy Group Inc. | (35,356) | (3,325) |
| | Ormat Technologies Inc. (XNYS) | (47,328) | (3,205) |
| | Brookfield Renewable Corp. | (110,934) | (3,068) |
| * | Altus Power Inc. | (656,550) | (2,672) |
| | Clearway Energy Inc. Class C | (73,947) | (1,923) |
| | Sempra | (18,227) | (1,599) |
| | | | (15,792) |
Total Common Stocks Sold Short
(Proceeds $382,593) | (421,943) |
| Other Assets and Other Liabilities—Net (99.4%) | 428,307 |
| Net Assets (100%) | 430,901 |
| Cost is in $000. |
| • | See Note A in Notes to Financial Statements. |
| * | Non-income-producing security. |
| 1 | Long security positions with a value of $275,237,000 are held in a segregated account at the fund's custodian bank and pledged to a broker-dealer as collateral for the fund's obligation to return borrowed securities. For so long as such obligations continue, the fund’s access to these assets is subject to authorization from the broker-dealer. |
| 2 | Affiliated money market fund available only to Vanguard funds and certain trusts and accounts managed by Vanguard. Rate shown is the 7-day yield. |
See accompanying Notes, which are an integral part of the Financial Statements.
Statement of Assets and Liabilities
|
| ($000s, except shares, footnotes, and per-share amounts) | Amount |
| Assets | |
| Investments in Securities, at Value | |
| Unaffiliated Issuers (Cost $376,109) | 419,800 |
| Affiliated Issuers (Cost $4,736) | 4,737 |
| Total Investments in Securities | 424,537 |
| Investment in Vanguard | 12 |
| Cash Held at Broker for Short Positions | 428,239 |
| Receivables for Investment Securities Sold | 1,814 |
| Receivables for Accrued Income | 317 |
| Receivables for Capital Shares Issued | 774 |
| Total Assets | 855,693 |
| Liabilities | |
| Securities Sold Short, at Value (Proceeds $382,593) | 421,943 |
| Due to Custodian | 88 |
| Payables for Investment Securities Purchased | 571 |
| Payables for Capital Shares Redeemed | 1,467 |
| Payables to Vanguard | 38 |
| Accrued Dividend Expense on Securities Sold Short | 685 |
| Total Liabilities | 424,792 |
| Net Assets | 430,901 |
| At December 31, 2024, net assets consisted of: | |
| | |
| Paid-in Capital | 542,967 |
| Total Distributable Earnings (Loss) | (112,066) |
| Net Assets | 430,901 |
| |
| Investor Shares—Net Assets | |
Applicable to 29,891,154 outstanding $.001 par value shares of
beneficial interest (unlimited authorization) | 396,258 |
| Net Asset Value Per Share—Investor Shares | $13.26 |
| |
| Institutional Shares—Net Assets | |
Applicable to 2,623,058 outstanding $.001 par value shares of
beneficial interest (unlimited authorization) | 34,643 |
| Net Asset Value Per Share—Institutional Shares | $13.21 |
See accompanying Notes, which are an integral part of the Financial Statements.
|
| | Year Ended
December 31, 2024 |
| | ($000) |
| Investment Income | |
| Income | |
| Dividends1 | 6,629 |
| Interest2 | 23,683 |
| Securities Lending—Net | 73 |
| Total Income | 30,385 |
| Expenses | |
| The Vanguard Group—Note B | |
| Investment Advisory Services | 124 |
| Management and Administrative—Investor Shares | 648 |
| Management and Administrative—Institutional Shares | 27 |
| Marketing and Distribution—Investor Shares | 31 |
| Marketing and Distribution—Institutional Shares | 1 |
| Custodian Fees | 16 |
| Auditing Fees | 49 |
| Shareholders’ Reports and Proxy Fees—Investor Shares | 35 |
| Shareholders’ Reports and Proxy Fees—Institutional Shares | 2 |
| Trustees’ Fees and Expenses | — |
| Dividend Expense on Securities Sold Short | 5,815 |
| Other Expenses | 15 |
| Total Expenses | 6,763 |
| Net Investment Income | 23,622 |
| Realized Net Gain (Loss) | |
| Investment Securities Sold—Long Positions2 | 77,360 |
| Investment Securities Sold—Short Positions | (64,636) |
| Realized Net Gain (Loss) | 12,724 |
| Change in Unrealized Appreciation (Depreciation) | |
| Investment Securities—Long Positions2 | (832) |
| Investment Securities—Short Positions | (8,053) |
| Change in Unrealized Appreciation (Depreciation) | (8,885) |
| Net Increase (Decrease) in Net Assets Resulting from Operations | 27,461 |
| 1 | Dividends are net of foreign withholding taxes of $28,000. |
| 2 | Interest income, realized net gain (loss), and change in unrealized appreciation (depreciation) from an affiliated company of the fund were $383,000, ($2,000), and $1,000, respectively. Purchases and sales are for temporary cash investment purposes. |
See accompanying Notes, which are an integral part of the Financial Statements.
Statement of Changes in Net Assets
|
| | Year Ended December 31, |
| | 2024
($000) | 2023
($000) |
| Increase (Decrease) in Net Assets | | |
| Operations | | |
| Net Investment Income | 23,622 | 24,168 |
| Realized Net Gain (Loss) | 12,724 | 57,495 |
| Change in Unrealized Appreciation (Depreciation) | (8,885) | (28,502) |
| Net Increase (Decrease) in Net Assets Resulting from Operations | 27,461 | 53,161 |
| Distributions | | |
| Investor Shares | (21,586) | (22,681) |
| Institutional Shares | (1,863) | (1,480) |
| Total Distributions | (23,449) | (24,161) |
| Capital Share Transactions | | |
| Investor Shares | (69,600) | (210,654) |
| Institutional Shares | 5,635 | (27,367) |
| Net Increase (Decrease) from Capital Share Transactions | (63,965) | (238,021) |
| Total Increase (Decrease) | (59,953) | (209,021) |
| Net Assets | | |
| Beginning of Period | 490,854 | 699,875 |
| End of Period | 430,901 | 490,854 |
See accompanying Notes, which are an integral part of the Financial Statements.
| Investor Shares | | | | | |
For a Share Outstanding
Throughout Each Period | Year Ended December 31, |
| 2024 | 2023 | 2022 | 2021 | 2020 |
| Net Asset Value, Beginning of Period | $13.23 | $12.39 | $11.00 | $8.94 | $10.19 |
| Investment Operations | | | | | |
| Net Investment Income1 | .683 | .572 | .107 | .017 | .051 |
| Net Realized and Unrealized Gain (Loss) on Investments | .090 | .941 | 1.376 | 2.060 | (1.229) |
| Total from Investment Operations | .773 | 1.513 | 1.483 | 2.077 | (1.178) |
| Distributions | | | | | |
| Dividends from Net Investment Income | (.743) | (.673) | (.093) | (.017) | (.072) |
| Distributions from Realized Capital Gains | — | — | — | — | — |
| Total Distributions | (.743) | (.673) | (.093) | (.017) | (.072) |
| Net Asset Value, End of Period | $13.26 | $13.23 | $12.39 | $11.00 | $8.94 |
| Total Return | 5.84% | 12.24% | 13.48% | 23.24% | -11.57% |
| Ratios/Supplemental Data | | | | | |
| Net Assets, End of Period (Millions) | $396 | $461 | $648 | $283 | $243 |
| Ratio of Total Expenses to Average Net Assets | | | | | |
| Based on Total Expenses2,3 | 1.40% | 1.80% | 1.83% | 1.31% | 1.18% |
| Net of Dividend and Borrowing Expense on Securities Sold Short | 0.20% | 0.20% | 0.20% | 0.20% | 0.20% |
| Ratio of Net Investment Income to Average Net Assets | 4.89% | 4.50% | 0.90% | 0.18% | 0.52% |
| Portfolio Turnover Rate | 104% | 124% | 209% | 133% | 172% |
| 1 | Calculated based on average shares outstanding. |
| 2 | Includes dividend expense on securities sold short of 1.20%, 1.60%, 1.63%, 0.84%, and 0.98%, respectively. |
| 3 | Includes borrowing expense on securities sold short of 0.00%, 0.00%, 0.00%, 0.27%, and 0.00%, respectively. |
See accompanying Notes, which are an integral part of the Financial Statements.
| Institutional Shares | | | | | |
For a Share Outstanding
Throughout Each Period | Year Ended December 31, |
| 2024 | 2023 | 2022 | 2021 | 2020 |
| Net Asset Value, Beginning of Period | $13.18 | $12.34 | $10.96 | $8.90 | $10.15 |
| Investment Operations | | | | | |
| Net Investment Income1 | .692 | .566 | .108 | .017 | .057 |
| Net Realized and Unrealized Gain (Loss) on Investments | .087 | .953 | 1.368 | 2.065 | (1.230) |
| Total from Investment Operations | .779 | 1.519 | 1.476 | 2.082 | (1.173) |
| Distributions | | | | | |
| Dividends from Net Investment Income | (.749) | (.679) | (.096) | (.022) | (.077) |
| Distributions from Realized Capital Gains | — | — | — | — | — |
| Total Distributions | (.749) | (.679) | (.096) | (.022) | (.077) |
| Net Asset Value, End of Period | $13.21 | $13.18 | $12.34 | $10.96 | $8.90 |
| Total Return | 5.91% | 12.33% | 13.47% | 23.39% | -11.58% |
| Ratios/Supplemental Data | | | | | |
| Net Assets, End of Period (Millions) | $35 | $29 | $52 | $45 | $65 |
| Ratio of Total Expenses to Average Net Assets | | | | | |
| Based on Total Expenses2,3 | 1.34% | 1.74% | 1.77% | 1.25% | 1.12% |
| Net of Dividend and Borrowing Expense on Securities Sold Short | 0.14% | 0.14% | 0.14% | 0.14% | 0.14% |
| Ratio of Net Investment Income to Average Net Assets | 4.96% | 4.48% | 0.91% | 0.17% | 0.59% |
| Portfolio Turnover Rate | 104% | 124% | 209% | 133% | 172% |
| 1 | Calculated based on average shares outstanding. |
| 2 | Includes dividend expense on securities sold short of 1.20%, 1.60%, 1.63%, 0.84%, and 0.98%, respectively. |
| 3 | Includes borrowing expense on securities sold short of 0.00%, 0.00%, 0.00%, 0.27%, and 0.00%, respectively. |
See accompanying Notes, which are an integral part of the Financial Statements.
Notes to Financial Statements
Vanguard Market Neutral Fund is registered under the Investment Company Act of 1940 as an open-end investment company, or mutual fund. The fund offers two classes of shares: Investor Shares and Institutional Shares. Each of the share classes has different eligibility and minimum purchase requirements, and is designed for different types of investors.
| A. | The following significant accounting policies conform to generally accepted accounting principles for U.S. investment companies. The fund consistently follows such policies in preparing its financial statements. |
1. Security Valuation: Securities are valued as of the close of trading on the New York Stock Exchange (generally 4 p.m., Eastern time) on the valuation date. Equity securities are valued at the latest quoted sales prices or official closing prices taken from the primary market in which each security trades; such securities not traded on the valuation date are valued at the mean of the latest quoted bid and asked prices. Securities for which market quotations are not readily available, or whose values have been affected by events occurring before the fund’s pricing time but after the close of the securities’ primary markets, are valued by methods deemed by the valuation designee to represent fair value and subject to oversight by the board of trustees. Investments in Vanguard Market Liquidity Fund are valued at that fund's net asset value.
2. Short Sales: Short sales are the sales of securities that the fund does not own. The fund sells a security it does not own in anticipation of a decline in the value of that security. In order to deliver the security to the purchaser, the fund borrows the security from a broker-dealer. The fund must segregate, as collateral for its obligation to return the borrowed security, an amount of cash and long security positions at least equal to the market value of the security sold short. In the absence of a default, the collateral segregated by the fund cannot be repledged, resold or rehypothecated. This results in the fund holding a significant portion of its assets in cash. The fund later closes out the position by returning the security to the lender, typically by purchasing the security in the open market. A gain, limited to the price at which the fund sold the security short, or a loss, theoretically unlimited in size, is recognized upon the termination of the short sale. The fund is charged a fee on borrowed securities, based on the market value of each borrowed security and a variable rate that is dependent upon the availability of such security, and the fund may receive a portion of the income from the investment of collateral which offsets the borrowing fee. The net amounts of fees or income are recorded as borrowing expense on securities sold short (for net fees charged) or interest income (for net income received) on the Statement of Operations. Dividends on securities sold short are reported as an expense in the Statement of Operations. Cash collateral segregated for securities sold short is recorded as an asset in the Statement of Assets and Liabilities. Long security positions segregated as collateral are shown in the Schedule of Investments.
3. Federal Income Taxes: The fund intends to continue to qualify as a regulated investment company and distribute virtually all of its taxable income. The fund’s tax returns are open to examination by the relevant tax authorities until expiration of the applicable statute of limitations, which is generally three years after the filing of the tax return. Management has analyzed the fund’s tax positions taken for all open federal and state income tax years, and has concluded that no provision for income tax is required in the fund’s financial statements.
4. Distributions: Distributions to shareholders are recorded on the ex-dividend date. Distributions are determined on a tax basis at the fiscal year-end and may differ from net investment income and realized capital gains for financial reporting purposes.
5. Securities Lending: To earn additional income, the fund lends its securities to qualified institutional borrowers. Security loans are subject to termination by the fund at any time, and are required to be secured at all times by collateral in an amount at least equal to the market value of securities loaned. Daily market fluctuations could cause the value of loaned securities to be more or less than the value of the collateral received. When this occurs, the collateral is adjusted and settled before the opening of the market on the next business day. The fund further mitigates its counterparty risk by entering into securities lending transactions only with a diverse group of prequalified counterparties, monitoring their financial strength, and entering into master securities lending agreements with its counterparties. The master securities lending agreements provide that, in the event of a counterparty’s default (including bankruptcy), the fund may terminate any loans with that borrower, determine the net amount owed, and sell or retain the collateral up to the net amount owed to the fund; however, such actions may be subject to legal proceedings. While collateral mitigates counterparty risk, in the event of a default, the fund may experience delays and costs in recovering the securities loaned. The fund invests cash collateral received in Vanguard Market Liquidity Fund, and records a liability in the Statement of Assets and Liabilities for the return of the collateral, during the period the securities are on loan. Collateral investments in Vanguard Market Liquidity Fund are subject to market appreciation or depreciation. Securities lending income represents fees charged to borrowers plus income earned on invested cash collateral, less expenses associated with the loan. During the term of the loan, the fund is entitled to all distributions made on or in respect of the loaned securities.
6. Credit Facilities and Interfund Lending Program: The fund and certain other funds managed by The Vanguard Group ("Vanguard") participate in a $4.3 billion committed credit facility provided by a syndicate of lenders pursuant to a credit agreement and an uncommitted credit facility provided by Vanguard. Both facilities may be renewed annually. Each fund is individually liable for its borrowings, if any, under the credit facilities. Borrowings may be utilized for temporary or emergency purposes and are subject to the fund’s regulatory and contractual borrowing restrictions. With respect to the committed credit facility, the participating funds are charged administrative fees and an annual commitment fee of 0.10% of the undrawn committed amount of the facility, which are allocated to the funds based on a method approved by the fund’s board of trustees and included in Management and Administrative expenses on the fund’s Statement of Operations. Any borrowings under either facility bear interest at an agreed-upon spread plus the higher of the federal funds effective rate, the overnight bank funding rate, or the Daily Simple Secured Overnight Financing Rate inclusive of an additional agreed-upon spread. However, borrowings under the uncommitted credit facility may bear interest based upon an alternate rate agreed to by the fund and Vanguard.
In accordance with an exemptive order (the “Order”) from the SEC, the fund may participate in a joint lending and borrowing program that allows registered open-end Vanguard funds to borrow money from and lend money to each other for temporary or emergency purposes (the “Interfund Lending Program”), subject to compliance with the terms and conditions of the Order, and to the extent permitted by the fund’s investment objective and investment policies. Interfund loans and borrowings normally extend overnight but can have a maximum duration of seven days. Loans may be called on one business day’s notice. The interest rate to be charged is governed by the conditions of the Order and internal procedures adopted by the board of trustees. The board of trustees is responsible for overseeing the Interfund Lending Program.
For the year ended December 31, 2024, the fund did not utilize the credit facilities or the Interfund Lending Program.
7. Other: Dividend income (or dividend expense on short positions) is recorded on the ex-dividend date. Non-cash dividends included in income, if any, are recorded at the fair value of the securities received. Interest income includes income distributions received from Vanguard Market Liquidity Fund and is accrued daily. Security transactions are accounted for on the date securities are bought or sold. Costs used to determine realized gains (losses) on the sale of investment securities are those of the specific securities sold.
Each class of shares has equal rights as to assets and earnings, except that each class separately bears certain class-specific expenses related to maintenance of shareholder accounts (included in Management and Administrative expenses), shareholder reporting, and proxy fees. Marketing and distribution expenses are allocated to each class of shares based on a method approved by the board of trustees. Income, other non-class-specific expenses, and gains and losses on investments are allocated to each class of shares based on its relative net assets.
| B. | In accordance with the terms of a Funds' Service Agreement (the “FSA”) between Vanguard and the fund, Vanguard furnishes to the fund investment advisory, corporate management, administrative, marketing, and distribution services at Vanguard’s cost of operations (as defined by the FSA). These costs of operations are allocated to the fund based on methods and guidelines approved by the board of trustees and are generally settled twice a month. |
Upon the request of Vanguard, the fund may invest up to 0.40% of its net assets as capital in Vanguard. At December 31, 2024, the fund had contributed to Vanguard capital in the amount of $12,000, representing less than 0.01% of the fund’s net assets and less than 0.01% of Vanguard’s capital received pursuant to the FSA. The fund’s trustees and officers are also directors and employees, respectively, of Vanguard.
| C. | Various inputs may be used to determine the value of the fund’s investments. These inputs are summarized in three broad levels for financial statement purposes. The inputs or methodologies used to value securities are not necessarily an indication of the risk associated with investing in those securities. |
Level 1—Quoted prices in active markets for identical securities.
Level 2—Other significant observable inputs (including quoted prices for similar securities, interest rates, prepayment speeds, credit risk, etc.).
Level 3—Significant unobservable inputs (including the fund’s own assumptions used to determine the fair value of investments). Any investments valued with significant unobservable inputs are noted on the Schedule of Investments.
At December 31, 2024, 100% of the market value of the fund’s investments was determined based on Level 1 inputs.
| D. | Permanent differences between book-basis and tax-basis components of net assets, if any, are reclassified among capital accounts in the financial statements to reflect their tax character. These reclassifications have no effect on net assets or net asset value per share. |
Temporary differences between book-basis and tax-basis components of total distributable earnings (loss) arise when certain items of income, gain, or loss are recognized in different periods for financial statement and tax purposes; these differences will reverse at some time in the future. The differences are primarily related to capital loss carryforwards; the deferral of losses from wash sales; and unsettled short sales. As of period end, the tax-basis components of total distributable earnings (loss) are detailed in the table as follows:
| | Amount
($000) |
| Undistributed Ordinary Income | 405 |
| Undistributed Long-Term Gains | — |
| Net Unrealized Gains (Losses) | 2,830 |
| Capital Loss Carryforwards | (115,301) |
| Qualified Late-Year Losses | — |
| Other Temporary Differences | — |
| Total | (112,066) |
The tax character of distributions paid was as follows:
| | Year Ended December 31, |
| | 2024
Amount
($000) | 2023
Amount
($000) |
| Ordinary Income* | 23,449 | 24,161 |
| Long-Term Capital Gains | — | — |
| Total | 23,449 | 24,161 |
| * | Includes short-term capital gains, if any. |
As of December 31, 2024, gross unrealized appreciation and depreciation for investments, and securities sold short based on cost for U.S. federal income tax purposes were as follows:
| | Amount
($000) |
| Tax Cost | 382,356 |
| Gross Unrealized Appreciation | 185,614 |
| Gross Unrealized Depreciation | (182,784) |
| Net Unrealized Appreciation (Depreciation) | 2,830 |
| E. | During the year ended December 31, 2024, the fund purchased $398,836,000 of investment securities and sold $527,174,000 of investment securities, other than temporary cash investments. The proceeds of short sales and the cost of purchases to cover short sales were $449,240,000 and $569,697,000, respectively. |
The fund purchased securities from and sold securities to other Vanguard funds or accounts managed by Vanguard or its affiliates, in accordance with procedures adopted by the board of trustees in compliance with Rule 17a-7 of the Investment Company Act of 1940. For the year ended December 31, 2024, such purchases were $68,000 and sales were $1,172,000, resulting in net realized gain of $210,000; these amounts, other than temporary cash investments, are included in the purchases and sales of investment securities noted above.
| F. | Capital share transactions for each class of shares were: |
| | Year Ended December 31, |
| | 2024 | | 2023 |
| | Amount
($000) | Shares
(000) | | Amount
($000) | Shares
(000) |
| Investor Shares | | | | | |
| Issued | 176,162 | 12,625 | | 183,160 | 14,227 |
| Issued in Lieu of Cash Distributions | 14,570 | 1,099 | | 16,452 | 1,249 |
| Redeemed | (260,332) | (18,702) | | (410,266) | (32,895) |
| Net Increase (Decrease)—Investor Shares | (69,600) | (4,978) | | (210,654) | (17,419) |
| Institutional Shares | | | | | |
| Issued | 17,973 | 1,290 | | 28,782 | 2,237 |
| Issued in Lieu of Cash Distributions | 1,863 | 141 | | 1,135 | 87 |
| Redeemed | (14,201) | (1,038) | | (57,284) | (4,305) |
| Net Increase (Decrease)—Institutional Shares | 5,635 | 393 | | (27,367) | (1,981) |
| G. | Significant market disruptions, such as those caused by pandemics, natural or environmental disasters, war, acts of terrorism, or other events, can adversely affect local and global markets and normal market operations. Any such disruptions could have an adverse impact on the value of the fund’s investments and fund performance. |
To the extent the fund’s investment portfolio reflects concentration in a particular market, industry, sector, country or asset class, the fund may be adversely affected by the performance of these concentrations and may be subject to increased price volatility and other risks.
| H. | The fund adopted Accounting Standards Update 2023-07, Segment Reporting - Improvements to Reportable Segment Disclosures. The new guidance did not change how the fund identifies operating segments but did require incremental disclosure of information not previously required. Operating segments are components of an entity that engage in business activities, have discrete financial information available, and have their operating results regularly reviewed by a chief operating decision maker (“CODM”). The fund is considered a single segment. Vanguard’s chief executive officer, chief investment officer, and chief financial officer, who are also officers of the fund, as well as the fund’s chief financial officer collectively act as the CODM. Vanguard has established various management committees to assist the CODM with overseeing aspects of the fund’s daily operations. Through these committees, the CODM manages the fund’s operations to achieve a single investment objective, as detailed in its prospectus, through the execution of the fund’s investment strategies. When assessing segment performance and making decisions about segment resources, the CODM relies on the fund’s portfolio composition, total returns, expense ratios and changes in net assets which are consistent with the information contained in the fund’s financial statements. Segment assets, liabilities, income, and expenses are also detailed in the accompanying financial statements. |
| I. | Management has determined that no subsequent events or transactions occurred through the date the financial statements were issued that would require recognition or disclosure in these financial statements. |
Report of Independent Registered Public Accounting Firm
To the Board of Trustees of Vanguard Montgomery Funds and Shareholders of Vanguard Market Neutral Fund
Opinion on the Financial Statements
We have audited the accompanying statement of assets and liabilities, including the schedule of investments, of Vanguard Market Neutral Fund (constituting Vanguard Montgomery Funds, referred to hereafter as the "Fund") as of December 31, 2024, the related statement of operations for the year ended December 31, 2024, the statement of changes in net assets for each of the two years in the period ended December 31, 2024, including the related notes, and the financial highlights for each of the five years in the period ended December 31, 2024 (collectively referred to as the "financial statements"). In our opinion, the financial statements present fairly, in all material respects, the financial position of the Fund as of December 31, 2024, the results of its operations for the year then ended, the changes in its net assets for each of the two years in the period ended December 31, 2024 and the financial highlights for each of the five years in the period ended December 31, 2024 in conformity with accounting principles generally accepted in the United States of America.
Basis for Opinion
These financial statements are the responsibility of the Fund’s management. Our responsibility is to express an opinion on the Fund’s financial statements based on our audits. We are a public accounting firm registered with the Public Company Accounting Oversight Board (United States) (PCAOB) and are required to be independent with respect to the Fund in accordance with the U.S. federal securities laws and the applicable rules and regulations of the Securities and Exchange Commission and the PCAOB.
We conducted our audits of these financial statements in accordance with the standards of the PCAOB. Those standards require that we plan and perform the audit to obtain reasonable assurance about whether the financial statements are free of material misstatement, whether due to error or fraud.
Our audits included performing procedures to assess the risks of material misstatement of the financial statements, whether due to error or fraud, and performing procedures that respond to those risks. Such procedures included examining, on a test basis, evidence regarding the amounts and disclosures in the financial statements. Our audits also included evaluating the accounting principles used and significant estimates made by management, as well as evaluating the overall presentation of the financial statements. Our procedures included confirmation of securities owned as of December 31, 2024 by correspondence with the custodian, transfer agent and brokers; when replies were not received from brokers, we performed other auditing procedures. We believe that our audits provide a reasonable basis for our opinion.
/s/PricewaterhouseCoopers LLP
Philadelphia, Pennsylvania
February 20, 2025
We have served as the auditor of one or more investment companies in The Vanguard Group of Funds since 1975.
Tax information (unaudited)
For corporate shareholders, 20.5%, or if subsequently determined to be different, the maximum percentage allowable by law, of ordinary income (dividend income plus short-term gains, if any) for the fiscal year qualified for the dividends-received deduction.
The fund hereby designates $5,797,000, or if subsequently determined to be different, the maximum amount allowable by law, as qualified dividend income for purposes of the maximum rate under section 1(h)(11) for the fiscal year.
The fund hereby designates for the fiscal year $214,000, or if subsequently determined to be different, the maximum amount allowable by law, of interest earned from obligations of the U.S. government which is generally exempt from state income tax.
The fund hereby designates $1,419,000, or if subsequently determined to be different, the maximum amount allowable by law, of qualified business income under section 199A for the fiscal year.
Q6340 022025
Item 8: Changes in and Disagreements with Accountants for Open-End Management Investment Companies.
Not applicable.
Item 9: Proxy Disclosures for Open-End Management Investment Companies.
Not applicable.
Item 10: Remuneration Paid to Directors, Officers, and Others of Open-End Management Investment Companies.
Not applicable. The Trustees’ Fees and Expenses are included in the financial statements filed under Item 7 of this Form.
Item 11: Statement Regarding Basis for Approval of Investment Advisory Contracts.
Not applicable.
Item 12: Disclosure of Proxy Voting Policies and Procedures for Closed-End Management Investment Companies.
Not applicable.
Item 13: Portfolio Managers of Closed-End Management Investment Companies.
Not applicable.
Item 14: Purchase of Equity Securities by Closed-End Management Investment Company and Affiliated Purchasers.
Not applicable.
Item 15: Submission of Matters to a Vote of Security Holders.
Not applicable.
Item 16: Controls and Procedures.
(a) Disclosure Controls and Procedures. The Principal Executive and Financial Officers concluded that the Registrant’s disclosure controls and procedures are effective based on their evaluation of the disclosure controls and procedures as of a date within 90 days of the filing date of this report.
(b) Internal Control Over Financial Reporting. In February 2024, a third-party service provider began performing security pricing services for the Registrant. There were no other changes in the Registrant’s internal control over financial reporting or in other factors that could significantly affect this control during the period covered by this report, including any corrective actions with regard to significant deficiencies and material weaknesses.
Item 17: Disclosure of Securities Lending Activities for Closed-End Management Investment Companies.
Not applicable.
Item 18: Recovery of Erroneously Awarded Compensation.
Not applicable.
Item 19: Exhibits.
(a)(1) Code of Ethics filed herewith.
(a)(2) Certifications filed herewith.
(a)(2) Certifications filed herewith.
Pursuant to the requirements of the Securities Exchange Act of 1934 and the Investment Company Act of 1940, the registrant has duly caused this report to be signed on its behalf by the undersigned, thereunto duly authorized.
| | VANGUARD MONTGOMERY FUNDS | |
| | | |
| BY: | /s/ SALIM RAMJI* | |
| | | |
| | SALIM RAMJI | |
| | CHIEF EXECUTIVE OFFICER | |
Date: February 21, 2025
Pursuant to the requirements of the Securities Exchange Act of 1934 and the Investment Company Act of 1940, this report has been signed below by the following persons on behalf of the registrant and in the capacities and on the dates indicated.
| | VANGUARD MONTGOMERY FUNDS | |
| | | |
| BY: | /s/ SALIM RAMJI* | |
| | | |
| | SALIM RAMJI | |
| | CHIEF EXECUTIVE OFFICER | |
Date: February 21, 2025
| | VANGUARD MONTGOMERY FUNDS | |
| | | |
| BY: | /s/ CHRISTINE BUCHANAN* | |
| | | |
| | CHRISTINE BUCHANAN | |
| | CHIEF FINANCIAL OFFICER | |
Date: February 21, 2025
| * By: | /s/ Tonya T. Robinson | |
Tonya T. Robinson, pursuant to a Power of Attorney filed on February 28, 2025 (see File Number 333-177613), Incorporated by Reference.