UNITED STATES
SECURITIES AND EXCHANGE COMMISSION
Washington, D.C. 20549
FORM 10-Q
(Mark One)
| x | QUARTERLY REPORT PURSUANT TO SECTION 13 OR 15(d) OF THE SECURITIES EXCHANGE ACT OF 1934 |
For the quarterly period ended September 30, 2013
or
| ¨ | TRANSITION REPORT PURSUANT TO SECTION 13 OR 15(d) OF THE SECURITIES EXCHANGE ACT OF 1934 |
For the transition period from to
Commission File Number: 000-54752
LendingClub Corporation
(Exact name of registrant as specified in its charter)
| | |
| Delaware | | 51-0605731 |
(State or other jurisdiction of incorporation or organization) | | (I.R.S. Employer Identification No.) |
| |
71 Stevenson St., Suite 300 San Francisco, California | | 94105 |
| (Address of principal executive offices) | | (Zip Code) |
(415) 632-5600
(Registrant’s telephone number, including area code)
Indicate by check mark whether the registrant (1) has filed all reports required to be filed by Section 13 or 15(d) of the Securities Exchange Act of 1934 during the preceding 12 months (or for such shorter period that the registrant was required to file such reports), and (2) has been subject to such filing requirements for the past 90 days. Yes x No ¨
Indicate by check mark whether the registrant has submitted electronically and posted on its corporate Web site, if any, every Interactive Data File required to be submitted and posted pursuant to Rule 405 of Regulation S-T (§232.405 of this chapter) during the preceding 12 months (or for such shorter period that the registrant was required to submit and post such files). Yes x No ¨
Indicate by check mark whether the registrant is a large accelerated filer, an accelerated filer, a non-accelerated filer, or a smaller reporting company. See the definitions of “large accelerated filer,” “accelerated filer” and “smaller reporting company” in Rule 12b-2 of the Exchange Act. (Check one):
| | | | | | |
| Large accelerated filer | | ¨ | | Accelerated filer | | ¨ |
| | | |
| Non-accelerated filer | | ¨ (Do not check if a smaller reporting company) | | Smaller reporting company | | x |
Indicate by check mark whether the registrant is a shell company (as defined in Rule 12b-2 of the Exchange Act). Yes ¨ No x
As of October 31, 2013, there were 13,694,815 shares of the registrant’s common stock outstanding.
LENDINGCLUB CORPORATION
TABLE OF CONTENTS
Cautionary Note Regarding Forward-Looking Statements
This Quarterly Report on Form 10-Q (“Report”) contains forward-looking statements within the meaning of Section 27A of the Securities Act of 1933 (“1933 Act”), as amended, and Section 21E of the Securities Exchange Act of 1934 (“1934 Act”), as amended, that involve substantial risks and uncertainties. Those sections of the 1933 Act and 1934 Act provide a “safe harbor” for forward-looking statements to encourage companies to provide prospective information about their financial performance so long as they provide meaningful, cautionary statements identifying important factors that could cause actual results to differ significantly from projected results.
All statements, other than statements of historical facts, included in this Report on Form 10-Q regarding our borrower members, credit scoring, Fair Isaac Corporation (“FICO”) scores, our strategy, future operations, future financial position, future revenue, projected costs, prospects, plans, objectives of management and expected market growth are forward-looking statements. The words “anticipate,” “believe,” “continue,” “could,” “estimate,” “expect,” “intend,” “may,” “plan,” “predict,” “project,” “will,” “would” or similar expressions are intended to identify forward-looking statements, although not all forward-looking statements contain these identifying words. These forward-looking statements include, among other things, statements about:
| | • | | our ability to attract potential borrowers to our lending platform; |
| | • | | the degree to which potential borrowers apply for, are approved for and actually borrow via a Member Loan; |
| | • | | the status of borrower members, the ability of borrower members to repay Member Loans and the plans of borrower members; |
| | • | | interest rates and origination fees on Member Loans; |
| | • | | our ability to service Member Loans and our ability, or the ability of third party collection agents, to pursue collection of delinquent and defaulted Member Loans; |
| | • | | our ability to retain WebBank or another third party banking institution as the lender of loans originated through our platform; |
| | • | | the functionality of the secondary market trading program; |
| | • | | expected rates of return provided to investors; |
| | • | | our ability to attract additional investors to the platform, to our funds, to separately managed accounts or to purchase loans; |
| | • | | our financial condition and performance, including our ability to remain profitable or cash flow positive; |
| | • | | our ability to retain and hire competent employees and appropriately staff our operations; |
| | • | | the lack of a public trading market for the member payment dependent Notes (“Notes”) and Trust Certificates (“Certificates”) and any inability to resell the Notes and Certificates; |
| | • | | our ability to prevent security breaks, disruption in service, and comparable events that could compromise the personal and confidential information held in our data systems, reduce the attractiveness of the platform or adversely impact our ability to service the loans; |
| | • | | our compliance with applicable local, state and federal laws, including the Investment Advisors Act of 1940, the Investment Company Act of 1940 and other laws; and |
| | • | | our compliance with applicable regulations and regulatory developments. |
We may not actually achieve the plans, intentions or expectations disclosed in forward-looking statements, and you should not place undue reliance on forward-looking statements. We have included important factors in the cautionary statements included in this Report, including in the “Risk Factors” section of our annual Report on Form 10-K, for a description of certain risks that could, among other things, cause actual results or events to differ materially from forward-looking statements contained in this Report. Forward-looking statements do not reflect the potential impact of any future acquisitions, mergers, dispositions, joint ventures or investments we may make.
You should carefully read this Report completely and with the understanding that actual future results may be materially different from what we expect. We do not assume any obligation to update or revise any forward-looking statements, whether as a result of new information, future events or otherwise, other than as required by law.
1
PART I. FINANCIAL INFORMATION
Item 1. Financial Statements
LendingClub Corporation and Subsidiaries
Condensed Consolidated Balance Sheets (unaudited)
(in thousands, except per share data)
| | | | | | | | |
| | | September 30,
2013 | | | December 31,
2012 | |
| ASSETS | | | | | | | | |
Cash and cash equivalents | | $ | 62,186 | | | $ | 52,551 | |
Restricted cash | | | 8,747 | | | | 7,484 | |
Member Loans at fair value (includes $939,817 and $396,081 from consolidated Trust, respectively) | | | 1,516,676 | | | | 781,215 | |
Accrued interest receivable (includes $4,583 and $2,023 from consolidated Trust, respectively) | | | 12,801 | | | | 5,521 | |
Prepaid expenses and other assets | | | 2,578 | | | | 1,785 | |
Property, Equipment and Software, net | | | 8,407 | | | | 1,578 | |
Deposits | | | 253 | | | | 696 | |
| | | | | | | | |
Total Assets | | $ | 1,611,648 | | | $ | 850,830 | |
| | | | | | | | |
| LIABILITIES | | | | | | | | |
Accounts payable | | $ | 2,330 | | | $ | 1,210 | |
Accrued interest payable (includes $4,583 and $2,023 from consolidated Trust, respectively) | | | 14,549 | | | | 6,678 | |
Accrued expenses and other liabilities | | | 9,475 | | | | 3,366 | |
Payable to member investors | | | 457 | | | | 2,050 | |
Notes and Certificates at fair value (includes $939,817 and $396,081 from consolidated Trust, respectively) | | | 1,522,975 | | | | 785,316 | |
| | | | | | | | |
Total Liabilities | | | 1,549,786 | | | | 798,620 | |
| | | | | | | | |
Commitments and contingencies (seeNote 12) | | | | | | | | |
| PREFERRED STOCK | | | | | | | | |
Preferred stock | | $ | 103,219 | | | $ | 103,023 | |
| STOCKHOLDERS’ DEFICIT | | | | | | | | |
Common stock, $0.01 par value; 90,000,000 shares authorized at September 30, 2013 and December 31, 2012, respectively; 13,601,335 and 11,291,862 shares issued and outstanding at September 30, 2013 and December 31, 2012, respectively | | $ | 136 | | | $ | 123 | |
Additional paid-in capital | | | 11,694 | | | | 6,713 | |
Treasury stock (0 and 17,640 shares held at September 30, 2013 and December 31, 2012, respectively) | | | — | | | | (12 | ) |
Accumulated deficit | | | (53,187 | ) | | | (57,637 | ) |
| | | | | | | | |
Total Stockholders’ Deficit | | | (41,357 | ) | | | (50,813 | ) |
| | | | | | | | |
Total Liabilities, Preferred Stock and Stockholders’ Deficit | | $ | 1,611,648 | | | $ | 850,830 | |
| | | | | | | | |
The accompanying notes are an integral part of these condensed consolidated financial statements.
2
LendingClub Corporation and Subsidiaries
Condensed Consolidated Statements of Operations (Unaudited)
(in thousands, except share and per share amounts)
| | | | | | | | | | | | | | | | |
| | | Three Months Ended September 30, | | | Nine Months Ended September 30, | |
| | | 2013 | | | 2012 | | | 2013 | | | 2012 | |
Non-Interest Revenue: | | | | | | | | | | | | | | | | |
Origination fees | | $ | 25,245 | | | $ | 8,973 | | | $ | 55,229 | | | | 19,418 | |
Servicing fees | | | 942 | | | | 479 | | | | 2,461 | | | | 1,341 | |
Management fees | | | 869 | | | | 225 | | | | 2,082 | | | | 476 | |
Other revenue | | | 349 | | | | 137 | | | | 4,718 | | | | 255 | |
| | | | | | | | | | | | | | | | |
Total Non-Interest Revenue | | | 27,405 | | | | 9,814 | | | | 64,490 | | | | 21,490 | |
| | | | | | | | | | | | | | | | |
Net Interest Income: | | | | | | | | | | | | | | | | |
Total interest income | | | 51,386 | | | | 18,490 | | | | 124,771 | | | | 44,704 | |
Total interest expense | | | (51,370 | ) | | | (18,259 | ) | | | (124,727 | ) | | | (44,222 | ) |
| | | | | | | | | | | | | | | | |
Net Interest Income | | | 16 | | | | 231 | | | | 44 | | | | 482 | |
| | | | | | | | | | | | | | | | |
(Provision)/Benefit for loan losses on Member Loans at amortized cost | | | — | | | | (7 | ) | | | — | | | | 33 | |
Fair valuation adjustments, Member Loans | | | (15,613 | ) | | | (7,248 | ) | | | (37,877 | ) | | | (15,551 | ) |
Fair valuation adjustments, Notes and Certificates | | | 15,607 | | | | 7,107 | | | | 37,848 | | | | 15,322 | |
| | | | | | | | | | | | | | | | |
Net Interest Income after provision for loan losses and fair value adjustments | | | 10 | | | | 83 | | | | 15 | | | | 286 | |
| | | | | | | | | | | | | | | | |
Total Revenue | | | 27,415 | | | | 9,897 | | | | 64,505 | | | | 21,776 | |
| | | | | | | | | | | | | | | | |
Operating Expenses: | | | | | | | | | | | | | | | | |
Sales and marketing | | | (10,460 | ) | | | (4,743 | ) | | | (26,577 | ) | | | (12,151 | ) |
Origination and servicing | | | (4,996 | ) | | | (1,929 | ) | | | (11,045 | ) | | | (5,138 | ) |
General and administrative | | | (9,331 | ) | | | (4,107 | ) | | | (22,433 | ) | | | (10,517 | ) |
| | | | | | | | | | | | | | | | |
Total Operating Expenses | | | (24,787 | ) | | | (10,779 | ) | | | (60,055 | ) | | | (27,806 | ) |
| | | | | | | | | | | | | | | | |
Income (loss) before provision for income taxes | | | 2,628 | | | | (882 | ) | | | 4,450 | | | | (6,030 | ) |
Income tax benefit | | | 85 | | | | — | | | | — | | | | — | |
| | | | | | | | | | | | | | | | |
Net Income (Loss) | | $ | 2,713 | | | $ | (882 | ) | | $ | 4,450 | | | $ | (6,030 | ) |
| | | | | | | | | | | | | | | | |
Basic net income (loss) per share attributable to common stockholders | | $ | — | | | $ | (0.09 | ) | | $ | — | | | $ | (0.62 | ) |
Diluted net income (loss) per share attributable to common stockholders | | $ | — | | | $ | (0.09 | ) | | $ | — | | | $ | (0.62 | ) |
Weighted-average shares of common stock used in computing basic net income (loss) per share | | | 13,328,103 | | | | 10,300,351 | | | | 12,614,487 | | | | 9,739,922 | |
Weighted-average shares of common stock used in computing diluted net income (loss) per share | | | 80,346,432 | | | | 10,300,351 | | | | 80,160,536 | | | | 9,739,922 | |
The accompanying notes are an integral part of these condensed consolidated financial statements.
3
LendingClub Corporation and Subsidiaries
Condensed Consolidated Statements of Cash Flows (Unaudited)
(in thousands)
| | | | | | | | |
| | | For the Nine Months Ended September 30, | |
| | | 2013 | | | 2012 | |
Cash flows from Operating Activities: | | | | | | | | |
Net income/(loss) | | $ | 4,450 | | | $ | (6,030 | ) |
Adjustments to reconcile net income (loss) to net cash used in operating activities: | | | | | | | | |
(Benefit) for loan losses | | | — | | | | (33 | ) |
Fair value adjustments, net | | | 29 | | | | 230 | |
Change in Loan Servicing Rights carried at fair value | | | 578 | | | | — | |
Stock based compensation and warrant expense | | | 3,345 | | | | 779 | |
Depreciation | | | 907 | | | | 182 | |
Other, net | | | — | | | | (42 | ) |
Changes in operating assets and liabilities | | | | | | | | |
Purchase of Member Loans sold | | | (250,433 | ) | | | — | |
Proceeds from sale of Member Loans | | | 250,433 | | | | — | |
Accrued interest receivable | | | (7,280 | ) | | | (4,123 | ) |
Prepaid expenses and other assets | | | (792 | ) | | | (568 | ) |
Deposits | | | 442 | | | | (513 | ) |
Accounts payable | | | 1,120 | | | | 16 | |
Accrued interest payable | | | 7,871 | | | | 5,060 | |
Accrued expenses and other liabilities | | | 5,532 | | | | 1,741 | |
| | | | | | | | |
Net cash provided by (used in) operating activities | | | 16,202 | | | | (3,301 | ) |
| | | | | | | | |
Cash flows from Investing Activities: | | | | | | | | |
Purchase of Member Loans | | | (1,115,774 | ) | | | (454,080 | ) |
Repayment of Member Loans | | | 341,256 | | | | 131,061 | |
Proceeds from recoveries and sale of charged-off Member Loans | | | 1,180 | | | | 216 | |
Net change in restricted cash | | | (1,264 | ) | | | (1,704 | ) |
Purchase of property and equipment, net | | | (7,736 | ) | | | (764 | ) |
| | | | | | | | |
Net cash used in investing activities | | | (782,338 | ) | | | (325,271 | ) |
| | | | | | | | |
Cash flows from Financing Activities: | | | | | | | | |
Payable to member investors | | | (1,593 | ) | | | 2,859 | |
Proceeds from issuance of Notes and Certificates | | | 1,115,694 | | | | 461,961 | |
Payments on Notes and Certificates | | | (339,048 | ) | | | (131,772 | ) |
Payments on charged-off Notes and Certificates from recoveries/sales of related charged off Member Loans | | | (1,139 | ) | | | (219 | ) |
Payments on loans payable | | | — | | | | (810 | ) |
Proceeds from exercise of warrants to acquire Series A convertible preferred stock and common stock | | | 326 | | | | 350 | |
Proceeds from issuance of Series B convertible preferred stock, net of issuance costs | | | — | | | | 27 | |
Proceeds from issuance of Series D convertible preferred stock, net of issuance costs | | | — | | | | 6,042 | |
Proceeds from issuance of Series E convertible preferred stock, net of issuance costs | | | — | | | | 17,344 | |
Proceed from issuance of common stock | | | 1,531 | | | | 487 | |
| | | | | | | | |
Net cash provided by financing activities | | | 775,771 | | | | 356,269 | |
| | | | | | | | |
Net increase in cash and cash equivalents | | | 9,635 | | | | 27,697 | |
Cash and cash equivalents, beginning of period | | | 52,551 | | | | 24,712 | |
| | | | | | | | |
Cash and cash equivalents, end of period | | $ | 62,186 | | | $ | 52,409 | |
| | | | | | | | |
Supplemental disclosure of cash flow information: | | | | | | | | |
Cash paid for interest | | $ | 116,746 | | | $ | 38,092 | |
Non-cash exercise of common stock warrants | | | 137 | | | | — | |
The accompanying notes are an integral part of these condensed consolidated financial statements.
4
LENDINGCLUB CORPORATION AND SUBSIDIARIES
Notes to Condensed Consolidated Financial Statements
(Unaudited)
1. Basis of Presentation
The condensed consolidated balance sheets as of September 30, 2013 and December 31, 2012, the condensed consolidated statements of operations for the three and nine months ended September 30, 2013 and 2012, respectively, and the condensed consolidated statements of cash flows for the nine months ended September 30, 2013 and 2012, respectively, have been prepared by LendingClub Corporation (“LendingClub”, “we”, “our”, the “Company” and “us”) in conformity with U.S. generally accepted accounting principles (“GAAP”) for interim financial information. Accordingly, they do not include all of the information and footnotes required by GAAP for complete financial statements.
The Company did not have any items of other comprehensive income/(loss) during any of the periods presented in the condensed consolidated financial statements as of and for the three and nine month periods ended September 30, 2013 and 2012, and therefore, we are not currently required to report comprehensive income/(loss).
In the opinion of management, all necessary adjustments (including only those of a normal recurring nature) have been made for a fair presentation of the financial position, results of operations, and cash flows for the interim periods presented. The results of operations for the interim periods are not necessarily indicative of the results for the full fiscal year. The unaudited interim condensed consolidated financial statements should be read in conjunction with the audited financial statements and notes thereto for the nine-month period ended December 31, 2012.
2. Summary of Significant Accounting Policies
Change in Fiscal Year
On December 19, 2012, our Board of Directors approved a change in our fiscal year-end from March 31stto December 31st. The change was effective as of December 31, 2012 and we filed a transition report with the Securities and Exchange Commission (“SEC”), which covered the nine-month period ending December 31, 2012. The accompanying interim condensed consolidated financial statements cover the period from January 1, 2013 through September 30, 2013, representing three quarters of our newly adopted fiscal year period and should be read in conjunction with our audited financial statements and notes thereto for the nine-month period ended December 31, 2012.
Consolidation Policies
Our condensed consolidated financial statements include the accounts of the Company and its wholly-owned subsidiary, LC Advisors, LLC (“LCA”), a registered investment advisor, and LC Trust I (the “Trust”), a Delaware business trust. Our policy is to consolidate the accounts of entities in which we have a controlling financial interest. We determine whether we have a controlling financial interest in an entity by evaluating whether the entity is a voting interest entity or variable interest entity (“VIE”) and if the accounting guidance requires consolidation.
Voting interest entities are entities that have sufficient equity and provide the equity investors voting rights that enable them to make significant decisions relating to the entities’ operations. For these types of entities, our determination of whether we have a controlling financial interest is based on ownership of a majority of the entities’ voting equity interest or through control of management of the entities.
VIEs are entities that, by design, either (i) lack sufficient equity to permit the entity to finance its activities without additional subordinated financial support from other parties, or (ii) have equity investors that do not have the ability to make significant decisions relating to the entity’s operations through voting rights, or do not have the obligation to absorb the expected losses, or do not have the right to receive the residual returns of the entity. We determine whether we have a controlling financial interest in a VIE by considering whether our involvement with the VIE is significant and whether we are the primary beneficiary of the VIE based on the following:
| | 1. | We have the power to direct the activities of the VIE that most significantly impact the entity’s economic performance; |
| | 2. | The aggregate indirect and direct variable interests held by the Company have the obligation to absorb losses or the right to receive benefits from the entity that could be significant to the VIE; and, |
5
| | 3. | Qualitative and quantitative factors regarding the nature, size, and form of our involvement with the VIE. |
We believe our beneficial ownership of a controlling financial interest in the Trust has qualified and continues to qualify as an equity investment in a VIE that should be consolidated for financial accounting and reporting purposes. All intercompany accounts between the Company and LCA have been eliminated. In addition, due to the financial consolidation of the Trust we have also eliminated transactions between these entities and the Trust. We perform on-going reassessments on the status of the entities and whether facts or circumstances have changed in relation to our involvement in VIEs which could cause our conclusion to change.
Use of Estimates
The preparation of our condensed consolidated financial statements and related disclosures in conformity with U.S. GAAP requires management to make judgments, assumptions and estimates that affect the amounts reported in our condensed consolidated financial statements and accompanying notes. We base our estimates on historical experience and on various other factors we believe to be reasonable under the circumstances, the results of which form the basis for making judgments about the carrying values of certain assets and liabilities. These judgments, assumptions and estimates include but are not limited to the following: (i) revenue recognition; (ii) fair value determinations for Member Loans, Notes and Certificates; (iii) stock-based compensation expense; (iv) provision for income taxes, net of valuation allowance for deferred tax assets; and (v) loan servicing asset/liability fair value determination. These judgments, estimates and assumptions are inherently subjective in nature and actual results may differ from these judgments, estimates and assumptions, and the differences could be material.
Cash and Cash Equivalents
Cash and cash equivalents include various unrestricted deposits with financial institutions in checking, money market and short-term certificate of deposit accounts. We consider all highly liquid investments with stated maturity dates of three months or less from the date of purchase to be classified as cash equivalents. Cash equivalents are recorded at cost, which approximates fair value.
Restricted Cash
Restricted cash consists primarily of the Company’s funds in certain checking, money market and certificate of deposit accounts that are: (i) pledged to or held in escrow by our correspondent banks as security for transactions processed on or related to our platform; (ii) pledged through a credit support agreement with a Certificate holder and (iii) received from Member investors but not yet applied to their accounts on the platform and transferred to segregated bank accounts that hold investors’ funds.
Member Loans
Beginning October 13, 2008, we have elected the fair value option for Member Loan investments that were financed by Notes and also for the related Notes. Since March 2011, we have also elected the fair value option for all Member Loan investments financed by Certificates and the related Certificates. Under this election, origination fees and all costs incurred in the origination process are recognized in earnings as earned or incurred. Member Loans accounted for under the fair value option are initially measured at fair value. Gains and losses from initial measurement and subsequent changes in fair value are recognized in earnings. Interest income on Member Loans is calculated based on the interest rate of the Member Loan and recorded as interest income.
The fair value election for Member Loans, Notes and Certificates allows symmetrical accounting for the timing and amounts recognized for both expected unrealized losses and charge-offs on the Member Loans and the related Notes and Certificates, consistent with the member payment dependent design of the Notes and Certificates.
Member Loans Sold to Unrelated Third Party Purchasers
From January 1, 2013 through June 30, 2013, origination fees and direct Member Loan origination/acquisition costs for loans that were subsequently sold to unrelated third party purchasers and met the accounting requirements for a sale of loans were deferred and included in the overall net investment in the loans purchased. Accordingly, the origination fees for such loans were not included in origination fee revenue and the direct loan origination costs for such loans were not included in operating expenses. A gain or loss on the sale of loans was recorded on the sale date. As part of the sale agreement, we retained the rights to service these sold loans and calculated a gain or loss on the sale of loans sold with servicing retained based on the net proceeds from the sale of loans, after allocation of proceeds from/(toward) the recording of any net servicing asset/(liability), minus the net investment in the loans being sold. Gains on loans sold were previously reported in “Gain on Sale of Member Loans” and have been reclassified to “Other revenue” in the Condensed Consolidated Statement of Operations.
6
Effective July 1, 2013, we elected the fair value option for loans that are sold to unrelated third party purchasers. Under this election, all origination fees and all direct costs incurred in the origination process are recognized in earnings as earned or incurred and are not deferred. Beginning July 1, 2013, origination fees for loans purchased and subsequently sold to unrelated third party purchasers are included in “Origination Fees” and direct loan origination costs are included in “Origination and Servicing” operating expense on the Condensed Consolidated Statement of Operations. Loans sold to unrelated third party purchasers that are accounted for under the fair value option are initially measured at fair value. Gains and losses from initial measurement at fair value are recognized in earnings.
For loans sold to unrelated third party purchasers with servicing retained, we estimate the fair value of the loan servicing asset or liability considering the contractual servicing fee revenue, adequate compensation for our servicing obligation, the current principal balances of the loans and projected servicing revenues given projected defaults and prepayments (if significant) over the remaining lives of the loans. We initially record servicing assets and liabilities at fair value. Subsequently, servicing assets and liabilities are carried at fair value and changes in fair value are reported in non-interest income in the period in which the change occurs.
Additionally, we will record a liability for significant estimated post-sale obligations or contingent obligations to the purchaser of the loans, if any, such as delinquent/fraudulent loan repurchase obligations or excess loss indemnification obligations.
Member Loans at Fair Value and Notes and Certificates at Fair Value
We use fair value measurements to record Member Loans and Notes and Certificates at fair value on a recurring basis and in our fair value disclosures. The aggregate fair values of the Member Loans and underlying Notes and Certificates are reported as separate line items in the assets and liabilities sections of our condensed consolidated balance sheets using the methods and disclosures related to fair value accounting that are described in ASC 820,Fair Value Measurements and Disclosures, which provides a framework for measuring the fair value of assets and liabilities.
Fair value is defined as the exchange price that would be received for an asset or paid to transfer a liability (an exit price) in the principal or most advantageous market for the asset or liability in an orderly transaction between market participants on the measurement date. Changes in the fair value of the Member Loans and Notes and Certificates are recognized, on a gross basis, in earnings.
We determine the fair value of the Member Loans and Notes and Certificates in accordance with the fair value hierarchy that requires an entity to maximize the use of observable inputs and minimize the use of unobservable inputs, which generally requires significant management judgment. ASC 820 establishes the following hierarchy for categorizing these inputs:
| | |
| Level 1 – | | Quoted market prices in active markets for identical assets or liabilities. |
| |
| Level 2 – | | Significant other observable inputs (e.g., quoted prices for similar items in active markets, quoted prices for identical or similar items in markets that are not active, inputs other than quoted prices that are observable such as interest rate and yield curves, and market-corroborated inputs). |
| |
| Level 3 – | | Valuation generated from model-based techniques that use inputs that are significant and unobservable in the market. These unobservable assumptions reflect estimates of inputs that market participants would use in pricing the asset or liability. Valuation techniques include use of option pricing models, discounted cash flow methodologies or similar techniques, which incorporate management’s own estimate of assumptions that market participants would use in pricing the instrument or valuations that require significant management judgment or estimation. |
Since observable market prices and inputs are not available for similar assets and liabilities, the Member Loans and Notes and Certificates are considered Level 3 financial instruments. We estimated the fair values of Member Loans and their related Notes and Certificates using a discounted cash flow valuation methodology. The estimated fair value of Member Loans is computed by projecting the future contractual cash flows to be received on the loans, adjusting those cash flows for our expectations of prepayments (if significant), defaults and losses over the life of the loans and recoveries, if any. We then discount those projected net cash flows to a present value, which is the estimated fair value. Our expectation of future defaults and losses on loans is based on analyses of actual defaults and losses that occurred on the various credit grades of Member Loans over the past several years. Expected recoveries reflect actual historical recovery experience for the various types of defaulted loans, the contractual arrangements with collection agencies and actual proceeds received on sales of defaulted loans. The discount rates for the projected net cash flows of the Member Loans are our estimates of the rates of return that investors in unsecured consumer credit obligations would require when investing in the various credit grades of Member Loans.
LendingClub’s and the Trust’s obligation to pay principal and interest on any Note or Certificate is equal to the pro-rata portion of the payments, if any, received on the related Member Loan subject to applicable fees. The gross effective interest rate associated
7
with Notes or Certificates is the same as the interest rate earned on the underlying Member Loans. At September 30, 2013, the discounted cash flow methodology used to estimate the Notes’ and Certificates’ fair values uses the same projected net cash flows as their related Member Loans. The discount rates for the projected net cash flows of the Notes and Certificates are our estimates of the rates of return, including risk premiums (if significant) that investors in unsecured consumer credit obligations would require when investing in Notes issued by LendingClub and Certificates issued by the Trust with cash flows dependent on specific credit grades of Member Loans.
For additional discussion on this topic, including the adjustments to the estimated fair values of Loans and Notes and Certificates, as discussed above, seeNote 4 – Member Loans at Fair Value and Notes and Certificates at Fair Value.
Accrued Interest Receivable
Interest income on Member Loans is calculated based on the interest rate of the loan and recorded as interest income as earned. Member Loans reaching 120 days delinquent are classified as non-accrual loans, and we stop accruing interest and reverse all accrued but unpaid interest as of such date.
Property, Equipment and Software
Property, equipment and software consists of computer equipment and software, office furniture and equipment, construction in progress, leasehold improvements and internal use software and website development costs are recorded at cost, less accumulated depreciation and amortization.
| | • | | For computer equipment and software and office furniture and equipment: Depreciation and amortization is straight-lined over the estimated useful life of each asset class, which generally ranges from two to five years. |
| | • | | For construction in progress: When the project is complete, costs associated with the project are transferred to the leasehold improvement account or software account and amortized accordingly. |
| | • | | For leasehold improvements: Costs are amortized over the terms of the lease or the estimated useful life, whichever is shorter. |
| | • | | For internal use software and website development costs: Development costs are capitalized when preliminary development efforts are successfully completed and it is probable that the project will be completed and the software will be used as intended. Internal use software and website development costs are amortized on a straight line basis over the project’s estimated useful life, generally three years. |
Capitalized internal use software development costs consist of salaries and payroll related costs for employees and fees paid to third-party consultants who are directly involved in development efforts. Costs related to preliminary project activities and post implementation activities including training and maintenance are expensed as incurred. Costs incurred for upgrades and enhancements that are considered to be probable to result in additional functionality are capitalized.
Long-lived Assets
In accordance with ASC 360,Property, Plant, and Equipment, we evaluate potential impairments of our long-lived assets whenever events or changes in circumstances indicate that the carrying amount of the assets may not be recoverable. Events or changes in circumstances that could result in impairment include, but are not limited to, underperformance relative to historical or projected future operating results, significant changes in the manner of use of the acquired assets or the strategy for the Company’s overall business and significant negative industry or economic trends. Determination of recoverability of long-lived assets is based on an estimate of undiscounted future cash flows resulting from the use of the asset and its eventual disposition. Measurement of an impairment loss for long-lived assets that management expects to hold and use is based on the fair value of the asset. When an impairment loss is recognized, the carrying amount of the asset is reduced to its estimated fair value. For the nine months ended September 30, 2013 and 2012, there was no impairment of long-lived assets.
Payable to Member Investors
Payable to member investors primarily represents payments-in-process received from member investors that, as of the last day of the period, have not been credited to their accounts on the platform and transferred to the separate bank account that holds investors’ uninvested funds in trust for them.
8
Revenue Recognition
We recognize revenue in accordance with ASC 605,Revenue Recognition.Revenues primarily result from fees earned. Fees include loan origination fees (paid by borrower members), servicing fees (paid by investor members and certain Certificate holders) and management fees (paid by certain Certificate holders).
Origination Fees
The loan origination fee charged to each borrower member is determined by the term and credit grade of that borrower’s Member Loan and, as of September 30, 2013 and September 30, 2012, ranged from 1.11% to 5.00% of the aggregate Member Loan amount. The Member Loan origination fees are included in the annual percentage rate calculation provided to the borrower member and is subtracted from the gross loan proceeds prior to disbursement of the loan funds to the borrower member. A Member Loan is considered issued when we record the transfer of funds to the borrower member’s account on our platform and we initiate an ACH transaction to transfer funds from our platform’s correspondent bank account to the borrower member’s bank account.
Because of the election to account for Member Loans at fair value, origination fees on Member Loans are recognized upon origination of the loan as a component of non-interest revenue.
Servicing Fees
We record servicing fees paid by Note and certain Certificate holders, which are based on the payments serviced on the related Member Loans, as a component of non-interest revenue when received. Servicing fees can be, and have been, modified or waived at management’s discretion.
Management Fees
LCA acts as the general partner for certain private funds (the “Funds”) in which it has made no capital contributions and does not receive any allocation of the Funds’ income, expenses, gains, losses or any carried interest. Each Fund invests in a Certificate pursuant to a set investment strategy. LCA charges limited partners in the Funds a management fee, payable monthly in arrears, based on a limited partner’s capital account balance at month end.
LCA also earns management fees on separately managed accounts (“SMA”), payable monthly in arrears, based on the month-end balances in the SMA accounts.
Management fees are a component of non-interest revenue in the condensed consolidated statements of operations and are recorded as earned. Management fees can be, and have been, modified or waived at the discretion of LCA.
Sales, Marketing and Advertising Expense
Sales, marketing and advertising costs, including borrower and investor acquisition costs, are expensed as incurred and included in “Sales and marketing” on the condensed consolidated statement of operations.
Fair Valuation Adjustments of Member Loans at Fair Value and Notes and Certificates at Fair Value
We include in earnings the estimated unrealized fair value gains or losses during the period of Member Loans, and the offsetting estimated unrealized fair value losses or gains on related Notes and Certificates. As discussed earlier inNote 2, at September 30, 2013, we estimated the fair values of Member Loans and related Notes and Certificates using a discounted cash flow valuation methodology. At each reporting period, we recognize fair valuation adjustments for the Member Loans and the related Notes and Certificates. The fair valuation adjustment for a given principal amount of a Member Loan will be approximately equal to the corresponding estimated fair valuation adjustment on the combined principal amounts of related Notes and Certificates because the same net cash flows of the Member Loan and the related Notes and/or Certificates are used in the discounted cash flow valuation methodology.
Concentrations of Credit Risk
Financial instruments that potentially subject us to significant concentrations of credit risk consist principally of cash and cash equivalents, restricted cash, Member Loans financed directly by LendingClub and the related accrued interest receivable, and deposits with service providers. We hold our cash and cash equivalents and restricted cash in accounts at regulated domestic financial institutions. We are exposed to credit risk in the event of default by these institutions to the extent the amount recorded on the balance sheet exceeds the FDIC insured amounts. As of September 30, 2013, the Company has net credit risk exposure on $0.4 million of fair value of Member Loans held that were financed directly by LendingClub. At September 30, 2012, we had net credit risk exposure on $0.5 million of fair value of Member Loans held that were financed directly by LendingClub.
9
Stock-based Compensation
All stock-based awards made to employees are recognized in the condensed consolidated financial statements based on their respective grant date fair values. Any benefits of tax deductions in excess of recognized compensation cost are reported as a financing cash inflow and cash outflow from operating activities. The stock-based compensation related to awards that are expected to vest is amortized using the straight-line method over the vesting term of the stock-based award, which is generally four years.
The fair value of share-option awards is estimated on the date of grant using the Black-Scholes option pricing model. The Black-Scholes option pricing model considers, among other factors, the expected term of the option award, expected volatility of our stock price and expected future dividends, if any.
Forfeitures of awards are estimated at the time of grant and revised, as necessary, in subsequent periods if actual forfeitures differ from initial estimates or if future forfeitures are expected to differ from recent actual or previously expected forfeitures. Stock-based compensation expense is recorded net of estimated forfeitures, such that expense is recorded only for those stock-based awards that are expected to vest.
Stock-based awards issued to non-employees are accounted for in accordance with provisions of ASC 718-505-50,Equity-Based Payments to Non-Employees, which requires that equity awards be recorded at their fair value. We use the Black-Scholes option pricing model to estimate the value of options granted to non-employees at each vesting date to determine the appropriate charge to stock-based compensation. The assumed volatility of the price of our common stock was based on comparative public-company stock price volatility.
Reclassifications
During the third quarter of 2013, we changed the definitions used to classify operating expenses. Operating expenses were formerly classified as Sales, marketing and customer service, Engineering, and General and administrative. Our new categories of operating expenses are Sales and marketing, Origination and servicing, and General and administrative. As a result of the new classification, loan origination and servicing costs which were previously included in Sales, marketing and customer service are now included as a separate financial statement line and engineering costs which represent technology related expenses are categorized within General and administrative expenses. The changes had no impact to the total operating expenses or net income. Prior period amounts have been reclassified to conform to the current presentation.
Impact of New Accounting Standards
We do not expect recently issued accounting pronouncements to have any impact on our results of operations, financial position, or cash flow for the three and nine months ended September 30, 2013.
3. Net Income/(Loss) Attributable to Common Stockholders
We present basic earnings (loss) per share (“EPS”) in accordance with ASC 260. Under ASC 260, basic EPS is the amount of earnings available to each share of common stock outstanding during the reporting period. Diluted EPS is the amount of earnings available to each share of common stock outstanding during the reporting period adjusted to include the effect of potentially dilutive common shares. Potentially dilutive common shares include incremental shares issued for stock options, convertible preferred stock and warrants. Potentially dilutive common shares are excluded from the computation of dilutive EPS in periods in which the effect would be antidilutive.
We calculate EPS using the two-class method. The two-class method allocates earnings that otherwise would have been available to common shareholders to holders of participating securities. We consider all series of our convertible preferred stock to be participating securities due to their non-cumulative dividend rights. As such, earnings allocated to these participating securities, which include participation rights in undistributed earnings (seeNote 7 – Preferred Stock), are subtracted from net income to determine total undistributed earnings to be allocated to common stockholders. All participating securities are excluded from basic weighted-average common shares outstanding.
10
The following is a reconciliation of basic EPS to diluted EPS for the three and nine months ended September 30, 2013 and 2012 respectively:
| | | | | | | | | | | | | | | | |
| | | Three Months Ended September 30, | | | Nine Months Ended September 30, | |
| ($ in thousands, except EPS) | | 2013 | | | 2012 | | | 2013 | | | 2012 | |
Net income/(loss) | | $ | 2,713 | | | $ | (882 | ) | | $ | 4,450 | | | $ | (6,030 | ) |
Less: Earnings allocated to participating securities (1) | | $ | 2,713 | | | $ | — | | | $ | 4,450 | | | $ | — | |
Net income/(loss) available to common shareholders after required adjustments for the calculation of basic and diluted earnings per common share | | $ | — | | | $ | (882 | ) | | $ | — | | | $ | (6,030 | ) |
| | | | | | | | | | | | | | | | |
Basic weighted average common shares outstanding | | | 13,328,103 | | | | 10,300,351 | | | | 12,614,487 | | | | 9,739,922 | |
Weighted average effect of dilutive securities: | | | | | | | | | | | | | | | | |
Preferred Stock | | | 60,026,463 | | | | — | | | | 59,941,389 | | | | — | |
Stock Options | | | 6,482,703 | | | | — | | | | 6,792,704 | | | | — | |
Warrants | | | 509,163 | | | | — | | | | 811,956 | | | | — | |
| | | | | | | | | | | | | | | | |
Diluted weighted average common shares outstanding | | | 80,346,432 | | | | 10,300,351 | | | | 80,160,536 | | | | 9,739,922 | |
Earnings per common share | | | | | | | | | | | | | | | | |
Basic | | $ | — | | | $ | (0.09 | ) | | $ | — | | | $ | (0.62 | ) |
Diluted | | $ | — | | | $ | (0.09 | ) | | $ | — | | | $ | (0.62 | ) |
| (1) | In a period with net income, both earnings and dividends (if any) are allocated to participating securities. In a period with a net loss, only dividends (if any) are allocated to participating securities. |
The following table summarizes the equity shares excluded from the dilutive EPS calculation as they were deemed to be antidilutive for the three and nine months ended September 30, 2013 and 2012 respectively:
| | | | | | | | | | | | | | | | |
| | | Three Months Ended September 30, | | | Nine Months Ended September 30, | |
| | | 2013 | | | 2012 | | | 2013 | | | 2012 | |
Excluded Securities: | | | | | | | | | | | | | | | | |
Stock Options | | | 1,148,679 | | | | 8,566,158 | | | | 600,451 | | | | 8,353,549 | |
Convertible Preferred Stock | | | — | | | | 58,905,918 | | | | — | | | | 58,905,918 | |
Warrants | | | — | | | | 1,519,717 | | | | — | | | | 1,519,717 | |
| | | | | | | | | | | | | | | | |
Total | | | 1,148,679 | | | | 68,991,793 | | | | 600,451 | | | | 68,779,184 | |
| | | | | | | | | | | | | | | | |
4. Member Loans at Fair Value and Notes and Certificates at Fair Value
At September 30, 2013 and December 31, 2012, Member Loans and Notes and Certificates measured at fair value on a recurring basis (in thousands) were:
| | | | | | | | | | | | | | | | |
| | | Member Loans at fair value | | | Notes and Certificates at fair value | |
| | | September 30, 2013 | | | December 31, 2012 | | | September 30, 2013 | | | December 31, 2012 | |
Aggregate principal balance outstanding | | $ | 1,534,340 | | | $ | 791,774 | | | $ | 1,540,631 | | | $ | 795,842 | |
Fair valuation adjustments | | | (17,664 | ) | | | (10,559 | ) | | | (17,656 | ) | | | (10,526 | ) |
| | | | | | | | | | | | | | | | |
Fair Value | | $ | 1,516,676 | | | $ | 781,215 | | | $ | 1,522,975 | | | $ | 785,316 | |
| | | | | | | | | | | | | | | | |
11
We determined the fair values of Member Loans and Notes and Certificates using inputs and methods that are categorized in the fair value hierarchy of ASC 820, as follows (in thousands):
| | | | | | | | | | | | | | | | |
| | | Level 1 Inputs | | | Level 2 Inputs | | | Level 3 Inputs | | | Fair Value | |
September 30, 2013 | | | | | | | | | | | | | | | | |
Assets | | | | | | | | | | | | | | | | |
Member Loans at fair value | | $ | — | | | $ | — | | | $ | 1,516,676 | | | $ | 1,516,676 | |
Liabilities | | | | | | | | | | | | | | | | |
Notes and Certificates at fair value | | $ | — | | | $ | — | | | $ | 1,522,975 | | | $ | 1,522,975 | |
December 31, 2012 | | | | | | | | | | | | | | | | |
Assets | | | | | | | | | | | | | | | | |
Member Loans at fair value | | $ | — | | | $ | — | | | $ | 781,215 | | | $ | 781,215 | |
Liabilities | | | | | | | | | | | | | | | | |
Notes and Certificates at fair value | | $ | — | | | $ | — | | | $ | 785,316 | | | $ | 785,316 | |
Instruments are categorized in the Level 3 valuation hierarchy based on the significance of unobservable factors in the overall fair value measurement. Our fair value approach for Level 3 instruments primarily uses unobservable inputs, but may also include observable, actively quoted components derived from external sources. As a result, the realized and unrealized gains and losses for assets and liabilities within the Level 3 category presented in the tables below may include changes in fair value that were attributable to both observable and unobservable inputs.
The following table presents additional information about Level 3 assets and liabilities measured at fair value on a recurring basis for the nine months ended September 30, 2013 (in thousands):
| | | | | | | | |
| | | Member Loans | | | Notes and Certificates | |
Fair value at December 31, 2012 | | $ | 781,215 | | | $ | 785,316 | |
Issuances | | | 1,366,207 | | | | 1,115,694 | |
Principal repayments | | | (341,256 | ) | | | (339,048 | ) |
Loans sold to third parties | | | (250,433 | ) | | | — | |
Recoveries from sale and collection of charged-off loans | | | (1,180 | ) | | | (1,139 | ) |
| | | | | | | | |
Carrying value before fair value adjustments | | | 1,554,553 | | | | 1,560,823 | |
Fair valuation adjustments, included in earnings | | | (37,877 | ) | | | (37,848 | ) |
| | | | | | | | |
Fair value at September 30, 2013 | | $ | 1,516,676 | | | $ | 1,522,975 | |
| | | | | | | | |
At September 30, 2013, Member Loans underlying Notes and Certificates have original terms of 36 months or 60 months and are paid monthly with fixed interest rates ranging from 6.03% to 26.06% and various maturity dates through September 2018.
As discussed previously inNote 2 – Summary of Significant Accounting Policies, fair values for Member Loans and the related Notes and Certificates are determined using a discounted cash flow model utilizing estimates for credit losses, prepayments, changes in the interest rate environment, and other factors. For Notes and Certificates, we also consider risk factors such as the Company’s continued profitability, ability to operate on a cash-flow positive basis and liquidity position. The majority of fair valuation adjustments included in earnings is attributable to changes in estimated instrument-specific future credit losses. All fair valuation adjustments were related to Level 3 instruments for the nine months ended September 30, 2013. A specific loan that is projected to have higher future default losses than previously estimated has lower expected future cash flows over its remaining life, which reduces its estimated fair value. Conversely, a specific loan that is projected to have lower future default losses than previously estimated has increased expected future cash flows over its remaining life, which increases its fair value. Because the payments to holders of Notes and Certificates directly reflect the payments received on Member Loans, a reduction or increase of the expected future payments on Member Loans will decrease or increase the estimated fair values of the related Notes and Certificates. Expected losses and actual loan charge-offs on Member Loans are offset to the extent that the loans are financed by Notes and Certificates that absorb the related loan losses.
Fair value adjustment gains/(losses) for Member Loans were $(15.6 million) and $(7.2 million) for the three months ended September 30, 2013 and 2012, respectively, and $(37.9 million) and $(15.6 million) for the nine months ended September 30, 2013 and 2012, respectively. The fair value adjustments for Member Loans were largely offset by the fair value adjustments of the Notes and Certificates due to the member payment dependent design of the Notes and Certificates and because the principal balances of the Member Loans were very close to the combined principal balances of the Notes and Certificates. Accordingly, the net fair value adjustment gains/(losses) for Member Loans, Notes and Certificates were $(0.006 million) and $(0.141 million) for the three months ended September 30, 2013 and 2012, respectively, and $(0.029 million) and $(0.229 million) for the nine months ended September 30, 2013 and 2012, respectively.
12
At September 30, 2013, we had 1,097 Member Loans that were 90 days or more past due including non-accrual loans and loans where the borrower has filed for bankruptcy or is deceased, which had a total outstanding principal balance of $12.3 million, aggregate adverse fair value adjustments totaling $10.9 million and an aggregate fair value of $1.4 million. At December 31, 2012, we had 576 Member Loans that were 90 days or more past due including non-accrual loans and loans where the borrower has filed for bankruptcy or is deceased, which had a total outstanding principal balance of $6.4 million, aggregate adverse fair value adjustments totaling $5.7 million and an aggregate fair value of $0.7 million.
Significant Unobservable Inputs
The following table presents quantitative information about the significant unobservable inputs used for certain of our Level 3 fair value measurements at September 30, 2013 (in thousands):
| | | | | | | | | | | | | | | | |
| | | | | | | | | | Range of Inputs | |
| | | Fair Value | | | Valuation Techniques | | Unobservable Input | | Minimum | | | Maximum | |
Member Loans | | $ | 1,516,676 | | | Discounted cash flow | | Discount rate | | | 5.5 | % | | | 13.2 | % |
| | | | | | | | Net cumulative expected loss | | | 2.1 | % | | | 29.3 | % |
Notes & Certificates | | $ | 1,522,975 | | | Discounted cash flow | | Discount rate | | | 5.5 | % | | | 13.2 | % |
| | | | | | | | Net cumulative expected loss | | | 2.1 | % | | | 29.3 | % |
The valuation technique used for our Level 3 assets and liabilities, as presented in the previous table, is described as follows:
Discounted cash flow – Discounted cash flow valuation techniques generally consist of developing an estimate of future cash flows that are expected to occur over the life of a financial instrument and then discounting those cash flows at a rate of return that results in the fair value amount.
Significant unobservable inputs presented in the previous table are those we consider significant to the estimated fair values of the Level 3 assets and liabilities. We consider unobservable inputs to be significant, if by their exclusion, the estimated fair value of the Level 3 asset or liability would be impacted by a significant percentage change, or based on qualitative factors such as the nature of the instrument and significance of the unobservable inputs relative to other inputs used within the valuation. Following is a description of the significant unobservable inputs provided in the table.
Discount rate – Discount rate is a rate of return used to discount future expected cash flows to arrive at a present value, the fair value, of a financial instrument. The discount rates for the projected net cash flows of Member Loans are our estimates of the rates of return that investors in unsecured consumer credit obligations would require when investing in the various credit grades of Member Loans. The discount rates for the projected net cash flows of the Notes and Certificates are our estimates of the rates of return that investors in unsecured consumer credit obligations would require when investing in Notes issued by LendingClub and Certificates issued by the Trust with cash flows dependent on specific grades of Member Loans. Discount rates for existing Member Loans, Notes and Certificates are adjusted to reflect the time value of money. A risk premium component is implicitly included in the discount rates to reflect the amount of compensation market participants require due to the uncertainty inherent in the instruments’ cash flows resulting from risks such as credit and liquidity.
Net cumulative expected loss – Net cumulative expected loss is an estimate of the net cumulative principal payments that will not be repaid over the entire life of a new Member Loan, Note or Certificate, expressed as a percentage of the original principal amount of the Member Loan, Note or Certificate. The estimated net cumulative loss is the sum of the net losses estimated to occur each month of the life of a new Member Loan, Note or Certificate. Therefore, the total net losses estimated to occur over the remaining maturity of existing Member Loans, Notes and Certificates are less than the estimated net cumulative losses of comparable new Member Loans, Notes and Certificates. A given month’s estimated net losses are a function of two variables:
| | (i) | estimated default rate, which is an estimate of the probability of not collecting the remaining contractual principal amounts owed and, |
| | (ii) | estimated net loss severity, which is the percentage of contractual principal cash flows lost in the event of a default, net of the average net recovery, expected to be received on a defaulted Loan, Note or Certificate. |
Significant Recurring Level 3 Fair Value Asset and Liability Input Sensitivity
The discounted cash flow technique that we use to determine the fair value of our Level 3 Member Loans, Notes and Certificates at fair value requires determination of relevant inputs and assumptions, some of which represent significant unobservable inputs as indicated in the preceding table. Accordingly, changes in these unobservable inputs may have a significant impact on fair
13
value. Certain of these unobservable inputs will (in isolation) have a directionally consistent impact on the fair value of the instrument for a given change in that input. Alternatively, the fair value of the instrument may move in an opposite direction for a given change in another input. For example, increases in the discount rate and estimated net cumulative loss rates will reduce the estimated fair value of Member Loans, Notes and Certificates. When multiple inputs are used within the valuation technique of a Loan, Note or Certificate at fair value, a change in one input in a certain direction may be offset by an opposite change in another input.
5. Deposits
We had deposits of $0.3 and $0.7 million as of September 30, 2013 and December 31, 2012, respectively. The majority of this balance at September 30, 2013, was comprised of deposits related to operating leases (seeNote 12 – Commitments and Contingencies). The decrease in the deposit balance from December 2012 is due to the return of a significant portion of a deposit placed with a payment service provider that processed investor payment transactions. As of June 30, 2013, we are no longer utilizing the services of this provider and expect to have our full deposit returned to us pursuant to the terms of our agreement. As of September 30, 2013, the remaining deposit balance related to this vendor was $0.014 million.
6. Related Party Transactions
Several of our executive officers and directors (including immediate family members) have opened investor member accounts with LendingClub, made deposits and withdrawals to their accounts and funded portions of Member Loans via purchases of Notes and Certificates. All Note and Certificate purchases made by related parties were conducted on terms and conditions that were not more favorable than those obtained by other investors.
The following table summarizes deposits and withdrawals made by related parties for the nine months ended September 30, 2013 and ending account balances as of September 30, 2013 and December 31, 2012 (in thousands).
| | | | | | | | | | | | | | | | |
| | | For the nine months ended
September 30, 2013 | | | As of September 30,
2013 | | | As of December 31,
2012 | |
Related Party | | Deposits | | | Withdrawals | | | Account Balance | | | Account Balance | |
Executive Officers | | $ | — | | | $ | 20 | | | $ | 38 | | | $ | 39 | |
Directors | | | 1,868 | | | | 297 | | | | 5,042 | | | | 3,105 | |
| | | | | | | | | | | | | | | | |
| | $ | 1,868 | | | $ | 317 | | | $ | 5,080 | | | $ | 3,144 | |
| | | | | | | | | | | | | | | | |
14
7. Preferred Stock
Convertible Preferred Stock (in thousands, except share amounts)
Preferred stock is issuable in series, and the Board of Directors is authorized to determine the rights, preferences and terms of each series. The following table provides details regarding each Series of preferred stock authorized by the Board of Directors.
| | | | | | | | |
| | | September 30,
2013 | | | December 31,
2012 | |
Preferred stock, $0.01 par value; 61,617,516 total shares authorized at September 30, 2013 and December 31, 2012: | | | | | | | | |
Series A convertible preferred stock, 17,006,275 shares designated at September 30, 2013 and December 31, 2012; 16,501,612 and 16,317,747 shares issued and outstanding at September 30, 2013 and December 31, 2012; aggregate liquidation preference of $17,574 and $17,371 at September 30, 2013 and December 31, 2012. | | $ | 17,376 | | | $ | 17,181 | |
Series B convertible preferred stock, 16,410,526 shares designated at September 30, 2013 and December 31, 2012; 16,394,325 and 16,394,324 shares issued and outstanding at September 30, 2013 and December 31, 2012 ; aggregate liquidation preference of $12,280 and $12,167 at September 30, 2013 and December 31, 2012. | | | 12,165 | | | | 12,164 | |
Series C convertible preferred stock, 15,621,609 shares designated at September 30, 2013 and December 31, 2012; 15,621,609 shares issued and outstanding at September 30, 2013 and December 31, 2012, aggregate liquidation preference of $24,490 at September 30, 2013 and December 31, 2012. | | | 24,388 | | | | 24,388 | |
Series D convertible preferred stock, 9,007,678 shares designated at September 30, 2013 and December 31, 2012; 9,007,678 shares issued and outstanding at September 30, 2013 and December 31, 2012; aggregate liquidation preference of $32,044 at September 30, 2013 and December 31, 2012. | | | 31,943 | | | | 31,943 | |
Series E convertible preferred stock, 3,571,428 shares designated at September 30, 2013 and December 31, 2012; 2,500,000 shares issued and outstanding at September 30, 2013 and December 31, 2012; aggregate liquidation preference of $17,500 at September 30, 2013 and December 31, 2012. | | | 17,347 | | | | 17,347 | |
| | | | | | | | |
| | $ | 103,219 | | | $ | 103,023 | |
| | | | | | | | |
The outstanding shares of convertible preferred stock are not mandatorily redeemable. The sale of all, or substantially all, of the Company’s assets, a consolidation or merger with another company, or a transfer of voting control in excess of fifty percent (50%) of the Company’s voting power are all events which are deemed to be a liquidation and would trigger the payment of liquidation preferences under the preferred stock agreements. All such events require approval of the Board. Therefore, based on the guidance of SEC Accounting Series Release No. 268, “Presentation in Financial Statements of Redeemable Preferred Stocks,” the contingently redeemable convertible preferred stock has been classified outside of the stockholders’ equity section as certain of these factors are outside the control of the Company. The significant terms of outstanding Series A, Series B, Series C, Series D and Series E convertible preferred stock are as follows:
Conversion – Each share of convertible preferred stock is convertible, at the option of the holder, initially, into one share of common stock (subject to adjustments for events of dilution). Each share of convertible preferred stock will automatically be converted upon the earlier of: (i) the closing of an underwritten public offering of our common stock with aggregate gross proceeds that are at least $30.0 million; or (ii) the consent of the holders of a 55% majority of outstanding shares of convertible preferred stock, voting together as a single class, on an as-converted to common stock basis. The Company’s preferred stock agreements contain certain anti-dilution provisions, whereby if the Company issues additional shares of capital stock for an effective price lower than the conversion price for a series of preferred stock immediately prior to such issue, then the existing conversion price of such series of preferred stock will be reduced. The Company determined that while its convertible preferred stock contains certain anti-dilution features, the conversion feature embedded within its convertible preferred stock does not require bifurcation under the guidance of ASC 815,Derivatives and Hedging Activities.
Liquidation preference – Upon any liquidation, winding up or dissolution of us, whether voluntary or involuntary (a “Liquidation Event”), before any distribution or payment shall be made to the holders of any common stock, the holders of convertible preferred stock shall, on a pari passu basis, be entitled to receive by reason of their ownership of such stock, an amount per share of Series A convertible preferred stock equal to $1.065 (as adjusted for stock splits, recapitalizations and the like) plus all declared and unpaid dividends (the “Series A Preferred Liquidation Preference”), an amount per share of Series B convertible preferred stock equal to $0.7483 (as adjusted for stock splits, recapitalizations and the like) plus all declared and unpaid dividends (the “Series B Preferred Liquidation Preference”), an amount per share of Series C convertible preferred stock equal to $1.5677 (as adjusted for stock splits, recapitalizations and the like), an amount per share of Series D convertible preferred stock equal to $3.557 and an amount per share of Series E convertible preferred stock equal to $7.00 (as adjusted for stock splits, recapitalizations and the like). However, if upon any such Liquidation Event, our assets shall be insufficient to make payment in full to all holders of convertible preferred stock of their respective liquidation preferences, then the entire assets of ours legally available for distribution shall be distributed with equal priority between the preferred holders based upon the amounts such series was to receive. Any excess assets, after payment in full of the liquidation preferences to the convertible preferred stockholders, are then allocated to the holders of common and preferred stockholders, pro-rata, on an as-if-converted to common stock basis.
15
Dividends – If and when declared by the Board, the holders of Series A, Series B, Series C, Series D and Series E convertible preferred stock, on a pari passu basis, will be entitled to receive non-cumulative dividends at a rate of 6% per annum in preference to any dividends on common stock (subject to adjustment for certain events). The holders of Series A, Series B, Series C, Series D and Series E convertible preferred stock are also entitled to receive with common stockholders, on an as-if-converted basis, any additional dividends issued by us. As of September 30, 2013, we have not declared any dividends.
Voting rights – Generally, preferred stockholders have one vote for each share of common stock that would be issuable upon conversion of preferred stock. Voting as a separate class, and on an as-if-converted to common stock basis, the Series A convertible preferred stockholders are entitled to elect two members of the Board, the holders of Series B convertible preferred stockholders are entitled to elect one member of the Board. The Series C and Series D convertible preferred stockholders are not entitled to elect a member of the Board. The Series E convertible preferred stockholders are entitled to nominate members to the Board, this nominee is subject to the vote of all convertible preferred stockholders. The holders of common stock, voting as a separate class, are entitled to elect one member of the Board. The remaining directors are elected by the preferred stockholders and common stockholders voting together as a single class on an as-if-converted to common stock basis.
8. Common Stock and Stockholders’ Deficit
Common Stock
At September 30, 2013, we have shares of common stock authorized and reserved for future issuance as follows:
| | | | |
Options to purchase common stock | | | 9,488,881 | |
Options available for future issuance | | | 1,411,490 | |
Convertible preferred Series A stock warrants | | | 411,288 | |
Common stock warrants | | | 138,299 | |
| | | | |
Total common stock authorized and reserved for future issuance | | | 11,449,958 | |
| | | | |
During the nine months ended September 30, 2013, we issued 2,100,402 shares of common stock in exchange for proceeds of $1.5 million upon the exercise of stock options.
Convertible preferred Series A stock warrants are fully exercisable with an exercise price of $1.065 per share. The warrants may be exercised at any time on or before January 2018.
Common stock warrants are fully exercisable with exercise prices between $0.01 and $1.5677 per share. The warrants may be exercised at any time on or before February 2021.
Accumulated Deficit
We have incurred operating losses since our inception through December 31, 2012. For the three and nine months ended September 30, 2013, we had net income of approximately $2.7 million and $4.5 million, respectively. For the three and nine months ended September 30, 2012, we had net losses of $0.9 million and $6.0 million, respectively. We have an accumulated deficit of $53.2 million and a stockholders’ deficit of $41.4 million, at September 30, 2013.
9. Stock-Based Compensation
Under our 2007 Stock Incentive Plan, or the Option Plan, we may grant options to purchase shares of common stock to employees, executives, directors and consultants at exercise prices not less than the fair market value at date of grant for incentive stock options and not less than 85% of the fair market value at the date of grant for non-statutory options. During the second quarter, the Board of Directors increased the total number of options under the Option Plan by 1.8 million for a total of 15,859,948 options. The options granted through September 30, 2013 are stock options that generally expire ten years from the date of grant and generally vest 25% twelve months from the date of grant, and ratably over the next 12 quarters thereafter, provided the grantee remains continuously employed by the Company through each vesting date (“service-based options”); however, the Board of Directors retains the authority to grant options with different terms.
16
We did not grant any service-based options in the three months ended September 30, 2013. For the nine months ended September 30, 2013, we granted service-based stock options to purchase 1,566,750 shares of common stock with a weighted average exercise price of $5.81 per share, a weighted average grant date fair value of $8.95 per share and a total estimated fair value of approximately $21.9 million.
We used the Black-Scholes option pricing model to estimate the fair value of stock options granted with the following assumptions:
| | | | |
| | | Nine Months Ended
September 30, 2013 | |
Assumed forfeiture rate (annual %) | | | 5.0 | % |
Expected dividend yield | | | 0.0 | % |
Assumed stock price volatility | | | 63.5 | % |
Weighted average risk-free rate | | | 1.10 | % |
Expected life (years) | | | 6.25 | |
Options activity under the Option Plan for the nine month period ended September 30, 2013 is summarized as follows:
| | | | | | | | |
| | | Stock Options Issued
and
Outstanding | | | Weighted
Average
Exercise Price | |
Balances, at December 31, 2012 | | | 10,255,222 | | | $ | 1.19 | |
Options Granted | | | 1,566,750 | | | | 5.81 | |
Options Exercised | | | (2,100,402 | ) | | | 0.73 | |
Options Forfeited/Expired | | | (232,689 | ) | | | 2.03 | |
| | | | | | | | |
Balances, September 30, 2013 | | | 9,488,881 | | | $ | 2.03 | |
| | | | | | | | |
A summary of outstanding options, options vested and options vested and expected to vest as of September 30, 2013, is as follows:
| | | | | | | | | | | | |
| | | Stock Options Issued
and
Outstanding | | | Weighted Average
Remaining
Contractual Life
(Years) | | | Weighted
Average
Exercise Price | |
Options Outstanding | | | 9,488,881 | | | | 8.25 | | | $ | 2.03 | |
Options Vested | | | 3,125,677 | | | | 7.21 | | | $ | 0.76 | |
Options Vested and Expected to Vest | | | 9,089,708 | | | | 8.22 | | | $ | 1.98 | |
A summary by weighted average exercise price of outstanding options, options vested, and options vested and expected to vest at September 30, 2013, is as follows:
| | | | | | | | | | | | | | | | |
Exercise Price Range | | Stock Options
Outstanding | | | Weighted Average
Remaining Contractual
Life of Outstanding Stock
Options (Years) | | | Number of
Stock Options
Vested | | | Number of Stock
Options Vested and
Expected to Vest | |
$0.01 - $1.00 | | | 5,152,706 | | | | 7.40 | | | | 2,724,812 | | | | 5,049,203 | |
$1.01 - $5.00 | | | 3,187,925 | | | | 9.13 | | | | 388,654 | | | | 2,989,216 | |
$5.01 - $10.00 | | | 1,148,250 | | | | 9.62 | | | | 12,211 | | | | 1,051,289 | |
| | | | | | | | | | | | | | | | |
$0.01 - $10.00 | | | 9,488,881 | | | | 8.25 | | | | 3,125,677 | | | | 9,089,708 | |
| | | | | | | | | | | | | | | | |
17
We recognized $1.9 million and $0.3 million of stock-based compensation expense related to stock options for the three months ended September 30, 2013 and 2012, respectively. We recognized $3.3 million and $0.8 million of stock-based compensation expense related to stock options for the nine months ended September 30, 2013 and 2012, respectively. As of September 30, 2013, total unrecognized compensation cost was $15.9 million and these costs are expected to be recognized over the next 3.2 years.
No net income tax benefit has been recognized relating to stock-based compensation expense and no tax benefits have been realized from exercised stock options.
10. Income Taxes
We account for income taxes using the asset and liability method as codified in ASC 740. Under this method, deferred tax assets and liabilities are recognized for the future tax consequences attributable to differences between the financial statement carrying amounts of existing assets and liabilities and their respective tax bases and operating loss and tax credit carryforwards. A valuation allowance is recorded to reduce deferred tax assets to the amount that is more likely than not to be realized. A full valuation allowance has been recorded against net deferred tax assets of $24.5 and $23.9 million at September 30, 2013 and December 31, 2012, respectively.
We recorded no net provision for income taxes for the nine month period ended September 30, 2013 because the minimum corporate income tax liabilities due on our taxable income will be offset by usage of prior years’ net operating loss and tax credit carryforwards. We recorded no net provision or benefit for income taxes in the three and nine month periods ended September 30, 2012 when we incurred taxable losses due to the full valuation allowance for deferred tax assets recorded in those periods then ended. Payments of minimum amounts due to state taxing authorities that are not related to the level of our taxable income or loss are recorded as operating expenses instead of income tax expense.
Our policy is to recognize interest and penalties accrued on any unrecognized tax benefits as a component of income tax expense. We did not have any material changes in unrecognized tax benefits and there were no interest expense or penalties on any unrecognized tax benefits during the three months ended September 30, 2013 and 2012 respectively.
In general, a corporation’s ability to utilize its net operating loss (“NOL”) and research and development (“R&D”) credit carryforwards may be substantially limited due to ownership changes that may have occurred or that could occur in the future, as required by Section 382 of the Internal Revenue Code of 1986, as amended (the “Code”), as well as similar state provisions. These ownership changes may limit the amount of NOL and R&D credit carryforwards that can be utilized annually to offset future taxable income and tax, respectively. In general, an “ownership change,” as defined by Section 382 of the Code, results from a transaction or series of transactions over a three-year period resulting in an ownership change of more than 50 percent of the capital (as defined) of a company by certain stockholders or public groups.
The amount of such limitations on our total federal net operating losses of approximately $53.0 million incurred since the Company’s inception in October 2006 through the fiscal year-ended December 31, 2012 has been analyzed, and we believe limitations exist only on the future annual deductibility of approximately $2.5 million of the Company’s total net operating loss carryforwards. Additionally, the Company had certain capital transactions during the nine months ended September 30, 2013, that trigger a testing date and we have completed a preliminary study to assess whether one or more ownership changes have occurred since December 31, 2012. We believe there has not been an ownership change of more than 50 percent as a result of the capital transactions in the nine months ended September 30, 2013. Therefore, utilization of certain NOL or tax credit carryforwards are believed not to be subject to additional annual limitations beyond the limitation discussed above.
The annual limitations on a company’s NOL or tax credit carryforwards is determined by first multiplying the value of the company’s capital at the time of the ownership change by the applicable long-term, tax-exempt rate, and then could be subject to additional adjustments, as required. In the most adverse case, such limitation may result in the expiration of a portion of the NOL or tax credit carryforwards before utilization. Any carryforwards that expire prior to utilization as a result of such limitations will be removed from deferred tax assets with a corresponding reduction of the valuation allowance. Due to the full valuation allowance on our deferred tax assets, it is not expected that any possible limitation on the future deductibility of NOL or tax credit carryforwards will have an impact on the results of our operations. As of September 30, 2013, we continued to have a full valuation allowance against our net deferred tax assets. Although there was pre-tax income for the three and nine months ended September 30, 2013, and we have expectations for business growth, uncertainty regarding profitability in the coming years, and the impact of that uncertainty on the future realization of the net operating loss carryforwards remain, therefore, we believe it is more likely than not that all of our deferred tax assets will not be realized.
18
11. Fair Value of Financial Instruments Not Measured at Fair Value on a Recurring Basis in the Balance Sheet
Following are descriptions of the valuation methodologies used for estimating the fair values of financial instruments not recorded at fair value on a recurring basis in the balance sheet; these financial instruments are carried at historical cost or amortized cost on the balance sheet.
| | • | | Short-term financial assets: Short-term financial assets include cash and cash equivalents, restricted cash, accrued interest, other receivables and deposits with service providers. These assets are carried at historical cost. The carrying amount approximates fair value due to the short term nature of the instruments. |
| | • | | Short-term financial liabilities: Short-term financial liabilities include accrued interest payable and other accrued expenses, and payables to member investors. These liabilities are carried at historical cost. The carrying amount approximates fair value due to the short term nature of the instruments. |
12. Commitments and Contingencies
Commitments
Operating Leases
Corporate Headquarters
We have several lease agreements for space at 71 Stevenson Street in San Francisco, California, where our corporate headquarters is located. These leases commenced in April 2011, July 2012, and May 2013. The July 2012 lease for the second floor expires in June 2015 with a renewal option that would extend the lease for two years to June 2017 and the leases for the third floor and the eleventh and twelfth floors, respectively, expire in June 2017.
Other Real Estate
In December 2012, we renewed a lease for a New York City office for a one year term that expires on January 31, 2014.
Total facilities rental expense for the three months ended September 30, 2013 and 2012 was $0.5 million and $0.1 million, respectively. Facilities rental expense for the nine months ended September 30, 2013 and 2012 was $1.3 million and $0.4 million, respectively. As part of these lease agreements, we have pledged $0.2 million of cash and arranged for a $0.2 million letter of credit as security deposits.
Loan Funding Related to Direct Marketing Programs
In regards to loans listed on the platform as a result of direct marketing efforts, we have committed to invest in such loans in order for these loans to have investment commitments equal to the lesser of the amount approved and $10,000 at the time of issuance. Based upon our platform’s performance to date we have not had to commit any material amounts to finance these loans and as such we have not recorded a contingent obligation on our balance sheet as of September 30, 2013 or December 31, 2012.
Contingencies
Credit Support Agreement
The Company is subject to a Credit Support Agreement with a Certificate investor. The Credit Support Agreement requires the Company to pledge and restrict cash in support of its contingent obligation to reimburse the investor for credit losses on Member Loans underlying the investor’s Certificate, that are in excess of a specified, aggregate loss threshold. The Company is contingently obligated to pledge cash, not to exceed $5.0 million, to support this contingent obligation and which cash balance is premised upon the investor’s Certificate purchase volume. As of September 30, 2013, approximately $3.4 million was pledged and restricted to support this contingent obligation.
As of September 30, 2013, the credit losses pertaining to the investor’s Certificate have not exceeded the specified threshold, nor are future credit losses expected to exceed the specified threshold, and thus no expense or liability has been recorded. The Company currently does not anticipate recording losses resulting from its contingent obligation under this Credit Support Agreement. If losses related to the Credit Support Agreement are later determined to be likely to occur and are estimable, results of operations could be affected in the period in which such losses are recorded.
19
Legal
The Company may be subject to pending legal proceedings and regulatory actions in the ordinary course of business. After consultation with legal counsel, we do not anticipate that the ultimate liability, if any, arising out of any such matter will have a material effect on our financial condition, results of operations or cash flows.
13. Subsequent Events
There have been no material events that occurred subsequent to September 30, 2013 that would require disclosure or recognition in our third quarter 2013 condensed consolidated financial statements.
20
Item 2. Management’s Discussion and Analysis of Financial Condition and Results of Operations
The following discussion and analysis should be read in conjunction with the condensed consolidated financial statements and related notes included elsewhere in this Report. In addition to historical information, this Report contains forward-looking statements that involve risks and uncertainties that could cause actual results to differ materially from those projected. Factors that might cause or contribute to such differences include, but are not limited to, those discussed in the following “Management’s Discussion and Analysis of Financial Condition and Results of Operations” as well as in Part II Item 1A, “Risk Factors.” Actual results could differ materially. Important factors that could cause actual results to differ materially include, but are not limited to; the level of demand for our products and services; the intensity of competition; our ability to effectively expand and improve internal infrastructure; maintenance of positive cash flows from operations, and adverse financial, customer and employee consequences that might result to us if litigation were to be initiated and resolved in an adverse manner to us. Readers are cautioned not to place undue reliance on the forward-looking statements, including statements regarding our expectations, beliefs, intentions or strategies regarding the future, which speak only as of the date of this Report. We assume no obligation to update these forward-looking statements.
Overview
We are an online marketplace that facilitates loans to qualified borrowers and offers investments to qualified investors. We were incorporated in Delaware in October 2006, and in May 2007, we began operations. Pursuant to a prospectus that describes a public offering of Member Payment Dependent Notes (“Notes”), investors have the opportunity to purchase, directly on our website, Notes issued by us, with each Note corresponding to an individual Member Loan facilitated through our platform. The Notes are unsecured, are dependent for payment on the related Member Loan and offer interest rates and credit characteristics that the investors find attractive.
In addition to our public offering of Notes, we offer private placements to accredited investors and qualified purchasers in the Funds managed by LCA. The Company established LC Trust I (“Trust”), a Delaware business trust in February 2011 to acquire and hold Member Loans for the sole benefit of investors that purchase Trust Certificates (“Certificates”) which are related to underlying Member Loans. The Funds each purchase a Certificate from the Trust and the Trust uses these proceeds to acquire and hold Member Loans for the sole benefit of the Certificate holders. The Certificates can only be settled with cash flows from the underlying Member Loans and the Certificate holder does not have recourse to the general credit or other assets of the Trust, Company, borrower members or other investors.
In December 2012, we began selling consumer Member Loans to unrelated third party purchasers through our platform. In all these sales transactions, we retained the servicing rights and obligations on the sold loans.
We aim to use technology and efficient operations to lower costs so we may facilitate, with our partners, loans to borrower members with rates that are generally lower, on average, than the rates they obtain through unsecured credit provided by credit cards or traditional consumer loans from banks and other financial institutions, while offering attractive returns to investors. Our customer acquisition process, registration, underwriting, servicing and payment systems are highly automated. We encourage the use of ACH (Automated Clearing House) payments as the preferred means to disburse member loan proceeds, receive payments on outstanding Member Loans, receive funds from investors and disburse payments to investors. We have no physical branches for loan application or payment-taking activities.
All Member Loans are unsecured obligations of individual borrower members with fixed interest rates, three-year or five-year original maturities and minimum amounts of $1,000 and maximum amounts of up to $35,000. Applications for Member Loans are posted on our website pursuant to a program agreement with WebBank, an FDIC-insured, state-chartered industrial bank organized under the laws of the state of Utah. Approved loans are funded and issued by WebBank and sold to us after closing. As a part of operating our platform, we verify the identity of members, obtain borrower members’ credit characteristics from consumer reporting agencies such as TransUnion, Experian or Equifax and screen borrower members for eligibility to participate in the platform. Also, after acquiring the Member Loans from WebBank, we service the Member Loans on an ongoing basis.
As of September 30, 2013, the platform had facilitated 190,173 Member Loans totaling approximately $2.5 billion since the platform’s inception. Our agreement with WebBank enables us to make our platform available to borrower members on a uniform basis nationwide, except that we currently do not offer Member Loans in Idaho, Iowa, Maine, Mississippi, Nebraska and North Dakota. We pay WebBank a monthly service fee based on the amount of loans issued by WebBank, subject to a minimum monthly fee.
21
Historically, we funded our operations primarily with proceeds from debt financing, preferred stock issuances and common stock issuances. Currently, we are able to fund our operations with the cash flow generated from such operations, which are described under “Liquidity and Capital Resources” in our “Management’s Discussion and Analysis of Financial Condition and Results of Operations.” From inception through September 30, 2013, we have raised approximately $103.2 million (net) through preferred equity financings.
We incurred net losses from our inception through December 31, 2012. For the three and nine months ended September 30, 2013, respectively, our net income was $2.7 million and $4.5 million. For the nine months ended September 30, 2013, we were cash-flow positive on an operating basis. We expect that we will remain profitable during the remainder of 2013. If our assumptions regarding continued growth and operating plan are incorrect, we may need to slow our investment spending, which could slow our rate of growth or ability to continue operating on a cash-flow positive or profitable basis, and our current liquidity resources may be consumed.
We earn revenues primarily from origination fees charged to borrowers, investor servicing fees and management fees. We expect that the number of borrowers, investors and unrelated third party purchasers and the volume of Member Loans facilitated through our platform to continue to increase, and that we will generate increased revenue from these fees.
Significant Accounting Policies and Estimates
The accounting policies which are more fully described inNote 2 to our condensed consolidated financial statements reflect our most significant judgments, assumptions and estimates and which we believe are critical in understanding and evaluating our reported financial results include: (i) revenue recognition; (ii) fair value determinations for Member Loans, Notes and Certificates; (iii) stock-based compensation; (iv) provision for income taxes, net of valuation allowances for deferred tax assets; and (v) loan servicing asset/liability fair value determination. These estimates and assumptions are inherently subjective in nature; actual results may differ from these estimates and assumptions, and the differences could be material.
Member Loans
We have elected fair value accounting for Member Loans and related Notes and Certificates. The fair value election for these Member Loans, Notes and Certificates allows symmetrical accounting for the timing and amounts recognized for both expected unrealized losses and charge-off losses on the Member Loans and the related Notes and Certificates, consistent with the member payment dependent design of the Notes and Certificates.
At September 30, 2013, we estimated the fair values of Member Loans and their related Notes and Certificates using a discounted cash flow valuation methodology. The discounted cash flow methodology used to estimate the Notes’ and Certificates’ fair values uses the same projected net cash flows as their related Member Loans. The discount rates for the projected net cash flows of the Notes and Certificates are our estimates of the rate of return, including any applicable risk premiums, if significant, that investors in unsecured consumer credit obligations would require when investing in Notes issued by LendingClub or Certificates issued by the Trust, with cash flows dependent on specific credit grades of Member Loans.
Our obligation to pay principal and interest on any Note or Certificate is equal to the pro-rata portion of the payments, if any, received on the related Member Loan, net of any applicable servicing fee. The gross effective interest rate associated with a Note or Certificate is the same as the interest rate earned on the related Member Loan. The principal payments reduce the carrying values of both the Member Loans and the related Notes and Certificates. Servicing fees withheld from payments made to Note and certain Certificate investors are recorded as a component of non-interest revenue when received. Management fees from Certificate investors are recognized as a component of non-interest revenue when earned.
We include in earnings the estimated unrealized fair value gains or losses during the period of Member Loans, and the offsetting estimated fair value losses or gains attributable to the expected changes in future payments on Notes and Certificates.
Results of Operations
Revenues
Our business model consists primarily of charging fees to borrower members, investor members and unrelated third party purchasers for transactions through or related to our platform. During the three months ended September 30, 2013 and 2012, we facilitated and acquired $567.1 million and $207.2 million of loans, respectively, via our platform. During the nine months ended September 30, 2013 and 2012, we facilitated and acquired $1.4 billion and $454.1 million of loans, respectively, via our platform.
22
The loan origination fee charged to each borrower member is determined by the term and credit grade of that borrower member’s loan.
Investor members that purchase Notes pay servicing fees to us based on each Member Loan payment they receive. We charge investors that invest through the Trust a monthly management fee that is based on their month-end account balances.
Non-Interest Revenue
The following table summarizes the components of non-interest revenue for the three and nine months ended September 30, 2013 and 2012 (in thousands):
| | | | | | | | | | | | | | | | |
| | | Three Months Ended September 30, | | | Nine Months Ended September 30, | |
| | | 2013 | | | 2012 | | | 2013 | | | 2012 | |
Origination fees | | $ | 25,245 | | | $ | 8,973 | | | $ | 55,229 | | | $ | 19,418 | |
Servicing fees | | | 942 | | | | 479 | | | | 2,461 | | | | 1,341 | |
Management fees | | | 869 | | | | 225 | | | | 2,082 | | | | 476 | |
Other revenue | | | 349 | | | | 137 | | | | 4,718 | | | | 255 | |
| | | | | | | | | | | | | | | | |
Total Non-Interest Revenue | | $ | 27,405 | | | $ | 9,814 | | | $ | 64,490 | | | $ | 21,490 | |
| | | | | | | | | | | | | | | | |
For the nine months ended September 30, 2013, $3,862 of gains from sales of loans to unrelated third party purchasers is included in Other revenue (seeNote 2 – Member Loans Sold to Unrelated Third Party Purchasers.)
Origination Fees
This fee is determined by the term and loan grade of the Member Loan and as of September 30, 2013 ranged from 1.11% to 5.00% of the issued principal balances. The fee is deducted from the loan proceeds at the time of issuance.
Origination fees received on Member Loans are recognized as a component of non-interest revenue at the time of loan origination and were $25.2 million and $9.0 million for the three months ended September 30, 2013 and 2012, respectively, an increase of 180%. The increase in these fees was primarily due to an increase in origination volumes of Member Loans during the three months ended September 30, 2013, to $567.1 million versus originations of $207.2 million for the three months ended September 30, 2012, an increase of 174%. Average loan origination fees were 4.4% and 4.3% of the principal amount of Member Loans originated for the three months ended September 30, 2013 and 2012, respectively. The increase in the average loan origination fee was primarily due to a higher percentage of 60 month loans and a higher percentage of C-G grade loans that have higher origination fees.
Origination fees received on Member Loans were $60.1 million (including $4.9 million in origination fees related to loans sold to unrelated third party purchasers that were recorded in gains on loans sold - seeNote 2 – Member Loans Sold to Unrelated Third Party Purchasers) and $19.4 million for the nine months ended September 30, 2013 and 2012, respectively, an increase of 210%. The increase in these fees was primarily due to an increase in origination volumes of Member Loans during the nine months ended September 30, 2013, to $1,366.3 million versus originations of $454.1 million for the nine months ended September 30, 2012, an increase of 201%. Average loan origination fees were 4.4% and 4.3% of the principal amount of Member Loans originated for the nine months ended September 30, 2013 and 2012, respectively. The increase in the average loan origination fee was primarily due to a higher percentage of 60 month loans and a higher percentage of C-G grade loans that have higher origination fees.
Servicing Fees
We charge investor members an ongoing service fee for Notes and certain Certificates. The servicing fee compensates us for the costs we incur in servicing the related Member Loans, including managing payments from borrower members, payments to the investor members and maintaining investors’ account portfolios. This service fee is charged based upon borrower member loan payment amounts received by us on behalf of a Note or Certificate.
Servicing fees earned from Note and certain Certificate holders that relate to cash flows received on related Member Loans were $0.9 million and $0.5 million for the three months ended September 30, 2013 and 2012, respectively, an increase of 80%. The increase in servicing fees was primarily due to increased balances of Notes and certain Certificates outstanding during the three months ended September 30, 2013, versus the three months ended September 30, 2012.
23
Servicing fees earned from Note and certain Certificate holders that relate to cash flows serviced on related Member Loans were $2.5 million and $1.3 million for the nine months ended September 30, 2013 and 2012, respectively, an increase of 92%. The increase in the servicing fees earned was primarily due to increased balances of Notes outstanding during the nine months ended September 30, 2013, versus the nine months ended September 30, 2012.
Management Fees and Assets Under Management
LCA charges certain Certificate holders a management fee based on their capital account balances in lieu of paying a servicing fee. LCA earned management fees from investors in Certificates totaling $0.9 million and $0.2 million for the three months ended September 30, 2013 and 2012, respectively. LCA earned management fees totaling $2.1 million and $0.5 million for the nine months ended September 30, 2013 and 2012, respectively. The increases in management fees earned during the three and nine months ended September 30, 2013 versus the prior year periods were due primarily to an increase in total assets under management, which were $653.2 million at September 30, 2013 ($573.5 million in five investment funds and $79.7 million in certain SMAs) and $225.0 million at September 30, 2012.
Net Interest Income
The following table summarizes interest income, interest expense and net interest income for the three months ended September 30, 2013 and 2012, as follows (in thousands):
| | | | | | | | | | | | | | | | |
| | | Three Months Ended | | | Nine Months Ended | |
| | | September 30, | | | September 30, | |
| | | 2013 | | | 2012 | | | 2013 | | | 2012 | |
Interest Income | | | | | | | | | | | | | | | | |
Member Loans | | $ | 51,385 | | | $ | 18,477 | | | $ | 124,760 | | | $ | 44,673 | |
Cash and cash equivalents | | | 1 | | | | 13 | | | | 11 | | | | 31 | |
| | | | | | | | | | | | | | | | |
Total Interest Income | | | 51,386 | | | | 18,490 | | | | 124,771 | | | | 44,704 | |
| | | | | | | | | | | | | | | | |
Interest Expense | | | | | | | | | | | | | | | | |
Notes and Certificates | | | (51,370 | ) | | | (18,259 | ) | | | (124,727 | ) | | | (44,180 | ) |
Loans payable | | | — | | | | — | | | | — | | | | (42 | ) |
| | | | | | | | | | | | | | | | |
Total Interest Expense | | | (51,370 | ) | | | (18,259 | ) | | | (124,727 | ) | | | (44,222 | ) |
| | | | | | | | | | | | | | | | |
Net Interest Income | | $ | 16 | | | $ | 231 | | | $ | 44 | | | $ | 482 | |
| | | | | | | | | | | | | | | | |
We had net interest income of $0.02 million and $0.23 million for the three months ended September 30, 2013 and 2012, respectively. We had net interest income of $0.04 million and $0.48 million for the nine months ended September 30, 2013 and 2012, respectively. Net interest income decreased in the three and nine months ended September 30, 2013, when compared to the same periods in the prior year primarily due to the reduction in loans financed by us.
Interest Income on Member Loans
We record interest income from Member Loans as earned. For the three months ended September 30, 2013 and 2012, we recorded interest income from Member Loans, excluding loan origination fees, of $51.4 million and $18.5 million, respectively. For the nine months ended September 30, 2013 and 2012, we recorded interest income from Member Loans, excluding loan origination fees, of $124.8 million and $44.7 million, respectively. The increase in interest income in the three months ended September 30, 2013, compared to the comparable period in the prior year is primarily due to the significant increase in the outstanding balances of Member Loans.
The average balance of Member Loans outstanding during the three months ended September 30, 2013, was $1.4 billion as compared to an estimated average balance of $547.6 million during the three months ended September 30, 2012, an increase of 156%. The average balance of Member Loans outstanding during the nine months ended September 30, 2013, was $1.2 billion as compared to an estimated average balance of $435.8 million during the nine months ended September 30, 2012, an increase of 175%.
Interest Earned on Cash and Investments
Interest income from cash and cash equivalents is recognized as it is earned. For the three months ended September 30, 2013 and 2012, we recognized $0.001 million and $0.013 million of interest income earned on cash and cash equivalents, respectively. For the nine months ended September 30, 2013 and 2012, we recognized $0.011 million and $0.031 million of interest income earned on cash and cash equivalents, respectively.
24
Interest Expense on Notes and Certificates
We record interest expense on Notes and Certificates. For the three months ended September 30, 2013 and 2012, we recorded interest expense for Notes and Certificates of $51.4 million and $18.3 million, respectively. We recorded interest expense for Notes and Certificates of $124.7 million and $44.2 million, respectively, for the nine months ended September 30, 2013 and 2012, respectively. The increase in interest expense in the three and nine months ended September 30, 2013, compared to the comparable period in the prior year was primarily due to the significant increase in the outstanding balances of Notes and Certificates.
The estimated average balance of Notes and Certificates outstanding during the three months ended September 30, 2013, was $1.4 billion as compared to an estimated average balance of $548.6 million in the prior year, an increase of 155%. The estimated average balance of Notes and Certificates outstanding during the nine months ended September 30, 2013, was $1.2 billion as compared to an estimated average balance of $435.5 million in the prior year, an increase of 176%.
Interest Expense on Loans Payable
We did not have any interest expense for loans payable for the three months ended September 30, 2013 and 2012. We recorded interest expense for loans payable of zero and $0.042 million respectively, for the nine months ended September 30, 2013 and 2012, respectively. The decrease was due to the remaining loans payable balance being paid in full in July 2012.
Fair Value Adjustments on Member Loans and Notes and Certificates
At September 30, 2013, we estimated the fair values of Member Loans and their related Notes and Certificates using a discounted cash flow valuation methodology. The fair valuation methodology considers projected prepayments, if significant, and uses the historical actual defaults, losses and recoveries on our loans over the past several years to project future losses and net cash flows on loans.
Fair value adjustment gains/(losses) for Member Loans were $(15.6 million) and $(7.2 million) for the three months ended September 30, 2013 and 2012, respectively, and $(37.9 million) and $(15.6 million) for the nine months ended September 30, 2013 and 2012, respectively. Fair value adjustment gains/(losses) for Notes and Certificates were $15.6 million and $7.1 million for the three months ended September 30, 2013 and 2012, respectively, and $37.8 million and $15.3 million for the nine months ended September 30, 2013 and 2012, respectively.
The fair value adjustments for Member Loans were largely offset by the fair value adjustments of the Notes and Certificates at fair value due to the member payment dependent design of the Notes and Certificates, and because the principal balances of the Member Loans were very close to the combined principal balances of the Notes and Certificates. Accordingly, the net fair value adjustment gains/(losses) for Member Loans and Notes and Certificates were $(0.006 million) and $(0.141 million) for the three months ended September 30, 2013 and 2012, respectively, and $(0.029 million) and $(0.229 million), for the nine months ended September 30, 2013 and 2012, respectively.
25
Operating Expenses
The following tables summarize our operating expenses for the three and nine months ended September 30, 2013 and 2012, respectively (in thousands).
| | | | | | | | | | | | | | | | |
| | | Three Months Ended September 30, | |
| | | 2013 | | | 2012 | | | $ Change | | | % Change | |
Sales and Marketing | | $ | (10,460 | ) | | $ | (4,743 | ) | | $ | (5,717 | ) | | | 121 | % |
Origination and Servicing | | | (4,996 | ) | | | (1,929 | ) | | | (3,067 | ) | | | 159 | % |
General and Administrative: Technology | | | (3,849 | ) | | | (1,382 | ) | | | (2,467 | ) | | | 179 | % |
General and Administrative: Other | | | (5,482 | ) | | | (2,725 | ) | | | (2,757 | ) | | | 101 | % |
| | | | | | | | | | | | | | | | |
Total Operating Expenses | | $ | (24,787 | ) | | $ | (10,779 | ) | | $ | (14,008 | ) | | | 130 | % |
| | | | | | | | | | | | | | | | |
| | | | | | | | | | | | | | | | |
| | | Nine Months Ended September 30, | |
| | | 2013 | | | 2012 | | | $ Change | | | % Change | |
Sales and Marketing | | $ | (26,577 | ) | | $ | (12,151 | ) | | $ | (14,426 | ) | | | 119 | % |
Origination and Servicing | | | (11,045 | ) | | | (5,138 | ) | | | (5,907 | ) | | | 115 | % |
General and Administrative: Technology | | | (9,140 | ) | | | (3,236 | ) | | | (5,904 | ) | | | 182 | % |
General and Administrative: Other | | | (13,293 | ) | | | (7,281 | ) | | | (6,012 | ) | | | 83 | % |
| | | | | | | | | | | | | | | | |
Total Operating Expenses | | $ | (60,055 | ) | | $ | (27,806 | ) | | $ | (32,249 | ) | | | 116 | % |
| | | | | | | | | | | | | | | | |
Sales and Marketing
Sales and marketing expense consists primarily of borrower and investor acquisition costs and salaries, benefits and stock-based compensation expense related to our sales and marketing staff. Sales and marketing expenses for the three months ended September 30, 2013 and 2012 were $10.5 million and $4.7 million, respectively, an increase of approximately 121%. The increase in spending during the three month period ended September 30, 2013 compared to the same period of the prior year was primarily due to a $4.9 million increase in acquisition costs related to expansion of direct mail and other borrower and investor acquisition programs and a $0.7 million increase in salaries, benefits and stock-based compensation expense.
Sales and marketing expense for the nine months ended September 30, 2013 and 2012 were $26.6 million and $12.2 million, respectively, an increase of approximately 119%. The increase in spending during the nine month period ended September 30, 2013 compared to the same period of the prior year was primarily due to a $11.6 million increase in acquisition costs related to expansion of direct mail and other borrower and investor acquisition programs and a $2.6 million increase in personnel related expenses from increased headcount.
Origination and Servicing
Origination and servicing expense consists primarily of salaries, benefits and stock-based compensation expense related to our credit, collections, customer support and payment processing staff and vendor costs associated with underwriting, issuing and servicing Member Loans. Origination and servicing expenses for the three months ended September 30, 2013 and 2012 were $5.0 million and $1.9 million, respectively, an increase of approximately 159%. The increase in spending during the three month period ended September 30, 2013 compared to the same period of the prior year was primarily due to a $2.1 million increase in personnel related expenses as we expanded our credit and customer support teams to keep pace with increased loan application and processing volume and a $0.8 million increase in consumer reporting agency and loan processing costs which was also driven by higher loan volumes.
Origination and servicing expense for the nine months ended September 30, 2013 and 2012 were $11.0 million and $5.1 million, respectively, an increase of approximately 115%. The increase in spending during the three month period ended September 30, 2013 compared to the same period of the prior year was primarily due to a $4.2 million increase in personnel related expenses as we expanded our credit, customer support and payment processing teams to keep pace with increased loan and transaction volumes and a $1.8 million increase in consumer reporting agency and loan processing costs which was also driven by higher loan volumes.
General and Administrative: Technology
Technology expense consists primarily of salaries, benefits and stock-based compensation expense for our Technology team and the cost of subcontractors who work on the development and maintenance of our platform and software enhancements that run our platform, expensed hardware and software and depreciation expense. Technology expenses for the three months ended September 30, 2013 and 2012 were $3.8 million and $1.4 million, respectively, an increase of 179%. The increase for the three month period ended September 30, 2013 versus the same period in the prior year was primarily due to a $1.7 million increase in personnel related expenses resulting from increased headcount and contract labor expense as we enhanced our website tools and functionality, $0.3 million in expensed equipment and software and $0.3 million in depreciation expense reflecting our continued investment in IT infrastructure.
26
Technology expenses for the nine months ended September 30, 2013 and 2012 were $9.1 million and $3.2 million, respectively, an increase of 182%. The increase for the nine month period ended September 30, 2013 versus the same period in the prior year was primarily due to a $4.4 million increase in personnel, third party recruiting and contract labor expense as we continued to enhance our website tools and functionality, $0.6 million in expensed equipment and software and $0.6 million in depreciation expense.
During the three and nine months ended September 30, 2013, we capitalized $0.9 million and $2.0 million of software development costs, respectively, compared to zero costs capitalized for the same periods in 2012.
General and Administrative: Other
Other general and administrative expense consists primarily of salaries, benefits and stock-based compensation expense for our accounting and finance, business development, legal, human resources and facilities staff, professional fees related to legal and accounting and facilities expense. Other general and administrative expenses for the three months ended September 30, 2013 and 2012, were $5.5 million and $2.7 million, respectively, an increase of approximately 101%. The increase was primarily due to a $1.9 million increase in personnel related expenses from increased headcount and a $0.6 million increase in rent/facilities expense.
Other general and administrative expense for the nine months ended September 30, 2013 and 2012 was $13.3 million and $7.3 million, respectively, an increase of approximately 83%. The increase was primarily due to a $4.4 million increase in personnel, third party recruiting and contract labor expense and a $1.4 million increase in rent/facilities expense.
We expect that general and administrative expenses will increase as we continue to expand our business.
Liquidity and Capital Resources
The following table summarizes our cash flows for the nine months ended September 30, 2013 and 2012 (in thousands).
| | | | | | | | |
| | | Nine Months Ended | |
| | | September 30, | |
| | | 2013 | | | 2012 | |
Cash provided by (used in) | | | | | | | | |
Operating activities | | $ | 16,202 | | | $ | (3,301 | ) |
Investing activities | | | (782,338 | ) | | | (325,271 | ) |
Financing activities | | | 775,771 | | | | 356,269 | |
| | | | | | | | |
Net increase in cash | | $ | 9,635 | | | $ | 27,697 | |
| | | | | | | | |
Net cash provided by (used in) operating activities was $16.2 million and $(3.3 million) for the nine months ended September 30, 2013 and 2012, respectively. Net cash provided by operating activities was positive for the nine months ended September 30, 2013 due to our continued profitability.
Net cash used in investing activities for the nine months ended September 30, 2013 and 2012 were $782.3 million and $325.3 million, respectively. Net cash used for the nine months ended September 30, 2013 primarily represents originations of Member Loans of $1.1 billion (excluding $0.3 billion in originations of Member Loans sold to unrelated third parties which is included in cash flow from operations along with the corresponding proceeds from sale of Member Loans), offset by repayment of Member Loans of $0.3 billion.
At September 30, 2013, we had $8.7 million in restricted cash. Restricted cash at September 30, 2013 consisted primarily of pledges of $3.0 million of our funds as security for WebBank, $3.4 million for an investor as part of a credit support agreement and $1.7 million as security for a correspondent bank that clears our borrowers’ and investors’ cash transactions. We primarily hold our excess unrestricted cash in short-term interest-bearing money market funds at highly-rated financial institutions.
Net cash provided by financing activities for the nine months ended September 30, 2013 and 2012 were $775.8 million and $356.3 million, respectively. Net cash provided for the nine months ended September 30, 2013 primarily represents proceeds from the issuance of Notes and Certificates of $1.1 billion partially offset by payments on Notes and Certificates of $0.3 billion.
As of September 30, 2013, our accumulated deficit was $53.2 million and our total stockholders’ deficit was $41.4 million. Our net income for the three and nine months ended September 30, 2013 was $2.7 million, and $4.5 million, respectively. For the nine months ended September 30, 2013, we were able to generate a positive cash flow from operations on an operating basis. We expect to continue to generate positive cash flows from operations through the end of calendar year 2013.
27
At September 30, 2013, we had $62.2 million in available cash and cash equivalents. We believe that our current cash position is sufficient to meet our current liquidity needs. Our current operating plan calls for continued investments in technology, new business development, security infrastructure, underwriting, credit processing and marketing. If assumptions regarding our continued growth and our operating plan are incorrect, we may need to slow our investment spending, which could slow our rate of growth or ability to continue operating on a cash-flow positive basis. To date, we have funded our cash requirements with proceeds from the sale of our equity securities, issuance of loans payable and recently through operations.
Assets Under Management—LCA
As of September 30, 2013, LCA was the general partner to five Funds. These Funds are: Broad Based Consumer Credit Fund, L.P. (“BBF”), Broad Based Consumer Credit (Q) Fund, L.P. (“BBF-QP”), Broad Based Consumer Credit II Fund, L.P. (“BBF II”), Conservative Consumer Credit Fund, L.P. (“CCF”), and Conservative Consumer Credit (Q) Fund, L.P. (“CCF-QP”). In connection with the Funds, there is a Trust that acts as a bankruptcy remote entity for holding portions of Member Loans related to Certificates purchased by the Funds separate and apart from the Member Loans and other assets of ours. We and the Trust have entered into a loan purchase agreement and a servicing agreement whereby we service the loans acquired by the Trust in a manner identical to other Member Loans; the Trust earns a fee equal to 40 basis points for each Certificate holder and we earn a servicing fee equal to 35 basis points, which is paid by the Trust.
As of September 30, 2013, the funds had approximately $573.5 million in assets with $28.1 million in escrow, which was contributed to the funds on the first business day of October 2013. LCA earns a management fee paid by the limited partners of the funds, paid monthly in arrears, which ranges from 0.70% to 1.25% (annualized) of the month-end balances of partners’ capital accounts. These management fees can be modified or waived for individual limited partners at the discretion of the general partner.
Beginning January 2012, LCA also began offering SMAs to individual accredited investors. Investors with SMAs invest in Certificates issued by the Trust. As of September 30, 2013, the SMAs had approximately $79.7 million in assets. LCA earns management fees paid by certain SMA investors, monthly in arrears, based on balances in the SMA accounts.
Summary of Changes in Assets Under Management
The table below presents a summary of changes in total assets under management for LCA for the nine month period ended September 30, 2013 (in millions).
| | | | |
Balance at December 31, 2012 | | $ | 286.7 | |
Net capital contributions | | | 338.2 | |
Appreciation (depreciation) | | | 28.3 | |
| | | | |
Balance at September 30, 2013 | | $ | 653.2 | |
| | | | |
Income Taxes
We recorded no net provision for income taxes for the nine month period ended September 30, 2013 because the minimum corporate income tax liabilities due for the Company’s taxable income will be offset by usage of prior years’ net operating loss and tax credit carryforwards. The Company recorded no net tax provision or benefit related to our pre-tax income for the nine month period ended September 30, 2012. Accounting Standards Codification Topic 740, “Income Taxes,” provides for the recognition of deferred tax assets, such as the future benefit of net operating loss deductions against future taxable income, if realization of such tax-related assets is more likely than not. However, given our history of operating losses, it is difficult to accurately forecast when and in what amounts future results will be affected by the realization, if any, of the tax benefits of future deductions for our net operating loss carry forwards. Based upon the weight of available evidence, which includes our historical operating performance and the reported cumulative net losses in all prior years, we have provided a full valuation allowance against our net deferred tax assets. Such valuation allowance against the deferred tax assets fully offsets the current periods’ tax benefits attributable to the pre-tax losses.
As of December 31, 2012, we had federal and state net operating loss (NOL) carryforwards of $53.0 million and $41.9 million, respectively. As of December 31, 2012, we also had federal and state research and development (R&D) tax credit carryforwards of $0.3 million and $0.3 million, respectively. In general, a corporation’s ability to utilize its NOL’s and R&D credit carryforwards may be substantially limited due to ownership changes that may have occurred or that could occur in the future, as required by Section 382 of the Code, as well as similar state provisions. These ownership changes may limit the amount of NOL and R&D credit carryforwards that can be utilized annually to offset future taxable income and tax, respectively. The amount of such limitations on the
28
Company’s total federal net operating losses of approximately $53.0 million incurred since the Company’s inception in October 2006 through September 30, 2013 has been analyzed, and the Company believes limitations exist only on the future annual deductibility of approximately $2.5 million of the Company’s total net operating loss carryforwards.
29
Additional Information about the LendingClub Platform
The tables and charts set forth below relate only to prime consumer loans facilitated through our platform.
Historical Information about Our Borrower Members Loans:
In regards to the following historical information, prior performance is no guarantee of future results or outcomes.
From inception to September 30, 2013, we had facilitated Member Loans with an average original principal amount of $13,466 and an aggregate original principal amount of $2,516,068,550. Out of 186,847 facilitated Member Loans, 29,940 Member Loans with an aggregate original principal amount of $331.5 million, or 13.18%, are fully paid.
The following table presents aggregated information about loans for the period from inception to September 30, 2013, grouped by the loan grade assigned by us:
| | | | | | | | | | | | |
Loan Grade | | Number of Loans | | | Average Interest Rate | | | Total Amount
Issued | |
A1 | | | 4,674 | | | | 5.98% | | | $ | 51,075,450 | |
A2 | | | 4,796 | | | | 6.55% | | | | 50,514,875 | |
A3 | | | 5,515 | | | | 7.47% | | | | 64,916,750 | |
A4 | | | 8,140 | | | | 7.82% | | | | 96,642,475 | |
A5 | | | 8,960 | | | | 8.71% | | | | 115,653,000 | |
B1 | | | 9,596 | | | | 9.99% | | | | 113,832,875 | |
B2 | | | 12,327 | | | | 10.89% | | | | 157,706,600 | |
B3 | | | 15,569 | | | | 11.80% | | | | 192,467,075 | |
B4 | | | 14,029 | | | | 12.64% | | | | 181,638,500 | |
B5 | | | 9,591 | | | | 13.20% | | | | 116,042,725 | |
C1 | | | 10,951 | | | | 13.86% | | | | 137,492,950 | |
C2 | | | 10,325 | | | | 14.63% | | | | 137,175,325 | |
C3 | | | 8,967 | | | | 15.23% | | | | 123,850,250 | |
C4 | | | 8,655 | | | | 15.79% | | | | 124,173,800 | |
C5 | | | 7,860 | | | | 16.61% | | | | 115,171,725 | |
D1 | | | 6,587 | | | | 17.18% | | | | 85,865,700 | |
D2 | | | 6,015 | | | | 17.58% | | | | 71,483,850 | |
D3 | | | 5,187 | | | | 17.91% | | | | 65,518,050 | |
D4 | | | 4,974 | | | | 18.37% | | | | 71,842,200 | |
D5 | | | 4,283 | | | | 19.00% | | | | 67,599,150 | |
E1 | | | 2,703 | | | | 19.24% | | | | 46,380,750 | |
E2 | | | 3,126 | | | | 19.99% | | | | 53,976,550 | |
E3 | | | 2,535 | | | | 20.38% | | | | 45,246,425 | |
E4 | | | 2,406 | | | | 21.01% | | | | 46,088,450 | |
E5 | | | 1,935 | | | | 21.38% | | | | 37,741,800 | |
F1 | | | 1,632 | | | | 22.00% | | | | 32,340,475 | |
F2 | | | 1,378 | | | | 22.42% | | | | 27,224,825 | |
F3 | | | 1,143 | | | | 22.95% | | | | 22,188,650 | |
F4 | | | 889 | | | | 23.07% | | | | 18,748,300 | |
F5 | | | 731 | | | | 23.33% | | | | 16,345,425 | |
G1 | | | 488 | | | | 23.55% | | | | 10,766,300 | |
G2 | | | 320 | | | | 23.51% | | | | 7,032,700 | |
G3 | | | 225 | | | | 23.67% | | | | 4,895,625 | |
G4 | | | 183 | | | | 22.76% | | | | 3,842,100 | |
G5 | | | 152 | | | | 22.51% | | | | 2,586,850 | |
| | | | | | | | | | | | |
Total | | | 186,847 | | | | 13.76% | | | | $2,516,068,550 | |
| | | | | | | | | | | | |
30
The following table presents aggregated information for the period from inception to September 30, 2013, reported by a consumer reporting agency about our borrower members at the time of their loan applications, grouped by the loan grade assigned by us. As used in this table, “Delinquencies in the Last Two Years” means the number of 30+ days past-due incidences of delinquency in the borrower member’s credit file for the past two years. We do not independently verify this information. All figures other than loan grade are agency reported:
| | | | | | | | | | | | | | | | | | | | | | | | | | | | | | | | |
Loan Grade | | Average
FICO | | | Average
Open
Credit
Lines | | | Average
Total
Credit
Lines | | | Average
Revolving
Credit
Balance | | | Average
Revolving
Line
Utilization | | | Average
Inquiries
in the
Last Six
Months | | | Average
Delinquencies
in the Last
Two Years | | | Average
Months
Since Last
Delinquency | |
A1 | | | 774 | | | | 11 | | | | 26 | | | $ | 13,599 | | | | 22.72 | % | | | 0 | | | | 0 | | | | 40 | |
A2 | | | 756 | | | | 11 | | | | 25 | | | | 13,985 | | | | 29.00 | % | | | 1 | | | | 0 | | | | 38 | |
A3 | | | 746 | | | | 10 | | | | 24 | | | | 16,021 | | | | 34.23 | % | | | 1 | | | | 0 | | | | 38 | |
A4 | | | 737 | | | | 10 | | | | 24 | | | | 15,556 | | | | 40.22 | % | | | 1 | | | | 0 | | | | 38 | |
A5 | | | 729 | | | | 11 | | | | 25 | | | | 17,498 | | | | 44.50 | % | | | 1 | | | | 0 | | | | 38 | |
B1 | | | 717 | | | | 10 | | | | 24 | | | | 15,672 | | | | 48.88 | % | | | 1 | | | | 0 | | | | 37 | |
B2 | | | 711 | | | | 11 | | | | 24 | | | | 16,498 | | | | 52.65 | % | | | 1 | | | | 0 | | | | 37 | |
B3 | | | 705 | | | | 10 | | | | 23 | | | | 15,523 | | | | 55.82 | % | | | 1 | | | | 0 | | | | 36 | |
B4 | | | 700 | | | | 11 | | | | 24 | | | | 15,899 | | | | 57.24 | % | | | 1 | | | | 0 | | | | 37 | |
B5 | | | 697 | | | | 10 | | | | 23 | | | | 14,623 | | | | 59.14 | % | | | 1 | | | | 0 | | | | 36 | |
C1 | | | 694 | | | | 10 | | | | 23 | | | | 15,224 | | | | 60.24 | % | | | 1 | | | | 0 | | | | 36 | |
C2 | | | 693 | | | | 10 | | | | 23 | | | | 15,277 | | | | 61.23 | % | | | 1 | | | | 0 | | | | 35 | |
C3 | | | 692 | | | | 11 | | | | 24 | | | | 15,954 | | | | 61.15 | % | | | 1 | | | | 0 | | | | 35 | |
C4 | | | 689 | | | | 11 | | | | 24 | | | | 16,197 | | | | 63.20 | % | | | 1 | | | | 0 | | | | 35 | |
C5 | | | 687 | | | | 11 | | | | 24 | | | | 16,127 | | | | 63.64 | % | | | 1 | | | | 0 | | | | 34 | |
D1 | | | 683 | | | | 11 | | | | 23 | | | | 15,156 | | | | 65.69 | % | | | 1 | | | | 0 | | | | 35 | |
D2 | | | 683 | | | | 10 | | | | 22 | | | | 14,221 | | | | 64.93 | % | | | 1 | | | | 0 | | | | 34 | |
D3 | | | 684 | | | | 10 | | | | 22 | | | | 14,647 | | | | 64.91 | % | | | 1 | | | | 0 | | | | 34 | |
D4 | | | 684 | | | | 10 | | | | 23 | | | | 14,940 | | | | 66.40 | % | | | 1 | | | | 0 | | | | 35 | |
D5 | | | 684 | | | | 11 | | | | 24 | | | | 16,733 | | | | 66.27 | % | | | 1 | | | | 0 | | | | 34 | |
E1 | | | 683 | | | | 11 | | | | 24 | | | | 16,200 | | | | 67.51 | % | | | 1 | | | | 0 | | | | 35 | |
E2 | | | 684 | | | | 11 | | | | 24 | | | | 16,856 | | | | 67.13 | % | | | 1 | | | | 0 | | | | 33 | |
E3 | | | 682 | | | | 11 | | | | 24 | | | | 17,432 | | | | 68.74 | % | | | 1 | | | | 0 | | | | 33 | |
E4 | | | 681 | | | | 11 | | | | 24 | | | | 18,499 | | | | 69.32 | % | | | 1 | | | | 0 | | | | 33 | |
E5 | | | 680 | | | | 11 | | | | 25 | | | | 19,056 | | | | 69.02 | % | | | 1 | | | | 0 | | | | 32 | |
F1 | | | 680 | | | | 11 | | | | 26 | | | | 18,319 | | | | 68.89 | % | | | 1 | | | | 0 | | | | 32 | |
F2 | | | 678 | | | | 11 | | | | 25 | | | | 18,216 | | | | 70.13 | % | | | 1 | | | | 0 | | | | 32 | |
F3 | | | 678 | | | | 11 | | | | 25 | | | | 17,903 | | | | 69.93 | % | | | 1 | | | | 0 | | | | 31 | |
F4 | | | 677 | | | | 12 | | | | 27 | | | | 18,272 | | | | 70.00 | % | | | 2 | | | | 0 | | | | 31 | |
F5 | | | 676 | | | | 12 | | | | 27 | | | | 19,491 | | | | 70.84 | % | | | 2 | | | | 0 | | | | 32 | |
G1 | | | 674 | | | | 12 | | | | 27 | | | | 18,226 | | | | 70.13 | % | | | 2 | | | | 1 | | | | 29 | |
G2 | | | 674 | | | | 13 | | | | 27 | | | | 23,815 | | | | 72.95 | % | | | 2 | | | | 0 | | | | 29 | |
G3 | | | 673 | | | | 12 | | | | 27 | | | | 18,300 | | | | 74.57 | % | | | 2 | | | | 0 | | | | 28 | |
G4 | | | 671 | | | | 14 | | | | 30 | | | | 25,659 | | | | 72.45 | % | | | 2 | | | | 0 | | | | 30 | |
G5 | | | 667 | | | | 13 | | | | 30 | | | | 35,167 | | | | 72.92 | % | | | 3 | | | | 0 | | | | 29 | |
Total | | | 703 | | | | 11 | | | | 24 | | | $ | 15,850 | | | | 56.45 | % | | | 1 | | | | 0 | | | | 35 | |
31
The following table presents additional aggregated information for the period from inception to September 30, 2013, about current and paid off loans, grouped by the loan grade assigned by us.
| | | | | | | | | | | | | | | | | | | | | | | | | | | | |
Loan Grade | | Number of
Current loans | | | Current loan
Outstanding
Principal ($) | | | Number of Loans
Fully Paid | | | Fully Paid ($) | | | Fully Paid
(%) of
Originated
Issued
Loans | | | Number
of All
Issued
Loans | | | Total Origination
Amount for All
Issued Loans | |
A1 | | | 3,577 | | | $ | 30,345,342 | | | | 808 | | | $ | 6,412,175 | | | | 12.55 | % | | | 4,674 | | | $ | 51,075,450 | |
A2 | | | 3,338 | | | | 27,446,310 | | | | 1,108 | | | | 8,024,350 | | | | 15.89 | % | | | 4,796 | | | | 50,514,875 | |
A3 | | | 3,705 | | | | 36,120,049 | | | | 1,386 | | | | 11,040,275 | | | | 17.01 | % | | | 5,515 | | | | 64,916,750 | |
A4 | | | 5,586 | | | | 49,104,817 | | | | 1,999 | | | | 18,357,675 | | | | 19.00 | % | | | 8,140 | | | | 96,642,475 | |
A5 | | | 6,143 | | | | 65,610,919 | | | | 2,085 | | | | 20,704,500 | | | | 17.90 | % | | | 8,960 | | | | 115,653,000 | |
B1 | | | 6,988 | | | | 68,198,680 | | | | 1,457 | | | | 14,954,175 | | | | 13.14 | % | | | 9,596 | | | | 113,832,875 | |
B2 | | | 9,276 | | | | 100,134,816 | | | | 1,650 | | | | 17,907,575 | | | | 11.35 | % | | | 12,327 | | | | 157,706,600 | |
B3 | | | 11,803 | | | | 116,443,732 | | | | 2,157 | | | | 25,206,425 | | | | 13.10 | % | | | 15,569 | | | | 192,467,075 | |
B4 | | | 10,400 | | | | 112,685,952 | | | | 1,937 | | | | 21,834,650 | | | | 12.02 | % | | | 14,029 | | | | 181,638,500 | |
B5 | | | 6,605 | | | | 62,213,912 | | | | 1,897 | | | | 20,788,500 | | | | 17.91 | % | | | 9,591 | | | | 116,042,725 | |
C1 | | | 7,896 | | | | 81,921,815 | | | | 1,664 | | | | 18,129,450 | | | | 13.19 | % | | | 10,951 | | | | 137,492,950 | |
C2 | | | 7,359 | | | | 83,277,183 | | | | 1,581 | | | | 17,585,325 | | | | 12.82 | % | | | 10,325 | | | | 137,175,325 | |
C3 | | | 6,375 | | | | 79,745,893 | | | | 1,231 | | | | 13,507,775 | | | | 10.91 | % | | | 8,967 | | | | 123,850,250 | |
C4 | | | 6,239 | | | | 82,818,489 | | | | 1,138 | | | | 12,367,650 | | | | 9.96 | % | | | 8,655 | | | | 124,173,800 | |
C5 | | | 5,595 | | | | 75,962,555 | | | | 1,022 | | | | 11,194,200 | | | | 9.72 | % | | | 7,860 | | | | 115,171,725 | |
D1 | | | 4,668 | | | | 53,623,324 | | | | 909 | | | | 10,046,600 | | | | 11.70 | % | | | 6,587 | | | | 85,865,700 | |
D2 | | | 4,112 | | | | 39,645,086 | | | | 952 | | | | 11,125,600 | | | | 15.56 | % | | | 6,015 | | | | 71,483,850 | |
D3 | | | 3,453 | | | | 35,518,845 | | | | 844 | | | | 10,559,450 | | | | 16.12 | % | | | 5,187 | | | | 65,518,050 | |
D4 | | | 3,450 | | | | 43,617,522 | | | | 720 | | | | 9,235,725 | | | | 12.86 | % | | | 4,974 | | | | 71,842,200 | |
D5 | | | 2,943 | | | | 41,807,738 | | | | 627 | | | | 8,665,025 | | | | 12.82 | % | | | 4,283 | | | | 67,599,150 | |
E1 | | | 1,776 | | | | 26,887,163 | | | | 455 | | | | 6,756,125 | | | | 14.57 | % | | | 2,703 | | | | 46,380,750 | |
E2 | | | 2,146 | | | | 33,424,222 | | | | 435 | | | | 6,332,325 | | | | 11.73 | % | | | 3,126 | | | | 53,976,550 | |
E3 | | | 1,715 | | | | 28,022,882 | | | | 371 | | | | 5,551,900 | | | | 12.27 | % | | | 2,535 | | | | 45,246,425 | |
E4 | | | 1,652 | | | | 29,368,823 | | | | 302 | | | | 4,763,000 | | | | 10.33 | % | | | 2,406 | | | | 46,088,450 | |
E5 | | | 1,282 | | | | 22,997,935 | | | | 272 | | | | 4,377,775 | | | | 11.60 | % | | | 1,935 | | | | 37,741,800 | |
F1 | | | 1,127 | | | | 20,424,194 | | | | 197 | | | | 3,237,725 | | | | 10.01 | % | | | 1,632 | | | | 32,340,475 | |
F2 | | | 918 | | | | 16,964,078 | | | | 170 | | | | 3,002,000 | | | | 11.03 | % | | | 1,378 | | | | 27,224,825 | |
F3 | | | 744 | | | | 13,249,702 | | | | 143 | | | | 2,576,375 | | | | 11.61 | % | | | 1,143 | | | | 22,188,650 | |
F4 | | | 581 | | | | 11,859,963 | | | | 104 | | | | 1,747,525 | | | | 9.32 | % | | | 889 | | | | 18,748,300 | |
F5 | | | 505 | | | | 10,788,490 | | | | 71 | | | | 1,306,000 | | | | 7.99 | % | | | 731 | | | | 16,345,425 | |
G1 | | | 315 | | | | 6,469,478 | | | | 71 | | | | 1,354,200 | | | | 12.58 | % | | | 488 | | | | 10,766,300 | |
G2 | | | 196 | | | | 4,014,559 | | | | 45 | | | | 791,375 | | | | 11.25 | % | | | 320 | | | | 7,032,700 | |
G3 | | | 124 | | | | 2,613,342 | | | | 38 | | | | 658,250 | | | | 13.45 | % | | | 225 | | | | 4,895,625 | |
G4 | | | 83 | | | | 1,711,540 | | | | 47 | | | | 880,475 | | | | 22.92 | % | | | 183 | | | | 3,842,100 | |
G5 | | | 59 | | | | 1,088,330 | | | | 47 | | | | 563,600 | | | | 21.79 | % | | | 152 | | | | 2,586,850 | |
| | | | | | | | | | | | | | | | | | | | | | | | | | | | |
Total | | | 132,734 | | | $ | 1,516,127,680 | | | | 29,940 | | | $ | 331,545,750 | | | | 13.18 | % | | | 186,847 | | | $ | 2,516,068,550 | |
| | | | | | | | | | | | | | | | | | | | | | | | | | | | |
32
The following graph presents the dollar weighted average interest rate for Member Loans originated from inception to September 30, 2013, by grade.
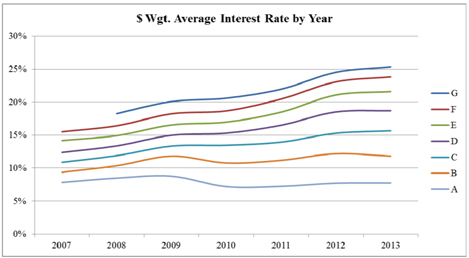
33
The following table presents outstanding loan balance in dollars, delinquent loan balance in dollars, principal amount of loans charged-off during the quarter, delinquency rate and annualized charge-off rate as of September 30, 2013. This information excludes loans that we classified as identity theft. In cases of verified identity theft, we write-off the loan and pay the holder of the related Notes or Certificates an amount equal to the unpaid principal balances due on the Notes less any applicable servicing fees.
| | | | | | | | | | | | | | | | | | | | | | | | | | | | | | | | | | | | | | | | | | | | | | | | |
| Outstandings (1) | |
| | | | | | | | | | | | |
| | | 2013-Q3 | | | 2013-Q2 | | | 2013-Q1 | | | 2012-Q4 | | | 2012-Q3 | | | 2012-Q2 | | | 2012-Q1 | | | 2011-Q4 | | | 2011-Q3 | | | 2011-Q2 | | | 2011-Q1 | | | 2010-Q4 | |
Total | | $ | 1,750,364,599 | | | $ | 1,377,063,925 | | | $ | 1,058,994,336 | | | $ | 805,762,673 | | | $ | 614,888,789 | | | $ | 464,367,269 | | | $ | 372,219,576 | | | $ | 300,981,599 | | | $ | 242,940,789 | | | $ | 198,898,230 | | | $ | 164,293,968 | | | $ | 136,066,358 | |
Grade A | | | 230,596,152 | | | | 199,205,136 | | | | 167,636,091 | | | | 130,844,888 | | | | 108,620,465 | | | | 89,352,446 | | | | 74,014,114 | | | | 56,698,297 | | | | 45,181,116 | | | | 35,321,605 | | | | 29,898,683 | | | | 24,106,596 | |
Grade B | | | 524,253,037 | | | | 416,396,255 | | | | 328,331,100 | | | | 241,219,434 | | | | 184,014,545 | | | | 136,784,984 | | | | 108,646,899 | | | | 86,458,634 | | | | 69,077,649 | | | | 56,298,108 | | | | 47,119,722 | | | | 40,815,361 | |
Grade C | | | 471,686,103 | | | | 351,183,654 | | | | 253,471,907 | | | | 169,705,649 | | | | 122,985,071 | | | | 89,615,401 | | | | 70,356,879 | | | | 57,785,257 | | | | 47,469,986 | | | | 39,947,631 | | | | 33,414,866 | | | | 29,570,943 | |
Grade D | | | 249,748,219 | | | | 199,912,034 | | | | 153,861,310 | | | | 127,701,086 | | | | 94,518,339 | | | | 67,602,607 | | | | 53,707,947 | | | | 44,554,881 | | | | 37,435,226 | | | | 31,682,765 | | | | 26,324,025 | | | | 22,286,033 | |
Grade E | | | 166,244,847 | | | | 130,030,180 | | | | 99,328,925 | | | | 86,250,040 | | | | 65,672,747 | | | | 50,561,701 | | | | 41,235,661 | | | | 34,242,722 | | | | 26,804,123 | | | | 21,554,533 | | | | 16,697,416 | | | | 12,073,966 | |
Grade F | | | 88,311,217 | | | | 66,519,207 | | | | 46,616,552 | | | | 40,438,437 | | | | 30,864,095 | | | | 23,706,878 | | | | 18,276,540 | | | | 15,679,970 | | | | 12,229,462 | | | | 9,863,641 | | | | 7,383,441 | | | | 4,655,585 | |
Grade G | | | 19,525,024 | | | | 13,817,459 | | | | 9,748,451 | | | | 9,603,139 | | | | 8,213,527 | | | | 6,743,252 | | | | 5,981,536 | | | | 5,561,838 | | | | 4,743,227 | | | | 4,229,947 | | | | 3,455,815 | | | | 2,557,874 | |
|
| Outstandings of Delinquent Loans (2) | |
| | | | | | | | | | | | |
| | | 2013-Q3 | | | 2013-Q2 | | | 2013-Q1 | | | 2012-Q4 | | | 2012-Q3 | | | 2012-Q2 | | | 2012-Q1 | | | 2011-Q4 | | | 2011-Q3 | | | 2011-Q2 | | | 2011-Q1 | | | 2010-Q4 | |
Total | | $ | 24,627,790 | | | $ | 17,262,327 | | | $ | 14,850,107 | | | $ | 12,788,662 | | | $ | 9,586,950 | | | $ | 7,374,699 | | | $ | 5,527,306 | | | $ | 5,849,888 | | | $ | 5,501,713 | | | $ | 4,006,570 | | | $ | 3,704,724 | | | $ | 3,522,460 | |
Grade A | | | 1,172,286 | | | | 1,037,058 | | | | 986,293 | | | | 844,494 | | | | 645,906 | | | | 501,586 | | | | 244,111 | | | | 356,477 | | | | 272,859 | | | | 186,715 | | | | 163,243 | | | | 144,354 | |
Grade B | | | 4,974,684 | | | | 3,484,961 | | | | 2,865,740 | | | | 2,283,231 | | | | 1,851,870 | | | | 1,449,389 | | | | 1,283,207 | | | | 1,109,586 | | | | 1,061,620 | | | | 774,299 | | | | 936,193 | | | | 880,418 | |
Grade C | | | 5,762,595 | | | | 3,588,468 | | | | 3,025,989 | | | | 2,551,721 | | | | 1,991,462 | | | | 1,299,900 | | | | 1,162,852 | | | | 1,172,263 | | | | 1,203,663 | | | | 963,323 | | | | 798,484 | | | | 768,797 | |
Grade D | | | 5,393,265 | | | | 3,963,875 | | | | 3,605,332 | | | | 2,870,124 | | | | 2,069,916 | | | | 1,492,371 | | | | 1,162,834 | | | | 1,364,443 | | | | 1,278,711 | | | | 958,866 | | | | 895,225 | | | | 856,069 | |
Grade E | | | 4,298,361 | | | | 2,680,574 | | | | 2,334,809 | | | | 2,328,965 | | | | 1,613,169 | | | | 1,239,647 | | | | 1,009,578 | | | | 950,776 | | | | 848,841 | | | | 690,453 | | | | 499,757 | | | | 507,321 | |
Grade F | | | 2,501,975 | | | | 1,970,257 | | | | 1,450,438 | | | | 1,461,271 | | | | 1,014,141 | | | | 1,085,956 | | | | 437,866 | | | | 581,478 | | | | 532,081 | | | | 282,089 | | | | 302,024 | | | | 245,234 | |
Grade G | | | 524,624 | | | | 537,134 | | | | 581,506 | | | | 448,856 | | | | 400,486 | | | | 305,850 | | | | 226,858 | | | | 314,865 | | | | 303,938 | | | | 150,825 | | | | 109,798 | | | | 120,267 | |
|
| Charge-Off Amount (3) | |
| | | | | | | | | | | | |
| | | 2013-Q3 | | | 2013-Q2 | | | 2013-Q1 | | | 2012-Q4 | | | 2012-Q3 | | | 2012-Q2 | | | 2012-Q1 | | | 2011-Q4 | | | 2011-Q3 | | | 2011-Q2 | | | 2011-Q1 | | | 2010-Q4 | |
Total | | $ | 12,500,153 | | | $ | 10,597,523 | | | $ | 8,949,564 | | | $ | 6,116,909 | | | $ | 4,878,122 | | | $ | 3,342,427 | | | $ | 3,365,817 | | | $ | 2,888,000 | | | $ | 1,757,029 | | | $ | 1,658,883 | | | $ | 1,439,029 | | | $ | 1,199,278 | |
Grade A | | | 848,544 | | | | 857,591 | | | | 655,065 | | | | 515,654 | | | | 361,014 | | | | 130,494 | | | | 225,833 | | | | 156,802 | | | | 106,810 | | | | 90,020 | | | | 31,252 | | | | 64,394 | |
Grade B | | | 2,730,955 | | | | 2,155,828 | | | | 1,833,203 | | | | 1,265,295 | | | | 932,505 | | | | 709,000 | | | | 602,278 | | | | 551,128 | | | | 365,884 | | | | 486,199 | | | | 357,292 | | | | 313,290 | |
Grade C | | | 2,574,208 | | | | 2,122,310 | | | | 1,671,987 | | | | 1,251,676 | | | | 972,305 | | | | 867,763 | | | | 722,553 | | | | 727,826 | | | | 500,547 | | | | 319,313 | | | | 310,886 | | | | 313,985 | |
Grade D | | | 2,723,486 | | | | 2,585,059 | | | | 1,879,307 | | | | 1,282,636 | | | | 852,728 | | | | 694,218 | | | | 652,686 | | | | 587,904 | | | | 377,842 | | | | 327,527 | | | | 422,338 | | | | 311,480 | |
Grade E | | | 1,921,466 | | | | 1,467,947 | | | | 1,607,602 | | | | 963,260 | | | | 853,769 | | | | 631,853 | | | | 553,774 | | | | 470,002 | | | | 289,469 | | | | 241,649 | | | | 203,713 | | | | 65,020 | |
Grade F | | | 1,261,300 | | | | 992,258 | | | | 1,029,190 | | | | 606,623 | | | | 736,042 | | | | 220,482 | | | | 371,949 | | | | 288,267 | | | | 63,786 | | | | 131,729 | | | | 72,513 | | | | 84,680 | |
Grade G | | | 440,194 | | | | 416,530 | | | | 273,210 | | | | 231,765 | | | | 169,759 | | | | 88,617 | | | | 236,744 | | | | 106,071 | | | | 52,691 | | | | 62,446 | | | | 41,035 | | | | 46,429 | |
|
| Delinquent Rate (4) | |
| | | | | | | | | | | | |
| | | 2013-Q3 | | | 2013-Q2 | | | 2013-Q1 | | | 2012-Q4 | | | 2012-Q3 | | | 2012-Q2 | | | 2012-Q1 | | | 2011-Q4 | | | 2011-Q3 | | | 2011-Q2 | | | 2011-Q1 | | | 2010-Q4 | |
Total | | | 1.41% | | | | 1.25% | | | | 1.40% | | | | 1.59% | | | | 1.56% | | | | 1.59% | | | | 1.48% | | | | 1.94% | | | | 2.26% | | | | 2.01% | | | | 2.25% | | | | 2.59% | |
Grade A | | | 0.51% | | | | 0.52% | | | | 0.59% | | | | 0.65% | | | | 0.59% | | | | 0.56% | | | | 0.33% | | | | 0.63% | | | | 0.60% | | | | 0.53% | | | | 0.55% | | | | 0.60% | |
Grade B | | | 0.95% | | | | 0.84% | | | | 0.87% | | | | 0.95% | | | | 1.01% | | | | 1.06% | | | | 1.18% | | | | 1.28% | | | | 1.54% | | | | 1.38% | | | | 1.99% | | | | 2.16% | |
Grade C | | | 1.22% | | | | 1.02% | | | | 1.19% | | | | 1.50% | | | | 1.62% | | | | 1.45% | | | | 1.65% | | | | 2.03% | | | | 2.54% | | | | 2.41% | | | | 2.39% | | | | 2.60% | |
Grade D | | | 2.16% | | | | 1.98% | | | | 2.34% | | | | 2.25% | | | | 2.19% | | | | 2.21% | | | | 2.17% | | | | 3.06% | | | | 3.42% | | | | 3.03% | | | | 3.40% | | | | 3.84% | |
Grade E | | | 2.59% | | | | 2.06% | | | | 2.35% | | | | 2.70% | | | | 2.46% | | | | 2.45% | | | | 2.45% | | | | 2.78% | | | | 3.17% | | | | 3.20% | | | | 2.99% | | | | 4.20% | |
Grade F | | | 2.83% | | | | 2.96% | | | | 3.11% | | | | 3.61% | | | | 3.29% | | | | 4.58% | | | | 2.40% | | | | 3.71% | | | | 4.35% | | | | 2.86% | | | | 4.09% | | | | 5.27% | |
Grade G | | | 2.69% | | | | 3.89% | | | | 5.97% | | | | 4.67% | | | | 4.88% | | | | 4.54% | | | | 3.79% | | | | 5.66% | | | | 6.41% | | | | 3.57% | | | | 3.18% | | | | 4.70% | |
|
| Annualized Charge-off Rate (5) | |
| | | | | | | | | | | | |
| | | 2013-Q3 | | | 2013-Q2 | | | 2013-Q1 | | | 2012-Q4 | | | 2012-Q3 | | | 2012-Q2 | | | 2012-Q1 | | | 2011-Q4 | | | 2011-Q3 | | | 2011-Q2 | | | 2011-Q1 | | | 2010-Q4 | |
Total | | | 2.86% | | | | 3.08% | | | | 3.38% | | | | 3.04% | | | | 3.17% | | | | 2.88% | | | | 3.62% | | | | 3.84% | | | | 2.89% | | | | 3.34% | | | | 3.50% | | | | 3.53% | |
Grade A | | | 1.47% | | | | 1.72% | | | | 1.56% | | | | 1.58% | | | | 1.33% | | | | 0.58% | | | | 1.22% | | | | 1.11% | | | | 0.95% | | | | 1.02% | | | | 0.42% | | | | 1.07% | |
Grade B | | | 2.08% | | | | 2.07% | | | | 2.23% | | | | 2.10% | | | | 2.03% | | | | 2.07% | | | | 2.22% | | | | 2.55% | | | | 2.12% | | | | 3.45% | | | | 3.03% | | | | 3.07% | |
Grade C | | | 2.18% | | | | 2.42% | | | | 2.64% | | | | 2.95% | | | | 3.16% | | | | 3.87% | | | | 4.11% | | | | 5.04% | | | | 4.22% | | | | 3.20% | | | | 3.72% | | | | 4.25% | |
Grade D | | | 4.36% | | | | 5.17% | | | | 4.89% | | | | 4.02% | | | | 3.61% | | | | 4.11% | | | | 4.86% | | | | 5.28% | | | | 4.04% | | | | 4.14% | | | | 6.42% | | | | 5.59% | |
Grade E | | | 4.62% | | | | 4.52% | | | | 6.47% | | | | 4.47% | | | | 5.20% | | | | 5.00% | | | | 5.37% | | | | 5.49% | | | | 4.32% | | | | 4.48% | | | | 4.88% | | | | 2.15% | |
Grade F | | | 5.71% | | | | 5.97% | | | | 8.83% | | | | 6.00% | | | | 9.54% | | | | 3.72% | | | | 8.14% | | | | 7.35% | | | | 2.09% | | | | 5.34% | | | | 3.93% | | | | 7.28% | |
Grade G | | | 9.02% | | | | 12.06% | | | | 11.21% | | | | 9.65% | | | | 8.27% | | | | 5.26% | | | | 15.83% | | | | 7.63% | | | | 4.44% | | | | 5.91% | | | | 4.75% | | | | 7.26% | |
| 1) | Principal balance at quarter-end. |
| 2) | Principal balance as of quarter-end for loans that are “Late 30-120” or in Default status at quarter-end. |
| 3) | Principal balance charged off during the quarter. |
| 4) | Principal balance at quarter-end for loans that are “Late 30-120” or in Default status at quarter-end divided by Principal balance at quarter-end. |
| 5) | Principal balance charged off during the quarter multiplied by four then divided by Principal balance at quarter-end. |
34
The following table presents dollars collected on delinquent loans and recoveries received on charged-off loans (which include collection recoveries on charged-off loans and proceeds from the sale of charged-off loans), in any given quarter. This information excludes loans that we classified as identity theft. In cases of verified identity theft, we write-off the loan and pay the holder of the related Notes or Certificates an amount equal to the unpaid principal balances due on the Notes less any applicable servicing fees.
Dollars Collected From Delinquent Loans (1)
| | | | | | | | | | | | | | | | | | | | | | | | | | | | | | | | | | | | | | | | | | | | | | | | |
| | | 2013-Q3 | | | 2013-Q2 | | | 2013-Q1 | | | 2012-Q4 | | | 2012-Q3 | | | 2012-Q2 | | | 2012-Q1 | | | 2011-Q4 | | | 2011-Q3 | | | 2011-Q2 | | | 2011-Q1 | | | 2010-Q4 | |
Total | | $ | 1,205,268 | | | $ | 942,995 | | | $ | 1,029,297 | | | $ | 739,462 | | | $ | 652,039 | | | $ | 507,211 | | | $ | 680,986 | | | $ | 532,827 | | | $ | 424,017 | | | $ | 342,323 | | | $ | 360,570 | | | $ | 386,737 | |
Grade A | | | 80,834 | | | | 66,387 | | | | 96,335 | | | | 65,755 | | | | 44,749 | | | | 44,220 | | | | 39,668 | | | | 30,111 | | | | 38,300 | | | | 17,429 | | | | 23,810 | | | | 10,337 | |
Grade B | | | 244,118 | | | | 159,187 | | | | 236,565 | | | | 150,778 | | | | 160,700 | | | | 128,276 | | | | 143,189 | | | | 108,863 | | | | 78,490 | | | | 73,769 | | | | 80,299 | | | | 102,006 | |
Grade C | | | 241,163 | | | | 227,713 | | | | 188,263 | | | | 154,334 | | | | 105,295 | | | | 77,107 | | | | 170,695 | | | | 148,714 | | | | 102,996 | | | | 94,162 | | | | 99,284 | | | | 87,443 | |
Grade D | | | 290,585 | | | | 187,328 | | | | 191,224 | | | | 156,524 | | | | 139,382 | | | | 105,488 | | | | 137,298 | | | | 121,470 | | | | 105,590 | | | | 80,008 | | | | 70,315 | | | | 74,947 | |
Grade E | | | 184,173 | | | | 168,219 | | | | 136,542 | | | | 121,224 | | | | 105,764 | | | | 77,000 | | | | 135,629 | | | | 74,396 | | | | 57,604 | | | | 39,829 | | | | 39,561 | | | | 67,684 | |
Grade F | | | 140,889 | | | | 70,430 | | | | 110,949 | | | | 51,239 | | | | 61,677 | | | | 61,331 | | | | 33,056 | | | | 26,824 | | | | 26,545 | | | | 22,294 | | | | 19,886 | | | | 28,528 | |
Grade G | | | 23,506 | | | | 63,731 | | | | 69,419 | | | | 39,608 | | | | 34,472 | | | | 13,789 | | | | 21,451 | | | | 22,449 | | | | 14,492 | | | | 14,832 | | | | 27,415 | | | | 15,792 | |
Recoveries (2)
| | | | | | | | | | | | | | | | | | | | | | | | | | | | | | | | | | | | | | | | | | | | | | | | |
| | | 2013-Q3 | | | 2013-Q2 | | | 2013-Q1 | | | 2012-Q4 | | | 2012-Q3 | | | 2012-Q2 | | | 2012-Q1 | | | 2011-Q4 | | | 2011-Q3 | | | 2011-Q2 | | | 2011-Q1 | | | 2010-Q4 | |
Total | | $ | 463,035 | | | $ | 460,127 | | | $ | 549,061 | | | $ | 104,885 | | | $ | 78,283 | | | $ | 383,403 | | | $ | 88,771 | | | $ | 36,163 | | | $ | 91,431 | | | $ | 52,137 | | | $ | 46,898 | | | $ | 33,518 | |
Grade A | | | 30,391 | | | | 35,150 | | | | 39,526 | | | | 8,989 | | | | 7,919 | | | | 15,345 | | | | 2,752 | | | | 2,575 | | | | 18,818 | | | | — | | | | 7,894 | | | | 8,016 | |
Grade B | | | 82,742 | | | | 66,124 | | | | 120,147 | | | | 9,856 | | | | 2,282 | | | | 76,198 | | | | 10,265 | | | | 5,777 | | | | 5,503 | | | | 6,580 | | | | 12,395 | | | | 5,628 | |
Grade C | | | 89,982 | | | | 101,307 | | | | 106,854 | | | | 39,125 | | | | 27,206 | | | | 84,423 | | | | 22,392 | | | | 10,170 | | | | 23,323 | | | | 21,817 | | | | 9,829 | | | | 6,712 | |
Grade D | | | 104,636 | | | | 103,187 | | | | 112,834 | | | | 10,645 | | | | 13,875 | | | | 109,490 | | | | 14,959 | | | | 5,801 | | | | 15,047 | | | | 8,572 | | | | 10,023 | | | | 3,728 | |
Grade E | | | 87,642 | | | | 76,261 | | | | 87,943 | | | | 14,051 | | | | 13,189 | | | | 53,773 | | | | 12,076 | | | | 4,321 | | | | 2,777 | | | | 632 | | | | 3,566 | | | | 3,138 | |
Grade F | | | 46,776 | | | | 58,489 | | | | 57,885 | | | | 8,166 | | | | 2,006 | | | | 23,765 | | | | 17,830 | | | | 4,519 | | | | 22,784 | | | | 12,186 | | | | 3,091 | | | | 6,296 | |
Grade G | | | 20,866 | | | | 19,609 | | | | 23,872 | | | | 14,053 | | | | 11,806 | | | | 20,409 | | | | 8,497 | | | | 3,000 | | | | 3,179 | | | | 2,350 | | | | 100 | | | | — | |
| 1) | Dollars collected during the quarter for loans that are in “Late 30-120” or in Default status. |
| 2) | Total payments received from borrowers of charged-off loans and proceeds from sale of charged-off loans. |
35
Cumulative Charge-off Rate
The graph and corresponding table below shows the cumulative net lifetime charge-offs by LendingClub grades for Member Loans by annual vintage booked from January 1, 2008 through September 30, 2013, as a percentage of the aggregate principal amount of originations. The charge-offs are tracked by annual vintage, meaning each line represents all loans originated in that year.
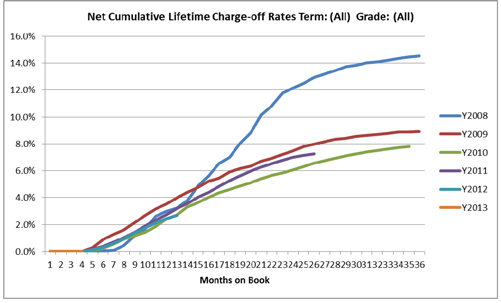
| | | | | | | | | | | | | | | | | | | | | | | | |
| | | Cumulative Charge-off Rate by Booking Year | |
Mo # | | Y2008 | | | Y2009 | | | Y2010 | | | Y2011 | | | Y2012 | | | Y2013 | |
| 1 | | | 0.0 | % | | | 0.0 | % | | | 0.0 | % | | | 0.0 | % | | | 0.0 | % | | | 0.0 | % |
| 2 | | | 0.0 | % | | | 0.0 | % | | | 0.0 | % | | | 0.0 | % | | | 0.0 | % | | | 0.0 | % |
| 3 | | | 0.0 | % | | | 0.0 | % | | | 0.0 | % | | | 0.0 | % | | | 0.0 | % | | | 0.0 | % |
| 4 | | | 0.0 | % | | | 0.0 | % | | | 0.0 | % | | | 0.0 | % | | | 0.0 | % | | | 0.0 | % |
| 5 | | | 0.0 | % | | | 0.3 | % | | | 0.1 | % | | | 0.2 | % | | | 0.1 | % | | | | |
| 6 | | | 0.0 | % | | | 0.9 | % | | | 0.2 | % | | | 0.4 | % | | | 0.3 | % | | | | |
| 7 | | | 0.1 | % | | | 1.3 | % | | | 0.6 | % | | | 0.7 | % | | | 0.6 | % | | | | |
| 8 | | | 0.4 | % | | | 1.6 | % | | | 0.9 | % | | | 1.0 | % | | | 1.0 | % | | | | |
| 9 | | | 1.2 | % | | | 2.2 | % | | | 1.2 | % | | | 1.4 | % | | | 1.4 | % | | | | |
| 10 | | | 1.7 | % | | | 2.7 | % | | | 1.4 | % | | | 1.9 | % | | | 1.8 | % | | | | |
| 11 | | | 2.6 | % | | | 3.1 | % | | | 1.9 | % | | | 2.3 | % | | | 2.1 | % | | | | |
| 12 | | | 3.0 | % | | | 3.5 | % | | | 2.4 | % | | | 2.7 | % | | | 2.4 | % | | | | |
| 13 | | | 3.2 | % | | | 4.0 | % | | | 2.7 | % | | | 3.2 | % | | | 2.7 | % | | | | |
| 14 | | | 3.8 | % | | | 4.4 | % | | | 3.3 | % | | | 3.6 | % | | | | | | | | |
| 15 | | | 4.9 | % | | | 4.8 | % | | | 3.6 | % | | | 4.0 | % | | | | | | | | |
| 16 | | | 5.6 | % | | | 5.2 | % | | | 4.0 | % | | | 4.4 | % | | | | | | | | |
| 17 | | | 6.5 | % | | | 5.5 | % | | | 4.3 | % | | | 4.8 | % | | | | | | | | |
| 18 | | | 7.0 | % | | | 5.9 | % | | | 4.6 | % | | | 5.3 | % | | | | | | | | |
| 19 | | | 8.0 | % | | | 6.2 | % | | | 4.9 | % | | | 5.6 | % | | | | | | | | |
| 20 | | | 8.8 | % | | | 6.3 | % | | | 5.1 | % | | | 6.0 | % | | | | | | | | |
| 21 | | | 10.1 | % | | | 6.7 | % | | | 5.4 | % | | | 6.3 | % | | | | | | | | |
| 22 | | | 10.8 | % | | | 6.9 | % | | | 5.6 | % | | | 6.5 | % | | | | | | | | |
| 23 | | | 11.8 | % | | | 7.2 | % | | | 5.9 | % | | | 6.8 | % | | | | | | | | |
| 24 | | | 12.2 | % | | | 7.5 | % | | | 6.1 | % | | | 7.0 | % | | | | | | | | |
| 25 | | | 12.5 | % | | | 7.8 | % | | | 6.3 | % | | | 7.1 | % | | | | | | | | |
| 26 | | | 12.9 | % | | | 8.0 | % | | | 6.6 | % | | | 7.2 | % | | | | | | | | |
| 27 | | | 13.2 | % | | | 8.2 | % | | | 6.8 | % | | | | | | | | | | | | |
| 28 | | | 13.5 | % | | | 8.3 | % | | | 6.9 | % | | | | | | | | | | | | |
| 29 | | | 13.7 | % | | | 8.4 | % | | | 7.1 | % | | | | | | | | | | | | |
| 30 | | | 13.9 | % | | | 8.6 | % | | | 7.3 | % | | | | | | | | | | | | |
| 31 | | | 14.0 | % | | | 8.6 | % | | | 7.4 | % | | | | | | | | | | | | |
| 32 | | | 14.1 | % | | | 8.7 | % | | | 7.5 | % | | | | | | | | | | | | |
| 33 | | | 14.2 | % | | | 8.8 | % | | | 7.6 | % | | | | | | | | | | | | |
| 34 | | | 14.4 | % | | | 8.9 | % | | | 7.7 | % | | | | | | | | | | | | |
| 35 | | | 14.5 | % | | | 8.9 | % | | | 7.8 | % | | | | | | | | | | | | |
| 36 | | | 14.5 | % | | | 8.9 | % | | | | | | | | | | | | | | | | |
36
The graphs and corresponding tables below show cumulative net charge-offs for Member Loans as a percentage of the aggregate principal amount of originations for each LendingClub grade (A-G) presented by annual vintage from January 1, 2008 to September 30, 2013.
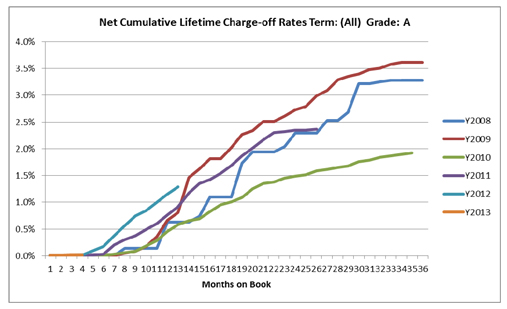
| | | | | | | | | | | | | | | | | | | | | | | | |
| | | Cumulative Charge-off Rate by Booking Year | |
Mo # | | Y2008 | | | Y2009 | | | Y2010 | | | Y2011 | | | Y2012 | | | Y2013 | |
| 1 | | | 0.0 | % | | | 0.0 | % | | | 0.0 | % | | | 0.0 | % | | | 0.0 | % | | | 0.0 | % |
| 2 | | | 0.0 | % | | | 0.0 | % | | | 0.0 | % | | | 0.0 | % | | | 0.0 | % | | | 0.0 | % |
| 3 | | | 0.0 | % | | | 0.0 | % | | | 0.0 | % | | | 0.0 | % | | | 0.0 | % | | | 0.0 | % |
| 4 | | | 0.0 | % | | | 0.0 | % | | | 0.0 | % | | | 0.0 | % | | | 0.0 | % | | | 0.0 | % |
| 5 | | | 0.0 | % | | | 0.0 | % | | | 0.0 | % | | | 0.0 | % | | | 0.1 | % | | | | |
| 6 | | | 0.0 | % | | | 0.0 | % | | | 0.0 | % | | | 0.0 | % | | | 0.2 | % | | | | |
| 7 | | | 0.0 | % | | | 0.0 | % | | | 0.0 | % | | | 0.2 | % | | | 0.4 | % | | | | |
| 8 | | | 0.1 | % | | | 0.1 | % | | | 0.1 | % | | | 0.3 | % | | | 0.6 | % | | | | |
| 9 | | | 0.1 | % | | | 0.1 | % | | | 0.1 | % | | | 0.4 | % | | | 0.7 | % | | | | |
| 10 | | | 0.1 | % | | | 0.2 | % | | | 0.2 | % | | | 0.5 | % | | | 0.8 | % | | | | |
| 11 | | | 0.1 | % | | | 0.4 | % | | | 0.3 | % | | | 0.6 | % | | | 1.0 | % | | | | |
| 12 | | | 0.6 | % | | | 0.7 | % | | | 0.5 | % | | | 0.8 | % | | | 1.1 | % | | | | |
| 13 | | | 0.6 | % | | | 0.8 | % | | | 0.6 | % | | | 0.9 | % | | | 1.3 | % | | | | |
| 14 | | | 0.6 | % | | | 1.5 | % | | | 0.7 | % | | | 1.2 | % | | | | | | | | |
| 15 | | | 0.7 | % | | | 1.6 | % | | | 0.7 | % | | | 1.3 | % | | | | | | | | |
| 16 | | | 1.1 | % | | | 1.8 | % | | | 0.8 | % | | | 1.4 | % | | | | | | | | |
| 17 | | | 1.1 | % | | | 1.8 | % | | | 1.0 | % | | | 1.5 | % | | | | | | | | |
| 18 | | | 1.1 | % | | | 2.0 | % | | | 1.0 | % | | | 1.7 | % | | | | | | | | |
| 19 | | | 1.7 | % | | | 2.3 | % | | | 1.1 | % | | | 1.9 | % | | | | | | | | |
| 20 | | | 1.9 | % | | | 2.3 | % | | | 1.3 | % | | | 2.0 | % | | | | | | | | |
| 21 | | | 1.9 | % | | | 2.5 | % | | | 1.4 | % | | | 2.2 | % | | | | | | | | |
| 22 | | | 1.9 | % | | | 2.5 | % | | | 1.4 | % | | | 2.3 | % | | | | | | | | |
| 23 | | | 2.0 | % | | | 2.6 | % | | | 1.5 | % | | | 2.3 | % | | | | | | | | |
| 24 | | | 2.3 | % | | | 2.7 | % | | | 1.5 | % | | | 2.3 | % | | | | | | | | |
| 25 | | | 2.3 | % | | | 2.8 | % | | | 1.5 | % | | | 2.4 | % | | | | | | | | |
| 26 | | | 2.3 | % | | | 3.0 | % | | | 1.6 | % | | | 2.4 | % | | | | | | | | |
| 27 | | | 2.5 | % | | | 3.1 | % | | | 1.6 | % | | | | | | | | | | | | |
| 28 | | | 2.5 | % | | | 3.3 | % | | | 1.6 | % | | | | | | | | | | | | |
| 29 | | | 2.7 | % | | | 3.4 | % | | | 1.7 | % | | | | | | | | | | | | |
| 30 | | | 3.2 | % | | | 3.4 | % | | | 1.8 | % | | | | | | | | | | | | |
| 31 | | | 3.2 | % | | | 3.5 | % | | | 1.8 | % | | | | | | | | | | | | |
| 32 | | | 3.2 | % | | | 3.5 | % | | | 1.8 | % | | | | | | | | | | | | |
| 33 | | | 3.3 | % | | | 3.6 | % | | | 1.9 | % | | | | | | | | | | | | |
| 34 | | | 3.3 | % | | | 3.6 | % | | | 1.9 | % | | | | | | | | | | | | |
| 35 | | | 3.3 | % | | | 3.6 | % | | | 1.9 | % | | | | | | | | | | | | |
| 36 | | | 3.3 | % | | | 3.6 | % | | | | | | | | | | | | | | | | |
37
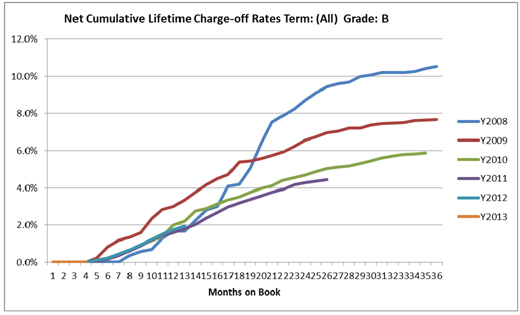
| | | | | | | | | | | | | | | | | | | | | | | | |
| | | Cumulative Charge-off Rate by Booking Year | |
Mo # | | Y2008 | | | Y2009 | | | Y2010 | | | Y2011 | | | Y2012 | | | Y2013 | |
| 1 | | | 0.0 | % | | | 0.0 | % | | | 0.0 | % | | | 0.0 | % | | | 0.0 | % | | | 0.0 | % |
| 2 | | | 0.0 | % | | | 0.0 | % | | | 0.0 | % | | | 0.0 | % | | | 0.0 | % | | | 0.0 | % |
| 3 | | | 0.0 | % | | | 0.0 | % | | | 0.0 | % | | | 0.0 | % | | | 0.0 | % | | | 0.0 | % |
| 4 | | | 0.0 | % | | | 0.0 | % | | | 0.0 | % | | | 0.0 | % | | | 0.0 | % | | | 0.0 | % |
| 5 | | | 0.0 | % | | | 0.2 | % | | | 0.1 | % | | | 0.0 | % | | | 0.1 | % | | | | |
| 6 | | | 0.0 | % | | | 0.8 | % | | | 0.2 | % | | | 0.2 | % | | | 0.2 | % | | | | |
| 7 | | | 0.0 | % | | | 1.2 | % | | | 0.4 | % | | | 0.4 | % | | | 0.4 | % | | | | |
| 8 | | | 0.4 | % | | | 1.3 | % | | | 0.6 | % | | | 0.6 | % | | | 0.7 | % | | | | |
| 9 | | | 0.6 | % | | | 1.6 | % | | | 0.9 | % | | | 0.9 | % | | | 0.9 | % | | | | |
| 10 | | | 0.7 | % | | | 2.4 | % | | | 1.2 | % | | | 1.2 | % | | | 1.2 | % | | | | |
| 11 | | | 1.3 | % | | | 2.8 | % | | | 1.4 | % | | | 1.4 | % | | | 1.5 | % | | | | |
| 12 | | | 1.7 | % | | | 3.0 | % | | | 2.0 | % | | | 1.6 | % | | | 1.8 | % | | | | |
| 13 | | | 1.7 | % | | | 3.3 | % | | | 2.2 | % | | | 1.8 | % | | | 1.9 | % | | | | |
| 14 | | | 2.2 | % | | | 3.8 | % | | | 2.8 | % | | | 2.0 | % | | | | | | | | |
| 15 | | | 2.8 | % | | | 4.2 | % | | | 2.9 | % | | | 2.4 | % | | | | | | | | |
| 16 | | | 3.0 | % | | | 4.5 | % | | | 3.1 | % | | | 2.7 | % | | | | | | | | |
| 17 | | | 4.1 | % | | | 4.7 | % | | | 3.3 | % | | | 3.0 | % | | | | | | | | |
| 18 | | | 4.2 | % | | | 5.4 | % | | | 3.5 | % | | | 3.2 | % | | | | | | | | |
| 19 | | | 5.1 | % | | | 5.4 | % | | | 3.8 | % | | | 3.4 | % | | | | | | | | |
| 20 | | | 6.4 | % | | | 5.6 | % | | | 4.0 | % | | | 3.6 | % | | | | | | | | |
| 21 | | | 7.5 | % | | | 5.7 | % | | | 4.1 | % | | | 3.8 | % | | | | | | | | |
| 22 | | | 7.9 | % | | | 5.9 | % | | | 4.4 | % | | | 3.9 | % | | | | | | | | |
| 23 | | | 8.2 | % | | | 6.2 | % | | | 4.5 | % | | | 4.2 | % | | | | | | | | |
| 24 | | | 8.7 | % | | | 6.6 | % | | | 4.7 | % | | | 4.3 | % | | | | | | | | |
| 25 | | | 9.1 | % | | | 6.7 | % | | | 4.9 | % | | | 4.4 | % | | | | | | | | |
| 26 | | | 9.4 | % | | | 7.0 | % | | | 5.0 | % | | | 4.4 | % | | | | | | | | |
| 27 | | | 9.6 | % | | | 7.0 | % | | | 5.1 | % | | | | | | | | | | | | |
| 28 | | | 9.7 | % | | | 7.2 | % | | | 5.2 | % | | | | | | | | | | | | |
| 29 | | | 10.0 | % | | | 7.2 | % | | | 5.3 | % | | | | | | | | | | | | |
| 30 | | | 10.0 | % | | | 7.4 | % | | | 5.4 | % | | | | | | | | | | | | |
| 31 | | | 10.2 | % | | | 7.4 | % | | | 5.6 | % | | | | | | | | | | | | |
| 32 | | | 10.2 | % | | | 7.5 | % | | | 5.7 | % | | | | | | | | | | | | |
| 33 | | | 10.2 | % | | | 7.5 | % | | | 5.8 | % | | | | | | | | | | | | |
| 34 | | | 10.2 | % | | | 7.6 | % | | | 5.8 | % | | | | | | | | | | | | |
| 35 | | | 10.4 | % | | | 7.6 | % | | | 5.9 | % | | | | | | | | | | | | |
| 36 | | | 10.5 | % | | | 7.7 | % | | | | | | | | | | | | | | | | |
38
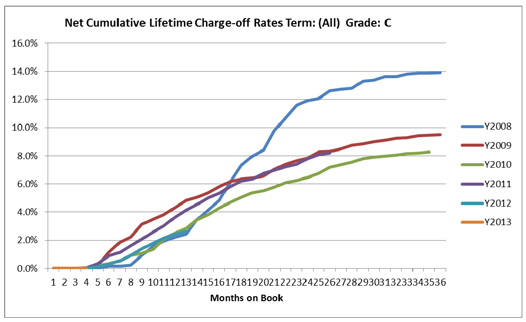
| | | | | | | | | | | | | | | | | | | | | | | | |
| | | Cumulative Charge-off Rate by Booking Year | |
Mo # | | Y2008 | | | Y2009 | | | Y2010 | | | Y2011 | | | Y2012 | | | Y2013 | |
| 1 | | | 0.0 | % | | | 0.0 | % | | | 0.0 | % | | | 0.0 | % | | | 0.0 | % | | | 0.0 | % |
| 2 | | | 0.0 | % | | | 0.0 | % | | | 0.0 | % | | | 0.0 | % | | | 0.0 | % | | | 0.0 | % |
| 3 | | | 0.0 | % | | | 0.0 | % | | | 0.0 | % | | | 0.0 | % | | | 0.0 | % | | | 0.0 | % |
| 4 | | | 0.0 | % | | | 0.0 | % | | | 0.0 | % | | | 0.0 | % | | | 0.0 | % | | | 0.0 | % |
| 5 | | | 0.0 | % | | | 0.2 | % | | | 0.2 | % | | | 0.3 | % | | | 0.1 | % | | | | |
| 6 | | | 0.2 | % | | | 1.1 | % | | | 0.3 | % | | | 0.9 | % | | | 0.3 | % | | | | |
| 7 | | | 0.2 | % | | | 1.9 | % | | | 0.5 | % | | | 1.1 | % | | | 0.6 | % | | | | |
| 8 | | | 0.2 | % | | | 2.2 | % | | | 0.9 | % | | | 1.6 | % | | | 0.9 | % | | | | |
| 9 | | | 0.9 | % | | | 3.1 | % | | | 1.1 | % | | | 2.1 | % | | | 1.4 | % | | | | |
| 10 | | | 1.6 | % | | | 3.5 | % | | | 1.4 | % | | | 2.6 | % | | | 1.8 | % | | | | |
| 11 | | | 1.9 | % | | | 3.8 | % | | | 2.1 | % | | | 3.0 | % | | | 2.1 | % | | | | |
| 12 | | | 2.2 | % | | | 4.3 | % | | | 2.5 | % | | | 3.6 | % | | | 2.4 | % | | | | |
| 13 | | | 2.4 | % | | | 4.8 | % | | | 2.8 | % | | | 4.1 | % | | | 2.6 | % | | | | |
| 14 | | | 3.5 | % | | | 5.0 | % | | | 3.4 | % | | | 4.6 | % | | | | | | | | |
| 15 | | | 4.1 | % | | | 5.4 | % | | | 3.8 | % | | | 5.0 | % | | | | | | | | |
| 16 | | | 4.8 | % | | | 5.8 | % | | | 4.3 | % | | | 5.3 | % | | | | | | | | |
| 17 | | | 6.1 | % | | | 6.2 | % | | | 4.7 | % | | | 5.8 | % | | | | | | | | |
| 18 | | | 7.3 | % | | | 6.3 | % | | | 5.1 | % | | | 6.2 | % | | | | | | | | |
| 19 | | | 8.0 | % | | | 6.4 | % | | | 5.4 | % | | | 6.4 | % | | | | | | | | |
| 20 | | | 8.4 | % | | | 6.6 | % | | | 5.5 | % | | | 6.7 | % | | | | | | | | |
| 21 | | | 9.8 | % | | | 7.0 | % | | | 5.8 | % | | | 7.0 | % | | | | | | | | |
| 22 | | | 10.7 | % | | | 7.4 | % | | | 6.1 | % | | | 7.2 | % | | | | | | | | |
| 23 | | | 11.6 | % | | | 7.6 | % | | | 6.2 | % | | | 7.4 | % | | | | | | | | |
| 24 | | | 11.9 | % | | | 7.8 | % | | | 6.4 | % | | | 7.8 | % | | | | | | | | |
| 25 | | | 12.1 | % | | | 8.3 | % | | | 6.7 | % | | | 8.1 | % | | | | | | | | |
| 26 | | | 12.6 | % | | | 8.3 | % | | | 7.2 | % | | | 8.2 | % | | | | | | | | |
| 27 | | | 12.7 | % | | | 8.5 | % | | | 7.4 | % | | | | | | | | | | | | |
| 28 | | | 12.8 | % | | | 8.7 | % | | | 7.5 | % | | | | | | | | | | | | |
| 29 | | | 13.3 | % | | | 8.8 | % | | | 7.8 | % | | | | | | | | | | | | |
| 30 | | | 13.4 | % | | | 9.0 | % | | | 7.9 | % | | | | | | | | | | | | |
| 31 | | | 13.6 | % | | | 9.1 | % | | | 8.0 | % | | | | | | | | | | | | |
| 32 | | | 13.6 | % | | | 9.2 | % | | | 8.0 | % | | | | | | | | | | | | |
| 33 | | | 13.8 | % | | | 9.3 | % | | | 8.1 | % | | | | | | | | | | | | |
| 34 | | | 13.9 | % | | | 9.4 | % | | | 8.2 | % | | | | | | | | | | | | |
| 35 | | | 13.9 | % | | | 9.5 | % | | | 8.3 | % | | | | | | | | | | | | |
| 36 | | | 13.9 | % | | | 9.5 | % | | | | | | | | | | | | | | | | |
39
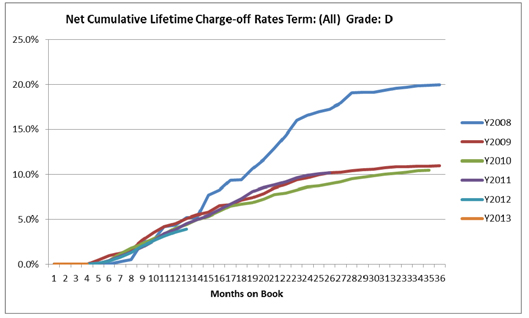
| | | | | | | | | | | | | | | | | | | | | | | | |
| | | Cumulative Charge-off Rate by Booking Year | |
Mo # | | Y2008 | | | Y2009 | | | Y2010 | | | Y2011 | | | Y2012 | | | Y2013 | |
| 1 | | | 0.0 | % | | | 0.0 | % | | | 0.0 | % | | | 0.0 | % | | | 0.0 | % | | | 0.0 | % |
| 2 | | | 0.0 | % | | | 0.0 | % | | | 0.0 | % | | | 0.0 | % | | | 0.0 | % | | | 0.0 | % |
| 3 | | | 0.0 | % | | | 0.0 | % | | | 0.0 | % | | | 0.0 | % | | | 0.0 | % | | | 0.0 | % |
| 4 | | | 0.0 | % | | | 0.0 | % | | | 0.0 | % | | | 0.0 | % | | | 0.0 | % | | | 0.0 | % |
| 5 | | | 0.0 | % | | | 0.5 | % | | | 0.1 | % | | | 0.1 | % | | | 0.1 | % | | | | |
| 6 | | | 0.0 | % | | | 1.0 | % | | | 0.4 | % | | | 0.4 | % | | | 0.4 | % | | | | |
| 7 | | | 0.3 | % | | | 1.3 | % | | | 1.2 | % | | | 0.9 | % | | | 0.8 | % | | | | |
| 8 | | | 0.6 | % | | | 1.6 | % | | | 1.9 | % | | | 1.4 | % | | | 1.3 | % | | | | |
| 9 | | | 2.4 | % | | | 2.7 | % | | | 2.3 | % | | | 1.9 | % | | | 2.1 | % | | | | |
| 10 | | | 2.7 | % | | | 3.5 | % | | | 2.9 | % | | | 2.6 | % | | | 2.6 | % | | | | |
| 11 | | | 4.2 | % | | | 4.2 | % | | | 3.3 | % | | | 3.4 | % | | | 3.1 | % | | | | |
| 12 | | | 4.4 | % | | | 4.5 | % | | | 4.0 | % | | | 3.9 | % | | | 3.6 | % | | | | |
| 13 | | | 5.2 | % | | | 5.1 | % | | | 4.4 | % | | | 4.5 | % | | | 4.0 | % | | | | |
| 14 | | | 5.2 | % | | | 5.5 | % | | | 5.0 | % | | | 5.0 | % | | | | | | | | |
| 15 | | | 7.7 | % | | | 5.8 | % | | | 5.3 | % | | | 5.5 | % | | | | | | | | |
| 16 | | | 8.3 | % | | | 6.5 | % | | | 5.9 | % | | | 6.1 | % | | | | | | | | |
| 17 | | | 9.3 | % | | | 6.6 | % | | | 6.5 | % | | | 6.7 | % | | | | | | | | |
| 18 | | | 9.4 | % | | | 7.2 | % | | | 6.7 | % | | | 7.3 | % | | | | | | | | |
| 19 | | | 10.7 | % | | | 7.4 | % | | | 6.9 | % | | | 8.1 | % | | | | | | | | |
| 20 | | | 11.7 | % | | | 7.9 | % | | | 7.3 | % | | | 8.5 | % | | | | | | | | |
| 21 | | | 12.9 | % | | | 8.5 | % | | | 7.8 | % | | | 8.9 | % | | | | | | | | |
| 22 | | | 14.3 | % | | | 8.9 | % | | | 7.9 | % | | | 9.2 | % | | | | | | | | |
| 23 | | | 16.0 | % | | | 9.4 | % | | | 8.3 | % | | | 9.6 | % | | | | | | | | |
| 24 | | | 16.6 | % | | | 9.7 | % | | | 8.6 | % | | | 9.9 | % | | | | | | | | |
| 25 | | | 17.0 | % | | | 10.0 | % | | | 8.7 | % | | | 10.1 | % | | | | | | | | |
| 26 | | | 17.3 | % | | | 10.2 | % | | | 9.0 | % | | | 10.2 | % | | | | | | | | |
| 27 | | | 18.0 | % | | | 10.3 | % | | | 9.2 | % | | | | | | | | | | | | |
| 28 | | | 19.1 | % | | | 10.4 | % | | | 9.5 | % | | | | | | | | | | | | |
| 29 | | | 19.1 | % | | | 10.5 | % | | | 9.7 | % | | | | | | | | | | | | |
| 30 | | | 19.2 | % | | | 10.6 | % | | | 9.9 | % | | | | | | | | | | | | |
| 31 | | | 19.3 | % | | | 10.8 | % | | | 10.0 | % | | | | | | | | | | | | |
| 32 | | | 19.6 | % | | | 10.9 | % | | | 10.2 | % | | | | | | | | | | | | |
| 33 | | | 19.7 | % | | | 10.9 | % | | | 10.3 | % | | | | | | | | | | | | |
| 34 | | | 19.9 | % | | | 10.9 | % | | | 10.4 | % | | | | | | | | | | | | |
| 35 | | | 20.0 | % | | | 10.9 | % | | | 10.5 | % | | | | | | | | | | | | |
| 36 | | | 20.0 | % | | | 11.0 | % | | | | | | | | | | | | | | | | |
40
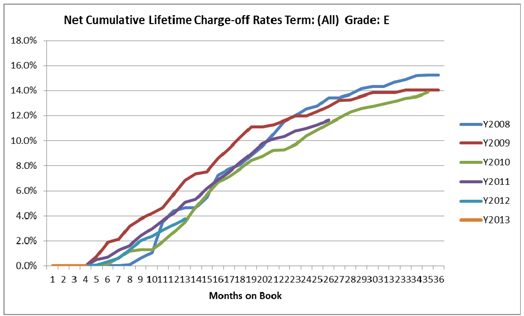
| | | | | | | | | | | | | | | | | | | | | | | | |
| | | Cumulative Charge-off Rate by Booking Year | |
Mo # | | Y2008 | | | Y2009 | | | Y2010 | | | Y2011 | | | Y2012 | | | Y2013 | |
| 1 | | | 0.0 | % | | | 0.0 | % | | | 0.0 | % | | | 0.0 | % | | | 0.0 | % | | | 0.0 | % |
| 2 | | | 0.0 | % | | | 0.0 | % | | | 0.0 | % | | | 0.0 | % | | | 0.0 | % | | | 0.0 | % |
| 3 | | | 0.0 | % | | | 0.0 | % | | | 0.0 | % | | | 0.0 | % | | | 0.0 | % | | | 0.0 | % |
| 4 | | | 0.0 | % | | | 0.0 | % | | | 0.0 | % | | | 0.0 | % | | | 0.0 | % | | | 0.0 | % |
| 5 | | | 0.0 | % | | | 0.7 | % | | | 0.1 | % | | | 0.5 | % | | | 0.1 | % | | | | |
| 6 | | | 0.0 | % | | | 1.9 | % | | | 0.1 | % | | | 0.7 | % | | | 0.3 | % | | | | |
| 7 | | | 0.0 | % | | | 2.1 | % | | | 0.7 | % | | | 1.3 | % | | | 0.6 | % | | | | |
| 8 | | | 0.1 | % | | | 3.2 | % | | | 1.2 | % | | | 1.6 | % | | | 1.3 | % | | | | |
| 9 | | | 0.6 | % | | | 3.8 | % | | | 1.3 | % | | | 2.4 | % | | | 2.0 | % | | | | |
| 10 | | | 1.1 | % | | | 4.2 | % | | | 1.3 | % | | | 3.0 | % | | | 2.4 | % | | | | |
| 11 | | | 3.5 | % | | | 4.7 | % | | | 1.9 | % | | | 3.6 | % | | | 2.9 | % | | | | |
| 12 | | | 4.4 | % | | | 5.8 | % | | | 2.7 | % | | | 4.2 | % | | | 3.3 | % | | | | |
| 13 | | | 4.7 | % | | | 6.8 | % | | | 3.5 | % | | | 5.1 | % | | | 3.8 | % | | | | |
| 14 | | | 4.7 | % | | | 7.4 | % | | | 4.7 | % | | | 5.4 | % | | | | | | | | |
| 15 | | | 5.5 | % | | | 7.6 | % | | | 5.7 | % | | | 6.2 | % | | | | | | | | |
| 16 | | | 7.3 | % | | | 8.6 | % | | | 6.7 | % | | | 6.9 | % | | | | | | | | |
| 17 | | | 7.8 | % | | | 9.4 | % | | | 7.1 | % | | | 7.5 | % | | | | | | | | |
| 18 | | | 8.1 | % | | | 10.3 | % | | | 7.8 | % | | | 8.3 | % | | | | | | | | |
| 19 | | | 8.8 | % | | | 11.1 | % | | | 8.4 | % | | | 9.0 | % | | | | | | | | |
| 20 | | | 9.6 | % | | | 11.1 | % | | | 8.8 | % | | | 9.8 | % | | | | | | | | |
| 21 | | | 10.5 | % | | | 11.3 | % | | | 9.3 | % | | | 10.1 | % | | | | | | | | |
| 22 | | | 11.6 | % | | | 11.6 | % | | | 9.3 | % | | | 10.3 | % | | | | | | | | |
| 23 | | | 12.0 | % | | | 12.0 | % | | | 9.7 | % | | | 10.8 | % | | | | | | | | |
| 24 | | | 12.6 | % | | | 12.0 | % | | | 10.4 | % | | | 11.0 | % | | | | | | | | |
| 25 | | | 12.8 | % | | | 12.4 | % | | | 10.9 | % | | | 11.3 | % | | | | | | | | |
| 26 | | | 13.5 | % | | | 12.8 | % | | | 11.4 | % | | | 11.7 | % | | | | | | | | |
| 27 | | | 13.5 | % | | | 13.3 | % | | | 11.8 | % | | | | | | | | | | | | |
| 28 | | | 13.7 | % | | | 13.3 | % | | | 12.3 | % | | | | | | | | | | | | |
| 29 | | | 14.2 | % | | | 13.6 | % | | | 12.6 | % | | | | | | | | | | | | |
| 30 | | | 14.3 | % | | | 13.9 | % | | | 12.8 | % | | | | | | | | | | | | |
| 31 | | | 14.3 | % | | | 13.9 | % | | | 13.0 | % | | | | | | | | | | | | |
| 32 | | | 14.7 | % | | | 13.9 | % | | | 13.2 | % | | | | | | | | | | | | |
| 33 | | | 14.9 | % | | | 14.1 | % | | | 13.4 | % | | | | | | | | | | | | |
| 34 | | | 15.2 | % | | | 14.1 | % | | | 13.5 | % | | | | | | | | | | | | |
| 35 | | | 15.3 | % | | | 14.1 | % | | | 13.9 | % | | | | | | | | | | | | |
| 36 | | | 15.3 | % | | | 14.1 | % | | | | | | | | | | | | | | | | |
41
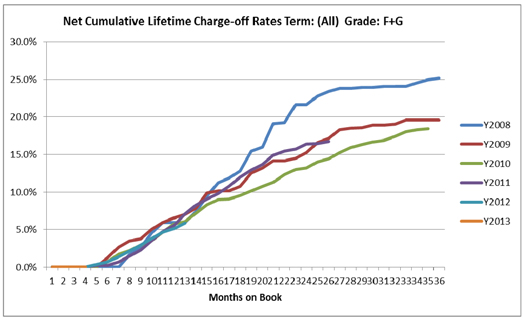
| | | | | | | | | | | | | | | | | | | | | | | | |
| | | Cumulative Charge-off Rate by Booking Year | |
Mo # | | Y2008 | | | Y2009 | | | Y2010 | | | Y2011 | | | Y2012 | | | Y2013 | |
| 1 | | | 0.0 | % | | | 0.0 | % | | | 0.0 | % | | | 0.0 | % | | | 0.0 | % | | | 0.0 | % |
| 2 | | | 0.0 | % | | | 0.0 | % | | | 0.0 | % | | | 0.0 | % | | | 0.0 | % | | | 0.0 | % |
| 3 | | | 0.0 | % | | | 0.0 | % | | | 0.0 | % | | | 0.0 | % | | | 0.0 | % | | | 0.0 | % |
| 4 | | | 0.0 | % | | | 0.0 | % | | | 0.0 | % | | | 0.0 | % | | | 0.1 | % | | | 0.0 | % |
| 5 | | | 0.0 | % | | | 0.0 | % | | | 0.1 | % | | | 0.2 | % | | | 0.4 | % | | | | |
| 6 | | | 0.0 | % | | | 1.2 | % | | | 0.7 | % | | | 0.2 | % | | | 0.7 | % | | | | |
| 7 | | | 0.0 | % | | | 2.7 | % | | | 1.7 | % | | | 0.7 | % | | | 1.4 | % | | | | |
| 8 | | | 1.6 | % | | | 3.5 | % | | | 2.2 | % | | | 1.4 | % | | | 2.1 | % | | | | |
| 9 | | | 2.6 | % | | | 3.8 | % | | | 3.0 | % | | | 2.3 | % | | | 2.9 | % | | | | |
| 10 | | | 4.6 | % | | | 5.1 | % | | | 3.6 | % | | | 3.5 | % | | | 3.8 | % | | | | |
| 11 | | | 6.0 | % | | | 5.9 | % | | | 4.6 | % | | | 4.7 | % | | | 4.6 | % | | | | |
| 12 | | | 6.0 | % | | | 6.6 | % | | | 5.7 | % | | | 5.5 | % | | | 5.1 | % | | | | |
| 13 | | | 5.9 | % | | | 7.0 | % | | | 6.1 | % | | | 7.1 | % | | | 5.9 | % | | | | |
| 14 | | | 7.3 | % | | | 7.8 | % | | | 7.2 | % | | | 8.2 | % | | | | | | | | |
| 15 | | | 9.4 | % | | | 9.9 | % | | | 8.3 | % | | | 9.1 | % | | | | | | | | |
| 16 | | | 11.2 | % | | | 10.2 | % | | | 9.0 | % | | | 9.8 | % | | | | | | | | |
| 17 | | | 11.8 | % | | | 10.2 | % | | | 9.1 | % | | | 10.7 | % | | | | | | | | |
| 18 | | | 12.8 | % | | | 10.7 | % | | | 9.5 | % | | | 12.0 | % | | | | | | | | |
| 19 | | | 15.5 | % | | | 12.5 | % | | | 10.2 | % | | | 12.9 | % | | | | | | | | |
| 20 | | | 16.0 | % | | | 13.2 | % | | | 10.8 | % | | | 13.7 | % | | | | | | | | |
| 21 | | | 19.1 | % | | | 14.1 | % | | | 11.3 | % | | | 14.9 | % | | | | | | | | |
| 22 | | | 19.2 | % | | | 14.1 | % | | | 12.3 | % | | | 15.4 | % | | | | | | | | |
| 23 | | | 21.6 | % | | | 14.5 | % | | | 13.0 | % | | | 15.7 | % | | | | | | | | |
| 24 | | | 21.6 | % | | | 15.2 | % | | | 13.2 | % | | | 16.4 | % | | | | | | | | |
| 25 | | | 22.8 | % | | | 16.6 | % | | | 14.0 | % | | | 16.4 | % | | | | | | | | |
| 26 | | | 23.4 | % | | | 17.1 | % | | | 14.4 | % | | | 16.7 | % | | | | | | | | |
| 27 | | | 23.8 | % | | | 18.3 | % | | | 15.2 | % | | | | | | | | | | | | |
| 28 | | | 23.8 | % | | | 18.5 | % | | | 15.9 | % | | | | | | | | | | | | |
| 29 | | | 23.9 | % | | | 18.6 | % | | | 16.3 | % | | | | | | | | | | | | |
| 30 | | | 23.9 | % | | | 18.9 | % | | | 16.7 | % | | | | | | | | | | | | |
| 31 | | | 24.1 | % | | | 18.9 | % | | | 16.9 | % | | | | | | | | | | | | |
| 32 | | | 24.1 | % | | | 19.0 | % | | | 17.4 | % | | | | | | | | | | | | |
| 33 | | | 24.1 | % | | | 19.6 | % | | | 18.0 | % | | | | | | | | | | | | |
| 34 | | | 24.5 | % | | | 19.6 | % | | | 18.3 | % | | | | | | | | | | | | |
| 35 | | | 25.0 | % | | | 19.6 | % | | | 18.4 | % | | | | | | | | | | | | |
| 36 | | | 25.1 | % | | | 19.6 | % | | | | | | | | | | | | | | | | |
42
Item 3. Quantitative and Qualitative Disclosures about Market Risk
Not applicable for smaller reporting companies.
Item 4. Changes in and Disagreements with Accountants on Accounting and Financial Disclosure
On September 5, 2013, Grant Thornton L.L.P. (“Grant Thornton”), the independent registered public accounting firm of LendingClub Corporation, was dismissed by the Company. We have engaged Deloitte & Touche L.L.P. (“Deloitte”) as our independent registered public accounting firm for our third quarter ended September 30, 2013 and fiscal year ended December 31, 2013. Our decision to dismiss Grant Thornton and to engage Deloitte was approved by the Audit Committee of the Company on September 5, 2013.
Item 5. Controls and Procedures
We have adopted and maintain disclosure controls and procedures that are designed to ensure that information required to be disclosed in our reports under the 1934 Act is recorded, processed, summarized and reported within the time periods specified in the SEC’s rules and forms and that the information is accumulated and communicated to our management, including our Chief Executive Officer and Chief Financial Officer, as appropriate, to allow for timely decisions regarding required disclosure. In designing and evaluating our disclosure controls and procedures, management recognizes that any controls and procedures, no matter how well designed and operated, can provide only reasonable assurance of achieving the desired control objectives, and we are required to apply our judgment in evaluating the cost-benefit relationship of possible controls and procedures.
As required by Rule 13a-15(b) of the 1934 Act, we carried out an evaluation, under the supervision and with the participation of management, including our Chief Executive Officer and Chief Financial Officer, of the effectiveness of the design and operation of our disclosure controls and procedures as of the end of the quarter covered by this report. Based on the foregoing, our Chief Executive Officer and Chief Financial Officer have concluded that our disclosure controls and procedures were effective at a reasonable assurance level.
There has been no adverse change in our internal control over financial reporting during our most recent fiscal quarter that has materially affected, or is reasonably likely to materially affect, our internal control over financial reporting.
43
PART II. OTHER INFORMATION
Item 1. Legal Proceedings
There were no material changes to report.
Item 1A. Risk Factors
The discussion in this Report should be read together with the risk factors contained in Part I, Item 1A, “Risk Factors,” of our Annual Report on Form 10-K for the transitional period ended December 31, 2012. These risk factors describe various risks and uncertainties. These risks and uncertainties have the potential to affect our business, financial condition, results of operations, cash flows, strategies or prospects in a material and adverse manner. In addition, these risks could have a material adverse effect on the value of the Notes you purchase and could cause you to lose all or part of your initial purchase price or future principal and interest payments you expect to receive.
In addition, you should consider the following:
We have incurred net losses in the past and have only recently become profitable. If we are unable to sustain our profitability and become insolvent or bankrupt, you may lose your investment.
As of September 30, 2013, our accumulated deficit was $53.2 million and our total stockholders’ deficit was $41.4 million. Our net income for the nine months ended September 30, 2013 was $4.5 million. For the nine months ended September 30, 2012, our net loss was $6.0 million. For the nine months ended September 30, 2013, we were cash-flow positive and we believe that we will remain profitable for the remainder of 2013. However, if our assumptions regarding our growth and operating plan are incorrect, we may need to slow our investment spending and/or find new funding to continue to operate our business. We currently believe that such funding would be available to us on terms that we would find acceptable. Any delay in securing, or failing to secure, any necessary funding could result in delays and operational slowdowns that could adversely affect the regularity of our processing payments, the cash flows on your investment and ultimately the value of your investment.
Item 2. Unregistered Sales of Equity Securities and Use of Proceeds
We have no publicly traded equity securities. At September 30, 2013, there were 110 holders of record of our common stock. We have not paid cash dividends since our inception, and we do not anticipate paying cash dividends in the foreseeable future.
Item 3. Defaults Upon Senior Securities
None.
Item 4. Mine Safety Disclosures
None.
Item 5. Other Information
None.
Item 6. Exhibits
See Exhibit Index. The exhibits noted in the accompanying Exhibit Index are filed or incorporated by reference as a part of this Report and such Exhibit Index is incorporated herein by reference.
44
SIGNATURES
Pursuant to the requirements of the Securities Exchange Act of 1934, the registrant has duly caused this report to be signed on its behalf by the undersigned thereunto duly authorized.
| | |
| LENDINGCLUB CORPORATION |
| |
| By: | | /s/ RENAUD LAPLANCHE |
| Name: | | Renaud Laplanche |
| Title: | | Chief Executive Officer |
| | (principal executive officer) |
| |
| By: | | /S/ CARRIE DOLAN |
| Name: | | Carrie Dolan |
| Title: | | Chief Financial Officer |
| | (principal financial officer and principal accounting officer) |
Dated: November 14, 2013
45
EXHIBIT INDEX
| | |
Exhibit Number | | Exhibit |
| |
| 31.1 | | Certification of Chief Executive Officer, Pursuant to Section 302 of Sarbanes-Oxley Act of 2002 |
| |
| 31.2 | | Certification of Chief Financial Officer, Pursuant to Section 302 of Sarbanes-Oxley Act of 2002 |
| |
| 32.1 | | Certification of Chief Executive Officer and Chief Financial Officer, Pursuant to Section 906 of Sarbanes-Oxley Act of 2002 |
| |
| 101.INS | | XBRL Instance Document |
| |
| 101.SCH | | XBRL Taxonomy Extension Schema Document |
| |
| 101.CAL | | Taxonomy Extension Calculation Linkbase Document |
| |
| 101.DEF | | Taxonomy Extension Definition Linkbase Document |
| |
| 101.LAB | | Taxonomy Extension Label Linkbase Document |
| |
| 101.PRE | | Taxonomy Extension Presentation Linkbase Document |
46