PRO FORMA VALUATION REPORT
MUTUAL HOLDING COMPANY
STOCK OFFERING
SOUND FINANCIAL, INC.
SEATTLE, WASHINGTON
PROPOSED MID-TIER HOLDING COMPANY FOR:
SOUND COMMUNITY BANK
Seattle, Washington
Dated As Of:
August 31, 2007
Prepared By:
RP® Financial, LC.
1700 North Moore Street
Suite 2210
Arlington, Virginia 22209
RP® FINANCIAL, LC.
Financial Services Industry
Consultants
August 31, 2007
Board of Directors
Sound Community Bank
2005 Fifth Avenue, 2nd Floor
Seattle, Washington 98121
Members of the Board of Directors:
At your request, we have completed and hereby provide an independent appraisal ("Appraisal") of the estimated pro forma market value of the common stock which is to be offered in connection with the mutual-to-stock conversion transaction described below.
This Appraisal is furnished pursuant to the conversion regulations promulgated by the Office of Thrift Supervision ("OTS"). Specifically, this Appraisal has been prepared in accordance with the "Guidelines for Appraisal Reports for the Valuation of Savings and Loan Associations Converting from Mutual to Stock Form of Organization" as set forth by the OTS, and applicable regulatory interpretations thereof.
Description of Plan of Reorganization and Stock Offering
The Board of Directors of Sound Community Bank ("Sound" or the "Bank") has adopted a plan of reorganization and stock issuance, pursuant to which Sound will reorganize into a federal mutual holding company structure. As part of the plan of reorganization, Sound will convert from a federally-chartered mutual savings bank to a federally-chartered stock savings bank and will become a wholly-owned subsidiary of Sound Financial, Inc. ("Sound Financial" or the "Company"), a federally-chartered mid-tier holding corporation. Sound Financial will issue a majority of its common stock to Sound Community MHC (the "MHC"), a federally-chartered mutual holding company, and sell a minority of its common stock to the public. It is anticipated that the public shares will be offered in a subscription offering to the Bank's Eligible Account Holders, Tax-Qualified Employee Plans, Supplemental Eligible Account Holders and Other Members, as such terms are defined for purposes of applicable federal regulatory requirements governing mutual-to-stock conversions. To the extent that shares remain available for purchase after satisfaction of all subscriptions received in the subscription offering, the shares may be offered for sale in a direct community offering and a public offering. In addition, as part of the reorganization, the Bank will form the Sound Community Foundation (the "Foundation") to further the Bank's commitment to the local community. The Foundation will be funded with stock equal to 1% of the stock to be issued in the reorganization and cash equal to $200,000. The total shares offered for sale to the public and issued to the Foundation will constitute a minority of the Company's stock (49.0% or less).
| Washington Headquarters Rosslyn Center 1700 North Moore Street, Suite 2210 Arlington, VA 22209 www.rpfinancial.com | Telephone: (703) 528-1700 Fax No.: (703) 528-1788 Toll-Free No.: (866) 723-0594 E-Mail: mail@rpfinancial.com |
Board of Directors
August 31, 2007
Page 2
The aggregate amount of stock issued by the Company cannot exceed the appraised value of the Bank. Immediately following the offering, the primary assets of the Company will be the capital stock of the Bank and the net offering proceeds remaining after contributing proceeds to the Bank in exchange for 100% of the capital stock of the Bank. The Company will contribute at least 50% of the net offering proceeds in exchange for the Bank's capital stock. The remaining net offering proceeds, retained at the Company, will be used to fund a loan to the ESOP and as general working capital.
RP® Financial, LC.
RP® Financial, LC. ("RP Financial") is a financial consulting firm serving the financial services industry nationwide that, among other things, specializes in financial valuations and analyses of business enterprises and securities, including the pro forma valuation for savings institutions converting from mutual-to-stock form. The background and experience of RP Financial is detailed in Exhibit V-1. We believe that, except for the fee we will receive for our appraisal, we are independent of the Bank and the other parties engaged by Sound to assist in the corporate reorganization and minority stock issuance process.
Valuation Methodology
In preparing our appraisal, we have reviewed the Bank's, the Company's and MHC's regulatory applications, including the prospectus as filed with the OTS and the Securities and Exchange Commission ("SEC"). We have conducted a financial analysis of the Bank that has included due diligence related discussions with Sound's management; Moss Adams LLP, the Bank's independent auditor; Silver Freedman & Taff, L.L.P., Sound's conversion counsel; and Keefe Bruyette & Woods, Inc., which has been retained as the marketing advisor in connection with the Bank's stock offering. All conclusions set forth in the Appraisal were reached independently from such discussions. In addition, where appropriate, we have considered information based on other available published sources that we believe are reliable. While we believe the information and data gathered from all these sources are reliable, we cannot guarantee the accuracy and completeness of such information.
We have investigated the competitive environment within which Sound operates and have assessed the Bank's relative strengths and weaknesses. We have monitored all material regulatory and legislative actions affecting financial institutions generally and analyzed the potential impact of such developments on Sound and the industry as a whole to the extent we were aware of such matters. We have analyzed the potential effects of the stock conversion on the Bank's operating characteristics and financial performance as they relate to the pro forma market value of Sound Financial. We have reviewed the economy and demographic characteristics of the primary market area in which the Bank currently operates. We have compared Sound's financial performance and condition with publicly-traded thrift institutions evaluated and selected in accordance with the Valuation Guidelines, as well as all publicly-traded thrifts and thrift holding companies. We have reviewed conditions in the securities
Board of Directors
August 31, 2007
Page 3
markets in general and the markets for thrifts, thrift holding companies and mutual holding companies including mutual holding company offerings.
The Appraisal is based on Sound's representation that the information contained in the regulatory applications and additional information furnished to us by the Bank and its independent auditors, legal counsel, investment bankers and other authorized agents are truthful, accurate and complete. We did not independently verify the financial statements and other information provided by the Bank, or its independent auditors, legal counsel, investment bankers and other authorized agents nor did we independently value the assets or liabilities of the Bank. The valuation considers Sound only as a going concern and should not be considered as an indication of the Bank's liquidation value.
Our appraised value is predicated on a continuation of the current operating environment for the Bank, the MHC and the Company and for all thrifts and their holding companies. Changes in the local and national economy, the federal and state legislative and regulatory environments for financial institutions and mutual holding companies, the stock market, interest rates, and other external forces (such as natural disasters or significant world events) may occur from time to time, often with great unpredictability, and may materially impact the value of thrift stocks as a whole or the Bank's value alone. It is our understanding that there are no current plans for pursuing a second-step conversion or for selling control of the Company or the Bank following the offering. To the extent that such factors can be foreseen, they have been factored into our analysis.
The estimated pro forma market value is defined as the price at which the Company's stock, immediately upon completion of the offering, would change hands between a willing buyer and a willing seller, neither being under any compulsion to buy or sell and both having reasonable knowledge of relevant facts.
Valuation Conclusion
It is our opinion that, as of August 31, 2007, the estimated aggregate pro forma market value of the shares to be issued immediately following the offering, including shares issued publicly as well as to the Foundation and the MHC, was $29,000,000 at the midpoint, equal to 2,900,000 shares issued at a per share value of $10.00. The Board of Directors has established a public offering range such that the public ownership of the Company will constitute a 44.0% ownership interest of the Company, excluding the issuance of the shares to the Foundation. Based on the public offering range, and inclusive of the shares issued to the Foundation, the public ownership of the shares will represent 45.0% of the shares issued, with the MHC owning the majority of the shares. Based on the foregoing valuation, the corresponding range of shares and market values based on a $10.00 per share price are as follows:
Board of Directors
August 31, 2007
Page 4
| Offering Shares | MHC Shares | Foundation Shares | Total Shares | |
| Shares | ||||
| Supermaximum | 1,687,510 | 2,109,388 | 38,353 | 3,835,251 |
| Maximum | 1,467,400 | 1,834,250 | 33,350 | 3,335,000 |
| Midpoint | 1,276,000 | 1,595,000 | 29,000 | 2,900,000 |
| Minimum | 1,084,600 | 1,355,750 | 24,650 | 2,465,000 |
| Market Value | ||||
| Supermaximum | $16,875,100 | $21,093,880 | $383,530 | $38,352,510 |
| Maximum | $14,674,000 | $18,342,500 | $333,500 | $33,350,000 |
| Midpoint | $12,760,000 | $15,950,000 | $290,000 | $29,000,000 |
| Minimum | $10,846,000 | $13,557,500 | $246,500 | $24,650,000 |
Limiting Factors and Considerations
The valuation is not intended, and must not be construed, as a recommendation of any kind as to the advisability of purchasing shares of the common stock. Moreover, because such valuation is determined in accordance with applicable OTS regulatory guidelines and is necessarily based upon estimates and projections of a number of matters, all of which are subject to change from time to time, no assurance can be given that persons who purchase shares of common stock in the conversion will thereafter be able to buy or sell such shares at prices related to the foregoing valuation of the estimated pro forma market value thereof. The appraisal reflects only a valuation range as of this date for the pro forma market value of Sound Financial immediately upon issuance of the stock and does not take into account any trading activity with respect to the purchase and sale of common stock in the secondary market on the date of issuance of such securities or at anytime thereafter following the completion of the public stock offering.
The valuation prepared by RP Financial in accordance with applicable OTS regulatory guidelines was based on the financial condition and operations of Sound as of June 30, 2007, the date of the financial data included in the prospectus.
RP Financial is not a seller of securities within the meaning of any federal and state securities laws and any report prepared by RP Financial shall not be used as an offer or solicitation with respect to the purchase or sale of any securities. RP Financial maintains a policy which prohibits RP Financial, its principals or employees from purchasing stock of its financial institution clients.
Board of Directors
August 31, 2007
Page 5
The valuation will be updated as provided for in the OTS conversion regulations and guidelines. These updates will consider, among other things, any developments or changes in the financial performance and condition of Sound Financial, management policies, and current conditions in the equity markets for thrift stocks, both existing issues and new issues. These updates may also consider changes in other external factors which impact value including, but not limited to: various changes in the federal and state legislative and regulatory environments for financial institutions, the stock market and the market for thrift stocks, and interest rates. Should any such new developments or changes be material, in our opinion, to the valuation of the shares, appropriate adjustments to the estimated pro forma market value will be made. The reasons for any such adjustments will be explained in the update at the date of the release of the update.
| Respectfully submitted, RP® FINANCIAL, LC. /s/ Ronald S. Riggins Ronald S. Riggins President and Managing Director /s/ James J. Oren James J. Oren Senior Vice President |
RP® FINANCIAL, LC.
TABLE OF CONTENTS
SOUND FINANCIAL, INC.
Seattle, Washington
| DESCRIPTION | PAGE NUMBER | |
| CHAPTER ONE OVERVIEW AND FINANCIAL ANALYSIS | ||
| Introduction | 1.1 | |
| Plan of Reorganization | 1.1 | |
| Strategic Overview | 1.2 | |
| Balance Sheet Trends | 1.4 | |
| Income and Expense Trends | 1.8 | |
| Interest Rate Risk Management | 1.12 | |
| Lending Activities and Strategy | 1.13 | |
| Asset Quality | 1.16 | |
| Funding Composition and Strategy | 1.17 | |
| Subsidiaries | 1.18 | |
| Legal Proceedings | 1.18 | |
| CHAPTER TWO MARKET AREA | ||
| Introduction | 2.1 | |
| National Economic Factors | 2.2 | |
| Interest Rate Environment | 2.3 | |
| Market Area Demographics | 2.4 | |
| Summary of Local Economy | 2.7 | |
| Unemployment Data and Trends | 2.10 | |
| Market Area Deposit Characteristics/Competition | 2.10 | |
| Summary | 2.12 | |
| CHAPTER THREE PEER GROUP ANALYSIS | ||
| Peer Group Selection | 3.1 | |
| Basis of Comparison | 3.2 | |
| Sound's Peer Group | 3.3 | |
| Financial Condition | 3.6 | |
| Income and Expense Components | 3.9 | |
| Loan Composition | 3.12 | |
| Credit Risk | 3.14 | |
| Interest Rate Risk | 3.14 | |
| Summary | 3.18 | |
RP® FINANCIAL, LC.
TABLE OF CONTENTS
SOUND FINANCIAL, INC.
Seattle, Washington
(continued)
| DESCRIPTION | PAGE NUMBER | |
| CHAPTER FOUR VALUATION ANALYSIS | ||
| Introduction | 4.1 | |
| Appraisal Guidelines | 4.1 | |
| RP Financial Approach to the Valuation | 4.1 | |
| Valuation Analysis | 4.3 | |
| 1. Financial Condition | 4.3 | |
| 2. Profitability, Growth and Viability of Earnings | 4.5 | |
| 3. Asset Growth | 4.7 | |
| 4. Primary Market Area | 4.7 | |
| 5. Dividends | 4.8 | |
| 6. Liquidity of the Shares | 4.9 | |
| 7. Marketing of the Issue | 4.10 | |
| A. The Public Market | 4.10 | |
| B. The New Issue Market | 4.15 | |
| C. The Acquisition Market | 4.18 | |
| 8. Management | 4.18 | |
| 9. Effect of Government Regulation and Regulatory Reform | 4.20 | |
| Summary of Adjustments | 4.20 | |
| Basis of Valuation - Fully-Converted Pricing Ratios | 4.21 | |
| Valuation Approaches: Fully-Converted Basis | 4.22 | |
| 1. Price-to-Earnings ("P/E") | 4.25 | |
| 2. Price-to-Book ("P/B") | 4.27 | |
| 3. Price-to-Assets ("P/A") | 4.29 | |
| Comparison to Recent Offerings | 4.30 | |
| Valuation Conclusion | 4.30 | |
RP® FINANCIAL, LC.
LIST OF TABLES
Sound Financial, Inc.
Seattle, Washington
| TABLE NUMBER | DESCRIPTION | PAGE |
| 1.1 | Historical Balance Sheets | 1.5 |
| 1.2 | Historical Income Statements | 1.9 |
| 2.1 | Summary Demographic Data | 2.5 |
| 2.2 | Major Private Employers in Washington | 2.8 |
| 2.3 | Primary Market Area Employment Sectors | 2.9 |
| 2.4 | Unemployment Data and Trends | 2.10 |
| 2.5 | Deposit Summary | 2.11 |
| 2.6 | Market Area Deposit Competitors | 2.13 |
| 3.1 | Peer Group of Publicly-Traded Thrifts | 3.5 |
| 3.2 | Balance Sheet Composition and Growth Rates | 3.7 |
| 3.3 | Income as a Percent of Average Assets and Yields, Costs, Spreads | 3.10 |
| 3.4 | Loan Portfolio Composition and Related Information | 3.13 |
| 3.5 | Credit Risk Measures and Related Information | 3.15 |
| 3.6 | Interest Rate Risk Measures and Net Interest Income Volatility | 3.16 |
| 4.1 | Market Area Unemployment Rates | 4.8 |
| 4.2 | Market Pricing Characteristics and After-Market Trends | 4.17 |
| 4.3 | Market Pricing Comparatives | 4.19 |
| 4.4 | Valuation Adjustments | 4.21 |
| 4.5 | Calculation of Implied Per Share Data | 4.23 |
| 4.6 | MHC Institutions - Implied Pricing Ratios, Full Conversion Basis | 4.26 |
| 4.7 | Pricing Table: MHC Public Market Pricing | 4.28 |
RP® FINANCIAL, LC.
Page 1.1
I. Overview and Financial Analysis
Introduction
Sound is a federally-chartered savings bank headquartered in Seattle, Washington. The Bank serves the Seattle-Tacoma-Bellevue metropolitan area and western portions of Washington through its main office in Seattle and four branch offices, three of which are located in the Seattle area and one that is located in Clallam County, west of Puget Sound. The Bank's offices are located in four different counties. The main office is in Seattle and one branch is located in King County, while the Lakewood branch is located in Pierce County, the Mountain Terrace branch is located in Snohomish County and the Sequim branch is located in Clallam County. A map of the Bank's branch offices is provided in Exhibit I-1. Sound is a member of the Federal Home Loan Bank ("FHLB") system, and its deposits are insured up to the regulatory maximums by the Federal Deposit Insurance Corporation ("FDIC"). At June 30, 2007, Sound had $230.7 million in assets, $183.5 million in deposits and total equity of $16.0 million, equal to 6.9% of total assets. Sound's audited financial statements are included by reference as Exhibit I-2.
Plan of Reorganization
The Board of Directors of Sound adopted the plan of reorganization and stock issuance to reorganize from the mutual form of organization to the mutual holding company form of organization. Pursuant to the reorganization, Sound will become a wholly-owned subsidiary of Sound Financial, a federally-chartered mid-tier holding corporation, and Sound Financial will issue a majority of its common stock to the MHC, a federally-chartered mutual holding company, and sell a minority of its common stock to the public. Concurrent with the reorganization, the Company will retain up to 50% of the net stock proceeds. At the present time, it is not anticipated that the MHC or the Company will engage in any business activity other than ownership of their respective subsidiaries and investment of stock proceeds that are retained by the Company.
The MHC will own a controlling interest in the Company of at least 51%, and the Company will be the sole subsidiary of the MHC. The Company will own 100% of the Bank's outstanding stock. The Company's initial activities will be ownership of its subsidiary, Sound,
RP® FINANCIAL, LC.
Page 1.2
investment of the net cash proceeds retained at the holding company level (initially in short-term investment securities) and extending a loan to the Bank's newly-formed employee stock ownership plan ("ESOP"). Subsequent activities of the Company may include payment of regular or special dividends, acquisitions of other financial institutions or financial service providers and/or stock repurchases.
The plan of reorganization provides for the establishment of the Foundation, which will be funded with $200,000 of cash and stock equal to 1% of the total shares to be outstanding. The Foundation will be dedicated to assist the communities and organization's within Sound's market area beyond community development and lending and will enhance the Bank's current activities under the Community Reinvestment Act.
Strategic Overview
Sound began operations in 1953 as a credit union, serving the employees of a wholesale grocer in the Seattle area. After expanding its operations to include employees of other companies and communities, the Bank converted its charter to a federally chartered savings bank May 19, 2003 due to its desire to: (1) originate greater numbers of residential real estate secured loans; (2) originate commercial real estate and commercial business loans; and, (3) provide access to capital given the internal growth plans. The Bank's general business strategies for the future include continuing to grow the franchise and remain competitive through high levels of customer service and an expanded branch office network, emphasizing lower cost core deposits to manage funding costs, continuing to expand and diversify the loan portfolio, maintain high asset quality, leverage the increased capital base and improve earnings.
Since the conversion to a federal savings bank, the Bank has expanded the loan portfolio, particularly in the areas of construction, commercial real estate and commercial business loans. The loan portfolio continues to contain significant balances of manufactured home loans and automobile loans, with automobile lending having been a lending strategy for many years prior to the charter conversion. A significant portion of the manufactured home loan portfolio has been originated since the charter conversion in 2003. In 2006, the Bank entered into an agent agreement to offer Visa accounts without assuming credit risk and sold the existing receivables for a substantial gain. In 2004, reflecting the benefits of the unrestricted membership potential of
RP® FINANCIAL, LC.
Page 1.3
the thrift charter, Sound relocated two branch offices in the Seattle metropolitan area into "Class A" retail space in order to attract additional retail customers.
Sound's operations are characteristic of many thrifts with its emphasis on originating 1-4 family residential mortgage loans largely funded by retail deposits, with time deposits constituting the largest portion of the deposit base. More recently, borrowings have supplemented the growth objectives, as well as assist in managing funding costs and interest rate risk. Such borrowings have typically been limited to FHLB advances with fixed rate terms and balances of overnight advances. As lending has been a continuous focus for the Bank, in recent years the cash and investments portfolio has been limited to cash and equivalents as well as FHLB stock, with a minor investment in MBS.
Sound's earnings are largely dependent upon net interest income, non-interest income and strong asset quality. Sound typically sells longer-term fixed rate loans into the secondary market on a servicing-retained basis, and thus has built a sizeable balance of loans serviced for others which has supported non-interest income. To strengthen the net interest margin the Bank sought to maintain a high loans/assets ratio. The Bank's relatively high operating expenses reflect the five branch locations (including recent office relocations to stimulate growth).
The equity from the minority stock offering will increase liquidity, leverage and growth capacity and the overall financial strength. Sound's higher capital position resulting from the infusion of stock proceeds is anticipated to reduce interest rate risk through enhancing the interest-earning assets to interest-bearing liabilities ("IEA/IBL") ratio. The increased equity is expected to reduce funding costs. Additionally, the higher pro forma equity ratio should better position the Bank to take advantage of prospective expansion opportunities, including the establishment or acquisition of additional banking offices in current or nearby markets. The Bank intends to open one branch per year in fiscal years 2008 through 2010, although no specific locations have been identified at present. The Bank will also be positioned better to pursue growth and revenue diversification through acquisition of other financial service providers. The projected use of proceeds is highlighted below.
- MHC. The Bank intends to capitalize the MHC with $100,000 of cash. The primary activity of the MHC will be ownership of the majority interest in
RP® FINANCIAL, LC.
Page 1.4
- The Company. The Company is expected to retain up to 50% of the net conversion proceeds. At present, funds at the holding company level are expected to be initially invested primarily into short-term investment grade securities or a deposit at the Bank. Over time, the funds may be utilized for various corporate purposes, which may include acquisitions, infusing additional equity into the Bank, repurchases of common stock, and the payment of regular and/or special cash dividends.
- The Bank. A minimum of 50% of the net conversion proceeds will be infused into the Bank. Cash proceeds (i.e., net proceeds less deposits withdrawn to fund stock purchases) infused into the Bank will initially be used to pay down FHLB borrowings and over time become part of general funds, pending deployment into loans and investment securities.
- Sound Financial. Such cash is anticipated to be invested into low risk liquid instruments.
Balance Sheet Trends
Table 1.1 shows the Bank's historical balance sheet data since year end 2002, reflecting thrift operations since the May 19, 2003 date. During this period through June 30, 2007, Sound's assets increased at a 12.7% annual rate, while loans increased at a 16.3% annual rate. Such growth was funded by a 9.7% annual growth in deposits, commencement of funding with borrowings, 5.9% annual growth in retained earnings, as well as a reduction in cash and equivalents and investment securities. A summary of Sound's key operating ratios for the past three and one-half years is presented in Exhibit I-3.
Sound's 16.3% annual growth rate in loans receivable increased the loans-to-assets ratio from 81.0% at year end 2002 to 93.2% at June 30, 2007. Coupled with the increased funding with borrowings in the last couple of years, the loans/deposits ratio increased from 90.3% at year end 2002 to 117.1%.
Sound's changing lending emphasis is reflected in its loan portfolio composition, as 39.4% and 22.2% of total loans receivable consisted of 1-4 family permanent residential mortgage loans and consumer loans, respectively, at June 30, 2007; in contrast, such loans represented 43.0% and 27.9%, respectively, at December 31, 2002. As noted earlier, the Bank has increased its construction, commercial mortgage and commercial business lending since 2002. Construction loans increased from 0.7% to 4.5% of total loans from December 31, 2002 to
RP® FINANCIAL, LC.
Page 1.5
| RP® Financial, LC. | ||||||||||||||||||||||||
| Page 1.5 | ||||||||||||||||||||||||
| Table 1.1 | ||||||||||||||||||||||||
| Sound Community Bank, Seattle, Washington | ||||||||||||||||||||||||
| Historical Balance Sheet Data | ||||||||||||||||||||||||
| 12/31/02- | ||||||||||||||||||||||||
| 6/30/07 | ||||||||||||||||||||||||
| As of December 31, | As of | Annual. | ||||||||||||||||||||||
| 2002(1) | 2003(1) | 2004 | 2005 | 2006 | June 30, 2007 | Growth Rate | ||||||||||||||||||
| Amount | Pct(2) | Amount | Pct(2) | Amount | Pct(2) | Amount | Pct(2) | Amount | Pct(2) | Amount | Pct(2) | Pct | ||||||||||||
| ($000) | (%) | ($000) | (%) | ($000) | (%) | ($000) | (%) | ($000) | (%) | ($000) | (%) | (%) | ||||||||||||
| Total Amount of: | ||||||||||||||||||||||||
| Assets | $134,493 | 100.00% | $150,373 | 100.00% | $176,057 | 100.00% | $204,231 | 100.00% | $221,070 | 100.00% | $230,656 | 100.00% | 12.74% | |||||||||||
| Loans Receivable (net) | 108,973 | 81.03% | 132,979 | 88.43% | 157,705 | 89.58% | 190,535 | 93.29% | 206,119 | 93.24% | 214,986 | 93.21% | 16.30% | |||||||||||
| Cash and Equivalents | 10,406 | 7.74% | 6,823 | 4.54% | 5,841 | 3.32% | 5,014 | 2.46% | 5,649 | 2.56% | 6,395 | 2.77% | -10.25% | |||||||||||
| Investment Securities | 11,851 | 8.81% | 6,144 | 4.09% | 3,951 | 2.24% | 222 | 0.11% | 170 | 0.08% | 117 | 0.05% | -64.13% | |||||||||||
| FHLB Stock | NA | 0.00% | 936 | 0.62% | 1,136 | 0.65% | 1,320 | 0.65% | 1,320 | 0.60% | 1,320 | 0.57% | NM | |||||||||||
| Mortgage Servicing Rights | 0 | 0.00% | 0 | 0.00% | 0 | 0.00% | 855 | 0.42% | 868 | 0.39% | 854 | 0.37% | NM | |||||||||||
| Bank-Owned Life Insurance | 0 | 0.00% | 0 | 0.00% | 3,041 | 1.73% | 3,165 | 1.55% | 3,279 | 1.48% | 3,957 | 1.72% | NM | |||||||||||
| Fixed Assets | 1,259 | 0.94% | 1,120 | 0.74% | 1,679 | 0.95% | 1,572 | 0.77% | 1,330 | 0.60% | 1,271 | 0.55% | 0.21% | |||||||||||
| Other Assets | 2,003 | 1.49% | 2,372 | 1.58% | 2,704 | 1.54% | 1,550 | 0.76% | 2,336 | 1.06% | 1,755 | 0.76% | -2.89% | |||||||||||
| Deposits | $120,727 | 89.77% | $130,722 | 86.93% | $158,901 | 90.26% | $168,173 | 82.34% | $180,968 | 81.86% | $183,549 | 79.58% | 9.76% | |||||||||||
| FHLB Advances, Other Borrowed Funds | 0 | 0.00% | 4,613 | 3.07% | 2,669 | 1.52% | 21,304 | 10.43% | 22,029 | 9.96% | 27,669 | 12.00% | NM | |||||||||||
| Other Liabilities | 1,428 | 1.06% | 2,116 | 1.41% | 1,599 | 0.91% | 1,444 | 0.71% | 2,503 | 1.13% | 3,455 | 1.50% | 21.70% | |||||||||||
| Retained Earnings | $12,337 | 9.17% | $12,923 | 8.59% | $12,888 | 7.32% | $13,310 | 6.52% | $15,569 | 7.04% | $15,982 | 6.93% | 5.92% | |||||||||||
| Loans/Deposits | 90.26% | 101.73% | 99.25% | 113.30% | 113.90% | 117.13% | ||||||||||||||||||
| Offices Open | 5 | 5 | 5 | 5 | 5 | 5 | ||||||||||||||||||
| (1) | 2002 and 2003 data from audited financial statements not included in prospectus. |
| (2) | Ratios are as a percent of ending assets. |
| Source: | Audited and unaudited financial statements; RP Financial calculations. |
RP® FINANCIAL, LC.
Page 1.6
June 30, 2007, while commercial real estate and commercial business loans have increased from 11.6% to 14.9% during this same period.
The decline in portfolio mix of 1-4 family mortgages was attributable to the strategy of selling longer-term fixed rate loans into the secondary market, primarily to Fannie Mae. The Bank typically retains the mortgage servicing rights ("MSRs"), which it capitalizes; the MSRs totaled $854,000 as of June 30, 2007, reflecting a portfolio of loans serviced for others of $127.1 million as of June 30, 2007.
Given the Bank's lending focus, the investment securities portfolio has been diminished, ranging from a high of 8.8% of assets at year end 2002 to a low of 0.1% of assets at June 30, 2007. The Bank's only investments consist of two collateralized mortgage obligations ("CMOs"), held as available-for-sale ("AFS"), with a balance of $117,000 as of June 30, 2007. Beyond the CMOs investment, the Bank held $1.32 million of FHLB stock at June 30, 2007. Cash and cash equivalents totaled $6.4 million at June 30, 2007. Exhibit I-4 provides historical detail of the Bank's investment portfolio.
The Bank also maintains an investment in bank-owned life insurance ("BOLI") policies, which cover the lives of some of the Bank's officers and managers, to provide funding for the employee benefit plans. The life insurance policies earn tax-exempt income through cash value accumulation and death proceeds. As of June 30, 2007, the cash surrender value of the Bank's BOLI equaled $4.0 million.
The Bank's five office locations are all in leased facilities, resulting in a relatively low level of investment in fixed assets, which was $1.271 million, or 0.55% of assets as of June 30, 2007. The Bank is considering opening a second office in Clallam County in 2008, but the additional investment in fixed assets is expected to be limited.
The Bank's 9.8% annual deposit growth rate since 2002 was supported by the 2004 relocation of branch offices in King and Snohomish Counties. Due to increased funding with borrowings, the Bank's deposits/assets ratio declined to 79.6% at June 30, 2007, versus 89.8% at December 31, 2002. Time deposits have been the primary source of the Bank's deposit growth in recent years, increasing from $66.1 million, or 41.6% of deposits, at year end 2004 to $96.4 million, or 52.5% of deposits, at June 30, 2007. Transaction and savings accounts equaled
RP® FINANCIAL, LC.
Page 1.7
47.5% of the Bank's total deposits at June 30, 2007, versus a comparable ratio of 58.4% at year end 2004.
Since the conversion to a savings bank charter in 2003, Sound commenced funding with borrowings to fund growth, and to manage funding costs and interest rate risk. Borrowings totaled $27.7 million, or 12.0% of assets, at June 30, 2007. The Bank's utilization of borrowings has been limited to fixed rate, fixed maturity characteristics and short-term overnight FHLB advances.
Since year end 2002, retention of earnings and the adjustment for accumulated other comprehensive income translated into an annual equity growth rate of 5.9%. The Bank's strategy to leverage its equity to increase earnings is evidenced in the decline of the equity-to-assets ratio from 9.2% at year end 2002 to 6.9% at June 30, 2007. All of the Bank's equity is tangible, and the Bank maintained surpluses relative to all of its regulatory capital requirements at June 30, 2007. The addition of stock proceeds will serve to strengthen the Bank's equity position, as well as support growth opportunities. The pro forma return of equity ("ROE") is expected to initially decline given the increased equity position.
Income and Expense Trends
Table 1.2 shows the Bank's income and expense trends since fiscal 2002. Earnings and profitability have been volatile over this period, but the earnings for the 12 months through June 30, 2007 reflect stability and a normalized view of earnings. Fiscal 2003 reflects approximately five months of operations as a credit union and tax adjustments contributing to a tax benefit. For the 12 months ended June 30, 2007, the Bank reported net income of $699,000 for a return on average assets of 0.32%. Income has also been affected by net gains on sale (gains or loss on the sale of investments, loans and the credit card receivables portfolio) as well as tax adjustments and net operating loss carryforwards resulting from the 2003 charter conversion.
Net interest income steadily increased from 2003 to 2005, and has since declined. The growth in net interest income was attributable to strong balance sheet growth, between year end 2002 and year end 2005 and the commercial and construction lending initiatives. The subsequent decline in net interest income is attributable to the sale of the higher yielding credit card receivables, higher cost of funding with borrowings and the unfavorable yield curve, which
RP® FINANCIAL, LC.
Page 1.8
| RP® Financial, LC. | |||||||||||||||||||
| Page 1.8 | |||||||||||||||||||
| Table 1.2 | |||||||||||||||||||
| Sound Community Bank | |||||||||||||||||||
| Historical Income Statements | |||||||||||||||||||
| For the Fiscal Year Ended December 31, | 12 Months Ended | ||||||||||||||||||
| 2003 (1) | 2004 | 2005 | 2006 | June 30, 2007 | |||||||||||||||
| Amount | Pct(2) | Amount | Pct(2) | Amount | Pct(2) | Amount | Pct(2) | Amount | Pct(2) | ||||||||||
| ($000) | (%) | ($000) | (%) | ($000) | (%) | ($000) | (%) | ($000) | (%) | ||||||||||
| Interest Income | $9,445 | 6.63% | $9,937 | 6.65% | $12,158 | 6.44% | $13,641 | 6.45% | $13,793 | 6.31% | |||||||||
| Interest Expense | (3,240) | -2.27% | (3,256) | -2.18% | (4,376) | -2.32% | (6,386) | -3.02% | (7,109) | -3.25% | |||||||||
| Net Interest Income | $6,206 | 4.36% | $6,681 | 4.47% | $7,782 | 4.12% | $7,255 | 3.43% | $6,683 | 3.06% | |||||||||
| Provision for Loan Losses | (925) | -0.65% | (857) | -0.57% | (946) | -0.50% | (282) | -0.13% | (23) | -0.01% | |||||||||
| Net Interest Income after Provisions | $5,281 | 3.71% | $5,824 | 3.90% | $6,836 | 3.62% | $6,973 | 3.30% | $6,660 | 3.04% | |||||||||
| Other Income | $998 | 0.70% | $2,026 | 1.36% | $2,150 | 1.14% | $2,335 | 1.10% | $2,269 | 1.04% | |||||||||
| Operating Expense | (6,230) | -4.37% | (7,891) | -5.28% | (8,298) | -4.39% | (8,234) | -3.89% | (7,942) | -3.63% | |||||||||
| Net Operating Income | $49 | 0.03% | ($41) | -0.03% | $689 | 0.36% | $1,074 | 0.51% | $987 | 0.45% | |||||||||
| Gain (Loss) on Sale of Investments | ($4) | 0.00% | $2 | 0.00% | ($21) | -0.01% | $0 | 0.00% | $0 | 0.00% | |||||||||
| Gain (Loss) on Sale of Loans (Incl MSR Gains) | 322 | 0.23% | (21) | -0.01% | (13) | -0.01% | (10) | 0.00% | 12 | 0.01% | |||||||||
| Gain on Sale of Credit Card Portfolio | 0 | 0.00% | 0 | 0.00% | 0 | 0.00% | 2,287 | 1.08% | 0 | 0.00% | |||||||||
| Net Income Before Tax | $367 | 0.26% | ($61) | -0.04% | $654 | 0.35% | $3,351 | 1.58% | $999 | 0.46% | |||||||||
| Income Tax Provision (Benefit) (3) | 297 | 0.21% | 31 | 0.02% | (258) | -0.14% | (1,108) | -0.52% | (300) | -0.14% | |||||||||
| Net Income (Loss) | $664 | 0.47% | ($30) | -0.02% | $396 | 0.21% | $2,243 | 1.06% | $699 | 0.32% | |||||||||
| Adjusted Earnings | |||||||||||||||||||
| Net Income | $664 | 0.47% | ($30) | -0.02% | $396 | 0.21% | $2,243 | 1.06% | $699 | 0.32% | |||||||||
| Add(Deduct): Net Gain/(Loss) on Sale | (318) | -0.22% | 19 | 0.01% | 34 | 0.02% | (2,277) | -1.08% | (12) | -0.01% | |||||||||
| Tax Effect (4) | 118 | 0.08% | (7) | 0.00% | (13) | -0.01% | 843 | 0.40% | 4 | 0.00% | |||||||||
| Adjusted Earnings | $463 | 0.33% | ($18) | -0.01% | $418 | 0.22% | $808 | 0.38% | $691 | 0.32% | |||||||||
| Expense Coverage Ratio (5) | 99.6% | 84.7% | 93.8% | 88.1% | 84.1% | ||||||||||||||
| Efficiency Ratio (6) | 86.5% | 90.6% | 83.5% | 85.9% | 88.7% | ||||||||||||||
| Effective Tax Rate (Benefit) (7) | -80.9% | -50.9% | 39.4% | 33.1% | 30.0% | ||||||||||||||
| (1) | Charter conversion from a credit union to a federal savings bank was completed May 19, 2003; 2003 data from audited financial statements not included in prospectus. |
| (2) | Ratios are as a percent of average assets |
| (3) | For 2003 incorporates tax benefit resulting from establishment of deferred tax assets ∓ liabilities as well as taxable income following the charter conversion; the net operating loss carryforward created at the time of the charter conversion was fully utilized in 2005 |
| (4) | Assumes a 37% effective tax rate for federal ∓ state income taxes; for 2003 excludes tax benefit resulting from establishment of deferred tax assets ∓ liabilities; for this calculation no adjustment has been made for the net operating loss carryforward for the years that it was available (through 2005) |
| (5) | Expense coverage ratio calculated as net interest income before provisions for loan losses divided by operating expenses |
| (6) | Efficiency ratio calculated as operating expenses divided by the sum of net interest income before provisions for loan losses plus other income (excluding net gains) |
| (7) | Based on reported financial statements |
| Source: | Audited & unaudited financial statements & RP Financial calculations |
RP® FINANCIAL, LC.
Page 1.9
narrowed the yield-cost spread. Although the sale of the credit card receivables adversely impacted net interest income, the Bank eliminated the high level of loan loss provisions required to maintain this portfolio. The Bank's net interest income ratio to average assets ratio has declined as a result, from a high of 4.47% during 2004 to 3.06% during the 12 months ended June 30, 2007. The Bank's net interest rate spreads and yields and costs for the past two and one-half years are set forth in Exhibits I-3 and I-5.
Non-interest operating income ("other income") increased sharply in 2004 to $2.03 million and gradually increased to $2.34 million in 2006 before easing slightly to $2.27 million in the last 12 months. As the balance sheet has grown, such income has diminished as a percent of average assets - from 1.36% in 2004 to 1.04% for the last 12 months. The level of non-interest operating income ratio is dependent upon the level of banking activities, with fees and charges on transaction deposit accounts constituting the primary source of non-interest income for the Bank. Such income also includes mortgage loan servicing revenues as well as BOLI income.
Operating expenses have traditionally been high, approximating $7.9 million for the last 12 months. The operating expense ratio has declined from 5.28% of average assets during fiscal 2004 to 3.63% for the last 12 months as the level of operating expenses have moderated since the 2005 peak. The recent decline in operating expenses reflects the sale of the Bank's credit card receivables and reduction of related expenses and the reduction of certain personnel expenses (including a senior level employee vacancy for several months). Upward pressure will be placed on the Bank's operating expense ratio following the stock offering, due to expenses associated with operating as a publicly-traded company, including expenses related to the stock benefit plans.
The favorable trends in the operating expense ratio have not offset the diminished net interest income ratio - accordingly, the expense coverage ratio (net interest income divided by operating expenses) has gradually deteriorated such that the coverage was 84.1% for the last 12 months. The relatively strong other income has partially mitigated the weakness in the expense coverage ratio. Sound's efficiency ratio (operating expenses, net of amortization of intangibles, as a percent of the sum of net interest income and other operating income) of 86.5% during 2003 was more favorable than the 88.7% efficiency ratio maintained for the 12 months ended June 30,
RP® FINANCIAL, LC.
Page 1.10
2007. Going forward, the Bank believes the efficiency ratio should improve with continued balance sheet growth and reinvestment of the offering proceeds. The de novo branching and stock benefit plans will result in a slow improvement in the efficiency ratio.
As noted earlier, loan loss provisions prior to the sale of the credit card receivables were quite high. With the sale of the credit card receivables portfolio in June 2006, the asset quality improved and level of troubled assets declined substantially. As a result, the balance of allowances for loan losses ("ALLLs") was in excess of required amounts, and the level of loan loss provisions significantly declined for the last 12 months and the ALLL has declined as well. The Bank expects the level of loan loss provisions to increase with continued loan growth. As of June 30, 2007, Sound maintained allowance for loan losses of $674,000, equal to 119.9% of non-accruing loans and 0.31% of net loans receivable. Exhibit I-6 sets forth the Bank's allowance for loan loss activity during the past two and one-half years.
Net gains on sale have generally had a favorable impact on earnings, particularly the $0.3 million gain on sale of loans in 2003 and the gain on the sale of the credit card receivables equaled $2.3 million. The Bank recognized small net losses on the sale of investments and loans in 2004 and 2005 and a small net gain during the last 12 months. The Bank's net gains/losses on sale of residential mortgage loans also includes the capitalization of the mortgage servicing rights backed at the time the loans are sold. For the 12 months ended June 30, 2007 the Bank recorded a net gain of $12,000 on the sale of loans.
The Bank's 2003 tax situation has been impacted by the benefit resulting from the charter conversion. For the last 12 months the effective tax rate was 30.0%. The Bank's marginal effective statutory tax rate approximates 37%, and this is the rate utilized to calculate the net reinvestment benefit from the offering proceeds.
Interest Rate Risk Management
The Bank's balance sheet is liability-sensitive in the short-term (less than one year) and, thus, the net interest margin will typically be adversely affected during periods of rising and higher interest rates, as well as in the interest rate environment that prevailed during 2006 and the first half of 2007 in which the yield curve was inverted due to short-term interest rates increasing to levels that exceed the yields earned on longer-term Treasury bonds. As of June 30,
RP® FINANCIAL, LC.
Page 1.11
2007 the Net Portfolio Value ("NPV") analysis provided by the OTS indicated that a 2.0% instantaneous and sustained increase in interest rates would result in a 24% decline in the Bank's NPV (see Exhibit I-7).
The Bank pursues a number of strategies to manage interest rate risk, particularly with respect to seeking to limit the repricing mismatch between interest rate sensitive assets and liabilities. The Bank manages interest rate risk from the asset side of the balance sheet through underwriting residential mortgages that will allow for their sale to the secondary market when such a strategy is appropriate, originating 1-4 family ARM loans and diversifying into other types of lending beyond 1-4 family permanent mortgage loans which consist primarily of shorter term and adjustable rate loans. As of December 31, 2006, of the Bank's total loans due after December 31, 2007, ARM loans comprised 21% of those loans (see Exhibit I-8). On the liability side of the balance sheet, management of interest rate risk has been pursued through maintaining a high concentration of deposits in lower cost and less interest rate sensitive transaction and savings accounts. Transaction and savings accounts comprised 47.5% of the Bank's deposits at June 30, 2007. The infusion of stock proceeds will serve to further limit the Bank's interest rate risk exposure, as most of the net proceeds will be redeployed into interest-earning assets and the increase in the Bank's capital will lessen the proportion of interest rate sensitive liabilities funding assets.
Lending Activities and Strategy
Sound's lending activities emphasize 1-4 family permanent mortgage loans and home equity loans and such loans continue to comprise the largest component of the Bank's loan portfolio. Beyond 1-4 family and home equity loans, lending diversification by the Bank has emphasized commercial real estate loans followed by manufactured home loans and automobile loans. Other noteworthy areas of lending diversification for the Bank include commercial business loans and construction loans. Going forward, the Bank's lending strategy is expected to remain fairly consistent with recent historical trends, with the origination of 1-4 family permanent and home equity mortgage loans remaining as the primary source of loan originations and commercial real estate loans continuing to expand as a portion of the lending operations. Growth of home equity loans and commercial business loans will also be emphasized as desired
RP® FINANCIAL, LC.
Page 1.12
areas of loan growth going forward. Exhibit I-9 provides historical detail of Sound's loan portfolio composition over the past five and one-half years and Exhibit I-10 provides the contractual maturity of the Bank's loan portfolio by loan type as of June 30, 2007.
Sound originates both fixed rate and adjustable rate 1-4 family permanent mortgage loans. The Bank typically sells a portion of the fixed rate loan originations into the secondary market for purposes of interest rate risk management. The Bank retains the servicing on essentially all loans that are sold, most of which are sold to Fannie Mae. Currently, all ARM loans are offered with annual adjustments and life-time rate caps, generally with a maximum annual rate change of 2% and maximum overall rate change of 6%. ARM loans are generally indexed to the rate on the one-year Treasury bills. Fixed rate 1-4 family mortgage loans offered by the Bank have terms of up to 40 years. Fixed rate loans include loans with five-to-seven year terms and 30-year amortization periods with a refinancing option at the end of the initial term and 30-year mortgages with a one-time interest adjustment five or seven years after origination. Loans are generally underwritten to secondary market standards. As of June 30, 2007, the Bank's outstanding balance of 1-4 family loans equaled $84.9 million or 39.4% of total loans outstanding.
Home equity loans, consisting of fixed-rate loans and variable-rate lines of credit, comprise the second largest portion of the Bank's loan portfolio. At June 30, 2007, home equity lines of credit totaled $23.2 million and home equity loans totaled $18.0 million, or 19.1% of total loans. Home equity lines of credit are originated up to a 90% loan to value ratio ("LTV") and in amounts of up to $500,000. Such loans carry an adjustable rate of interest based on the prime rate of interest plus a margin. Home equity lines of credit generally have up to a 12-year draw period, after which the loan terms require payment over a 15-year period based on the loan balance at that time. Sound also originates fixed-rate home equity loans for up to 100% LTV's of the appraised value of the subject property. Home equity loans have terms of up to 20 years and are fully amortizing.
The balance of the mortgage loan portfolio consists of commercial real estate loans, which are collateralized by properties in the Bank's primary market area. Commercial real estate loans are generally offered as fixed rate loans for a five year term and a 20-25 year amortization period. At the end of the initial five year period, the loans either carry a balloon feature, or
RP® FINANCIAL, LC.
Page 1.13
reprice at a spread above the prime rate of interest for another five year term. LTV's are generally limited to 80% and these loans require a minimum debt-coverage ratio. Properties securing the commercial real estate loan portfolio include retail centers, warehouses and office buildings, along with a limited amount of multi-family properties. As of June 30, 2007, the Bank's outstanding balance of commercial real estate loans equaled $22.8 million or 10.6% of the total loan portfolio.
Construction loans originated by the Bank consist of loans to finance the construction of 1-4 family residences, non-residential properties and for acquisition of raw land for future development. Residential construction loans are generally interest only loans that provide for payment of only interest during the construction phase, which is usually up to 12 months. At the end of the construction phase, the loan either converts to a permanent mortgage loan or is paid off through a permanent loan from another lender. Residential construction loans are generally originated up to a maximum LTV of 100% of cost or 80% of appraised value at completion. Residential land loans are made to builders for the acquisition and development of lots for future residential construction, essentially all of which are in the local market area. These loans are generally originated up to a maximum LTV ratio of 75%. The Bank has engaged in a limited amount of commercial real estate construction loans for small retail properties, which are underwritten with similar terms as the residential construction loans. The Bank had no commercial construction loans as of June 30, 2007. As of that same date, Sound's outstanding balance of construction loans equaled $9.6 million or 4.5% of total loans outstanding.
The Bank's non-mortgage lending includes both commercial business lending and consumer lending. Consumer loans primarily include loans secured by manufactured homes and automobiles, with lesser amounts of loans secured by recreational vehicles, boats and loans secured by deposits. Manufactured home loans comprised the largest segment of the non-real estate secured consumer loan portfolio, and at June 30, 2007, these loans totaled $21.0 million, or 9.7% of the total loan portfolio. The Bank's lending activities in this area have increased substantially since fiscal 2003, with the balance of such loans increasing from $2.4 million as of December 31, 2003. These loans are made up to 90% of the lesser of the appraised value or purchase price of up to $200,000, terms of up to 20 years, generally with a 1% origination fee. Manufactured home loans are made directly to the occupant of the home. Sound has been active
RP® FINANCIAL, LC.
Page 1.14
in this type of lending (although at more modest levels) for an extended number of years, and has in place underwriting policies and procedures to manage the credit risk of these loans, including maintaining a reserve against the loan balances.
The second largest portion of the consumer loan portfolio consists of automobile loans that are secured by new or used automobiles, with approximately 80% of the portfolio secured by used autos. Reflecting the Bank's prior operations as a credit union, auto loans totaled $17.0 million, or 7.9% of total loans as of June 30, 2007. These loans are also originated directly to the owner of the automobile, have fixed interest rates and generally have terms up to seven years for new automobiles and six years for used automobiles. Sound generally offers automobile loans with a maximum LTV ratio of 100% of the lesser of the purchase price of the vehicle or the industry accepted value for the specific automobile.
Beyond manufactured homes and automobile loans, the Bank's consumer lending activities include boats, motorcycles and other recreational vehicles which typically have terms of up to 15 years and LTVs of up to 90%, depending on the collateral. Sound also offers unsecured personal loans with either a fixed rate of interest for a term of generally up to 48 months, or a revolving line of credit with a maximum limit of up to $50,000. These other consumer loans totaled $9.8 million, or 4.6% of total loans as of June 30, 2007.
The Bank maintained a commercial business loan portfolio of $9.2 million, or 4.3% of loans as of June 30, 2007. This has been an area of emphasis for Sound since the charter conversion in 2003, and the Bank intends to continue to increase the balance of such loans going forward. These loans are generated through extending loans to small- and medium-sized companies operating in the Bank's market area. Commercial business loans offered by the Bank include fixed rate loans of up to seven year terms and lines of credit with 12 month terms and interest-only payments during the term. These loans are generally adjustable rate loans with rates based on the prime rate of interest plus a margin.
Exhibit I-11 provides a summary of the Bank's lending activities over the past three and one-half years. Lending volumes have fluctuated over the past three and one-half years with total loans originated reaching a high of $122.7 million during 2005, decreasing to $98.8 million during 2006 and then remaining relatively stable at $47.4 million of originations for the six
RP® FINANCIAL, LC.
Page 1.15
months ended June 30, 2007. Within the loan categories, home equity loans have shown a general increase in volume, while most lending volumes have trended lower in the most recent period. During this period, 1-4 family loans and consumer (inclusive of home equity loans) were two largest sources of total originations, accounting for 45.9% and 18.5%, respectively. No loans were purchased during the past three and one-half years. Loan sales, consisting primarily of 1-4 family fixed rate loans, totaled $125.1 million for the three and one-half year period ending June 30, 2007, equal to 34% of total originations.
Asset Quality
The Bank's 1-4 family property secured lending emphasis and the sale of the credit card receivables has supported the favorable credit quality measures. The ratio of non-performing assets, inclusive of accruing loans past due 90 days or more, peaked at 0.56% of assets at year end 2002. The credit card receivables were generally charged off; otherwise, the level of non-performing loans would have been higher. As of June 30, 2007, as shown in Exhibit I-12, non-performing assets at June 30, 2007 consisted of $562,000 of non-accruing loans, equal to 0.24% of total assets, consisting of $365,000 of 1-4 family permanent mortgage loans, $13,000 of home equity loans and $184,000 of consumer loans.
To track the Bank's asset quality and the adequacy of valuation allowances, Sound has established detailed asset classification policies and procedures which are consistent with regulatory guidelines. Detailed asset classifications are reviewed quarterly by senior management and the Board. Pursuant to these procedures, when needed, the Bank establishes additional valuation allowances to cover anticipated losses in classified or non-classified assets. As of June 30, 2007, the Bank maintained valuation allowances of $674,000, equal to 0.31% of net loans receivable and 119.93% of non-accruing loans.
Funding Composition and Strategy
Deposits have consistently accounted for the major portion of the Bank's IBL and at June 30, 2007 deposits equaled 86.9%. Exhibit I-13 sets forth the Bank's deposit composition for the past three and one-half years and Exhibit I-14 provides the interest rate and maturity composition of the certificate of deposit ("CD") portfolio at June 30, 2007. Transaction and savings account
RP® FINANCIAL, LC.
Page 1.16
deposits constitute the largest portion of the Bank's deposit base, although recent trends in the Bank's deposit composition show that the concentration of transaction and savings accounts comprising total deposits has been declining. Transaction and savings account deposits equaled $87.1 million, or 47.5% of total deposits, at June 30, 2007, versus $92.8 million, or 58.4% of total deposits, at December 31, 2004. The largest portion of the core deposit base consists of money market accounts, which totaled $41.4 million, or 22.6% of total deposits.
The balance of the Bank's deposits consists of CDs, with Sound's current CD composition reflecting a higher concentration of short-term CDs (maturities of one year or less). As of June 30, 2007, the CD portfolio totaled $96.4 million, or 52.5% of total deposits, and 74.7% of the CDs were scheduled to mature in one year or less. As of June 30, 2007, jumbo CDs (balances exceeding $100,000) amounted to $43.4 million, or 45% of total CDs. The Bank does not maintain any brokered CDs. Growth of CDs in recent years has been facilitated by a general increase in CD rates, thereby increasing the attractiveness of those deposits relative to lower yielding transaction and savings account deposits. From year end 2004 through June 30, 2007, the Bank's balance of CDs increased by $30.3 million.
Borrowings serve as an alternative funding source for the Bank to facilitate management of funding costs and interest rate risk. Sound maintained $27.7 million of FHLB advances at June 30, 2007 with a weighted average rate of 4.96%, which included either short-term overnight advances or advances that had fixed interest rates with maturity dates through 2011. Exhibit I-15 provides further detail of the Bank's borrowings activities during the past three and one-quarter years.
Subsidiaries
Sound currently has one inactive subsidiary, which was formed to originate mortgages for non-customers during the credit union period. The Bank's investment in this subsidiary was $2,400 as of June 30, 2007.
RP® FINANCIAL, LC.
Page 1.17
Legal Proceedings
The Bank is not involved in any pending legal proceedings other than routine legal proceedings occurring in the ordinary course of business which, in the aggregate, are believed by management to be immaterial to the financial condition of the Bank.
RP® FINANCIAL, LC.
Page 2.1
II. MARKET AREA
Introduction
Sound conducts operations out of five branches and one administrative office in the Puget Sound region of Washington. The administrative office is located in downtown Seattle, in King County, Washington. The branches extend to Snohomish County to the north, Pierce County to the south, and Clallam County to the west (data regarding the office locations is presented in Exhibit II-1). The primary market area for business operations is the Seattle-Tacoma-Bellevue, WA Metropolitan Statistical Area (the "Seattle MSA"), while Clallam County is part of the Port Angeles, WA Micropolitan Statistical Area (the "Port Angeles Micro SA"). The population of the Seattle MSA was an estimated 3.3 million in 2007, approximately one-half of the state's population, representing a large population base for potential business, while Clallam County, across Puget Sound, covers the northern part of the coastal range area, and is a rural and less populated area. The Seattle MSA has a well-developed urban area in the western portion along Puget Sound, with the central and eastern portions remaining undeveloped, rural and mountainous.
The region has long experienced a relatively steady economy, not experiencing boom and bust time periods as has been common in other areas of the country. The regional economy has had a historical dependence on the aerospace industry which has had periods of strong growth and alternatively, reductions in activity. In the recent past, the region has been impacted by adverse trends in several of its major industries including technology, aerospace and shipping/transportation (particularly Asia-related trade). However, over the past few years growth rates have been steady and long-term growth trends are favorable as the market area continues to maintain a highly educated and motivated workforce, and the Seattle metropolitan area remains a desirable place to live.
A map showing the Bank's office coverage is set forth in Exhibit I-1. Future growth opportunities for Sound depend on the growth and stability of the regional economy, demographic growth trends, and the nature and intensity of the competitive environment. These factors have been briefly examined in the following pages to help determine the growth potential that exists for the Bank and the relative economic health of Sound's market area. The growth
RP® FINANCIAL, LC.
Page 2.2
potential and the stability provided by the market area have a direct bearing on the market value of the Bank, and will be factored into our valuation analysis accordingly.
National Economic Factors
The business potential of a financial institution is partially dependent on the future operating environment and growth opportunities for the banking industry and the economy as a whole. Trends in the national economy, such as employment and gross national product growth, improved during the 12 month period ending June 2007, as total U.S. employment increased by 2.6 million jobs, although there remains uncertainty about the near term future, particularly in the areas of the unknown resolution of the war in Iraq, the current unstable prices of oil and gasoline, the near-term future performance of the real estate industry, including both residential and commercial real estate prices, and other world-wide tensions, all of which have the potential to impact future economic growth. Annualized growth in gross domestic product was 1.3% (advance estimate) for the first quarter of 2007, compared to 2.5% in the fourth quarter of 2006 and 5.6% in the year ago first quarter. The inflation rate increased modestly during the first eleven months of 2006, in part because of the varying effect of energy costs. Inflation totaled 3.2% for all of 2006, and was 2.3% on an annualized basis for the first two months of 2007. The growth in employment also led to fears that wages could increase if shortfalls of available labor appear. The unemployment rate declined to 4.3% as of April 2007, a decline from 4.5% in February 2007 and down from 4.7% in March 2006, all of which represent relatively low levels in comparison to recent historical averages. The current and projected size of government spending and deficits also has the ability to impact the longer-term economic performance of the country. Various other indicators show the economy performing relatively well, such as consumer spending and improving industrial capacity utilization.
The major stock exchange indices have shown relatively strong increases during the most recent 12 month period (although such indices were relatively stable during the most three month period), with the positive performance due in part to continued low evidence of inflation, economic growth, and the perception that the Federal Reserve likely will not raise interest rates in the near term future. As an indication of the changes in the nation's stock markets over the last 12 months, as of June 30, 2007, the Dow Jones Industrial Average closed at 13408.62, an
RP® FINANCIAL, LC.
Page 2.3
increase of 20.3% from June 30, 2006, while the NASDAQ Composite Index stood at 2603.23, an increase of 19.9% over the same time period. The Standard & Poors 500 Index totaled 1503.35 as of June 30, 2007, an increase of 18.4% from June 30, 2006.
Regarding factors that most directly impact the banking and financial services industries, in the past year certain data has indicated that the relatively strong housing market that existed in the early part of this decade has cooled down, as the level of existing and new home sales and housing starts have shown fluctuations, including decreases in some recent months, the number of homes for sale has increased in many regions, and the median home price for the nation has recorded a modest decline from one year ago. Most recently, the issue of subprime loans, and the recent rise in delinquency rates of these types of loans, has created a high level of uncertainty in the housing market. Should residential mortgage loan delinquency rates rise, continue to remain elevated, and cause a high level of borrower defaults, the 2007 residential housing market performance is likely to suffer. This uncertainty has to some extent also affected other housing related sectors of the economy, such as building materials. Thus, many analysts are expressing uncertainty as to when the housing market will bottom-out, nationally, and resume an upward trend as far as home values. The 2007 home real estate sales activity will provide additional indications as to whether the housing market has begun to recover in terms of pricing and demand, or whether additional time will be required for a shake-out of the inflated housing market of 2004 and 2005. Overall, housing prices and land values remain well above the levels of the late 1990s, providing continued support for most traditional loan values. Commercial development trends are also showing some signs of weakness in certain areas of the country, while at the same time other areas are reporting relatively strong sales activity and prices.
Interest Rate Environment
Through the first half of 2004, in a reaction to try to avoid a significant slowdown of the economy, the Federal Reserve lowered key market interest rates to historical lows not seen since the 1950s, with the federal funds rate equal to 1.00% and the discount rate equal to 2.00%. Beginning in June 2004, the Fed began slowly, but steadily increasing the federal funds and overnight interest rates in order to ward off any possibility of inflation. Through June 2006, the Fed had increased interest rates a total of 17 times, and as of the latest Fed rate increase, effective
RP® FINANCIAL, LC.
Page 2.4
in June 2006, the Fed Funds rate was 5.25%, up from 1.00% in early 2004, but down from 6.50% at the beginning of 2001, while the Discount Rate stood at 6.25%, up from 2.00% in early 2004. Since the June 2006 meeting, the Fed has not changed interest rates, and economists are studying various news releases and minutes of Fed board meetings in order to determine the likelihood of interest rate increases or decreases by the Fed. As detailed in the minutes of the March and May 2007 Fed board meetings, the Fed held interest rates steady but noted it was still wary of inflation - a sign the Fed may increase rates in order to avoid further increases in inflation rates. In addition, the Fed dropped language that would indicate that rates would be raised to avoid an overheated economy. Thus, the Fed continues to closely monitor the U.S. economy and trends, with the potential to change interest rates based on a combination of factors. The effect of the interest rate increases since 2004 has been most evident in short term rates, which increased more than longer term rates. In 2006, the yield curve became inverted, with long term rates modestly lower than short term rates, although in mid-2007 the yield curve has at times returns to a positive, but modest, slope. As of June 30, 2007, one- and ten-year U.S. government bonds were yielding 4.91% and 5.03%, respectively, compared to 5.21% and 5.15%, respectively, as of June 30, 2006. This has negatively impacted the performance of many financial institutions, as they rely on a spread between the yields on longer term assets and the costs of shorter term funding sources. Exhibit II-2 provides historical interest rate trends.
Market Area Demographics
Table 2.1 presents information regarding the demographic and economic trends for the Bank's market area from 2000 to 2007 and projected through 2012, with additional data shown in Exhibit II-3. Data for the nation and the State of Washington is included for comparative purposes. The size and scope of the market area is evidenced by the demographic data, which shows that as of 2007 the total population of the Seattle MSA was 3.328 million, approximately 51% of the state population. Most of the population base is concentrated along the western border of the region, against Puget Sound, resulting in a relatively urban market area for Sound. Between 2000 and 2007 the annual population growth rate of the Seattle MSA was slightly lower than the state rate and slightly higher than the national rate, indicating a moderately growing area, with King County reporting the slowest growth rate and the more "suburban" counties of
RP® FINANCIAL, LC.
Page 2.5
| RP® Financial, LC. | ||||||
| Page 2.5 | ||||||
| Table 2.1 | ||||||
| Sound Community Bank | ||||||
| Summary Demographic Data | ||||||
| Year | Annual Growth Rate | |||||
| 2000 | 2007 | 2012 | 2000-2007 | 2008-2012 | ||
| Population (000) | ||||||
| United States | 281,422 | 306,348 | 325,526 | 1.2% | 1.2% | |
| Washington | 5,894 | 6,516 | 6,976 | 1.4% | 1.4% | |
| Seattle-Tacoma-Bellevue MSA | 3,044 | 3,328 | 3,532 | 1.3% | 1.2% | |
| King County | 1,737 | 1,860 | 1,944 | 1.0% | 0.9% | |
| Pierce County | 701 | 783 | 843 | 1.6% | 1.5% | |
| Snohomish County | 606 | 673 | 729 | 1.5% | 1.6% | |
| Clallam County | 64 | 71 | 77 | 1.4% | 1.6% | |
| Households (000) | ||||||
| United States | 105,480 | 115,337 | 122,831 | 1.3% | 1.3% | |
| Washington | 2,271 | 2,514 | 2,695 | 1.5% | 1.4% | |
| Seattle-Tacoma-Bellevue MSA | 1,197 | 1,315 | 1,398 | 1.4% | 1.2% | |
| King County | 711 | 764 | 800 | 1.0% | 0.9% | |
| Pierce County | 261 | 292 | 316 | 1.6% | 1.6% | |
| Snohomish County | 225 | 258 | 282 | 2.0% | 1.8% | |
| Clallam County | 27 | 31 | 33 | 1.7% | 1.8% | |
| Median Household Income ($) | ||||||
| United States | $42,164 | $53,154 | $62,503 | 3.4% | 3.3% | |
| Washington | 45,770 | 59,060 | 70,229 | 3.7% | 3.5% | |
| Seattle-Tacoma-Bellevue MSA | 51,488 | 67,187 | 80,720 | 3.9% | 3.7% | |
| King County | 53,383 | 71,420 | 86,191 | 4.2% | 3.8% | |
| Pierce County | 45,197 | 57,619 | 68,716 | 3.5% | 3.6% | |
| Snohomish County | 53,219 | 68,275 | 80,881 | 3.6% | 3.4% | |
| Clallam County | 36,481 | 45,334 | 53,080 | 3.2% | 3.2% | |
| Per Capita Income ($) | ||||||
| United States | $21,587 | $27,916 | $33,873 | 3.7% | 3.9% | |
| Washington | 22,973 | 29,955 | 36,734 | 3.9% | 4.2% | |
| Seattle-Tacoma-Bellevue MSA | 26,332 | 34,819 | 43,295 | 4.1% | 4.5% | |
| King County | 29,521 | 39,393 | 49,679 | 4.2% | 4.7% | |
| Pierce County | 20,948 | 27,259 | 33,279 | 3.8% | 4.1% | |
| Snohomish County | 23,417 | 31,047 | 37,976 | 4.1% | 4.1% | |
| Clallam County | 19,517 | 25,474 | 30,496 | 3.9% | 3.7% | |
| $0 to | $25,000- | $50,000- | ||||
| 2006 HH Net Income Dist. (%) | $25,000 | $50,000 | $100,000 | $100,000+ | ||
| United States | 21.91% | 25.02% | 32.32% | 20.75% | ||
| Washington | 18.07% | 23.99% | 34.90% | 23.04% | ||
| Seattle-Tacoma-Bellevue MSA | 14.49% | 21.38% | 35.33% | 28.80% | ||
| King County | 14.02% | 19.78% | 33.70% | 32.50% | ||
| Pierce County | 17.42% | 25.42% | 37.11% | 20.05% | ||
| Snohomish County | 12.57% | 21.54% | 38.11% | 27.78% | ||
| Clallam County | 25.58% | 29.60% | 32.80% | 12.02% | ||
| 2006 Age Distribution(%) | 0-14 Yrs. | 15-34 Yrs. | 35-54 Yrs. | 55-69 Yrs. | 70+ Yrs. | |
| United States | 20.3% | 27.3% | 29.1% | 14.3% | 9.0% | |
| Washington | 19.6% | 27.7% | 29.8% | 14.7% | 8.1% | |
| Seattle-Tacoma-Bellevue MSA | 19.3% | 27.7% | 31.6% | 14.0% | 7.4% | |
| King County | 18.0% | 27.7% | 32.3% | 14.4% | 7.6% | |
| Pierce County | 20.4% | 28.8% | 29.7% | 13.6% | 7.5% | |
| Snohomish County | 21.2% | 26.7% | 31.9% | 13.6% | 6.7% | |
| Clallam County | 15.3% | 20.8% | 26.1% | 21.8% | 16.1% | |
| Source: SNL Financial, LC. | ||||||
RP® FINANCIAL, LC.
Page 2.6
Pierce and Snohomish reporting higher growth rates. Clallam County also reported a population growth rate in line with Pierce and Snohomish Counties, although the small population base of Clallam County restricted the actual increase in population to a low level. In most comparative areas, growth in households has paralleled trends with respect to population, as household growth rates for King County increased at a 1.0% annual rate compared to higher rates for the other counties. The slower growth in King County reflects the more developed characteristic of western King County, which is one of the older regions in the state.
Age distribution information in Table 2.1 illustrates that while most of the Seattle MSA population has a similar distribution of younger and older residents as the nation, Clallam County contains a very high level of residents with ages above 55 years - 37.9% versus 22.8% of the state and 23.3% nationally. This reflects the growth of Clallam County, and in particular the area of Sequim, Washington, as a major retirement center. A large number of residents have retired to this area, drawn by the lower cost of living, the attractive lifestyle of the ocean and mountains nearby, and temporate weather conditions.
The 2007 median household income and per capita income levels in King and Snohomish Counties were higher than the state and national averages, while Pierce County reported income levels slightly below the Washington state average and Clallam County reported the lowest income levels. Additional data regarding market area income levels is presented in Exhibit II-4. King and Snohomish Counties contain a larger percentage of white-collar professional employment. For example, the King County (the highest income levels) median household income was 121% of the state average and 134% of the national average. Household income distribution patterns provide support for earlier statements regarding the nature of the Bank's market as approximately 66% of King County households had income levels in excess of $50,000 annually in 2007 while the ratio was 58% for the State of Washington and 53% for the national average. In 2005, the city of Seattle was ranked as the most well educated city in the country, with the largest concentration of residents that hold college degrees. Seattle's relatively high income coupled with high education levels for a major city, results in King County placing among the 100 wealthiest counties in the United States, which will favorably influence demand for the products and services offered by financial services providers operating in the market.
RP® FINANCIAL, LC.
Page 2.7
Summary of Local Economy
The Seattle MSA area is the largest business center in both the State of Washington and the Pacific Northwest. Currently, key elements of the economy are aerospace, military bases, clean technology, biotechnology, education, information technology, logistics, international trade and tourism. The region is well known for the long presence of The Boeing Corporation and Microsoft, two major industry leaders, and for its leadership in technology. The workforce in general is well-educated and strong in technology. Washington State's location with regard to the Pacific Rim, along with a deepwater port has made international trade a significant part of the regional economy (one in three jobs in Washington is tied to foreign exports). The Washington State ports handle 6% of all U. S. exports and 7% of all U.S. imports, and the top five trading partners with Washington State include Japan, Canada, China, Korea and Ireland. Tourism has also developed into a major industry for the area, due to the scenic beauty, temperate climate and easy accessibility.
King County, the location of city of Seattle, has the largest employment base and overall level of economic activity. King County's largest employers include The Boeing Company, Microsoft Corporation, and the University of Washington. Companies that are headquartered in King County include Alaska Airlines, Amazon.com, Attachmate, CostCo and Microsoft. Pierce County's economy is also well diversified with the presence of military related government employment (Fort Lewis Army Base, 39,000 employees, and McChord Air Force Base, 11,000 employees, along with health care (the Franciscan Health System, 3,900 employees and the Multicare Health System, 3,200 employees). In addition, there is a large employment base in the economic sectors of shipping (the Port of Tacoma) and aerospace employment (Boeing). Snohomish County to the north has an economy based on aerospace employment (Boeing), military (the Everett Naval Station) along with additional employment concentrations in biotechnology, electronics/computers, and wood products. The State of Washington's largest private employers, including the number of employees, are provided in Table 2.2. Eight of the largest employers in the state are headquartered in King County.
RP® FINANCIAL, LC.
Page 2.8
Table 2.2
Sound Community Bank
Major Private Employers in Washington
| Employer | Employees | |
| The Boeing Company | 59,219 | |
| Microsoft Corporation* | 28,007 | |
| University of Washington* | 21,358 | |
| The Kroger Company | 17,300 | |
| Alaska Airlines* | 9,936 | |
| Starbucks Corporation* | 8,806 | |
| Providence Health | 8,499 | |
| Group Health Corporation | 8,422 | |
| Washington Mutual, Inc.* | 7,968 | |
| Weyerhaeuser Corporation* | 7,700 | |
| Costco Wholesale Corporation* | 6,526 | |
| Multicare Health Systems | 5,500 | |
| Nordstroms Inc.* | 5,349 | |
| Macy's Northwest | 4,905 | |
| Safeway, Inc. | 4,881 | |
| Haggen, Inc. | 4,000 | |
| Safeco Corporation* | 3,700 | |
| Swedish Health | 3,583 | |
| Evergreen Healthcare | 2,700 | |
| *Headquartered in King County | ||
| Sources: Puget Sound Business Journal 2005 Supplement. |
Clallam County, operating in the separate region to the west of the Seattle MSA, has an employment base concentrated in the marine and forestry/forest resources sectors. In addition, the previously mentioned retirement-aged population has provided the need for additional resources in the areas of health care and elderly services. The largest employers in Clallam County include the Olympic Medical Center (584 full-time and 387 part-time), the Port Angeles School District (505 employees), Peninsula College (230 full-time and 243 part-time), Wal-Mart (425 employees), the Clallam Bay Corrections Center (419 employees), Clallam County Government (407 employees), Safeway (395 employees), 7 Cedars Casino (370 employees), the Sequim School District (324 employees), City of Port Angeles (257 employees), Forks Community Hospital (254 employees), and the Nippon Paper Industries (242 employees).
RP® FINANCIAL, LC.
Page 2.9
Employment data, presented in Table 2.3 below, indicates that similar to many larger, developed areas of the country, services are the most prominent sector for the state of Washington and the four market area counties, comprising approximately 34% of total employment. The next largest component of the economy of the market area is wholesale and retail trade, at 14.8%, reflecting the trade employment in the ports of the Seattle region. Government employment was highest in Pierce and Clallam Counties, reflecting the military bases previously mentioned for Pierce County, with such employment related to the presence of Boeing. Manufacturing employment is highest in Snohomish County, the location of Boeing's largest manufacturing and assembly plant, while information-related employment is highest in King County, due to the impact of Microsoft and other information technology employers. King County's percentages of employment in the different sectors resembled that of the economy of Washington, which was provided for comparative purposes. This data indicates that the Seattle MSA and Clallam County have a relatively diversified economic base, such that a downturn in any one industry will likely not have a large impact on the regional economy. This diversification provides a level of stability that in a positive factor for financial institutions such as Sound.
Table 2.3
Sound Community Bank
Primary Market Area Employment Sectors
(Percent of Labor Force)
| Employ. Sectors | Washington | King | Pierce | Snohomish | Clallam | ||||||||||
| Services | 34.6 | % | 37.2 | % | 33.9 | % | 31.0 | % | 33.2 | % | |||||
| Wholesale/Retail Trade | 14.5 | 14.4 | 14.3 | 14.8 | 15.9 | ||||||||||
| Government | 16.0 | 11.6 | 22.8 | 14.7 | 20.0 | ||||||||||
| Finance/Ins./Real Estate | 8.1 | 9.6 | 7.9 | 8.3 | 7.7 | ||||||||||
| Manufacturing | 7.7 | 7.9 | 5.4 | 15.5 | 5.0 | ||||||||||
| Construction | 6.4 | 5.5 | 7.5 | 8.6 | 7.9 | ||||||||||
| Information | 2.8 | 5.2 | 1.1 | 1.6 | 1.2 | ||||||||||
| Transportation/Public Util. | 3.0 | 3.6 | 3.6 | 1.6 | 2.1 | ||||||||||
| Arts, Entertainment | 2.3 | 2.7 | 1.9 | 2.0 | 2.0 | ||||||||||
| Farming | 2.0 | 0.1 | 0.5 | 0.7 | 1.2 | ||||||||||
| Other | 2.5 | 2.1 | 1.2 | 1.2 | 3.9 | ||||||||||
| 100.0 | % | 100.0 | % | 100.0 | % | 100.0 | % | 100.0 | % | ||||||
| Source: REIS DataSource. | |||||||||||||||
RP® FINANCIAL, LC.
Page 2.10
Unemployment Data and Trends
Table 2.4 below, provides unemployment data which shows that the unemployment rates in Pierce and Clallam Counties have increased slightly over the first seven months of 2007 from the average for all of 2006, while the unemployment rate for all of Washington State has declined modestly. King and Snohomish Counties reported unemployment rates lower than the state and national averages, while the unemployment rate for Washington was slightly lower than the national unemployment rate. The lower unemployment rate in King County is reflective of the underlying strength of the local economy. Clallam County reported the highest unemployment rate, although the rate for a smaller, rural county can be impacted to a greater extent by changes in one large employer.
Table 2.4
Sound Community Bank
Market Area Unemployment Trends
| Region | 2006 Annual Unemployment | July 2007 Unemployment | |
| United States | 4.6% | 4.9% | |
| Washington | 5.0% | 4.7% | |
| King County | 4.2% | 3.7% | |
| Pierce County | 5.2% | 5.3% | |
| Snohomish County | 4.6% | 4.0% | |
| Clallam County | 5.9% | 6.1% | |
| Source: U.S. Bureau of Labor Statistics. | |||
Market Area Deposit Characteristics/Competition
Table 2.5 displays deposit market trends and deposit market share, respectively, for commercial banks and savings institutions in the market area from June 30, 2003 to June 30, 2006. Deposit growth trends are important indicators of a market area's current and future prospect's for growth. The table indicates that overall deposit growth rates in the Bank's market range from a low of 5.6% annually in King County over the past three years, compared to 8.1% in Pierce County, 9.9% annually in Snohomish County and 6.4% annually in Clallam County. Washington state deposits increased at a rate of 6.9% annually, with savings and loan associations declining in overall deposit, although part of this decline was due to a charter
RP® FINANCIAL, LC.
Page 2.11
| Table 2.5 | ||||||||||
| Sound Community Bank | ||||||||||
| Deposit Summary | ||||||||||
| As of June 30, | ||||||||||
| 2003 | 2006 | Deposit | ||||||||
| Deposits | Market Share | Number of Branches | Deposits | Market Share | No. of Branches | Growth Rate 2003-2006 | ||||
| (Dollars in Millions) | (%) | |||||||||
| Washington | $81,522,000 | 100.0% | 1,784 | $99,586,000 | 100.0% | 1,871 | 6.9% | |||
| Commercial Banks | 54,978,000 | 67.4% | 1,317 | 76,640,000 | 77.0% | 1,484 | 11.7% | |||
| Savings Institutions | 26,544,000 | 32.6% | 467 | 22,946,000 | 23.0% | 387 | -4.7% | |||
| King County | $40,179,000 | 100.0% | 503 | $47,353,000 | 100.0% | 526 | 5.6% | |||
| Commercial Banks | 26,750,000 | 66.6% | 362 | 36,328,000 | 76.7% | 389 | 10.7% | |||
| Savings Institutions | 13,429,000 | 33.4% | 141 | 11,025,000 | 23.3% | 137 | -6.4% | |||
| Sound Community | 73,482 | 0.2% | 2 | 92,759 | 0.2% | 2 | 8.1% | |||
| Pierce County | $6,438,000 | 100.0% | 194 | $8,126,000 | 100.0% | 199 | 8.1% | |||
| Commercial Banks | 4,806,000 | 74.7% | 147 | 6,526,000 | 80.3% | 156 | 10.7% | |||
| Savings Institutions | 1,632,000 | 25.3% | 47 | 1,600,000 | 19.7% | 43 | -0.7% | |||
| Sound Community | 6,267 | 0.1% | 1 | 8,249 | 0.1% | 1 | 9.6% | |||
| Snohomish County | $6,084,000 | 100.0% | 166 | $8,076,000 | 100.0% | 180 | 9.9% | |||
| Commercial Banks | 3,870,000 | 63.6% | 113 | 5,787,000 | 71.7% | 141 | 14.4% | |||
| Savings Institutions | 2,214,000 | 36.4% | 53 | 2,289,000 | 28.3% | 39 | 1.1% | |||
| Sound Community | 11,643 | 0.2% | 1 | 13,576 | 0.2% | 1 | 5.3% | |||
| Clallam County | $1,117,019 | 100.0% | 30 | $1,343,716 | 100.0% | 33 | 6.4% | |||
| Commercial Banks | 455,105 | 40.7% | 17 | 627,334 | 46.7% | 21 | 11.3% | |||
| Savings Institutions | 661,914 | 59.3% | 13 | 716,382 | 53.3% | 12 | 2.7% | |||
| Sound Community | 33,042 | 3.0% | 1 | 61,810 | 4.6% | 1 | 23.2% | |||
| Source: FDIC. | ||||||||||
RP® FINANCIAL, LC.
Page 2.12
conversion by Sterling Savings Bank, of Spokane, to a commercial bank. Future growth will be facilitated by the large size of the market overall, the competitive environment and the ability of the Bank to attract deposits to its one-office location.
As of June 30, 2006, Sound maintained relatively small deposit market shares in all three Seattle MSA counties, representative of the overall large size of the deposit base and indicating that future deposit gains and market share gains are possible. In the smaller market of Clallam County, the Bank reported a market share of 4.6%. Since June 30, 2003, Sound has increased deposits at a higher rate than the overall markets in King, Pierce and Clallam Counties, evidence that the Bank is competitive in the market. Sound's market share growth in Clallam County is significant and a positive factor in overall deposit growth. As detailed in the data showing competitor deposits (see Table 2.6), significant competitors for the Bank consist of large nationwide and superregional banks, including Bank of America, Washington Mutual and Key Bank, NA, all of which maintain a strong presence in the regional market. This factor, however, allows Sound to position itself as a community bank, locally owned and managed. Additionally, credit unions such as Boeing Employees Credit Union are also formidable competitors.
Summary
The overall condition of the primary market area can be characterized as positive, with growth potential in King County and the other counties of the Seattle MSA, and Clallam County based on regional population and economic projections. The overall total population base within the Bank's market area provides the potential for additional banking customers. In addition, income levels are relatively high and growing in line with national averages, indicating an increasing amount of personal wealth for residents. Going forward, in view of the local demographic and economic trends and the numbers and types of competitors in the market area, the competition for deposits is expected to remain substantial, which will result in Sound having to pay competitive deposit rates, provide high quality service and continue to provide electronic banking capabilities to increase local market share.
RP® FINANCIAL, LC.
Page 2.13
Table 2.6
Sound Community Bank
Market Area Counties Deposit Competitors
| Location | Name |
| King County, WA | Bank of America (32.9%) US Bank NA (16.5%) Washington Mutual (13.7%) Keybank NA (8.2%) Sound Community (0.2%) |
| Pierce County, WA | Keybank NA (17.2%) Columbia State Bank (16.3%) Bank of America, NA (13.7%) Washington Mutual Bank (10.5%) Sound Community (0.1%) |
| Snohomish County, WA | Washington Mutual (17.0%) Frontier Bank (15.9%) Bank of America (14.5%) Cascade Bank (6.8%) Sound Community (0.2%) |
| Clallam County, WA | First FS&LA of Port Angeles (32.6%) Bank of American, NA (13.2%) Washington Mutual (11.2%) Keybank NA (6.0%) Sound Community (4.6%) |
| Source: FDIC. |
RP® FINANCIAL, LC.
Page 3.1
III. PEER GROUP ANALYSIS
This chapter presents an analysis of Sound's operations versus a group of comparable companies (the "Peer Group") selected from the universe of all publicly-traded savings institutions. The primary basis of the pro forma market valuation of Sound is provided by these public companies. Factors affecting the Bank's pro forma market value such as financial condition, credit risk, interest rate risk, and recent operating results can be readily assessed in relation to the Peer Group. Current market pricing of the Peer Group, subject to appropriate adjustments to account for differences between Sound and the Peer Group, will then be used as a basis for the valuation of Sound's to-be-issued common stock.
Peer Group Selection
The mutual holding company form of ownership has been in existence in its present form since 1991. As of the date of this appraisal, there were approximately 40 publicly-traded institutions operating as subsidiaries of MHCs. We believe there are a number of characteristics of MHC shares that make them different from the shares of fully-converted companies. These factors include: (1) lower aftermarket liquidity in the MHC shares since less than 50% of the shares are available for trading; (2) guaranteed minority ownership interest, with no opportunity of exercising voting control of the institution in the MHC form of organization; (3) the potential impact of "second-step" conversions on the pricing of public MHC institutions; (4) the regulatory policies regarding the dividend waiver by MHC institutions; and (5) most MHCs have formed mid-tier holding companies, facilitating the ability for stock repurchases, thus improving the liquidity of the stock on an interim basis. We believe that each of these factors has an impact on the pricing of the shares of MHC institutions, and that such factors are not reflected in the pricing of fully-converted public companies.
Given the unique characteristics of the MHC form of ownership, RP Financial concluded that the appropriate Peer Group for Sound's valuation should be comprised of subsidiary institutions of mutual holding companies. The selection of publicly-traded mutual holding companies for the Bank's Peer Group is consistent with the regulatory guidelines and other recently completed MHC transactions. Further, the Peer Group should be comprised of only
RP® FINANCIAL, LC.
Page 3.2
those MHC institutions whose common stock is either listed on a national exchange or is NASDAQ listed, since the market for companies trading in this fashion is regular and reported. We believe non-listed MHC institutions are inappropriate for the Peer Group, since the trading activity for thinly-traded stocks is typically highly irregular in terms of frequency and price and may not be a reliable indicator of market value. We have excluded from the Peer Group those public MHC institutions that are currently pursuing a "second-step" conversion and/or companies whose market prices appear to be distorted by speculative factors or unusual operating conditions. MHCs which have recently completed a minority stock offering have been excluded as well, due to the lack of a seasoned trading history and insufficient quarterly financial data that includes the impact of the offering proceeds. The universe of all publicly-traded institutions is included as Exhibit III-1.
Basis of Comparison
This appraisal includes two sets of financial data and ratios for the Peer Group institutions. The first set of financial data reflects the actual book value, earnings, assets and operating results reported by the Peer Group institutions in its public filings inclusive of the minority ownership interest outstanding to the public. The second set of financial data, discussed at length in the following chapter, places the Peer Group institutions on equal footing by restating their financial data and pricing ratios on a "fully-converted" basis through assuming the sale of the majority shares held by the MHCs in public offerings based on their current trading prices and standard assumptions for a thrift conversion offering. Throughout the appraisal, the adjusted figures will be specifically identified as being on a "fully-converted" basis. Unless so noted, the figures referred to in the appraisal will be actual financial data reported by the Peer Group institutions.
Both sets of financial data have their specific use and applicability to the appraisal. The actual financial data, as reported by the Peer Group companies and reflective of the minority interest outstanding, will be used in Chapter III to make financial comparisons between the Peer Group and the Bank. The differences between the Peer Group's reported financial data and the financial data of Sound are not significant enough to distort the conclusions of the comparison (in fact, such differences are greater in a standard conversion appraisal). The adjusted financial
RP® FINANCIAL, LC.
Page 3.3
data (fully-converted basis) will be more fully described and quantified in the pricing analysis discussed in Chapter IV. The fully-converted pricing ratios are considered critical to the valuation analysis in Chapter IV, because they place each Peer Group institution on a fully-converted basis (making their pricing ratios comparable to the pro forma valuation conclusion reached herein), eliminate distortion in pricing ratios between Peer Group institutions that have sold different percentage ownership interests to the public, and reflect the implied pricing ratios being placed on the Peer Group institutions in the market today to reflect the unique trading characteristics of publicly-traded MHC institutions.
Sound's Peer Group
Under ideal circumstances, the Peer Group would be comprised of ten publicly-traded Washington-based MHC institutions with capital, earnings, credit quality and interest rate risk comparable to Sound. However, given the limited number of publicly-traded institutions in the MHC form of ownership, the selection criteria was necessarily broad-based and not confined to a particular geographic market area. In light of the relatively small asset size of the Bank, the Peer Group companies were selected based on the following criteria: (1) ten smallest publicly-traded MHCs in terms of asset size with seasoned trading histories; and (2) profitable on a reported earnings basis. The asset sizes of the Peer Group companies ranged from $133 million to $398 million. The universe of all publicly-traded MHC institutions, exclusive of institutions that have announced second-step conversions, is included as Exhibit III-2 and Exhibit III-3 provides summary demographic and deposit market share data for the primary market areas served by each of the Peer Group companies.
Unlike the universe of fully-converted publicly-traded thrifts, which includes approximately 125 companies, the universe of public MHC institutions is small, thereby reducing the prospects of a highly comparable Peer Group. Nonetheless, because the trading characteristics of public MHC institution shares are significantly different from those of fully-converted companies, public MHC institutions were the most appropriate group to consider as Peer Group candidates for this valuation. Relying solely on full stock public companies for the Peer Group would not capture the difference in current market pricing for public MHC institutions and thus could lead to distorted valuation conclusions. The federal regulatory
RP® FINANCIAL, LC.
Page 3.4
agencies have previously concurred with this selection procedure of the Peer Group for MHC valuations. To account for differences between Sound and the MHC Peer Group in reaching a valuation conclusion, it will be necessary to make certain valuation adjustments. The following discussion addresses financial similarities and differences between Sound and the Peer Group.
Table 3.1 on the following page lists key general characteristics of the Peer Group companies. Although there are differences among several of the Peer Group members, by and large they are well-capitalized and profitable institutions and their decision to reorganize in MHC form suggests a commonality of operating philosophy. Importantly, the trading prices of the Peer Group companies reflect the unique operating and other characteristics of public MHC institutions. While the Peer Group is not exactly comparable to Sound, we believe such companies form a good basis for the valuation of Sound, subject to certain valuation adjustments.
In aggregate, the Peer Group companies maintain a higher level of capital relative to the universe of all public thrifts (17.38% of assets versus 12.58% for the all public average), generate slightly lower core earnings on a return on average assets basis (0.44% ROAA versus 0.49% for the all public average), and generate a lower core return on equity (3.10% ROE versus 4.70% for the all public average). The summary table below underscores the key differences, particularly in the average pricing ratios between full stock and MHC institutions (both as reported and on a fully-converted basis).
RP® FINANCIAL, LC.
Page 3.5
| Table 3.1 | ||||||||||||||||||||
| Peer Group of Publicly-Traded Thrifts | ||||||||||||||||||||
| September 12, 2007(1) | ||||||||||||||||||||
| Operating | Total | Fiscal | Conv. | Stock | Market | |||||||||||||||
| Ticker | Financial Institution | Exchange | Primary Market | Strategy(2) | Assets | Offices | Year | Date | Price | Value | ||||||||||
| ($) | ($Mil) | |||||||||||||||||||
| BFSB | Brooklyn Federal MHC of NY (30.0) | NASDAQ | Brooklyn, NY | Thrift | $398 | 4 | 09-30 | 04/05 | $14.01 | $188 | ||||||||||
| UCBA | United Comm. Bancorp MHC IN (45.0) | NASDAQ | Lawrenceburg, IN | Thrift | $386 | M | 5 | 06-30 | 03/06 | $12.40 | $103 | |||||||||
| LSBK | Lake Shore Bancorp MHC of NY (45.0) | NASDAQ | Dunkirk, NY | Thrift | $349 | 8 | 12-31 | 04/06 | $10.40 | $67 | ||||||||||
| GCBC | Green County Bancorp MHC of NY (44.4) | NASDAQ | Catskill, NY | Thrift | $326 | 7 | 06-30 | 12/98 | $12.28 | $51 | ||||||||||
| CHEV | Cheviot Financial Corp. MHC of OH (42.1) | NASDAQ | Cincinnati, OH | Thrift | $316 | 5 | 12-31 | 01/04 | $11.99 | $110 | ||||||||||
| NECB | NE Comm. Bancorp MHC of NY (45.0) | NASDAQ | White Plains, NY | Thrift | $306 | 6 | 12-31 | 07/06 | $10.40 | $138 | ||||||||||
| PBHC | Pathfinder BC MHC of NY (35.8) | NASDAQ | Oswego, NY | Thrift | $305 | 8 | 12-31 | 11/95 | $10.98 | $27 | ||||||||||
| JXSB | Jacksonville Bancorp MHC of IL (47.7) | NASDAQ | Jacksonville, IL | Thrift | $275 | 8 | 12-31 | 04/95 | $13.39 | $27 | ||||||||||
| KFFB | KY First Fed. Bancorp MHC of KY (44.5) | NASDAQ | Hazard, KY | Thrift | $267 | M | 1 | 06-30 | 03/05 | $9.89 | $82 | |||||||||
| GOV | Gouverneur Bancorp MHC of NY (42.8) | AMEX | Gouverneur, NY | Thrift | $133 | 2 | 09-30 | 03/99 | $11.05 | $25 | ||||||||||
| NOTES: | (1) | Or most recent date available (M=March, S=September, D=December, J=June, E=Estimated, and P=Pro Forma). |
| (2) | Operating strategies are: Thrift=Traditional Thrift, M.B.=Mortgage Banker, R.E.=Real Estate Developer, Div.=Diversified and Ret.=Retail Banking. | |
| (3) | BIF-insured savings bank institution. | |
| Source: | Corporate offering circulars, data derived from information published in SNL Securities Quarterly Thrift Report, and financial reports of publicly-traded thrifts. |
RP® FINANCIAL, LC.
Page 3.6
| All Publicly- Traded(1) | Reported Basis | Fully Converted Basis (Pro Forma) | ||||||||
| Financial Characteristics (Averages) | ||||||||||
| Assets ($Mil) | 3,136 | 306 | 347 | |||||||
| Equity/Assets (%) | 12.58 | % | 17.38 | % | 26.14 | |||||
| Core Return on Assets (%) | 0.49 | 0.44 | 0.61 | |||||||
| Core Return on Equity (%) | 4.70 | 3.10 | 2.60 | |||||||
| Pricing Ratios (Averages)(2) | ||||||||||
| Core Price/Earnings (x) | 20.71 | x | 21.46 | x | 28.22 | x | ||||
| Price/Book (%) | 130.65 | % | 145.72 | % | 83.76 | % | ||||
| Price/Assets (%) | 16.47 | 25.67 | 22.14 | |||||||
| (1) | Includes thrifts in full stock and MHC form. | |
| (2) | Based on market prices as of August 31, 2007. |
The following sections present a comparison of Sound's financial condition, income and expense trends, loan composition, interest rate risk and credit risk versus the figures reported by the Peer Group. The conclusions drawn from the comparative analysis are then factored into the valuation analysis discussed in the final chapter.
Financial Condition
Table 3.2 shows comparative balance sheet measures for Sound and the Peer Group (as of June 30, 2007 or the most recent date publicly available). Sound's equity ratio of 6.9% of assets was well below the Peer Group's average ratio of 17.4%. With the consummation of the reorganization and infusion of the net conversion proceeds, the Bank will continue to maintain a lower equity ratio than the Peer Group average. All of the Bank's equity consisted of tangible equity, while the Peer Group's equity included intangibles equal to 0.8% of assets. While Sound's lower pro forma equity ratio will be less favorable from a risk and leverage perspective, the potential for a market level ROE is more achievable in the short-to-intermediate term.
The Bank's asset composition reflects a higher proportion of loans than for the Peer Group at 93.2% and 69.0%, respectively. In contrast, the Bank's cash and investments-to-assets ratio of 3.4% was lower than the Peer Group ratio of 25.4%. Overall, Sound's interest-earning
RP® FINANCIAL, LC.
Page 3.7
| Table 3.2 | |||||||||||||||||||||||
| Balance Sheet Composition and Growth Rates | |||||||||||||||||||||||
| Comparable Institution Analysis | |||||||||||||||||||||||
| As of June 30, 2007 | |||||||||||||||||||||||
| Balance Sheet as a Percent of Assets | Balance Sheet Annual Growth Rates | Regulatory Capital | |||||||||||||||||||||
| Cash & | MBS & | Borrowed | Subd. | Net | Goodwill | Tng Net | MEMO: | MBS, Cash & | Borrows. | Net | Tng Net | ||||||||||||
| Equivalents | Invest | Loans | Deposits | Funds | Debt | Worth | & Intang | Worth | Pref.Stock | Assets | Investments | Loans | Deposits | &Subdebt | Worth | Worth | Tangible | Core | Reg.Cap. | ||||
| Sound Financial, Inc. of WA | |||||||||||||||||||||||
| June 30, 2007 | 2.8% | 0.6% | 93.2% | 79.6% | 12.0% | 0.0% | 6.9% | 0.0% | 6.9% | 0.0% | 8.45% | 12.59% | 8.38% | 6.01% | 19.04% | 12.97% | 12.97% | 6.93% | 6.93% | 10.47% | |||
| All Public Companies | |||||||||||||||||||||||
| Averages | 4.4% | 19.8% | 70.2% | 68.7% | 17.0% | 0.7% | 12.4% | 1.0% | 11.4% | 0.0% | 4.19% | -1.30% | 7.80% | 5.50% | -3.95% | 2.53% | 1.93% | 10.78% | 10.62% | 17.81% | |||
| Medians | 2.7% | 18.1% | 70.6% | 70.6% | 15.4% | 0.0% | 10.6% | 0.1% | 9.3% | 0.0% | 2.76% | -3.77% | 7.15% | 3.53% | -6.67% | 2.42% | 1.88% | 9.35% | 9.33% | 15.04% | |||
| State of WA | |||||||||||||||||||||||
| Averages | 3.1% | 13.6% | 77.5% | 65.8% | 20.9% | 0.7% | 11.7% | 1.4% | 10.3% | 0.0% | 7.23% | -1.09% | 12.30% | 8.11% | -17.03% | 3.07% | 1.83% | 11.03% | 11.03% | 15.05% | |||
| Medians | 1.8% | 14.2% | 79.7% | 64.5% | 22.2% | 0.0% | 11.9% | 1.1% | 10.2% | 0.0% | 8.52% | -10.91% | 11.73% | 8.03% | -7.84% | 5.85% | 2.03% | 10.91% | 10.91% | 13.41% | |||
| Comparable Group | |||||||||||||||||||||||
| Averages | 4.5% | 20.9% | 69.0% | 71.7% | 9.2% | 0.2% | 17.4% | 0.8% | 16.6% | 0.0% | 3.34% | -11.80% | 9.90% | 0.99% | 0.34% | 1.70% | 1.94% | 14.03% | 12.89% | 23.29% | |||
| Medians | 2.4% | 22.2% | 68.3% | 70.8% | 6.3% | 0.0% | 15.7% | 0.0% | 15.7% | 0.0% | 4.26% | -6.95% | 8.14% | 6.03% | 4.10% | 0.88% | 2.46% | 14.90% | 13.45% | 24.00% | |||
| Comparable Group | |||||||||||||||||||||||
| BFSB | Brooklyn Federal MHC of NY (30.0) | 2.4% | 21.1% | 71.8% | 70.7% | 5.9% | 0.0% | 21.4% | 0.0% | 21.4% | 0.0% | 4.95% | -23.78% | 18.37% | 6.34% | -8.34% | 8.49% | 8.49% | 16.80% | 16.80% | 24.00% | ||
| CHEV | Cheviot Fin. Corp. MHC of OH (42.1) | 1.7% | 16.7% | 77.9% | 67.1% | 10.3% | 0.0% | 22.0% | 0.0% | 22.0% | 0.0% | 4.74% | -3.06% | 6.00% | 7.61% | 8.20% | -4.55% | -4.55% | 16.40% | 16.40% | 32.80% | ||
| GOV | Gouverneur Bncrp. MHC of NY (42.8) | 2.3% | 9.1% | 82.0% | 56.6% | 26.1% | 0.0% | 15.4% | 0.0% | 15.4% | 0.0% | 3.78% | -6.83% | 4.38% | 1.12% | 9.34% | 5.05% | 5.05% | 14.90% | 14.90% | 26.70% | ||
| GCBC | Green Co. Bncrp. MHC of NY (44.4) | 4.3% | 27.0% | 63.6% | 87.2% | 1.5% | 0.0% | 10.9% | 0.0% | 10.9% | 0.0% | 5.94% | -1.83% | 9.04% | 5.94% | 0.00% | 5.46% | 5.46% | 10.07% | 10.07% | 19.97% | ||
| JXSB | Jacksonville Bncrp. MHC of IL (47.7) | 1.8% | 34.3% | 58.4% | 86.2% | 4.3% | 0.0% | 7.6% | 1.0% | 6.6% | 0.0% | 6.54% | 2.97% | 9.91% | 6.12% | 17.10% | 5.73% | 7.16% | NA | 7.19% | 12.28% | ||
| KFFB | KY Fst Fed Bncrp MHC of KY(44.5)(1) | 0.7% | 29.6% | 61.5% | 52.1% | 23.8% | 0.0% | 23.3% | 5.7% | 17.7% | 0.0% | 1.89% | -7.08% | 7.23% | -3.34% | 22.48% | -3.46% | -4.27% | NA | NA | NA | ||
| LSBK | Lake Shore Bncrp. MHC of NY (45.0) | 3.2% | 31.2% | 59.9% | 70.9% | 12.2% | 0.0% | 14.9% | 0.0% | 14.9% | 0.0% | -0.51% | -7.16% | 1.84% | 1.20% | -7.79% | -1.88% | -1.88% | 12.00% | 12.00% | 24.00% | ||
| NECB | NE Comm. Bancorp MHC of NY (45.0) | 13.5% | 3.4% | 77.8% | 59.6% | 1.3% | 0.0% | 35.2% | 0.0% | 35.2% | 0.0% | -1.88% | -48.05% | 17.53% | -31.32% | NM | NM | NM | NA | NA | NA | ||
| PBHC | Pathfinder BC MHC of NY (35.8) | 2.4% | 23.3% | 67.0% | 83.7% | 6.7% | 1.7% | 6.8% | 1.3% | 5.5% | 0.0% | 2.56% | -4.54% | 6.79% | 9.80% | -38.27% | 0.88% | 2.46% | NA | NA | NA | ||
| UCBA | United Comm. Bncrp. MHC IN (45.0)(1) | 12.5% | 13.4% | 69.5% | 83.2% | 0.0% | 0.0% | 16.1% | 0.0% | 16.1% | 0.0% | 5.43% | -18.62% | 17.88% | 6.40% | NM | -0.43% | -0.43% | NA | NA | NA | ||
| (1) | Financial information is for the quarter ending March 31, 2007. | ||||||||||||||||||||||
| Source: | Audited and unaudited financial statements, corporate reports and offering circulars, and RP® Financial, LC. calculations. The information provided in this table has been obtained from sources we believe are reliable, but we cannot guarantee the accuracy or completeness of such information. |
| Copyright (c) 2007 by RP® Financial, LC. | |
RP® FINANCIAL, LC.
Page 3.8
assets amounted to 96.6% of assets, which exceeded the comparable Peer Group ratio of 94.4%, reflecting the Bank's limited investment in fixed assets.
Sound's funding composition reflects a higher ratio of deposits at 79.6%, which exceeds the Peer Group's ratio of 71.7%. In addition, borrowings also accounted for a higher portion of assets at 12.0% and 9.4%, respectively. The primary difference is the equity levels, with the Bank having a much lower level. Total interest-bearing liabilities maintained by the Bank and the Peer Group, as a percent of assets, equaled 91.6% and 81.1%, respectively. Following the increase in equity provided by the net offering proceeds, the Bank's ratio of interest-bearing liabilities as a percent of assets will continue to be higher than the Peer Group's ratio, based on a lower pro forma equity position.
A key measure of balance sheet strength for a thrift institution is its IEA/IBL ratio. Presently, the Bank's IEA/IBL ratio is lower than the Peer Group's ratio, based on respective ratios of 105.5% and 116.4%. The additional equity realized from net offering proceeds should serve to increase the Bank's IEA/IBL ratio, but the Bank will maintain a comparative disadvantage relative to the Peer Group.
The growth rate section of Table 3.2 shows annual growth rates for key balance sheet items. Sound's growth rates are based on annualized growth based on the 18-month period ended June 30, 2007, while the Peer Group's growth rates are based on annual growth rates for the 12 months ended June 30, 2007 (or the most recent 12 month period available). Sound's assets increased at an 8.5% annual growth rate, versus a 3.3% increase in assets posted by the Peer Group on average. Sound's asset growth reflected in a 12.6% increase in cash and investments and an 8.4% increase in loans. Asset growth for the Peer Group was sustained by a 9.9% increase in loans, which was partially offset by an 11.8% decline in cash and investments.
The Bank's asset growth was funded with a 6.0% increase in deposits and a 19.0% increase in borrowings. The Peer Group posted a lower average deposit growth rate of 1.0% and a nominal increase in borrowings. Equity growth rates posted by the Bank and the Peer Group equaled 13.0% and 1.7%, respectively. The Bank's higher equity growth rate was supported by retention of all of its earnings and its lower equity ratio. Comparatively, the Peer Group's equity growth rate was slowed by the overall higher equity ratios but also through dividend payments
RP® FINANCIAL, LC.
Page 3.9
and stock repurchases during the period. The NM capital growth rate reflected for NE Community Bancorp resulted from the July 2006 offering. The increase in capital realized from stock proceeds will likely depress the Bank's equity growth rate initially following the stock offering. Dividend payments and stock repurchases, pursuant to regulatory limitations and guidelines, could also potentially slow the Bank's equity growth rate in the longer term following the stock offering.
Income and Expense Components
Table 3.3 displays comparable statements of operations for the Bank and the Peer Group, based on earnings for the 12 months ended June 30, 2007, unless otherwise indicated for the Peer Group companies. Sound and the Peer Group reported net income to average assets ratios of 0.32% and 0.88%, respectively. The Peer Group's higher return was primarily attributable to a lower operating expense ratio despite the Bank maintaining the advantage in terms of the net interest income ratio (higher), loss provisions (lower), non-interest income (higher) and effective tax rate (lower).
The Bank's marginally higher net interest income ratio was realized through maintenance of a higher interest income, offset in part by a higher interest expense ratio, with the interest expense ratio elevated due to the higher proportion of interest-bearing liabilities used to fund the asset base. The Bank's higher interest income ratio was supported by the higher level of interest-earning assets to assets, loans/assets ratio, and yield earned on interest-earning assets. The Peer Group's lower interest expense ratio was supported by a lower cost of funds and higher equity ratio.
The Peer Group maintained a much lower operating expense ratio than the Bank, at 2.81% and 3.63%, respectively. The Peer Group's lower operating expense ratio reflected its higher asset per employee than the Bank, at $4.0 million and $3.5 million, respectively. On a post-offering basis, the Bank's operating expenses can be expected to increase with the addition of stock benefit plans and certain expenses that result from being a publicly-traded company, with such expenses already impacting the Peer Group's operating expenses.
RP® FINANCIAL, LC.
Page 3.10
| Table 3.3 | |||||||||||||||||||||||
| Income as Percent of Average Assets and Yields, Costs, Spreads | |||||||||||||||||||||||
| Comparable Institution Analysis | |||||||||||||||||||||||
| For the 12 Months Ended June 30, 2007 | |||||||||||||||||||||||
| Net Interest Income | Other Income | G&A/Other Exp. | Non-Op. Items | Yields, Costs, and Spreads | |||||||||||||||||||
| Loss | NII | Total | MEMO: | MEMO: | |||||||||||||||||||
| Net | Provis. | After | Loan | R.E. | Other | Other | G&A | Goodwill | Net | Extrao. | Yield | Cost | Yld-Cost | Assets/ | Effective | ||||||||
| Income | Income | Expense | NII | on IEA | Provis. | Fees | Oper. | Income | Income | Expense | Amort. | Gains | Items | On Assets | Of Funds | Spread | FTE Emp. | Tax Rate | |||||
| Sound Financial, Inc. of WA | |||||||||||||||||||||||
| June 30, 2007 | 0.32% | 6.31% | 3.25% | 3.06% | 0.01% | 3.05% | 0.00% | 0.00% | 1.04% | 1.04% | 3.63% | 0.00% | 0.00% | 0.00% | 6.66% | 3.56% | 3.10% | $3,548 | 30.00% | ||||
| All Public Companies | |||||||||||||||||||||||
| Averages | 0.50% | 5.83% | 3.09% | 2.73% | 0.11% | 2.63% | 0.03% | 0.00% | 0.62% | 0.65% | 2.57% | 0.02% | 0.07% | 0.00% | 6.19% | 3.58% | 2.62% | $5,493 | 32.41% | ||||
| Medians | 0.55% | 5.74% | 3.10% | 2.72% | 0.06% | 2.61% | 0.00% | 0.00% | 0.50% | 0.52% | 2.49% | 0.00% | 0.01% | 0.00% | 6.05% | 3.62% | 2.67% | $4,443 | 32.63% | ||||
| State of WA | |||||||||||||||||||||||
| Averages | 1.17% | 6.75% | 3.18% | 3.58% | 0.07% | 3.50% | 0.04% | 0.01% | 0.75% | 0.79% | 2.53% | 0.03% | 0.04% | 0.00% | 7.35% | 3.57% | 3.79% | $5,846 | 34.17% | ||||
| Medians | 1.40% | 6.56% | 3.33% | 3.58% | 0.07% | 3.51% | 0.01% | 0.00% | 0.88% | 0.97% | 3.14% | 0.03% | 0.04% | 0.00% | 7.26% | 3.65% | 4.46% | $3,917 | 34.73% | ||||
| Comparable Group | |||||||||||||||||||||||
| Averages | 0.88% | 5.60% | 2.60% | 3.00% | 0.06% | 2.94% | 0.02% | -0.01% | 0.56% | 0.58% | 2.79% | 0.02% | 0.67% | 0.00% | 5.93% | 3.19% | 2.74% | $3,959 | 31.20% | ||||
| Medians | 0.58% | 5.51% | 2.69% | 2.90% | 0.04% | 2.79% | 0.00% | 0.00% | 0.59% | 0.59% | 2.83% | 0.00% | 0.01% | 0.00% | 5.83% | 3.28% | 2.85% | $3,827 | 33.50% | ||||
| Comparable Group | |||||||||||||||||||||||
| BFSB | Brooklyn Federal MHC of NY (30.0) | 0.97% | 6.87% | 2.59% | 4.28% | 0.03% | 4.24% | 0.00% | 0.00% | 0.64% | 0.64% | 3.41% | 0.00% | 0.02% | 0.00% | 7.17% | 3.35% | 3.82% | $5,307 | 35.09% | |||
| CHEV | Cheviot Fin. Corp. MHC of OH (42.1)(3) | 0.34% | 5.60% | 2.96% | 2.64% | 0.00% | 2.64% | 0.00% | 0.00% | 0.15% | 0.15% | 2.28% | 0.00% | 0.01% | 0.00% | 5.80% | 3.85% | 1.95% | $5,861 | 33.50% | |||
| GOV | Gouverneur Bncrp. MHC of NY (42.8) | 0.82% | 6.09% | 2.89% | 3.20% | 0.04% | 3.16% | 0.00% | 0.01% | 0.64% | 0.65% | 2.67% | 0.00% | -0.09% | 0.00% | 6.50% | 3.49% | 3.01% | $3,900 | 37.25% | |||
| GCBC | Green Co. Bncrp. MHC of NY (44.4) | 0.72% | 5.39% | 2.04% | 3.34% | 0.09% | 3.25% | 0.00% | 0.00% | 1.25% | 1.25% | 3.50% | 0.00% | -0.08% | 0.00% | 5.66% | 2.30% | 3.36% | $2,883 | 31.23% | |||
| JXSB | Jacksonville Bncrp. MHC of IL (47.7) | 0.22% | 5.53% | 3.10% | 2.43% | 0.01% | 2.42% | 0.13% | -0.02% | 0.76% | 0.88% | 2.99% | 0.03% | -0.01% | 0.00% | 5.85% | 3.42% | 2.43% | $2,477 | 14.45% | |||
| KFFB | KY Fst Fed Bncrp MHC of KY(44.5)(1)(3) | 0.32% | 4.88% | 2.89% | 1.99% | 0.00% | 1.99% | 0.00% | 0.00% | 0.07% | 0.07% | 1.50% | 0.05% | 0.01% | 0.00% | 5.32% | 3.82% | 1.50% | NM | NM | |||
| LSBK | Lake Shore Bncrp. MHC of NY (45.0) | 0.44% | 5.10% | 2.46% | 2.64% | 0.05% | 2.59% | 0.00% | 0.00% | 0.55% | 0.55% | 2.52% | 0.00% | 0.00% | 0.00% | 5.38% | 2.97% | 2.41% | $3,754 | 28.68% | |||
| NECB | NE Comm. Bancorp MHC of NY (45.0) | 3.98% | 5.40% | 1.73% | 3.67% | 0.11% | 3.56% | 0.00% | 0.00% | 0.31% | 0.31% | 3.25% | 0.00% | 6.38% | 0.00% | 5.76% | 2.52% | 3.24% | $4,315 | 43.01% | |||
| PBHC | Pathfinder BC MHC of NY (35.8) | 0.27% | 5.49% | 2.74% | 2.76% | 0.04% | 2.71% | 0.09% | -0.07% | 0.87% | 0.89% | 3.30% | 0.07% | 0.11% | 0.00% | 5.93% | 2.97% | 2.96% | $3,172 | 20.47% | |||
| UCBA | United Comm. Bncrp. MHC IN (45.0)(1) | 0.72% | 5.68% | 2.63% | 3.05% | 0.18% | 2.86% | 0.00% | 0.00% | 0.40% | 0.40% | 2.45% | 0.00% | 0.35% | 0.00% | 5.96% | 3.21% | 2.74% | NM | 37.10% | |||
| (1) | Financial information is for the quarter ending March 31, 2007. |
| (3) | Income and expense information has been annualized from available financial information. |
| Source: | Audited and unaudited financial statements, corporate reports and offering circulars, and RP® Financial, LC. calculations. The information provided in this table has been obtained from sources we believe are reliable, but we cannot guarantee the accuracy or completeness of such information. |
| Copyright (c) 2007 by RP® Financial, LC. | |
RP® FINANCIAL, LC.
Page 3.11
In terms of expense coverage ratios (net interest income divided by operating expenses), the Peer Group's earnings power was stronger than the Bank's, at 0.84x and 1.07x, respectively. An expense coverage ratio of greater than 1.0x indicates that an institution is able to sustain pre-tax profitability without having to rely on non-interest sources of income.
Sources of non-interest operating income provided a larger contribution to the Bank's earnings, with such income amounting to 1.04% and 0.58% of the Sound's and the Peer Group's average assets, respectively. Such income increased the Bank's earnings power, but the disadvantage relative to the Peer Group remained. Specifically, Sound's efficiency ratio (operating expenses, net of amortization of intangibles, as a percent of the sum of non-interest operating income and net interest income) of 88.5% was less favorable than the Peer Group's efficiency ratio of 78.5%.
Loan loss provisions had a larger impact on the Peer Group's earnings, as minimal loan loss provisions were established by the Bank during the 12 month period. Loan loss provisions for the Peer Group equaled 0.06% of average assets, in contrast to 0.01% for the Bank. The relatively minor impact of loan loss provisions on the Bank's and the Peer Group's earnings were indicative of their generally favorable credit quality measures and low risk lending strategies.
Net gains for the Peer Group equaled 0.67% of average assets, which was supported by a large net gain posted by NE Community Bancorp equal to 6.38% of average assets. The gain recorded by NE Community Bancorp was realized through the sale of a branch office. Comparatively, net gains for the Bank were nominal. Given the generally non-recurring nature of gains and losses resulting from the sale of loans, investments and other assets, the net gains reflected in the Peer Group's earnings will be discounted in evaluating the relative strengths and weaknesses of the Bank's and the Peer Group's respective earnings. Extraordinary items were not a factor in either the Bank's or the Peer Group's earnings.
Taxes had a slightly larger impact on the Peer Group's earnings, as Sound and the Peer Group posted effective tax rates of 30.00% and 31.20%, respectively.
RP® FINANCIAL, LC.
Page 3.12
Loan Composition
Table 3.4 presents data related to the Bank's and the Peer Group's loan portfolio compositions (including the investment in mortgage-backed securities and CMOs). The Bank's loan portfolio composition reflected a higher concentration of 1-4 family permanent mortgage loans and mortgage-backed securities than maintained by the Peer Group (54.7% versus 48.1% for the Peer Group). The Bank's higher ratio was substantially attributable to maintaining a higher concentration of 1-4 family loans, as the Bank maintained minimal levels of mortgage-backed securities. Loans serviced for others equaled 55.1% and 12.1% of the Bank's and the Peer Group's assets, respectively, thereby indicating a greater influence of loan servicing income on the Bank's profitability. The Peer Group's balance of loans serviced for others translated into a modest balance of servicing intangibles, versus a much large value for the Bank.
Diversification into higher risk and higher yielding types of lending was more significant for the Bank in comparison to the Peer Group companies on average. Consumer loans represented the most significant area of lending diversification for the Bank (20.7% of assets), followed by commercial real estate/multi-family loans (9.9% of assets). The Peer Group's lending diversification also consisted primarily of commercial real estate/multi-family loans (20.4% assets), while other areas of lending diversification for the Peer Group were fairly evenly distributed between construction/land loans (3.1% of assets), commercial business loans (2.3% of assets), and consumer loans (1.9% of assets). Other areas of lending diversification for the Bank consisted of construction/land loans (4.2% of assets) and commercial business loans (4.0% of assets). The Bank's higher concentration of assets in loans translated into a higher risk weighted assets-to-assets ratio for the Bank (68.98% versus 56.37% for the Peer Group).
Credit Risk
Overall, the credit risk associated with the Bank's and the Peer Group's balance sheets were considered to be fairly similar, as implied by a comparison of their respective credit quality measures. As shown in Table 3.5, Sound's level of non-performing assets and accruing loans that are more than 90 days past due as a percent of assets was well below the comparable Peer Group ratio. The Bank a lower level of loss reserves as a percent of non-performing loans than the peer Group (119.9% versus 142.0%, respectively), and as a percent of loans were higher for
RP® FINANCIAL, LC.
Page 3.13
| Table 3.4 | |||||||||||
| Loan Portfolio Composition and Related Information | |||||||||||
| Comparable Institution Analysis | |||||||||||
| As of June 30, 2007 | |||||||||||
| Portfolio Composition as a Percent of Assets | |||||||||||
| 1-4 | Constr. | 5+Unit | Commerc. | RWA/ | Serviced | Servicing | |||||
Institution | MBS | Family | & Land | Comm RE | Business | Consumer | Assets | For Others | Assets | ||
| (%) | (%) | (%) | (%) | (%) | (%) | (%) | ($000) | ($000) | |||
| Sound Financial, Inc. of WA | 0.05% | 54.69% | 4.18% | 9.88% | 4.00% | 20.74% | 68.98% | $127,090 | $854 | ||
| Comparable Group | |||||||||||
| Averages | 9.57% | 38.51% | 3.10% | 20.42% | 2.25% | 1.85% | 56.37% | $36,896 | $138 | ||
| Medians | 7.64% | 39.31% | 2.24% | 10.39% | 1.32% | 1.22% | 58.75% | $10,946 | $0 | ||
| Comparable Group | |||||||||||
| BFSB | Brooklyn Federal MHC of NY (30.0) | 21.10% | 13.96% | 12.77% | 43.80% | 0.00% | 0.20% | 71.63% | $134,326 | $0 | |
| CHEV | Cheviot Financial Corp. MHC of OH (42.1) | 4.43% | 67.72% | 3.72% | 6.21% | 0.00% | 0.03% | 50.90% | $8,212 | $69 | |
| GOV | Gouverneur Bancorp MHC of NY (42.8) | 4.55% | 65.51% | 2.48% | 7.01% | 1.14% | 6.94% | 58.25% | $0 | $0 | |
| GCBC | Green County Bancorp MHC of NY (44.4) | 10.86% | 49.32% | 3.34% | 7.75% | 3.01% | 1.40% | 52.74% | $0 | $0 | |
| JXSB | Jacksonville Bancorp MHC of IL (47.7) | 4.30% | 26.19% | 2.00% | 14.22% | 7.60% | 3.97% | 62.32% | $130,219 | $1,012 | |
| KFFB | KY First Fed. Bncrp. MHC of KY (44.5)(1) | 13.39% | 33.08% | 0.82% | 0.77% | 0.00% | 2.49% | 31.84% | $0 | $0 | |
| LSBK | Lake Shore Bancorp MHC of NY (45.0) | 20.22% | 50.51% | 0.92% | 5.09% | 2.50% | 0.66% | 52.20% | $13,679 | $0 | |
| NECB | NE Commercial Bancorp MHC of NY (45.0) | 1.58% | 0.15% | 0.98% | 78.14% | 0.00% | 0.20% | 59.26% | $2,984 | $0 | |
| PBHC | Pathfinder BC MHC of NY (35.8) | 7.52% | 41.95% | 0.65% | 13.03% | 6.77% | 1.05% | 61.46% | $52,896 | $58 | |
| UCBA | United Comm. Bancorp MHC IN (45.0)(1) | 7.78% | 36.67% | 3.35% | 28.18% | 1.50% | 1.55% | 63.14% | $26,645 | $238 | |
| Source: | SNL Financial LC. and RP® Financial, LC. calculations. The information provided in this table has been obtained from sources we believe are reliable, but we cannot guarantee the accuracy or completeness of such information. |
RP® FINANCIAL, LC.
Page 3.14
| Table 3.5 | |||||||||
| Credit Risk Measures and Related Information | |||||||||
| Comparable Institution Analysis | |||||||||
| As of June 30, 2007 or Most Recent Date Available | |||||||||
| NPAs & | Rsrves/ | ||||||||
| REO/ | 90+Del/ | NPLs/ | Rsrves/ | Rsrves/ | NPAs & | Net Loan | NLCs/ | ||
Institution | Assets | Assets | Loans | Loans | NPLs | 90+Del | Chargoffs | Loans | |
| (%) | (%) | (%) | (%) | (%) | (%) | ($000) | (%) | ||
| Sound Financial, Inc. of WA | 0.00% | 0.24% | 0.26% | 0.31% | 119.93% | 119.93% | $162 | 0.08% | |
| All Public Companies | |||||||||
| Averages | 0.09% | 0.60% | 0.61% | 0.84% | 236.18% | 205.29% | $486 | 0.11% | |
| Medians | 0.01% | 0.40% | 0.43% | 0.78% | 178.00% | 115.61% | $65 | 0.03% | |
| State of WA | |||||||||
| Averages | 0.01% | 0.06% | 0.06% | 0.96% | 380.81% | 295.73% | $114 | 0.03% | |
| Medians | 0.01% | 0.05% | 0.06% | 1.09% | 380.81% | 295.73% | $131 | 0.01% | |
| Comparable Group | |||||||||
| Averages | 0.06% | 0.42% | 0.55% | 0.73% | 141.99% | 109.24% | $27 | 0.04% | |
| Medians | 0.03% | 0.39% | 0.49% | 0.71% | 130.93% | 90.60% | $15 | 0.00% | |
| Comparable Group | |||||||||
| BFSB | Brooklyn Federal MHC of NY (30.0) | 0.00% | 0.03% | 0.04% | 0.61% | NA | NA | $0 | 0.00% |
| CHEV | Cheviot Fin. Corp. MHC of OH (42.1) | 0.23% | 0.23% | 0.15% | 0.29% | 98.10% | 114.11% | $110 | 0.18% |
| GOV | Gouverneur Bncrp. MHC of NY (42.8) | 0.07% | 0.44% | 0.49% | 0.83% | 166.12% | 158.25% | $14 | 0.05% |
| GCBC | Green Co. Bncrp. MHC of NY (44.4) | 0.00% | 0.36% | 0.56% | 0.71% | 217.89% | 124.20% | $36 | 0.07% |
| JXSB | Jacksonville Bncrp. MHC of IL (47.7) | 0.13% | 0.79% | 1.16% | 1.12% | 201.22% | 84.50% | $32 | 0.08% |
| KFFB | KY Fst Fed Bncrp MHC of KY(44.5)(1) | 0.00% | 0.33% | NA | NA | NA | 80.45% | $0 | 0.00% |
| LSBK | Lake Shore Bncrp. MHC of NY (45.0) | 0.01% | 0.41% | 0.39% | 0.62% | 138.45% | 90.60% | $1 | 0.00% |
| NECB | NE Comm. Bancorp MHC of NY (45.0) | 0.00% | 0.27% | 0.36% | 0.64% | 103.64% | 156.05% | $0 | 0.00% |
| PBHC | Pathfinder BC MHC of NY (35.8) | 0.15% | 0.54% | 0.66% | 0.76% | 123.40% | 86.36% | $65 | -0.01% |
| UCBA | United Comm. Bncrp. MHC IN (45.0)(1) | 0.05% | 0.81% | 1.10% | 0.98% | 87.10% | 88.67% | $16 | 0.00% |
| (1) | Financial information is for the quarter ending March 31, 2007. |
| Source: | Audited and unaudited financial statements, corporate reports and offering circulars, and RP® Financial, LC. calculations. The information provided in this table has been obtained from sources we believe are reliable, but we cannot guarantee the accuracy or completeness of such information. |
| Copyright (c) 2007 by RP® Financial, LC. | |
RP® FINANCIAL, LC.
Page 3.15
the Peer Group (0.31% versus 0.73%, respectively). Net loan charge-offs were higher for the Bank than the Peer Group.
Interest Rate Risk
Table 3.6 reflects various key ratios highlighting the relative interest rate risk exposure of the Bank versus the Peer Group companies. Most notably, the Peer Group maintained higher tangible equity/assets and IEA/IBL ratios compared to the Bank, but a lower level of non-interest earning assets. On a pro forma basis, the infusion of net offering proceeds should serve to narrow the Bank's disadvantage relative to the Peer Group in terms of the balance sheet interest rate risk characteristics, particularly with respect to the pro forma increases in the Bank's equity-to-assets and IEA/IBL ratios.
To analyze interest rate risk associated with the net interest income ratio, we reviewed quarterly changes in net interest income as a percent of average assets for Sound and the Peer Group. In general, there was a slightly greater degree of volatility reflected in the quarterly changes in the Bank's net interest income ratios, based on the interest rate environment that prevailed during the period covered in Table 3.5. The large decline in the September 2006 quarter for the Bank's net interest income reflected the sale of the high yielding credit card portfolio. However, the stability of the Bank's net interest margin should be enhanced by the infusion of stock proceeds, since interest rate sensitive liabilities will be funding a lower portion of the Bank's assets.
Summary
Based on the above analysis, RP Financial concluded that the Peer Group forms a reasonable basis for determining the pro forma market value of Sound. Such general characteristics as asset size, capital position, interest-earning asset composition, funding composition, core earnings measures, loan composition, credit quality and exposure to interest rate risk all tend to support the reasonability of the Peer Group from a financial standpoint. Those areas where differences exist will be addressed in the form of valuation adjustments to the extent necessary.
RP® FINANCIAL, LC.
Page 3.16
| Table 3.6 | |||||||||||
| Interest Rate Risk Measures and Net Interest Income Volatility | |||||||||||
| Comparable Institution Analysis | |||||||||||
| As of June 30, 2007 or Most Recent Date Available | |||||||||||
| Balance Sheet Measures | |||||||||||
| Non-Earn. | Quarterly Change in Net Interest Income | ||||||||||
| Equity/ | IEA/ | Assets/ | |||||||||
| Institution | Assets | IBL | Assets | 6/30/2007 | 3/31/2007 | 12/31/2006 | 9/30/2006 | 6/30/2006 | 3/31/2006 | ||
| (%) | (%) | (%) | (change in net interest income is annualized in basis points) | ||||||||
| Sound Financial, Inc. of WA | 6.9% | 105.5% | 3.4% | -6 | -9 | -7 | -68 | 18 | 8 | ||
| All Public Companies | 11.3% | 110.0% | 5.6% | 1 | 0 | -8 | -6 | -3 | 0 | ||
| State of WA | 10.3% | 107.8% | 5.8% | -5 | -2 | -7 | -7 | -5 | 2 | ||
| Comparable Group | |||||||||||
| Averages | 16.6% | 117.9% | 5.6% | -3 | -4 | -7 | -4 | -6 | 0 | ||
| Medians | 15.8% | 114.2% | 5.4% | -2 | -3 | -8 | -2 | -6 | 0 | ||
| Comparable Group | |||||||||||
| BFSB | Brooklyn Federal MHC of NY (30.0) | 21.4% | 124.5% | 4.7% | -13 | 7 | 19 | 6 | 7 | 23 | |
| CHEV | Cheviot Fin. Corp. MHC of OH (42.1) | 22.0% | 124.6% | 3.6% | -1 | NA | NA | -16 | -10 | -6 | |
| GOV | Gouverneur Bncrp. MHC of NY (42.8) | 15.4% | 113.1% | 6.6% | -8 | 1 | -8 | -2 | -13 | -13 | |
| GCBC | Green Co. Bncrp. MHC of NY (44.4) | 10.9% | 106.9% | 5.1% | 1 | -10 | -5 | -9 | -6 | 5 | |
| JXSB | Jacksonville Bncrp. MHC of IL (47.7) | 6.6% | 104.4% | 5.5% | 6 | -16 | -15 | -17 | -13 | 0 | |
| KFFB | KY Fst Fed Bncrp MHC of KY(44.5)(1) | 17.7% | 121.0% | 8.2% | NA | -1 | -15 | NA | NA | -12 | |
| LSBK | Lake Shore Bncrp. MHC of NY (45.0) | 14.9% | 113.5% | 5.7% | -9 | -3 | -28 | 11 | 16 | -17 | |
| NECB | NE Comm. Bancorp MHC of NY (45.0) | 35.2% | 155.4% | 5.3% | 3 | -4 | 13 | -10 | -45 | NA | |
| PBHC | Pathfinder BC MHC of NY (35.8) | 5.5% | 100.8% | 7.2% | -2 | -2 | 0 | 0 | -5 | 2 | |
| UCBA | United Comm. Bncrp. MHC IN (45.0)(1) | 16.1% | 114.8% | 4.6% | NA | -6 | -27 | 1 | 19 | 18 | |
| (1) | Financial information is for the quarter ending March 31, 2007. |
| NA=Change is greater than 100 basis points during the quarter. | |
| Source: | Audited and unaudited financial statements, corporate reports and offering circulars, and RP® Financial, LC. calculations. The information provided in this table has been obtained from sources we believe are reliable, but we cannot guarantee the accuracy or completeness of such information. |
| Copyright (c) 2007 by RP® Financial, LC. | |
RP® FINANCIAL, LC.
Page 4.1
IV. VALUATION ANALYSIS
Introduction
This chapter presents the valuation analysis and methodology used to determine Sound's estimated pro forma market value for purposes of pricing the minority stock. The valuation incorporates the appraisal methodology promulgated by the OTS and adopted in practice by the FDIC for standard conversions and mutual holding company offerings, particularly regarding selection of the Peer Group, fundamental analysis on both the Bank and the Peer Group, and determination of the Bank's pro forma market value utilizing the market value approach.
Appraisal Guidelines
The OTS written appraisal guidelines specify the market value methodology for estimating the pro forma market value of an institution. The FDIC, state banking agencies and other Federal agencies have endorsed the OTS appraisal guidelines as the appropriate guidelines involving mutual-to-stock conversions. As previously noted, the appraisal guidelines for MHC offerings are somewhat different, particularly in the Peer Group selection process. Specifically, the regulatory agencies have indicated that the Peer Group should be based on the pro forma fully-converted pricing characteristics of publicly-traded MHCs, rather than on already fully-converted publicly-traded stock thrifts, given the unique differences in stock pricing of MHCs and fully-converted stock thrifts. Pursuant to this methodology: (1) a peer group of comparable publicly-traded MHC institutions is selected; (2) a financial and operational comparison of the subject company to the peer group is conducted to discern key differences; and (3) the pro forma market value of the subject company is determined based on the market pricing of the peer group, subject to certain valuation adjustments based on key differences. In addition, the pricing characteristics of recent conversions and MHC offerings must be considered.
RP Financial Approach to the Valuation
The valuation analysis herein complies with such regulatory approval guidelines. Accordingly, the valuation incorporates a detailed analysis based on the Peer Group, discussed in Chapter III, which constitutes "fundamental analysis" techniques. Additionally, the valuation
RP® FINANCIAL, LC.
Page 4.2
incorporates a "technical analysis" of recently completed conversions and stock offerings of comparable MHCs, including closing pricing and aftermarket trading of such offerings. It should be noted that these valuation analyses, based on either the Peer Group or the recent conversions and MHC transactions, cannot possibly fully account for all the market forces which impact trading activity and pricing characteristics of a stock on a given day.
The pro forma market value determined herein is a preliminary value for the Bank's to-be-issued stock. Throughout the MHC process, RP Financial will: (1) review changes in the Bank's operations and financial condition; (2) monitor the Bank's operations and financial condition relative to the Peer Group to identify any fundamental changes; (3) monitor the external factors affecting value including, but not limited to, local and national economic conditions, interest rates, and the stock market environment, including the market for thrift stocks; and (4) monitor pending MHC offerings, and to a lesser extent, standard conversion offerings, both regionally and nationally. If material changes should occur prior to the close of the offering, RP Financial will evaluate if updated valuation reports should be prepared reflecting such changes and their related impact on value, if any. RP Financial will also prepare a final valuation update at the closing of the offering to determine if the prepared valuation analysis and resulting range of value continues to be appropriate.
The appraised value determined herein is based on the current market and operating environment for the Bank and for all thrifts. Subsequent changes in the local and national economy, the legislative and regulatory environment, the stock market, interest rates, and other external forces (such as natural disasters or major world events), which may occur from time to time (often with great unpredictability) may materially impact the market value of all thrift stocks, including Sound's value, the market value of the stocks of public MHC institutions, or Sound's value alone. To the extent a change in factors impacting the Bank's value can be reasonably anticipated and/or quantified, RP Financial has incorporated the estimated impact into its analysis.
RP® FINANCIAL, LC.
Page 4.3
Valuation Analysis
A fundamental analysis discussing similarities and differences relative to the Peer Group was presented in Chapter III. The following sections summarize the key differences between the Bank and the Peer Group and how those differences affect the pro forma valuation. Emphasis is placed on the specific strengths and weaknesses of the Bank relative to the Peer Group in such key areas as financial condition, profitability, growth and viability of earnings, asset growth, primary market area, dividends, liquidity of the shares, marketing of the issue, management, and the effect of government regulations and/or regulatory reform. We have also considered the market for thrift stocks, in particular new issues, to assess the impact on value of Sound coming to market at this time.
1. Financial Condition
The financial condition of an institution is an important determinant in pro forma market value because investors typically look to such factors as liquidity, capital, asset composition and quality, and funding sources in assessing investment attractiveness. The similarities and differences in the Bank's and the Peer Group's financial strengths are noted as follows:
- Overall A/L Composition. The Bank's interest-earning asset composition exhibited a higher concentration of loans, and a higher level of lending diversification into higher risk and higher yielding types of loans. Accordingly, the Bank's asset composition provided for higher yield on interest-earning assets as well as a higher risk weighted assets ratio in comparison to the Peer Group. Sound's funding composition reflected both a higher level of deposits and a higher level of borrowings than the comparable Peer Group ratios, due to the Bank's much lower equity/assets ratio, which resulted in a higher cost of funds than for the Peer Group. The Bank's comparatively higher level of interest-earning assets and interest-bearing liabilities combined to result in a lower IEA/IBL ratio than for the Peer Group. The infusion of net offering proceeds should increase the Bank's IEA/IBL ratio, however the ratio is expected to remain below the Peer Group on a pro forma basis. On balance, RP Financial concluded that the Bank's pro forma asset/liability composition was a slightly positive factor in our adjustment for financial condition.
- Credit Quality. The Bank's ratios for non-performing assets and non-performing loans ratios were lower than the comparable Peer Group ratios. At the same time, loss reserves as a percent of non-performing loans and total loans were lower for the Bank than the Peer Group. Net loan charge-offs were higher for Sound. The
RP® FINANCIAL, LC.
Page 4.4
- Balance Sheet Liquidity. The Peer Group maintained a much higher level of assets in cash and investments than Sound. Following the infusion of net offering proceeds, the Bank's cash and investments ratio is expected to increase as the proceeds will be initially deployed into investments. The Bank's future borrowing capacity was considered to be slightly lower than Peer Group's, based on the higher level of borrowings currently maintained by Sound. Overall, RP Financial concluded that this was a slightly negative factor in our adjustment for financial condition.
- Funding Liabilities. The Bank's funding composition reflects a higher concentration of deposits and a higher concentration of borrowings relative to the comparable Peer Group ratios, which provided the Bank with a higher cost of funds than maintained by the Peer Group. Total interest-bearing liabilities as a percent of assets were higher for the Bank compared to the Peer Group ratio, which was attributable to Sound's lower equity position. On a pro forma basis, Sound's equity ratio will remain lower than the Peer Group average; thus, Sound's interest-bearing liabilities/assets ratio is expected to remain higher than the Peer Group. Accordingly, we concluded that this was a moderately negative factor in our adjustment for financial condition.
- Equity. The Peer Group operates with a higher equity-to-assets ratio than the Bank, and following the stock offering, Sound's pro forma equity position will continue to be lower than the Peer Group's equity-to-assets ratio. The increase in the Bank's pro forma equity position, however, will result in greater leverage potential and reduce the level of interest-bearing liabilities utilized to fund assets. At the same time, the Bank's lower earnings will likely result in a lower ROE, despite the lower equity level. On balance, RP Financial concluded that equity was less favorable than for the Peer Group.
- Bank maintained a higher risk weighted assets ratio than the Peer Group. Overall, RP Financial concluded that credit quality was a neutral factor in our adjustment for financial condition.
On balance, we applied a slight downward adjustment for the Bank's financial condition, taking into account the benefits of the net offering proceeds.
2. Profitability, Growth and Viability of Earnings
Earnings are a key factor in determining pro forma market value, as the level and risk characteristics of an institution's earnings stream and the prospects and ability to generate future earnings heavily influence the multiple that the investment community will pay for earnings. The major factors considered in the valuation are described below.
RP® FINANCIAL, LC.
Page 4.5
- Reported Profitability. The Peer Group maintains a considerable profitability relative to the Bank, particularly given the much lower operating expense ratio. In comparison, the Bank maintains a slight to moderate advantage in the other profitability components. Reinvestment of the net offering proceeds into interest-earning assets will increase the Bank's earnings, net of the stock benefit plan expenses. On balance, RP Financial concluded that the Bank's reported profitability was a negative factor in our adjustment for profitability, growth and viability of earnings.
- Core Profitability. The Bank realized much less in non-core earnings than the Peer Group; but even after adjusting for such non-core revenue sources, the Bank maintained a considerable profitability disadvantage. Therefore, RP Financial concluded that this was a negative factor in our adjustment for profitability, growth and viability of earnings.
- Interest Rate Risk. While the net offering proceeds are expected to diminish the Bank's interest rate risk, the Peer Group's advantage is expected to continue given the higher average equity level and more favorable expense coverage ratio. On balance, RP Financial concluded that interest rate risk was a slightly negative factor in our adjustment for profitability, growth and viability of earnings.
- Credit Risk. The Bank's credit risk profile appears to be somewhat higher given its higher risk-weighted assets ratio and lower reserve levels, despite the currently more favorable level of non-performing assets. Overall, RP Financial concluded that earnings credit risk was a neutral factor in our adjustment for profitability, growth and viability of earnings.
- Earnings Growth Potential. The Bank's historical loan growth was similar to the Peer Group's, indicating a similar ability to expand the interest-earning asset base. The infusion of net offering proceeds will provide the Bank with improved growth potential through leverage than currently maintained, however such growth potential will remain lower than the Peer Group's based on the lower pro forma capital position. Furthermore, the Bank's lower profitability provides less opportunity for branching expansion given the related start-up costs. Overall, earnings growth potential was considered to be a moderately negative factor in our adjustment for profitability, growth and viability of earnings.
- Return on Equity. The Bank's current ROE advantage to the Peer Group will be reversed on a pro forma basis given the Bank's lower profitability. Accordingly, this was a downward adjustment in the factor for profitability, growth and viability of earnings.
Accordingly, a moderate downward adjustment was applied for profitability, growth and viability of earnings.
RP® FINANCIAL, LC.
Page 4.6
3. Asset Growth
Sound recorded stronger asset growth than the Peer Group (8.5% growth versus 3.3% growth for the Peer Group), although loans growth was somewhat stronger for the Peer Group (9.9% versus 8.3% for the Bank). The Bank intends to payoff a large portion of the existing borrowings with the conversion proceeds, and then continue with a retail growth strategy. Sound operates in a relatively strong and growing market area, which provides support for growth objectives. On a pro forma basis, the Bank's tangible equity-to-assets ratio will be below the Peer Group average, implying lower leverage capacity for the Bank. Accordingly, on balance, we believe that no valuation adjustment was warranted for this factor.
4. Primary Market Area
The general condition of an institution's market area has an impact on value, as future success is in part dependent upon opportunities for profitable activities in the local market served. Sound's primary market area for deposits is considered to be the immediate areas surrounding the Bank's offices in the Seattle metropolitan area and in the region surrounding Sequim, while lending activities extend over a somewhat greater geographical area inclusive of the Seattle MSA. The markets served by the Bank are somewhat more affluent than statewide averages, thereby fostering significant competition among financial services companies that includes other locally-based thrifts and banks, as well as regional and super regional banks.
The Peer Group companies operate in a combination of urban, suburban and rural markets with lower population bases as the markets served by Sound. In general, the Peer Group companies operated in markets with slower growing populations. Comparative per capita income measures imply that the greater Seattle MSA areas is a more affluent market area compared to the markets served by the Peer Group companies. Sound's deposit market share in King County was less than the majority of the Peer Group companies, indicating a less competitive position advantage for the Bank. Overall, the growth potential in the markets served by the Peer Group companies was for the most part viewed to be less favorable than provided by the Bank's primary market area. Summary demographic and deposit market share data for the Company and the Peer Group companies is provided in Exhibit III-3. As shown in Table 4.1, July 2007 unemployment rates for all of markets served by the Peer Group companies exceeded
RP® FINANCIAL, LC.
Page 4.7
the unemployment rate reflected for King County. On balance, we concluded that a slight upward adjustment was appropriate for the Bank's market area.
Table 4.1
Market Area Unemployment Rates
Sound and the Peer Group Companies(1)
| County | July 2007 Unemployment | |||||
| Sound - WA | King | 3.7 | % | |||
| Peer Group Average | 5.5 | % | ||||
| Brooklyn Federal MHC - NY | Kings | 6.7 | % | |||
| Cheviot Financial MHC - OH | Hamilton | 5.1 | ||||
| Gouverneur Bancorp MHC - NY | St. Lawrence | 5.8 | ||||
| Greene Co. Bancorp MHC - NY | Greene | 4.8 | ||||
| Jacksonville Bancorp MHC - IL | Morgan | 5.1 | ||||
| Kentucky First Fed. Bancorp - KY | Perry | 7.5 | ||||
| Lake Shore Bancorp. MHC - NY | Chautauqua | 4.5 | ||||
| NE Community Bancorp MHC - NY | New York | 5.2 | ||||
| Pathfinder Bancorp MHC - NY | Oswego | 5.1 | ||||
| United Comm. Bancorp MHC - IN | Dearborn | 5.1 | ||||
| (1) Unemployment rates are not seasonally adjusted. | ||||||
| Source: U.S. Bureau of Labor Statistics. | ||||||
5. Dividends
At this time the Bank has not established a dividend policy. Future declarations of dividends by the Board of Directors will depend upon a number of factors, including investment opportunities, growth objectives, financial condition, profitability, tax considerations, minimum capital requirements, regulatory limitations, stock market characteristics and general economic conditions.
Nine out of the ten of the Peer Group companies pay regular cash dividends, with implied dividend yields ranging from 1.14% to 4.07%. The average dividend yield on the stocks of the Peer Group institutions equaled 2.45% as of August 31, 2007. As of August 31, 2007, approximately 82% of all publicly-traded thrifts had adopted cash dividend policies (see Exhibit
RP® FINANCIAL, LC.
Page 4.8
IV-1), exhibiting an average yield of 2.34%. The dividend paying thrifts generally maintain higher than average profitability ratios, facilitating their ability to pay cash dividends.
Our valuation adjustment for dividends for Sound also considered the regulatory policy with regard to waiver of dividends by the MHC. Under current policy, any waiver of dividends by an FDIC regulated MHC requires that the minority stockholders' ownership interest be reduced in a second-step conversion to reflect the cumulative waived dividend account. Comparatively, no adjustment for waived dividends is required for OTS regulated companies in a second-step conversion. As an MHC operating under OTS regulation, the Bank will be subject to the same regulatory dividend policy as all of the Peer Group companies. Accordingly, we believe that to the extent Sound's pro forma market value would be influenced by the OTS' dividend policy regarding MHC institutions, it has been sufficiently captured in the pricing of the Peer Group companies.
While the Bank has not established a definitive dividend policy prior to converting, the Bank will have the capacity to pay a dividend comparable to the Peer Group's average dividend yield based on pro forma earnings and capitalization. On balance, we concluded that no adjustment was warranted for purposes of the Bank's dividend policy.
6. Liquidity of the Shares
The Peer Group is by definition composed of companies that are traded in the public markets. Nine of the Peer Group members trade on the NASDAQ system and the remaining company trades on the AMEX. Typically, the number of shares outstanding and market capitalization provides an indication of how much liquidity there will be in a particular stock. The market capitalization of the Peer Group companies, based on the shares issued and outstanding to public shareholders (i.e., excluding the majority ownership interest owned by the respective MHCs) ranged from $9.7 million to $61.9 million as of August 31, 2007, with average and median market values of $33.7 million and $34.2 million, respectively. The shares issued and outstanding to the public shareholders of the Peer Group members ranged from 881,000 to 6.0 million, with average and median shares outstanding of 2.9 million and 3.4 million, respectively. The Bank's minority stock offering is expected to have a pro forma market value and shares outstanding that are well below the average and median market values and shares
RP® FINANCIAL, LC.
Page 4.9
outstanding indicated for the Peer Group. It is anticipated that the Bank's stock will be listed for trading on the OTC Bulletin Board. Overall, we anticipate that the Bank's public stock will have a less liquid trading market than the Peer Group companies on average and, therefore, concluded that a slight downward adjustment was necessary for this factor.
7. Marketing of the Issue
Three separate markets exist for thrift stocks: (1) the after-market for public companies, both fully-converted stock companies and MHCs, in which trading activity is regular and investment decisions are made based upon financial condition, earnings, capital, ROE, dividends and future prospects; (2) the new issue market in which converting thrifts are evaluated on the basis of the same factors but on a pro forma basis without the benefit of prior operations as a publicly-held company and stock trading history; and (3) the thrift acquisition market. All three of these markets were considered in the valuation of the Bank's to-be-issued stock.
A. The Public Market
The value of publicly-traded thrift stocks is easily measurable, and is tracked by most investment houses and related organizations. Exhibit IV-1 provides pricing and financial data on all publicly-traded thrifts. In general, thrift stock values react to market stimuli such as interest rates, inflation, perceived industry health, projected rates of economic growth, regulatory issues and stock market conditions in general. Exhibit IV-2 displays historical stock market trends for various indices and includes historical stock price index values for thrifts and commercial banks. Exhibit IV-3 displays historical stock price indices for thrifts only.
In terms of assessing general stock market conditions, the performance of the overall stock market has been mixed over the past year. Stocks traded in a narrow range before strengthening at the end of August 2006 and into early-September, as oil prices dropped below $70 a barrel for the first time in two months and the unemployment rate for August dropped to 4.7%. The Dow Jones Industrial Average ("DJIA") moved to a four-month high in mid-September, with further declines in oil prices and the Federal Reserve's decision to leave rates unchanged helping to sustain the positive trend. Stocks retreated modestly heading into late-September, as investors reacted negatively to an economic report showing a slow down in
RP® FINANCIAL, LC.
Page 4.10
business activity in the Mid-Atlantic region. Lower oil prices and a strong consumer sentiment report helped stocks to rally at the close of the third quarter.
The broader stock market rally was sustained into the fourth quarter of 2006, as the DJIA moved to an all-time high in early-October. Lower oil prices and growing expectations that the next move by the Federal Reserve would be to cut rates extended the stock market rally into mid-October, with the DJIA approaching the 12000 mark. The DJIA closed above 12000 heading into late-October 2006, with optimism about corporate earnings, the Federal Reserve's decision to hold rates steady and lower oil prices sustaining the rally. Despite a slight pullback at the end of October, the 3.4% gain in the DJIA for October was the best monthly gain since November 2005. Stocks continued to edge lower at the beginning of November, but then rebounded strongly in mid-November. Favorable inflation data reflected in wholesale and consumer prices for October, merger news and upbeat comments by the Federal Reserve about interest rates were factors that contributed to the rally in the broader market. Stocks traded in a narrow range ahead of the holiday shopping season in late-November. After posting a big one day loss in late-November on concerns about retail sales, lower oil prices, merger news and favorable economic reports provided a boost to stocks in early-December. The DJIA traded to record highs in mid- and late-December, as stocks benefited from some robust economic reports and investors betting on a strong finish for the year.
Lower oil prices helped to sustain the positive trend in stocks at the start of 2007, which was followed by a mild pullback due to weakness in technology stocks. Optimism about the economy and some favorable earnings reports helped to lift the DJIA to a record high heading into late-January 2007, which was followed by a one day sell-off on a weak housing report and concerns about higher rates. Stocks surged higher at the end of January 2007, as the Federal Reserve's late-January meeting concluded with no change in rates. The broader stock market traded in a narrow range in early-February and then the DJIA rallied to a new record in mid-February. Comments by the Federal Reserve Chairman that helped to alleviate concerns of higher rates, as well as lower oil prices, were factors that contributed to the mid-February rally. Comparatively, higher oil prices contributed to a downturn in stocks heading into late-February. A sell-off in China's stock market turned into a global market sell-off, as the DJIA plunged over 400 points on February 27th.
RP® FINANCIAL, LC.
Page 4.11
Stocks recovered some of the losses from the one day sell-off in early-March 2007, as the broader stock market benefited from a rebound in China's stock market. Mounting troubles for subprime mortgage lenders and weak economic data fueled a sharp downturn in the broader stock market in mid-March. Following the sell-off, merger announcements, rallies in overseas markets and a drop in oil prices supported a rebound in the broader stock market ahead of the March meeting of the Federal Reserve. The Federal Reserve's decision to hold rates steady further strengthened the rebound in the stock market as investors were buoyed by the Federal Reserve's assessment that the economy would continue to expand at a moderate pace. Stocks fluctuated at the close of the first quarter on mixed economic data.
Signs of an improving housing market provided a boost to the stock market at the start of the second quarter 2007, with news of an increase in an index of pending existing home sales during February supporting a one-day gain of more than 120 points in the DJIA. News of Iran's release of British hostages, lower oil prices and a favorable March employment report also contributed to the broader market gains in early-April. The broader market rally continued through most of April, as merger news and strong corporate profits lifted the DJIA above a close of 13000 in late-April. For the month of April, the DJIA closed up 5.7%. Stronger than expected manufacturing data and lower oil prices helped to propel the DJIA to five consecutive record highs in early-May. Following a sharp one day sell-off on a weak retail sale report for April, the positive trend in the broader stock market continued into mid-May. A new wave of corporate deals, lower oil prices and a stronger than expected reading for May consumer confidence were noted factors that help to sustain the rally. Stocks eased lower in late-May, reflecting profit taking and concerns about a pullback in China's stock market. Inflation worries and higher rates pushed stocks lower in early-June, while a strong retail sales report for May triggered a rebound in the stock market in mid-June. Stocks generally traded lower in the second half of June on continued inflation concerns, as well as higher oil prices and weakness in the housing market.
The broader stock market showed a positive trend at the start of third quarter of 2007, with the DJIA closing at record highs in mid-July. A positive report on manufacturing activity in June, healthy job growth reflected in the June employment report and merger news contributed to the stock market rally. A favorable second quarter earnings report by IBM helped
RP® FINANCIAL, LC.
Page 4.12
the DJIA close above the 14000 mark heading into late-July, which was followed a general downturn in stocks during late-July and early-August. Stocks were driven lower by fears that the housing slump was spreading to the broader economy and concerns of a widening credit crunch prompted by home mortgage lenders cutting off credit or raising rates for a growing number of borrowers. The stock market turned highly volatile in mid-August, reflecting mixed economic news and the ongoing fallout from the credit crisis. Volatility in the stock market continued to prevail through the end of August, based on concerns about the impact of the credit crunch on the economy and speculation about whether or not the Federal Reserve would cut rates at the September meeting. As an indication of the general trends in the nation's stock markets over the past year, as of August 31, 2007 the DJIA closed at 13357.74 an increase of 17.4% from one year ago and an increase of 7.2% year-to-date, and the NASDAQ closed at 2596.36 an increase of 18.9% from one year ago and an increase of 7.5% year-to-date. The Standard & Poors 500 Index closed at 1473.99 on August 31 2007 an increase of 13.1% from one year ago and an increase of 3.9% year-to-date.
The market for thrift stocks has been mixed during the past 12 months, but, in general, thrift stocks have underperformed the broader stock market. Thrift stocks trended lower in late-August 2006 reflecting concerns of a slowdown in housing, while a favorable August employment report provided a boost to the thrift sector at the beginning of September. Inflationary fears prompted a brief sell-off in thrift stocks heading into mid-September, which was followed by a rebound as falling oil prices benefited stocks in general.
Thrift stocks advanced at the start of the fourth quarter of 2006, based on economic data that suggested the economy was slowing and comments from the Federal Reserve Chairman that raised hopes of a decline in short-term interest rates. Acquisition news and strength in the broader market sustained the upward trend in thrift stocks into mid-October. Thrift stocks sold off with the broader market at the end of October and into early-November, as economic data showing slower growth raised concerns for some investors. Strength in the broader market supported a rebound in thrift stocks ahead of the national elections. Favorable inflation data boosted thrifts stocks along with the broader market in mid-November. Weaker than expected housing data pressured thrift stocks lower heading into late-November. Merger news, including Bank of New York's announced merger with Mellon Financial Corp., sparked
RP® FINANCIAL, LC.
Page 4.13
gains in thrift stocks in early-December 2006. Thrift stocks traded in a narrow range through mid-December, as the Federal Reserve left interest rates unchanged as expected. An upbeat report on home sales helped thrift and bank stocks participate in the broader market rally in late-December.
Thrift stocks traded lower at the beginning of 2007, as a favorable employment report for December reduced expectations of the Federal Reserve cutting interest rates. Mixed fourth quarter earnings reports and investor nervousness ahead of the Federal Reserve meeting provided for a choppy trading market for thrift issues in mid- and late-January. Thrift stocks posted gains in late-January and early-February, as thrift investors reacted favorably to the Federal Reserve's decision to hold rates steady. While the DJIA moved to a new high in mid-February, thrift stocks traded in a narrow range heading into late-February. The late-February sell-off triggered by the downturn in China's stock market hit thrift stocks as well. Selling pressure in thrift stocks increased during the first half of March, as mortgage lenders in general were hurt by the deterioration in market conditions for subprime mortgage lenders. In mid-March, the Mortgage Bankers Association reported that subprime mortgage delinquencies rose to a four year high during the fourth quarter of 2006. Thrift stocks participated in the broader stock market rally following the Federal Reserve's decision to hold rates steady at its March meeting, based on expectations that the economy would continue to expand at a moderate pace. Thrift stocks pulled back in late-March, as lenders were hurt by news that sales of new homes fell for the second straight month in February and consumer confidence dropped in March.
A favorable report on February pending existing home sales sparked gains in thrift stocks at the start of the second quarter of 2007. In contrast to the broader market, thrift stocks trended lower in mid-April as a weak housing market and the overhang of problems in the subprime lending market continued to weigh on the thrift sector. Some positive earnings reports helped to boost thrift stocks heading into the second half of April, but the rally did not match gains posted in the broader market. A late-April report showing a decline in home sales in March served to dampen enthusiasm for thrift stocks, while news of Bank of America's $21 billion proposed acquisition of LaSalle Bank Corp. had little impact on trading activity among thrift and bank stocks. Thrift stocks headed higher along with the broader stock market in early-May, but did not sustain the upward momentum into mid-May. A disappointing report on the
RP® FINANCIAL, LC.
Page 4.14
outlook for the housing market weighed on the thrift sector in mid-May, with the National Association of Home Builders report projecting that home sales and housing production would not begin to improve until late in 2007. Merger news provided a boost to thrift stocks heading into late-May, but the gains were not sustained as thrift stocks traded lower on news of stronger than expected economic data and higher interest rates. A favorable employment report for May boosted thrift stocks at the start of June, which was followed by a general downturn in thrift stocks going into mid-June on higher interest rates. Higher interest rates and lackluster housing data furthered the downward trend in thrift stocks during the second half of June.
The thrift sector continued to struggle at the beginning of the third quarter of 2007 on earnings worries and the widening meltdown in the subprime market as Standard & Poor and Moody's announced plans to downgrade securities backed by subprime mortgages. Bargain hunting and strength in the broader market supported a brief rebound in thrift stocks in mid-July, which was followed a sharp sell off on fears of spreading subprime problems and some second quarter earnings reports showing deterioration in credit quality. A disappointing second quarter earnings report by Countrywide Financial and a larger-than-expected decline in new home sales knocked thrift equities lower in late-July. The downturn in thrift stocks continued into the beginning of August on news that American Home Mortgage Investment Corp. was shutting down operations due to liquidity problems. Thrift stocks participated in the volatility exhibited in the broader market volatility in mid-August, but, in general, the downward trend in thrift equities continued during the first half of August. Thrift equities benefited from the mid-August discount rate cut by the Federal Reserve and then fluctuated along with the broader market through the end of August based on speculation over the outcome of the Federal Reserve's next meeting. On August 31, 2007, the SNL Index for all publicly-traded thrifts closed at 1,537.5 a decrease of 8.7% from one year ago and a decrease of 16.0% year-to-date. The SNL MHC Index closed at 3,516.6 on August 31, 2007, an increase of 4.1% from one year ago and a decrease of 9.2% year-to-date.
B. The New Issue Market
In addition to thrift stock market conditions in general, the new issue market for converting thrifts is also an important consideration in determining the Bank's pro forma market
RP® FINANCIAL, LC.
Page 4.15
value. The new issue market is separate and distinct from the market for seasoned thrift stocks in that the pricing ratios for converting issues are computed on a pro forma basis, specifically: (1) the numerator and denominator are both impacted by the conversion offering amount, unlike existing stock issues in which price change affects only the numerator; and (2) the pro forma pricing ratio incorporates assumptions regarding source and use of proceeds, effective tax rates, stock plan purchases, etc. which impact pro forma financials, whereas pricing for existing issues are based on reported financials. The distinction between pricing of converting and existing issues is perhaps no clearer than in the case of the price/book ("P/B") ratio in that the P/B ratio of a converting thrift will typically result in a discount to book value whereas in the current market for existing thrifts the P/B ratio often reflects a premium to book value. Therefore, it is appropriate to also consider the market for new issues, both at the time of the conversion and in the aftermarket.
The market for recent conversions has pulled back along with the thrift sector in general, with fewer offerings being oversubscribed and typically reflecting only modest price appreciation or, in some cases, trading below their IPO prices in initial after market trading activity. As shown in Table 4.2, two standard conversions, one second-step conversion and three mutual holding company offerings were completed during the past three months. The mutual holding company offerings are considered to be more relevant for purposes of our analysis. Two of the MHC offerings were closed at the top of their super ranges and one was closed at the minimum of its valuation range. Of the three MHC offerings, Hometown Bancorp's offering was considered to be more comparable to the Bank's offering. Beneficial Mutual Bancorp ("Beneficial") is a significantly larger institution than Sound and completed a simultaneous acquisition with the stock offering. FSB Community Bancshares' offering had to be extended to close at the minimum of the offering range and, to date, the stock has only traded on one day since closing on August 15, 2007. Hometown Bancorp had pre-conversion assets of $124 million and raised gross proceeds of $10.7 million in a 45% public offering. On a fully-converted basis, Hometown Bancorp's closing pro forma price/tangible book ratio equaled 82.6%. Hometown Bancorp's stock price was unchanged from the IPO price after the first week of trading and closed 17.5% below the IPO price as of August 31, 2007. Beneficial's stock price was down 6.2% from the IPO price after the first week of trading and closed 5.0% below the IPO
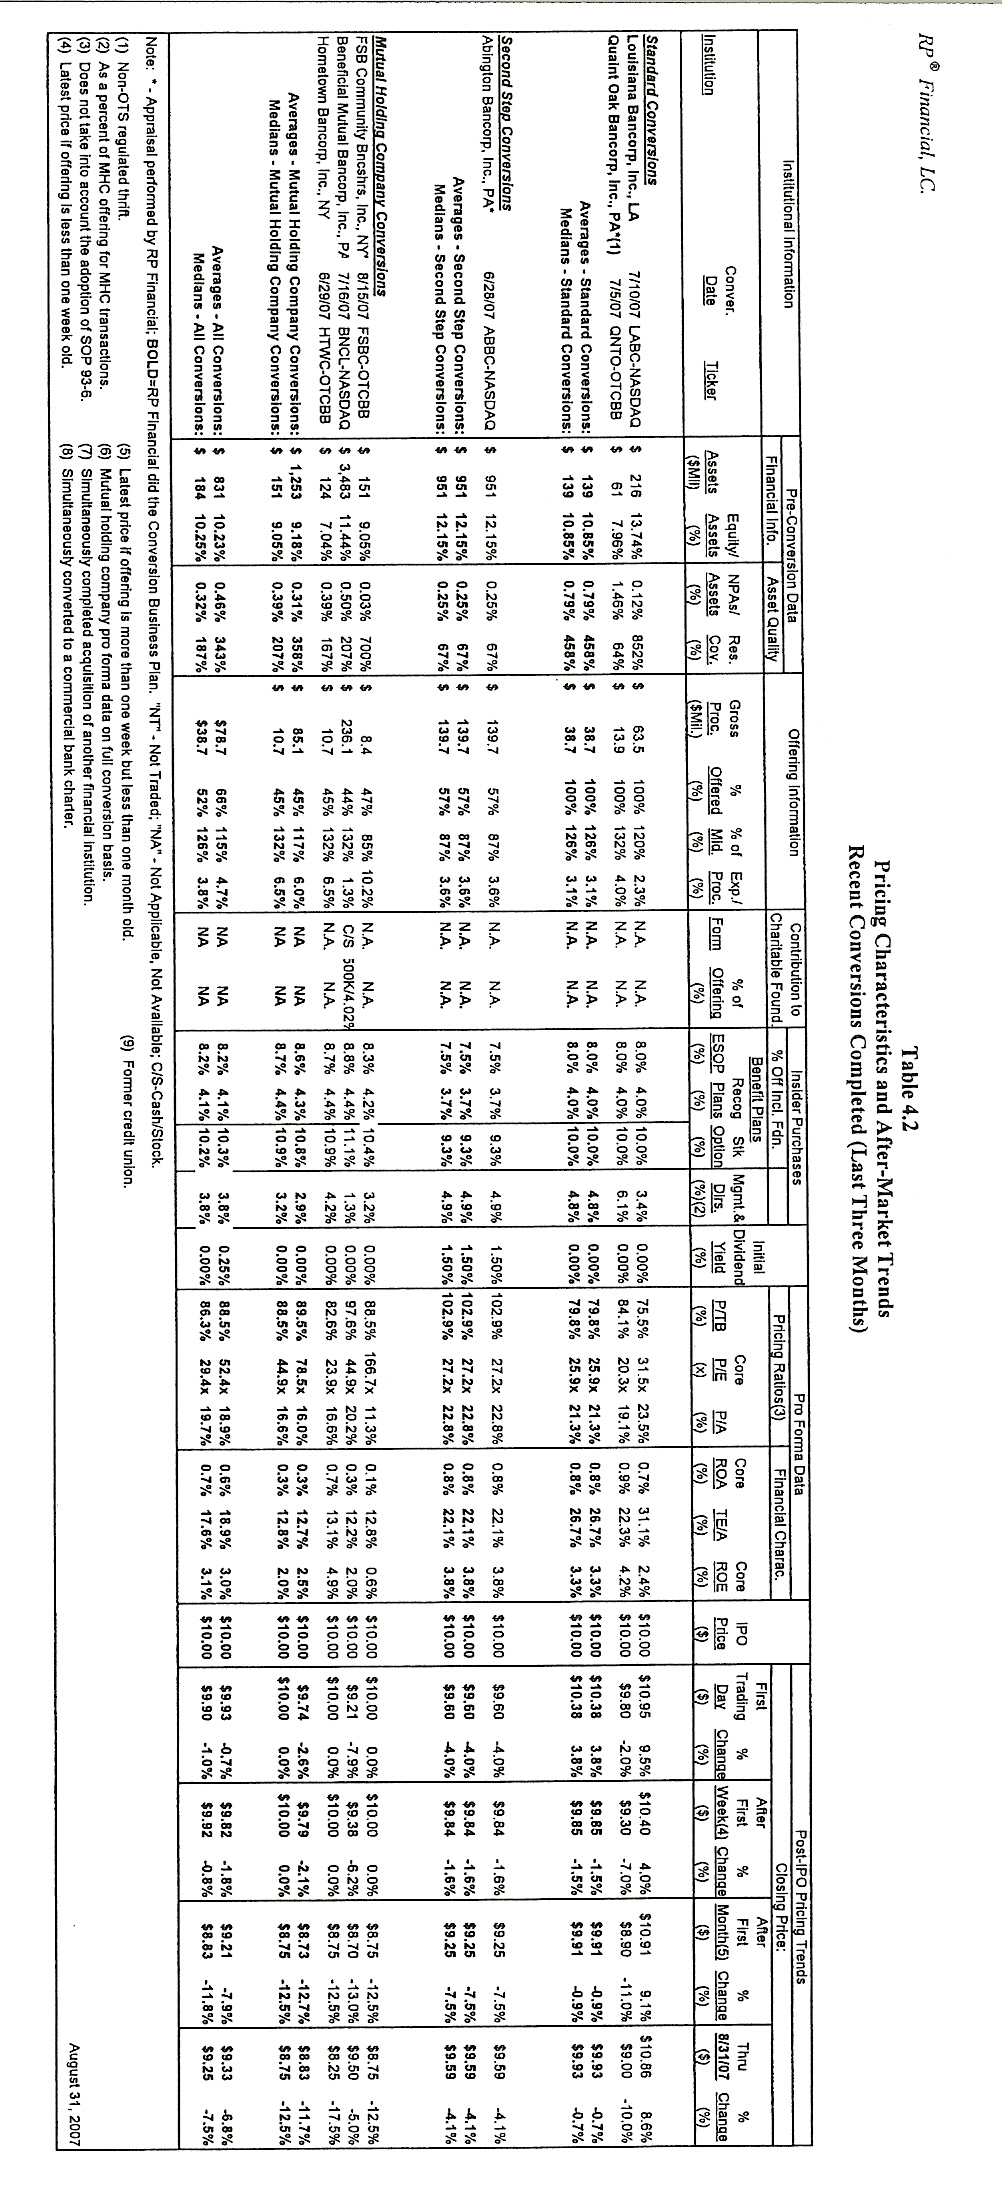
RP® FINANCIAL, LC.
Page 4.17
price as of August 31, 2007. FSB Community Bancshares' stock did not trade until August 31, 2007 and closed down 17.5% from the IPO price.
Shown in Table 4.3 are the current pricing ratios for the two companies that have completed fully-converted offerings during the past three months and are traded on NASDAQ or an Exchange. One of the offerings was a second-step conversions (Abington Bancorp), thereby placing an upward bias on the P/TB ratio compared to the standard conversion offering (Louisiana Bancorp). The current average P/TB ratio of the publicly-traded recent conversions equaled 88.98%.
C. The Acquisition Market
Also considered in the valuation was the potential impact on Sound's stock price of recently completed and pending acquisitions of other savings institutions and banks operating in Washington. As shown in Exhibit IV-4, there were four Washington acquisitions of thrifts completed from the beginning of 2000 through year-to-date 2007, and there is currently one acquisition pending for a Washington thrift. To the extent that speculation of a re-mutualization may impact the Bank's valuation, we have largely taken this into account in selecting companies which operate in the MHC form of ownership. Accordingly, the Peer Group companies are considered to be subject to the same type of acquisition speculation that may influence Sound's trading price.
* * * * * * * * * * *
In determining our valuation adjustment for marketing of the issue, we considered trends in both the overall thrift market, the new issue market including the new issue market for MHC shares and the local acquisition market for thrift and bank stocks. Taking these factors and trends into account, RP Financial concluded that a slight downward adjustment was appropriate in the valuation analysis for purposes of marketing of the issue.
8. Management
Sound's management team appears to have experience and expertise in all of the key areas of the Bank's operations. Exhibit IV-5 provides summary resumes of Sound's Board of
RP® FINANCIAL, LC.
Page 4.18
| Table 4.3 | ||||||||||||||||||||||||||
| Market Pricing Comparatives | ||||||||||||||||||||||||||
| Prices As of August 31, 2007 | ||||||||||||||||||||||||||
| Market Capitalization | Per Share Data | Dividends(4) | Financial Characteristics(6) | |||||||||||||||||||||||
| Price/ | Market | Core 12 Month | Book Value/ | Pricing Ratios(3) | Amount/ | Payout | Total | Equity/ | NPAs/ | Reported | Core | |||||||||||||||
| Financial Institution | Share(1) | Value | EPS(2) | Share | P/E | P/B | P/A | P/TB | P/Core | Share | Yield | Ratio(5) | Assets | Assets | Assets | ROA | ROE | ROA | ROE | |||||||
| ($) | ($Mil) | ($) | ($) | (x) | (%) | (%) | (%) | (x) | ($) | (%) | (%) | ($Mil) | (%) | (%) | (%) | (%) | (%) | (%) | ||||||||
| All Public Companies | $16.62 | $412.92 | $0.74 | $13.46 | 19.97x | 130.65% | 16.47% | 149.25% | 20.71x | $0.41 | 2.34% | 35.89% | $3,136 | 12.58% | 0.60% | 0.53% | 5.04% | 0.49% | 4.70% | |||||||
| Special Selection Grouping (8) | $10.23 | $151.74 | $0.29 | $11.62 | 36.15x | 88.98% | 23.90% | 88.98% | 36.15x | $0.09 | 0.94% | 36.00% | $660 | 27.17% | 0.26% | 0.70% | 3.40% | 0.70% | 3.40% | |||||||
| Special Comparative Group (8) | ||||||||||||||||||||||||||
| ABBC | Abington Bancorp, Inc. of PA | $9.59 | $234.57 | $0.25 | $9.99 | 38.36x | 96.00% | 22.34% | 96.00% | 38.36x | $0.18 | 1.88% | 72.00% | $1,050 | 23.27% | 0.26% | 0.65% | 4.38% | 0.65% | 4.38% | ||||||
| LABC | Louisiana Bancorp, Inc. of LA | $10.86 | $68.92 | $0.32 | $13.25 | 33.94x | 81.96% | 25.47% | 81.96% | 33.94x | $0.00 | 0.00% | 0.00% | $271 | 31.07% | NA | 0.75% | 2.42% | 0.75% | 2.42% | ||||||
| (1) | Average of High/Low or Bid/Ask price per share. |
| (2) | EPS (estimate core basis) is based on actual trailing 12 month data, adjusted to omit non-operating items on a tax-effected basis. |
| (3) | P/E = Price to earnings; P/B = Price to book; P/A = Price to assets; P/TB = Price to tangible book value; and P/Core = Price to core earnings. |
| (4) | Indicated 12 month dividend, based on last quarterly dividend declared. |
| (5) | Indicated 12 month dividend as a percent of trailing 12 month estimated core earnings. |
| (6) | ROA (return on assets) and ROE (return on equity) are indicated ratios based on trailing 12 month common earnings and average common equity and total assets balances. |
| (7) | Excludes from averages and medians those companies the subject of actual or rumored acquisition activities or unusual operating characteristics. |
| (8) | Includes Converted Last 3 Months (no MHC). |
| Source: | Corporate reports, offering circulars, and RP® Financial, LC. calculations. The information provided in this report has been obtained from sources we believe are reliable, but we cannot guarantee the accuracy or completeness of such information. |
| Copyright (c) 2007 by RP® Financial, LC. | |
RP® FINANCIAL, LC.
Page 4.19
Directors and senior management. The financial characteristics of the Bank suggest that the Board and senior management have been effective in implementing an operating strategy that can be well managed by the Bank's present organizational structure. The Bank currently does not have any senior management positions that are vacant.
Similarly, the returns, equity positions and other operating measures of the Peer Group companies are indicative of well-managed financial institutions, which have Boards and management teams that have been effective in implementing competitive operating strategies. Therefore, on balance, we concluded no valuation adjustment relative to the Peer Group was appropriate for this factor.
9. Effect of Government Regulation and Regulatory Reform
In summary, as a federally-insured savings institution operating in the MHC form of ownership, Sound will operate in substantially the same regulatory environment as the Peer Group members -- all of whom are adequately capitalized institutions and are operating with no apparent restrictions. Exhibit IV-6 reflects the Bank's pro forma regulatory capital ratios. On balance, no adjustment has been applied for the effect of government regulation and regulatory reform.
Summary of Adjustments
Overall, based on the factors discussed above, we concluded that the Bank's pro forma market value should reflect the following valuation adjustments relative to the Peer Group:
RP® FINANCIAL, LC.
Page 4.20
Table 4.4
Valuation Adjustments
Sound Financial, Inc. and the Peer Group Companies
| Key Valuation Parameters: | Valuation Adjustment |
| Financial Condition | Slight Downward |
| Profitability, Growth and Viability of Earnings | Moderate Downward |
| Asset Growth | No Adjustment |
| Primary Market Area | Slight Upward |
| Dividends | No Adjustment |
| Liquidity of the Shares | Slight Downward |
| Marketing of the Issue | Slight Downward |
| Management | No Adjustment |
| Effect of Government Regulations and Regulatory Reform | No Adjustment< |
Basis of Valuation - Fully-Converted Pricing Ratios
As indicated in Chapter III, the valuation analysis included in this section places the Peer Group institutions on equal footing by restating their financial data and pricing ratios on a "fully-converted" basis. We believe there are a number of characteristics of MHC shares that make them different from the shares of fully-converted companies. These factors include: (1) lower aftermarket liquidity in the MHC shares since less than 50% of the shares are available for trading; (2) no opportunity for public shareholders to exercise voting control; (3) the potential pro forma impact of second-step conversions on the pricing of MHC institutions; and (4) the regulatory policies regarding the dividend waiver policy by MHC institutions. The above characteristics of MHC shares have provided MHC shares with different trading characteristics versus fully-converted companies. To account for the unique trading characteristics of MHC shares, RP Financial has placed the financial data and pricing ratios of the Peer Group on a fully-converted basis to make them comparable for valuation purposes. Using the per share and pricing information of the Peer Group on a fully-converted basis accomplishes a number of objectives. First, such figures eliminate distortions that result when trying to compare institutions that have different public ownership interests outstanding. Secondly, such an analysis provides ratios that are comparable to the pricing information of fully-converted public companies, and more importantly, are directly applicable to determining the pro forma market value range of the 100% ownership interest in Sound as an MHC. Lastly, such an analysis
RP® FINANCIAL, LC.
Page 4.21
allows for consideration of the potential dilutive impact of dividend waiver policies adopted by the Federal agencies. This technique is validated by the investment community's evaluation of MHC pricing, which also incorporates the pro forma impact of a second-step conversion based on the current market price.
To calculate the fully-converted pricing information for MHCs, the reported financial information for the public MHCs must incorporate the following assumptions, based on completed second-step conversions to date: (1) all shares owned by the MHC are assumed to be sold at the current trading price in a second step-conversion; (2) the gross proceeds from such a sale are adjusted to reflect reasonable offering expenses and standard stock based benefit plan parameters that would be factored into a second-step conversion of MHC institutions; (3) net proceeds are assumed to be reinvested at market rates on a tax effected basis; and (4) the public ownership interest is adjusted to reflect the pro forma impact of the waived dividends pursuant to applicable regulatory policy. Book value per share and earnings per share figures for the public MHCs were adjusted by the impact of the assumed second step-conversion, resulting in an estimation of book value per share and earnings per share figures on a fully-converted basis. Table 4.5 on the following page shows the calculation of per share financial data (fully-converted basis) for each of the ten public MHC institutions that form the Peer Group.
Valuation Approaches: Fully-Converted Basis
In applying the accepted valuation methodology promulgated by the OTS and adopted by the FDIC, i.e., the pro forma market value approach, including the fully-converted analysis described above, we considered the three key pricing ratios in valuing Sound's to-be-issued stock -- price/earnings ("P/E"), price/book ("P/B"), and price/assets ("P/A") approaches -- all performed on a pro forma basis including the effects of the stock proceeds. In computing the pro forma impact of the conversion and the related pricing ratios, we have incorporated the valuation parameters disclosed in Sound's prospectus for reinvestment rate, effective tax rate, stock benefit plan assumptions and the Foundation (summarized in Exhibits IV-7 and IV-8). Pursuant to the minority stock offering, we have also incorporated the valuation parameters disclosed in Sound's prospectus for offering expenses. The assumptions utilized in the pro forma analysis in
RP® FINANCIAL, LC.
Page 4.22
| Table 4.5 | |||||||||||||||||||||||||
| Calculation of Implied Per Share Data -- Incorporating MHC Second Step Conversion | |||||||||||||||||||||||||
| Comparable Institution Analysis | |||||||||||||||||||||||||
| For the 12 Months Ended June 30, 2007 | |||||||||||||||||||||||||
| Pro Forma | |||||||||||||||||||||||||
| Current Ownership | Current Per Share Data (MHC Ratios) | Impact of Second Step Conversion(4) | Per Share Data (Fully-Converted)(4) | Pro Forma(5) | |||||||||||||||||||||
| Total | Public | MHC | Core | Book | Tang. | Share | Gross | Net Incr. | Net Incr. | Core | Book | Tang. | Public | ||||||||||||
| Shares | Shares | Shares | EPS | EPS | Value | Book | Assets | Price | Proceeds(1) | Capital(2) | Income(3) | EPS | EPS | Value | Book | Assets | Pct. | Dilution | |||||||
| (000) | (000) | (000) | ($) | ($) | ($) | ($) | ($) | ($) | ($000) | ($000) | ($000) | ($) | ($) | ($) | ($) | ($) | (%) | (%) | |||||||
| Publicly-Traded MHC Institutions | |||||||||||||||||||||||||
| BFSB | Brooklyn Federal MHC of NY (30.0) | 13,418 | 3,968 | 9,450 | 0.29 | 0.28 | 6.36 | 6.36 | 29.66 | 14.01 | 132,395 | 113,859 | 2,223 | 0.46 | 0.45 | 14.85 | 14.85 | 38.15 | 29.6 | 0 | |||||
| CHEV | Cheviot Fin. Corp. MHC of OH (42.1) | 9,144 | 3,968 | 5,176 | 0.10 | 0.11 | 7.63 | 7.63 | 34.61 | 11.99 | 62,060 | 53,372 | 1,042 | 0.21 | 0.22 | 13.47 | 13.47 | 40.45 | 43.4 | 0 | |||||
| GOV | Gouverneur Bncrp. MHC of NY (42.8) | 4,151 | 1,841 | 2,310 | 0.54 | 0.59 | 8.53 | 8.53 | 78.49 | 12.28 | 28,367 | 24,395 | 476 | 0.65 | 0.70 | 14.41 | 14.41 | 84.37 | 44.4 | 0 | |||||
| GCBC | Green Co. Bncrp. MHC of NY (44.4) | 2,300 | 981 | 1,319 | 0.47 | 0.50 | 8.88 | 8.88 | 57.65 | 11.05 | 14,575 | 12,534 | 245 | 0.58 | 0.61 | 14.33 | 14.33 | 63.10 | 42.7 | 0 | |||||
| JXSB | Jacksonville Bncrp. MHC of IL (47.7) | 1,987 | 947 | 1,040 | 0.29 | 0.31 | 10.57 | 9.15 | 138.35 | 13.39 | 13,926 | 11,976 | 234 | 0.41 | 0.43 | 16.60 | 15.18 | 144.38 | 47.7 | 0 | |||||
| KFFB | KY Fst Fed Bncrp MHC of KY(44.5) | 8,263 | 3,794 | 4,469 | 0.10 | 0.10 | 7.54 | 5.71 | 32.34 | 9.89 | 44,198 | 38,011 | 742 | 0.19 | 0.19 | 12.14 | 10.31 | 36.94 | 45.9 | 0 | |||||
| LSBK | Lake Shore Bncrp. MHC of NY (45.0) | 6,464 | 2,976 | 3,488 | 0.24 | 0.24 | 8.05 | 8.05 | 54.02 | 10.40 | 36,275 | 31,197 | 609 | 0.33 | 0.33 | 12.88 | 12.88 | 58.85 | 46.0 | 0 | |||||
| NECB | NE Comm. Bancorp MHC of NY (45.0) | 13,225 | 5,951 | 7,274 | 0.90 | -0.05 | 8.16 | 8.16 | 23.16 | 10.40 | 75,650 | 65,059 | 1270 | 1.00 | 0.05 | 13.08 | 13.08 | 28.08 | 45.0 | 0 | |||||
| PBHC | Pathfinder BC MHC of NY (35.8) | 2,484 | 881 | 1,603 | 0.33 | 0.24 | 8.36 | 6.78 | 122.61 | 10.98 | 17,601 | 15,137 | 295 | 0.45 | 0.36 | 14.45 | 12.87 | 128.70 | 35.5 | 0 | |||||
| UCBA | United Comm. Bncrp. MHC IN (45.0) | 8,298 | 3,809 | 4,489 | 0.32 | 0.22 | 7.49 | 7.49 | 46.55 | 12.40 | 55,664 | 47,871 | 934 | 0.43 | 0.33 | 13.26 | 13.26 | 52.32 | 45.9 | 0 | |||||
| (1) | Gross proceeds calculated as stock price multiplied by the number of shares owned by the mutual holding company (i.e., non-public shares). | |||
| (2) | Net increase in capital reflects gross proceeds less offering expenses, contra-equity account for leveraged ESOP and deferred compensation account for restricted stock plan. For institutions with assets at the MHC level, the net increase in capital also includes consolidation of MHC assets with the capital of the institution concurrent with hypothetical second step. | |||
| Offering expense percent | 2.00% | |||
| ESOP percent purchase | 8.00% | |||
| Recognition plan percent | 4.00% |
| (3) | Net increase in earnings reflects after-tax reinvestment income (assumes ESOP and recognition plan do not generate reinvestment income), less after-tax ESOP amortization and recognition plan vesting: | |||
| After-tax reinvestment | 3.18% | |||
| ESOP loan term (years) | 10 | |||
| Recognition plan vesting (years) | 5 | |||
| Effective tax rate | 34.00% |
| (4) | Figures reflect adjustments to "non-grandfathered" companies to reflect dilutive impact of cumulative dividends waived by the MHC (reflect FDIC policy regarding waived dividends). | |||
| (5) | Reflects pro forma ownership position of minority stockholders after taking into account the OTS and FDIC policies regarding waived dividends assuming a hypothetical second step. For OTS "grandfathered" companies, dilution reflects excess waived dividends and MHC assets. For all other companies, dilution reflects all waived dividends and MHC assets. | |||
| Source: | Audited and unaudited financial statements, corporate reports, offering circulars, and RP Financial, LC. calculations. The information provided in this report has been obtained from sources we believe are reliable, but we cannot guarantee the accuracy or completeness of such information. |
| Copyright (c) 2007 by RP® Financial, LC. | |
RP® FINANCIAL, LC.
Page 4.23
calculating the Bank's full conversion value were consistent with the assumptions utilized for the minority stock offering.
In our estimate of value, we assessed the relationship of the pro forma pricing ratios relative to the Peer Group, recent conversions and MHC offerings.
RP Financial's valuation placed an emphasis on the following:
- P/E Approach. The P/E approach is generally the best indicator of long-term value for a stock. Given the similarities between the Bank's and the Peer Group's earnings composition and overall financial condition, the P/E approach was carefully considered in this valuation. At the same time, recognizing that (1) the earnings multiples will be evaluated on a pro forma fully-converted basis for the Bank as well as for the Peer Group; and (2) the Peer Group on average has had the opportunity to realize the benefit of reinvesting the minority offering proceeds, we also gave weight to the other valuation approaches.
- P/B Approach. P/B ratios have generally served as a useful benchmark in the valuation of thrift stocks, particularly in the context of an initial public offering, as the earnings approach involves assumptions regarding the use of proceeds. RP Financial considered the P/B approach to be a valuable indicator of pro forma value taking into account the pricing ratios under the P/E and P/A approaches. We have also modified the P/B approach to exclude the impact of intangible assets (i.e., price/tangible book value or "P/TB"), in that the investment community frequently makes this adjustment in its evaluation of this pricing approach.
- P/A Approach. P/A ratios are generally a less reliable indicator of market value, as investors typically assign less weight to assets and attribute greater weight to book value and earnings. Furthermore, this approach as set forth in the regulatory valuation guidelines does not take into account the amount of stock purchases funded by deposit withdrawals, thus understating the pro forma P/A ratio. At the same time, the P/A ratio is an indicator of franchise value, and, in the case of highly capitalized institutions, high P/A ratios may limit the investment community's willingness to pay market multiples for earnings or book value when ROE is expected to be low.
The Bank will adopt Statement of Position ("SOP") 93-6, which will cause earnings per share computations to be based on shares issued and outstanding excluding unreleased ESOP shares. For purposes of preparing the pro forma pricing analyses, we have reflected all shares issued in the offering, including all ESOP shares, to capture the full dilutive impact, particularly since the ESOP shares are economically dilutive, receive dividends and can be voted. However, we did consider the impact of the adoption of SOP 93-6 in the valuation.
RP® FINANCIAL, LC.
Page 4.24
Based on the application of the three valuation approaches, taking into consideration the valuation adjustments discussed above, RP Financial concluded that as of August 31, 2007, the pro forma market value of Sound's full conversion offering, taking into account the dilutive impact of the stock contribution to the Foundation, equaled $29,000,000 at the midpoint, equal to 2,900,000 shares at $10.00 per share.
1. Price-to-Earnings ("P/E"). The application of the P/E valuation method requires calculating the Bank's pro forma market value by applying a valuation P/E multiple (fully-converted basis) to the pro forma earnings base. In applying this technique, we considered both reported earnings and a recurring earnings base, that is, earnings adjusted to exclude any one-time non-operating items, plus the estimated after-tax earnings benefit of the reinvestment of the net proceeds. The Bank's reported earnings equaled $699,000 for the 12 months ended June 30, 2007. In deriving Sound's core earnings, the only non-operating items recorded by Sound consisted of a minimal level of gains on the sale of loans. Adjusting for such net gains on an after-tax basis indicated a core valuation earnings base of $691,000. (Note: see Table 1.2 for the Bank's adjusted earnings calculation and Exhibit IV-9 for the adjustments applied to the Peer Group's earnings in the calculation of core earnings).
Based on Sound's reported and estimated core earnings and incorporating the impact of the pro forma assumptions discussed previously, the Bank's pro forma reported and core P/E multiples (fully-converted basis) at the $29.0 million midpoint value equaled 29.22 times and 29.46 times, respectively, which provided for a premiums of 19.1% and 4.4% relative to the Peer Group's average reported and core P/E multiples (fully-converted basis) of 24.53 times and 28.22 times, respectively (see Table 4.6). In comparison to the Peer Group's
median reported and core earnings multiples of 26.62 times and 31.13 times, respectively, the Bank's pro forma reported and core P/E multiples at the midpoint value indicated a premium of 9.8% and a discount of 5.4%, respectively. At the top of the super range, the Bank's reported and core P/E multiples equaled 35.54 times and 35.81 times, respectively. In comparison to the Peer Group's average reported and core P/E multiples, the Bank' P/E multiples at the top of the super range reflected premiums of 44.9% and 26.9%, respectively. In comparison to the Peer Group's
RP® FINANCIAL, LC.
Page 4.25
| Table 4.6 | ||||||||||||||||||||||||||
| MHC Institutions -- Implied Pricing Ratios, Full Conversion Basis | ||||||||||||||||||||||||||
| Sound Financial, Inc. of WA and the Comparables | ||||||||||||||||||||||||||
| As of August 31, 2007 | ||||||||||||||||||||||||||
| Fully Converted | ||||||||||||||||||||||||||
| Implied Value | Per Share(8) | Dividends(4) | Financial Characteristics(6) | |||||||||||||||||||||||
| Price/ | Market | Core 12 Mo. | Book Value/ | Pricing Ratios(3) | Amount/ | Payout | Total | Equity/ | NPAs/ | Reported | Core | |||||||||||||||
| Financial Institution | Share(1) | Value | EPS(2) | Share | P/E | P/B | P/A | P/TB | P/Core | Share | Yield | Ratio(5) | Assets | Assets | Assets | ROA | ROE | ROA | ROE | |||||||
| ($) | ($Mil) | ($) | ($) | (x) | (%) | (%) | (%) | (x) | ($) | (%) | (%) | ($Mil) | (%) | (%) | (%) | (%) | (%) | (%) | ||||||||
| Sound Financial, Inc. of WA | ||||||||||||||||||||||||||
| Superrange | $10.00 | $38.35 | $0.28 | $12.60 | 35.54x | 79.35% | 15.25% | 79.35% | 35.81x | $0.00 | 0.00% | 0.00% | $252 | 19.22% | 0.22% | 0.43% | 2.23% | 0.43% | 2.22% | |||||||
| Maximum | $10.00 | $33.35 | $0.31 | $13.20 | 32.29x | 75.78% | 13.49% | 75.78% | 32.55x | $0.00 | 0.00% | 0.00% | $247 | 17.80% | 0.23% | 0.42% | 2.35% | 0.41% | 2.33% | |||||||
| Midpoint | $10.00 | $29.00 | $0.34 | $13.88 | 29.22x | 72.05% | 11.91% | 72.05% | 29.46x | $0.00 | 0.00% | 0.00% | $243 | 16.53% | 0.23% | 0.41% | 2.47% | 0.40% | 2.45% | |||||||
| Minimum | $10.00 | $24.65 | $0.39 | $14.80 | 25.89x | 67.55% | 10.29% | 67.55% | 26.11x | $0.00 | 0.00% | 0.00% | $240 | 15.23% | 0.23% | 0.40% | 2.61% | 0.39% | 2.59% | |||||||
| All Public Companies(7) | ||||||||||||||||||||||||||
| Averages | $16.62 | $412.92 | $0.74 | $13.46 | 19.97x | 130.65% | 16.47% | 149.25% | 20.71x | $0.41 | 2.34% | 35.89% | $3,136 | 12.58% | 0.60% | 0.53% | 5.04% | 0.49% | 4.70% | |||||||
| Medians | $14.14 | $91.89 | $0.48 | $11.55 | 17.89x | 120.79% | 13.46% | 136.61% | 19.09x | $0.34 | 2.39% | 40.68% | $778 | 10.67% | 0.37% | 0.55% | 4.54% | 0.54% | 4.64% | |||||||
| All Non-MHC State of WA(7) | ||||||||||||||||||||||||||
| Averages | $18.39 | $677.29 | $1.03 | $11.92 | 20.32x | 155.32% | 18.40% | 179.88% | 21.16x | $0.49 | 2.56% | 48.87% | $3,087 | 11.69% | 0.06% | 1.15% | 9.16% | 1.12% | 8.96% | |||||||
| Medians | $16.04 | $142.23 | $1.06 | $12.11 | 15.83x | 162.15% | 19.33% | 181.03% | 15.97x | $0.42 | 2.73% | 22.27% | $869 | 11.92% | 0.05% | 1.40% | 10.62% | 1.36% | 10.44% | |||||||
| Publicly-Traded MHC Institutions, Full Conversion Basis | ||||||||||||||||||||||||||
| Averages | $11.68 | $81.73 | $0.37 | $13.95 | 24.53x | 83.76% | 22.14% | 86.89% | 28.22x | $0.29 | 2.45% | 44.26% | $347 | 26.14% | 0.42% | 0.97% | 3.48% | 0.61% | 2.60% | |||||||
| Medians | $11.52 | $74.47 | $0.35 | $13.90 | 26.62x | 81.11% | 20.69% | 86.76% | 31.13x | $0.32 | 2.62% | 44.41% | $360 | 24.03% | 0.39% | 0.68% | 3.13% | 0.55% | 2.50% | |||||||
| Publicly-Traded MHC Institutions, Full Conversion Basis | ||||||||||||||||||||||||||
| BFSB | Brooklyn Federal MHC of NY (30.0) | $14.01 | $187.99 | $0.45 | $14.85 | 30.46x | 94.34% | 36.72% | 94.34% | 31.13x | $0.16 | 1.14% | 35.56% | $512 | 38.93% | 0.03% | 1.21% | 3.15% | 1.18% | 3.08% | ||||||
| CHEV | Cheviot Fin. Corp. MHC of OH (42.1) | $11.99 | $109.64 | $0.22 | $13.47 | NM | 89.01% | 29.64% | 89.01% | NM | $0.32 | 2.67% | NM | $370 | 33.30% | 0.23% | 0.52% | 1.55% | 0.55% | 1.62% | ||||||
| GOV | Gouverneur Bncrp. MHC of NY (42.8) | $11.05 | $25.42 | $0.61 | $14.33 | 19.05x | 77.11% | 17.51% | 77.11% | 18.11x | $0.32 | 2.90% | 52.46% | $145 | 22.71% | 0.44% | 0.93% | 4.10% | 0.98% | 4.31% | ||||||
| GCBC | Green Co. Bncrp. MHC of NY (44.4) | $12.28 | $50.97 | $0.70 | $14.41 | 18.89x | 85.22% | 14.55% | 85.22% | 17.54x | $0.50 | 4.07% | 71.43% | $350 | 17.08% | 0.36% | 0.79% | 4.56% | 0.86% | 4.91% | ||||||
| JXSB | Jacksonville Bncrp. MHC of IL (47.7) | $13.39 | $26.61 | $0.43 | $16.60 | 32.66x | 80.66% | 9.27% | 88.21% | 31.14x | $0.30 | 2.24% | 69.77% | $287 | 11.50% | 0.79% | 0.29% | 2.48% | 0.33% | 2.60% | ||||||
| KFFB | KY Fst Fed Bncrp MHC of KY(44.5) | $9.89 | $81.72 | $0.19 | $12.14 | NM | 81.47% | 26.77% | 95.93% | NM | $0.40 | 4.04% | NM | $305 | 32.86% | 0.33% | 0.52% | 1.56% | 0.52% | 1.56% | ||||||
| LSBK | Lake Shore Bncrp. MHC of NY (45.0) | $10.40 | $67.23 | $0.33 | $12.88 | 31.52x | 80.75% | 17.67% | 80.75% | 31.52x | $0.12 | 1.15% | 36.36% | $380 | 21.89% | 0.41% | 0.56% | 2.52% | 0.56% | 2.52% | ||||||
| NECB | NE Comm. Bancorp MHC of NY (45.0) | $10.40 | $137.54 | $0.05 | $13.08 | 10.40x | 79.51% | 37.04% | 79.51% | NM | $0.00 | 0.00% | 0.00% | $371 | 46.58% | 0.27% | 3.65% | 8.61% | 0.18% | 0.43% | ||||||
| PBHC | Pathfinder BC MHC of NY (35.8) | $10.98 | $27.27 | $0.36 | $14.45 | 24.40x | 75.99% | 8.53% | 85.31% | 30.50x | $0.41 | 3.73% | NM | $320 | 11.23% | 0.54% | 0.35% | 3.10% | 0.28% | 2.48% | ||||||
| UCBA | United Comm. Bncrp. MHC IN (45.0) | $12.40 | $102.90 | $0.33 | $13.26 | 28.84x | 93.51% | 23.70% | 93.51% | 37.58x | $0.32 | 2.58% | NM | $434 | 25.34% | 0.81% | 0.87% | 3.22% | 0.66% | 2.47% | ||||||
| (1) | Current stock price of minority stock. Average of High/Low or Bid/Ask price per share. | ||||||||||||||||||||||
| (2) | EPS (estimated core earnings) is based on reported trailing 12 month data, adjusted to omit non-operating gains and losses on a tax-effected basis. Public MHC data reflects additional earnings from reinvestment of proceeds of second step conversion. | ||||||||||||||||||||||
| (3) | P/E = Price to Earnings; P/B = Price to Book; P/A = Price to Assets; P/TB = Price to Tangible Book; and P/Core = Price to Core Earnings. Ratios are pro forma assuming a second step conversion to full stock form. | ||||||||||||||||||||||
| (4) | Indicated 12 month dividend, based on last quarterly dividend declared. | ||||||||||||||||||||||
| (5) | Indicated 12 month dividend as a percent of trailing 12 month estimated core earnings (earnings adjusted to reflect second step conversion). | ||||||||||||||||||||||
| (6) | ROA (return on assets) and ROE (return on equity) are indicated ratios based on trailing 12 month earnings and average equity and assets balances. | ||||||||||||||||||||||
| (7) | Excludes from averages and medians those companies the subject of actual or rumored acquisition activities or unusual operating characteristics. | ||||||||||||||||||||||
| (8) | Figures estimated by RP Financial to reflect a second step conversion of the MHC to full stock form. | ||||||||||||||||||||||
| Source: | Corporate reports, offering circulars, and RP® Financial, LC. calculations. The information provided in this report has been obtained from sources we believe are reliable, but we cannot guarantee the accuracy or completeness of such information. | ||||||||||||||||||||||
| Copyright (c) 2007 by RP® Financial, LC. | |||||||||||||||||||||||
RP® FINANCIAL, LC.
Page 4.26
median reported and core P/E multiples, the Bank' P/E multiples at the top of the super range reflected premiums of 33.5% and 15.0%, respectively.
On an MHC reported basis, the Bank's reported and core P/E multiples at the midpoint value of $29.0 million equaled 36.01 times and 36.37 times, respectively. The Bank's reported and core P/E multiples provided for premiums of 38.7% and 69.5% relative to the Peer Group's average reported and core P/E multiples of 25.97 times and 21.46 times, respectively. In comparison to the Peer Group's median reported and core earnings multiples of 23.51 times and 21.46 times, respectively, the Bank's pro forma reported and core P/E multiples on an MHC basis at the midpoint value indicated premiums of 53.2% and 69.5%, respectively. At the top of the super range on an MHC basis, the Bank's reported and core P/E multiples equaled 45.57 times and 46.00 times, respectively. In comparison to the Peer Group's average reported and core P/E multiples, the Bank' P/E multiples at the top of the super range reflected premiums of 75.5% and 114.4%, respectively. In comparison to the Peer Group's median reported and core P/E multiples, the Bank' P/E multiples at the top of the super range reflected premiums of 93.8% and 114.4%, respectively. The Bank's implied MHC pricing ratios relative to the MHC pricing ratios for the Peer Group are shown in Table 4.7, and the pro forma calculations are detailed in Exhibits IV-10 and Exhibit IV-11.
2. Price-to-Book ("P/B"). The application of the P/B valuation method requires calculating the Bank's pro forma market value by applying a valuation P/B ratio, as derived from the Peer Group's P/B ratio (fully-converted basis), to Sound's pro forma book value (fully-converted basis). Based on the $29.0 million midpoint valuation, Sound's pro forma P/B and P/TB ratios both equaled 72.05%. In comparison to the average P/B and P/TB ratios for the Peer Group of 83.76% and 86.89%, the Bank's ratios reflect a discount of 14.0% on a P/B basis and a discount of 17.1% on a P/TB basis. In comparison to the Peer Group's median P/B and P/TB ratios of 81.11% and 86.76%, respectively, the Bank's pro forma P/B and P/TB ratios at the midpoint value reflect discounts of 11.2% and 17.0%, respectively. At the top of the super range, the Bank's P/B and P/TB ratios on a fully-converted basis both equaled 79.35%. In comparison to the Peer Group's average P/B and P/TB ratios, the Company's P/B and P/TB ratios at the top of the super range reflect discounts of 5.3% and 8.7%, respectively. In comparison to the Peer
RP® FINANCIAL, LC.
Page 4.27
| Table 4.7 | |||||||||||||||||||||||||||
| Public Market Pricing | |||||||||||||||||||||||||||
| Sound Financial, Inc. and the Comparables | |||||||||||||||||||||||||||
| As of August 31, 2007 | |||||||||||||||||||||||||||
| Market | Per Share Data | ||||||||||||||||||||||||||
| Capitalization | Core | Book | Dividends(4) | Financial Characteristics(6) | |||||||||||||||||||||||
| Price/ | Market | 12 Month | Value/ | Pricing Ratios(3) | Amount/ | Payout | Total | Equity/ | NPAs/ | Reported | Core | Offering | |||||||||||||||
| Share(1) | Value | EPS(2) | Share | P/E | P/B | P/A | P/TB | P/Core | Share | Yield | Ratio(5) | Assets | Assets | Assets | ROA | ROE | ROA | ROE | Size | ||||||||
| ($) | ($Mil) | ($) | ($) | (x) | (%) | (%) | (%) | (x) | ($) | (%) | (%) | ($Mil) | (%) | (%) | (%) | (%) | (%) | (%) | ($Mil) | ||||||||
| Sound Financial, Inc. | |||||||||||||||||||||||||||
| Superrange | $10.00 | $17.26 | $0.22 | $7.74 | 45.57x | 129.20% | 16.47% | 129.20% | 46.00x | $0.00 | 0.00% | 0.00% | $233 | 12.75% | 0.24% | 0.36% | 2.84% | 0.36% | 2.81% | 16.88 | |||||||
| Maximum | $10.00 | $15.01 | $0.25 | $8.33 | 40.38x | 120.05% | 14.44% | 120.05% | 40.78x | $0.00 | 0.00% | 0.00% | $231 | 12.03% | 0.24% | 0.36% | 2.97% | 0.35% | 2.94% | 14.67 | |||||||
| Midpoint | $10.00 | $13.05 | $0.28 | $9.01 | 36.01x | 111.02% | 12.57% | 111.02% | 36.37x | $0.00 | 0.00% | 0.00% | $231 | 11.32% | 0.24% | 0.35% | 3.08% | 0.35% | 3.05% | 12.76 | |||||||
| Minimum | $10.00 | $11.09 | $0.32 | $9.93 | 31.50x | 100.75% | 10.66% | 100.75% | 31.82x | $0.00 | 0.00% | 0.00% | $231 | 10.58% | 0.24% | 0.34% | 3.20% | 0.34% | 3.17% | 10.85 | |||||||
| All Public Companies(7) | |||||||||||||||||||||||||||
| Averages | $16.62 | $412.92 | $0.74 | $13.46 | 19.97x | 130.65% | 16.47% | 149.25% | 20.71x | $0.41 | 2.34% | 35.89% | $3,136 | 12.58% | 0.60% | 0.53% | 5.04% | 0.49% | 4.70% | ||||||||
| Medians | $14.14 | $91.89 | $0.48 | $11.55 | 17.89x | 120.79% | 13.46% | 136.61% | 19.09x | $0.34 | 2.39% | 40.68% | $778 | 10.67% | 0.37% | 0.55% | 4.54% | 0.54% | 4.64% | ||||||||
| All Non-MHC State of WA(7) | |||||||||||||||||||||||||||
| Averages | $18.39 | $677.29 | $1.03 | $11.92 | 20.32x | 155.32% | 18.40% | 179.88% | 21.16x | $0.49 | 2.56% | 48.87% | $3,087 | 11.69% | 0.06% | 1.15% | 9.16% | 1.12% | 8.96% | ||||||||
| Medians | $16.04 | $142.23 | $1.06 | $12.11 | 15.83x | 162.15% | 19.33% | 181.03% | 15.97x | $0.42 | 2.73% | 22.27% | $869 | 11.92% | 0.05% | 1.40% | 10.62% | 1.36% | 10.44% | ||||||||
| Comparable Group Averages | |||||||||||||||||||||||||||
| Averages | $11.68 | $33.66 | $0.25 | $8.16 | 25.97x | 145.72% | 25.67% | 154.95% | 21.46x | $0.29 | 2.45% | 22.41% | $306 | 17.38% | 0.42% | 0.88% | 4.65% | 0.44% | 3.10% | ||||||||
| Medians | $11.52 | $34.24 | $0.24 | $8.11 | 23.51x | 131.25% | 22.95% | 151.74% | 21.46x | $0.32 | 2.62% | 23.02% | $311 | 15.75% | 0.39% | 0.58% | 4.07% | 0.38% | 2.90% | ||||||||
| Comparable Group | |||||||||||||||||||||||||||
| BFSB | Brooklyn Federal MHC of NY (30.0) | $14.01 | $55.59 | $0.28 | $6.36 | NM | 220.28% | 47.24% | 220.28% | NM | $0.16 | 1.14% | 16.90% | $398 | 21.44% | 0.03% | 0.98% | 4.75% | 0.94% | 4.58% | |||||||
| CHEV | Cheviot Fin. Corp. MHC of OH (42.1) | $11.99 | $47.58 | $0.11 | $7.63 | NM | 157.14% | 34.64% | 157.14% | NM | $0.32 | 2.67% | NM | $316 | 22.05% | 0.23% | 0.29% | 1.29% | 0.32% | 1.42% | |||||||
| GOV | Gouverneur Bncrp. MHC of NY (42.8) | $11.05 | $10.84 | $0.50 | $8.88 | 23.51 | 124.44% | 19.17% | 124.44% | 22.10x | $0.32 | 2.90% | 27.30% | $133 | 15.40% | 0.44% | 0.82% | 5.40% | 0.88% | 5.75% | |||||||
| GCBC | Green Co. Bncrp. MHC of NY (44.4) | $12.28 | $22.61 | $0.59 | $8.53 | 22.74 | 143.96% | 15.65% | 143.96% | 20.81x | $0.50 | 4.07% | NM | $326 | 10.87% | 0.36% | 0.71% | 6.44% | 0.78% | 7.03% | |||||||
| JXSB | Jacksonville Bncrp. MHC of IL (47.7) | $13.39 | $12.68 | $0.31 | $10.57 | NM | 126.68% | 9.68% | 146.34% | NM | $0.30 | 2.24% | NM | $275 | 7.64% | 0.79% | 0.22% | 2.76% | 0.23% | 2.95% | |||||||
| KFFB | KY Fst Fed Bncrp MHC of KY(44.5) | $9.89 | $37.52 | $0.10 | $7.54 | NM | 131.17% | 30.58% | 173.20% | NM | $0.40 | 4.04% | NM | $267 | 23.31% | 0.33% | 0.31% | 1.32% | 0.31% | 1.32% | |||||||
| LSBK | Lake Shore Bncrp. MHC of NY (45.0) | $10.40 | $30.95 | $0.24 | $8.05 | NM | 129.19% | 19.25% | 129.19% | NM | $0.12 | 1.15% | 23.02% | $349 | 14.90% | 0.41% | 0.44% | 2.90% | 0.44% | 2.90% | |||||||
| NECB | NE Comm. Bancorp MHC of NY (45.0) | $10.40 | $61.89 | ($0.05) | $8.16 | 11.56 | 127.45% | 44.91% | 127.45% | NM | $0.00 | 0.00% | NM | $306 | 35.23% | 0.27% | 4.00% | 13.45% | -0.22% | -0.75% | |||||||
| PBHC | Pathfinder BC MHC of NY (35.8) | $10.98 | $9.67 | $0.24 | $8.36 | 33.27 | 131.34% | 8.96% | 161.95% | NM | $0.41 | 3.73% | NM | $305 | 6.82% | 0.54% | 0.27% | 3.92% | 0.20% | 2.85% | |||||||
| UCBA | United Comm. Bncrp. MHC IN (45.0) | $12.40 | $47.23 | $0.22 | $7.49 | 38.75 | 165.55% | 26.64% | 165.55% | NM | $0.32 | 2.58% | NM | $386 | 16.09% | 0.81% | 0.73% | 4.22% | 0.50% | 2.90% | |||||||
| (1) | Average of High/Low or Bid/Ask price per share. |
| (2) | EPS (estimate core basis) is based on actual trailing 12 month data, adjusted to omit non-operating items on a tax-effected basis, and is shown on a pro forma basis where appropriate. |
| (3) | P/E = Price to earnings; P/B = Price to book; P/A = Price to assets; P/TB = Price to tangible book value; and P/Core = Price to core earnings. |
| (4) | Indicated 12 month dividend, based on last quarterly dividend declared. |
| (5) | Indicated 12 month dividend as a percent of trailing 12 month estimated core earnings. |
| (6) | ROA (return on assets) and ROE (return on equity) are indicated ratios based on trailing 12 month common earnings and average common equity and total assets balances. |
| (7) | Excludes from averages and medians those companies the subject of actual or rumored acquisition activities or unusual operating characteristics. |
| Source: | Corporate reports, offering circulars, and RP Financial, LC. calculations. The information provided in this report has been obtained from sources we believe are reliable, but we cannot guarantee the accuracy or completeness of such information. |
RP® FINANCIAL, LC.
Page 4.28
Group's median P/B and P/TB ratios, the Company's P/B and P/TB ratios at the top of the super range reflect discounts of 2.2% and 8.5%, respectively. RP Financial considered the discounts under the P/B approach to be reasonable, in light of the previously referenced valuation adjustments, the nature of the calculation of the P/B ratio which mathematically results in a ratio discounted to book value and the resulting pricing ratios indicated under the earnings approach.
On an MHC reported basis, the Bank's P/B and P/TB ratios at the $29.0 million midpoint value both equaled 111.02%. In comparison to the average P/B and P/TB ratios indicated for the Peer Group of 145.72% and 154.95%, respectively, Sound's ratios were discounted by 23.8% on a P/B basis and 28.4% on a P/TB basis. In comparison to the Peer Group's median P/B and P/TB ratios of 131.25% and 151.74%, respectively, the Bank's pro forma P/B and P/TB ratios at the midpoint value reflect discounts of 15.4% and 26.8%, respectively. At the top of the super range, the Bank's P/B and P/TB ratios on an MHC basis both equaled 129.20%. In comparison to the Peer Group's average P/B and P/TB ratios, the Company's P/B and P/TB ratios at the top of the super range reflect discounts of 11.3% and 16.6%, respectively. In comparison to the Peer Group's median P/B and P/TB ratios, the Company's P/B and P/TB ratios at the top of the super range reflect discounts of 1.6% and 14.9%, respectively.
3. Price-to-Assets ("P/A"). The P/A valuation methodology determines market value by applying a valuation P/A ratio (fully-converted basis) to the Bank's pro forma asset base, conservatively assuming no deposit withdrawals are made to fund stock purchases. In all likelihood there will be deposit withdrawals, which results in understating the pro forma P/A ratio which is computed herein. At the midpoint of the valuation range, Sound's full conversion value equaled 11.91% of pro forma assets. Comparatively, the Peer Group companies exhibited an average P/A ratio (fully-converted basis) of 22.14%, which implies a discount of 46.2% has been applied to the Bank's pro forma P/A ratio (fully-converted basis). In comparison to the Peer Group's median P/A ratio of 20.69%, the Bank's pro forma P/A ratio at the midpoint value reflects a discount of 42.4%.
On an MHC reported basis, Sound's pro forma P/A ratio at the $29.0 million midpoint value equaled 12.57%. In comparison to the Peer Group's average P/A ratio of 25.67%, Sound's
RP® FINANCIAL, LC.
Page 4.29
P/A ratio indicated a discount of 51.0%. In comparison to the Peer Group's median P/A ratio of 22.95%, the Bank's pro forma P/A ratio at the midpoint value reflected a discount of 45.2%.
Comparison to Recent Offerings
As indicated at the beginning of this chapter, RP Financial's analysis of recent conversion and MHC offering pricing characteristics at closing and in the aftermarket has been limited to a "technical" analysis and, thus, the pricing characteristics of recent conversion offerings can not be a primary determinate of value. Particular focus was placed on the P/TB approach in this analysis, since the P/E multiples do not reflect the actual impact of reinvestment and the source of the stock proceeds (i.e., external funds vs. deposit withdrawals). As previously noted, of the three recently completed MHC offerings, Hometown Bancorp's offering was considered to be most comparable to Sound's offering. Hometown Bancorp's MHC offerings closed at a price/tangible book ratio of 82.6% (fully-converted basis) and, as of August 31, 2007, Hometown Bancorp's stock price was 17.5% below the IPO price. In comparison, the Bank's P/TB ratio of 72.05% at the midpoint value reflects an implied discount of 12.8% relative to Hometown Bancorp's closing P/TB ratio.
Valuation Conclusion
Based on the foregoing, it is our opinion that, as of August 31, 2007, the estimated aggregate pro forma market value of the shares to be issued immediately following the conversion, both shares issued publicly as well as to the MHC, equaled $29,000,000 at the midpoint, equal to 2,900,000 shares offered at a per share value of $10.00. The Board of Directors has established a public offering range such that the public ownership of the Bank will constitute a 44.0% ownership interest prior to the issuance of shares to the Foundation. Based on the public offering range and inclusive of the shares issued to the Foundation, equal to 1.0% of the shares issued in the reorganization, the public ownership of shares will represent 45.0% of the shares issued throughout the valuation range. Based on the foregoing valuation, the corresponding range of shares and market values based on a $10.00 per share price are as shown in the table below. The pro forma valuation calculations relative to the Peer Group (fully-converted basis) are shown in Table 4.6 and are detailed in Exhibit IV-7 and Exhibit IV-8; the
RP® FINANCIAL, LC.
Page 4.30
pro forma valuation calculations relative to the Peer Group based on reported financials are shown in Table 4.7 and are detailed in Exhibits IV-10 and IV-11.
| Offering Shares | MHC Shares | Foundation Shares | Total Shares | |||||||||
| Shares | ||||||||||||
| Supermaximum | 1,687,510 | 2,109,388 | 38,353 | 3,835,251 | ||||||||
| Maximum | 1,467,400 | 1,834,250 | 33,350 | 3,335,000 | ||||||||
| Midpoint | 1,276,000 | 1,595,000 | 29,000 | 2,900,000 | ||||||||
| Minimum | 1,084,600 | 1,355,750 | 24,650 | 2,465,000 | ||||||||
| Market Value | ||||||||||||
| Supermaximum | $16,875,100 | $21,093,880 | $383,530 | $38,352,510 | ||||||||
| Maximum | $14,674,000 | $18,342,500 | $333,500 | $33,350,000 | ||||||||
| Midpoint | $12,760,000 | $15,950,000 | $290,000 | $29,000,000 | ||||||||
| Minimum | $10,846,000 | $13,557,500 | $246,500 | $24,650,000 |