Business Valuations
Fairness Opinions
Solvency Opinions
Expert Testimony
Fiduciary Advisory Services
Los Angeles Sacramento
June 12, 2008
File No: 18470
Mr. Brian Altounian
President and Chief Operating Officer
Platinum Studios, Inc.
11400 W. Olympic Blvd, 14th Floor
Los Angeles, CA 90064
RE: | Valuation of Intellectual Property Held and Controlled by Platinum Studios, Inc. (Ticker Symbol: PDOS.OB) |
Dear Mr. Altounian:
As requested, SANLI PASTORE& HILL, INC. (“SP&H”) has determined the fair market value and fair value of a 100% equity interest in intellectual property consisting primarily of a library of comic book characters (the “Intellectual Property” or the “IP”) held and controlled by Platinum Studios, Inc. (“Platinum” or the “Company”). The Intellectual Property is being commercialized in six primary areas: 1) theatrical films and DVDs, 2) online content, 3) comic books, 4) video games, 5) licensing and merchandising, and 6) an online comic book challenge contest. The Company’s corporate headquarters are located at 11400 W. Olympic Boulevard, 14th Floor, Los Angeles, California.
PURPOSE OF ASSIGNMENT
The purpose of SP&H’s assignment is to determine the fair market value and fair value, as further described in the Standard of Value section of this cover letter, of a 100% equity interest in the Intellectual Property held and controlled by Platinum Studios, Inc.
Sanli Pastore& Hill, Inc.
1990 South Bundy Drive, Suite 800
Los Angeles, California 90025
Telephone: 310/571-3400
Fax: 310/571-3420
www.sphvalue.com
| June 12, 2008 | Los Angeles Sacramento | |
| Page 2 of 6 | ||
FUNCTION OF ASSIGNMENT
The function of this valuation is to provide information that may be used by management to raise additional capital for the Company.
DATE OF VALUE
The date of value utilized herein is March 31, 2008. Unless otherwise indicated, our discussion is as of the date of value.
SCOPE OF WORK
SP&H’s valuation is referred to by the American Society of Appraisers (“ASA”) as anAppraisal. The definition ofAppraisal is provided by ASA Business Valuation Standard I. This standard defines the objectives and qualities of anAppraisal as follows:
a. | The objective of an appraisal is to express an unambiguous opinion as to the value of the business, business ownership interest, or security, which is supported by all procedures that the appraiser deems to be relevant to the valuation. |
b. | An appraisal has the following qualities: |
(1) | It is expressed as a single dollar amount or a range. |
(2) | It considers all relevant information as of the appraisal date available to the appraiser at the time of performance of the valuation. |
(3) | The appraiser conducts appropriate procedures to collect and analyze all information expected to be relevant to the valuation. |
(4) | The valuation is based upon consideration of all conceptual approaches deemed to be relevant by the appraiser. |
STANDARD OF VALUE
In performing our valuation, we will use the ASA definition of fair market value:1
1“ASA Business Valuation Standardsã and Portions of Uniform Standards of Professional Appraisal Practice (USPAP)” Copyright, 2002, American Society of Appraisers. p. 23.
| Mr. Brian Altounian | ||
Valuation of IP for Platinum Studios, Inc. | ||
| June 12, 2008 | Los Angeles Sacramento | |
| Page 3 of 6 | ||
Fair Market Value:The price, expressed in terms of cash equivalents, at which property would change hands between a hypothetical willing and able buyer and a hypothetical willing and able seller, acting at arm’s length in an open and unrestricted market, when neither is under compulsion to buy or sell and when both have reasonable knowledge of the relevant facts.
We also considered Statement of Financial Accounting Standards (“SFAS”) No. 157, in which fair value is defined as follows:
Fair Value: The exchange price is the price in an orderly transaction between market participants to sell the asset or transfer the liability in the market in which the reporting entity would transact for the asset or liability, that is, the principal or most advantageous market for the asset or liability. The transaction to sell the asset or transfer the liability is a hypothetical transaction at the measurement date, considered from the perspective of a market participant that holds the asset or owes the liability. Therefore, the definition focuses on the price that would be received to sell the asset or paid to transfer the liability (an exit price), not the price that would be paid to acquire the asset or received to assume the liability (an entry price).
In addition, SFAS 157 identifies a fair value hierarchy to rank the reliability of inputs used in a valuation approach, which is as follows:
Level 1: Use quoted prices for identical securities in an active market;
When those prices are not available,
Level 2: Use observable inputs that a market participant would use;
When those observations are not available,
Level 3: Use unobservable inputs.
SP&H considered the fair value hierarchy, and our conclusion is fair market value, as well as fair value.
PREMISE OF VALUE
It is essential to determine under which premise of value a business enterprise’s valuation will be determined. The premises of value to be considered are:
| Mr. Brian Altounian | ||
Valuation of IP for Platinum Studios, Inc. | ||
| June 12, 2008 | Los Angeles Sacramento | |
| Page 4 of 6 | ||
| 1. | Valuation under going-concern conditions: the business enterprise is valued in continued use, as a mass assemblage of income producing assets and well-managed, efficient employees, as a going-concern business enterprise. |
In addition, the ASA defines Going-Concern Value as:
1. The value of an enterprise, or an interest therein, as a going concern. 2. Intangible elements of value in a business enterprise resulting from factors such as: having a trained work force; an operational plant; and the necessary licenses, systems and procedures in place.
| 2. | Valuation as an assemblage of assets: the value in place as a mass assemblage of assets, but not in current use in the production of income, and not as a going-concern business enterprise. |
| 3. | Valuation as an orderly disposition: the value in exchange, on a piecemeal basis (not part of a mass assemblage of assets), as part of an orderly liquidation. |
| 4. | Valuation as a forced liquidation: the value in exchange, on a piecemeal basis (not part of a mass assemblage of assets), as part of a forced liquidation; this premise contemplates that the assets of the business enterprise will be sold individually and that they will experience less than normal exposure to the market. A Chapter 7, Bankruptcy Act liquidation is one example. |
Based upon our research and analysis, the Intellectual Property was valued under the going concern premise number 1 above, subject to the Limited Conditions on page 5 of this letter.
CONCLUSION OF VALUES
Based upon the results of our analysis and procedures, the fair market value and fair value of the Intellectual Property under a going-concern premise is as follows (see Schedule 31, page 92):
| Mr. Brian Altounian | ||
Valuation of IP for Platinum Studios, Inc. | ||
| June 12, 2008 | Los Angeles Sacramento | |
| Page 5 of 6 | ||
Fair Market Value and Fair Value of Intellectual Property | ||||
Film Entertainment | ||||
| Licensed Films | $ | 8,750,000 | ||
| Joint Venture Films | 18,457,000 | |||
| Film Fund Films | 23,565,000 | |||
| Direct to DVD Films | 9,314,000 | |||
Film Entertainment Total | $ | 60,041,000 | ||
Digital Publishing | $ | 28,816,000 | ||
Video Network | $ | 42,391,000 | ||
Print Publishing | $ | 812,000 | ||
Licensed Video Games | $ | 29,852,000 | ||
Licensing and Merchandising | $ | 7,991,000 | ||
Comic Book Challenge | $ | 500,000 | ||
Total Market Value of Invested Capital | $ | 170,403,000 | ||
Less: | ||||
| Net Working Capital | $ | (1,598,000 | ) | |
| Property and Equipment | $ | (257,000 | ) | |
| Existing Debt | $ | (4,662,000 | ) | |
| Projected Debt Funding | $ | (13,848,000 | ) | |
Total Fair Market Value and Fair Value of 100% Equity Interest in Intellectual Property | $ | 150,038,000 | ||
In rendering our opinion, SP&H has relied upon and assumed the accuracy and completeness of all financial and other information that was available to us from both public and private sources, including all the financial information and other information provided to us by Platinum. We have further relied upon assurances from management ofPlatinum that they are unaware of any facts that would make the information provided to SP&H incomplete or misleading. SP&H conducted interviews with the management regarding assumptions contained in our projections and the factors that may affect the accuracy of these projections, and also conducted thorough independent industry, economic and competitive research and analysis. It should be noted, however, that there exists the possibility thatPlatinum’s performance will differ from what is projected in the report. We make no representations about the ability of Platinum to achieve these projections. Actual results may differ, and these differences could be material. We disclaim any liability resulting from information provided by management.
| Mr. Brian Altounian | ||
Valuation of IP for Platinum Studios, Inc. | ||
| June 12, 2008 | Los Angeles Sacramento | |
| Page 6 of 6 | ||
Among several risk factors identified in the Company’s 10-K as of December 31, 2007, are the Company’s ability to obtain additional financing to execute its business plan as well as the Company’s ability to continue as a going concern. Our valuation takes into account these risks.
Our valuation opinions are necessarily based on economic, market, financial, and other conditions, as they exist, and the information made available to us. We reserve the right to amend our opinions if additional information is made available. Please note that we have not been engaged to nor are we rendering any fairness or solvency opinions in connection with this engagement.
Our compensation for this appraisal is not contingent on an action or event resulting from the analyses, opinions, or conclusions in, or use of, this report.
The report that follows sets forth the information used in arriving at our conclusion.
The valuation analyses performed herein were done in conformity with the Appraisal Foundation’s Uniform Standards of Professional Appraisal Practice. This appraisal is subject to the enclosed “Appraisers’ Certification and Contingent and Limiting Conditions.” Also enclosed is information about SP&H, including the professional qualifications of the firm’s management and SP&H's products and services.
Respectfully submitted,

SANLI PASTORE&HILL, INC.
a California Corporation
NS/TP/mi/nl
Enclosures
EXECUTIVE SUMMARY
Platinum owns 5,622 comic book characters in various genres. The Company’s focus is adapting its library to all media platforms. Some of Platinum’s titles include:Cowboys & Aliens, Unique, Atlantis Rising, Dead of Night, Blood Nation, Ghosting,and Kiss 4 K.With characters that have appeared in comics in 25 languages and in more than 50 countries, the Company’s library is continually expanding.
In 2007 and through the first quarter of 2008, Platinum:
| · | SoldUnique to Disney Studios, with the anticipation that it will go into production in 2009; |
| · | Entered into a 2-year option agreement with DreamWorks, Universal Studios, Paramount Pictures, and Imagine Entertainment to acquire the film production rights toCowboys & Aliens,with the goal to produce a feature film; |
| · | Completed a co-production deal forDead of Nightwith Hyde Park Entertainment; and |
| · | Completed a co-production deal forWitchbladewith Arclight Films and Top Cow Entertainment. |
Currently Platinum is in negotiation with several film studios to co-produce the following titles:
| · | Atlantis Rising |
| · | Hunter |
| · | Mal Chance |
The depth, breadth, and versatility of Platinum’s library provide a rich field for the growth of lucrative entertainment franchises. Among the 84 comic book adaptation movies since 1978 to present, 22.8% of the movies produced at least 1 sequel. With the potential to create film franchises and spin-offs, this enables the Company to produce more film projects derived from the same characters.
On February 1, 2008, Platinum became a publicly traded company (ticker symbol: PDOS.OB) on the OTCBB. For the quarter ended March 31, 2008, the stock prices per common share reached a high of $0.23 and a low of $0.09. The number of outstanding shares, as of March 31, 2008, was 216,921,227, which indicated a market capitalization of $34.7 million. Platinum successfully raised approximately $5.0 million from its initial round of private financing (“PPM”) and plans to raise additional $2.2 million in the second round. The proceeds of the offering are expected to be used for working capital.
Platinum’s principals have spent approximately $10 million building the 5,622 character library. Platinum is actively recruiting executives, artists, and other talent.
Based upon the results of our analysis and procedures, the fair market value and fair value of equity interest in Platinum’s Intellectual Property is $150,038,000.
TABLE OF CONTENTS
TABLE OF CONTENTS | I |
COMPANY PROFILE | 1 |
| DATE OF VALUE | 1 |
| BUSINESS OVERVIEW | 1 |
| PRODUCTS AND SERVICES | 2 |
Definition of Industry | 2 |
Products | 2 |
| LOCATIONS AND FACILITIES | 3 |
| BUSINESS STRATEGY | 3 |
Character Development | 3 |
Sales and Distribution | 4 |
| CUSTOMERS AND CONSUMERS | 6 |
| PROPERTY AND EQUIPMENT | 6 |
Fixture and Equipment | 6 |
Licensing Rights | 6 |
| COMPANY ORGANIZATION AND STRUCTURE | 8 |
Ownership | 8 |
Executive Management | 9 |
Management | 10 |
Employees | 10 |
FINANCIAL ANALYSIS | 11 |
Income Statements (Schedule 1) | 11 |
Balance Sheets (Schedule 2) | 12 |
| SUMMARY | 14 |
Schedule 1: Income Statements | 15 |
Schedule 2: Balance Sheets | 16 |
INDUSTRY ANALYSIS | 17 |
| INTRODUCTION | 17 |
| U.S. FILM ENTERTAINMENT MARKET | 17 |
Industry Growth | 17 |
Number of Films Released | 18 |
Comic Book Adaptation Movies | 18 |
Industry Concentration | 19 |
| U.S. AND INTERNATIONAL LICENSING MARKET | 20 |
Industry Growth | 20 |
Character Licensing Growth | 21 |
| U.S. DIGITAL PUBLISHING INDUSTRY | 21 |
| U.S. COMIC BOOK PUBLISHING INDUSTRY | 23 |
Industry Growth | 23 |
Comic Book Market Shares | 23 |
| U.S. VIDEO GAME INDUSTRY | 24 |
Industry Growth | 24 |
| SUMMARY | 24 |
COMPETITION ANALYSIS | 26 |
ECONOMIC ANALYSIS | 28 |
| INTRODUCTION | 28 |
| THE U.S. ECONOMY | 28 |
Growth | 28 |
Unemployment | 29 |
Consumer Confidence | 29 |
Personal Income | 30 |
Disposable Income | 31 |
| FORECASTS FOR THE U.S. ECONOMY | 32 |
The Anderson Forecast | 32 |
The Livingston Survey | 32 |
The Congressional Budget Office Survey | 32 |
| THE EUROPEAN ECONOMY | 33 |
European Growth | 33 |
European Unemployment | 33 |
| FORECASTS FOR THE EUROPEAN ECONOMY | 34 |
The Euro-area GDP Growth Projection | 34 |
European Economic Forecasts | 34 |
| SUMMARY | 35 |
VALUATION ANALYSIS | 36 |
| INTRODUCTION | 36 |
| DEFINITION OF FAIR MARKET VALUE | 36 |
| DATE OF VALUE | 37 |
| RISK/REWARD PROFILE | 37 |
| METHODOLOGICAL APPROACHES | 40 |
Schedule 3: Projected Cash Flows for Licensed Film Division | 43 |
Schedule 4: Method 1: Discount Cash Flow for Licensed Film Division | 45 |
Schedule 5: Method 2: Market Multiplier Method for Licensed Film Division | 51 |
Schedule 6: Fair Market Value of Intellectual Property in the Licensed Film Division | 53 |
Schedule 7: Projected Cash Flows for Joint Venture Film Division | 54 |
Schedule 8: Method 1: Discount Cash Flow for Joint Venture Film Division | 56 |
Schedule 9: Method 2: Market Multiplier Method for Joint Venture Film Division | 57 |
Schedule 10: Fair Market Value of Intellectual Property in the Joint Venture Film Division | 59 |
Schedule 11: Projected Cash Flows for Film Fund Division | 60 |
Schedule 12: Method 1: Discount Cash Flow for Film Fund Division | 62 |
Schedule 13: Method 2: Market Multiplier Method for Film Fund Division | 63 |
Schedule 14: Fair Market Value of Intellectual Property in the Joint Venture Film Division | 65 |
Schedule 15: Projected Cash Flows for Direct to DVD Division | 66 |
Schedule 16: Method 1: Discount Cash Flow for Direct to DVD Division | 68 |
Schedule 17: Method 2: Market Multiplier Method for Direct to DVD Division | 69 |
Schedule 18: Fair Market Value of Intellectual Property in the Direct to DVD Division | 71 |
Schedule 19: Projected Cash Flow for Digital Publishing Division | 72 |
Schedule 20: Method 1: Discount Cash Flow for Digital Publishing Division | 74 |
Schedule 21: Method 2: Market Multiplier Method for Digital Publishing Division | 76 |
Schedule 22: Fair Market Value of Intellectual Property in the Digital Publishing Division | 78 |
Schedule 23: Projected Cash Flow for Video Network Division | 79 |
Schedule 24: Method 1: Discount Cash Flow for Video Network Division | 81 |
Schedule 25: Method 2: Market Multiplier Method for Video Network Division | 82 |
Schedule 26: Fair Market Value of Intellectual Property in the Video Network Division | 84 |
Schedule 27: Revenue Multiplier Method for Print Publishing Division | 85 |
Schedule 28: Projected Cash Flow for Licensed Video Games Division | 87 |
Schedule 29: Discounted Cash Flow Method for Licensed Video Games Division | 89 |
Schedule 30: Discounted Cash Flow Method for Licensing and Merchandising Division | 91 |
Schedule 31: Conclusion of Fair Market Value of the Intellectual Property | 92 |
Exhibit 1: Licensed Film Division Assumptions | 97 |
Exhibit 2: Time of Cash Flows from Ultimates – Licensed Film, Film Fund, Joint Venture | 98 |
Exhibit 3: Time of Cash Flows from High Budget Action Film | 99 |
Exhibit 4: Time of Cash Flows from High Budget Comedy Film | 100 |
ii
Exhibit 5: Time of Cash Flows from High Budget Thriller Film | 101 |
Exhibit 6A: Development of Equity Discount Rate | 102 |
Exhibit 6B: Development of Rate of Return on Debt | 103 |
Exhibit 6C: Development of Weighted Average Cost of Capital | 104 |
Exhibit 7: Capital Structure per Film Fund, LLC Agreement | 105 |
Exhibit 8: Joint Venture Film Division Assumptions | 106 |
Exhibit 9: Time of Cash Flows from Low Budget Action Film | 107 |
Exhibit 10: Time of Cash Flows from Low Budget Comedy Film | 108 |
Exhibit 11: Time of Cash Flows from Low Budget Thriller Film | 109 |
Exhibit 12: Time of Cash Flows from Horror Film | 110 |
Exhibit 13: Film Fund Division Assumption | 111 |
Exhibit 14: Time of Cash Flows from Film Fund | 112 |
Exhibit 15: Direct to DVD Division Assumption | 113 |
Exhibit 16: Time of Cash Flows from Ultimates – Direct to DVD | 114 |
Exhibit 17: Time of Cash Flows from Direct to DVD Films | 115 |
Exhibit 18: Traffic Analysis of Digital Publishing Division | 116 |
Exhibit 19: Revenue and Cost Assumptions of Digital Publishing Division | 117 |
Exhibit 20: Growth Assumptions of Digital Publishing Division | 118 |
Exhibit 21A: Development of Equity Discount Rate | 119 |
Exhibit 21B: Development of Rate of Return on Debt | 120 |
Exhibit 21C: Development of Weighted Average Cost of Capital | 121 |
Exhibit 22: Revenue and Cost Assumptions of Video Network Division | 122 |
Exhibit 23: Growth Assumptions of Video Network Division | 123 |
Exhibit 24: Time of Revenues from Licensed Video Games | 124 |
Appendix A-1: Comic Book Adaptation Movies | 125 |
Appendix A-2: Comic Book Adaptation Movies: Action – High Budget | 126 |
Appendix A-3: Comic Book Adaptation Movies: Comedy – High Budget | 127 |
Appendix A-4: Comic Book Adaptation Movies: Thriller – High Budget | 128 |
Appendix A-5: Comic Book Adaptation Movies: Action – Low Budget | 129 |
Appendix A-6: Comic Book Adaptation Movies: Comedy – Low Budget | 130 |
Appendix A-7: Comic Book Adaptation Movies: Thriller– Low Budget | 131 |
Appendix A-8: Comic Book Adaptation Movies: Horror | 132 |
Appendix A-9: Comic Book Adaptation Movies: Low Budget All Genres | 133 |
Appendix B: Horror Movies | 134 |
Appendix C: Film Library Deals | 136 |
Appendix D: Direct to DVD Movies | 137 |
Appendix E: User Generated Content Sites Deals | 138 |
Appendix F: General Content / E-Commerce Sites Deals | 139 |
Appendix G-1: Video Game Unit Sales | 140 |
Appendix G-2: Video Game Unit Sales: Comic and Manga Titles Released from 2004 - 2006 | 141 |
Appendix H: The Process of Business Valuation and Diligence Procedures | 142 |
APPRAISERS CERTIFICATION AND CONTINGENT AND LIMITING CONDITIONS | 144 |
iii
COMPANY PROFILE
DATE OF VALUE
Many events both within and outside a business’ control can cause significant changes in its value. These changes may occur in, but are not limited to, company management and financial performance, competitive pressures, industry and economic conditions, and investor perceptions. Therefore, the first step in a business appraisal is to determine the precise date of value. The date of value utilized herein is March 31, 2008.
BUSINESS OVERVIEW1
Platinum Studios, LLC was founded and operated as a California limited liability company on November 20, 1996. On September 15, 2006, Platinum Studios, LLC filed with the State of California to convert Platinum Studios, LLC into Platinum Studios, Inc., (“Platinum” or the “Company”) a California C corporation. As of February 1, 2008, Platinum became a publicly traded company (ticker symbol: PDOS.OB) on the Over The Counter Bulletin Board (“OTCBB”).
Platinum controls a library consisting of 5,622 characters and is engaged principally as a comics-based entertainment company adapting characters and storylines for production in film, television, publishing and all other media. With characters that have appeared in comics in 25 languages and in more than 50 countries, the Company’s library is continually expanding.
Platinum is working to become the leading independent comic book commercialization producer for the entertainment industry across all media platforms including film, television, direct-to-DVD, digital media, publishing, and video games, creating merchandising vehicles though all retail product lines. This would allow the Company to maximize the potential and value of its content creator relationships and acquisitions, story development and character/franchise brand-building capabilities without investing significant capital.
The depth, breadth, and versatility of Platinum’s library provide a rich field for the growth of lucrative entertainment franchises. Among the 84 comic book adaptation movies since 1978 to present, 22.8% of the movies produced at least 1 sequel. With the potential to create film franchises and spin-offs, this enables the Company to produce more film projects derived from the same characters.
1 Obtained from Platinum’s Form 10-K filed on March 31, 2008, and the Company’s website.
1
PRODUCTS AND SERVICES
Definition of Industry
Platinum is engaged principally as a comics-based entertainment company adapting characters and storylines for production in film, television, publishing and all other media. The Company derives revenues from a number of sources in each of the following areas: Print Publishing, Digital Publishing, Film entertainment, and Merchandise/Licensing. After researching the Company’s products, SP&H determined that there are three Standard Industrial Classification (“SIC”) Codes which the Company could be classified under. These SIC Codes include the following2:
1. | SIC Code 2721 – Periodicals, which primarily engages in publishing periodicals, or in publishing and printing periodicals; |
2. | SIC Code 7812 – Motion Picture and Video Tape Production, which primarily engages in the production of theatrical and nontheatrical motion pictures and video tapes for exhibition or sale, including educational, industrial, and religious films; and |
| 3. | SIC Code 7379 – Computer Related Services, Not elsewhere classified, which primarily engages in supplying computer related services, not elsewhere classified. |
Platinum’s current and future prospects are largely dependent on the conditions of the industries listed above. These industries are impacted by macroeconomic conditions such as GDP growth, personal and disposable income, unemployment and consumer confidence. As such, SP&H has performed an analysis of the economies in which Platinum markets and intends to market its products (see Economic Analysis section on page 28). Furthermore, we have performed an analysis of the industries listed above (see Industry Analysis section on page 17).
Products3
Platinum is a comic-based entertainment company, focused on adapting it character library to film, television, publishing (both print and digital), video games, merchandising, licensing and other media. Its library consists of 5,622 characters in various genres, including science fiction, fantasy, horror, mystery, romance, comedy, crime, action, and family.
After launching its first graphic novel in December 2006, Platinum has published over 40 comic books and graphic novels for distribution throughout the U.S.4
Platinum also owns and operateswww.DrunkDuck.com, a user-generated website and one of the industry’s leading web-comic communities.5
2 U.S. Department of Labor, Standard Industrial Classification (SIC) System Search.
3 See Business Strategy section, page 3, for a detailed description for the Company’s plan to commercialize its products. In addition, please refer to the License Rights section, page 6, for a more detailed description of the genres and a sample of well- known character names.
4 Platinum’s Form 10-K as of December 31, 2007.
5 Company’s website.
2
In December 2007, Platinum partnered with Comflix Studios, Inc. to createwww.splastk.com (“Splastk”), the first web-syndicated on-demand video network featuring free comic book inspired animated content.
Since 2006, Platinum annually organizes The Comic Book Challenge, an online talent search contest for new and aspiring comic book creators. In 2007, entrants represented nearly two dozen countries, triple the number of countries in 2006.6
LOCATIONS AND FACILITIES
Platinum’s headquarters are located at 11400 W. Olympic Boulevard, 14th Floor, Los Angeles, California, which consist of approximately 12,400 square feet. The Company entered into a five year lease term in 2006, expiring on August 31, 2011. The lease payments are as follows:
Time Period | Annual Lease Payment | |||
| September 1, 2006 – December 31,2006 | $ | 127,429 | ||
| January 1, 2007 – December 31, 2007 | $ | 387,383 | ||
| January 1, 2008 – December 31, 2008 | $ | 402,878 | ||
| January 1, 2009 – December 31, 2009 | $ | 418,993 | ||
| January 1, 2010 – December 31, 2010 | $ | 435,753 | ||
| January 1, 2011 – August 31, 2011 | $ | 298,147 | ||
Source: Platinum’s Form 10-K filed on March 31, 2008
BUSINESS STRATEGY7
Character Development
Platinum is focused on adding titles and expanding its library with the primary goal of creating new franchise properties and characters. In addition to in-house development and further acquisitions, Platinum is developing content with professionals outside the realm of comic books. The Company has teamed up with screenwriters, producers, directors, movie stars, and novelists to develop entertainment content and potential new franchise properties. Every project is designed for eventual adaptation to all media platforms, including film and television, digital publishing, print publishing, video games and merchandising licensing.
6Per Mr. Scott Rosenberg, Chairman and CEO of Platinum Studios, Inc., as quoted in “Platinum Studios Presents The Comic Book Challenge 2008”, Business Wire, March 13, 2008.
7Obtained from Platinum’s Form10-K filed on March 31, 2008.
3
Sales and Distribution
Film Entertainment
Platinum is pursuing a multi-pronged approach to create feature films: 1) licensing characters and stories to third-party producers and/or affiliated major studios for production; 2) securing outside financing to produce the Company’s own slates of films; 3) entering into joint ventures with other studios; and 4) producing direct to DVD films.
Platinum has film and television development deals with several major film producers, and in 2007 the Company successfully sold one property,Unique,to Disney Studios, with the anticipation that it will go into production in 2009. Additionally, effective as of June 2007, Platinum entered into a 2-year option agreement with DreamWorks, in association with Universal Pictures, Paramount Pictures, and Imagine Entertainment, to acquire the film production rights to its propertyCowboys & Aliens,the #1-ordered graphic novel in the U.S. in 2006,8 with the goal to produce a feature film. This film’s production is anticipated to begin pre-production sometime within the next 24 months.9
Platinum also intends to develop television programming using the following approaches: 1) continue the Company’s strategy of licensing characters and stories to third-party producers for sale to broadcast and cable television networks; and 2) secure third-party financing to produce the Company’s own specials and series.
Digital Publishing
Platinum owns the following sites which it uses to distribute digital content:
| · | www.platinumstudios.com– homepage |
| · | www.platinumstudioscomics.com– features news on Platinum’s comic books and serves as a distribution channel for comic books |
| · | www.pt78mobile.com – a mobile storefront for distribution of digital content |
| · | www.drunkduck.com– a web-comics site to host the digital distribution of the Company’s printed comics and a resource for independent comic book creators to post new material |
| · | www.kisscomicgroup.com– homepage of the Kiss comic books |
| · | www.comicbookchallenge.com– homepage of Platinum’s annual comic book creator talent search |
8 Entertainment Weekly, January, 2007.
9 Platinum’s Form 10-K as of December 31, 2007.
4
Video Network
In December 2007, Platinum partnered with Comflix Studios, Inc. to create Splastk, the first web-syndicated on-demand video network featuring free comic book inspired animated content. As of the end of 2007, Splastk’s web traffic was at 6 million uniques and over 100 million page views per month.10
Print Publishing
Platinum has established four channels to sell products:
| 1) | Direct to comic book store: For its first year of publishing, Platinum established a distribution agreement with Top Cow Productions to list the Company’s titles in Diamond Comic Distributors’ wholesale catalog for retail comic book stores. While this was the primary distribution chain for the Company’s comic books, however, Platinum recently established a direct contractual relationship with Diamond Comic Distributor for the listing of the Company’s properties, giving the Company more flexibility regarding the types and number of products that the Company could offer to this direct market; |
| 2) | Online: Platinum also distributes products to consumers and retailers via the Company’s Web store and comic book site www.PlatinumStudiosComics.com; |
| 3) | Traditional book retail stores: Platinum also distributes products through established distribution companies, such as the Company’s arrangement with Ingram, the leading wholesale distributor of book products. Ingram has agreed to distribute Platinum’s KISS 4K books to book stores and libraries, such as Borders, Barnes & Noble, Hastings and newsstands; and |
| 4) | International distributors: Platinum has established relationships with international publishing entities to distribute translated versions of the Company’s completed series of comic books to over 100 countries throughout the world. |
Licensing and Merchandising
Platinum intends to pursue opportunities via the following channels:
| 1) | General merchandising agreements with third parties in each major territory where films, television and new media will be released; |
| 2) | Collectible merchandising: cultivating the worldwide collector market by allowing licensees in other countries to license abroad; |
| 3) | Licensing the characters to customized advertising campaigns and/or media purchase campaigns; |
| 4) | Licensing the characters to video game producers and distributors; |
10 Per Mr. Scott Schneider, CEO of Comflix Studios, Inc., as quoted in “Splastk - First Web Syndicated Comic Book Fueled Video Network”, PR Newswire, December 17, 2007.
5
| 5) | Leveraging individual partners and licensees’ efforts together globally and locally to create critical mass, including promotions, contests, and third-party advertising on radio, television and new media; and |
| 6) | Leveraging its relationships with hundreds of comic book publishers and distributors worldwide for the distribution of the characters in print form. |
CUSTOMERS AND CONSUMERS
Platinum has been dependent upon a small number of licensing transactions with major studios and television/cable networks. The comic book characters generally appeals to young adult males ages 18 to 35. However, consumers for Platinum’s planned film and online products are expected to be multiple target audiences, primarily in the U.S. and Europe.
PROPERTY AND EQUIPMENT
Fixture and Equipment
The following table indicates the net book value after accumulated depreciation of the Company’s fixtures and equipment as of December 31, 2007.
Property Plant & Equipment | Value | |||
| Office Equipment | $ | 10,804 | ||
| Furniture and Fixtures | 118,140 | |||
| Computer Equipment | 151,220 | |||
| Software | 91,292 | |||
| Leasehold Improvements | 20,557 | |||
| Less: Accumulated Depreciation | (134,883 | ) | ||
Net Book Value | $ | 257,130 | ||
Source: Platinum’s Form 10-K filed on March 31, 2008
There is no independent appraisal of fixtures and equipment available to SP&H.
Licensing Rights
Platinum’s library consists of 5,622 characters in various genres, including science fiction, fantasy, horror, mystery, romance, comedy, crime, action, and family. In addition to a broad spectrum of more than 1,000 characters developed in-house, Platinum also acquired the rights to the characters and storylines of Italian-based SBE Publishing’s Horror/Sci-Fi Universe, and French-based Hexagon Comics, as well as U.S.-based Top Cow and Barry Ween. Platinum’s library comprises of the following characters:
6
Universe of Characters | Origins | # of Characters | |||||
| SBE Horror / Sci-Fi | Europe | 1,048 | |||||
| Awesome Comics/RIP Media | North America | 404 | |||||
| Top Cow Comics | North America | 573 | |||||
| Hexagon Comics | Europe | 702 | |||||
| Platinum Studios Macroverse | Worldwide | 1,200+ | |||||
| Platinum Studios Acquisitions | Worldwide | 1,680+ | |||||
Total | 5,622 | ||||||
Source: Provided by management.
The following describes the Company’s library of characters in more detail:11
SBE Horror/Sci-Fi
| · | Characters: 1,048 Dylan Dog acquired from SBE: 319 characters Legs Weaver acquired from SBE: 271 characters Nathan Never acquired from SBE: 456 characters |
On the SBE properties, the Company has acquired all right, title and interest in and to all 3 properties (Dylan Dog, Legs Weaver, and Nathan Never), excluding only comic book print publication rights. Platinum originally had 10 years in which to produce a motion picture or television program based on these properties to preclude a reversion of rights. In connection therewith, on February 29, 2008, Platinum received a notice of reversion; however, the Company has 12 months from the date of such notice to commence principal photography on a picture, whereupon reversion rights would be terminated. The Company has a reasonable belief that it will commence principal photography on a picture by February 28, 2009 thereby terminating any reversion rights.
Awesome Comics/RIP Media
| · | Characters: 404 |
Platinum has all rights worldwide, not including print comic publishing rights. Platinum has the exclusive right to enter into agreements related to the licensing of motion picture rights and allied/ancillary rights until the date upon which Platinum Studios’ CEO, Mr. Scott Mitchell Rosenberg, is no longer at least one of the following: (a) an executive officer of the Company; (b) a member of the Board of Directors of the Company, or (c) holds at least 30% of the outstanding capital stock of the Company.
11Per Platinum’s Form 10-K filed on March 31, 2008.
7
Top Cow
| · | Characters: 573 |
Platinum has all rights for film and television worldwide. Publishing is excluded and certain non-film ancillary rights subject to preexisting deals (certain properties only) are also excluded. Platinum has the exclusive right to enter into agreements related to the licensing of motion picture rights and allied/ancillary rights through January 30, 2010. The rights can be extended through January 30, 2011 with an additional payment of $350,000 on or before June 30, 2010.
Hexagon Library from Mosaic Multimedia
| · | Characters: 702 |
Platinum has all rights worldwide, not including print comic publishing rights, contingent on verification of chain-of-title and European legal documentation. Platinum has the exclusive right to enter into agreements related to the licensing of motion picture rights and allied/ancillary rights through January 1, 2014. The rights can be extended through January 1, 2016 with an additional payment of $196,000 on or before June 1, 2011. Platinum can also have the rights in perpetuity with a payment of $600,000 by January 1, 2016. The agreement requires the formation of an LLC co-owned by Mosaic Multimedia and Platinum Studios with Platinum acting as manager.
Platinum Studios Macroverse
| · | Characters: 1,200+ |
Platinum has all rights worldwide, in all media.
Platinum Studios Acquisitions
| · | Characters: 1,680+ |
Platinum has all rights worldwide, in all media.
COMPANY ORGANIZATION AND STRUCTURE
The following sections discuss Platinum’s organization, including its ownership, management, and employees.
Ownership
On January 10, 2008, the Securities and Exchange Commission declared effective the Form SB-2 registration statement originally filed by Platinum on September 4, 2007. Under the Form SB-2, Platinum provided a prospectus to offer the resale by the selling stockholders of up to 66,255,825 shares. On January 18, 2008, Platinum commenced a private placement for the sale of up to 15,000,000 shares of the Company’s common stock at a purchase price of $0.15 per share, for an aggregate purchase price of up to $2,250,000. As of February 1, 2008, Platinum became a publicly traded company (ticker symbol: PDOS.OB) on the Over The Counter Bulletin Board (“OTCBB”). For the quarter ended March 31, 2008, the stock prices per common share reached a high of $0.23 and a low of $0.09. The number of outstanding shares, as of March 31, 2008, was 216,921,227, which indicated a market capitalization of $34.7 million. Platinum successfully raised approximately $5.0 million from the initial private placement offering (“PPM”) and plans to raise additional $2.2 million in a second private placement round.
8
The following table displays the Company’s shareholders and the number of shares held on a fully diluted basis as of January 9, 2008:
Name | Ownership Percentage | No. Shares | |||||
| Common stock resale offering | 24.4 | % | Up to 49,047,250 | ||||
| Charlotte Rosenberg | 8.6 | % | 17,208,575 | ||||
Total Common Stock offered | 32.92 | % | Up to 66,255,825 | ||||
| Scott Rosenberg | 63.7 | % | 128,250,000 | ||||
| Brian Altounian | 9.2 | % | 19,940,000 | ||||
| Helene Presky | 3.7 | % | 8,000,000 | ||||
Total Executive Shareholders | 76.6 | % | 135,000,000 | ||||
Total | 100 | % | Up to 201,255,825 | ||||
Source: Platinum’s Form 10-K filed on March 31, 2008
Executive Management
As of January 9, 2008, the executive management, where indicated, was comprised of the following individuals:
| 1. | Scott Mitchell Rosenberg –Chairman& Chief Executive Officer |
Mr. Rosenberg founded Platinum Studios, LLC in 1996 and has served as the Chairman of Platinum Studios. As founder and head of Malibu Comics, Mr. Rosenberg produced the Men In Black comic book, which he took to Sony to become a billion-dollar film franchise. Malibu was bought by Marvel Comics in 1994. Mr. Rosenberg’s salary was $34,615 in 2006 and $300,000 in 2007.
| 2. | Brian Kenneth Altounian –President, Chief Operating Officer and Director |
Mr. Altounian has been Chief Operating Officer since June 2005, and was appointed to serve as President in September 2006. Mr. Altounian's background included business development, finance, operations and administration for a variety of start-ups, Fortune 100 companies, and public and private organizations. Mr. Altounian had worked extensively in the entertainment and high-tech industries. Mr. Altounian’s salary was $63,961 in 2005, $299,039 in 2006 and $300,000 in 2007.
9
| 3. | Jill Zimmerman –Director |
Ms. Zimmerman served as a director since September 16, 2006. Ms. Zimmerman was Vice President at the Alford Group, a consulting firm based in Evanston, Illinois. Ms. Zimmerman previously served as a Crisis Program Supervisor and Director of Development at Alternatives, Inc. a non-profit corporation from November 1994 through May 2005.
| 4. | Helene Pretsky –Corporate Secretary and General Counsel |
Ms. Pretsky has served as the Company’s general counsel since January 2006 and its corporate secretary and Executive Vice President since October 1 2006. Ms. Pretsky, a securities/corporate attorney with expertise in intellectual property, had focused her twenty-year legal career on representing start-up, early-stage revenue companies in the high-tech, emerging technologies and entertainment industries. Ms. Pretsky’s salary was $161,187 in 2006, and $200,000 in 2007.
Management
In addition to executive management above, the following table lists the names and titles of Platinum’s key managers:
Name | Title | Joined Platinum in | ||
| Norman Lambert | Executive Vice President, Business Development | 2006 | ||
| Sean O’Reilly | Head of Publishing and Animation | 2007 | ||
| Richard Marincic | Director of Film/Television Department | 2004 | ||
| Dan Forcey | Vice President, Content Development | 2007 | ||
| Zachary Pennington | Vice President, Creative Design | 2006 |
Source: Platinum’s Form SB-2 filed on January 10, 2008.
Employees
As of March 22, 2008, Platinum had 23 full-time and 3 part-time employees.
10
FINANCIAL ANALYSIS
SP&H analyzed Platinum’s audited financial statements for the fiscal years ending December 31, 2002 through 2007 (See Schedules 1 and 2).
Income Statements (Schedule 1)
Total Revenues
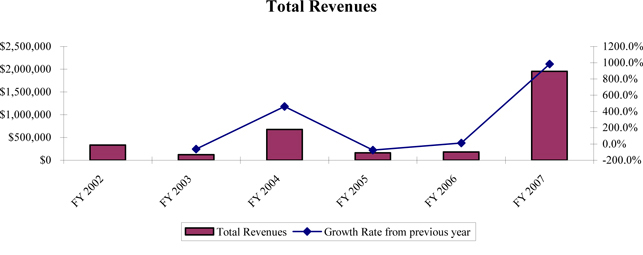
The following chart displays Platinum’sTotal Revenues from 2002 through 2007:
Source: Audited financial statements for 2002 through 2006,
10-K as of December 31, 2007.
Total Revenues increased from $334,800 in 2002 to $1,956,054 in 2007 at an annual compound rate (“ACR”) of 42.3%. As of the date of value, Platinum had been dependent upon a small number of licensing transactions with major studios and television/cable networks.Total Revenuesin 2007 was $1,956,054 compared to $180,500 in 2006. The increasedTotal Revenues was primarily attributable to an increase in option fee revenue of $860,500 and first look revenue of $450,000.
Cost of Revenues
Platinum did not incur anyCost of Revenues from 2002 though 2006. In 2007,Cost of Revenuesincreased to $278,442, representing 14.2% ofTotal Revenues.
11
Total Operating Expenses
The following graph represents Platinum’sTotal Operating Expenses from 2002 through 2007:
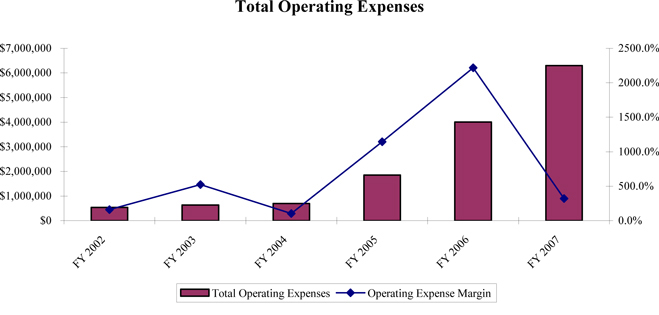
Source: Audited financial statements for 2002 through 2006,
10-K as of December 31, 2007.
Total Operating Expenses increased from $541,209 in 2002 to $6,302,399 in 2007 as the Company expanded its operations. The majority ofOperating Expenseswas due toSalaries, as the Company actively recruited executives and other talents to help exploit the Company’s library of comic book characters.
Operating Income (Loss)
Platinum hadOperating Losses from 2002 through 2007, as low as -$21,730 in 2004 and as high as -$4,624,787 in 2007. This was due to the establishment and expansion of the business.
Net Income (Loss)
Platinum hadNet Losses from 2002 through 2007, as low as -$354,472 in 2004 and as high as -$5,192,815 in 2007. This was due to the establishment and expansion of the business.
Balance Sheets (Schedule 2)
Assets
Total Current Assets increased significantly from $15,137 in 2002 to $28,027 in 2003, declined to $8,141 in 2004, and then rose to $449,138 in 2006 but decreased to $237,792 in 2007. The large decrease occurring between 2006 and 2007 was due to an approximately $326,990 decrease inCash.
12
Property Plant & Equipment accounted for $36,632 in 2002, declined to $10,408 in 2004, and then rose to $268,981 in 2006 but decreased to $257,130 in 2007.
Character Development Costsincreased from $148,573 in 2002 to $563,921 in 2004 as the Company expanded its library of characters.
Total Assets grew from $201,827 in 2002 to $583,455 in 2004, decreased to $514,720 in 2005, and then rose to $1,141,088 in 2006 but decreased to $802,301 in 2007 as a result of the factors discussed above.
Liabilities
Total Current Liabilities decreased from $1,137,271 in 2002 to $128,564 in 2004 and grew to $3,798,650 in 2007. During the period under review,Current Liabilities consisted mainly ofAccounts Payable,Accrued ExpensesandShort-term Notes Payable. Total Non-Current Liabilitiesincreased from $5,065,305 in 2002 to $9,664,312 in 2005 and decreased to $2,698,338 in 2007 as the Company repaid the uncollateralized loans received from Rosenberg IP in 2004. As a result of the factors described above,Total Liabilities varied between $5,672,224 and $9,664,312 during the period under review.
Shareholders’ Equity
Total Shareholders’ Equity was composed ofCommon Stock,Additional Paid-in Capital, andRetained Deficit. As Platinum was a start-up company and generatedNet Lossesfrom 2002 through 2007,Total Shareholders’ Equity was negative during the period under review.
The Company’s December 31, 2007 Form 10-K states that Platinum plans to seek additional financing in order to execute its business plan, but there is no assurance the Company will be able to obtain such financing on terms favorable to the Company or at all. These items raise substantial doubt about the Company’s ability to continue as a going concern, which is mentioned in the independent auditors’ cover letter to the audited financial statements for fiscal year 2007.
Since Platinum had minimumRevenues and significantNet Losses during the period under review, and the Company’s business plan is to generate significant film entertainment and online revenues in the next several years through active exploitation of its comic book character library, we have given limited consideration to Platinum’s historical financial performance as a basis for our valuation.However, our valuation takes into account the risks of the Company not obtaining adequate financing and its ability to continue as a going concern.
13
SUMMARY
Platinum’sTotal Revenues increased at an ACR of 42.3% from 2002 through 2007. Platinum did not incur anyCost of Revenues from 2002 though 2006. In 2007,Cost of Revenuesrepresented 14.2% ofTotal Revenues. Total Operating Expenses increased during the same period as the Company actively recruited executives and other talent. Platinum hadOperating Losses andNet Losses from 2002 through 2007, due to the establishment and expansion of the business.
Total Assets grew at an ACR of 31.8% from 2002 through 2007.Total Liabilities varied between $5,672,224 and $9,664,312 during the same period.Total Shareholders’ Equity was negative due toNet Losses from 2002 through 2007.
The Company’s December 31, 2007 Form 10-K stated that Platinum plans to seek additional financing in order to execute its business plan, but that there is no assurance the Company will be able to obtain such financing on terms favorable to the Company or at all.
We have given limited consideration to Platinum’s historical financial performance as a basis for our valuation since the Company’s business plan is to generate significant film entertainment and online revenues in the next several years through active exploitation of its comic book character library.
14
Schedule 1
Platinum Studios, Inc.
Income Statements
For the Years Ending December 31,
2002 | 2003 | 2004 | 2005 | 2006 | 2007 | ||||||||||||||||||||||||||
(1) | (2) | (3) | (4) | (5) | (6) | ||||||||||||||||||||||||||
| Total Revenues | $ | 334,800 | 100.0 | % | $ | 120,667 | 100.0 | % | $ | 677,406 | 100.0 | % | $ | 162,500 | 100.0 | % | $ | 180,500 | 100.0 | % | $ | 1,956,054 | 100.0 | % | |||||||
| Cost of Revenues | |||||||||||||||||||||||||||||||
| Fees | - | - | - | - | - | $ | 171,229 | 8.8 | % | ||||||||||||||||||||||
| Merchandising | - | - | - | - | - | 10,217 | 0.5 | % | |||||||||||||||||||||||
| Other | - | - | - | - | - | 96,996 | 5.0 | % | |||||||||||||||||||||||
| Total Cost of Revenues | $ | 0 | 0.0 | % | $ | 0 | 0.0 | % | $ | 0 | 0.0 | % | $ | 0 | 0.0 | % | $ | 0 | 0.0 | % | $ | 278,442 | 14.2 | % | |||||||
Gross Profit | $ | 334,800 | 100.0 | % | $ | 120,667 | 100.0 | % | $ | 677,406 | 100.0 | % | $ | 162,500 | 100.0 | % | $ | 180,500 | 100.0 | % | $ | 1,677,612 | 85.8 | % | |||||||
| Operating Expenses | |||||||||||||||||||||||||||||||
| Operating Expenses (excluding Depreciation) | - | - | - | $ | 1,607,672 | 989.3 | % | $ | 3,168,078 | 1755.2 | % | $ | 5,176,142 | 264.6 | % | ||||||||||||||||
| Research and Development | - | - | - | 243,833 | 150.1 | % | 764,282 | 423.4 | % | 960,396 | 49.1 | % | |||||||||||||||||||
| Depreciation and Amortization | - | - | - | 7,436 | 4.6 | % | 73,486 | 40.7 | % | 165,861 | 8.5 | % | |||||||||||||||||||
| Total Operating Expenses | $ | 541,209 | 161.7 | % | $ | 633,568 | 525.1 | % | $ | 699,136 | 103.2 | % | $ | 1,858,941 | 1144.0 | % | $ | 4,005,846 | 2219.3 | % | $ | 6,302,399 | 322.2 | % | |||||||
Operating Income (Loss) | $ | (206,409 | ) | -61.7 | % | $ | (512,901 | ) | -425.1 | % | $ | (21,730 | ) | -3.2 | % | $ | (1,696,441 | ) | -1044.0 | % | $ | (3,825,346 | ) | -2119.3 | % | $ | (4,624,787 | ) | -236.4 | % | |
| Other Expenses | |||||||||||||||||||||||||||||||
| Loss on Disposition of Assets | $ | (13,849 | ) | -4.1 | % | $ | (10,098 | ) | -8.4 | % | $ | (4,829 | ) | -0.7 | % | $ | 0 | 0.0 | % | $ | (33,260 | ) | -18.4 | % | $ | (24,000 | ) | -1.2 | % | ||
| Interest Expense | (396,009 | ) | -118.3 | % | (299,771 | ) | -248.4 | % | (327,913 | ) | -48.4 | % | (390,288 | ) | -240.2 | % | (391,745 | ) | -217.0 | % | (544,028 | ) | -27.8 | % | |||||||
| Other Income | 0 | 0.0 | % | 0 | 0.0 | % | 0 | 0.0 | % | 5,814 | 3.6 | % | 2,571 | 1.4 | % | 0 | 0.0 | % | |||||||||||||
| Other Expenses | 0 | 0.0 | % | 0 | 0.0 | % | 0 | 0.0 | % | 0 | 0.0 | % | (25,000 | ) | -13.9 | % | 0 | 0.0 | % | ||||||||||||
| Total Other Expenses | $ | (409,858 | ) | -122.4 | % | $ | (309,869 | ) | -256.8 | % | $ | (332,742 | ) | -49.1 | % | $ | (384,474 | ) | -236.6 | % | $ | (447,434 | ) | -247.9 | % | $ | (568,028 | ) | -29.0 | % | |
Net Income (Loss) | $ | (616,267 | ) | -184.1 | % | $ | (822,770 | ) | -681.9 | % | $ | (354,472 | ) | -52.3 | % | $ | (2,080,915 | ) | -1280.6 | % | $ | (4,272,780 | ) | -2367.2 | % | $ | (5,192,815 | ) | -265.5 | % | |
Sources:Platinum Studios, Inc. Audited Financial Statements for the periods ending December 31, 2002 through 2007.
SANLI PASTORE & HILL, INC.
15
Schedule 2
Platinum Studios, Inc.
Balance Sheets
As of December 31,
2002 | 2003 | 2004 | 2005 | 2006 | 2007 | ||||||||||||||||||||||||||
(1) | (2) | (3) | (4) | (5) | (6) | ||||||||||||||||||||||||||
Assets | |||||||||||||||||||||||||||||||
Current Assets | |||||||||||||||||||||||||||||||
| Cash | $ | 8,380 | 4.2 | % | $ | 20,642 | 9.5 | % | $ | 0 | 0.0 | % | $ | 11,843 | 2.3 | % | $ | 331,435 | 29.0 | % | $ | 4,445 | 0.6 | % | |||||||
| Accounts receivable | 0 | 0.0 | % | 0 | 0.0 | % | 0 | 0.0 | % | 0 | 0.0 | % | 0 | 0.0 | % | 44,695 | 5.6 | % | |||||||||||||
| Other receivable | 0 | 0.0 | % | 0 | 0.0 | % | 0 | 0.0 | % | 0 | 0.0 | % | 0 | 0.0 | % | 20,000 | 2.5 | % | |||||||||||||
| Prepaid expenses | 6,757 | 3.3 | % | 7,385 | 3.4 | % | 8,141 | 1.4 | % | 89,347 | 17.4 | % | 105,603 | 9.3 | % | 109,124 | 13.6 | % | |||||||||||||
| Deposits | 0 | 0.0 | % | 0 | 0.0 | % | 0 | 0.0 | % | 1,561 | 0.3 | % | 0 | 0.0 | % | 0 | 0.0 | % | |||||||||||||
| Retainers | 0 | 0.0 | % | 0 | 0.0 | % | 0 | 0.0 | % | 0 | 0.0 | % | 0 | 0.0 | % | 0 | 0.0 | % | |||||||||||||
| Inventory | 0 | 0.0 | % | 0 | 0.0 | % | 0 | 0.0 | % | 0 | 0.0 | % | 0 | 0.0 | % | 59,528 | 7.4 | % | |||||||||||||
| Stock offering costs | 0 | 0.0 | % | 0 | 0.0 | % | 0 | 0.0 | % | 0 | 0.0 | % | 12,100 | 1.1 | % | 0 | 0.0 | % | |||||||||||||
| Total Current Assets | $ | 15,137 | 7.5 | % | $ | 28,027 | 12.9 | % | $ | 8,141 | 1.4 | % | $ | 102,751 | 20.0 | % | $ | 449,138 | 39.4 | % | $ | 237,792 | 29.6 | % | |||||||
Property and Equipment | |||||||||||||||||||||||||||||||
| Office equipment | $ | 65,218 | 32.3 | % | $ | 65,218 | 29.9 | % | $ | 65,218 | 11.2 | % | $ | 69,633 | 13.5 | % | $ | 10,804 | 0.9 | % | $ | 10,804 | 1.3 | % | |||||||
| Furniture and fixtures | 22,347 | 11.1 | % | 22,347 | 10.2 | % | 22,347 | 3.8 | % | 24,108 | 4.7 | % | 107,317 | 9.4 | % | 118,140 | 14.7 | % | |||||||||||||
| Computer equipment | 53,855 | 26.7 | % | 22,350 | 10.2 | % | 12,226 | 2.1 | % | 37,974 | 7.4 | % | 105,054 | 9.2 | % | 151,220 | 18.8 | % | |||||||||||||
| Software | 0 | 0.0 | % | 0 | 0.0 | % | 0 | 0.0 | % | 3,345 | 0.6 | % | 85,576 | 7.5 | % | 91,292 | 11.4 | % | |||||||||||||
| Leasehold improvements | 0 | 0.0 | % | 0 | 0.0 | % | 0 | 0.0 | % | 23,728 | 4.6 | % | 20,557 | 1.8 | % | 20,557 | 2.6 | % | |||||||||||||
| Total Property and Equipment | 141,420 | 70.1 | % | 109,915 | 50.4 | % | 99,791 | 17.1 | % | 158,788 | 30.8 | % | 329,308 | 28.9 | % | 392,013 | 48.9 | % | |||||||||||||
Less:Accumulated depreciation | (104,788 | ) | -51.9 | % | (88,318 | ) | -40.5 | % | (89,383 | ) | -15.3 | % | (96,819 | ) | -18.8 | % | (60,327 | ) | -5.3 | % | (134,883 | ) | -16.8 | % | |||||||
| Net Property and Equipment | $ | 36,632 | 18.2 | % | $ | 21,597 | 9.9 | % | $ | 10,408 | 1.8 | % | $ | 61,969 | 12.0 | % | $ | 268,981 | 23.6 | % | $ | 257,130 | 32.0 | % | |||||||
Character Development Costs | |||||||||||||||||||||||||||||||
| Projects in process | $ | 104,521 | 51.8 | % | $ | 160,126 | 73.4 | % | $ | 552,724 | 94.7 | % | $ | 0 | 0.0 | % | $ | 0 | 0.0 | % | $ | 0 | 0.0 | % | |||||||
| Completed Projects | 44,052 | 21.8 | % | 7,329 | 3.4 | % | 11,197 | 1.9 | % | 0 | 0.0 | % | 0 | 0.0 | % | 0 | 0.0 | % | |||||||||||||
| Net Character Development Costs | $ | 148,573 | 73.6 | % | $ | 167,455 | 76.8 | % | $ | 563,921 | 96.7 | % | $ | 0 | 0.0 | % | $ | 0 | 0.0 | % | $ | 0 | 0.0 | % | |||||||
Other Assets | |||||||||||||||||||||||||||||||
| Web Sties | $ | 0 | 0.0 | % | $ | 0 | 0.0 | % | $ | 0 | 0.0 | % | $ | 0 | 0.0 | % | $ | 64,000 | 5.6 | % | $ | 40,000 | 5.0 | % | |||||||
| Long Term Deposits | 0 | 0.0 | % | 0 | 0.0 | % | 0 | 0.0 | % | 0 | 0.0 | % | 39,404 | 3.5 | % | 39,118 | 4.9 | % | |||||||||||||
| Intangible Assets | |||||||||||||||||||||||||||||||
| Character Library - Top Cow | 0 | 0.0 | % | 0 | 0.0 | % | 0 | 0.0 | % | 350,000 | 68.0 | % | 350,000 | 30.7 | % | 350,000 | 43.6 | % | |||||||||||||
| Character Library Amortization - Top Cow | 0 | 0.0 | % | 0 | 0.0 | % | 0 | 0.0 | % | 0 | 0.0 | % | (30,435 | ) | -2.7 | % | (121,739 | ) | -15.2 | % | |||||||||||
| Net Intangible Assets | 0 | 0.0 | % | 0 | 0.0 | % | 0 | 0.0 | % | 350,000 | 68.0 | % | 319,565 | 28.0 | % | 228,261 | 28.5 | % | |||||||||||||
| Other | 1,485 | 0.7 | % | 985 | 0.5 | % | 985 | 0.2 | % | 0 | 0.0 | % | 0 | 0.0 | % | 0 | 0.0 | % | |||||||||||||
| Total Other Assets | $ | 1,485 | 0.7 | % | $ | 985 | 0.5 | % | $ | 985 | 0.2 | % | $ | 350,000 | 68.0 | % | $ | 422,969 | 37.1 | % | $ | 307,379 | 38.3 | % | |||||||
Total Assets | $ | 201,827 | 100.0 | % | $ | 218,064 | 100.0 | % | $ | 583,455 | 100.0 | % | $ | 514,720 | 100.0 | % | $ | 1,141,088 | 100.0 | % | $ | 802,301 | 100.0 | % | |||||||
Liabilities and Stockholders' Equity | |||||||||||||||||||||||||||||||
Liabilities | |||||||||||||||||||||||||||||||
Current Liabilities | |||||||||||||||||||||||||||||||
| Bank overdraft | $ | 0 | 0.0 | % | $ | 0 | 0.0 | % | $ | 5,852 | 1.0 | % | $ | 0 | 0.0 | % | $ | 0 | 0.0 | % | $ | 89,665 | 11.2 | % | |||||||
| Line of credit | 1,000,000 | 495.5 | % | 0 | 0.0 | % | 0 | 0.0 | % | 0 | 0.0 | % | 0 | 0.0 | % | 0 | 0.0 | % | |||||||||||||
| Accounts payable | 134,145 | 66.5 | % | 105,653 | 48.5 | % | 109,802 | 18.8 | % | 131,131 | 25.5 | % | 231,849 | 20.3 | % | 663,848 | 82.7 | % | |||||||||||||
| Accrued expenses | 3,126 | 1.5 | % | 0 | 0.0 | % | 12,910 | 2.2 | % | 64,352 | 12.5 | % | 192,118 | 16.8 | % | 788,868 | 98.3 | % | |||||||||||||
| Loans payable to member | 0 | 0.0 | % | 253,308 | 116.2 | % | 0 | 0.0 | % | 0 | 0.0 | % | 0 | 0.0 | % | 0 | 0.0 | % | |||||||||||||
| Deferred revenue | 0 | 0.0 | % | 0 | 0.0 | % | 0 | 0.0 | % | 175,000 | 34.0 | % | 750,000 | 65.7 | % | 100,000 | 12.5 | % | |||||||||||||
| Short-term notes payable to shareholder | 0 | 0.0 | % | 0 | 0.0 | % | 0 | 0.0 | % | 0 | 0.0 | % | 1,004,078 | 88.0 | % | 1,889,908 | 235.6 | % | |||||||||||||
| Related party payable | 0 | 0.0 | % | 0 | 0.0 | % | 0 | 0.0 | % | 20,000 | 3.9 | % | 243,079 | 21.3 | % | 193,079 | 24.1 | % | |||||||||||||
| Capital leases payable, current | 0 | 0.0 | % | 0 | 0.0 | % | 0 | 0.0 | % | 6,441 | 1.3 | % | 55,820 | 4.9 | % | 73,282 | 9.1 | % | |||||||||||||
| Total Current Liabilities | $ | 1,137,271 | 563.5 | % | $ | 358,961 | 164.6 | % | $ | 128,564 | 22.0 | % | $ | 396,924 | 77.1 | % | $ | 2,476,944 | 217.1 | % | $ | 3,798,650 | 473.5 | % | |||||||
Long Term Liabilities | |||||||||||||||||||||||||||||||
| Accrued interest due to member | $ | 0 | 0.0 | % | $ | 0 | 0.0 | % | $ | 0 | 0.0 | % | $ | 1,067,465 | 207.4 | % | $ | 75,031 | 6.6 | % | $ | 60,479 | 7.5 | % | |||||||
| Deferred Revenue | 486,667 | 241.1 | % | 502,367 | 230.4 | % | 625,000 | 107.1 | % | 750,000 | 145.7 | % | 0 | 0.0 | % | 0 | 0.0 | % | |||||||||||||
| Due to Related Party | 0 | 0.0 | % | 0 | 0.0 | % | 20,000 | 3.4 | % | 0 | 0.0 | % | 0 | 0.0 | % | 0 | 0.0 | % | |||||||||||||
| Long-term portion of capital lease obligations | 0 | 0.0 | % | 0 | 0.0 | % | 0 | 0.0 | % | 13,591 | 2.6 | % | 148,721 | 13.0 | % | 106,395 | 13.3 | % | |||||||||||||
| Long-term debt payable to member | 4,578,638 | 2268.6 | % | 6,180,235 | 2834.1 | % | 6,987,872 | 1197.7 | % | 7,436,332 | 1444.7 | % | 3,326,107 | 291.5 | % | 2,531,464 | 315.5 | % | |||||||||||||
| Total Long Term Liabilities | $ | 5,065,305 | 2509.7 | % | $ | 6,682,602 | 3064.5 | % | $ | 7,632,872 | 1308.2 | % | $ | 9,267,388 | 1800.5 | % | $ | 3,549,859 | 311.1 | % | $ | 2,698,338 | 336.3 | % | |||||||
Total Liabilities | $ | 6,202,576 | 3073.2 | % | $ | 7,041,563 | 3229.1 | % | $ | 7,761,436 | 1330.3 | % | $ | 9,664,312 | 1877.6 | % | $ | 6,026,803 | 528.2 | % | $ | 6,496,988 | 809.8 | % | |||||||
Stockholders' Equity (Deficit) | |||||||||||||||||||||||||||||||
Common stock, $.0001 par value, 500,000,000 shares authorized, 158,056,000 issued, and outsatnding at December 31, 2006 | $ | 0 | 0.0 | % | $ | 0 | 0.0 | % | $ | 0 | 0.0 | % | $ | 0 | 0.0 | % | $ | 15,806 | 1.4 | % | $ | 20,126 | 2.5 | % | |||||||
| Additional paid in-capital | 0 | 0.0 | % | 0 | 0.0 | % | 0 | 0.0 | % | 0 | 0.0 | % | (628,741 | ) | -55.1 | % | 3,750,782 | 467.5 | % | ||||||||||||
| Members equity/ (deficit) | (6,000,749 | ) | -2973.2 | % | (6,823,509 | ) | -3129.1 | % | (7,177,981 | ) | -1230.3 | % | (9,149,592 | ) | -1777.6 | % | 0 | 0.0 | % | 0 | 0.0 | % | |||||||||
| Retained earnings/ (deficit) | 0 | 0.0 | % | 0 | 0.0 | % | 0 | 0.0 | % | 0 | 0.0 | % | (4,272,780 | ) | -374.4 | % | (9,465,595 | ) | -1179.8 | % | |||||||||||
Total stockholders' equity/ (deficit) | $ | (6,000,749 | ) | -2973.2 | % | $ | (6,823,509 | ) | -3129.1 | % | $ | (7,177,981 | ) | -1230.3 | % | $ | (9,149,592 | ) | -1777.6 | % | $ | (4,885,715 | ) | -428.2 | % | $ | (5,694,687 | ) | -709.8 | % | |
Total Liabilities and Stockholders' Equity | $ | 201,827 | 100.0 | % | $ | 218,054 | 100.0 | % | $ | 583,455 | 100.0 | % | $ | 514,720 | 100.0 | % | $ | 1,141,088 | 100.0 | % | $ | 802,301 | 100.0 | % | |||||||
Sources: Platinum Studios, Inc. Audited Financial Statements for the periods ending December 31, 2002 through 2007.
SANLI PASTORE & HILL, INC.
16
INTRODUCTION
Many factors can contribute to the outlook for an industry. In addition to the intensity of competition, the health of an industry may be shaped by demand from its customer base. Looming technological developments, the constant threat of substitute products or services, and broad economic factors may also play a role in any industry’s future.
To evaluate Platinum Studios, it is necessary to analyze the industry conditions under which it operates. Platinum operates as a comic-based entertainment company, whose core business is bringing comic book projects to feature film and television. The Company derives its revenues from the following sources: (1) film entertainment; (2) merchandising and licensing; (3) digital publishing; (4) print publishing; and (5) video games.Therefore, in the following sections, SP&H analyzed the U.S. (1) film entertainment market; (2) merchandising and licensing market (U.S. and international); (3) digital publishing industry; (4) comic book publishing industry; and (5) video games industry.
U.S. FILM ENTERTAINMENT MARKET
Industry Growth
The U.S. film entertainment industry is largely located in California, which includes Hollywood, and accounts for about 70.0% of total domestic film production.12 In general, the films made in Hollywood dominate the domestic and international film market. The following graph shows U.S. box office revenues from 2001 to 2007:
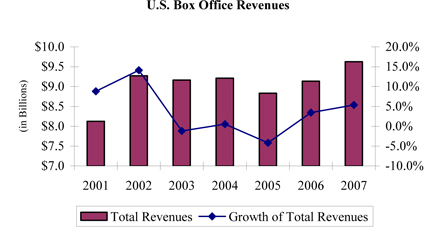
Source: Theatrical Market Statistics 2007, Motion Picture Association of America.
17
U.S. box office revenues increased from $8.1 billion in 2001 to $9.6 billion in 2007, at an ACR of 2.9%. U.S. box office revenues grew significantly in 2001 and 2002, at growth rates of 8.8% and 14.1%, respectively. In 2003, U.S. box office revenues decreased slightly by 1.2%, and increased slightly by 0.5% in 2004. U.S. box office revenues declined 4.2% in 2005, after which revenues rose 3.5% to reach $9.1 billion in 2006. In 2007, U.S. box office revenues were at a new all-time record of $9.6 billion.
Number of Films Released
The following graph illustrates the historical growth of the number of U.S. films released from 2001 to 2007:
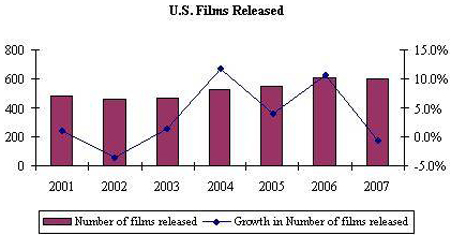
Source: Theatrical Market Statistics 2007, Motion Picture Association of America.
The number of films released increased from 483 in 2001 to 603 in 2007, at an ACR of 3.8%. Growth rates ranged from a low of -3.5% in 2002 to a high of 11.6% in 2004.
Comic Book Adaptation Movies
The following graph shows U.S. box office revenues of comic book adaptation movies from 2002 to 2007:
18
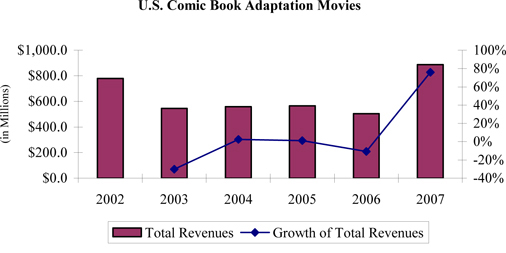
Source: Box Office Mojo, www.boxofficemojo.com.
U.S. box office revenues of comic book adaptation movies increased from $780.9 million in 2002 to $888.6 million in 2007, at an ACR of 2.6%. Annual revenues during the same period ranged from $505.0 million in 2006 to $888.6 million in 2007, while annual growth rates were lowest in 2003 at -30% and highest in 2007 at 76%. The year 2002 included the release ofSpider Man andMen in Black II. As movie making technology becomes more easily accessible, the production of comic book movies has become more popular. This has also helped the success of independent movies such as30 Days of Night.
In regards to the comic book market, the Company’s Form 10-K states the following:
The comic book market is highly sought after by the entertainment industry for the purpose of mining for new material. As proof of this appeal, two recent trade articles have pinpointed the virtues of comics publishing as a credible source of new material in Hollywood. Daily Variety and Hollywood Reporter have each reported separately that the big moneymakers are fresh concepts and comic books.“Among the better averages were pics based on comic books: There were only 13 such films, and the $2.8 billion total means that each comic book hit averaged a $215 million gross. Which explains why Hollywood is so hot to film comic books."13
Industry Concentration
According to Box Office Mojo, an online movie publication and box office tracker, the movie releases of six film distribution companies typically accounts for approximately 80% of box office revenues in the U.S.14. The following table provides market share data for major distributors in 2007:
14Box Office Mojo,http://www.boxofficemojo.com
19
Distributor | Market Share | |||
| Paramount | 15.5 | % | ||
| Warner Bros. | 14.7 | % | ||
| Buena Vista | 14.0 | % | ||
| Sony/Columbia | 12.9 | % | ||
| Universal | 11.4 | % | ||
| 20th Century Fox | 10.5 | % | ||
| New Line | 5.0 | % | ||
| Lionsgate | 3.8 | % | ||
| MGM/UA | 3.8 | % | ||
| Fox Searchlight | 1.4 | % | ||
| Miramax | 1.3 | % | ||
| Rogue Pictures | 0.8 | % | ||
Total major distributors | 95.1 | % | ||
Others | 4.9 | % | ||
Total | 100.0 | % | ||
Source: Box Office Mojo.
The industry is forecasted to grow at an average annual rate of 3.7% over the next five years, 2008 through 2012.15
U.S. AND INTERNATIONAL LICENSING MARKET
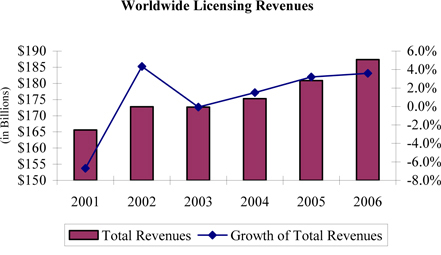
Industry Growth
According to License! Global Magazine, the U.S. remained the largest market, accounting for 65% of the total worldwide retail sales of licensed merchandise in 2006.16 The following graph shows worldwide retail sales of licensed products from 2001 to 2006:
Source: 2007 Industry Annual Report, License! Global Magazine.
16 2007 Industry Annual Report, License! Global Magazine.
20
Worldwide retail sales of licensed products increased from $165.6 billion in 2001 to $187.4 billion in 2006, at an ACR of 2.5%. After a dip in 2001, worldwide retail sales of licensed products increased by 4.3% in 2002, and then decreased slightly by 0.5% in 2003. From 2004 to 2006, revenues continued to grow, with growth rates of 1.5%, 3.2%, and 3.6%, respectively.
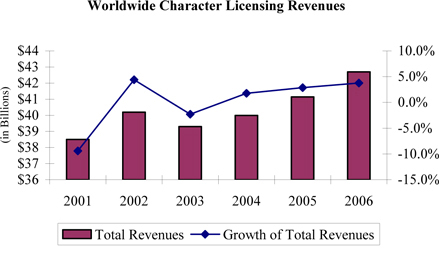
Character Licensing Growth
Character licensing is the largest category in the total worldwide retail sales of licensed products. The following graph shows worldwide retail sales of licensed products from 2001 to 2006:
Source: 2007 Industry Annual Report, License! Global Magazine.
Worldwide character licensing revenues increased from $38.5 billion in 2001 to $42.7 billion in 2006, at an ACR of 2.1%. Overall, character licensing revenues mirrored the trend of the total worldwide licensing revenues. After a dip in 2001, character licensing revenues increased by 4.4% in 2002, and then decreased by 2.3% in 2003. From 2004 to 2006, revenues continued to grow, with growth rates of 1.8%, 2.9%, and 3.8%, respectively.
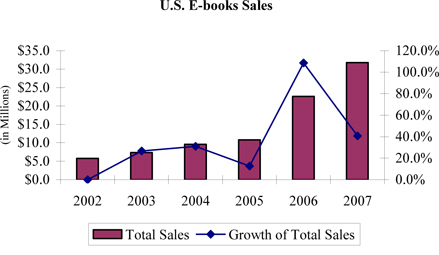
U.S. DIGITAL PUBLISHING INDUSTRY
With the advent of significant technological improvements, the digital publishing industry has grown substantially since late 1990. The increasing popularity and availability of electronic books are being driven largely by the proliferation of portable devices and software that made it possible for one to conveniently download and read content via the Internet. According to the International Digital Publishing Forum, eBooks represents the fastest growing segment of the publishing industry.17 The following graph shows U.S. trade wholesale eBooks sales from 2002 to 2007:
21
Source: International Digital Publishing Forum.
U.S. wholesale eBooks sales increased from $5.8 million in 2002 to $31.8 million in 2007, at an ACR of 40.6%. U.S. wholesale eBooks sales experienced significant growth in 2003 and 2004, with growth rates of 26.7% and 31.0%, respectively. After moderate growth in 2005, U.S. wholesale eBooks sales rose 108.7% to reach $22.6 million in 2006. In 2007, U.S. wholesale eBooks sales reached $31.8 million, with a growth rate of 40.7%.
According to Standard & Poor’s, internet advertising is the fastest growing of all direct marketing channels, driven largely by advertisers’ desire to tap into the rapidly growing online retail market. The following graph shows U.S. internet advertising revenues from 2000 to 2007:
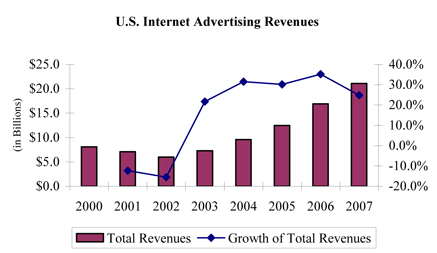
Source: Internet Advertising Revenue Report, Internet Advertising Bureau and PricewaterhouseCoopers.
U.S. internet advertising revenues increased from $8.1 billion in 2000 to $21.1 billion in 2007, at an ACR of 14.7%. Growth rates in 2001 and 2002 were negative due to poor economic conditions and the dotcom crash.From 2003 through 2007, U.S. internet advertising revenues experienced substantial growth, during which period growth rates varied from 21.7% to 35.2%.
22
U.S. COMIC BOOK PUBLISHING INDUSTRY
Industry Growth
According to Comics Buyer's Guide, one of the longest-running periodical reporting on thecomic book industry, the U.S. comics industry saw its seventh consecutive year of increased sales in 2007. The following graph shows the estimated overall U.S. comic book sales from 2001 to 2007:
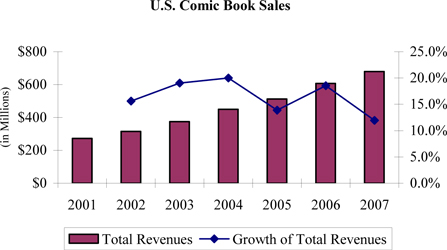
Source: Comics Buyer’s Guide.
U.S. comic book sales increased from $273 million in 2001 to $680 million in 2007, at an ACR of 16.5%. From 2001 through 2007, U.S. comic book sales experienced substantial growth, during which period growth rates varied from 11.9% to 20.0%.
Comic Book Market Shares
According to Diamond Comic Distributors, the largest comic book distributor that dominates the direct market in the U.S., the comic books published by Marvel and DC Comics account for approximately 70% of its comic book sales to retailers. The following table provides market share data for major comic book publishers as of December 2007:
Distributor | Market Share | |||
| Marvel | 38.7 | % | ||
| DC Comics | 32.7 | % | ||
| Dark Horse | 5.36 | % | ||
| Image | 3.69 | % | ||
| IDW | 2.38 | % | ||
| Viz | 1.84 | % | ||
| Tokyopop | 1.82 | % | ||
| Dynamic Forces | 1.44 | % | ||
| Wizard | 1.37 | % | ||
| Eaglemoss | 1.02 | % | ||
Total major distributors | 90.32 | % | ||
Others | 9.68 | % | ||
Total | 100.0 | % | ||
Source: Comics Buyer’s Guide.
23
U.S. VIDEO GAME INDUSTRY
Industry Growth
The following graph shows North America video game revenues from 2001 to 2007:
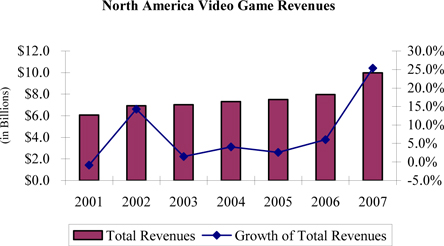
Source: NPD Group – Software revenues.
North America video game sales increased from $6.1 billion in 2001 to $10.0 billion in 2007, at an ACR of 8.7%. The growth rate in 2001 was negative because of poor economic conditions. Video game sales grew 14.3% in 2002. From 2003 through 2006, growth rates of video game sales were moderate and revenues increased from $7.0 billion in 2003 to $8.0 billion in 2006. In 2007, video games sales in North America increased significantly to $10.0 billion, at a growth rate of 25.4%, largely due to the release of video games for new console platforms.
SUMMARY
U.S. box office revenues increased at an ACR of 2.9% from 2001 through 2007. U.S. box office revenues of comic book adaptation movies increased at an ACR of 2.6% from 2002 through 2007. The industry is forecasted to grow at an average annual rate of 3.7% over the next five years, from 2008 to 2012.
Worldwide retail sales of licensed products increased at an ACR of 2.5% from 2001 through 2006. Character licensing is the largest category in the total worldwide retail sales of licensed products, and the revenues increased at an ACR of 2.1% during the same period.
24
U.S. wholesale eBooks sales increased at an ACR of 40.6% from 2002 through 2007. U.S. internet advertising revenues increased at an ACR of 14.7% from 2000 through 2007.
U.S. comic book sales increased at an ACR of 16.5% from 2001 through 2007. According to Diamond Comic Distributors, the comic books published by Marvel and DC Comics account for approximately 70% of its comic book sales to retailers.
North America video game revenues increased at an ACR of 8.7% from 2001 to 2007.
25
COMPETITION ANALYSIS
Platinum is a comic-based entertainment company, focused on adapting its character library to film, television, publishing (both print and digital), merchandising, licensing and all other media. Its library consists of 5,622 characters in various genres, including science fiction, fantasy, horror, mystery, romance, comedy, crime, action, and family.Our research and management interviews revealed that the Company had the following main competitors in the entertainment industry18:
Company | Divisions | Founded | Assets | Revenue | Content Library | |||||||||||
| (Billions) | (Billions) | |||||||||||||||
| Marvel Entertainment, Inc. | Licensing(consumer products, studio media licensing, destination-based entertainment, promotions, publications);Publishing(comic books based on the Marvel Universe);Toys; Film Production | 1933 | $ | 0.82 | $ | 0.49 | Over 5,000 characters | |||||||||
DC Comics (Warner Bros. Entertainment, Inc.) | Licensing; Publishing(comic books and graphic novels: Vertigo - mature reader line & WildStorm - cutting edge action line) | 1935 | n/a | n/a | n/a | |||||||||||
| Walt Disney Company | Median Network(broadcast television network, television production and distribution operations, Internet and mobile);ABC Television Network(multiple TV and radio stations);Parks and Resorts(theme parks, hotels, retail, and dining);Studio Entertainment;(production and acquisition of motion pictures, direct-to-DVD, musical recordings, and live stage plays);Consumer Products(licenses Disney characters) | 1923 | $ | 62.77 | $ | 36.38 | n/a | |||||||||
| DreamWorks Animation SKG, Inc. | Animation(computer generated animated feature films for theatrical, home entertainment, and TV releases) | 1985 | $ | 1.33 | $ | 0.77 | n/a | |||||||||
18Source: Yahoo! Finance, companies’ 10-Ks and 10-Qs. Assets data is obtained from most recent quarter available, and revenue data is for the trailing twelve months.
26
Company | Divisions | Founded | Assets | Revenue | Content Library | |||||||||||
| (Billions) | (Billions) | |||||||||||||||
| Lions Gate Entertainment Corp. | Production and Distribution of Film Entertainment(theatrical, TV, home entertainment, family entertainment, video-on-demand, and music content) | 1986 | $ | 1.38 | $ | 1.16 | 8,100 motion pictures 3,800 TV episodes | |||||||||
| Time Warner, Inc. | AOL(online advertising services, Internet access subscription services);Cable(video, high-speed data services, and Internet access);Film entertainment (production and distribution of theatrical motion pictures, TV shows, animation and other programming, licensees rights);Networks(domestic and international networks and pay TV programming services);Publishing(magazines and websites) | 1985 | $ | 1,338 | $ | 46.48 | n/a | |||||||||
Platinum’s main competitors have established superior longevity of operations, depth in management and financial performance and resources. However, the size of Platinum’s character library is comparable to Marvel and DC Comic’s and more diverse with respect with types of genre, and offers story lines of more recently developed characters beyond superhero status. Overall, Platinum operates in a niche but competitive environment. The Company’s competitive strategy is to promote and commercialize its more diverse and newer characters to its multiple target audiences.
27
ECONOMIC ANALYSIS
INTRODUCTION
An analysis of the economic environment is used in developing reasonable expectations about a business’ future prospects. The economy’s condition may have a significant impact on investment prospects and, therefore, the related valuation of a business. Platinum was a comic-based entertainment company, focused on adapting it character library to film, television, publishing (both print and digital), merchandising, licensing and other media, mainly throughout the U.S. and Europe. Therefore, we analyze the U.S. and European economies in the sections that follow.
THE U.S. ECONOMY
Growth
In the second half of 2007, the U.S. economy began to show signs of a slowdown due to the global credit crunch and mounting sub-prime mortgage concerns. To avert further economic decline and stem a potential liquidity crisis, the Federal Reserve has reduced the Federal Funds rate six consecutive times since the credit crisis erupted in August 2007. The following graph illustrates quarterly Gross Domestic Product (“GDP”) growth in the U.S. from first quarter of 2000 through 2007:
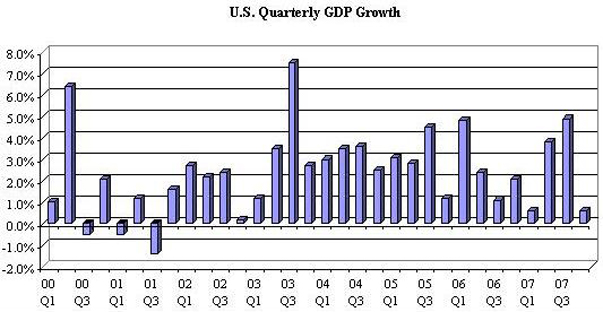
Source: U.S. Department of Commerce, Bureau of Economic Analysis
(measured in 2000-chained dollars)
28
On an annual basis, U.S. GDP has grown every year from 2000 to 2006. The growth trend appeared to continue through the third quarter of 2007. Despite the growth in GDP on a yearly basis, the growth rate has varied on a quarterly basis, particularly during 2000 and 2001. GDP experienced several quarters of decline throughout 2000 and 2001 as the economy was in the initial stages of recovering from the recession. GDP growth began to accelerate in 2002 and 2003 as the economic recovery began to pick up momentum. During 2004 and 2005, GDP grew at a more stable rate. During 2006 and the first half of 2007, GDP growth began to trend lower as the economy began to stabilize. However, the forth quarter of 2007 posted growth of 0.6% due to weaker economic conditions.
Unemployment
The following chart presents a comparison of the U.S. unemployment rates from 2000 through February 2008:
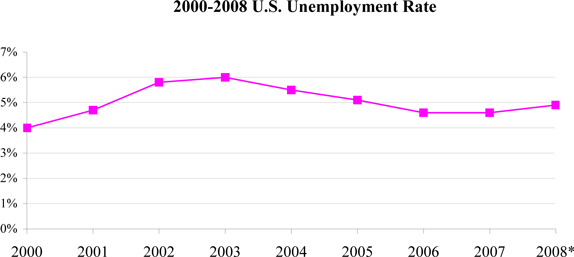
Sources: U.S. Department of Labor, Bureau of Labor Statistics (www.bls.gov)
*Average monthly data from January to February 2008.
The U.S. unemployment rate increased after the economic slowdown in 2001 to 5.8% in 2002 and 6.0% in 2003. In 2004 it decreased to 5.5%, and continued to decrease to 4.6% in 2006 and 2007 as the economy began to recover. However, the U.S. unemployment rate started to increase in 2008 as a result of a perceived economic downturn.
Consumer Confidence
The Consumer Confidence Index (“CCI”) reflects consumers’ views of current and future business and economic trends and how they expect to be affected by those trends. The CCI is measured by comparing consumer confidence with a base year of 1985 equaling 100. Consumers typically increase their spending when consumer confidence is high or rising. The following chart presents the average annual U.S. CCI from 2000 through February 2008:
29
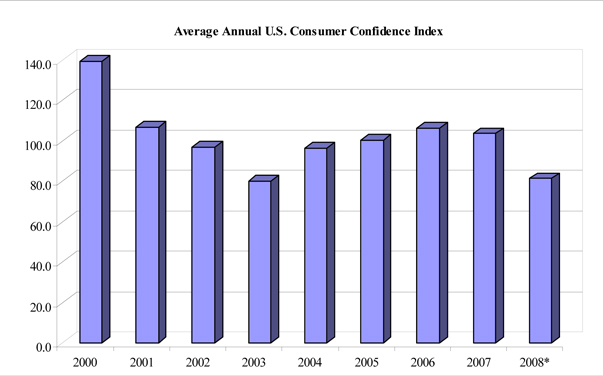
Source: NFO Research, Inc. (www.pollingreport.com)
*Average monthly data from January to February 2008.
The average annual CCI decreased from 2000 to 2003 due in part to an economic downturn. In 2003 the CCI dropped to 79.8, its lowest level in the past ten years, before trending upward in 2004. The CCI continued its upward trend between 2004 and 2006, and then dropped significantly to 81.2 in February 2008.
Personal Income
Personal income indicates the total amount of money consumers are earning. The following graph shows U.S. personal income for 2000 through 2007:
30
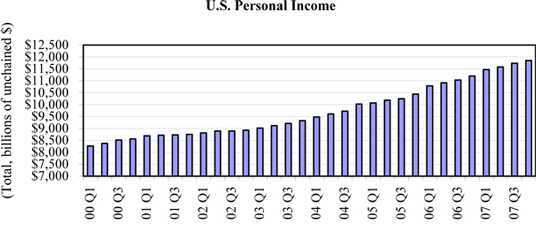
Source: U.S. Department of Commerce, Bureau of Economic Analysis
The U.S. personal income grew every quarter from the first quarter of 2000 through the third quarter of 2007, growing from $8,266.2 billion in first quarter 2000 to $11,853.5 billion in forth quarter 2007.
Disposable Income
Disposable income indicates the amount of money consumers are making after taxes have been paid, indicating the amount available for spending or saving. Thus, consumers will spend more on non critical services such as health clubs when disposable income is higher. The following chart presents quarterly U.S. disposable personal income from 2000 through 2007:
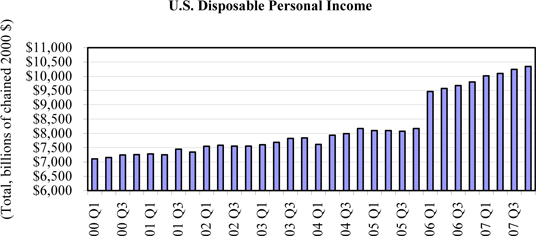
Source: U.S. Department of Commerce, Bureau of Economic Analysis
While there was some fluctuation between quarters, disposable personal income grew in every year from 2001 through 2007, reaching higher fourth quarters in each year than in the previous.
31
FORECASTS FOR THE U.S. ECONOMY
The Anderson Forecast19
The September 2007 Anderson Forecast projected that:
| · | The U.S. GDP, measured in constant dollars, would increase by 1.8% in 2007, 1.8% in 2008, and 3.0% in 2009. |
| · | U.S. unemployment rate would increase to 4.6% in 2007, 5.1% in 2008, and 5.1% in 2009; and |
| · | U.S. consumption would grow by 2.7 in 2007, 2.0% in 2008, and 2.6% in 2009. |
The Livingston Survey20
The December 2007 Livingston Survey projected that:
| · | The U.S. economy’s output would grow at an annual rate of 1.9% in the first half of 2008 and then increase to an annual rate of 2.8% in the second half of the year; |
| · | U.S. unemployment was expected to rise from 4.8% in December 2007 to 5.0% in June 2008 and then decrease slightly to 4.9% by the end of 2008; and |
| · | The Consumer Price Index inflation would average 2.8% in 2007, then increase to 3.0% in 2008, and fall back to 2.1% in 2009. |
The Congressional Budget Office Survey21
In January 2008, the Congressional Budget Office projected that:
| · | Economic growth was forecasted to grow at an inflation adjusted annual rate of 1.7% in 2008, 2.8% in 2009, 3.1% in 2010 through 2013 and then decline to an inflation adjusted annual growth rate of 2.5% from 2014 to 2018; |
| · | The Consumer Price Index was expected to grow at an annual rate of 2.9% throughout 2008 and 2.3% in 2009 and 2.2% for the years 2010 through 2018; and |
| · | The Unemployment Rate was anticipated to average about 5.1% throughout 2008, increase to 5.4% in 2009 and then decline to 4.9% during 2010 through 2013. |
20 The Federal Reserve Bank of Philadelphia. “The Livingston Survey, December 2007 Release.”
21Congressional Budget Office.“The Budget and Economic Outlook: An Update.” August 2007.
32
THE EUROPEAN ECONOMY
European Growth
The European economy is recovering from sluggish growth experienced in 2001 through 2003. The following graph shows quarterly GDP growth in Europe for the first quarter of 2000 through the fourth quarter of 2007, most recent data available:
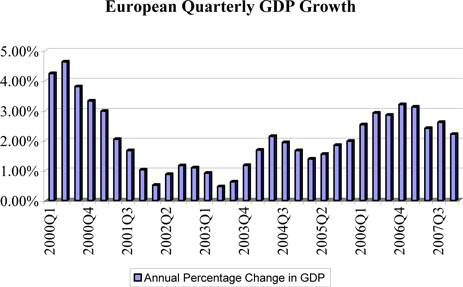
Source: European Central Bank Statistical Data Warehouse
On an annual basis, European GDP grew every year during the period under review. However, quarterly growth rates varied widely from 2000 through 2007, dropping from a high point of 4.63% in the second quarter of 2000 to a low of 0.46% in the second quarter of 2003. From the fourth quarter of 2003 through the fourth quarter of 2007, European GDP growth was positive in each quarter, reaching a high of 3.20% during the fourth quarter of 2006. In the fourth quarter of 2007, European GDP grew by 2.21%.
European Unemployment
The following graph displays the unemployment rate in Europe from 2000 through 2007, the most recent data available:
33
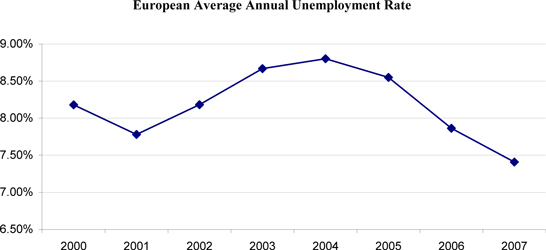
Source: European Central Bank Statistical Data Warehouse
Unemployment rate in Europe increased each year from 7.78% in 2001 to 8.80% in 2004. Since, the European unemployment rate declined to 7.41% in 2007.
FORECASTS FOR THE EUROPEAN ECONOMY
The Euro-area GDP Growth Projection22
In August 2007, the Directorate General for Economic and Financial Affairs of the European Commission projected that:
| · | GDP in the Euro Area would grow 0.3% to 0.8% in the third quarter of 2007 and 0.2% to 0.8% in the fourth quarter of 2007; and 0.2% to 0.9% in the first quarter of 2008. |
European Economic Forecasts23
In July 2007, the European Commission projected the following for the European Economy:
| · | GDP in the 27 country European Union area would grow by 2.9% in 2007, 2.4% in 2008 and 2009; |
| · | Consumption would increase 2.3% in 2007, 2.4% in 2008, and 2.2 in 2009; and |
| · | The Unemployment Rate in the European Union, which was 7.9% in 2006, would fall to 7.1% in 2007, 6.8% in 2008, and 6.6% in 2009. |
23 European Economy 2007. “Economic forecast Spring 2007.” May 7, 2007.
34
SUMMARY
U.S. Economy
After strong economic growth in the late 1990s and early 2000, the U.S. economy slowed in late 2000 and entered into a recession in March 2001. In 2002 and the first half of 2003, the U.S. economy appeared to be in a state of recovery but was growing slowly. In the second half of 2003 through the end of 2005, the economy grew strongly, indicating an expansion of the U.S. economy. However, in the second half of 2007, the U.S. economy began to show signs of a slowdown due to the global credit crunch and mounting sub-prime mortgage concerns.
U.S. unemployment rate increased after the economic slowdown in 2001 and began to decrease in 2004 and 2005. However, the unemployment rate began to increase in the second half of 2007 due to a perceived economic downturn.
U.S. average annual CCI was at its lowest point in 2003 at 79.8, after which it continued its upward trend between 2004 and 2006, and then dropped significantly to 81.2 in February 2008. The U.S. personal income and disposable personal income grew in every quarter from 2000 through the third quarter of 2007.
U.S. GDP growth is expected at 1.8% in 2007 and between 1.7% and 2.3% in 2008. U.S. unemployment rate is forecasted to range between 4.9% and 5.1% in 2008, and between 5.0% and 5.4% in 2009. The Consumer Price Index inflation is expected to average 2.8% in 2007, then increase to 3.0% in 2008, and fall back to 2.1% in 2009.
European Economy
The European economy is recovering from sluggish growth experienced in 2001 through 2003. On an annual basis, European GDP grew in every year during the period under review. In the fourth quarter of 2007, European GDP grew by 2.21%.
European GDP growth forecasts predict GDP growth in the 27 country European Union area to slow to 2.4% in 2008 and 2009.
35
VALUATION ANALYSIS
INTRODUCTION
We are performing a valuation of the fair market value and fair value of a 100% equity interest in the Intellectual Property. In order to value the Intellectual Property, we must use the standards of fair market value, fair value, and consider all relevant factors.
DEFINITION OF FAIR MARKET VALUE
Fair market value is defined by the American Society of Appraisers as:
The amount at which property would change hands between a willing seller and a willing buyer when neither is acting under compulsion and when both have reasonable knowledge of the relevant facts.
We also considered Statement of Financial Accounting Standards (“SFAS”) No. 157, in which fair value is defined as follows:
The exchange price is the price in an orderly transaction between market participants to sell the asset or transfer the liability in the market in which the reporting entity would transact for the asset or liability, that is, the principal or most advantageous market for the asset or liability. The transaction to sell the asset or transfer the liability is a hypothetical transaction at the measurement date, considered from the perspective of a market participant that holds the asset or owes the liability. Therefore, the definition focuses on the price that would be received to sell the asset or paid to transfer the liability (an exit price), not the price that would be paid to acquire the asset or received to assume the liability (an entry price).
We also considered the definition of fair market value as defined under Section 20.2031-1(b) of the Estate Tax Regulations and Section 23.2312-1 of the Gift Tax Regulations, which define fair market value as:
The price at which the property would change hands between a willing buyer and a willing seller when the former is not under any compulsion to buy and the latter is not under any compulsion to sell, both parties having reasonable knowledge of the relevant facts.
In addition, we also considered the factors listed under Appendix H: The Process of Business Valuation and Diligence Procedures, page 142.
36
DATE OF VALUE
The date of value is March 31, 2008.
RISK/REWARD PROFILE
The following outlines Platinum’s risk/reward profile as of the date of value:
Company Factors
| · | Platinum was established in 1996 and has operated for approximately 11 years. |
| · | Platinum’s executive management team has extensive experience. |
| · | Platinum is focused on adapting its character library to film, television, publishing (both print and digital), video games, merchandising, licensing and other media. Its library consists of 5,622 characters in various genres, including science fiction, fantasy, horror, mystery, romance, comedy, crime, action, and family. |
| · | In addition to in-house development and further acquisitions, Platinum is developing content with professionals outside the realm of comic books. The Company has teamed up with screenwriters, producers, directors, movie stars, and novelists to develop entertainment content and potential new franchise properties. Every project is designed for eventual adaptation to all media platforms, including film and television, digital publishing, print publishing, video games and merchandising licensing. |
| · | In 2007 and through the first quarter of 2008, Platinum: |
| o | SoldUnique to Disney Studios, with the anticipation that it will go into production in 2009; |
| o | Entered into a 2-year option agreement with DreamWorks, in association with Universal Pictures , Paramount Pictures, and Imagine Entertainment, to acquire the film production rights toCowboys & Aliens, with the goal to produce a feature film; and |
| o | Completed a co-production deal onDead of Nightwith Hyde Park Entertainment, with anticipated production start date Summer or Fall 2008; and |
| o | Completed a co-production deal onWitchbladewith Arclight Films and Top Cow Entertainment with anticipated production start date in Fall 2008. |
| · | Currently Platinum is in negotiation with several major film studios to co-produce the following titles: |
| o | Atlantis Rising |
| o | Hunter |
| o | Mal Chance |
37
| · | The Company’s December 31, 2007 Form 10-K states that Platinum plans to seek additional financing in order to execute its business plan, but there is no assurance the Company will be able to obtain such financing on terms favorable to the Company or at all. These items raise substantial doubt about the Company’s ability to continue as a going concern, which is mentioned in the independent auditors’ cover letter to the audited financial statements for fiscal year 2007. |
| · | On January 10, 2008, Platinum filed Form SB-2 and provided prospectus to offer the resale by the selling stockholders of up to 66,255,825 shares or 32.92% of the Company’s common stock outstanding. As of February 1, 2008, Platinum became a publicly traded company on the OTCBB. As of March 31, 2008, the number of shares of Platinum’s common stock outstanding was 216,921,227. |
| · | Platinum’sTotal Revenues increased at an ACR of 42.3% from 2002 through 2007. Platinum did not incur anyCost of Revenues from 2002 though 2006. In 2007,Cost of Revenuesrepresented 14.2% ofTotal Revenues. Total Operating Expenses increased during the same period under review as the Company actively recruited executives and other talents to help exploit the Company’s library of comic book characters. Platinum hadOperating Losses andNet Losses from 2002 through 2007, due to the establishment and expansion of the business. |
| · | Total Assets grew at an ACR of 31.8% from 2002 through 2007.Total Liabilities varied between $5,672,224 and $9,664,312 during the period under review.Total Shareholders’ Equity was negative during the period under review due toNet Losses from 2002 through 2007. |
| · | Since Platinum had minimumRevenues and significantNet Losses during the period under review, and since the Company’s business plan is to generate significant film entertainment and online revenues in the next several years through active exploitation of its comic book character library, we have given limited consideration to Platinum’s historical financial performance as a basis for our valuation. However, our valuation takes into account the risks of the Company not obtaining adequate financing and its ability to continue as a going concern. |
Industry Factors
| · | U.S. box office revenues increased at an ACR of 2.9% from 2001 through 2007. U.S. box office revenues of comic book adaptation movies increased at an ACR of 2.6% from 2002 through 2007. The industry is forecasted to grow at an average annual rate of 3.7% over the next five years, from 2008 to 2012.24 |
| · | Worldwide retail sales of licensed products increased at an ACR of 2.5% from 2001 through 2006. Character licensing is the largest category in the total worldwide retail sales of licensed products, and the revenues increased at an ACR of 2.1% during the same period. |
24 Ibid.
38
| · | U.S. wholesale eBooks sales increased at an ACR of 40.3% from 2002 through 2007. U.S. internet advertising revenues increased at an ACR of 14.7% from 2000 through 2008. |
| · | U.S. comic book sales increased at an ACR of 16.5% from 2001 through 2007. According to Diamond Comic Distributors, the comic books published by Marvel and DC Comics account for approximately 70% of its comic book sales to retailers. |
| · | North America video game revenues increased at an ACR of 8.7% from 2001 to 2007. |
Competitive Factors
| · | Platinum’s main competitors have established superior longevity of operations, depth in management and financial performance and resources. However, the size of Platinum’s character library is comparable to Marvel and DC Comic’s and more diverse with respect with types of genre, and offers story lines of more recently developed characters beyond superhero status. Overall, Platinum operates in a niche but competitive environment. The Company’s competitive strategy is to promote and commercialize its more diverse and newer characters to its multiple target audiences. |
Economic Factors
U.S. Economy
| · | After strong economic growth in the late 1990s and early 2000, the U.S. economy slowed in late 2000 and entered into a recession in March 2001. In 2002 and the first half of 2003, the U.S. economy appeared to be in a state of recovery but was growing slowly. In the second half of 2003 through the end of 2005, the economy grew strongly, indicating an expansion of the U.S. economy. However, in the second half of 2007, the U.S. economy began to show signs of a slowdown due to the global credit crunch and mounting sub-prime mortgage concerns. |
| · | U.S. unemployment rate increased after the economic slowdown in 2001 and began to decrease in 2004 and 2005. However, the unemployment rate began to increase in the second half of 2007 due to a perceived economic downturn. |
| · | U.S. average annual CCI was at its lowest point in 2003 at 79.8, after which it continued its upward trend between 2004 and 2006, and then dropped significantly to 81.2 in February 2008. The U.S. personal income and disposable personal income grew in every quarter from 2000 through the third quarter of 2007. |
| · | U.S. GDP growth is expected at 1.8% in 2007 and between 1.8% and 2.3% in 2008. U.S. unemployment rate is forecasted to range between 4.9% and 5.1% in 2008, and between 5.0% and 5.1% in 2009. The Consumer Price Index inflation is expected to average 2.8% in 2007, then increase to 3.0% in 2008, and fall back to 2.1% in 2009. |
39
European Economy
| · | The European economy is recovering from sluggish growth experienced in 2001 through 2003. On an annual basis, European GDP grew in every year during the period under review. In the fourth quarter of 2007, European GDP grew by 2.21%. |
| · | European GDP growth forecasts predict GDP growth in the 27 country European Union area to slow to 2.4% in 2008 and 2009. |
METHODOLOGICAL APPROACHES
We determined the fair market value of the Intellectual Property by determining the value of each of the Company’s divisions. For each of the divisions, the following presents an overview of the major production / marketing assumptions as well as references to the supporting schedules, which include independently derived market and industry support for the assumptions used in our valuations.
Unless otherwise indicated, for each of the divisions, we used the following valuation methods to determine the indicated fair market value of the Intellectual Property:
| 1 | Discounted Cash Flow (“DCF”) Method (income approach) |
| 2 | Market Multiple Method (market approach) |
1. Film Entertainment: Licensed Film Division
| · | The Licensed Film Division model assumes that Platinum Studios, Inc. sells theatrical film rights of high budget films (with average budgets of $50 - $65 million) to one of the major Hollywood Studios for a license fee, and retains partial merchandising rights. |
| · | The number of projects per year ranges between 1 and 2. |
| · | Schedules 3 to 6 present our overall valuation analysis. |
| · | Exhibits 1 to 5 provide support for Schedule 3 (Projections). |
| · | Appendices A-2 to A-4 provide support for Exhibit 1. |
| · | Exhibits 6A to 6C, and 7 provide support for Schedule 4 (DCF Method). |
| · | Appendix C provides support for Schedule 5 (Market Method). |
2. Film Entertainment: Joint Venture Division
| · | The Joint Venture Division model assumes that Platinum Studios, Inc. forms joint ventures with other studios to produce and distribute low budget films (with average budgets of $15 - $25 million), and Platinum assumes 30% of all costs and profits. |
40
| · | The number of projects per year ranges between 2 and 3. |
| · | Schedules 7 to 10 present our overall valuation analysis. |
| · | Exhibits 8 to 12 provide support for Schedule 7 (Projections). |
| · | Appendices A-5 to A-8, and Appendix B provide support for Exhibit 8. |
| · | Exhibits 6A to 6C, and 7 provide support for Schedule 8 (DCF Method). |
| · | Appendix C provides support for Schedule 9 (Market Method). |
3. Film Entertainment: Film Fund Division
| · | The Film Fund Division model assumes that Platinum Studios, Inc. finances 100% of low budget Indie films (with average budgets of $10 million) via the Film Fund. |
| · | The number of projects per year ranges between 0 and 5. |
| · | Schedules 11 to 14 present our overall valuation analysis. |
| · | Exhibits 13 and 14 provide support for Schedule 11 (Projections). |
| · | Appendix A-9 provides support for Exhibit 13. |
| · | Exhibits 6A to 6C, and 7 provide support for Schedule 12 (DCF Method). |
| · | Appendix C provides support for Schedule 13 (Market Method). |
4. Film Entertainment: Direct to DVD Division
| · | The Direct to DVD Division model assumes that Platinum Studios, Inc. finances 100% of Direct to DVD films (with average budgets of $1.5 million) via private financing. |
| · | The number of projects per year ranges between 0 and 7. |
| · | Schedules 15 to 18 present our overall valuation analysis. |
| · | Exhibits 15 to 17 provide support for Schedule 15 (Projections). |
| · | Appendix D provides support for Exhibit 15. |
| · | Exhibits 6A to 6C, and 7 provide support for Schedule 16 (DCF Method). |
| · | Appendix C provides support for Schedule 17 (Market Method). |
5. Digital Publishing
| · | The Digital Publishing model assumes that revenues are generated through: Merchandise Sales, Advertising Sales, Gaming Revenues, Subscription Revenues and Syndication Revenues. |
| · | Schedules 19 to 22 present our overall valuation analysis. |
| · | Exhibits 18 to 20 provide support for Schedule 19 (Projections). |
| · | Exhibits 21A to 21C provide support for Schedule 20 (DCF Method). |
| · | Appendix E provides support for Schedule 21 (Market Method). |
6. Video Network
| · | The Video Network model assumes that revenues are generated through Advertising Sales. |
| · | Schedules 23 to 26 present our overall valuation analysis. |
| · | Exhibits 22 to 23 provide support for Schedule 23 (Projections). |
41
| · | Exhibits 21A to 21C provide support for Schedule 24 (DCF Method). |
| · | Appendix F provides support for Schedule 25 (Market Method). |
7. Print Publishing
| · | We utilized the revenue multiplier method, a market-based method, and applied a revenue multiple in the high range to account for expected growth in future revenues and profits. |
| · | Schedule 27 presents our overall valuation analysis. |
8. Licensed Video Games
| · | The Licensed Video Games model assumed that revenues are generated through license agreements with video game production and distribution studios. |
| · | Schedules 28 and 29 present our overall valuation analysis. |
| · | Exhibit 24 provides support for Schedule 28 (Projections). |
| · | Appendices G-1 to G-2 provide support for Exhibit 24. |
| · | Exhibits 6A to 6C, and 7 provide support for Schedule 29 (DCF Method). |
9. Licensing and Merchandising
| · | The Licensing and Merchandising model assumes that revenues are generated through license agreements with distributors based on IP in addition to Film Entertainment, Digital Publishing, and Video Games. |
| · | Schedule 30 presents our overall valuation analysis. |
10. The Comic Book Challenge
| · | We utilized the Cost Approach to determine the indicated fair market value of the Comic Book Challenge. |
The following schedules and accompanying endnotes, exhibits and appendices present our valuation analysis.
42
Schedule 3
Platinum Studios, Inc.
Film Entertainment: Projected Cash Flow for Licensed Film Division1
Date of Value: March 31, 2008
| 2008 | 2009 | 2010 | 2011 | 2012 | 2013 | 2014 | 2015 | 2016 | 2017 | 2018 | ||||||||||||||||||||||||
| (1) | (2) | (3) | (4) | (5) | (6) | (7) | (8) | (9) | (10) | (11) | ||||||||||||||||||||||||
Assumptions: | ||||||||||||||||||||||||||||||||||
| Action | ||||||||||||||||||||||||||||||||||
| High Budget | 0 | 2 | 1 | 1 | 1 | 0 | 0 | 1 | 0 | 0 | 1 | |||||||||||||||||||||||
| Comedy | ||||||||||||||||||||||||||||||||||
| High Budget | 0 | 0 | 0 | 1 | 0 | 1 | 1 | 1 | 1 | 1 | 0 | |||||||||||||||||||||||
| Thriller | ||||||||||||||||||||||||||||||||||
| High Budget | 0 | 0 | 1 | 0 | 1 | 1 | 1 | 0 | 1 | 1 | 1 | |||||||||||||||||||||||
Total Projects Began per Year | 0 | 2 | 2 | 2 | 2 | 2 | 2 | 2 | 2 | 2 | 2 | |||||||||||||||||||||||
Projected Cash Flows: | ||||||||||||||||||||||||||||||||||
Revenue from Film License | $ | 0 | $ | 2,500,000 | $ | 2,500,000 | $ | 2,500,000 | $ | 2,500,000 | $ | 2,500,000 | $ | 2,500,000 | $ | 2,500,000 | $ | 2,500,000 | $ | 2,500,000 | $ | 2,500,000 | ||||||||||||
Gross Receipts | ||||||||||||||||||||||||||||||||||
| Domestic Theatrical | $ | 0 | $ | 0 | $ | 0 | $ | 0 | $ | 0 | $ | 0 | $ | 0 | $ | 0 | $ | 0 | $ | 0 | $ | 0 | ||||||||||||
| International Theatrical | 0 | 0 | 0 | 0 | 0 | 0 | 0 | 0 | 0 | 0 | 0 | |||||||||||||||||||||||
| Domestic Home Video | 0 | 0 | 0 | 0 | 0 | 0 | 0 | 0 | 0 | 0 | 0 | |||||||||||||||||||||||
| International Home Video | 0 | 0 | 0 | 0 | 0 | 0 | 0 | 0 | 0 | 0 | 0 | |||||||||||||||||||||||
| Domestic Television | ||||||||||||||||||||||||||||||||||
| PPV | 0 | 0 | 0 | 0 | 0 | 0 | 0 | 0 | 0 | 0 | 0 | |||||||||||||||||||||||
| Pay TV | 0 | 0 | 0 | 0 | 0 | 0 | 0 | 0 | 0 | 0 | 0 | |||||||||||||||||||||||
| Network TV | 0 | 0 | 0 | 0 | 0 | 0 | 0 | 0 | 0 | 0 | 0 | |||||||||||||||||||||||
| Syndicated TV | 0 | 0 | 0 | 0 | 0 | 0 | 0 | 0 | 0 | 0 | 0 | |||||||||||||||||||||||
| International Television | ||||||||||||||||||||||||||||||||||
| Pay TV | 0 | 0 | 0 | 0 | 0 | 0 | 0 | 0 | 0 | 0 | 0 | |||||||||||||||||||||||
| Syndicated TV | 0 | 0 | 0 | 0 | 0 | 0 | 0 | 0 | 0 | 0 | 0 | |||||||||||||||||||||||
| Domestic Merchandising | 0 | 0 | 1,217,592 | 968,056 | 949,048 | 1,059,749 | 644,486 | 623,030 | 958,203 | 617,643 | 599,348 | |||||||||||||||||||||||
| International Merchandising | 0 | 0 | 1,301,564 | 996,886 | 1,030,393 | 1,093,682 | 666,427 | 642,258 | 1,038,256 | 639,584 | 619,028 | |||||||||||||||||||||||
Total Gross Receipts | $ | 0 | $ | 0 | $ | 2,519,156 | $ | 1,964,942 | $ | 1,979,441 | $ | 2,153,431 | $ | 1,310,913 | $ | 1,265,288 | $ | 1,996,459 | $ | 1,257,227 | $ | 1,218,376 | ||||||||||||
Distribution Costs | ||||||||||||||||||||||||||||||||||
| Domestic Theatrical | $ | 0 | $ | 0 | $ | 0 | $ | 0 | $ | 0 | $ | 0 | $ | 0 | $ | 0 | $ | 0 | $ | 0 | $ | 0 | ||||||||||||
| International Theatrical | 0 | 0 | 0 | 0 | 0 | 0 | 0 | 0 | 0 | 0 | 0 | |||||||||||||||||||||||
| Domestic Home Video | 0 | 0 | 0 | 0 | 0 | 0 | 0 | 0 | 0 | 0 | 0 | |||||||||||||||||||||||
| International Home Video | 0 | 0 | 0 | 0 | 0 | 0 | 0 | 0 | 0 | 0 | 0 | |||||||||||||||||||||||
| Domestic Television Cost | 0 | 0 | 0 | 0 | 0 | 0 | 0 | 0 | 0 | 0 | 0 | |||||||||||||||||||||||
| International Television Cost | 0 | 0 | 0 | 0 | 0 | 0 | 0 | 0 | 0 | 0 | 0 | |||||||||||||||||||||||
Total Distribution Costs | $ | 0 | $ | 0 | $ | 0 | $ | 0 | $ | 0 | $ | 0 | $ | 0 | $ | 0 | $ | 0 | $ | 0 | $ | 0 | ||||||||||||
Publicity Expenses | ||||||||||||||||||||||||||||||||||
| Domestic Theatrical | ||||||||||||||||||||||||||||||||||
| Advertising | $ | 0 | $ | 0 | $ | 0 | $ | 0 | $ | 0 | $ | 0 | $ | 0 | $ | 0 | $ | 0 | $ | 0 | $ | 0 | ||||||||||||
| Prints | 0 | 0 | 0 | 0 | 0 | 0 | 0 | 0 | 0 | 0 | 0 | |||||||||||||||||||||||
| International Theatrical | ||||||||||||||||||||||||||||||||||
| Advertising | 0 | 0 | 0 | 0 | 0 | 0 | 0 | 0 | 0 | 0 | 0 | |||||||||||||||||||||||
| Prints | 0 | 0 | 0 | 0 | 0 | 0 | 0 | 0 | 0 | 0 | 0 | |||||||||||||||||||||||
Total Publicity Expenses | $ | 0 | $ | 0 | $ | 0 | $ | 0 | $ | 0 | $ | 0 | $ | 0 | $ | 0 | $ | 0 | $ | 0 | $ | 0 | ||||||||||||
Negative Costs | $ | 0 | $ | 0 | $ | 0 | $ | 0 | $ | 0 | $ | 0 | $ | 0 | $ | 0 | $ | 0 | $ | 0 | $ | 0 | ||||||||||||
Net Profit | $ | 0 | $ | 2,500,000 | $ | 5,019,156 | $ | 4,464,942 | $ | 4,479,441 | $ | 4,653,431 | $ | 3,810,913 | $ | 3,765,288 | $ | 4,496,459 | $ | 3,757,227 | $ | 3,718,376 | ||||||||||||
Less: | ||||||||||||||||||||||||||||||||||
Participations (10% of Net Profit each) | ||||||||||||||||||||||||||||||||||
| Talent | $ | 0 | $ | 0 | $ | 0 | $ | 0 | $ | 0 | $ | 0 | $ | 0 | $ | 0 | $ | 0 | $ | 0 | $ | 0 | ||||||||||||
| Writers | 0 | 0 | 0 | 0 | 0 | 0 | 0 | 0 | 0 | 0 | 0 | |||||||||||||||||||||||
Total Participations | $ | 0 | $ | 0 | $ | 0 | $ | 0 | $ | 0 | $ | 0 | $ | 0 | $ | 0 | $ | 0 | $ | 0 | $ | 0 | ||||||||||||
Net Profit After Participations | $ | 0 | $ | 2,500,000 | $ | 5,019,156 | $ | 4,464,942 | $ | 4,479,441 | $ | 4,653,431 | $ | 3,810,913 | $ | 3,765,288 | $ | 4,496,459 | $ | 3,757,227 | $ | 3,718,376 | ||||||||||||
Less: | ||||||||||||||||||||||||||||||||||
Content Partners (15% of Net Profit After Participations) | $ | 0 | $ | 375,000 | $ | 752,873 | $ | 669,741 | $ | 671,916 | $ | 698,015 | $ | 571,637 | $ | 564,793 | $ | 674,469 | $ | 563,584 | $ | 557,756 | ||||||||||||
Contribution Profit from Licensed Films | $ | 0 | $ | 2,125,000 | $ | 4,266,283 | $ | 3,795,201 | $ | 3,807,525 | $ | 3,955,416 | $ | 3,239,276 | $ | 3,200,495 | $ | 3,821,990 | $ | 3,193,643 | $ | 3,160,620 | ||||||||||||
Source: Exhibits 1 through 5.
Note 1: Assumption: Platinum Studios, Inc. sells theatrical film rights of high budget films to one of the Big Hollywood Studios for a license fee; retains partial merchandising rights.
SANLI PASTORE & HILL, INC.
43
Endnotes to Schedule 3
Platinum Studios, Inc.
Date of Value:March 31, 2008
Note 1
The Licensed Film Division model assumes that Platinum Studios, Inc. sells theatrical film rights of high budget films (with average budgets of $50 - $65 million) to one of the major Hollywood studios for a license fee, and retains merchandising rights.
To estimate the future cash flows generated by the Licensed Film Division, we estimated each film’s revenues and costs over the first ten years, “ultimates”, based on genre and budget size as presented in Exhibit 1, page 97.
We then estimated the timing of the cash flows in each year, as presented in Exhibit 2, page 98. As such, we developed the cash flows of each individual film in each year based on genre and budget size, as presented in Exhibits 3 to 5, pages 99 to 101.
In addition, we also estimated the number of licensed film deals that Platinum would enter into each year. Among the 84 comic book adaptation movies since 1978 to present, there are 57 original movies and 27 sequels to 13 of the original movies. Based on our calculations:
| · | 22.8% of the movies produce at least 1 sequel; |
| · | 10.5% of the movies produce at least 2 sequels; |
| · | 5.3% of the movies produce at least 3 sequels; and |
| · | 5.3% of the movies produce at least 4 sequels. |
With the potential to create film franchises and spin-offs, this enables the Company to produce more film projects derived from the same characters. Based on Platinum’s current licensed film deals, interviews with management, and the potential of sequels and spin-offs, we assumed the number of projects per year would range between 1 and 2.
A film’s ultimate revenues consist of theatrical revenues, home video revenues, TV revenues, and merchandising revenues. Costs of a film primarily consist of production costs, distribution costs, and publicity expenses.
Based on the assumptions of the Licensed Film Division model, we determined the revenues generated by the Licensed Film Division consisted of licenses fees and merchandising sales.
44
Schedule 4
Platinum Studios, Inc.
Method 1: Discounted Cash Flow Method for Licensed Film Division1
Date of Value: March 31, 2008
Apr 1 - Dec 31, 2008 | 2009 | 2010 | 2011 | 2012 | 2013 | 2014 | 2015 | 2016 | 2017 | 2018 | Terminal Year - 2019 | ||||||||||||||||||||||||||
(1) | (2) | (3) | (4) | (5) | (6) | (7) | (8) | (9) | (10) | (11) | (12) | ||||||||||||||||||||||||||
Contribution Profit from Licensed Films (Schedule 3) | $ | 0 | $ | 2,125,000 | $ | 4,266,283 | $ | 3,795,201 | $ | 3,807,525 | $ | 3,955,416 | $ | 3,239,276 | $ | 3,200,495 | $ | 3,821,990 | $ | 3,193,643 | $ | 3,160,620 | |||||||||||||||
Less: Overhead Allocation | (187,500 | ) | (750,000 | ) | (773,250 | ) | (797,221 | ) | (821,935 | ) | (847,415 | ) | (873,684 | ) | (900,769 | ) | (928,692 | ) | (957,482 | ) | (987,164 | ) | |||||||||||||||
EBITDA from Licensed Films | ($187,500 | ) | $ | 1,375,000 | $ | 3,493,033 | $ | 2,997,980 | $ | 2,985,590 | $ | 3,108,002 | $ | 2,365,592 | $ | 2,299,726 | $ | 2,893,298 | $ | 2,236,161 | $ | 2,173,456 | |||||||||||||||
Less: Depreciation | 0 | (100,000 | ) | (100,000 | ) | (100,000 | ) | (100,000 | ) | (100,000 | ) | (100,000 | ) | (100,000 | ) | (100,000 | ) | (100,000 | ) | (100,000 | ) | ||||||||||||||||
EBIT from Licensed Films | ($187,500 | ) | $ | 1,275,000 | $ | 3,393,033 | $ | 2,897,980 | $ | 2,885,590 | $ | 3,008,002 | $ | 2,265,592 | $ | 2,199,726 | $ | 2,793,298 | $ | 2,136,161 | $ | 2,073,456 | |||||||||||||||
Less: Taxes (40% tax rate) | 75,000 | (510,000 | ) | (1,357,213 | ) | (1,159,192 | ) | (1,154,236 | ) | (1,203,201 | ) | (906,237 | ) | (879,891 | ) | (1,117,319 | ) | (854,464 | ) | (829,382 | ) | ||||||||||||||||
Net Income from Licensed Films | ($112,500 | ) | $ | 765,000 | $ | 2,035,820 | $ | 1,738,788 | $ | 1,731,354 | $ | 1,804,801 | $ | 1,359,355 | $ | 1,319,836 | $ | 1,675,979 | $ | 1,281,697 | $ | 1,244,073 | |||||||||||||||
Add: Depreciation | 0 | 100,000 | 100,000 | 100,000 | 100,000 | 100,000 | 100,000 | 100,000 | 100,000 | 100,000 | 100,000 | ||||||||||||||||||||||||||
Less: Capital Expenditures | 0 | (200,000 | ) | (206,000 | ) | (212,180 | ) | (218,545 | ) | (225,102 | ) | (231,855 | ) | (238,810 | ) | (245,975 | ) | (253,354 | ) | (260,955 | ) | ||||||||||||||||
Net Cash Flow to MVIC from Licensed Films | ($112,500 | ) | $ | 665,000 | $ | 1,929,820 | $ | 1,626,608 | $ | 1,612,809 | $ | 1,679,699 | $ | 1,227,500 | $ | 1,181,025 | $ | 1,530,004 | $ | 1,128,343 | $ | 1,083,119 | |||||||||||||||
Terminal Value Calculation | |||||||||||||||||||||||||||||||||||||
End Year Economic Income (E0) | $ | 1,083,119 | |||||||||||||||||||||||||||||||||||
| Long Term Growth Rate (g) | 3.1 | % | |||||||||||||||||||||||||||||||||||
Terminal Year Economic Income (E1 = E0 x (1+g)) | $ | 1,116,695 | |||||||||||||||||||||||||||||||||||
| Capitalization Rate (discount rate - g) | 13.9 | % | |||||||||||||||||||||||||||||||||||
Terminal Value (V = E1 / capitalization rate)4 | $ | 8,028,212 | |||||||||||||||||||||||||||||||||||
Discount Rate (Exhibits 6A - 6C)2 | 1.6 | % | 17.0 | % | 17.0 | % | 17.0 | % | 17.0 | % | 17.0 | % | 17.0 | % | 17.0 | % | 17.0 | % | 17.0 | % | 17.0 | % | 17.0 | % | |||||||||||||
Present Value Factor3 | 0.99 | 0.82 | 0.70 | 0.60 | 0.51 | 0.44 | 0.37 | 0.32 | 0.27 | 0.23 | 0.20 | 0.20 | |||||||||||||||||||||||||
Present Value of Net Cash Flow to MVIC | ($111,849 | ) | $ | 546,443 | $ | 1,355,246 | $ | 976,253 | $ | 827,258 | $ | 736,322 | $ | 459,871 | $ | 378,140 | $ | 418,662 | $ | 263,870 | $ | 216,473 | $ | 1,604,527 | |||||||||||||
Fair Market Value of Licensed Film Division | $ | 7,671,217 | |||||||||||||||||||||||||||||||||||
SANLI PASTORE & HILL, INC.
45
Endnotes to Schedule 4
Platinum Studios, Inc.
Date of Value:March 31, 2008
Note 1
The Discounted Cash Flow (“DCF”) valuation method typically uses “net cash flow” as the economic income that is discounted to present value.Valuing Small Businesses & Professional Practices states:
There are two reasons why net cash flow is the preferred measure of economic income in the application of the income approach: (1) It is conceptually preferable, and (2) It is easier to develop an empirically defensible discount rate for net cash flow.
Dr. Shannon Pratt describes net free cash flow as:25
… [T]he return on the investment that the investor has completely available to take out of the business or to do with as he wishes with absolutely no impairment of the ongoing ability of the business to continue to produce the expected level of cash flows in the future.
Valuing Small Businesses & Professional Practices defines net free cash flow to overall invested capital:
Earnings Before Interests and Taxes
— Taxes on EBIT
+Noncash charges (e.g., depreciation, amortization, deferred income taxes)
— Capital expenditures (the net changes in fixed and other noncurrent assets)
— Changes in working capital
=Net cash flow to overall invested capital
To determine theNet cash flow to overall invested capital,we deducted corporate expenses for overhead, depreciation, and capital expenditures allocated to Licensed Films Division.
Note 2
SeeExhibits 6A to 7, Development of WACC.
25 Pratt, Shannon P., Robert F. Reilly, and Robert P. Schweihs.Valuing Small Businesses and Professional Practices. New York: McGraw-Hill, 1998. p. 220.
46
Under the Weighted Average Cost of Capital (“WACC”), returns on equity (Exhibit 6A) and debt (Exhibit 6B) are separately calculated. The returns on equity and debt are then weighted to calculate the WACC (Exhibit 6C).
Business Valuation Body of Knowledge describes the method as follows26:
Weighted average cost of capital is the blended costs of the company’s capital structure components[debt and equity], each weighted by the market value of that component.
To determine the Fair Value of Licensed Films Division, an appropriate discount rate must be selected. The discount rate reflects the expected longevity and certainty of generating earnings attributable to existing customers and takes numerous valuation characteristics into consideration.
Exhibit 6A presents the “build-up” method of developing an equity discount rate.Valuing a Business: The Analysis and Appraisal of Closely-Held Companies describes the components of a “build-up” as follows27:
1. | A “risk-free rate” (the amount that an investor feels certain of realizing over the holding period). This includes: |
a. | A “rental rate” for foregoing the use of funds over the holding period. |
b. | The expected rate of inflation over the holding period. |
2. | A premium for risk. This includes: |
a. | Systematic risk (that risk that relates to movements in returns on the investment market in general). |
| b. | Unsystematic risk (that risk that is specific to the subject investment). |
The discount rate is directly related to an investment’s potential risk. Investors apply a risk premium to riskier investments, expecting a higher rate of return for these investments. Investments have different levels of risk; these risk levels are defined by the following characteristics:28
Risk-Free | Building a duplicate plant to make more of a currently made and sold product in response to presently high demand. | |
Very Low Risk | Incorporating a new but well-understood technology into making a product presently made and sold in response to existing demand. |
26 Pratt, Shannon,Business Valuation Body of Knowledge. John Wiley & Sons, Inc., 1998, p. 94.
27 Pratt, Shannon P., Robert F. Reilly & Robert P. Schweihs,Valuing a Business: The Analysis and Appraisal of Closely-Held Companies. Irwin Professional Publishing, 2000, p. 160.
28 Razgaitis, Richard.Early-Stage Technologies: Valuation and Pricing. New York: John Wiley & Sons, Inc., 1999, Page 132.
47
Low Risk | Making a product with new features using well-understood technology into a presently served and understood customer segment with evidence of demand for such features. |
Moderate Risk | Making a new product using well-understood technology to a customer segment presently served by other products made by the corporation and with evidence of demand for such a new product. |
High Risk | Making a new product using a not well-understood technology and marketing it to an existing segment or a well-understood technology to a new market segment. |
Very High Risk | Making a new product with new technology to a new segment. |
Extremely High Risk | Creating a startup company to go into the business of making a product not presently sold or even known to exist using unproven technologies. |
Rates of return associated with the different levels of risk are presented in the following table:29
Characterization of Risk | Approximate Rates of Return (Risk-Adjusted Hurdle Rate) | |||
| Risk-free | 10% - 18 | % | ||
| Very low risk | 15% - 20 | % | ||
| Low risk | 20% - 30 | % | ||
| Moderate risk | 25% - 35 | % | ||
| High risk | 30% - 40 | % | ||
| Very high risk | 40% - 45 | % | ||
| Extremely high risk | 50% - 70% or Higher | |||
Investors require a higher rate of return on a start-up company than one on the verge of an initial public offering (“IPO”). A higher discount rate is applicable to companies in its earlier stages of development. The following table illustrates the required rate of return on different stages of development:
29 Razgaitis, Richard.Early-Stage Technologies: Valuation and Pricing. New York: John Wiley & Sons, Inc., 1999, Page 132.
48
Stage of Development | Plummer30 | Scherlis and Sahiman31 | |||||
| Start-up | 50% - 70 | % | 50% - 70 | % | |||
| First Stage or “Early Development” | 40% - 60 | % | 40% - 60 | % | |||
| Second Stage or “Expansion” | 35% - 50 | % | 30% - 50 | % | |||
| Bridge/IPO | 25% - 35 | % | 20% - 35 | % | |||
The After-Tax Equity Discount Rate we determined falls within the moderate to high risk for the above categories, which takes into account the risks identified in our Risk/Reward Profile, page 37.
The appropriate weights to apply to the After-Tax Equity Discount Rate and the After-Tax Rate of Return on Debt were based on the average Debt to Equity ratio of a perpetual slate financing as defined in the Platinum Studios Film Fund, LLC Agreement (see Exhibit 7).
Note 3
SP&H determined that the Mid Year Convention was an appropriate method of calculating thePresent Value Factor for years 2008 through 2018.
Using the Mid Year Convention, thePresent Value Factors were calculated as follows:
Present Value Factor = 1
(1+k)t-0.5
Where:
k = Discount Rate (Equity Discount Rate)
t = Year
Note 4
The terminal value was calculated based on the Gordon Growth Model. 32
Using net cash flow as the economic income measure, the formula for the Gordon Growth Model is as follows:
PV = NCF0 (1+g)
k - g
where:
PV = Present Value
30 Plummer, James L.,QED Report on Venture Capital Financial Analysis (Palo Alto: QED Research, Inc. 1987)
31 Scherlis, Daniel R. and William A. Sahlman,A Method for Valuing High-Risk, Long Term, Investments: The Venture Capital Method(Boston, Harvard Business School Publishing, 1987).
32 Pratt, Shannon P., Robert F. Reilly, and Robert P. Schweihs.Valuing Small Businesses and Professional Practices. New York: McGraw-Hill, 1998. Pages 260-261.
49
NCF0 | = | Net cash flow for period 0, the period immediately preceding the effective valuation date (It is assumed that this has been normalized by whatever adjustments are appropriate, such as eliminating nonrecurring items and so on.) |
g | = | Projected long-term growth rate (annually compounded, sustainable in perpetuity) |
k | = | Present value discount rate (cost of capital applicable to definition of the economic incomevariable being capitalized) |
The Gordon Growth Model version of the capitalized economic income method is often used to derive the terminal value in the discounted economic income method.
50
Schedule 5
Platinum Studios, Inc.
Method 2: Market Multiplier Method for Licensed Film Division1
Date of Value: March 31, 2008
Total Number of Characters in Library | 5,622 | ||||||
| Percent of Characters Adaptable to High Budget Licensed Films | 3 | % | |||||
| Number of Characters Adaptable to High Budget Licensed Films | 169 | ||||||
| Market Multiple (Appendix C) | x | $ | 70,000 | ||||
Fair Market Value of Licensed Film Division | $ | 11,806,000 |
SANLI PASTORE & HILL, INC.
51
Endnotes to Schedule 5
Platinum Studios, Inc.
Date of Value:March 31, 2008
Note 1
In the Market Multiplier Method, the fair market value of the Intellectual Property in the Licensed Film Division was determined by multiplying the number of characters by an appropriate media format adaptation percentage, which we derived based on interviews with management and industry analysis.
To determine the appropriate market multiple, we searched for library transactions in film entertainment industry.We obtained library transaction data from Vogel 2007 and press releases, and made adjustments to the multiples to match the size and nature of the Licensed Film Division.(See Appendix C, page 136) To determine the fair market value of the Intellectual Property in the Licensed Film Division, we utilized the price per feature multiple. Based on our analysis of the Company as well as the industry, competition, and economic conditions for Platinum, we selected the average of low quartile and mean price per feature multiple of $70,000.
52
Schedule 6
Platinum Studios, Inc.
Fair Market Value of Intellectual Property in the Licensed Film Division
Date of Value: March 31, 2008
Fair Market Value | Weight | Weighted FairMarket Value | ||||||||
Method 1: Discounted Cash Flow Method (Schedule 4) | $ | 7,671,217 | 75 | % | $ | 5,753,413 | ||||
Method 2: Market Multiplier Method (Schedule 5) | $ | 11,806,000 | 25 | % | $ | 2,951,500 | ||||
Fair Market Value of Intellectual Property in Licensed Film Division (Rounded) | $ | 8,705,000 | ||||||||
SANLI PASTORE & HILL, INC.
53
Schedule 7
Platinum Studios, Inc.
Film Entertainment: Projected Cash Flow for Joint Venture Film Division1
Scenario: Base
Date of Value: March 31, 2008
| 2008 | 2009 | 2010 | 2011 | 2012 | 2013 | 2014 | 2015 | 2016 | 2017 | 2018 | |||||||||||||||||||||||||||||||||||||||||||||||||||
| (1) | (2) | (3) | (4) | (5) | (6) | (7) | (8) | (9) | (10) | (11) | |||||||||||||||||||||||||||||||||||||||||||||||||||
Assumptions: | |||||||||||||||||||||||||||||||||||||||||||||||||||||||||||||
| Action | |||||||||||||||||||||||||||||||||||||||||||||||||||||||||||||
| Low Budget | 1 | 1 | 1 | 1 | 2 | 1 | 1 | 1 | 1 | 1 | 1 | ||||||||||||||||||||||||||||||||||||||||||||||||||
| Comedy | |||||||||||||||||||||||||||||||||||||||||||||||||||||||||||||
| Low Budget | 0 | 0 | 0 | 0 | 0 | 0 | 1 | 0 | 0 | 0 | 0 | ||||||||||||||||||||||||||||||||||||||||||||||||||
| Thriller | |||||||||||||||||||||||||||||||||||||||||||||||||||||||||||||
| Low Budget | 1 | 1 | 1 | 1 | 1 | 1 | 1 | 1 | 1 | 1 | 1 | ||||||||||||||||||||||||||||||||||||||||||||||||||
| Horror | 0 | 0 | 0 | 1 | 0 | 1 | 0 | 1 | 1 | 1 | 1 | ||||||||||||||||||||||||||||||||||||||||||||||||||
Total Projects Began per Year | 2 | 2 | 2 | 3 | 3 | 3 | 3 | 3 | 3 | 3 | 3 | ||||||||||||||||||||||||||||||||||||||||||||||||||
Projected Cash Flows: | |||||||||||||||||||||||||||||||||||||||||||||||||||||||||||||
Gross Receipts | |||||||||||||||||||||||||||||||||||||||||||||||||||||||||||||
| Domestic Theatrical | $ | 0 | $ | 32,000,000 | $ | 32,000,000 | 22.9 | % | $ | 32,000,000 | 21.0 | % | $ | 38,075,000 | 20.6 | % | $ | 48,500,000 | 20.7 | % | $ | 38,075,000 | 17.7 | % | $ | 40,775,000 | 18.7 | % | $ | 38,075,000 | 17.5 | % | $ | 38,075,000 | 17.5 | % | $ | 38,075,000 | 17.4 | % | |||||||||||||||||||||
| International Theatrical | 0 | 20,451,000 | 24,060,000 | 17.2 | % | 24,060,000 | 15.8 | % | 29,160,000 | 15.8 | % | 38,815,000 | 16.6 | % | 31,605,000 | 14.7 | % | 27,408,000 | 12.6 | % | 29,592,000 | 13.6 | % | 30,060,000 | 13.8 | % | 30,060,000 | 13.7 | % | ||||||||||||||||||||||||||||||||
| Domestic Home Video | 0 | 37,440,000 | 40,934,400 | 29.3 | % | 43,929,600 | 28.8 | % | 53,034,150 | 28.7 | % | 67,392,390 | 28.8 | % | 57,401,370 | 26.7 | % | 61,276,020 | 28.1 | % | 58,870,110 | 27.0 | % | 59,259,330 | 27.3 | % | 59,443,800 | 27.1 | % | ||||||||||||||||||||||||||||||||
| International Home Video | 0 | 14,976,000 | 25,459,200 | 18.2 | % | 26,956,800 | 17.7 | % | 30,698,460 | 16.6 | % | 38,166,570 | 16.3 | % | 37,286,730 | 17.3 | % | 36,093,096 | 16.6 | % | 35,932,104 | 16.5 | % | 35,432,748 | 16.3 | % | 35,641,008 | 16.3 | % | ||||||||||||||||||||||||||||||||
| Domestic Television | |||||||||||||||||||||||||||||||||||||||||||||||||||||||||||||
| PPV | 0 | 120,000 | 4,000,000 | 2.9 | % | 4,000,000 | 2.6 | % | 4,022,781 | 2.2 | % | 4,798,469 | 2.1 | % | 6,023,406 | 2.8 | % | 4,769,500 | 2.2 | % | 5,086,750 | 2.3 | % | 4,759,375 | 2.2 | % | 4,759,375 | 2.2 | % | ||||||||||||||||||||||||||||||||
| Pay TV | 0 | 432,000 | 11,232,000 | 8.0 | % | 14,400,000 | 9.4 | % | 14,482,013 | 7.8 | % | 16,673,063 | 7.1 | % | 20,652,188 | 9.6 | % | 18,202,275 | 8.4 | % | 18,045,000 | 8.3 | % | 17,401,050 | 8.0 | % | 17,133,750 | 7.8 | % | ||||||||||||||||||||||||||||||||
| Network TV | 0 | 0 | 0 | 0.0 | % | 864,000 | 0.6 | % | 3,744,000 | 2.0 | % | 4,608,000 | 2.0 | % | 5,636,025 | 2.6 | % | 6,752,250 | 3.1 | % | 7,573,050 | 3.5 | % | 7,153,200 | 3.3 | % | 7,377,975 | 3.4 | % | ||||||||||||||||||||||||||||||||
| Syndicated TV | 0 | 0 | 0 | 0.0 | % | 0 | 0.0 | % | 224,000 | 0.1 | % | 448,000 | 0.2 | % | 672,000 | 0.3 | % | 826,525 | 0.4 | % | 1,054,025 | 0.5 | % | 1,208,550 | 0.6 | % | 1,360,713 | 0.6 | % | ||||||||||||||||||||||||||||||||
| International Television | |||||||||||||||||||||||||||||||||||||||||||||||||||||||||||||
| Pay TV | 0 | 0 | 1,190,970 | 0.9 | % | 5,557,860 | 3.6 | % | 7,939,800 | 4.3 | % | 8,236,800 | 3.5 | % | 9,835,650 | 4.6 | % | 11,789,250 | 5.4 | % | 10,785,060 | 5.0 | % | 9,353,520 | 4.3 | % | 9,610,920 | 4.4 | % | ||||||||||||||||||||||||||||||||
| Syndicated TV | 0 | 0 | 0 | 0.0 | % | 0 | 0.0 | % | 2,406,000 | 1.3 | % | 4,812,000 | 2.1 | % | 7,218,000 | 3.4 | % | 9,021,000 | 4.1 | % | 11,854,000 | 5.4 | % | 13,657,000 | 6.3 | % | 14,848,000 | 6.8 | % | ||||||||||||||||||||||||||||||||
| Domestic Merchandising | 0 | 313,280 | 342,519 | 0.2 | % | 367,582 | 0.2 | % | 403,910 | 0.2 | % | 611,812 | 0.3 | % | 446,260 | 0.2 | % | 485,964 | 0.2 | % | 452,163 | 0.2 | % | 451,700 | 0.2 | % | 450,481 | 0.2 | % | ||||||||||||||||||||||||||||||||
| International Merchandising | 0 | 325,875 | 356,291 | 0.3 | % | 382,361 | 0.3 | % | 423,963 | 0.2 | % | 678,256 | 0.3 | % | 472,193 | 0.2 | % | 473,675 | 0.2 | % | 473,494 | 0.2 | % | 473,138 | 0.2 | % | 472,473 | 0.2 | % | ||||||||||||||||||||||||||||||||
Total Gross Receipts | $ | 0 | $ | 106,058,155 | $ | 139,575,380 | 100.0 | % | $ | 152,518,202 | 100.0 | % | $ | 184,614,077 | 100.0 | % | $ | 233,740,359 | 100.0 | % | $ | 215,323,822 | 100.0 | % | $ | 217,872,554 | 100.0 | % | $ | 217,792,755 | 100.0 | % | $ | 217,284,611 | 100.0 | % | $ | 219,233,495 | 100.0 | % | |||||||||||||||||||||
Distribution Costs | |||||||||||||||||||||||||||||||||||||||||||||||||||||||||||||
| Domestic Theatrical | $ | 0 | $ | 6,400,000 | $ | 6,400,000 | 4.6 | % | $ | 6,400,000 | 4.2 | % | $ | 7,615,000 | 4.1 | % | $ | 9,700,000 | 4.1 | % | $ | 7,615,000 | 3.5 | % | $ | 8,155,000 | 3.7 | % | $ | 7,615,000 | 3.5 | % | $ | 7,615,000 | 3.5 | % | $ | 7,615,000 | 3.5 | % | |||||||||||||||||||||
| International Theatrical | 0 | 4,090,200 | 4,812,000 | 3.4 | % | 4,812,000 | 3.2 | % | 5,832,000 | 3.2 | % | 7,763,000 | 3.3 | % | 6,321,000 | 2.9 | % | 5,481,600 | 2.5 | % | 5,918,400 | 2.7 | % | 6,012,000 | 2.8 | % | 6,012,000 | 2.7 | % | ||||||||||||||||||||||||||||||||
| Domestic Home Video | 0 | 6,988,800 | 7,488,000 | 5.4 | % | 7,887,360 | 5.2 | % | 9,513,660 | 5.2 | % | 12,184,770 | 5.2 | % | 10,445,916 | 4.9 | % | 11,359,452 | 5.2 | % | 11,135,748 | 5.1 | % | 11,483,706 | 5.3 | % | 11,831,664 | 5.4 | % | ||||||||||||||||||||||||||||||||
| International Home Video | 0 | 2,695,680 | 4,672,512 | 3.3 | % | 4,972,032 | 3.3 | % | 5,723,406 | 3.1 | % | 7,156,609 | 3.1 | % | 7,099,092 | 3.3 | % | 6,945,401 | 3.2 | % | 7,019,158 | 3.2 | % | 7,000,672 | 3.2 | % | 7,118,654 | 3.2 | % | ||||||||||||||||||||||||||||||||
| Domestic Television Cost | 0 | 252,800 | 2,780,800 | 2.0 | % | 3,792,000 | 2.5 | % | 4,345,593 | 2.4 | % | 5,160,675 | 2.2 | % | 6,194,983 | 2.9 | % | 5,919,273 | 2.7 | % | 6,095,640 | 2.8 | % | 6,005,620 | 2.8 | % | 6,033,862 | 2.8 | % | ||||||||||||||||||||||||||||||||
| International Television Cost | 0 | 199,698 | 2,196,678 | 1.6 | % | 2,995,470 | 2.0 | % | 3,444,666 | 1.9 | % | 4,227,854 | 1.8 | % | 5,276,343 | 2.5 | % | 4,916,986 | 2.3 | % | 4,642,622 | 2.1 | % | 4,812,307 | 2.2 | % | 4,912,604 | 2.2 | % | ||||||||||||||||||||||||||||||||
Total Distribution Costs | $ | 0 | $ | 20,627,178 | $ | 28,349,990 | 20.3 | % | $ | 30,858,862 | 20.2 | % | $ | 36,474,325 | 19.8 | % | $ | 46,192,908 | 19.8 | % | $ | 42,952,334 | 19.9 | % | $ | 42,777,712 | 19.6 | % | $ | 42,426,567 | 19.5 | % | $ | 42,929,304 | 19.8 | % | $ | 43,523,784 | 19.9 | % | |||||||||||||||||||||
Publicity Expenses | |||||||||||||||||||||||||||||||||||||||||||||||||||||||||||||
| Domestic Theatrical | |||||||||||||||||||||||||||||||||||||||||||||||||||||||||||||
| Advertising | $ | 2,100,228 | $ | 21,002,280 | $ | 21,002,280 | 15.0 | % | $ | 21,702,356 | 14.2 | % | $ | 28,469,757 | 15.4 | % | $ | 32,203,495 | 13.8 | % | $ | 28,003,040 | 13.0 | % | $ | 28,003,040 | 12.9 | % | $ | 28,003,040 | 12.9 | % | $ | 28,003,040 | 12.9 | % | $ | 28,003,040 | 12.8 | % | |||||||||||||||||||||
| Prints | 0 | 2,619,301 | 2,619,301 | 1.9 | % | 2,619,301 | 1.7 | % | 3,492,401 | 1.9 | % | 4,074,468 | 1.7 | % | 3,492,401 | 1.6 | % | 3,492,401 | 1.6 | % | 3,492,401 | 1.6 | % | 3,492,401 | 1.6 | % | 3,492,401 | 1.6 | % | ||||||||||||||||||||||||||||||||
| International Theatrical | |||||||||||||||||||||||||||||||||||||||||||||||||||||||||||||
| Advertising | 1,050,114 | 10,501,140 | 10,501,140 | 7.5 | % | 10,851,178 | 7.1 | % | 14,234,878 | 7.7 | % | 16,101,748 | 6.9 | % | 14,001,520 | 6.5 | % | 14,001,520 | 6.4 | % | 14,001,520 | 6.4 | % | 14,001,520 | 6.4 | % | 14,001,520 | 6.4 | % | ||||||||||||||||||||||||||||||||
| Prints | 0 | 1,113,203 | 1,309,650 | 0.9 | % | 1,309,650 | 0.9 | % | 1,680,718 | 0.9 | % | 1,993,579 | 0.9 | % | 1,789,856 | 0.8 | % | 1,746,201 | 0.8 | % | 1,746,201 | 0.8 | % | 1,746,201 | 0.8 | % | 1,746,201 | 0.8 | % | ||||||||||||||||||||||||||||||||
Total Publicity Expenses | $ | 3,150,342 | $ | 35,235,923 | $ | 35,432,371 | 25.4 | % | $ | 36,482,485 | 23.9 | % | $ | 47,877,755 | 25.9 | % | $ | 54,373,290 | 23.3 | % | $ | 47,286,816 | 22.0 | % | $ | 47,243,161 | 21.7 | % | $ | 47,243,161 | 21.7 | % | $ | 47,243,161 | 21.7 | % | $ | 47,243,161 | 21.5 | % | |||||||||||||||||||||
Negative Costs, Net of Story Rights Acquisitions | $ | 45,000,000 | $ | 45,000,000 | $ | 45,000,000 | 32.2 | % | $ | 60,000,000 | 39.3 | % | $ | 70,000,000 | 37.9 | % | $ | 60,000,000 | 25.7 | % | $ | 60,000,000 | 27.9 | % | $ | 60,000,000 | 27.5 | % | $ | 60,000,000 | 27.5 | % | $ | 60,000,000 | 27.6 | % | $ | 60,000,000 | 27.4 | % | |||||||||||||||||||||
Net Profit | $ | (48,150,342 | ) | $ | 5,195,054 | $ | 30,793,019 | 22.1 | % | $ | 25,176,855 | 16.5 | % | $ | 30,261,998 | 16.4 | % | $ | 73,174,160 | 31.3 | % | $ | 65,084,672 | 30.2 | % | $ | 67,851,681 | 31.1 | % | $ | 68,123,027 | 31.3 | % | $ | 67,112,146 | 30.9 | % | $ | 68,466,549 | 31.2 | % | ||||||||||||||||||||
Less: | |||||||||||||||||||||||||||||||||||||||||||||||||||||||||||||
Participations (10% of Net Profit each) | |||||||||||||||||||||||||||||||||||||||||||||||||||||||||||||
| Talent | $ | 0 | $ | 519,505 | $ | 3,079,302 | 2.2 | % | $ | 2,517,686 | 1.7 | % | $ | 3,026,200 | 1.6 | % | $ | 7,317,416 | 3.1 | % | $ | 6,508,467 | 3.0 | % | $ | 6,785,168 | 3.1 | % | $ | 6,812,303 | 3.1 | % | $ | 6,711,215 | 3.1 | % | $ | 6,846,655 | 3.1 | % | |||||||||||||||||||||
| Writers | 0 | 519,505 | 3,079,302 | 2.2 | % | 2,517,686 | 1.7 | % | 3,026,200 | 1.6 | % | 7,317,416 | 3.1 | % | 6,508,467 | 3.0 | % | 6,785,168 | 3.1 | % | 6,812,303 | 3.1 | % | 6,711,215 | 3.1 | % | 6,846,655 | 3.1 | % | ||||||||||||||||||||||||||||||||
Total Participations | $ | 0 | $ | 1,039,011 | $ | 6,158,604 | 4.4 | % | $ | 5,035,371 | 3.3 | % | $ | 6,052,400 | 3.3 | % | $ | 14,634,832 | 6.3 | % | $ | 13,016,934 | 6.0 | % | $ | 13,570,336 | 6.2 | % | $ | 13,624,605 | 6.3 | % | $ | 13,422,429 | 6.2 | % | $ | 13,693,310 | 6.2 | % | |||||||||||||||||||||
Net Profit After Participations | $ | (48,150,342 | ) | $ | 4,156,043 | $ | 24,634,415 | 17.6 | % | $ | 20,141,484 | 13.2 | % | $ | 24,209,598 | 13.1 | % | $ | 58,539,328 | 25.0 | % | $ | 52,067,738 | 24.2 | % | $ | 54,281,345 | 24.9 | % | $ | 54,498,422 | 25.0 | % | $ | 53,689,717 | 24.7 | % | $ | 54,773,239 | 25.0 | % | ||||||||||||||||||||
Less: | |||||||||||||||||||||||||||||||||||||||||||||||||||||||||||||
Content Partners (15% of Net Profit after Participations) | $ | 0 | $ | 623,406 | $ | 3,695,162 | 2.6 | % | $ | 3,021,223 | 2.0 | % | $ | 3,631,440 | 2.0 | % | $ | 8,780,899 | 3.8 | % | $ | 7,810,161 | 3.6 | % | $ | 8,142,202 | 3.7 | % | $ | 8,174,763 | 3.8 | % | $ | 8,053,458 | 3.7 | % | $ | 8,215,986 | 3.7 | % | |||||||||||||||||||||
Total Contribution Profit from Joint Venture Films | $ | (48,150,342 | ) | $ | 3,532,637 | $ | 20,939,253 | 15.0 | % | $ | 17,120,262 | 11.2 | % | $ | 20,578,159 | 11.1 | % | $ | 49,758,429 | 21.3 | % | $ | 44,257,577 | 20.6 | % | $ | 46,139,143 | 21.2 | % | $ | 46,323,658 | 21.3 | % | $ | 45,636,259 | 21.0 | % | $ | 46,557,253 | 21.2 | % | ||||||||||||||||||||
Allocation to Platinum Studios, Inc. (30%) | |||||||||||||||||||||||||||||||||||||||||||||||||||||||||||||
Contribution Profit from Joint Venture Films | $ | (14,445,103 | ) | $ | 1,059,791 | $ | 6,281,776 | 4.5 | % | $ | 5,136,078 | 3.4 | % | $ | 6,173,448 | 3.3 | % | $ | 14,927,529 | 6.4 | % | $ | 13,277,273 | 6.2 | % | $ | 13,841,743 | 6.4 | % | $ | 13,897,098 | 6.4 | % | $ | 13,690,878 | 6.3 | % | $ | 13,967,176 | 6.4 | % | ||||||||||||||||||||
Source: Exhibits 8 through 12.
SANLI PASTORE & HILL, INC.
54
Endnotes to Schedule 7
Platinum Studios, Inc.
Date of Value:March 31, 2008
Note 1:
The Joint Venture Film Division model assumes that Platinum forms joint ventures with other studios to produce and distribute low budget films (with average budgets of $15-25 million), and Platinum assumes 30% of all costs and profits.
To estimate the future cash flows generated by the Joint Venture Film Division, we estimated film ultimates based on genre and budget size as presented in Exhibits 8, page 106.
We then estimated the timing of the cash flows in each year, as presented in Exhibit 2, page 98. As such, we developed the cash flows of each individual film in each year based on genre and budget size, as presented in Exhibits 9 to 12, pages 107to 110.
In addition, we also estimated the number of films that Platinum would release per year. Based on Platinum’s business plan, interviews with management and the potential of sequels (SeeEndnote 1 of Schedule 3, page 44), we assumed the number of projects per year would range between 2 and 3.
55
Schedule 8
Platinum Studios, Inc.
Method 1: Discounted Cash Flow Method for the Joint Venture Film Division1
Scenario: Base
Date of Value: March 31, 2008
Apr 1 - Dec 31, 2008 | 2009 | 2010 | 2011 | 2012 | 2013 | 2014 | 2015 | 2016 | 2017 | 2018 | Terminal Year - 2019 | ||||||||||||||||||||||||||
(1) | (2) | (3) | (4) | (5) | (6) | (7) | (8) | (9) | (10) | (11) | (12) | ||||||||||||||||||||||||||
Contribution Profit from Joint Venture Films (Schedule 7) | $ | (10,833,827 | ) | $ | 1,059,791 | $ | 6,281,776 | $ | 5,136,078 | $ | 6,173,448 | $ | 14,927,529 | $ | 13,277,273 | $ | 13,841,743 | $ | 13,897,098 | $ | 13,690,878 | $ | 13,967,176 | ||||||||||||||
Less: Overhead Allocation | (1,125,000 | ) | (1,546,500 | ) | (1,594,442 | ) | (1,643,869 | ) | (1,694,829 | ) | (1,747,369 | ) | (1,801,537 | ) | (1,857,385 | ) | (1,914,964 | ) | (1,974,328 | ) | (2,035,532 | ) | |||||||||||||||
EBITDA from Joint Venture Films | $ | (11,958,827 | ) | $ | (486,709 | ) | $ | 4,687,334 | $ | 3,492,209 | $ | 4,478,618 | $ | 13,180,160 | $ | 11,475,736 | $ | 11,984,358 | $ | 11,982,134 | $ | 11,716,550 | $ | 11,931,644 | |||||||||||||
Less: Depreciation | (375,000 | ) | (500,000 | ) | (500,000 | ) | (500,000 | ) | (500,000 | ) | (500,000 | ) | (500,000 | ) | (500,000 | ) | (500,000 | ) | (500,000 | ) | (500,000 | ) | |||||||||||||||
EBIT from Joint Venture Films | $ | (12,333,827 | ) | $ | (986,709 | ) | $ | 4,187,334 | $ | 2,992,209 | $ | 3,978,618 | $ | 12,680,160 | $ | 10,975,736 | $ | 11,484,358 | $ | 11,482,134 | $ | 11,216,550 | $ | 11,431,644 | |||||||||||||
Less: Taxes (40% tax rate) | 4,933,531 | 394,684 | (1,674,934 | ) | (1,196,884 | ) | (1,591,447 | ) | (5,072,064 | ) | (4,390,294 | ) | (4,593,743 | ) | (4,592,853 | ) | (4,486,620 | ) | (4,572,658 | ) | |||||||||||||||||
Net Income from Joint Venture Films | $ | (7,400,296 | ) | $ | (592,025 | ) | $ | 2,512,401 | $ | 1,795,326 | $ | 2,387,171 | $ | 7,608,096 | $ | 6,585,442 | $ | 6,890,615 | $ | 6,889,280 | $ | 6,729,930 | $ | 6,858,986 | |||||||||||||
Add: Depreciation | 375,000 | 500,000 | 500,000 | 500,000 | 500,000 | 500,000 | 500,000 | 500,000 | 500,000 | 500,000 | 500,000 | ||||||||||||||||||||||||||
Less: Capital Expenditures | (300,000 | ) | (412,000 | ) | (424,360 | ) | (437,091 | ) | (450,204 | ) | (463,710 | ) | (477,621 | ) | (491,950 | ) | (506,708 | ) | (521,909 | ) | (537,567 | ) | |||||||||||||||
Net Cash Flow to MVIC from Joint Venture Films | $ | (7,325,296 | ) | $ | (504,025 | ) | $ | 2,588,041 | $ | 1,858,235 | $ | 2,436,968 | $ | 7,644,386 | $ | 6,607,821 | $ | 6,898,665 | $ | 6,882,572 | $ | 6,708,021 | $ | 6,821,420 | |||||||||||||
Terminal Value Calculation | |||||||||||||||||||||||||||||||||||||
End Year Economic Income (E0) | $ | 6,821,420 | |||||||||||||||||||||||||||||||||||
| Long Term Growth Rate (g) | 3.1 | % | |||||||||||||||||||||||||||||||||||
Terminal Year Economic Income (E1 = E0 x (1+g)) | $ | 7,032,884 | |||||||||||||||||||||||||||||||||||
| Capitalization Rate (discount rate - g) | 13.9 | % | |||||||||||||||||||||||||||||||||||
Terminal Value (V = E1 / capitalization rate) 4 | $ | 50,561,220 | |||||||||||||||||||||||||||||||||||
Discount Rate (Exhibits 6A - 6C)2 | 1.6 | % | 1.6 | % | 17.0 | % | 17.0 | % | 17.0 | % | 17.0 | % | 17.0 | % | 17.0 | % | 17.0 | % | 17.0 | % | 17.0 | % | 17.0 | % | |||||||||||||
Present Value Factor 3 | 0.99 | 0.98 | 0.70 | 0.60 | 0.51 | 0.44 | 0.37 | 0.32 | 0.27 | 0.23 | 0.20 | 0.20 | |||||||||||||||||||||||||
Present Value of Net Cash Flow to MVIC | $ | (7,282,897 | ) | $ | (494,367 | ) | $ | 1,817,491 | $ | 1,115,271 | $ | 1,249,994 | $ | 3,351,035 | $ | 2,475,557 | $ | 2,208,809 | $ | 1,883,312 | $ | 1,568,715 | $ | 1,363,336 | $ | 10,105,218 | |||||||||||
Fair Market Value of Joint Venture Film Division | $ | 19,361,474 | |||||||||||||||||||||||||||||||||||
Note 1: See Endnote 1 to Schedule 4, page 46.
Note 2: See Endnote 2 to Schedule 4, page 46. For years 2008 through 2010, as the Joint Venture Film Division is projected to generate negative cash flow, SP&H applied the 1-year Treasury Securities rate as a discount rate as it represents the alternative investment of a prudent investor.
Note 3: See Endnote 3 to Schedule 4, page 49.
Note 4: See Endnote 4 to Schedule 4, page 49.
SANLI PASTORE & HILL, INC.
56
Schedule 9
Platinum Studios, Inc.
Method 2: Market Multiplier Method for Joint Venture Film Division1
Date of Value: March 31, 2008
Total Number of Characters in Library | 5,622 | ||||||
| Percent of Characters Adaptable to Low Budget Joint Venture Films | 7 | % | |||||
| Number of Characters Adaptable to Low Budget Joint Venture Films | 394 | ||||||
| Market Multiple (Appendix C) | x | $ | 40,000 | ||||
Fair Market Value of Joint Venture Film Division | $ | 15,741,600 |
SANLI PASTORE & HILL, INC.
57
Endnotes to Schedule 9
Platinum Studios, Inc.
Date of Value:March 31, 2008
Note 1
In the market multiplier method, the fair market value of the Intellectual Property in the Joint Venture Film Division was determined by multiplying the number of characters by an appropriate media format adaptation percentage, which we derived based on interviews with management and industry analysis.
To determine the appropriate market multiple, we searched for library transactions in film entertainment industry.We obtained library transaction data from Vogel 2007 and press releases, and made adjustments to the multiples to match the size and nature of the Joint Venture Film Division.(See Appendix C, page 136) To determine the fair market value of the Intellectual Property in Joint Venture Film Division, we utilized the price per feature multiple. Based on our analysis of the Company as well as the industry, competition, and economic conditions for Platinum, we selected the average of low quartile price per feature multiple of $40,000.
58
Schedule 10
Platinum Studios, Inc.
Fair Market Value of Intellectual Property in Joint Venture Film Division
Date of Value: March 31, 2008
Fair Market Value | Weight | Weighted Fair Market Value | ||||||||
Method 1: Discounted Cash Flow Method (Schedule 8) | $ | 19,361,474 | 75 | % | $ | 14,521,106 | ||||
Method 2: Market Multiplier Method (Schedule 9) | $ | 15,741,600 | 25 | % | $ | 3,935,400 | ||||
Fair Market Value of Intellectual Property in Joint Venture Film Division (Rounded) | $ | 18,457,000 | ||||||||
SANLI PASTORE & HILL, INC.
59
Schedule 11
Platinum Studios, Inc.
Film Entertainment: Projected Cash Flow for Film Fund Division1
Date of Value: March 31, 2008
| 2008 | 2009 | 2010 | 2011 | 2012 | 2013 | 2014 | 2015 | 2016 | 2017 | 2018 | |||||||||||||||||||||||||||||||||||||||||||||||||||
| (1) | (2) | (3) | (4) | (5) | (6) | (7) | (8) | (9) | (10) | (11) | |||||||||||||||||||||||||||||||||||||||||||||||||||
Assumptions: | |||||||||||||||||||||||||||||||||||||||||||||||||||||||||||||
| Film Fund Projects Began per Year | 0 | 2 | 3 | 4 | 4 | 4 | 4 | 5 | 5 | 5 | 5 | ||||||||||||||||||||||||||||||||||||||||||||||||||
Projected Cash Flows: | |||||||||||||||||||||||||||||||||||||||||||||||||||||||||||||
Gross Receipts | |||||||||||||||||||||||||||||||||||||||||||||||||||||||||||||
| Domestic Theatrical | $ | 0 | $ | 0 | $ | 13,500,000 | 32.1 | % | $ | 20,250,000 | 26.5 | % | $ | 27,000,000 | 24.7 | % | $ | 27,000,000 | 22.1 | % | $ | 27,000,000 | 21.0 | % | $ | 27,000,000 | 20.3 | % | $ | 33,750,000 | 21.5 | % | $ | 33,750,000 | 20.4 | % | $ | 33,750,000 | 19.9 | % | |||||||||||||||||||||
| International Theatrical | 0 | 0 | 5,984,000 | 14.3 | % | 10,032,000 | 13.1 | % | 13,552,000 | 12.4 | % | 14,080,000 | 11.5 | % | 14,080,000 | 10.9 | % | 14,080,000 | 10.6 | % | 17,072,000 | 10.9 | % | 17,600,000 | 10.6 | % | 17,600,000 | 10.4 | % | ||||||||||||||||||||||||||||||||
| Domestic Home Video | 0 | 0 | 15,795,000 | 37.6 | % | 25,166,700 | 32.9 | % | 35,064,900 | 32.1 | % | 37,276,200 | 30.5 | % | 38,961,000 | 30.3 | % | 39,908,700 | 30.0 | % | 48,438,000 | 30.9 | % | 49,596,300 | 30.0 | % | 50,649,300 | 29.9 | % | ||||||||||||||||||||||||||||||||
| International Home Video | 0 | 0 | 6,318,000 | 15.0 | % | 13,899,600 | 18.2 | % | 19,901,700 | 18.2 | % | 22,807,980 | 18.7 | % | 23,566,140 | 18.3 | % | 24,008,400 | 18.0 | % | 27,483,300 | 17.5 | % | 29,947,320 | 18.1 | % | 30,515,940 | 18.0 | % | ||||||||||||||||||||||||||||||||
| Domestic Television | |||||||||||||||||||||||||||||||||||||||||||||||||||||||||||||
| PPV | 0 | 0 | 50,625 | 0.1 | % | 1,712,813 | 2.2 | % | 2,556,563 | 2.3 | % | 3,375,000 | 2.8 | % | 3,375,000 | 2.6 | % | 3,375,000 | 2.5 | % | 3,400,313 | 2.2 | % | 4,218,750 | 2.5 | % | 4,218,750 | 2.5 | % | ||||||||||||||||||||||||||||||||
| Pay TV | 0 | 0 | 182,250 | 0.4 | % | 4,829,625 | 6.3 | % | 8,535,375 | 7.8 | % | 11,481,750 | 9.4 | % | 12,150,000 | 9.4 | % | 12,150,000 | 9.1 | % | 12,241,125 | 7.8 | % | 14,519,250 | 8.8 | % | 15,187,500 | 9.0 | % | ||||||||||||||||||||||||||||||||
| Network TV | 0 | 0 | 0 | 0.0 | % | 0 | 0.0 | % | 364,500 | 0.3 | % | 1,761,750 | 1.4 | % | 2,916,000 | 2.3 | % | 4,070,250 | 3.1 | % | 4,556,250 | 2.9 | % | 4,799,250 | 2.9 | % | 5,042,250 | 3.0 | % | ||||||||||||||||||||||||||||||||
| Syndicated TV | 0 | 0 | 0 | 0.0 | % | 0 | 0.0 | % | 0 | 0.0 | % | 94,500 | 0.1 | % | 236,250 | 0.2 | % | 425,250 | 0.3 | % | 567,000 | 0.4 | % | 685,125 | 0.4 | % | 779,625 | 0.5 | % | ||||||||||||||||||||||||||||||||
| International Television | |||||||||||||||||||||||||||||||||||||||||||||||||||||||||||||
| Pay TV | 0 | 0 | 0 | 0.0 | % | 348,480 | 0.5 | % | 1,800,480 | 1.6 | % | 3,310,560 | 2.7 | % | 4,297,920 | 3.3 | % | 4,646,400 | 3.5 | % | 4,646,400 | 3.0 | % | 4,820,640 | 2.9 | % | 5,459,520 | 3.2 | % | ||||||||||||||||||||||||||||||||
| Syndicated TV | 0 | 0 | 0 | 0.0 | % | 0 | 0.0 | % | 0 | 0.0 | % | 704,000 | 0.6 | % | 1,760,000 | 1.4 | % | 3,168,000 | 2.4 | % | 4,224,000 | 2.7 | % | 5,104,000 | 3.1 | % | 5,808,000 | 3.4 | % | ||||||||||||||||||||||||||||||||
| Domestic Merchandising | 0 | 0 | 98,102 | 0.2 | % | 156,309 | 0.2 | % | 217,786 | 0.2 | % | 231,520 | 0.2 | % | 241,984 | 0.2 | % | 249,178 | 0.2 | % | 302,807 | 0.2 | % | 310,656 | 0.2 | % | 316,542 | 0.2 | % | ||||||||||||||||||||||||||||||||
| International Merchandising | 0 | 0 | 63,948 | 0.2 | % | 101,890 | 0.1 | % | 141,964 | 0.1 | % | 150,917 | 0.1 | % | 157,738 | 0.1 | % | 162,427 | 0.1 | % | 197,386 | 0.1 | % | 202,501 | 0.1 | % | 206,338 | 0.1 | % | ||||||||||||||||||||||||||||||||
Total Gross Receipts | $ | 0 | $ | 0 | $ | 41,991,925 | 100.0 | % | $ | 76,497,416 | 100.0 | % | $ | 109,135,268 | 100.0 | % | $ | 122,274,177 | 100.0 | % | $ | 128,742,032 | 100.0 | % | $ | 133,243,606 | 100.0 | % | $ | 156,878,581 | 100.0 | % | $ | 165,553,792 | 100.0 | % | $ | 169,533,765 | 100.0 | % | |||||||||||||||||||||
Distribution Costs | |||||||||||||||||||||||||||||||||||||||||||||||||||||||||||||
| Domestic Theatrical | $ | 0 | $ | 0 | $ | 2,700,000 | 6.4 | % | $ | 4,050,000 | 5.3 | % | $ | 5,400,000 | 4.9 | % | $ | 5,400,000 | 4.4 | % | $ | 5,400,000 | 4.2 | % | $ | 5,400,000 | 4.1 | % | $ | 6,750,000 | 4.3 | % | $ | 6,750,000 | 4.1 | % | $ | 6,750,000 | 4.0 | % | |||||||||||||||||||||
| International Theatrical | 0 | 0 | 1,196,800 | 2.9 | % | 2,006,400 | 2.6 | % | 2,710,400 | 2.5 | % | 2,816,000 | 2.3 | % | 2,816,000 | 2.2 | % | 2,816,000 | 2.1 | % | 3,414,400 | 2.2 | % | 3,520,000 | 2.1 | % | 3,520,000 | 2.1 | % | ||||||||||||||||||||||||||||||||
| Domestic Home Video | 0 | 0 | 2,948,400 | 7.0 | % | 4,633,200 | 6.1 | % | 6,381,180 | 5.8 | % | 6,697,080 | 5.5 | % | 6,970,860 | 5.4 | % | 7,223,580 | 5.4 | % | 8,950,500 | 5.7 | % | 9,308,520 | 5.6 | % | 9,645,480 | 5.7 | % | ||||||||||||||||||||||||||||||||
| International Home Video | 0 | 0 | 1,137,240 | 2.7 | % | 2,539,836 | 3.3 | % | 3,651,804 | 3.3 | % | 4,233,060 | 3.5 | % | 4,422,600 | 3.4 | % | 4,561,596 | 3.4 | % | 5,243,940 | 3.3 | % | 5,762,016 | 3.5 | % | 5,926,284 | 3.5 | % | ||||||||||||||||||||||||||||||||
| Domestic Television Cost | 0 | 0 | 106,650 | 0.3 | % | 1,226,475 | 1.6 | % | 2,239,650 | 2.1 | % | 3,199,500 | 2.6 | % | 3,626,100 | 2.8 | % | 3,828,735 | 2.9 | % | 3,999,375 | 2.5 | % | 4,617,945 | 2.8 | % | 4,916,565 | 2.9 | % | ||||||||||||||||||||||||||||||||
| International Television Cost | 0 | 0 | 58,432 | 0.1 | % | 671,968 | 0.9 | % | 1,227,072 | 1.1 | % | 1,752,960 | 1.4 | % | 1,986,688 | 1.5 | % | 2,097,709 | 1.6 | % | 2,191,200 | 1.4 | % | 2,530,106 | 1.5 | % | 2,693,715 | 1.6 | % | ||||||||||||||||||||||||||||||||
Total Distribution Costs | $ | 0 | $ | 0 | $ | 8,147,522 | 19.4 | % | $ | 15,127,879 | 19.8 | % | $ | 21,610,106 | 19.8 | % | $ | 24,098,600 | 19.7 | % | $ | 25,222,248 | 19.6 | % | $ | 25,927,620 | 19.5 | % | $ | 30,549,415 | 19.5 | % | $ | 32,488,587 | 19.6 | % | $ | 33,452,044 | 19.7 | % | |||||||||||||||||||||
Publicity Expenses | |||||||||||||||||||||||||||||||||||||||||||||||||||||||||||||
| Domestic Theatrical | |||||||||||||||||||||||||||||||||||||||||||||||||||||||||||||
| Advertising | $ | 0 | $ | 933,435 | $ | 9,801,064 | 23.3 | % | $ | 14,468,237 | 18.9 | % | $ | 18,668,693 | 17.1 | % | $ | 18,668,693 | 15.3 | % | $ | 18,668,693 | 14.5 | % | $ | 19,135,410 | 14.4 | % | $ | 23,335,866 | 14.9 | % | $ | 23,335,866 | 14.1 | % | $ | 23,335,866 | 13.8 | % | |||||||||||||||||||||
| Prints | 0 | 0 | 1,164,134 | 2.8 | % | 1,746,201 | 2.3 | % | 2,328,267 | 2.1 | % | 2,328,267 | 1.9 | % | 2,328,267 | 1.8 | % | 2,328,267 | 1.7 | % | 2,910,334 | 1.9 | % | 2,910,334 | 1.8 | % | 2,910,334 | 1.7 | % | ||||||||||||||||||||||||||||||||
| International Theatrical | |||||||||||||||||||||||||||||||||||||||||||||||||||||||||||||
| Advertising | 0 | 466,717 | 4,900,532 | 11.7 | % | 7,234,119 | 9.5 | % | 9,334,347 | 8.6 | % | 9,334,347 | 7.6 | % | 9,334,347 | 7.3 | % | 9,567,705 | 7.2 | % | 11,667,933 | 7.4 | % | 11,667,933 | 7.0 | % | 11,667,933 | 6.9 | % | ||||||||||||||||||||||||||||||||
| Prints | 0 | 0 | 494,757 | 1.2 | % | 829,445 | 1.1 | % | 1,120,479 | 1.0 | % | 1,164,134 | 1.0 | % | 1,164,134 | 0.9 | % | 1,164,134 | 0.9 | % | 1,411,512 | 0.9 | % | 1,455,167 | 0.9 | % | 1,455,167 | 0.9 | % | ||||||||||||||||||||||||||||||||
Total Publicity Expenses | $ | 0 | $ | 1,400,152 | $ | 16,360,486 | 39.0 | % | $ | 24,278,002 | 31.7 | % | $ | 31,451,786 | 28.8 | % | $ | 31,495,441 | 25.8 | % | $ | 31,495,441 | 24.5 | % | $ | 32,195,517 | 24.2 | % | $ | 39,325,646 | 25.1 | % | $ | 39,369,301 | 23.8 | % | $ | 39,369,301 | 23.2 | % | |||||||||||||||||||||
Negative Costs, Net of Story Rights Acquisitions | $ | 0 | $ | 20,000,000 | $ | 30,000,000 | 71.4 | % | $ | 40,000,000 | 52.3 | % | $ | 40,000,000 | 36.7 | % | $ | 40,000,000 | 32.7 | % | $ | 40,000,000 | 31.1 | % | $ | 50,000,000 | 37.5 | % | $ | 50,000,000 | 31.9 | % | $ | 50,000,000 | 30.2 | % | $ | 50,000,000 | 29.5 | % | |||||||||||||||||||||
Net Profit | $ | 0 | $ | (21,400,152 | ) | $ | (12,516,084 | ) | -29.8 | % | $ | (2,908,464 | ) | -3.8 | % | $ | 16,073,376 | 14.7 | % | $ | 26,680,136 | 21.8 | % | $ | 32,024,344 | 24.9 | % | $ | 25,120,469 | 18.9 | % | $ | 37,003,520 | 23.6 | % | $ | 43,695,904 | 26.4 | % | $ | 46,712,420 | 27.6 | % | ||||||||||||||||||
Less: | |||||||||||||||||||||||||||||||||||||||||||||||||||||||||||||
Participations (10% of Net Profit each) | |||||||||||||||||||||||||||||||||||||||||||||||||||||||||||||
| Talent | $ | 0 | $ | 0 | $ | 0 | 0.0 | % | $ | 0 | 0.0 | % | $ | 1,607,338 | 1.5 | % | $ | 2,668,014 | 2.2 | % | $ | 3,202,434 | 2.5 | % | $ | 2,512,047 | 1.9 | % | $ | 3,700,352 | 2.4 | % | $ | 4,369,590 | 2.6 | % | $ | 4,671,242 | 2.8 | % | |||||||||||||||||||||
| Writers | 0 | 0 | 0 | 0.0 | % | 0 | 0.0 | % | 1,607,338 | 1.5 | % | 2,668,014 | 2.2 | % | 3,202,434 | 2.5 | % | 2,512,047 | 1.9 | % | 3,700,352 | 2.4 | % | 4,369,590 | 2.6 | % | 4,671,242 | 2.8 | % | ||||||||||||||||||||||||||||||||
Total Participation | $ | 0 | $ | 0 | $ | 0 | 0.0 | % | $ | 0 | 0.0 | % | $ | 3,214,675 | 2.9 | % | $ | 5,336,027 | 4.4 | % | $ | 6,404,869 | 5.0 | % | $ | 5,024,094 | 3.8 | % | $ | 7,400,704 | 4.7 | % | $ | 8,739,181 | 5.3 | % | $ | 9,342,484 | 5.5 | % | |||||||||||||||||||||
Net Profit After Participations | $ | 0 | $ | (21,400,152 | ) | $ | (12,516,084 | ) | -29.8 | % | $ | (2,908,464 | ) | -3.8 | % | $ | 12,858,701 | 11.8 | % | $ | 21,344,109 | 17.5 | % | $ | 25,619,475 | 19.9 | % | $ | 20,096,376 | 15.1 | % | $ | 29,602,816 | 18.9 | % | $ | 34,956,724 | 21.1 | % | $ | 37,369,936 | 22.0 | % | ||||||||||||||||||
Less: | |||||||||||||||||||||||||||||||||||||||||||||||||||||||||||||
ContentPartners(15% of Net Profit after Participations) | $ | 0 | $ | 0 | $ | 0 | 0.0 | % | $ | 0 | 0.0 | % | $ | 1,928,805 | 1.8 | % | $ | 3,201,616 | 2.6 | % | $ | 3,842,921 | 3.0 | % | $ | 3,014,456 | 2.3 | % | $ | 4,440,422 | 2.8 | % | $ | 5,243,509 | 3.2 | % | $ | 5,605,490 | 3.3 | % | |||||||||||||||||||||
Contribution Profit from Film Fund Films | $ | 0 | $ | (21,400,152 | ) | $ | (12,516,084 | ) | -29.8 | % | $ | (2,908,464 | ) | -3.8 | % | $ | 10,929,896 | 10.0 | % | $ | 18,142,493 | 14.8 | % | $ | 21,776,554 | 16.9 | % | $ | 17,081,919 | 12.8 | % | $ | 25,162,393 | 16.0 | % | $ | 29,713,215 | 17.9 | % | $ | 31,764,445 | 18.7 | % | ||||||||||||||||||
Source: Exhibits 13 and 14.
SANLI PASTORE & HILL, INC.
60
Endnotes to Schedule 11
Platinum Studios, Inc.
Date of Value:March 31, 2008
Note 1:
The Film Fund Division model assumes that Platinum finances 100% of low budget Indie films (with average budgets of $10 million) via the Film Fund.
The Film Fund, formed by Platinum, intends to raise capital for and finance (“slate financing”) 5 to 15 Indie films including the following:Hunter, Hive, Blood Nation, Red Mantis, The Darkness, Dead of Night, Chain, The Disciple, Final Orbit, Ghosting, Gun Gallon, Nightfall, Three Hanged Men, Consumed,and American Wasteland.
To estimate the future cash flows generated by the Film Fund Division, we estimated film ultimates as presented in Exhibit 13, page 111.
We then estimated the timing of the cash flows in each year, as presented in Exhibit 2, page 98. As such, we developed the cash flows of each individual film in each year based on genre and budget size, as presented in Exhibit 14, pages 112.
In addition, we also estimated the number of films that Platinum would release per year in the Film Fund Division. Based on Platinum’s business plan, interviews with management and the potential of sequels (SeeEndnote 1 of Schedule 3, page 44), we assumed the number of projects per year would range between 0 and 5.
61
Schedule 12
Platinum Studios, Inc.
Method 1: Discounted Cash Flow Method for the Film Fund Division1
Date of Value: March 31, 2008
Apr 1 - Dec 31, 2008 | 2009 | 2010 | 2011 | 2012 | 2013 | 2014 | 2015 | 2016 | 2017 | 2018 | Terminal Year - 2019 | ||||||||||||||||||||||||||
(1) | (2) | (3) | (4) | (5) | (6) | (7) | (8) | (9) | (10) | (11) | (12) | ||||||||||||||||||||||||||
Contribution Profit from Film Fund Films | $ | 0 | $ | (21,400,152 | ) | $ | (12,516,084 | ) | $ | (2,908,464 | ) | $ | 10,929,896 | $ | 18,142,493 | $ | 21,776,554 | $ | 17,081,919 | $ | 25,162,393 | $ | 29,713,215 | $ | 31,764,445 | ||||||||||||
Less: Overhead Allocation | 0 | (1,500,000 | ) | (1,546,500 | ) | (1,594,442 | ) | (1,643,869 | ) | (1,694,829 | ) | (1,747,369 | ) | (1,801,537 | ) | (1,857,385 | ) | (1,914,964 | ) | (1,974,328 | ) | ||||||||||||||||
EBITDA from Film Fund Films | $ | 0 | $ | (22,900,152 | ) | $ | (14,062,584 | ) | $ | (4,502,906 | ) | $ | 9,286,026 | $ | 16,447,664 | $ | 20,029,185 | $ | 15,280,382 | $ | 23,305,008 | $ | 27,798,251 | $ | 29,790,118 | ||||||||||||
Less: Depreciation | 0 | (550,000 | ) | (550,000 | ) | (550,000 | ) | (550,000 | ) | (550,000 | ) | (550,000 | ) | (550,000 | ) | (550,000 | ) | (550,000 | ) | (550,000 | ) | ||||||||||||||||
EBIT from Film Fund Films | $ | 0 | $ | (23,450,152 | ) | $ | (14,612,584 | ) | $ | (5,052,906 | ) | $ | 8,736,026 | $ | 15,897,664 | $ | 19,479,185 | $ | 14,730,382 | $ | 22,755,008 | $ | 27,248,251 | $ | 29,240,118 | ||||||||||||
Less: Taxes (40% tax rate) | 0 | 9,380,061 | 5,845,034 | 2,021,162 | (3,494,411 | ) | (6,359,065 | ) | (7,791,674 | ) | (5,892,153 | ) | (9,102,003 | ) | (10,899,300 | ) | (11,696,047 | ) | |||||||||||||||||||
Net Income from Film Fund Films | $ | 0 | $ | (14,070,091 | ) | $ | (8,767,550 | ) | $ | (3,031,743 | ) | $ | 5,241,616 | $ | 9,538,598 | $ | 11,687,511 | $ | 8,838,229 | $ | 13,653,005 | $ | 16,348,951 | $ | 17,544,071 | ||||||||||||
Add: Depreciation | 0 | 550,000 | 550,000 | 550,000 | 550,000 | 550,000 | 550,000 | 550,000 | 550,000 | 550,000 | 550,000 | ||||||||||||||||||||||||||
Less: Capital Expenditures | 0 | (750,000 | ) | (772,500 | ) | (795,675 | ) | (819,545 | ) | (844,132 | ) | (869,456 | ) | (895,539 | ) | (922,405 | ) | (950,078 | ) | (978,580 | ) | ||||||||||||||||
Net Cash Flow to MVIC from Film Fund Films | $ | 0 | $ | (14,270,091 | ) | $ | (8,990,050 | ) | $ | (3,277,418 | ) | $ | 4,972,071 | $ | 9,244,467 | $ | 11,368,055 | $ | 8,492,690 | $ | 13,280,600 | $ | 15,948,873 | $ | 17,115,491 | ||||||||||||
Terminal Value Calculation | |||||||||||||||||||||||||||||||||||||
End Year Economic Income (E0) | $ | 17,115,491 | |||||||||||||||||||||||||||||||||||
| Long Term Growth Rate (g) | 3.1 | % | |||||||||||||||||||||||||||||||||||
Terminal Year Economic Income (E1 = E0 x (1+g)) | $ | 17,646,071 | |||||||||||||||||||||||||||||||||||
| Capitalization Rate (discount rate - g) | 13.9 | % | |||||||||||||||||||||||||||||||||||
Terminal Value (V = E1 / capitalization rate)4 | $ | 126,862,164 | |||||||||||||||||||||||||||||||||||
Discount Rate (Exhibits 6A - 6C)2 | 1.6 | % | 1.6 | % | 1.6 | % | 1.6 | % | 17.0 | % | 17.0 | % | 17.0 | % | 17.0 | % | 17.0 | % | 17.0 | % | 17.0 | % | 17.0 | % | |||||||||||||
Present Value Factor3 | 0.99 | 0.98 | 0.97 | 0.95 | 0.51 | 0.44 | 0.37 | 0.32 | 0.27 | 0.23 | 0.20 | 0.20 | |||||||||||||||||||||||||
Present Value of Net Cash Flow to MVIC | $ | 0 | $ | (13,996,627 | ) | $ | (8,682,325 | ) | $ | (3,116,615 | ) | $ | 2,550,324 | $ | 4,052,455 | $ | 4,258,934 | $ | 2,719,182 | $ | 3,634,035 | $ | 3,729,751 | $ | 3,420,720 | $ | 25,354,804 | ||||||||||
Fair Market Value of Film Fund Division | $ | 23,924,637 | |||||||||||||||||||||||||||||||||||
Note 1: See Endnote 1 to Schedule 4, page 46.
Note 2: See Endnote 2 to Schedule 4, page 46. For years 2008 through 2010, as the Film Fund Division is projected to generate negative cash flow, SP&H applied the 1-year Treasury Securities rate as a discount rate as it represents the alternative investment of a prudent investor.
Note 3: See Endnote 3 to Schedule 4, page 49.
Note 4: See Endnote 4 to Schedule 4, page 49.
SANLI PASTORE & HILL, INC.
62
Schedule 13
Platinum Studios, Inc.
Method 2: Market Multiplier Method for Film Fund Division1
Date of Value: March 31, 2008
Total Number of Characters in Library | 5,622 | ||||||
| Percent of Characters Adaptable to Low Budget Film Fund Films | 10 | % | |||||
| Number of Characters Adaptable to Low Budget Film Fund Films | 562 | ||||||
| Market Multiple (Appendix C) | x | $ | 40,000 | ||||
Fair Market Value of Film Fund Division | $ | 22,488,000 |
SANLI PASTORE & HILL, INC.
63
Endnotes to Schedule 13
Platinum Studios, Inc.
Date of Value:March 31, 2008
Note 1
In the market multiplier method, the fair market value of the Intellectual Property in the Film Fund Division was determined by multiplying the number of characters by an appropriate media format adaptation percentage, which we derived based on interviews with management and industry analysis.
To determine the appropriate market multiple, we searched for library transactions in film entertainment industry.We obtained library transaction data from Vogel 2007 and press releases, and made adjustments to the multiples to match the size and nature of theFilm Fund Division.(See Appendix C, page 136.) To determine the fair market value of the Intellectual Property inFilm Fund Division, we utilized the price per feature multiple. Based on our analysis of the Company as well as the industry, competition, and economic conditions for Platinum, we selected the price per feature multiple of $40,000 which falls between the minimum and lower quartile of the multiples.
64
Schedule 14
Platinum Studios, Inc.
Fair Market Value of Intellectual Property in Film Fund Division
Date of Value: March 31, 2008
Fair Market Value | Weight | Weighted Fair Market Value | ||||||||
Method 1: Discounted Cash Flow Method (Schedule 12) | $ | 23,924,637 | 75 | % | $ | 17,943,478 | ||||
Method 2: Market Multiplier Method (Schedule 13) | $ | 22,488,000 | 25 | % | $ | 5,622,000 | ||||
Fair Market Value of Intellectual Property in Film Fund Division (Rounded) | $ | 23,565,000 | ||||||||
SANLI PASTORE & HILL, INC.
65
Schedule 15
Platinum Studios, Inc.
Film Entertainment: Projected Cash Flow for Direct to DVD Division1
Date of Value: March 31, 2008
| 2008 | 2009 | 2010 | 2011 | 2012 | 2013 | 2014 | 2015 | 2016 | 2017 | 2018 | |||||||||||||||||||||||||||||||||||||||||||||||||||
| (1) | (2) | (3) | (4) | (5) | (6) | (7) | (8) | (9) | (10) | (11) | |||||||||||||||||||||||||||||||||||||||||||||||||||
Assumptions: | |||||||||||||||||||||||||||||||||||||||||||||||||||||||||||||
| Direct to DVD Projects Began per Year | 0 | 2 | 4 | 4 | 5 | 6 | 7 | 7 | 7 | 7 | 7 | ||||||||||||||||||||||||||||||||||||||||||||||||||
Projected Cash Flows: | |||||||||||||||||||||||||||||||||||||||||||||||||||||||||||||
Gross Receipts | |||||||||||||||||||||||||||||||||||||||||||||||||||||||||||||
| Home Video | 0 | 0 | 4,380,000 | 97.6 | % | 9,307,500 | 81.4 | % | 10,128,750 | 69.7 | % | 12,647,250 | 71.6 | % | 15,220,500 | 70.8 | % | 17,930,625 | 70.4 | % | 18,450,750 | 67.8 | % | 18,697,125 | 67.3 | % | 18,834,000 | 67.1 | % | ||||||||||||||||||||||||||||||||
| Television | |||||||||||||||||||||||||||||||||||||||||||||||||||||||||||||
| PPV | 0 | 0 | 109,500 | 2.4 | % | 219,000 | 1.9 | % | 219,000 | 1.5 | % | 273,750 | 1.5 | % | 328,500 | 1.5 | % | 383,250 | 1.5 | % | 383,250 | 1.4 | % | 383,250 | 1.4 | % | 383,250 | 1.4 | % | ||||||||||||||||||||||||||||||||
| Pay TV/ Free TV | 0 | 0 | 0 | 0.0 | % | 1,901,194 | 16.6 | % | 4,182,626 | 28.8 | % | 4,752,984 | 26.9 | % | 5,957,074 | 27.7 | % | 7,161,163 | 28.1 | % | 8,396,939 | 30.8 | % | 8,713,805 | 31.4 | % | 8,840,551 | 31.5 | % | ||||||||||||||||||||||||||||||||
Total Gross Receipts | $ | 0 | $ | 0 | $ | 4,489,500 | 100.0 | % | $ | 11,427,694 | 100.0 | % | $ | 14,530,376 | 100.0 | % | $ | 17,673,984 | 100.0 | % | $ | 21,506,074 | 100.0 | % | $ | 25,475,038 | 100.0 | % | $ | 27,230,939 | 100.0 | % | $ | 27,794,180 | �� | 100.0 | % | $ | 28,057,801 | 100.0 | % | ||||||||||||||||||||
Distribution Costs | |||||||||||||||||||||||||||||||||||||||||||||||||||||||||||||
| Home Video | 0 | 0 | 1,533,000 | 34.1 | % | 3,257,625 | 28.5 | % | 3,545,063 | 24.4 | % | 4,426,538 | 25.0 | % | 5,327,175 | 24.8 | % | 6,275,719 | 24.6 | % | 6,457,763 | 23.7 | % | 6,543,994 | 23.5 | % | 6,591,900 | 23.5 | % | ||||||||||||||||||||||||||||||||
| Television Cost | 0 | 0 | 0 | 0.0 | % | 99,166 | 0.9 | % | 218,165 | 1.5 | % | 247,915 | 1.4 | % | 310,720 | 1.4 | % | 373,525 | 1.5 | % | 437,983 | 1.6 | % | 454,511 | 1.6 | % | 461,122 | 1.6 | % | ||||||||||||||||||||||||||||||||
Total Distribution Costs | $ | 0 | $ | 0 | $ | 1,533,000 | 34.1 | % | $ | 3,356,791 | 29.4 | % | $ | 3,763,228 | 25.9 | % | $ | 4,674,452 | 26.4 | % | $ | 5,637,895 | 26.2 | % | $ | 6,649,244 | 26.1 | % | $ | 6,895,745 | 25.3 | % | $ | 6,998,504 | 25.2 | % | $ | 7,053,022 | 25.1 | % | |||||||||||||||||||||
Negative Costs, Net of Story Rights Acquisitions | $ | 0 | $ | 750,000 | $ | 3,750,000 | 83.5 | % | $ | 6,000,000 | 52.5 | % | $ | 6,375,000 | 43.9 | % | $ | 7,875,000 | 44.6 | % | $ | 9,375,000 | 43.6 | % | $ | 10,500,000 | 41.2 | % | $ | 10,500,000 | 38.6 | % | $ | 10,500,000 | 37.8 | % | $ | 10,500,000 | 37.4 | % | |||||||||||||||||||||
Net Profit | $ | 0 | $ | (750,000 | ) | $ | (793,500 | ) | -17.7 | % | $ | 2,070,903 | 18.1 | % | $ | 4,392,149 | 30.2 | % | $ | 5,124,532 | 29.0 | % | $ | 6,493,179 | 30.2 | % | $ | 8,325,794 | 32.7 | % | $ | 9,835,194 | 36.1 | % | $ | 10,295,675 | 37.0 | % | $ | 10,504,779 | 37.4 | % | |||||||||||||||||||
Less: | |||||||||||||||||||||||||||||||||||||||||||||||||||||||||||||
Participations (10% of Net Profit each) | |||||||||||||||||||||||||||||||||||||||||||||||||||||||||||||
| Talent | $ | 0 | $ | 0 | $ | 0 | 0.0 | % | $ | 207,090 | 1.8 | % | $ | 439,215 | 3.0 | % | $ | 512,453 | 2.9 | % | $ | 649,318 | 3.0 | % | $ | 832,579 | 3.3 | % | $ | 983,519 | 3.6 | % | $ | 1,029,568 | 3.7 | % | $ | 1,050,478 | 3.7 | % | |||||||||||||||||||||
| Writers | 0 | 0 | 0 | 0.0 | % | 207,090 | 1.8 | % | 439,215 | 3.0 | % | 512,453 | 2.9 | % | 649,318 | 3.0 | % | 832,579 | 3.3 | % | 983,519 | 3.6 | % | 1,029,568 | 3.7 | % | 1,050,478 | 3.7 | % | ||||||||||||||||||||||||||||||||
Total Participation | $ | 0 | $ | 0 | $ | 0 | 0.0 | % | $ | 414,181 | 3.6 | % | $ | 878,430 | 6.0 | % | $ | 1,024,906 | 5.8 | % | $ | 1,298,636 | 6.0 | % | $ | 1,665,159 | 6.5 | % | $ | 1,967,039 | 7.2 | % | $ | 2,059,135 | 7.4 | % | $ | 2,100,956 | 7.5 | % | |||||||||||||||||||||
Net Profit After Participations | $ | 0 | $ | (750,000 | ) | $ | (793,500 | ) | -17.7 | % | $ | 1,656,722 | 14.5 | % | $ | 3,513,719 | 24.2 | % | $ | 4,099,626 | 23.2 | % | $ | 5,194,543 | 24.2 | % | $ | 6,660,635 | 26.1 | % | $ | 7,868,155 | 28.9 | % | $ | 8,236,540 | 29.6 | % | $ | 8,403,823 | 30.0 | % | |||||||||||||||||||
Less: | |||||||||||||||||||||||||||||||||||||||||||||||||||||||||||||
Content Partners (15% of Net Profit after Participations) | $ | 0 | $ | 0 | $ | 0 | 0.0 | % | $ | 248,508 | 2.2 | % | $ | 527,058 | 3.6 | % | $ | 614,944 | 3.5 | % | $ | 779,181 | 3.6 | % | $ | 999,095 | 3.9 | % | $ | 1,180,223 | 4.3 | % | $ | 1,235,481 | 4.4 | % | $ | 1,260,574 | 4.5 | % | |||||||||||||||||||||
Contribution Profit from Direct to DVD Films | $ | 0 | $ | (750,000 | ) | $ | (793,500 | ) | -17.7 | % | $ | 1,408,214 | 12.3 | % | $ | 2,986,661 | 20.6 | % | $ | 3,484,682 | 19.7 | % | $ | 4,415,362 | 20.5 | % | $ | 5,661,540 | 22.2 | % | $ | 6,687,932 | 24.6 | % | $ | 7,001,059 | 25.2 | % | $ | 7,143,250 | 25.5 | % | |||||||||||||||||||
Source: Exhibits 15 through 17.
SANLI PASTORE & HILL, INC.
66
Endnotes to Schedule 15
Platinum Studios, Inc.
Date of Value:March 31, 2008
Note 1:
The Direct to DVD Division model assumes that Platinum finances 100% of Direct to DVD films (with average budgets of $1.5 million) via private financing.
To estimate the future cash flows generated by the Direct to DVD Division, we estimated average film ultimates as presented in Exhibit 15, page 113.
We then estimated the timing of the cash flows in each year, as presented in Exhibit 16, page 114. As such, we developed the cash flows of each individual film in each year, as presented in Exhibit 17, page 115.
In addition, we also estimated the number of films that Platinum would release per year in the Direct to DVD Division. Based on Platinum’s business plan, interviews with management and the potential of sequels (SeeEndnote 1 of Schedule 3, page 44), we assumed the number of projects per year would range between 0 and 7.
67
Schedule 16
Platinum Studios, Inc.
Method 1: Discounted Cash Flow Method for the Direct to DVD Film Division1
Date of Value: March 31, 2008
Apr 1 - Dec 31, 2008 | 2009 | 2010 | 2011 | 2012 | 2013 | 2014 | 2015 | 2016 | 2017 | 2018 | Terminal Year - 2019 | ||||||||||||||||||||||||||
(1) | (2) | (3) | (4) | (5) | (6) | (7) | (8) | (9) | (10) | (11) | (12) | ||||||||||||||||||||||||||
Contribution Profit from Direct to DVD Films | $ | 0 | $ | (750,000 | ) | $ | (793,500 | ) | $ | 1,408,214 | $ | 2,986,661 | $ | 3,484,682 | $ | 4,415,362 | $ | 5,661,540 | $ | 6,687,932 | $ | 7,001,059 | $ | 7,143,250 | |||||||||||||
Less: Overhead Allocation | 0 | (700,000 | ) | (721,700 | ) | (744,073 | ) | (767,139 | ) | (790,920 | ) | (815,439 | ) | (840,717 | ) | (866,780 | ) | (893,650 | ) | (921,353 | ) | ||||||||||||||||
EBITDA from Direct to DVD Films | $ | 0 | $ | (1,450,000 | ) | $ | (1,515,200 | ) | $ | 664,141 | $ | 2,219,522 | $ | 2,693,762 | $ | 3,599,923 | $ | 4,820,823 | $ | 5,821,152 | $ | 6,107,409 | $ | 6,221,897 | |||||||||||||
Less: Depreciation | 0 | (450,000 | ) | (450,000 | ) | (450,000 | ) | (450,000 | ) | (450,000 | ) | (450,000 | ) | (450,000 | ) | (450,000 | ) | (450,000 | ) | (450,000 | ) | ||||||||||||||||
EBIT from Direct to DVD Films | $ | 0 | $ | (1,900,000 | ) | $ | (1,965,200 | ) | $ | 214,141 | $ | 1,769,522 | $ | 2,243,762 | $ | 3,149,923 | $ | 4,370,823 | $ | 5,371,152 | $ | 5,657,409 | $ | 5,771,897 | |||||||||||||
Less: Taxes (40% tax rate) | 0 | 760,000 | 786,080 | (85,656 | ) | (707,809 | ) | (897,505 | ) | (1,259,969 | ) | (1,748,329 | ) | (2,148,461 | ) | (2,262,964 | ) | (2,308,759 | ) | ||||||||||||||||||
Net Income from Direct to DVD Films | $ | 0 | $ | (1,140,000 | ) | $ | (1,179,120 | ) | $ | 128,485 | $ | 1,061,713 | $ | 1,346,257 | $ | 1,889,954 | $ | 2,622,494 | $ | 3,222,691 | $ | 3,394,446 | $ | 3,463,138 | |||||||||||||
Add: Depreciation | 0 | 450,000 | 450,000 | 450,000 | 450,000 | 450,000 | 450,000 | 450,000 | 450,000 | 450,000 | 450,000 | ||||||||||||||||||||||||||
Less: Capital Expenditures | 0 | (250,000 | ) | (257,500 | ) | (265,225 | ) | (273,182 | ) | (281,377 | ) | (289,819 | ) | (298,513 | ) | (307,468 | ) | (316,693 | ) | (326,193 | ) | ||||||||||||||||
Net Cash Flow to MVIC from Direct to DVD Films | $ | 0 | $ | (940,000 | ) | $ | (986,620 | ) | $ | 313,260 | $ | 1,238,532 | $ | 1,514,880 | $ | 2,050,135 | $ | 2,773,981 | $ | 3,365,223 | $ | 3,527,753 | $ | 3,586,945 | |||||||||||||
Terminal Value Calculation | |||||||||||||||||||||||||||||||||||||
End Year Economic Income (E0) | $ | 3,586,945 | |||||||||||||||||||||||||||||||||||
| Long Term Growth Rate (g) | 3.1 | % | |||||||||||||||||||||||||||||||||||
Terminal Year Economic Income (E1 = E0 x (1+g)) | $ | 3,698,140 | |||||||||||||||||||||||||||||||||||
| Capitalization Rate (discount rate - g) | 13.9 | % | |||||||||||||||||||||||||||||||||||
Terminal Value (V = E1 / capitalization rate)4 | $ | 26,586,885 | |||||||||||||||||||||||||||||||||||
Discount Rate (Exhibits 6A - 6C)2 | 1.6 | % | 1.6 | % | 1.6 | % | 17.0 | % | 17.0 | % | 17.0 | % | 17.0 | % | 17.0 | % | 17.0 | % | 17.0 | % | 17.0 | % | 17.0 | % | |||||||||||||
Present Value Factor3 | 0.99 | 0.98 | 0.97 | 0.60 | 0.51 | 0.44 | 0.37 | 0.32 | 0.27 | 0.23 | 0.20 | 0.20 | |||||||||||||||||||||||||
Present Value of Net Cash Flow to MVIC | $ | 0 | $ | (921,986 | ) | $ | (952,849 | ) | $ | 188,011 | $ | 635,280 | $ | 664,071 | $ | 768,064 | $ | 888,171 | $ | 920,842 | $ | 824,989 | $ | 716,891 | $ | 5,313,683 | |||||||||||
Fair Market Value of Direct to DVD Film Division | $ | 9,045,166 | |||||||||||||||||||||||||||||||||||
Note 1: See Endnote 1 to Schedule 4, page 46.
Note 2: See Endnote 2 to Schedule 4, page 46. For years 2008 through 2010, as the Direct to DVD Division is projected to generate negative cash flow, SP&H applied the 1-year Treasury Securities rate as a discount rate as it represents the alternative investment of a prudent investor.
Note 3: See Endnote 3 to Schedule 4, page 49.
Note 4: See Endnote 4 to Schedule 4, page 49.
SANLI PASTORE & HILL, INC.
68
Schedule 17
Platinum Studios, Inc.
Method 2: Market Multiplier Method for Direct to DVD Film Division1
Date of Value: March 31, 2008
Total Number of Characters in Library | 5,622 | ||||||
| Percent of Characters Adaptable to Direct to DVD Films | 12 | % | |||||
| Number of Characters Adaptable to Direct to DVD Films | 675 | ||||||
| Market Multiple (Appendix C) | x | $ | 15,000 | ||||
Fair Market Value of Direct to DVD Film Division | $ | 10,119,600 |
SANLI PASTORE & HILL, INC.
69
Endnotes to Schedule 17
Platinum Studios, Inc.
Date of Value:March 31, 2008
Note 1
In the market multiplier method, the fair market value of the Intellectual Property in theDirect to DVD Division was determined by multiplying the number of characters by an appropriate media format adaptation percentage, which we derived based on interviews with management and industry analysis.
To determine the appropriate market multiple, we searched for library transactions in film entertainment industry.We obtained library transaction data from Vogel 2007 and press releases, and made adjustments to the multiples to match the size and nature of theDirect to DVD Division.(See Appendix C, page 136) To determine the fair market value of the Intellectual Property inDirect to DVD Division, we utilized the price per feature multiple. Based on our analysis of the Company as well as the industry, competition, and economic conditions for Platinum, we selected the price per feature multiple of $15,000 which falls in the high range of the multiples.
70
Schedule 18
Platinum Studios, Inc.
Fair Market Value of Intellectual Property in Direct to DVD Film Division
Date of Value: March 31, 2008
Fair Market Value | Weight | Weighted Fair Market Value | ||||||||
Method 1: Discounted Cash Flow Method (Schedule 16) | $ | 9,045,166 | 75 | % | $ | 6,783,874 | ||||
Method 2: Market Multiplier Method (Schedule 17) | $ | 10,119,600 | 25 | % | $ | 2,529,900 | ||||
Fair Market Value of Intellectual Property in Direct to DVD Film Division (Rounded) | $ | 9,314,000 | ||||||||
SANLI PASTORE & HILL, INC.
71
Schedule 19
Platinum Studios, Inc.
Projected Cash Flow for Digital Publishing Division
Date of Value: March 31, 2008
Apr 1 - Dec 31, 2008 | 2009 | 2010 | 2011 | 2012 | 2013 | 2014 | 2015 | 2016 | 2017 | ||||||||||||||||||||||||||||||||||||||||||||||||||||
(1) | (2) | (3) | (4) | (5) | (6) | (7) | (8) | (9) | (10) | ||||||||||||||||||||||||||||||||||||||||||||||||||||
Revenues | |||||||||||||||||||||||||||||||||||||||||||||||||||||||||||||
| Revenue from Sale of Merchandise | $ | 0 | 0.0 | % | $ | 2,487,052 | 17.0 | % | $ | 5,690,375 | 22.0 | % | $ | 9,764,683 | 24.7 | % | $ | 11,170,798 | 23.3 | % | $ | 12,779,392 | 20.4 | % | $ | 14,619,625 | 19.5 | % | $ | 16,724,851 | 17.7 | % | $ | 19,133,229 | 17.1 | % | $ | 21,888,414 | 15.8 | % | |||||||||||||||||||||
| Revenue from Sale of Advertising | 2,634,264 | 80.0 | % | 4,508,696 | 30.9 | % | 5,484,632 | 21.2 | % | 6,674,807 | 16.9 | % | 8,128,074 | 16.9 | % | 9,902,109 | 15.8 | % | 12,069,926 | 16.1 | % | 14,721,362 | 15.5 | % | 17,966,930 | 16.1 | % | 21,946,928 | 15.8 | % | |||||||||||||||||||||||||||||||
| Revenue from Gaming | 0 | 0.0 | % | 3,150,266 | 21.6 | % | 6,018,666 | 23.3 | % | 9,429,243 | 23.8 | % | 13,461,749 | 28.0 | % | 18,206,464 | 29.0 | % | 23,765,504 | 31.8 | % | 30,254,288 | 31.9 | % | 37,803,173 | 33.8 | % | 46,559,292 | 33.6 | % | |||||||||||||||||||||||||||||||
| Subscription Revenues | 0 | 0.0 | % | 3,316,069 | 22.7 | % | 7,295,352 | 28.2 | % | 12,037,331 | 30.4 | % | 13,241,064 | 27.6 | % | 19,420,228 | 30.9 | % | 21,362,251 | 28.5 | % | 29,373,095 | 31.0 | % | 32,310,404 | 28.9 | % | 42,649,733 | 30.8 | % | |||||||||||||||||||||||||||||||
| Syndication Revenues | 658,566 | 20.0 | % | 1,127,174 | 7.7 | % | 1,371,158 | 5.3 | % | 1,668,702 | 4.2 | % | 2,032,018 | 4.2 | % | 2,475,527 | 3.9 | % | 3,017,481 | 4.0 | % | 3,680,341 | 3.9 | % | 4,491,732 | 4.0 | % | 5,486,732 | 4.0 | % | |||||||||||||||||||||||||||||||
Total Gross Revenues | $ | 3,292,830 | 100.0 | % | $ | 14,589,257 | 100.0 | % | $ | 25,860,183 | 100.0 | % | $ | 39,574,766 | 100.0 | % | $ | 48,033,703 | 100.0 | % | $ | 62,783,720 | 100.0 | % | $ | 74,834,787 | 100.0 | % | $ | 94,753,936 | 100.0 | % | $ | 111,705,469 | 100.0 | % | $ | 138,531,100 | 100.0 | % | |||||||||||||||||||||
Cost of Sales | |||||||||||||||||||||||||||||||||||||||||||||||||||||||||||||
| Ad Agency/Partner Fee | $ | 1,317,132 | 40.0 | % | $ | 2,254,348 | 15.5 | % | $ | 2,742,316 | 10.6 | % | $ | 3,337,403 | 8.4 | % | $ | 2,844,826 | 5.9 | % | $ | 3,465,738 | 5.5 | % | $ | 4,224,474 | 5.6 | % | $ | 5,152,477 | 5.4 | % | $ | 6,288,425 | 5.6 | % | $ | 7,681,425 | 5.5 | % | |||||||||||||||||||||
| Credit Card Processing Fees | 16,464 | 0.5 | % | 28,179 | 0.2 | % | 34,279 | 0.1 | % | 41,718 | 0.1 | % | 50,800 | 0.1 | % | 61,888 | 0.1 | % | 75,437 | 0.1 | % | 92,009 | 0.1 | % | 112,293 | 0.1 | % | 137,168 | 0.1 | % | |||||||||||||||||||||||||||||||
| License Fee to Creator | 2,300,000 | 69.8 | % | 3,070,000 | 21.0 | % | 3,880,000 | 15.0 | % | 4,740,000 | 12.0 | % | 5,650,000 | 11.8 | % | 6,620,000 | 10.5 | % | 7,660,000 | 10.2 | % | 8,780,000 | 9.3 | % | 10,000,000 | 9.0 | % | 11,330,000 | 8.2 | % | |||||||||||||||||||||||||||||||
| Properties License Fees | 98,785 | 3.0 | % | 169,076 | 1.2 | % | 205,674 | 0.8 | % | 250,305 | 0.6 | % | 304,803 | 0.6 | % | 371,329 | 0.6 | % | 452,622 | 0.6 | % | 552,051 | 0.6 | % | 673,760 | 0.6 | % | 823,010 | 0.6 | % | |||||||||||||||||||||||||||||||
| Syndication | 230,498 | 7.0 | % | 394,511 | 2.7 | % | 479,905 | 1.9 | % | 584,046 | 1.5 | % | 711,206 | 1.5 | % | 866,435 | 1.4 | % | 1,056,119 | 1.4 | % | 1,288,119 | 1.4 | % | 1,572,106 | 1.4 | % | 1,920,356 | 1.4 | % | |||||||||||||||||||||||||||||||
| Web Hosting Fee | 3,165,339 | 96.1 | % | 4,642,497 | 31.8 | % | 5,106,747 | 19.7 | % | 5,617,421 | 14.2 | % | 6,179,163 | 12.9 | % | 6,797,080 | 10.8 | % | 7,476,788 | 10.0 | % | 8,224,467 | 8.7 | % | 9,046,913 | 8.1 | % | 9,951,604 | 7.2 | % | |||||||||||||||||||||||||||||||
Total Cost of Sales | $ | 7,128,218 | 216.5 | % | $ | 10,558,611 | 72.4 | % | $ | 12,448,920 | 48.1 | % | $ | 14,570,893 | 36.8 | % | $ | 15,740,799 | 32.8 | % | $ | 18,182,470 | 29.0 | % | $ | 20,945,440 | 28.0 | % | $ | 24,089,122 | 25.4 | % | $ | 27,693,498 | 24.8 | % | $ | 31,843,564 | 23.0 | % | |||||||||||||||||||||
Gross Margin | $ | (3,835,388 | ) | -116.5 | % | $ | 4,030,646 | 27.6 | % | $ | 13,411,262 | 51.9 | % | $ | 25,003,873 | 63.2 | % | $ | 32,292,904 | 67.2 | % | $ | 44,601,251 | 71.0 | % | $ | 53,889,347 | 72.0 | % | $ | 70,664,814 | 74.6 | % | $ | 84,011,971 | 75.2 | % | $ | 106,687,537 | 77.0 | % | ||||||||||||||||||||
Total Selling, General & Administrative | $ | 987,849 | 30.0 | % | $ | 4,230,885 | 29.0 | % | $ | 7,240,851 | 28.0 | % | $ | 10,685,187 | 27.0 | % | $ | 12,008,426 | 25.0 | % | $ | 15,068,093 | 24.0 | % | $ | 16,463,653 | 22.0 | % | $ | 20,845,866 | 22.0 | % | $ | 24,575,203 | 22.0 | % | $ | 30,476,842 | 22.0 | % | |||||||||||||||||||||
Other Operating Expenses | |||||||||||||||||||||||||||||||||||||||||||||||||||||||||||||
| 3rd Party Production Costs | $ | 2,156,250 | 65.5 | % | $ | 3,956,463 | 27.1 | % | $ | 5,155,361 | 19.9 | % | $ | 6,493,283 | 16.4 | % | $ | 7,979,820 | 16.6 | % | $ | 9,639,651 | 15.4 | % | $ | 11,499,813 | 15.4 | % | $ | 13,589,866 | 14.3 | % | $ | 15,958,032 | 14.3 | % | $ | 18,640,944 | 13.5 | % | |||||||||||||||||||||
| Technical & Management Consulting | 93,750 | 2.8 | % | 128,875 | 0.9 | % | 132,870 | 0.5 | % | 136,989 | 0.3 | % | 141,236 | 0.3 | % | 145,614 | 0.2 | % | 150,128 | 0.2 | % | 154,782 | 0.2 | % | 159,580 | 0.1 | % | 164,527 | 0.1 | % | |||||||||||||||||||||||||||||||
| Marketing | 750,000 | 22.8 | % | 1,031,000 | 7.1 | % | 1,062,961 | 4.1 | % | 1,095,913 | 2.8 | % | 1,129,886 | 2.4 | % | 1,164,913 | 1.9 | % | 1,201,025 | 1.6 | % | 1,238,257 | 1.3 | % | 1,276,643 | 1.1 | % | 1,316,218 | 1.0 | % | |||||||||||||||||||||||||||||||
| Software and Technical Support | 37,500 | 1.1 | % | 51,550 | 0.4 | % | 53,148 | 0.2 | % | 54,796 | 0.1 | % | 56,494 | 0.1 | % | 58,246 | 0.1 | % | 60,051 | 0.1 | % | 61,913 | 0.1 | % | 63,832 | 0.1 | % | 65,811 | 0.0 | % | |||||||||||||||||||||||||||||||
| Equipment Maintenance | 5,625 | 0.2 | % | 10,000 | 0.1 | % | 15,000 | 0.1 | % | 15,465 | 0.0 | % | 15,944 | 0.0 | % | 16,439 | 0.0 | % | 16,948 | 0.0 | % | 17,474 | 0.0 | % | 18,015 | 0.0 | % | 18,574 | 0.0 | % | |||||||||||||||||||||||||||||||
| Site & Content Acquisition/Aggregation | 225,000 | 6.8 | % | 309,300 | 2.1 | % | 318,888 | 1.2 | % | 328,774 | 0.8 | % | 338,966 | 0.7 | % | 349,474 | 0.6 | % | 360,307 | 0.5 | % | 371,477 | 0.4 | % | 382,993 | 0.3 | % | 394,866 | 0.3 | % | |||||||||||||||||||||||||||||||
| Web Publishing | 2,004,375 | 60.9 | % | 2,755,348 | 18.9 | % | 2,840,763 | 11.0 | % | 2,928,827 | 7.4 | % | 3,019,621 | 6.3 | % | 3,113,229 | 5.0 | % | 3,209,739 | 4.3 | % | 3,309,241 | 3.5 | % | 3,411,827 | 3.1 | % | 3,517,594 | 2.5 | % | |||||||||||||||||||||||||||||||
| Translations | 429,375 | 13.0 | % | 590,248 | 4.0 | % | 608,545 | 2.4 | % | 627,410 | 1.6 | % | 646,860 | 1.3 | % | 666,912 | 1.1 | % | 687,587 | 0.9 | % | 708,902 | 0.7 | % | 730,878 | 0.7 | % | 753,535 | 0.5 | % | |||||||||||||||||||||||||||||||
| Depreciation | 75,000 | 2.3 | % | 110,000 | 0.8 | % | 121,000 | 0.5 | % | 133,100 | 0.3 | % | 146,410 | 0.3 | % | 161,051 | 0.3 | % | 177,156 | 0.2 | % | 194,872 | 0.2 | % | 214,359 | 0.2 | % | 235,795 | 0.2 | % | |||||||||||||||||||||||||||||||
Total Other Operating Expenses | $ | 5,776,875 | 175.4 | % | $ | 8,942,783 | 61.3 | % | $ | 10,308,537 | 39.9 | % | $ | 11,814,557 | 29.9 | % | $ | 13,475,237 | 28.1 | % | $ | 15,315,528 | 24.4 | % | $ | 17,362,755 | 23.2 | % | $ | 19,646,783 | 20.7 | % | $ | 22,216,159 | 19.9 | % | $ | 25,107,864 | 18.1 | % | |||||||||||||||||||||
Operating Income | $ | (10,600,112 | ) | -321.9 | % | $ | (9,143,021 | ) | -62.7 | % | $ | (4,138,126 | ) | -16.0 | % | $ | 2,504,129 | 6.3 | % | $ | 6,809,241 | 14.2 | % | $ | 14,217,629 | 22.6 | % | $ | 20,062,940 | 26.8 | % | $ | 30,172,165 | 31.8 | % | $ | 37,220,608 | 33.3 | % | $ | 51,102,830 | 36.9 | % | ||||||||||||||||||
Less: Payment to IP Partners10% | $ | 0 | 0.0 | % | $ | 0 | 0.0 | % | $ | 0 | 0.0 | % | $ | 250,413 | 0.6 | % | $ | 680,924 | 1.4 | % | $ | 1,421,763 | 2.3 | % | $ | 2,006,294 | 2.7 | % | $ | 3,017,216 | 3.2 | % | $ | 3,722,061 | 3.3 | % | $ | 5,110,283 | 3.7 | % | |||||||||||||||||||||
Contribution Profit from Digital Publishing Division | $ | (10,600,112 | ) | -321.9 | % | $ | (9,143,021 | ) | -62.7 | % | $ | (4,138,126 | ) | -16.0 | % | $ | 2,253,716 | 5.7 | % | $ | 6,128,317 | 12.8 | % | $ | 12,795,866 | 20.4 | % | $ | 18,056,646 | 24.1 | % | $ | 27,154,948 | 28.7 | % | $ | 33,498,547 | 30.0 | % | $ | 45,992,547 | 33.2 | % | ||||||||||||||||||
SANLI PASTORE & HILL, INC.
72
Endnotes to Schedule 19
Platinum Studios, Inc.
Date of Value:March 31, 2008
Note 1:
Platinum launched a web-comics site (www.drunkduck.com) to host the digital distribution of the Company’s printed comic material and as resource for independent comic book creators to post new material. In addition, Platinum has developed multiple destination sites for individual comic properties. SP&H referred these websites as the Digital Publishing Division. The Digital Publishing Division was expected to generate revenues in the following ways: merchandise sales, advertising sales, gaming revenues, subscription revenues and syndication revenues.
Based on our research and interviews with the management, SP&H developed assumptions of revenues and costs for the Digital Publishing Division as presented in Exhibits 19 to 20, pages 117and 118. Based on these assumptions, we projected the 10-year income statements for the Digital Publishing Division.
73
Schedule 20
Platinum Studios, Inc.
Method 1: Discounted Cash Flow Method for Digital Publishing Division1
Date of Value: March 31, 2008
Apr 1 - Dec 31, 2008 | 2009 | 2010 | 2011 | 2012 | 2013 | 2014 | 2015 | 2016 | 2017 | Terminal Year - 2018 | ||||||||||||||||||||||||
(1) | (2) | (3) | (4) | (5) | (6) | (7) | (8) | (9) | (10) | (11) | ||||||||||||||||||||||||
Contribution Profit from Digital Publishing Division (Schedule 19) | $ | (10,600,112 | ) | $ | (9,143,021 | ) | $ | (4,138,126 | ) | $ | 2,253,716 | $ | 6,128,317 | $ | 12,795,866 | $ | 18,056,646 | $ | 27,154,948 | $ | 33,498,547 | $ | 45,992,547 | |||||||||||
Less: Taxes (40% tax rate) | $ | 4,240,045 | $ | 3,657,209 | $ | 1,655,250 | $ | (901,487 | ) | $ | (2,451,327 | ) | $ | (5,118,347 | ) | $ | (7,222,658 | ) | $ | (10,861,979 | ) | $ | (13,399,419 | ) | $ | (18,397,019 | ) | |||||||
Less: Capital Expenditures (Schedule 19) | (125,000 | ) | (137,500 | ) | (151,250 | ) | (166,375 | ) | (183,013 | ) | (201,314 | ) | (221,445 | ) | (243,590 | ) | (267,949 | ) | (294,743 | ) | ||||||||||||||
Add: Depreciation (Schedule 19) | 75,000 | 110,000 | 121,000 | 133,100 | 146,410 | 161,051 | 177,156 | 194,872 | 214,359 | 235,795 | ||||||||||||||||||||||||
Net Cash Flow After Tax | $ | (6,410,067 | ) | $ | (5,513,313 | ) | $ | (2,513,125 | ) | $ | 1,318,955 | $ | 3,640,388 | $ | 7,637,257 | $ | 10,789,698 | $ | 16,244,251 | $ | 20,045,539 | $ | 27,536,580 | |||||||||||
Terminal Value Calculation | ||||||||||||||||||||||||||||||||||
End Year Economic Income (E0) | $ | 27,536,580 | ||||||||||||||||||||||||||||||||
| Long Term Growth Rate (g) | 3.1 | % | ||||||||||||||||||||||||||||||||
Terminal Year Economic Income (E1 = E0 x (1+g)) | $ | 28,390,214 | ||||||||||||||||||||||||||||||||
| Capitalization Rate (discount rate - g) | 19.3 | % | ||||||||||||||||||||||||||||||||
Terminal Value (V = E1 / capitalization rate)4 | $ | 147,481,630 | ||||||||||||||||||||||||||||||||
Discount Rate (Exhibit 21C)2 | 1.6 | % | 1.6 | % | 1.6 | % | 22.4 | % | 22.4 | % | 22.4 | % | 22.4 | % | 22.4 | % | 22.4 | % | 22.4 | % | 22.4 | % | ||||||||||||
Present Value Factor3 | 0.99 | 0.98 | 0.97 | 0.52 | 0.42 | 0.35 | 0.28 | 0.23 | 0.19 | 0.15 | 0.15 | |||||||||||||||||||||||
Present Value of Net Cash Flow | $ | (6,373,201 | ) | $ | (5,408,324 | ) | $ | (2,427,640 | ) | $ | 684,726 | $ | 1,544,652 | $ | 2,648,601 | $ | 3,058,331 | $ | 3,763,318 | $ | 3,795,639 | $ | 4,261,605 | $ | 22,824,495 | |||||||||
Fair Market Value of Digital Publishing Division | $ | 28,372,202 | ||||||||||||||||||||||||||||||||
SANLI PASTORE & HILL, INC.
74
Endnotes to Schedule 20
Platinum Studios, Inc.
Date of Value:March 31, 2008
Note 1
SeeEndnote 1 to Schedule 4, page 46.
In order to determine theNet cash flow to overall invested capital,we deducted capital expenditures and added back depreciation allocated to the Digital Publishing Division.
Note 2
SeeExhibits 21A to 21C, Development of WACC.
SeeEndnote 2 to Schedule 4, pages 46.
Based on the analysis of cash flow shortfall in the first two years, as well as Platinum’s access to capital, SP&H utilized weights of 80% equity and 20% debt and applied to the After-Tax Equity Discount Rate and the After-Tax Rate of Return on Debt, which resulted a WACC of 22.4%
For years 2008 and 2009, as the Digital Publishing Division was projected to generate negative cash flow, SP&H applied the 1-year Treasury Securities rate as a discount rate as it represents the alternative investment of a prudent investor.
For the remaining years, SP&H utilized the WACC as discussed above.
Note 3
SeeEndnote 3 to Schedule 4, page 49.
Note 4
SeeEndnote 4 to Schedule 4, page 49.
75
Schedule 21
Platinum Studios, Inc.
Method 2: Market Multiplier Method for Digital Publishing Division1
Date of Value: March 31, 2008
Month | Number of Uniques | |||||||
| January-08 | 2,852,541 | |||||||
| February-08 | 2,202,324 | |||||||
| March-08 | 2,482,136 | |||||||
Average Number of Uniques | 2,512,334 | |||||||
| Average Number of Monthly Uniques | 2,512,334 | |||||||
| Market Multiple (Appendix E) | x | 12.0 | ||||||
Fair Market Value of Digital Publishing Division | $ | 30,148,004 | ||||||
SANLI PASTORE & HILL, INC.
76
Endnotes to Schedule 21
Platinum Studios, Inc.
Date of Value:March 31, 2008
Note 1
In the market multiplier method, the fair market value of the Intellectual Property in the Digital Publishing Division was determined by multiplying the number of monthly uniques by an appropriate valuation multiplier.
To determine the appropriate market multiple, we searched for user-generated content sites transactions from 2005 through 2007. The transaction details and valuation multiplier were summarized and calculated in Appendix E, page 138. To determine the fair market value of the Intellectual Property in the Digital Publishing Division, we utilized the price per monthly unique multiple. Based on our analysis of the Company as well as the industry, competition, and economic conditions for Platinum, we selected the upper price per monthly unique multiple of 12.
77
Schedule 22
Platinum Studios, Inc.
Fair Market Value of Intellectual Property in the Digital Publishing Division
Date of Value: March 31, 2008
Fair Market Value | Weight | Weighted Fair Market Value | ||||||||
Method 1: Discounted Cash Flow Method (Schedule 20) | $ | 28,372,202 | 75 | % | $ | 21,279,152 | ||||
Method 2: Market Multiplier Method (Schedule 21) | $ | 30,148,004 | 25 | % | $ | 7,537,001 | ||||
Fair Market Value of Intellectual Property in Digital Publishing Division (Rounded) | $ | 28,816,000 | ||||||||
SANLI PASTORE & HILL, INC.
78
Schedule 23
Platinum Studios, Inc.
Projected Cash Flow for Video Network Division
Date of Value: March 31, 2008
2008 | 2009 | 2010 | 2011 | 2012 | 2013 | 2014 | 2015 | 2016 | 2017 | |||||||||||||||||||||||||||||||||||||||||||||||||
(1) | (2) | (3) | (4) | (5) | (6) | (7) | (8) | (9) | (10) | |||||||||||||||||||||||||||||||||||||||||||||||||
Revenues | ||||||||||||||||||||||||||||||||||||||||||||||||||||||||||
| Revenue from Sale of Advertising | $ | 0 | $ | 40,575,000 | 100.0 | % | $ | 60,543,750 | 100.0 | % | $ | 77,997,672 | 100.0 | % | $ | 100,577,040 | 100.0 | % | $ | 121,546,164 | 100.0 | % | $ | 146,942,887 | 100.0 | % | $ | 177,701,719 | 100.0 | % | $ | 210,076,553 | 100.0 | % | $ | 248,400,497 | 100.0 | % | ||||||||||||||||||||
Total Gross Revenues | $ | 0 | $ | 40,575,000 | 100.0 | % | $ | 60,543,750 | 100.0 | % | $ | 77,997,672 | 100.0 | % | $ | 100,577,040 | 100.0 | % | $ | 121,546,164 | 100.0 | % | $ | 146,942,887 | 100.0 | % | $ | 177,701,719 | 100.0 | % | $ | 210,076,553 | 100.0 | % | $ | 248,400,497 | 100.0 | % | ||||||||||||||||||||
Cost of Sales | ||||||||||||||||||||||||||||||||||||||||||||||||||||||||||
| Ad Agency/Partner Fee | $ | 0 | $ | 20,287,500 | 50.0 | % | $ | 30,771,875 | 50.8 | % | $ | 39,498,836 | 50.6 | % | $ | 50,788,520 | 50.5 | % | $ | 43,191,157 | 35.5 | % | $ | 52,080,010 | 35.4 | % | $ | 62,845,602 | 35.4 | % | $ | 74,176,794 | 35.3 | % | $ | 87,590,174 | 35.3 | % | ||||||||||||||||||||
| License Fee to Creator | 0 | 1,000,000 | 2.5 | % | 1,350,000 | 2.2 | % | 1,820,000 | 2.3 | % | 2,180,000 | 2.2 | % | 2,620,000 | 2.2 | % | 3,140,000 | 2.1 | % | 3,610,000 | 2.0 | % | 4,150,000 | 2.0 | % | 4,770,000 | 1.9 | % | ||||||||||||||||||||||||||||||
| Web Hosting Fee | 0 | 9,000,000 | 22.2 | % | 11,700,000 | 19.3 | % | 13,455,000 | 17.3 | % | 15,473,250 | 15.4 | % | 16,633,744 | 13.7 | % | 17,881,275 | 12.2 | % | 19,222,370 | 10.8 | % | 20,183,489 | 9.6 | % | 21,192,663 | 8.5 | % | ||||||||||||||||||||||||||||||
Total Cost of Sales | $ | 0 | $ | 30,287,500 | 74.6 | % | $ | 43,821,875 | 72.4 | % | $ | 54,773,836 | 70.2 | % | $ | 68,441,770 | 68.0 | % | $ | 62,444,901 | 51.4 | % | $ | 73,101,285 | 49.7 | % | $ | 85,677,972 | 48.2 | % | $ | 98,510,282 | 46.9 | % | $ | 113,552,837 | 45.7 | % | ||||||||||||||||||||
Gross Margin | $ | 0 | $ | 10,287,500 | 25.4 | % | $ | 16,721,875 | 27.6 | % | $ | 23,223,836 | 29.8 | % | $ | 32,135,270 | 32.0 | % | $ | 59,101,263 | 48.6 | % | $ | 73,841,602 | 50.3 | % | $ | 92,023,747 | 51.8 | % | $ | 111,566,271 | 53.1 | % | $ | 134,847,660 | 54.3 | % | ||||||||||||||||||||
Total Selling, General & Administrative | $ | 0 | $ | 12,172,500 | 30.0 | % | $ | 17,557,688 | 29.0 | % | $ | 21,839,348 | 28.0 | % | $ | 27,155,801 | 27.0 | % | $ | 30,386,541 | 25.0 | % | $ | 35,266,293 | 24.0 | % | $ | 39,094,378 | 22.0 | % | $ | 46,216,842 | 22.0 | % | $ | 54,648,109 | 22.0 | % | ||||||||||||||||||||
Other Operating Expenses | ||||||||||||||||||||||||||||||||||||||||||||||||||||||||||
| 3rd Party Production Costs | $ | 0 | $ | 1,250,000 | 3.1 | % | $ | 1,739,813 | 2.9 | % | $ | 2,418,236 | 3.1 | % | $ | 2,986,362 | 3.0 | % | $ | 3,700,377 | 3.0 | % | $ | 4,572,282 | 3.1 | % | $ | 5,419,625 | 3.0 | % | $ | 6,423,456 | 3.1 | % | $ | 7,611,981 | 3.1 | % | ||||||||||||||||||||
| Technical & Management Consulting | 0 | 125,000 | 0.3 | % | 128,875 | 0.2 | % | 132,870 | 0.2 | % | 136,989 | 0.1 | % | 141,236 | 0.1 | % | 145,614 | 0.1 | % | 150,128 | 0.1 | % | 154,782 | 0.1 | % | 159,580 | 0.1 | % | ||||||||||||||||||||||||||||||
| Marketing | 0 | 500,000 | 1.2 | % | 515,500 | 0.9 | % | 531,481 | 0.7 | % | 547,956 | 0.5 | % | 564,943 | 0.5 | % | 582,456 | 0.4 | % | 600,512 | 0.3 | % | 619,128 | 0.3 | % | 638,321 | 0.3 | % | ||||||||||||||||||||||||||||||
| Software and Technical Support | 0 | 50,000 | 0.1 | % | 51,550 | 0.1 | % | 53,148 | 0.1 | % | 54,796 | 0.1 | % | 56,494 | 0.0 | % | 58,246 | 0.0 | % | 60,051 | 0.0 | % | 61,913 | 0.0 | % | 63,832 | 0.0 | % | ||||||||||||||||||||||||||||||
| Equipment Maintenance | 0 | 7,500 | 0.0 | % | 10,000 | 0.0 | % | 15,000 | 0.0 | % | 15,465 | 0.0 | % | 15,944 | 0.0 | % | 16,439 | 0.0 | % | 16,948 | 0.0 | % | 17,474 | 0.0 | % | 18,015 | 0.0 | % | ||||||||||||||||||||||||||||||
| Site & Content Acquisition/Aggregation | 0 | 300,000 | 0.7 | % | 309,300 | 0.5 | % | 318,888 | 0.4 | % | 328,774 | 0.3 | % | 338,966 | 0.3 | % | 349,474 | 0.2 | % | 360,307 | 0.2 | % | 371,477 | 0.2 | % | 382,993 | 0.2 | % | ||||||||||||||||||||||||||||||
| Web Publishing | 0 | 2,512,500 | 6.2 | % | 2,590,388 | 4.3 | % | 2,670,690 | 3.4 | % | 2,753,481 | 2.7 | % | 2,838,839 | 2.3 | % | 2,926,843 | 2.0 | % | 3,017,575 | 1.7 | % | 3,111,120 | 1.5 | % | 3,207,564 | 1.3 | % | ||||||||||||||||||||||||||||||
| Translations | 0 | 572,500 | 1.4 | % | 590,248 | 1.0 | % | 608,545 | 0.8 | % | 627,410 | 0.6 | % | 646,860 | 0.5 | % | 666,912 | 0.5 | % | 687,587 | 0.4 | % | 708,902 | 0.3 | % | 730,878 | 0.3 | % | ||||||||||||||||||||||||||||||
| Depreciation | 0 | 100,000 | 0.2 | % | 130,000 | 0.2 | % | 149,500 | 0.2 | % | 171,925 | 0.2 | % | 184,819 | 0.2 | % | 198,681 | 0.1 | % | 213,582 | 0.1 | % | 224,261 | 0.1 | % | 235,474 | 0.1 | % | ||||||||||||||||||||||||||||||
Total Other Operating Expenses | $ | 0 | $ | 5,417,500 | 13.4 | % | $ | 6,065,673 | 10.0 | % | $ | 6,898,358 | 8.8 | % | $ | 7,623,158 | 7.6 | % | $ | 8,488,478 | 7.0 | % | $ | 9,516,946 | 6.5 | % | $ | 10,526,316 | 5.9 | % | $ | 11,692,513 | 5.6 | % | $ | 13,048,640 | 5.3 | % | ||||||||||||||||||||
Operating Income | $ | 0 | $ | (7,302,500 | ) | -18.0 | % | $ | (6,901,485 | ) | -11.4 | % | $ | (5,513,870 | ) | -7.1 | % | $ | (2,643,689 | ) | -2.6 | % | $ | 20,226,244 | 16.6 | % | $ | 29,058,363 | 19.8 | % | $ | 42,403,053 | 23.9 | % | $ | 53,656,916 | 25.5 | % | $ | 67,150,911 | 27.0 | % | ||||||||||||||||
TOTAL COST OF SALES10% | $ | 0 | $ | 0 | 0.0 | % | $ | 0 | 0.0 | % | $ | 0 | 0.0 | % | $ | 0 | 0.0 | % | $ | 2,022,624 | 1.7 | % | $ | 2,905,836 | 2.0 | % | $ | 4,240,305 | 2.4 | % | $ | 5,365,692 | 2.6 | % | $ | 6,715,091 | 2.7 | % | ||||||||||||||||||||
Contribution Profit from Video Network Division | $ | 0 | $ | (7,302,500 | ) | -18.0 | % | $ | (6,901,485 | ) | -11.4 | % | $ | (5,513,870 | ) | -7.1 | % | $ | (2,643,689 | ) | -2.6 | % | $ | 18,203,619 | 15.0 | % | $ | 26,152,527 | 17.8 | % | $ | 38,162,748 | 21.5 | % | $ | 48,291,225 | 23.0 | % | $ | 60,435,820 | 24.3 | % | ||||||||||||||||
SANLI PASTORE & HILL, INC.
79
Endnotes to Schedule 23
Platinum Studios, Inc.
Date of Value:March 31, 2008
Note 1:
Platinum launched a website (www.splastk.com) syndicated on-demand video network featuring free comic book inspired animated content. The customized Java-based player of Splastk, compatible with any web browser, was expected to host original material as well as aggregate content from multiple sources to deliver video simultaneously to a growing network of pop culture sites. Splastk can be syndicated over a large number of affiliate websites. SP&H referred these websites as the Video Network Division. The Video Network Division was expected to generate revenues primarily in advertising sales.
Based on our research and interviews with the management, SP&H developed assumptions of revenues and costs for the Video Network Division as presented in Exhibits 22 to 23, pages 122and 123. Based on these assumptions, we projected the 10-year income statements for the Video Network Division.
80
Schedule 24
Platinum Studios, Inc.
Method 1: Discounted Cash Flow Method for Video Network Division1
Date of Value: March 31, 2008
2008 | 2009 | 2010 | 2011 | 2012 | 2013 | 2014 | 2015 | 2016 | 2017 | Terminal Year - 2018 | ||||||||||||||||||||||||
(1) | (2) | (3) | (4) | (5) | (6) | (7) | (8) | (9) | (10) | (11) | ||||||||||||||||||||||||
Contribution Profit from Video Network Division (Schedule 23) | $ | 0 | $ | (7,302,500 | ) | $ | (6,901,485 | ) | $ | (5,513,870 | ) | $ | (2,643,689 | ) | $ | 18,203,619 | $ | 26,152,527 | $ | 38,162,748 | $ | 48,291,225 | $ | 60,435,820 | ||||||||||
Less: Taxes (40% tax rate) | $ | 0 | $ | 2,921,000 | $ | 2,760,594 | $ | 2,205,548 | $ | 1,057,476 | $ | (7,281,448 | ) | $ | (10,461,011 | ) | $ | (15,265,099 | ) | $ | (19,316,490 | ) | $ | (24,174,328 | ) | |||||||||
Less: Capital Expenditures (Schedule 23) | 0 | (125,000 | ) | (162,500 | ) | (186,875 | ) | (214,906 | ) | (231,024 | ) | (248,351 | ) | (266,977 | ) | (280,326 | ) | (294,343 | ) | |||||||||||||||
Add: Depreciation (Schedule 23) | 0 | 100,000 | 130,000 | 149,500 | 171,925 | 184,819 | 198,681 | 213,582 | 224,261 | 235,474 | ||||||||||||||||||||||||
Net Cash Flow After Tax | $ | 0 | $ | (4,406,500 | ) | $ | (4,173,391 | ) | $ | (3,345,697 | ) | $ | (1,629,195 | ) | $ | 10,875,967 | $ | 15,641,846 | $ | 22,844,253 | $ | 28,918,670 | $ | 36,202,623 | ||||||||||
Terminal Value Calculation | ||||||||||||||||||||||||||||||||||
End Year Economic Income (E0) | $ | 36,202,623 | ||||||||||||||||||||||||||||||||
| Long Term Growth Rate (g) | 3.10 | % | ||||||||||||||||||||||||||||||||
Terminal Year Economic Income (E1 = E0 x (1+g)) | $ | 37,324,905 | ||||||||||||||||||||||||||||||||
| Capitalization Rate (discount rate - g) | 19.3 | % | ||||||||||||||||||||||||||||||||
Terminal Value (V = E1 / capitalization rate)4 | $ | 193,895,609 | ||||||||||||||||||||||||||||||||
Discount Rate (Exhibit 21C)2 | 22.4 | % | 1.6 | % | 1.6 | % | 1.6 | % | 1.6 | % | 22.4 | % | 22.4 | % | 22.4 | % | 22.4 | % | 22.4 | % | 22.4 | % | ||||||||||||
Present Value Factor3 | 0.93 | 0.98 | 0.97 | 0.95 | 0.94 | 0.35 | 0.28 | 0.23 | 0.19 | 0.15 | 0.15 | |||||||||||||||||||||||
Present Value of Net Cash Flow | $ | 0 | $ | (4,322,588 | ) | $ | (4,031,431 | ) | $ | (3,182,562 | ) | $ | (1,526,101 | ) | $ | 3,771,786 | $ | 4,433,668 | $ | 5,292,345 | $ | 5,475,774 | $ | 5,602,776 | $ | 30,007,597 | ||||||||
Fair Market Value of Video Network Division | $ | 41,521,264 | ||||||||||||||||||||||||||||||||
Note 1: See Endnote 1 to Schedule 4, page 46. In order to determine the Net Cash Flow to invested capital, we deducted capital expenditures and added back depreciation allocated to Video Network Division.
Note 2: See Endnote 2 to Scheudule 20, page 78. For years 2008 through 2011, as the Video Network Division is projected to generate negative cash flow, SP&H applied the 1-year Treasury Securities rate as a discount rate as it represents the alternative investment of a prudent investor.
Note 3: See Endnote 3 to Schedule 4, page 49.
Note 4: See Endnote 4 to Schedule 4, page 49.
SANLI PASTORE & HILL, INC.
81
Schedule 25
Platinum Studios, Inc.
Method 2: Market Multiplier Method for Video Network Division1
Date of Value: March 31, 2008
| Average Number of Monthly Uniques | 7,500,000 | ||||||
| Market Multiple (Appendix F) | x | 6.0 | |||||
Fair Market Value of Video Network Division | $ | 45,000,000 |
SANLI PASTORE & HILL, INC.
82
Endnotes to Schedule 25
Platinum Studios, Inc.
Date of Value:March 31, 2008
Note 1
In the market multiplier method, the fair market value of the Intellectual Property in the Video Network Division was determined by multiplying the number of monthly uniques by an appropriate valuation multiplier.
To determine the appropriate market multiple, we searched for general content sites transactions from 2006 through 2007. The transaction details and valuation multiplier were summarized and calculated in Appendix F, page 139. To determine the fair market value of the Intellectual Property in the Video Network Division, we utilized the price per monthly unique multiple. Based on our analysis of the Company as well as the industry, competition, and economic conditions for Platinum, we selected the low quartile price per monthly unique multiple of 6.0.
83
Schedule 26
Platinum Studios, Inc.
Fair Market Value of Intellectual Property in the Video Network Division
Date of Value: March 31, 2008
Fair Market Value | Weight | Weighted Fair Market Value | ||||||||
Method 1: Discounted Cash Flow Method (Schedule 24) | $ | 41,521,264 | 75 | % | $ | 31,140,948 | ||||
Method 2: Market Multiplier Method (Schedule 25) | $ | 45,000,000 | 25 | % | $ | 11,250,000 | ||||
Fair Market Value of Intellectual Property in Video Network Division (Rounded) | $ | 42,391,000 | ||||||||
SANLI PASTORE & HILL, INC.
84
Schedule 27
Platinum Studios, Inc.
Method 1: Revenue Multiplier Method for Print Publishing Division
Date of Value: March 31, 2008
Total Revenues from Print Publishing1 | $ | 270,755 | ||
Revenue Multiplier2 | 3.00 | |||
Fair Market Value of Intellectual Property in Print Publishing Division | $ | 812,000 |
SANLI PASTORE & HILL, INC.
85
Endnotes to Schedule 27
Platinum Studios, Inc.
Date of Value:March 31, 2008
Note 1
See Schedule 1, page 15.
Note 2
In the market multiplier method, the fair market value of the Intellectual Property in Print Publishing Division was determined by multiplying revenue by an appropriate valuation multiplier.
To determine the appropriate valuation multiple, we searched for transactions involving companies classified under SIC Code 2721. We obtained guideline company data from Pratt’s Stats and Done Deals from 1995 to the date of this report, which are databases primarily consisting of private-company transactions. SP&H made adjustments to the multiples to match Platinum’s business operations and to include transactions from 2000 to the date of value.
A summary of the revenue multiples obtained fromDone Dealsfollows:
Count | Minimum | Lower Quartile | Median | Mean | Upper Quartile | Maximum | ||||||
| 7 | 1.10 | 1.44 | 2.29 | 1.99 | 2.48 | 2.70 |
A summary of the revenue multiples obtained fromPratt’s Stats follows:
Count | Minimum | Lower Quartile | Median | Mean | Upper Quartile | Maximum | ||||||
| 21 | 0.36 | 0.73 | 1.00 | 1.20 | 1.54 | 2.40 |
Based on our analysis of risks and rewards attributable to Platinum, consideration of future growth, as well as the industry, competition, and economic conditions, we selected a revenue multiple of 3x which falls in the high range of the multiples.
86
Schedule 28
Platinum Studios, Inc.
Video Games: Projected Cash Flow for Licensed Video Games Division1
Date of Value: March 31, 2008
| 2008 | 2009 | 2010 | 2011 | 2012 | 2013 | 2014 | 2015 | 2016 | 2017 | 2018 | ||||||||||||||||||||||||
| (1) | (2) | (3) | (4) | (5) | (6) | (7) | (8) | (9) | (10) | (11) | ||||||||||||||||||||||||
Assumptions: | ||||||||||||||||||||||||||||||||||
| Video Game Projects per Year | 1 | 2 | 1 | 1 | 1 | 1 | 2 | 2 | 2 | 2 | 2 | |||||||||||||||||||||||
Projected Cash Flows: | ||||||||||||||||||||||||||||||||||
Total Gross Receipts | $ | 0 | $ | 42,500,000 | $ | 91,500,000 | $ | 56,500,000 | $ | 101,000,000 | $ | 150,000,000 | $ | 100,000,000 | $ | 142,500,000 | $ | 149,000,000 | $ | 150,000,000 | $ | 200,000,000 | ||||||||||||
Pre-Tax Relief from Royalty Rate (% of Total Gross Receipts)2 | $ | 0 | $ | 4,250,000 | $ | 9,150,000 | $ | 5,650,000 | $ | 10,100,000 | $ | 15,000,000 | $ | 10,000,000 | $ | 14,250,000 | $ | 14,900,000 | $ | 15,000,000 | $ | 20,000,000 | ||||||||||||
Source: Exhibits 24.
SANLI PASTORE & HILL, INC.
87
Endnotes to Schedule 28
Platinum Studios, Inc.
Date of Value:March 31, 2008
Note 1
The Licensed Video Games Division model assumes Platinum licenses video game rights to a production studio for a royalty fee. The production studio arranges and pays for all cost associated with producing and distributing a video game.
To estimate the future cash flows generated by the Licensed Video Games Division, we estimated each video games revenues based on the number of units a video game would sell across all gaming consul, i.e. PlayStation 2, PlayStation 3, Xbox 360, Wii, etc., over its ultimate shelf life of 3 years. Our assumptions of a video game’s sales and their timing are presented in Exhibit 24, page 124.
We based our assumed unit sales on industry average required expected unit sales to green light production of a video game.
Note 2
Media and Entertainment royalty rates based on license agreements can range from 2% to 50%.33 Based on our research we determined that it is reasonable to apply a royalty rate of 10% to all gross revenues generated by video games.
33 RoyaltySource.com, an online database of historical royalty rates.
88
Schedule 29
Platinum Studios, Inc.
Method 1: Discounted Royalty Cash Flow Method for Licensed Video Games Division1
Date of Value: March 31, 2008
Apr 1 - Dec 31, 2008 | 2009 | 2010 | 2011 | 2012 | 2013 | 2014 | 2015 | 2016 | 2017 | 2018 | Terminal Year - 2019 | ||||||||||||||||||||||||||
(1) | (2) | (3) | (4) | (5) | (6) | (7) | (8) | (9) | (10) | (11) | (12) | ||||||||||||||||||||||||||
| Pre-Tax Relief from Royalty Rate (% of Net Revenues) | $ | 0 | $ | 4,250,000 | $ | 9,150,000 | $ | 5,650,000 | $ | 10,100,000 | $ | 15,000,000 | $ | 10,000,000 | $ | 14,250,000 | $ | 14,900,000 | $ | 15,000,000 | $ | 20,000,000 | |||||||||||||||
Less:Overhead Allocation | $ | 0 | $ | (60,000 | ) | $ | (61,860 | ) | $ | (63,778 | ) | $ | (65,755 | ) | $ | (67,793 | ) | $ | (69,895 | ) | $ | (72,061 | ) | $ | (74,295 | ) | $ | (76,599 | ) | $ | (78,973 | ) | |||||
| Taxable Income | $ | 0 | $ | 4,190,000 | $ | 9,088,140 | $ | 5,586,222 | $ | 10,034,245 | $ | 14,932,207 | $ | 9,930,105 | $ | 14,177,939 | $ | 14,825,705 | $ | 14,923,401 | $ | 19,921,027 | |||||||||||||||
Less: Taxes (40%) | $ | 0 | $ | (1,676,000 | ) | $ | (3,635,256 | ) | $ | (2,234,489 | ) | $ | (4,013,698 | ) | $ | (5,972,883 | ) | $ | (3,972,042 | ) | $ | (5,671,175 | ) | $ | (5,930,282 | ) | $ | (5,969,361 | ) | $ | (7,968,411 | ) | |||||
After-Tax Royalty | $ | 0 | $ | 2,514,000 | $ | 5,452,884 | $ | 3,351,733 | $ | 6,020,547 | $ | 8,959,324 | $ | 5,958,063 | $ | 8,506,763 | $ | 8,895,423 | $ | 8,954,041 | $ | 11,952,616 | |||||||||||||||
Terminal Value Calculation | |||||||||||||||||||||||||||||||||||||
End Year Economic Income (E0) | $ | 11,952,616 | |||||||||||||||||||||||||||||||||||
| Long Term Growth Rate (g) | 3.1 | % | |||||||||||||||||||||||||||||||||||
Terminal Year Economic Income (E1 = E0 x (1+g)) | $ | 12,323,147 | |||||||||||||||||||||||||||||||||||
| Capitalization Rate (discount rate - g) | 18.9 | % | |||||||||||||||||||||||||||||||||||
Terminal Value (V = E1 / capitalization rate)4 | $ | 65,168,596 | |||||||||||||||||||||||||||||||||||
Discount Rate (Exhibits 6A - 6C plus 5% risk)2 | 22.0 | % | 22.0 | % | 22.0 | % | 22.0 | % | 22.0 | % | 22.0 | % | 22.0 | % | 22.0 | % | 22.0 | % | 22.0 | % | 22.0 | % | 22.0 | % | |||||||||||||
Present Value Factor3 | 0.93 | 0.78 | 0.64 | 0.52 | 0.43 | 0.35 | 0.29 | 0.24 | 0.19 | 0.16 | 0.13 | 0.13 | |||||||||||||||||||||||||
Present Value of Net Cash Flow to MVIC | $ | 0 | $ | 1,960,526 | $ | 3,485,294 | $ | 1,755,854 | $ | 2,585,002 | $ | 3,152,869 | $ | 1,718,469 | $ | 2,010,975 | $ | 1,723,514 | $ | 1,421,914 | $ | 1,555,690 | $ | 8,482,002 | |||||||||||||
Fair Market Value of Licensed Video Games Division | $ | 29,852,000 | |||||||||||||||||||||||||||||||||||
SANLI PASTORE & HILL, INC.
89
Endnotes to Schedule 29
Platinum Studios, Inc.
Date of Value:March 31, 2008
Note 1
See Endnote 1 to Schedule 4, page 46.
Note 2
See Endnote 2 to Schedule 4, page 46.
In addition, we have added 5% of excess risk bourn by this division. The risk above and beyond the risk of the Film Division is due to the following factors:
| a) | All license agreements are still in the conceptualization stage; and |
| b) | Platinum does not expect to sign any license agreements before 2010. |
Based on the above, we determined the discount rate for the Licensed Video Games Division to be 22.0%.
Note 3
See Endnote 3 to Schedule 4, page 49.
Note 4
See Endnote 4 to Schedule 4, page 49.
90
Schedule 30
Platinum Studios, Inc.
Method 1: Discounted Cash Flow Method for Licensing and Merchandising Division1
Date of Value: March 31, 2008
Apr 1 - Dec 31, 2008 | 2009 | 2010 | 2011 | 2012 | 2013 | 2014 | 2015 | 2016 | 2017 | 2018 | Terminal Year - 2019 | ||||||||||||||||||||||||||
(1) | (2) | (3) | (4) | (5) | (6) | (7) | (8) | (9) | (10) | (11) | (12) | ||||||||||||||||||||||||||
| Pre-Tax Revenue from Licensing and Merchandising | $ | 0 | $ | 2,000,000 | $ | 2,200,000 | $ | 2,420,000 | $ | 2,662,000 | $ | 2,928,200 | $ | 3,221,020 | $ | 3,543,122 | $ | 3,897,434 | $ | 4,287,178 | $ | 4,715,895 | |||||||||||||||
Less: Overhead Allocation | $ | 0 | $ | (50,000 | ) | $ | (51,550 | ) | $ | (53,148 | ) | $ | (54,796 | ) | $ | (56,494 | ) | $ | (58,246 | ) | $ | (60,051 | ) | $ | (61,913 | ) | $ | (63,832 | ) | $ | (65,811 | ) | |||||
| Taxable Income | $ | 0 | $ | 1,950,000 | $ | 2,148,450 | $ | 2,366,852 | $ | 2,607,204 | $ | 2,871,706 | $ | 3,162,774 | $ | 3,483,071 | $ | 3,835,521 | $ | 4,223,345 | $ | 4,650,084 | |||||||||||||||
Less: Taxes (40%) | $ | 0 | $ | (780,000 | ) | $ | (859,380 | ) | $ | (946,741 | ) | $ | (1,042,882 | ) | $ | (1,148,682 | ) | $ | (1,265,110 | ) | $ | (1,393,228 | ) | $ | (1,534,209 | ) | $ | (1,689,338 | ) | $ | (1,860,034 | ) | |||||
After-Tax Income | $ | 0 | $ | 1,170,000 | $ | 1,289,070 | $ | 1,420,111 | $ | 1,564,323 | $ | 1,723,023 | $ | 1,897,665 | $ | 2,089,842 | $ | 2,301,313 | $ | 2,534,007 | $ | 2,790,051 | |||||||||||||||
Terminal Value Calculation | |||||||||||||||||||||||||||||||||||||
End Year Economic Income (E0) | $ | 2,790,051 | |||||||||||||||||||||||||||||||||||
| Long Term Growth Rate (g) | 3.1 | % | |||||||||||||||||||||||||||||||||||
Terminal Year Economic Income (E1 = E0 x (1+g)) | $ | 2,876,542 | |||||||||||||||||||||||||||||||||||
| Capitalization Rate (discount rate - g) | 18.9 | % | |||||||||||||||||||||||||||||||||||
Terminal Value (V = E1 / capitalization rate)4 | $ | 15,212,041 | |||||||||||||||||||||||||||||||||||
Discount Rate (Exhibits 6A - 6C plus 5% risk)2 | 22.0 | % | 22.0 | % | 22.0 | % | 22.0 | % | 22.0 | % | 22.0 | % | 22.0 | % | 22.0 | % | 22.0 | % | 22.0 | % | 22.0 | % | 22.0 | % | |||||||||||||
Present Value Factor3 | 0.93 | 0.78 | 0.64 | 0.52 | 0.43 | 0.35 | 0.29 | 0.24 | 0.19 | 0.16 | 0.13 | 0.13 | |||||||||||||||||||||||||
Present Value of Net Cash Flow to MVIC | $ | 0 | $ | 912,417 | $ | 823,929 | $ | 743,946 | $ | 671,663 | $ | 606,348 | $ | 547,339 | $ | 494,033 | $ | 445,886 | $ | 402,404 | $ | 363,138 | $ | 1,979,919 | |||||||||||||
Fair Market Value of Licensing and Merchandising Division | $ | 7,991,000 | |||||||||||||||||||||||||||||||||||
Note 1: See Endnote 1 to Schedule 4, page 46. |
Note 2: See Endnote 2 to Schedule 4, page 46. |
Note 3: See Endnote 3 to Schedule 4, page 49. |
Note 4: See Endnote 4 to Schedule 4, page 49. |
SANLI PASTORE & HILL, INC.
91
Schedule 31
Platinum Studios, Inc.
Conclusion of Fair Market Value and Fair Value of Intellectual Property
Date of Value: March 31, 2008
Fair Market Value and Fair Value of Intellectual Property | ||||
Film Entertainment | ||||
| Licensed Films (Schedule 6) | $ | 8,705,000 | ||
| Joint Venture Films (Schedule 10) | 18,457,000 | |||
| Film Fund Films (Schedule 14) | 23,565,000 | |||
| Direct to DVD Films (Schedule 18) | 9,314,000 | |||
Film Entertainment Total | $ | 60,041,000 | ||
Digital Publishing (Schedule 22) | $ | 28,816,000 | ||
Video Network (Schedule 26) | $ | 42,391,000 | ||
Print Publishing (Schedule 27) | $ | 812,000 | ||
Licensed Video Games (Schedule 29) | $ | 29,852,000 | ||
Licensing and Merchandising (Schedule 30) | $ | 7,991,000 | ||
Comic Book Challenge1 | $ | 500,000 | ||
Total Market Value of Invested Capital | $ | 170,403,000 | ||
Less: | ||||
Net Working Capital2 | $ | (1,598,000 | ) | |
Property and Equipment3 | $ | (257,000 | ) | |
Existing Debt4 | $ | (4,662,000 | ) | |
Projected Debt Funding5 | $ | (13,848,000 | ) | |
Total Fair Market Value and Fair Value of Intellectual Property | $ | 150,038,000 | ||
Note 1: See Endnote 1 to Schedule 31, page 93. | ||
Note 2: Per Platinum form 10-K filed on March 31, 2008. | ||
Note 3: Per Platinum form 10-K filed on March 31, 2008. | ||
Note 4: See Endnote 4 to Schedule 31, page 95. | ||
Note 5: See Endnote 5 to Schedule 31, page 95. |
SANLI PASTORE & HILL, INC.
92
Endnotes to Schedule 31
Platinum Studios, Inc.
Date of Value:March 31, 2008
Note 1
The Cost Approach
Since the Comic Book Challenge was in early stage development, the amounts, if any, of future revenues remained uncertain and projected revenues and profits could not be made, the cost approach is deemed appropriate to determine the fair market value of the Comic Book Challenge. The cost approach also is effective at establishing a maximum price for the asset in a proposed transaction as an investor will pay no more for an asset than the cost to develop or obtain an asset of similar utility.34
As stated inValuing Intangible Assets:35
Generally, cost approach methods may be applicable when the subject intangible asset is newer and when it is a fungible property. The term fungible means that the subject intangible asset could be exchanged or substituted for another intangible. In addition, cost approach methods may be more applicable when estimating the value of the intangible asset to the current owner. These methods may also be applicable when estimating the value of an intangible asset under the premise of value in continued use.
There are two different types of cost quantified in cost approach valuation analyses. The types of costs relate to the two fundamental cost approach valuation methods are reproduction cost and replacement cost.36
Reproduction cost is the estimated cost to construct, at current market price as of the date of the analysis, an exact duplicate or replica of the subject intangible asset, using the same materials, production standards, design layout, and quality of workmanship as the subject intangible asset, The reproduction intangible asset will include the same inadequacies, superadequacies, and obsolescence as the subject intangible asset.
Replacement cost is the estimated cost to construct, at current prices as of the date of the analysis, an intangible asset with equivalent utility to the subject intangible, using modern materials, production standards, design, layout, and quality of workmanship, The replacement intangible asset will exclude all curable inadequacies, superadequacies, and obsolescence that present in the subject intangible asset.
34 Drews, David, IPMetrics LLC (2001). The cost approach to IP valuation: Its uses and limitations.
35 Reilly, Robert and Robert Schweihs.Valuing Intangible Assets,Page 122.
36 Ibid.
93
The selection of the reproduction cost method versus the replacement cost method should not materially different as the allowances for obsolescence would need to be adjusted. In addition, historical costs utilized under our approach were adjusted to present value to obtain replacement cost values.
Regardless of the type of cost being estimated, five components of cost are generally included in the analysis. The five components of cost are:
| 1. | Material |
| 2. | Labor |
| 3. | Overhead |
| 4. | Developer’s profit |
| 5. | Entrepreneurial incentive |
As stated inValuing Intangible Assets:37
Material costs include expenditures and accruals related to the tangible elements of the intangible asset development process. Typically, material costs do not represent a significant percentage of the overall cost of intangible asset development because there are typically few tangible manifestations of an intangible asset.
Labor costs include expenditures and accruals related to the human capital efforts associated with intangible asset development. Intangible asset labor costs can be either direct or indirect. Direct labor costs relate to the individuals who participated hands-on in the development process Labor costs typically include all salaries and wages to employees and all monetary compensation to contractors. Labor costs should be estimated at (or trended to) current costs as of the valuation date.
The overhead cost component has several subcomponents. The categories of overhead cost typically include employment-related taxes, employment-related perquisites, and fringe benefits, management and supervisory efforts, support and secretarial efforts, and utility and operating expenses.
The developer’s profit is a cost component that is frequently overlooked. From the perspective of the developer of any intangible asset, first, the developer expects a return of all of the material, labor, and overhead costs related to the development process; and second, the developer expects a return on all of the material, labor, and overhead costs related to the development process.
Entrepreneurial incentive is another cost component that is frequently overlooked. Nonetheless, entrepreneurial incentive is an integral component of the cost approach analysis. The entrepreneurial incentive is the amount of economic benefit required to motivate the intangible asset owner to enter into the development process. From the perspective of the intangible asset owner, entrepreneurial incentive is often perceived as an opportunity cost.
37 Reilly, Robert and Robert Schweihs.Valuing Intangible Assets.Page 124-125.
94
Based upon the cost component information provided by the management, we concluded the fair market value of the Comic Book Challenge was $500,000.
Note 2
Per Platinum’s Form 10-K filed on March 31, 2008. Short term notes payable and current portion of capital lease payable were excluded from our calculation of working capital, as these are financing liabilities included in Existing Debt, Note 4 below, and are not part of the company’ daily operations.
Note 3
Per Platinum’s Form 10-K filed on March 31, 2008.
Note 4
According to Platinum’s Form 10-K filed on March 31, 2008, Platinum’s existing debt consists of short term notes payable, long term notes payable to shareholder, accrued interest due to shareholder, and current and non-current portion of capital leases payable, with a total value of $4,662,000.
Note 5
As presented in the DCF method of each division, Platinum would incur negative cash flow in 2008 and 2009. In order to execute Platinum’s business plan, additional financing maybe required to cover the negative cash flow for at least the 2008 period. For the purposes of our valuation, we estimated the expected debt funding by summing up the total negative cash flow of the following divisions in 2008. As the Film Fund Division is funded from a separate business entity, we excluded the negative cash flow of Film Fund Division from our calculation of projected debt funding. The calculation of expected debt funding is as follows:
95
Negative Cash Flow of 2008 | ||||
Film Entertainment | ||||
| Licensed Films | $ | 112,500 | ||
| Joint Venture Films | 7,325,296 | |||
| Direct to DVD Films | 0 | |||
Film Entertainment Total | $ | 7,437,796 | ||
Digital Publishing | $ | 6,410,067 | ||
Video Network | $ | 0 | ||
Print Publishing | $ | 0 | ||
Licensed Video Games | $ | 0 | ||
Licensing and Merchandising | $ | 0 | ||
Comic Book Challenge | $ | 0 | ||
Total Projected Debt Funding (Rounded) | $ | 13,848,000 | ||
96
Exhibit 1: Ultimate Revenues and Costs
Platinum Studios, Inc.
Film Entertainment: Licensed Film Division Assumptions
Action | Comedy | Thriller | ||||||||||||||||||||
High Budget | High Budget | High Budget | ||||||||||||||||||||
| Projected Budget | $ | 65,000,000 | $ | 50,000,000 | $ | 65,000,000 | ||||||||||||||||
| Implied Domestic Box Office | Average of Median and Mean Multiple for High Budget Films, Based on Box Office Mojo data | $ | 94,250,000 | 1.45 | $ | 50,500,000 | 1.01 | $ | 76,050,000 | 1.17 | ||||||||||||
| Implied International Box Office | Average of Median and Mean Multiple for High Budget Films, Based on Box Office Mojo data | $ | 100,750,000 | 1.55 | $ | 60,000,000 | 1.20 | $ | 69,550,000 | 1.07 | ||||||||||||
Gross Receipts | Notes | |||||||||||||||||||||
| Domestic Theatrical | Based on Industry Estimates, Baselineresearch and Vogel 2007 | $ | 47,125,000 | 50.0 | % | $ | 25,250,000 | 50.0 | % | $ | 38,025,000 | 50.0 | % | |||||||||
| International Theatrical | Based on Industry Estimates, Baselineresearch and Vogel 2007 | 40,300,000 | 40.0 | % | 24,000,000 | 40.0 | % | 27,820,000 | 40.0 | % | ||||||||||||
| Domestic Home Video | % of Domestic Box Office, Based on Historical Actual of Marvel PG-13 Films | 73,515,000 | 78.0 | % | 39,390,000 | 78.0 | % | 59,319,000 | 78.0 | % | ||||||||||||
| International Home Video | % of Domestic Home Video, Based on Historical Actual of Marvel PG-13 Films | 44,109,000 | 60.0 | % | 23,634,000 | 60.0 | % | 35,591,400 | 60.0 | % | ||||||||||||
| Domestic Television | ||||||||||||||||||||||
| PPV | % of Domestic Theatrical, cap of $7.5M, Based on Industry Estimates, Marvel | 5,890,625 | 12.5 | % | 3,156,250 | 12.5 | % | 4,753,125 | 12.5 | % | ||||||||||||
| Pay TV | % of Domestic Theatrical, cap of $17.5M, Based on Industry Estimates, Marvel | 21,206,250 | 45.0 | % | 11,362,500 | 45.0 | % | 17,111,250 | 45.0 | % | ||||||||||||
| Network TV | % of Domestic Theatrical, cap of $40M, Based on Industry Estimates, Marvel | 8,482,500 | 18.0 | % | 4,545,000 | 18.0 | % | 6,844,500 | 18.0 | % | ||||||||||||
| Syndicated TV | % of Domestic Theatrical | 1,649,375 | 3.5 | % | 883,750 | 3.5 | % | 1,330,875 | 3.5 | % | ||||||||||||
| International Television | ||||||||||||||||||||||
| Pay TV | % of International Theatrical, cap of $30M, Based on Industry Estimates, Marvel | 13,299,000 | 33.0 | % | 7,920,000 | 33.0 | % | 9,180,600 | 33.0 | % | ||||||||||||
| Network TV | % of International Theatrical, cap of $30M, Based on Industry Estimates, Marvel | 20,150,000 | 50.0 | % | 12,000,000 | 50.0 | % | 13,910,000 | 50.0 | % | ||||||||||||
| Domestic Merchandising | % of Domestic Box Office less 35% Distribution Fees based on SNL Kagan 2007; Platinum collects 25% of Net | 811,728 | 0.9 | % | 217,466 | 0.4 | % | 327,490 | 0.4 | % | ||||||||||||
| International Merchandising | % of International Box Office less 35% Distribution Fees based on SNL Kagan 2007; Platinum collects 25% of Net | 867,709 | 0.9 | % | 258,375 | 0.4 | % | 299,500 | 0.4 | % | ||||||||||||
Total Gross Receipts | $ | 277,406,188 | $ | 152,617,341 | $ | 214,512,740 | ||||||||||||||||
Distribution Costs | ||||||||||||||||||||||
| Domestic Theatrical | % of Domestic Theatrical, Vogel 2007 | $ | 9,425,000 | 20.0 | % | $ | 5,050,000 | 20.0 | % | $ | 7,605,000 | 20.0 | % | |||||||||
| International Theatrical | % of International Theatrical, Vogel 2007 | 8,060,000 | 20.0 | % | 4,800,000 | 20.0 | % | 5,564,000 | 20.0 | % | ||||||||||||
| Domestic Home Video | % of Domestic Home Video Revenue, Based on Industry Estimates, Vogel 2007 | 14,703,000 | 20.0 | % | 7,878,000 | 20.0 | % | 11,863,800 | 20.0 | % | ||||||||||||
| International Home Video | % of International Home Video Revenue, Based on Industry Estimates, Vogel 2007 | 8,821,800 | 20.0 | % | 4,726,800 | 20.0 | % | 7,118,280 | 20.0 | % | ||||||||||||
| Domestic Television Cost | % of Television Revenue, Based on Industry Estimates, Marvel | 7,445,750 | 20.0 | % | 3,989,500 | 20.0 | % | 6,007,950 | 20.0 | % | ||||||||||||
| International Television Cost | % of Television Revenue, Based on Industry Estimates, Marvel | 6,689,800 | 20.0 | % | 3,984,000 | 20.0 | % | 4,618,120 | 20.0 | % | ||||||||||||
Total Distribution Costs | $ | 55,145,350 | $ | 30,428,300 | $ | 42,777,150 | ||||||||||||||||
Publicity Expenses | ||||||||||||||||||||||
| Domestic Theatrical | ||||||||||||||||||||||
| Advertising | % of Budget, 2006 Average Ad / Negative Costs, MPAA | $ | 30,336,626 | 46.7 | % | $ | 23,335,866 | 46.7 | % | $ | 30,336,626 | 46.7 | % | |||||||||
| Publicity | % of Budget, 2006 Average Print / Negative Costs, MPAA | 3,783,435 | 5.8 | % | 2,910,334 | 5.8 | % | 3,783,435 | 5.8 | % | ||||||||||||
| International Theatrical | ||||||||||||||||||||||
| Advertising | % of Domestic Advertising | 15,168,313 | 50.0 | % | 11,667,933 | 50.0 | % | 15,168,313 | 50.0 | % | ||||||||||||
| Publicity | % of Domestic Publicity | 1,891,717 | 50.0 | % | 1,455,167 | 50.0 | % | 1,891,717 | 50.0 | % | ||||||||||||
Total Publicity Expense | $ | 51,180,091 | $ | 39,369,301 | $ | 51,180,091 | ||||||||||||||||
Negative Costs | Same as Projected Budget | $ | 65,000,000 | $ | 50,000,000 | $ | 65,000,000 | |||||||||||||||
Contribution Profit | % of Total Gross Receipts | $ | 106,080,746 | 38.2 | % | $ | 32,819,740 | 21.5 | % | $ | 55,555,499 | 25.9 | % | |||||||||
Revenue from Theatrical Rights | $ | 1,250,000 | $ | 1,250,000 | $ | 1,250,000 | ||||||||||||||||
= Inputs/Assumptions
SANLI PASTORE & HILL, INC.
97
Exhibit 2: Time of Cash Flows from Ultimates
Platinum Studios, Inc.
Film Entertainment: Licensed, Joint Venture, and Film Fund Film Divisions
Year of Cash Flow | 0 | 1 | 2 | 3 | 4 | 5 | 6 | 7 | 8 | 9 | 10 | Total | |||||||||||||||||||||||||
Gross Receipts | |||||||||||||||||||||||||||||||||||||
| Domestic Theatrical | 0.0 | % | 100 | % | 0.0 | % | 0.0 | % | 0.0 | % | 0.0 | % | 0.0 | % | 0.0 | % | 0.0 | % | 0.0 | % | 0.0 | % | 100.0 | % | |||||||||||||
| International Theatrical | 0.0 | % | 85.0 | % | 15.0 | % | 0.0 | % | 0.0 | % | 0.0 | % | 0.0 | % | 0.0 | % | 0.0 | % | 0.0 | % | 0.0 | % | 100.0 | % | |||||||||||||
| Domestic Home Video | 0.0 | % | 75.0 | % | 7.0 | % | 6.0 | % | 4.0 | % | 3.0 | % | 1.0 | % | 1.0 | % | 1.0 | % | 1.0 | % | 1.0 | % | 100.0 | % | |||||||||||||
| International Home Video | 0.0 | % | 50.0 | % | 35.0 | % | 5.0 | % | 3.0 | % | 2.0 | % | 1.0 | % | 1.0 | % | 1.0 | % | 1.0 | % | 1.0 | % | 100.0 | % | |||||||||||||
| Domestic Television | |||||||||||||||||||||||||||||||||||||
| PPV | 0.0 | % | 3.0 | % | 97.0 | % | 0.0 | % | 0.0 | % | 0.0 | % | 0.0 | % | 0.0 | % | 0.0 | % | 0.0 | % | 0.0 | % | 100.0 | % | |||||||||||||
| Pay TV | 0.0 | % | 3.0 | % | 75.0 | % | 22.0 | % | 0.0 | % | 0.0 | % | 0.0 | % | 0.0 | % | 0.0 | % | 0.0 | % | 0.0 | % | 100.0 | % | |||||||||||||
| Network TV | 0.0 | % | 0.0 | % | 0.0 | % | 15.0 | % | 50.0 | % | 15.0 | % | 15.0 | % | 5.0 | % | 0.0 | % | 0.0 | % | 0.0 | % | 100.0 | % | |||||||||||||
| Syndicated TV | 0.0 | % | 0.0 | % | 0.0 | % | 0.0 | % | 20.0 | % | 20.0 | % | 20.0 | % | 10.0 | % | 10.0 | % | 10.0 | % | 10.0 | % | 100.0 | % | |||||||||||||
| International Television | |||||||||||||||||||||||||||||||||||||
| Pay TV | 0.0 | % | 0.0 | % | 15.0 | % | 55.0 | % | 30.0 | % | 0.0 | % | 0.0 | % | 0.0 | % | 0.0 | % | 0.0 | % | 0.0 | % | 100.0 | % | |||||||||||||
| Syndicated TV | 0.0 | % | 0.0 | % | 0.0 | % | 0.0 | % | 20.0 | % | 20.0 | % | 20.0 | % | 10.0 | % | 10.0 | % | 10.0 | % | 10.0 | % | 100.0 | % | |||||||||||||
| Domestic Merchandising | 0.0 | % | 75.0 | % | 7.0 | % | 6.0 | % | 4.0 | % | 3.0 | % | 2.0 | % | 1.0 | % | 1.0 | % | 0.5 | % | 0.5 | % | 100.0 | % | |||||||||||||
| International Merchandising | 0.0 | % | 75.0 | % | 7.0 | % | 6.0 | % | 4.0 | % | 3.0 | % | 2.0 | % | 1.0 | % | 1.0 | % | 0.5 | % | 0.5 | % | 100.0 | % | |||||||||||||
Total Gross Receipts | 0.0 | % | 38.8 | % | 21.5 | % | 9.6 | % | 11.3 | % | 5.5 | % | 5.1 | % | 2.4 | % | 2.0 | % | 1.9 | % | 1.9 | % | 100.0 | % | |||||||||||||
Distribution Costs | |||||||||||||||||||||||||||||||||||||
| Domestic Theatrical | 0.0 | % | 100.0 | % | 0.0 | % | 0.0 | % | 0.0 | % | 0.0 | % | 0.0 | % | 0.0 | % | 0.0 | % | 0.0 | % | 0.0 | % | 100.0 | % | |||||||||||||
| International Theatrical | 0.0 | % | 85.0 | % | 15.0 | % | 0.0 | % | 0.0 | % | 0.0 | % | 0.0 | % | 0.0 | % | 0.0 | % | 0.0 | % | 0.0 | % | 100.0 | % | |||||||||||||
| Domestic Home Video | 0.0 | % | 70.0 | % | 5.0 | % | 4.0 | % | 3.0 | % | 3.0 | % | 3.0 | % | 3.0 | % | 3.0 | % | 3.0 | % | 3.0 | % | 100.0 | % | |||||||||||||
| International Home Video | 0.0 | % | 45.0 | % | 33.0 | % | 5.0 | % | 4.0 | % | 3.0 | % | 2.0 | % | 2.0 | % | 2.0 | % | 2.0 | % | 2.0 | % | 100.0 | % | |||||||||||||
| Domestic Television Cost | 0.0 | % | 5.0 | % | 50.0 | % | 20.0 | % | 10.0 | % | 5.0 | % | 2.0 | % | 2.0 | % | 2.0 | % | 2.0 | % | 2.0 | % | 100.0 | % | |||||||||||||
| International Television Cost | 0.0 | % | 5.0 | % | 50.0 | % | 20.0 | % | 10.0 | % | 5.0 | % | 2.0 | % | 2.0 | % | 2.0 | % | 2.0 | % | 2.0 | % | 100.0 | % | |||||||||||||
Total Distribution Costs | 0.0 | % | 51.7 | % | 25.5 | % | 8.2 | % | 4.5 | % | 2.7 | % | 1.5 | % | 1.5 | % | 1.5 | % | 1.5 | % | 1.5 | % | 100.0 | % | |||||||||||||
Publicity Expenses | |||||||||||||||||||||||||||||||||||||
| Domestic Theatrical | |||||||||||||||||||||||||||||||||||||
| Advertising | 10.0 | % | 90.0 | % | 0.0 | % | 0.0 | % | 0.0 | % | 0.0 | % | 0.0 | % | 0.0 | % | 0.0 | % | 0.0 | % | 0.0 | % | 100.0 | % | |||||||||||||
| Prints | 0.0 | % | 100.0 | % | 0.0 | % | 0.0 | % | 0.0 | % | 0.0 | % | 0.0 | % | 0.0 | % | 0.0 | % | 0.0 | % | 0.0 | % | 100.0 | % | |||||||||||||
| International Theatrical | |||||||||||||||||||||||||||||||||||||
| Advertising | 10.0 | % | 90.0 | % | 0.0 | % | 0.0 | % | 0.0 | % | 0.0 | % | 0.0 | % | 0.0 | % | 0.0 | % | 0.0 | % | 0.0 | % | 100.0 | % | |||||||||||||
| Prints | 0.0 | % | 85.0 | % | 15.0 | % | 0.0 | % | 0.0 | % | 0.0 | % | 0.0 | % | 0.0 | % | 0.0 | % | 0.0 | % | 0.0 | % | 100.0 | % | |||||||||||||
Total Publicity Expenses | 5.0 | % | 91.3 | % | 3.8 | % | 0.0 | % | 0.0 | % | 0.0 | % | 0.0 | % | 0.0 | % | 0.0 | % | 0.0 | % | 0.0 | % | 100.0 | % | |||||||||||||
Negative Costs | 100.0 | % | 0.0 | % | 0.0 | % | 0.0 | % | 0.0 | % | 0.0 | % | 0.0 | % | 0.0 | % | 0.0 | % | 0.0 | % | 0.0 | % | 100.0 | % | |||||||||||||
Source: Duff & Phelps March 22, 2006 report and SP&H research.
SANLI PASTORE & HILL, INC.
98
Exhibit 3: Time of Cash Flow from High Budget Action Film
Platinum Studios, Inc.
Film Entertainment: Licensed Film Division: Action - High Budget Films
Year of Cash Flow | 0 | 1 | 2 | 3 | 4 | 5 | 6 | 7 | 8 | 9 | 10 | Total | |||||||||||||||||||||||||
Gross Receipts | |||||||||||||||||||||||||||||||||||||
| Domestic Theatrical | $ | 0 | $ | 47,125,000 | $ | 0 | $ | 0 | $ | 0 | $ | 0 | $ | 0 | $ | 0 | $ | 0 | $ | 0 | $ | 0 | $ | 47,125,000 | |||||||||||||
| International Theatrical | 0 | 34,255,000 | 6,045,000 | 0 | 0 | 0 | 0 | 0 | 0 | 0 | 0 | 40,300,000 | |||||||||||||||||||||||||
| Domestic Home Video | 0 | 55,136,250 | 5,146,050 | 4,410,900 | 2,940,600 | 2,205,450 | 735,150 | 735,150 | 735,150 | 735,150 | 735,150 | 73,515,000 | |||||||||||||||||||||||||
| International Home Video | 0 | 22,054,500 | 15,438,150 | 2,205,450 | 1,323,270 | 882,180 | 441,090 | 441,090 | 441,090 | 441,090 | 441,090 | 44,109,000 | |||||||||||||||||||||||||
| Domestic Television | |||||||||||||||||||||||||||||||||||||
| PPV | 0 | 176,719 | 5,713,906 | 0 | 0 | 0 | 0 | 0 | 0 | 0 | 0 | 5,890,625 | |||||||||||||||||||||||||
| Pay TV | 0 | 636,188 | 15,904,688 | 4,665,375 | 0 | 0 | 0 | 0 | 0 | 0 | 0 | 21,206,250 | |||||||||||||||||||||||||
| Network TV | 0 | 0 | 0 | 1,272,375 | 4,241,250 | 1,272,375 | 1,272,375 | 424,125 | 0 | 0 | 0 | 8,482,500 | |||||||||||||||||||||||||
| Syndicated TV | 0 | 0 | 0 | 0 | 329,875 | 329,875 | 329,875 | 164,938 | 164,938 | 164,938 | 164,938 | 1,649,375 | |||||||||||||||||||||||||
| International Television | |||||||||||||||||||||||||||||||||||||
| Pay TV | 0 | 0 | 1,994,850 | 7,314,450 | 3,989,700 | 0 | 0 | 0 | 0 | 0 | 0 | 13,299,000 | |||||||||||||||||||||||||
| Syndicated TV | 0 | 0 | 0 | 0 | 4,030,000 | 4,030,000 | 4,030,000 | 2,015,000 | 2,015,000 | 2,015,000 | 2,015,000 | 20,150,000 | |||||||||||||||||||||||||
| Domestic Merchandising | 0 | 608,796 | 56,821 | 48,704 | 32,469 | 24,352 | 16,235 | 8,117 | 8,117 | 4,059 | 4,059 | 811,728 | |||||||||||||||||||||||||
| International Merchandising | 0 | 650,782 | 60,740 | 52,063 | 34,708 | 26,031 | 17,354 | 8,677 | 8,677 | 4,339 | 4,339 | 867,709 | |||||||||||||||||||||||||
Total Gross Receipts | $ | 0 | $ | 160,643,234 | $ | 50,360,204 | $ | 19,969,316 | $ | 16,921,873 | $ | 8,770,263 | $ | 6,842,079 | $ | 3,797,097 | $ | 3,372,972 | $ | 3,364,575 | $ | 3,364,575 | $ | 277,406,188 | |||||||||||||
Distribution Costs | |||||||||||||||||||||||||||||||||||||
| Domestic Theatrical | $ | 0 | $ | 9,425,000 | $ | 0 | $ | 0 | $ | 0 | $ | 0 | $ | 0 | $ | 0 | $ | 0 | $ | 0 | $ | 0 | $ | 9,425,000 | |||||||||||||
| International Theatrical | 0 | 6,851,000 | 1,209,000 | 0 | 0 | 0 | 0 | 0 | 0 | 0 | 0 | 8,060,000 | |||||||||||||||||||||||||
| Domestic Home Video | 0 | 10,292,100 | 735,150 | 588,120 | 441,090 | 441,090 | 441,090 | 441,090 | 441,090 | 441,090 | 441,090 | 14,703,000 | |||||||||||||||||||||||||
| International Home Video | 0 | 3,969,810 | 2,911,194 | 441,090 | 352,872 | 264,654 | 176,436 | 176,436 | 176,436 | 176,436 | 176,436 | 8,821,800 | |||||||||||||||||||||||||
| Domestic Television Cost | 0 | 372,288 | 3,722,875 | 1,489,150 | 744,575 | 372,288 | 148,915 | 148,915 | 148,915 | 148,915 | 148,915 | 7,445,750 | |||||||||||||||||||||||||
| International Television Cost | 0 | 334,490 | 3,344,900 | 1,337,960 | 668,980 | 334,490 | 133,796 | 133,796 | 133,796 | 133,796 | 133,796 | 6,689,800 | |||||||||||||||||||||||||
Total Distribution Costs | $ | 0 | $ | 31,244,688 | $ | 11,923,119 | $ | 3,856,320 | $ | 2,207,517 | $ | 1,412,522 | $ | 900,237 | $ | 900,237 | $ | 900,237 | $ | 900,237 | $ | 900,237 | $ | 55,145,350 | |||||||||||||
Publicity Expenses | |||||||||||||||||||||||||||||||||||||
| Domestic Theatrical | |||||||||||||||||||||||||||||||||||||
| Advertising | $ | 3,033,663 | $ | 27,302,964 | $ | 0 | $ | 0 | $ | 0 | $ | 0 | $ | 0 | $ | 0 | $ | 0 | $ | 0 | $ | 0 | $ | 30,336,626 | |||||||||||||
| Prints | 0 | 3,783,435 | 0 | 0 | 0 | 0 | 0 | 0 | 0 | 0 | 0 | 3,783,435 | |||||||||||||||||||||||||
| International Theatrical | |||||||||||||||||||||||||||||||||||||
| Advertising | 1,516,831 | 13,651,482 | 0 | 0 | 0 | 0 | 0 | 0 | 0 | 0 | 0 | 15,168,313 | |||||||||||||||||||||||||
| Prints | 0 | 1,607,960 | 283,758 | 0 | 0 | 0 | 0 | 0 | 0 | 0 | 0 | 1,891,717 | |||||||||||||||||||||||||
Total Publicity Expenses | $ | 4,550,494 | $ | 46,345,840 | $ | 283,758 | $ | 0 | $ | 0 | $ | 0 | $ | 0 | $ | 0 | $ | 0 | $ | 0 | $ | 0 | $ | 51,180,091 | |||||||||||||
Negative Costs | $ | 65,000,000 | $ | 0 | $ | 0 | $ | 0 | $ | 0 | $ | 0 | $ | 0 | $ | 0 | $ | 0 | $ | 0 | $ | 0 | $ | 65,000,000 | |||||||||||||
Contribution Profit | $ | (69,550,494 | ) | $ | 83,052,707 | $ | 38,153,328 | $ | 16,112,996 | $ | 14,714,356 | $ | 7,357,742 | $ | 5,941,842 | $ | 2,896,860 | $ | 2,472,735 | $ | 2,464,338 | $ | 2,464,338 | $ | 106,080,746 | ||||||||||||
Source: Exhibit 1 (Ultimate Revenues and Costs) multiplied by Exhibit 2 (Time of Cash Flow from Ultimates).
SANLI PASTORE & HILL, INC.
99
Exhibit 4: Time of Cash Flow from High Budget Comedy Film
Platinum Studios, Inc.
Film Entertainment: Licensed Film Division: Comedy - High Budget Films
Year of Cash Flow | 0 | 1 | 2 | 3 | 4 | 5 | 6 | 7 | 8 | 9 | 10 | Total | |||||||||||||||||||||||||
Gross Receipts | |||||||||||||||||||||||||||||||||||||
| Domestic Theatrical | $ | 0 | $ | 25,250,000 | $ | 0 | $ | 0 | $ | 0 | $ | 0 | $ | 0 | $ | 0 | $ | 0 | $ | 0 | $ | 0 | $ | 25,250,000 | |||||||||||||
| International Theatrical | 0 | 20,400,000 | 3,600,000 | 0 | 0 | 0 | 0 | 0 | 0 | 0 | 0 | 24,000,000 | |||||||||||||||||||||||||
| Domestic Home Video | 0 | 29,542,500 | 2,757,300 | 2,363,400 | 1,575,600 | 1,181,700 | 393,900 | 393,900 | 393,900 | 393,900 | 393,900 | 39,390,000 | |||||||||||||||||||||||||
| International Home Video | 0 | 11,817,000 | 8,271,900 | 1,181,700 | 709,020 | 472,680 | 236,340 | 236,340 | 236,340 | 236,340 | 236,340 | 23,634,000 | |||||||||||||||||||||||||
| Domestic Television | |||||||||||||||||||||||||||||||||||||
| PPV | 0 | 94,688 | 3,061,563 | 0 | 0 | 0 | 0 | 0 | 0 | 0 | 0 | 3,156,250 | |||||||||||||||||||||||||
| Pay TV | 0 | 340,875 | 8,521,875 | 2,499,750 | 0 | 0 | 0 | 0 | 0 | 0 | 0 | 11,362,500 | |||||||||||||||||||||||||
| Network TV | 0 | 0 | 0 | 681,750 | 2,272,500 | 681,750 | 681,750 | 227,250 | 0 | 0 | 0 | 4,545,000 | |||||||||||||||||||||||||
| Syndicated TV | 0 | 0 | 0 | 0 | 176,750 | 176,750 | 176,750 | 88,375 | 88,375 | 88,375 | 88,375 | 883,750 | |||||||||||||||||||||||||
| International Television | |||||||||||||||||||||||||||||||||||||
| Pay TV | 0 | 0 | 1,188,000 | 4,356,000 | 2,376,000 | 0 | 0 | 0 | 0 | 0 | 0 | 7,920,000 | |||||||||||||||||||||||||
| Syndicated TV | 0 | 0 | 0 | 0 | 2,400,000 | 2,400,000 | 2,400,000 | 1,200,000 | 1,200,000 | 1,200,000 | 1,200,000 | 12,000,000 | |||||||||||||||||||||||||
| Domestic Merchandising | 0 | 163,099 | 15,223 | 13,048 | 8,699 | 6,524 | 4,349 | 2,175 | 2,175 | 1,087 | 1,087 | 217,466 | |||||||||||||||||||||||||
| International Merchandising | 0 | 193,781 | 18,086 | 15,503 | 10,335 | 7,751 | 5,168 | 2,584 | 2,584 | 1,292 | 1,292 | 258,375 | |||||||||||||||||||||||||
Total Gross Receipts | $ | 0 | $ | 87,801,943 | $ | 27,433,946 | $ | 11,111,150 | $ | 9,528,904 | $ | 4,927,155 | $ | 3,898,257 | $ | 2,150,623 | $ | 1,923,373 | $ | 1,920,994 | $ | 1,920,994 | $ | 152,617,341 | |||||||||||||
Distribution Costs | |||||||||||||||||||||||||||||||||||||
| Domestic Theatrical | $ | 0 | $ | 5,050,000 | $ | 0 | $ | 0 | $ | 0 | $ | 0 | $ | 0 | $ | 0 | $ | 0 | $ | 0 | $ | 0 | $ | 5,050,000 | |||||||||||||
| International Theatrical | 0 | 4,080,000 | 720,000 | 0 | 0 | 0 | 0 | 0 | 0 | 0 | 0 | 4,800,000 | |||||||||||||||||||||||||
| Domestic Home Video | 0 | 5,514,600 | 393,900 | 315,120 | 236,340 | 236,340 | 236,340 | 236,340 | 236,340 | 236,340 | 236,340 | 7,878,000 | |||||||||||||||||||||||||
| International Home Video | 0 | 2,127,060 | 1,559,844 | 236,340 | 189,072 | 141,804 | 94,536 | 94,536 | 94,536 | 94,536 | 94,536 | 4,726,800 | |||||||||||||||||||||||||
| Domestic Television Cost | 0 | 199,475 | 1,994,750 | 797,900 | 398,950 | 199,475 | 79,790 | 79,790 | 79,790 | 79,790 | 79,790 | 3,989,500 | |||||||||||||||||||||||||
| International Television Cost | 0 | 199,200 | 1,992,000 | 796,800 | 398,400 | 199,200 | 79,680 | 79,680 | 79,680 | 79,680 | 79,680 | 3,984,000 | |||||||||||||||||||||||||
Total Distribution Costs | $ | 0 | $ | 17,170,335 | $ | 6,660,494 | $ | 2,146,160 | $ | 1,222,762 | $ | 776,819 | $ | 490,346 | $ | 490,346 | $ | 490,346 | $ | 490,346 | $ | 490,346 | $ | 30,428,300 | |||||||||||||
Publicity Expenses | |||||||||||||||||||||||||||||||||||||
| Domestic Theatrical | |||||||||||||||||||||||||||||||||||||
| Advertising | $ | 2,333,587 | $ | 21,002,280 | $ | 0 | $ | 0 | $ | 0 | $ | 0 | $ | 0 | $ | 0 | $ | 0 | $ | 0 | $ | 0 | $ | 23,335,866 | |||||||||||||
| Prints | 0 | 2,910,334 | 0 | 0 | 0 | 0 | 0 | 0 | 0 | 0 | 0 | 2,910,334 | |||||||||||||||||||||||||
| International Theatrical | |||||||||||||||||||||||||||||||||||||
| Advertising | 1,166,793 | 10,501,140 | 0 | 0 | 0 | 0 | 0 | 0 | 0 | 0 | 0 | 11,667,933 | |||||||||||||||||||||||||
| Prints | 0 | 1,236,892 | 218,275 | 0 | 0 | 0 | 0 | 0 | 0 | 0 | 0 | 1,455,167 | |||||||||||||||||||||||||
Total Publicity Expenses | $ | 3,500,380 | $ | 35,650,646 | $ | 218,275 | $ | 0 | $ | 0 | $ | 0 | $ | 0 | $ | 0 | $ | 0 | $ | 0 | $ | 0 | $ | 39,369,301 | |||||||||||||
Negative Costs | $ | 50,000,000 | $ | 0 | $ | 0 | $ | 0 | $ | 0 | $ | 0 | $ | 0 | $ | 0 | $ | 0 | $ | 0 | $ | 0 | $ | 50,000,000 | |||||||||||||
Contribution Profit | $ | (53,500,380 | ) | $ | 34,980,962 | $ | 20,555,177 | $ | 8,964,990 | $ | 8,306,142 | $ | 4,150,336 | $ | 3,407,911 | $ | 1,660,277 | $ | 1,433,027 | $ | 1,430,648 | $ | 1,430,648 | $ | 32,819,740 | ||||||||||||
Source: Exhibit 1 (Ultimate Revenues and Costs) multiplied by Exhibit 2 (Time of Cash Flow from Ultimates).
SANLI PASTORE & HILL, INC.
100
Exhibit 5: Time of Cash Flow from High Budget Thriller Film
Platinum Studios, Inc.
Film Entertainment: Licensed Film Division: Thriller - High Budget Films
Year of Cash Flow | 0 | 1 | 2 | 3 | 4 | 5 | 6 | 7 | 8 | 9 | 10 | Total | |||||||||||||||||||||||||
Gross Receipts | |||||||||||||||||||||||||||||||||||||
| Domestic Theatrical | $ | 0 | $ | 38,025,000 | $ | 0 | $ | 0 | $ | 0 | $ | 0 | $ | 0 | $ | 0 | $ | 0 | $ | 0 | $ | 0 | $ | 38,025,000 | |||||||||||||
| International Theatrical | 0 | 23,647,000 | 4,173,000 | 0 | 0 | 0 | 0 | 0 | 0 | 0 | 0 | 27,820,000 | |||||||||||||||||||||||||
| Domestic Home Video | 0 | 44,489,250 | 4,152,330 | 3,559,140 | 2,372,760 | 1,779,570 | 593,190 | 593,190 | 593,190 | 593,190 | 593,190 | 59,319,000 | |||||||||||||||||||||||||
| International Home Video | 0 | 17,795,700 | 12,456,990 | 1,779,570 | 1,067,742 | 711,828 | 355,914 | 355,914 | 355,914 | 355,914 | 355,914 | 35,591,400 | |||||||||||||||||||||||||
| Domestic Television | |||||||||||||||||||||||||||||||||||||
| PPV | 0 | 142,594 | 4,610,531 | 0 | 0 | 0 | 0 | 0 | 0 | 0 | 0 | 4,753,125 | |||||||||||||||||||||||||
| Pay TV | 0 | 513,338 | 12,833,438 | 3,764,475 | 0 | 0 | 0 | 0 | 0 | 0 | 0 | 17,111,250 | |||||||||||||||||||||||||
| Network TV | 0 | 0 | 0 | 1,026,675 | 3,422,250 | 1,026,675 | 1,026,675 | 342,225 | 0 | 0 | 0 | 6,844,500 | |||||||||||||||||||||||||
| Syndicated TV | 0 | 0 | 0 | 0 | 266,175 | 266,175 | 266,175 | 133,088 | 133,088 | 133,088 | 133,088 | 1,330,875 | |||||||||||||||||||||||||
| International Television | |||||||||||||||||||||||||||||||||||||
| Pay TV | 0 | 0 | 1,377,090 | 5,049,330 | 2,754,180 | 0 | 0 | 0 | 0 | 0 | 0 | 9,180,600 | |||||||||||||||||||||||||
| Syndicated TV | 0 | 0 | 0 | 0 | 2,782,000 | 2,782,000 | 2,782,000 | 1,391,000 | 1,391,000 | 1,391,000 | 1,391,000 | 13,910,000 | |||||||||||||||||||||||||
| Domestic Merchandising | 0 | 245,618 | 22,924 | 19,649 | 13,100 | 9,825 | 6,550 | 3,275 | 3,275 | 1,637 | 1,637 | 327,490 | |||||||||||||||||||||||||
| International Merchandising | 0 | 224,625 | 20,965 | 17,970 | 11,980 | 8,985 | 5,990 | 2,995 | 2,995 | 1,497 | 1,497 | 299,500 | |||||||||||||||||||||||||
Total Gross Receipts | $ | 0 | $ | 125,083,124 | $ | 39,647,268 | $ | 15,216,809 | $ | 12,690,187 | $ | 6,585,058 | $ | 5,036,494 | $ | 2,821,686 | $ | 2,479,461 | $ | 2,476,326 | $ | 2,476,326 | $ | 214,512,740 | |||||||||||||
Distribution Costs | �� | ||||||||||||||||||||||||||||||||||||
| Domestic Theatrical | $ | 0 | $ | 7,605,000 | $ | 0 | $ | 0 | $ | 0 | $ | 0 | $ | 0 | $ | 0 | $ | 0 | $ | 0 | $ | 0 | $ | 7,605,000 | |||||||||||||
| International Theatrical | 0 | 4,729,400 | 834,600 | 0 | 0 | 0 | 0 | 0 | 0 | 0 | 0 | 5,564,000 | |||||||||||||||||||||||||
| Domestic Home Video | 0 | 8,304,660 | 593,190 | 474,552 | 355,914 | 355,914 | 355,914 | 355,914 | 355,914 | 355,914 | 355,914 | 11,863,800 | |||||||||||||||||||||||||
| International Home Video | 0 | 3,203,226 | 2,349,032 | 355,914 | 284,731 | 213,548 | 142,366 | 142,366 | 142,366 | 142,366 | 142,366 | 7,118,280 | |||||||||||||||||||||||||
| Domestic Television Cost | 0 | 300,398 | 3,003,975 | 1,201,590 | 600,795 | 300,398 | 120,159 | 120,159 | 120,159 | 120,159 | 120,159 | 6,007,950 | |||||||||||||||||||||||||
| International Television Cost | 0 | 230,906 | 2,309,060 | 923,624 | 461,812 | 230,906 | 92,362 | 92,362 | 92,362 | 92,362 | 92,362 | 4,618,120 | |||||||||||||||||||||||||
Total Distribution Costs | $ | 0 | $ | 24,373,590 | $ | 9,089,857 | $ | 2,955,680 | $ | 1,703,252 | $ | 1,100,766 | $ | 710,801 | $ | 710,801 | $ | 710,801 | $ | 710,801 | $ | 710,801 | $ | 42,777,150 | |||||||||||||
Publicity Expenses | |||||||||||||||||||||||||||||||||||||
| Domestic Theatrical | |||||||||||||||||||||||||||||||||||||
| Advertising | $ | 3,033,663 | $ | 27,302,964 | $ | 0 | $ | 0 | $ | 0 | $ | 0 | $ | 0 | $ | 0 | $ | 0 | $ | 0 | $ | 0 | $ | 30,336,626 | |||||||||||||
| Prints | 0 | 3,783,435 | 0 | 0 | 0 | 0 | 0 | 0 | 0 | 0 | 0 | 3,783,435 | |||||||||||||||||||||||||
| International Theatrical | |||||||||||||||||||||||||||||||||||||
| Advertising | 1,516,831 | 13,651,482 | 0 | 0 | 0 | 0 | 0 | 0 | 0 | 0 | 0 | 15,168,313 | |||||||||||||||||||||||||
| Prints | 0 | 1,607,960 | 283,758 | 0 | 0 | 0 | 0 | 0 | 0 | 0 | 0 | 1,891,717 | |||||||||||||||||||||||||
Total Publicity Expenses | $ | 4,550,494 | $ | 46,345,840 | $ | 283,758 | $ | 0 | $ | 0 | $ | 0 | $ | 0 | $ | 0 | $ | 0 | $ | 0 | $ | 0 | $ | 51,180,091 | |||||||||||||
Negative Costs | $ | 65,000,000 | $ | 0 | $ | 0 | $ | 0 | $ | 0 | $ | 0 | $ | 0 | $ | 0 | $ | 0 | $ | 0 | $ | 0 | $ | 65,000,000 | |||||||||||||
Contribution Profit | $ | (69,550,494 | ) | $ | 54,363,695 | $ | 30,273,653 | $ | 12,261,129 | $ | 10,986,934 | $ | 5,484,292 | $ | 4,325,693 | $ | 2,110,885 | $ | 1,768,660 | $ | 1,765,525 | $ | 1,765,525 | $ | 55,555,499 | ||||||||||||
Source: Exhibit 1 (Ultimate Revenues and Costs) multiplied by Exhibit 2 (Time of Cash Flow from Ultimates).
SANLI PASTORE & HILL, INC.
101
Exhibit 6A
Platinum Studios, Inc.
Development of Equity Discount Rate
Date of Value: March 31, 2008
Sources: | |||||||||||
| Federal Reserve Statistical | |||||||||||
| Long-Term Risk-Free Rate | 4.32 | % | Release dated March 28, 2008 | ||||||||
| (20-Year Government Treasury Bonds) | |||||||||||
Add: | |||||||||||
| Equity Risk Premium | 6.30 | % | Ibbotson Associates'Stocks, Bonds, Bills & Inflation, 2007 Yearbook | ||||||||
| Size Premium | 4.35 | % | Ibid. | ||||||||
| Industry Premium Adjustment (SIC 78) * | 8.45 | % | Ibbotson Associates'Stocks, Bonds, Bills & Inflation, 2007 Yearbook | ||||||||
| Adjusted Equity Risk Premium | 19.10 | % | 19.10 | % | |||||||
| Specific Company Risk | 7.00 | % | Per company research and analysis | ||||||||
After-Tax Equity Discount Rate: | 30.42 | % | |||||||||
After-Tax Equity Discount Rate (rounded): | 30.4 | % | |||||||||
* SIC 78 Motion Pictures was most comparable to Platinum Studios, Inc. in regard to business operations and risk factors.
SANLI PASTORE & HILL, INC.
102
Exhibit 6B
Platinum Studios, Inc.
Development of Rate of Return on Debt
Date of Value: March 31, 2008
Sources: | |||||||||||||
Bank Prime Rate: | 5.25 | % | Federal Reserve Statistical Release | ||||||||||
| Rate as of March 28, 2008 | |||||||||||||
Corporate Bonds: | |||||||||||||
| Moody's Seasonal | Aaa | 5.52 | % | Ibid. | |||||||||
| Baa | 6.94 | % | Ibid. | ||||||||||
Weighted Average Interest Rate on Gatekeeper's Interest Bearing Debt | 8.25 | % | Per Management and SP&H Analysis | ||||||||||
After-Tax Rate of Return on Debt (rounded): | 5.0 | % | |||||||||||
| (Rate of Return on Debt x (1 - tax rate of 40%)) | |||||||||||||
SANLI PASTORE & HILL, INC.
103
Exhibit 6C
Platinum Studios, Inc.
Development of Weighted Average Cost of Capital (WACC)
Date of Value: March 31, 2008
Rate | Weight1 | WACC | ||||||||
| After-Tax Equity Discount Rate: (Exhibit 6A) | 30.4 | % | 47 | % | 14.4 | % | ||||
| After-Tax Rate of Return on Debt: (Exhibit 6B) | 5.0 | % | 53 | % | 2.6 | % | ||||
After-Tax WACC | 100 | % | 17.0 | % | ||||||
Less: | ||||||||||
| Long-Term Growth Rate | 3.1 | % | ||||||||
After-Tax Capitalization Rate | 13.9 | % | ||||||||
Note 1: Per average Debt to Equity ratio of a perpetual slate financing as defined in the Platinum Studios Film Fund, LLC Agreement (see Exhibit 7)
SANLI PASTORE & HILL, INC.
104
Exhibit 7
Platinum Studios, Inc.
Capital Structure per Film Fund, LLC Agreement
Date of Value: March 31, 2008
Slate Financing1 | |||||||
| Private Equity | 25 | % | $ | 45,000,000 | |||
| Senior Debt | 50 | % | 90,000,000 | ||||
| Mezzanine Debt | 25 | % | 45,000,000 | ||||
| Total Slate Financing | 100 | % | $ | 180,000,000 | |||
| Average Film Budget | $ | 12,000,000 | |||||
2008 | 2009 | 2010 | 2011 | 2012 | 2013 | 2014 | 2015 | 2016 | 2017 | 2018 | 2019 | 2020 | 2021 | 2022 | ||||||||||||||||||||||||||||||||
(1) | (2) | (3) | (4) | (5) | (6) | (7) | (8) | (9) | (10) | (11) | (12) | (13) | (14) | (15) | ||||||||||||||||||||||||||||||||
| Projects (Schedule 11) | ||||||||||||||||||||||||||||||||||||||||||||||
| Film 1 - 2008 | $ | 12,000,000 | - | - | - | - | - | - | ||||||||||||||||||||||||||||||||||||||
| Film 2 - 2009 | - | 12,000,000 | - | - | - | - | - | |||||||||||||||||||||||||||||||||||||||
| Film 3 - 2009 | - | 12,000,000 | - | - | - | - | - | |||||||||||||||||||||||||||||||||||||||
| Film 4 - 2010 | - | - | 12,000,000 | - | - | - | - | �� | ||||||||||||||||||||||||||||||||||||||
| Film 5 - 2010 | - | - | 12,000,000 | - | - | - | - | |||||||||||||||||||||||||||||||||||||||
| Film 6 - 2011 | - | - | 12,000,000 | 12,000,000 | - | - | - | |||||||||||||||||||||||||||||||||||||||
| Film 7 - 2011 | - | - | - | 12,000,000 | - | - | - | |||||||||||||||||||||||||||||||||||||||
| Film 8 - 2011 | - | - | - | 12,000,000 | - | - | - | |||||||||||||||||||||||||||||||||||||||
| Film 9 - 2012 | - | - | - | - | 12,000,000 | - | - | |||||||||||||||||||||||||||||||||||||||
| Film 10 - 2012 | - | - | - | - | 12,000,000 | - | - | |||||||||||||||||||||||||||||||||||||||
| Film 11 - 2012 | - | - | - | - | 12,000,000 | - | - | |||||||||||||||||||||||||||||||||||||||
| Film 12 - 2013 | - | - | - | - | - | 12,000,000 | - | |||||||||||||||||||||||||||||||||||||||
| Film 13 - 2013 | - | - | - | - | - | 12,000,000 | - | |||||||||||||||||||||||||||||||||||||||
| Film 14 - 2013 | - | - | - | - | - | 12,000,000 | - | |||||||||||||||||||||||||||||||||||||||
| Film 15 - 2014 | - | - | - | - | - | - | 12,000,000 | |||||||||||||||||||||||||||||||||||||||
| Film 16 - 2014 | - | - | - | - | - | - | 12,000,000 | |||||||||||||||||||||||||||||||||||||||
| Film 17 - 2014 | - | - | - | - | - | - | 12,000,000 | |||||||||||||||||||||||||||||||||||||||
Total Slate Financing | $ | 12,000,000 | $ | 24,000,000 | $ | 36,000,000 | $ | 36,000,000 | $ | 36,000,000 | $ | 36,000,000 | $ | 36,000,000 | ||||||||||||||||||||||||||||||||
Cumulative Slate Financing | $ | 12,000,000 | $ | 36,000,000 | $ | 72,000,000 | $ | 108,000,000 | $ | 144,000,000 | $ | 180,000,000 | $ | 216,000,000 | ||||||||||||||||||||||||||||||||
Slate 1 | 180,000,000 | |||||||||||||||||||||||||||||||||||||||||||||
| Number of Projects | 1 | 2 | 3 | 3 | 3 | 3 | ||||||||||||||||||||||||||||||||||||||||
| Equity | 12,000,000 | 36,000,000 | 45,000,000 | 45,000,000 | 45,000,000 | 45,000,000 | ||||||||||||||||||||||||||||||||||||||||
| Debt | 0 | 0 | 27,000,000 | 63,000,000 | 99,000,000 | 135,000,000 | ||||||||||||||||||||||||||||||||||||||||
| Debt / Equity | 0 | 0 | 0.60 | 1.40 | 2.20 | 3.00 | ||||||||||||||||||||||||||||||||||||||||
Slate 2 | 180,000,000 | |||||||||||||||||||||||||||||||||||||||||||||
| Number of Projects | 1 | 2 | 3 | 3 | 3 | 3 | ||||||||||||||||||||||||||||||||||||||||
| Debt / Equity | 0 | 0 | 0.60 | 1.40 | 2.20 | 3.00 | ||||||||||||||||||||||||||||||||||||||||
Slate 3 | 180,000,000 | |||||||||||||||||||||||||||||||||||||||||||||
| Number of Projects | 1 | 2 | 3 | 3 | 3 | 3 | ||||||||||||||||||||||||||||||||||||||||
| Debt / Equity | 0 | 0 | 0.60 | 1.40 | 2.20 | 3.00 | ||||||||||||||||||||||||||||||||||||||||
Slate 4 | 180,000,000 | |||||||||||||||||||||||||||||||||||||||||||||
| Number of Projects | 1 | 2 | 3 | 3 | 3 | 3 | ||||||||||||||||||||||||||||||||||||||||
| Debt / Equity | 0.00 | 0.00 | 0.60 | 1.40 | 2.20 | 3.00 | ||||||||||||||||||||||||||||||||||||||||
| Average Debt / Equity | 0.00 | 0.00 | 0.60 | 0.70 | 1.10 | 1.80 | 0.70 | 1.10 | 1.80 | 0.70 | 1.10 | 1.80 | ||||||||||||||||||||||||||||||||||
| % Debt | 0.00 | % | 0.00 | % | 37.50 | % | 41.18 | % | 52.38 | % | 64.29 | % | 41.18 | % | 52.38 | % | 64.29 | % | 41.18 | % | 52.38 | % | 64.29 | % | ||||||||||||||||||||||
Average % Debt (if Fund is perpetual) | 52.61 | % | ||||||||||||||||||||||||||||||||||||||||||||
Note 1: Per Platinum Studios Film Fund, LLC
SANLI PASTORE & HILL, INC.
105
Exhibit 8: Ultimate Revenues and Costs
Platinum Studios, Inc.
Film Entertainment: Joint Venture Film Division Assumptions
Action | Comedy | Thriller | Horror | |||||||||||||||||||||||||
Low Budget | Low Budget | Low Budget | Low Budget | |||||||||||||||||||||||||
| Projected Budget | $ | 25,000,000 | $ | 15,000,000 | $ | 20,000,000 | $ | 15,000,000 | ||||||||||||||||||||
| Implied Domestic Box Office | Average of Median and Mean Multiple of Low Budget Films; Based on Box Office Mojo data | $ | 33,000,000 | 1.32 | $ | 17,550,000 | 1.17 | $ | 31,000,000 | 1.55 | $ | 12,150,000 | 0.81 | |||||||||||||||
| Implied International Box Office | Average of Median and Mean Multiple of Low Budget Films; Based on Box Office Mojo data | $ | 40,750,000 | 1.63 | $ | 7,200,000 | 0.48 | $ | 19,400,000 | 0.97 | $ | 15,000,000 | 1.00 | |||||||||||||||
Gross Receipts | Notes | |||||||||||||||||||||||||||
| Domestic Theatrical | Based on Industry Estimates, Baselineresearch and Vogel 2007 | $ | 16,500,000 | 50.0 | % | $ | 8,775,000 | 50.0 | % | $ | 15,500,000 | 50.0 | % | $ | 6,075,000 | 50.0 | % | |||||||||||
| International Theatrical | Based on Industry Estimates, Baselineresearch and Vogel 2007 | 16,300,000 | 40.0 | % | 2,880,000 | 40.0 | % | 7,760,000 | 40.0 | % | 6,000,000 | 40.0 | % | |||||||||||||||
| Domestic Home Video | % of Domestic Box Office, Based on Historical Actual of Marvel PG-13 Films | 25,740,000 | 78.0 | % | 13,689,000 | 78.0 | % | 24,180,000 | 78.0 | % | 9,477,000 | 78.0 | % | |||||||||||||||
| International Home Video | % of Domestic Home Video, Based on Historical Actual of Marvel PG-13 Films | 15,444,000 | 60.0 | % | 8,213,400 | 60.0 | % | 14,508,000 | 60.0 | % | 5,686,200 | 60.0 | % | |||||||||||||||
| Domestic Television | ||||||||||||||||||||||||||||
| PPV | % of Domestic Theatrical, cap of $7.5M, Based on Industry Estimates, Marvel | 2,062,500 | 12.5 | % | 1,096,875 | 12.5 | % | 1,937,500 | 12.5 | % | 759,375 | 12.5 | % | |||||||||||||||
| Pay TV | % of Domestic Theatrical, cap of $17.5M, Based on Industry Estimates, Marvel | 7,425,000 | 45.0 | % | 3,948,750 | 45.0 | % | 6,975,000 | 45.0 | % | 2,733,750 | 45.0 | % | |||||||||||||||
| Network TV | % of Domestic Theatrical, cap of $40M, Based on Industry Estimates, Marvel | 2,970,000 | 18.0 | % | 1,579,500 | 18.0 | % | 2,790,000 | 18.0 | % | 1,093,500 | 18.0 | % | |||||||||||||||
| Syndicated TV | % of Domestic Theatrical | 577,500 | 3.5 | % | 307,125 | 3.5 | % | 542,500 | 3.5 | % | 212,625 | 3.5 | % | |||||||||||||||
| International Television | ||||||||||||||||||||||||||||
| Pay TV | % of International Theatrical, cap of $30M, Based on Industry Estimates, Marvel | 5,379,000 | 33.0 | % | 950,400 | 33.0 | % | 2,560,800 | 33.0 | % | 1,980,000 | 33.0 | % | |||||||||||||||
| Network TV | % of International Theatrical, cap of $30M, Based on Industry Estimates, Marvel | 8,150,000 | 50.0 | % | 1,440,000 | 50.0 | % | 3,880,000 | 50.0 | % | 3,000,000 | 50.0 | % | |||||||||||||||
| Domestic Merchandising | % of Domestic Box Office less 35% Distribution Fees based on SNL Kagan 2007; Platinum collects 25% of Net | 284,213 | 0.9 | % | 75,575 | 0.4 | % | 133,494 | 0.4 | % | 26,160 | 0.2 | % | |||||||||||||||
| International Merchandising | % of International Box Office less 35% Distribution Fees based on SNL Kagan 2007; Platinum collects 25% of Net | 350,959 | 0.9 | % | 31,005 | 0.4 | % | 83,541 | 0.4 | % | 32,297 | 0.2 | % | |||||||||||||||
Total Gross Receipts | $ | 101,183,172 | $ | 42,986,630 | $ | 80,850,835 | $ | 37,075,907 | ||||||||||||||||||||
Distribution Costs | ||||||||||||||||||||||||||||
| Domestic Theatrical | % of Domestic Theatrical, Vogel 2007 | $ | 3,300,000 | 20.0 | % | $ | 1,755,000 | 20.0 | % | $ | 3,100,000 | 20.0 | % | $ | 1,215,000 | 20.0 | % | |||||||||||
| International Theatrical | % of International Theatrical, Vogel 2007 | 3,260,000 | 20.0 | % | 576,000 | 20.0 | % | 1,552,000 | 20.0 | % | 1,200,000 | 20.0 | % | |||||||||||||||
| Domestic Home Video | % of Domestic Home Video Revenue, Based on Industry Estimates, Vogel 2007 | 5,148,000 | 20.0 | % | 2,737,800 | 20.0 | % | 4,836,000 | 20.0 | % | 1,895,400 | 20.0 | % | |||||||||||||||
| International Home Video | % of International Home Video Revenue, Based on Industry Estimates, Vogel 2007 | 3,088,800 | 20.0 | % | 1,642,680 | 20.0 | % | 2,901,600 | 20.0 | % | 1,137,240 | 20.0 | % | |||||||||||||||
| Domestic Television Cost | % of Television Revenue, Based on Industry Estimates, Marvel | 2,607,000 | 20.0 | % | 1,386,450 | 20.0 | % | 2,449,000 | 20.0 | % | 959,850 | 20.0 | % | |||||||||||||||
| International Television Cost | % of Television Revenue, Based on Industry Estimates, Marvel | 2,705,800 | 20.0 | % | 478,080 | 20.0 | % | 1,288,160 | 20.0 | % | 996,000 | 20.0 | % | |||||||||||||||
Total Distribution Costs | $ | 20,109,600 | $ | 8,576,010 | $ | 16,126,760 | $ | 7,403,490 | ||||||||||||||||||||
Publicity Expenses | ||||||||||||||||||||||||||||
| Domestic Theatrical | ||||||||||||||||||||||||||||
| Advertising | % of Budget, 2006 Average Ad / Negative Costs, MPAA | $ | 11,667,933 | 46.7 | % | $ | 7,000,760 | 46.7 | % | $ | 9,334,347 | 46.7 | % | $ | 7,000,760 | 46.7 | % | |||||||||||
| Publicity | % of Budget, 2006 Average Print / Negative Costs, MPAA | 1,455,167 | 5.8 | % | 873,100 | 5.8 | % | 1,164,134 | 5.8 | % | 873,100 | 5.8 | % | |||||||||||||||
| International Theatrical | ||||||||||||||||||||||||||||
| Advertising | % of Domestic Advertising | 5,833,967 | 50.0 | % | 3,500,380 | 50.0 | % | 4,667,173 | 50.0 | % | 3,500,380 | 50.0 | % | |||||||||||||||
| Publicity | % of Domestic Publicity | 727,584 | 50.0 | % | 436,550 | 50.0 | % | 582,067 | 50.0 | % | 436,550 | 50.0 | % | |||||||||||||||
Total Publicity Expense | $ | 19,684,650 | $ | 11,810,790 | $ | 15,747,720 | $ | 11,810,790 | ||||||||||||||||||||
Negative Costs | Same as Projected Budget | $ | 25,000,000 | $ | 15,000,000 | $ | 20,000,000 | $ | 15,000,000 | |||||||||||||||||||
Contribution Profit | % of Total Gross Receipts | $ | 36,388,921 | 36.0 | % | $ | 7,599,829 | 17.7 | % | $ | 28,976,355 | 35.8 | % | $ | 2,861,627 | 7.7 | % | |||||||||||
= Inputs/Assumptions
SANLI PASTORE & HILL, INC.
106
Exhibit 9: Time of Cash Flow from Low Budget Action Film
Platinum Studios, Inc.
Film Entertainment: Joint Venture Film Division: Action - Low Budget
Year of Cash Flow | 0 | 1 | 2 | 3 | 4 | 5 | 6 | 7 | 8 | 9 | 10 | Total | |||||||||||||||||||||||||
Gross Receipts | |||||||||||||||||||||||||||||||||||||
| Domestic Theatrical | $ | 0 | $ | 16,500,000 | $ | 0 | $ | 0 | $ | 0 | $ | 0 | $ | 0 | $ | 0 | $ | 0 | $ | 0 | $ | 0 | $ | 16,500,000 | |||||||||||||
| International Theatrical | 0 | 13,855,000 | 2,445,000 | 0 | 0 | 0 | 0 | 0 | 0 | 0 | 0 | 16,300,000 | |||||||||||||||||||||||||
| Domestic Home Video | 0 | 19,305,000 | 1,801,800 | 1,544,400 | 1,029,600 | 772,200 | 257,400 | 257,400 | 257,400 | 257,400 | 257,400 | 25,740,000 | |||||||||||||||||||||||||
| International Home Video | 0 | 7,722,000 | 5,405,400 | 772,200 | 463,320 | 308,880 | 154,440 | 154,440 | 154,440 | 154,440 | 154,440 | 15,444,000 | |||||||||||||||||||||||||
| Domestic Television | |||||||||||||||||||||||||||||||||||||
| PPV | 0 | 61,875 | 2,000,625 | 0 | 0 | 0 | 0 | 0 | 0 | 0 | 0 | 2,062,500 | |||||||||||||||||||||||||
| Pay TV | 0 | 222,750 | 5,568,750 | 1,633,500 | 0 | 0 | 0 | 0 | 0 | 0 | 0 | 7,425,000 | |||||||||||||||||||||||||
| Network TV | 0 | 0 | 0 | 445,500 | 1,485,000 | 445,500 | 445,500 | 148,500 | 0 | 0 | 0 | 2,970,000 | |||||||||||||||||||||||||
| Syndicated TV | 0 | 0 | 0 | 0 | 115,500 | 115,500 | 115,500 | 57,750 | 57,750 | 57,750 | 57,750 | 577,500 | |||||||||||||||||||||||||
| International Television | |||||||||||||||||||||||||||||||||||||
| Pay TV | 0 | 0 | 806,850 | 2,958,450 | 1,613,700 | 0 | 0 | 0 | 0 | 0 | 0 | 5,379,000 | |||||||||||||||||||||||||
| Syndicated TV | 0 | 0 | 0 | 0 | 1,630,000 | 1,630,000 | 1,630,000 | 815,000 | 815,000 | 815,000 | 815,000 | 8,150,000 | |||||||||||||||||||||||||
| Domestic Merchandising | 0 | 213,159 | 19,895 | 17,053 | 11,369 | 8,526 | 5,684 | 2,842 | 2,842 | 1,421 | 1,421 | 284,213 | |||||||||||||||||||||||||
| International Merchandising | 0 | 263,220 | 24,567 | 21,058 | 14,038 | 10,529 | 7,019 | 3,510 | 3,510 | 1,755 | 1,755 | 350,959 | |||||||||||||||||||||||||
Total Gross Receipts | $ | 0 | $ | 58,143,004 | $ | 18,072,887 | $ | 7,392,160 | $ | 6,362,527 | $ | 3,291,135 | $ | 2,615,543 | $ | 1,439,442 | $ | 1,290,942 | $ | 1,287,766 | $ | 1,287,766 | $ | 101,183,172 | |||||||||||||
Distribution Costs | |||||||||||||||||||||||||||||||||||||
| Domestic Theatrical | $ | 0 | $ | 3,300,000 | $ | 0 | $ | 0 | $ | 0 | $ | 0 | $ | 0 | $ | 0 | $ | 0 | $ | 0 | $ | 0 | $ | 3,300,000 | |||||||||||||
| International Theatrical | 0 | 2,771,000 | 489,000 | 0 | 0 | 0 | 0 | 0 | 0 | 0 | 0 | 3,260,000 | |||||||||||||||||||||||||
| Domestic Home Video | 0 | 3,603,600 | 257,400 | 205,920 | 154,440 | 154,440 | 154,440 | 154,440 | 154,440 | 154,440 | 154,440 | 5,148,000 | |||||||||||||||||||||||||
| International Home Video | 0 | 1,389,960 | 1,019,304 | 154,440 | 123,552 | 92,664 | 61,776 | 61,776 | 61,776 | 61,776 | 61,776 | 3,088,800 | |||||||||||||||||||||||||
| Domestic Television Cost | 0 | 130,350 | 1,303,500 | 521,400 | 260,700 | 130,350 | 52,140 | 52,140 | 52,140 | 52,140 | 52,140 | 2,607,000 | |||||||||||||||||||||||||
| International Television Cost | 0 | 135,290 | 1,352,900 | 541,160 | 270,580 | 135,290 | 54,116 | 54,116 | 54,116 | 54,116 | 54,116 | 2,705,800 | |||||||||||||||||||||||||
Total Distribution Costs | $ | 0 | $ | 11,330,200 | $ | 4,422,104 | $ | 1,422,920 | $ | 809,272 | $ | 512,744 | $ | 322,472 | $ | 322,472 | $ | 322,472 | $ | 322,472 | $ | 322,472 | $ | 20,109,600 | |||||||||||||
Publicity Expenses | |||||||||||||||||||||||||||||||||||||
| Domestic Theatrical | |||||||||||||||||||||||||||||||||||||
| Advertising | $ | 1,166,793 | $ | 10,501,140 | $ | 0 | $ | 0 | $ | 0 | $ | 0 | $ | 0 | $ | 0 | $ | 0 | $ | 0 | $ | 0 | $ | 11,667,933 | |||||||||||||
| Prints | 0 | 1,455,167 | 0 | 0 | 0 | 0 | 0 | 0 | 0 | 0 | 0 | 1,455,167 | |||||||||||||||||||||||||
| International Theatrical | |||||||||||||||||||||||||||||||||||||
| Advertising | 583,397 | 5,250,570 | 0 | 0 | 0 | 0 | 0 | 0 | 0 | 0 | 0 | 5,833,967 | |||||||||||||||||||||||||
| Prints | 0 | 618,446 | 109,138 | 0 | 0 | 0 | 0 | 0 | 0 | 0 | 0 | 727,584 | |||||||||||||||||||||||||
Total Publicity Expenses | $ | 1,750,190 | $ | 17,825,323 | $ | 109,138 | $ | 0 | $ | 0 | $ | 0 | $ | 0 | $ | 0 | $ | 0 | $ | 0 | $ | 0 | $ | 19,684,650 | |||||||||||||
Negative Costs | $ | 25,000,000 | $ | 0 | $ | 0 | $ | 0 | $ | 0 | $ | 0 | $ | 0 | $ | 0 | $ | 0 | $ | 0 | $ | 0 | $ | 25,000,000 | |||||||||||||
Contribution Profit | $ | (26,750,190 | ) | $ | 28,987,481 | $ | 13,541,645 | $ | 5,969,240 | $ | 5,553,255 | $ | 2,778,391 | $ | 2,293,071 | $ | 1,116,970 | $ | 968,470 | $ | 965,294 | $ | 965,294 | $ | 36,388,921 | ||||||||||||
Source: Exhibit 8 (Ultimate Revenues and Costs) multiplied by Exhibit 2 (Time of Cash Flow from Ultimates).
SANLI PASTORE & HILL, INC.
107
Exhibit 10: Time of Cash Flow from Low Budget Comedy Film
Platinum Studios, Inc.
Film Entertainment: Joint Venture Film Division: Comedy - Low Budget
Year of Cash Flow | 0 | 1 | 2 | 3 | 4 | 5 | 6 | 7 | 8 | 9 | 10 | Total | |||||||||||||||||||||||||
Gross Receipts | |||||||||||||||||||||||||||||||||||||
| Domestic Theatrical | $ | 0 | $ | 8,775,000 | $ | 0 | $ | 0 | $ | 0 | $ | 0 | $ | 0 | $ | 0 | $ | 0 | $ | 0 | $ | 0 | $ | 8,775,000 | |||||||||||||
| International Theatrical | 0 | 2,448,000 | 432,000 | 0 | 0 | 0 | 0 | 0 | 0 | 0 | 0 | 2,880,000 | |||||||||||||||||||||||||
| Domestic Home Video | 0 | 10,266,750 | 958,230 | 821,340 | 547,560 | 410,670 | 136,890 | 136,890 | 136,890 | 136,890 | 136,890 | 13,689,000 | |||||||||||||||||||||||||
| International Home Video | 0 | 4,106,700 | 2,874,690 | 410,670 | 246,402 | 164,268 | 82,134 | 82,134 | 82,134 | 82,134 | 82,134 | 8,213,400 | |||||||||||||||||||||||||
| Domestic Television | |||||||||||||||||||||||||||||||||||||
| PPV | 0 | 32,906 | 1,063,969 | 0 | 0 | 0 | 0 | 0 | 0 | 0 | 0 | 1,096,875 | |||||||||||||||||||||||||
| Pay TV | 0 | 118,463 | 2,961,563 | 868,725 | 0 | 0 | 0 | 0 | 0 | 0 | 0 | 3,948,750 | |||||||||||||||||||||||||
| Network TV | 0 | 0 | 0 | 236,925 | 789,750 | 236,925 | 236,925 | 78,975 | 0 | 0 | 0 | 1,579,500 | |||||||||||||||||||||||||
| Syndicated TV | 0 | 0 | 0 | 0 | 61,425 | 61,425 | 61,425 | 30,713 | 30,713 | 30,713 | 30,713 | 307,125 | |||||||||||||||||||||||||
| International Television | |||||||||||||||||||||||||||||||||||||
| Pay TV | 0 | 0 | 142,560 | 522,720 | 285,120 | 0 | 0 | 0 | 0 | 0 | 0 | 950,400 | |||||||||||||||||||||||||
| Syndicated TV | 0 | 0 | 0 | 0 | 288,000 | 288,000 | 288,000 | 144,000 | 144,000 | 144,000 | 144,000 | 1,440,000 | |||||||||||||||||||||||||
| Domestic Merchandising | 0 | 56,681 | 5,290 | 4,534 | 3,023 | 2,267 | 1,511 | 756 | 756 | 378 | 378 | 75,575 | |||||||||||||||||||||||||
| International Merchandising | 0 | 23,254 | 2,170 | 1,860 | 1,240 | 930 | 620 | 310 | 310 | 155 | 155 | 31,005 | |||||||||||||||||||||||||
Total Gross Receipts | $ | 0 | $ | 25,827,754 | $ | 8,440,472 | $ | 2,866,775 | $ | 2,222,520 | $ | 1,164,485 | $ | 807,506 | $ | 473,777 | $ | 394,802 | $ | 394,269 | $ | 394,269 | $ | 42,986,630 | |||||||||||||
Distribution Costs | |||||||||||||||||||||||||||||||||||||
| Domestic Theatrical | $ | 0 | $ | 1,755,000 | $ | 0 | $ | 0 | $ | 0 | $ | 0 | $ | 0 | $ | 0 | $ | 0 | $ | 0 | $ | 0 | $ | 1,755,000 | |||||||||||||
| International Theatrical | 0 | 489,600 | 86,400 | 0 | 0 | 0 | 0 | 0 | 0 | 0 | 0 | 576,000 | |||||||||||||||||||||||||
| Domestic Home Video | 0 | 1,916,460 | 136,890 | 109,512 | 82,134 | 82,134 | 82,134 | 82,134 | 82,134 | 82,134 | 82,134 | 2,737,800 | |||||||||||||||||||||||||
| International Home Video | 0 | 739,206 | 542,084 | 82,134 | 65,707 | 49,280 | 32,854 | 32,854 | 32,854 | 32,854 | 32,854 | 1,642,680 | |||||||||||||||||||||||||
| Domestic Television Cost | 0 | 69,323 | 693,225 | 277,290 | 138,645 | 69,323 | 27,729 | 27,729 | 27,729 | 27,729 | 27,729 | 1,386,450 | |||||||||||||||||||||||||
| International Television Cost | 0 | 23,904 | 239,040 | 95,616 | 47,808 | 23,904 | 9,562 | 9,562 | 9,562 | 9,562 | 9,562 | 478,080 | |||||||||||||||||||||||||
Total Distribution Costs | $ | 0 | $ | 4,993,493 | $ | 1,697,639 | $ | 564,552 | $ | 334,294 | $ | 224,641 | $ | 152,278 | $ | 152,278 | $ | 152,278 | $ | 152,278 | $ | 152,278 | $ | 8,576,010 | |||||||||||||
Publicity Expenses | |||||||||||||||||||||||||||||||||||||
| Domestic Theatrical | |||||||||||||||||||||||||||||||||||||
| Advertising | $ | 700,076 | $ | 6,300,684 | $ | 0 | $ | 0 | $ | 0 | $ | 0 | $ | 0 | $ | 0 | $ | 0 | $ | 0 | $ | 0 | $ | 7,000,760 | |||||||||||||
| Prints | 0 | 873,100 | 0 | 0 | 0 | 0 | 0 | 0 | 0 | 0 | 0 | 873,100 | |||||||||||||||||||||||||
| International Theatrical | |||||||||||||||||||||||||||||||||||||
| Advertising | 350,038 | 3,150,342 | 0 | 0 | 0 | 0 | 0 | 0 | 0 | 0 | 0 | 3,500,380 | |||||||||||||||||||||||||
| Prints | 0 | 371,068 | 65,483 | 0 | 0 | 0 | 0 | 0 | 0 | 0 | 0 | 436,550 | |||||||||||||||||||||||||
Total Publicity Expenses | $ | 1,050,114 | $ | 10,695,194 | $ | 65,483 | $ | 0 | $ | 0 | $ | 0 | $ | 0 | $ | 0 | $ | 0 | $ | 0 | $ | 0 | $ | 11,810,790 | |||||||||||||
Negative Costs | $ | 15,000,000 | $ | 0 | $ | 0 | $ | 0 | $ | 0 | $ | 0 | $ | 0 | $ | 0 | $ | 0 | $ | 0 | $ | 0 | $ | 15,000,000 | |||||||||||||
Contribution Profit | $ | (16,050,114 | ) | $ | 10,139,067 | $ | 6,677,350 | $ | 2,302,223 | $ | 1,888,226 | $ | 939,844 | $ | 655,227 | $ | 321,499 | $ | 242,524 | $ | 241,991 | $ | 241,991 | $ | 7,599,829 | ||||||||||||
Source: Exhibit 8 (Ultimate Revenues and Costs) multiplied by Exhibit 2 (Time of Cash Flow from Ultimates).
SANLI PASTORE & HILL, INC.
108
Exhibit 11: Time of Cash Flow from Low Budget Thriller Film
Platinum Studios, Inc.
Film Entertainment: Joint Venture Film Division: Thriller - Low Budget
Year of Cash Flow | 0 | 1 | 2 | 3 | 4 | 5 | 6 | 7 | 8 | 9 | 10 | Total | |||||||||||||||||||||||||
Gross Receipts | |||||||||||||||||||||||||||||||||||||
| Domestic Theatrical | $ | 0 | $ | 15,500,000 | $ | 0 | $ | 0 | $ | 0 | $ | 0 | $ | 0 | $ | 0 | $ | 0 | $ | 0 | $ | 0 | $ | 15,500,000 | |||||||||||||
| International Theatrical | 0 | 6,596,000 | 1,164,000 | 0 | 0 | 0 | 0 | 0 | 0 | 0 | 0 | 7,760,000 | |||||||||||||||||||||||||
| Domestic Home Video | 0 | 18,135,000 | 1,692,600 | 1,450,800 | 967,200 | 725,400 | 241,800 | 241,800 | 241,800 | 241,800 | 241,800 | 24,180,000 | |||||||||||||||||||||||||
| International Home Video | 0 | 7,254,000 | 5,077,800 | 725,400 | 435,240 | 290,160 | 145,080 | 145,080 | 145,080 | 145,080 | 145,080 | 14,508,000 | |||||||||||||||||||||||||
| Domestic Television | |||||||||||||||||||||||||||||||||||||
| PPV | 0 | 58,125 | 1,879,375 | 0 | 0 | 0 | 0 | 0 | 0 | 0 | 0 | 1,937,500 | |||||||||||||||||||||||||
| Pay TV | 0 | 209,250 | 5,231,250 | 1,534,500 | 0 | 0 | 0 | 0 | 0 | 0 | 0 | 6,975,000 | |||||||||||||||||||||||||
| Network TV | 0 | 0 | 0 | 418,500 | 1,395,000 | 418,500 | 418,500 | 139,500 | 0 | 0 | 0 | 2,790,000 | |||||||||||||||||||||||||
| Syndicated TV | 0 | 0 | 0 | 0 | 108,500 | 108,500 | 108,500 | 54,250 | 54,250 | 54,250 | 54,250 | 542,500 | |||||||||||||||||||||||||
| International Television | |||||||||||||||||||||||||||||||||||||
| Pay TV | 0 | 0 | 384,120 | 1,408,440 | 768,240 | 0 | 0 | 0 | 0 | 0 | 0 | 2,560,800 | |||||||||||||||||||||||||
| Syndicated TV | 0 | 0 | 0 | 0 | 776,000 | 776,000 | 776,000 | 388,000 | 388,000 | 388,000 | 388,000 | 3,880,000 | |||||||||||||||||||||||||
| Domestic Merchandising | 0 | 100,120 | 9,345 | 8,010 | 5,340 | 4,005 | 2,670 | 1,335 | 1,335 | 667 | 667 | 133,494 | |||||||||||||||||||||||||
| International Merchandising | 0 | 62,656 | 5,848 | 5,012 | 3,342 | 2,506 | 1,671 | 835 | 835 | 418 | 418 | 83,541 | |||||||||||||||||||||||||
Total Gross Receipts | $ | 0 | $ | 47,915,151 | $ | 15,444,337 | $ | 5,550,662 | $ | 4,458,861 | $ | 2,325,071 | $ | 1,694,221 | $ | 970,800 | $ | 831,300 | $ | 830,215 | $ | 830,215 | $ | 80,850,835 | |||||||||||||
Distribution Costs | |||||||||||||||||||||||||||||||||||||
| Domestic Theatrical | $ | 0 | $ | 3,100,000 | $ | 0 | $ | 0 | $ | 0 | $ | 0 | $ | 0 | $ | 0 | $ | 0 | $ | 0 | $ | 0 | $ | 3,100,000 | |||||||||||||
| International Theatrical | 0 | 1,319,200 | 232,800 | 0 | 0 | 0 | 0 | 0 | �� | 0 | 0 | 0 | 1,552,000 | ||||||||||||||||||||||||
| Domestic Home Video | 0 | 3,385,200 | 241,800 | 193,440 | 145,080 | 145,080 | 145,080 | 145,080 | 145,080 | 145,080 | 145,080 | 4,836,000 | |||||||||||||||||||||||||
| International Home Video | 0 | 1,305,720 | 957,528 | 145,080 | 116,064 | 87,048 | 58,032 | 58,032 | 58,032 | 58,032 | 58,032 | 2,901,600 | |||||||||||||||||||||||||
| Domestic Television Cost | 0 | 122,450 | 1,224,500 | 489,800 | 244,900 | 122,450 | 48,980 | 48,980 | 48,980 | 48,980 | 48,980 | 2,449,000 | |||||||||||||||||||||||||
| International Television Cost | 0 | 64,408 | 644,080 | 257,632 | 128,816 | 64,408 | 25,763 | 25,763 | 25,763 | 25,763 | 25,763 | 1,288,160 | |||||||||||||||||||||||||
Total Distribution Costs | $ | 0 | $ | 9,296,978 | $ | 3,300,708 | $ | 1,085,952 | $ | 634,860 | $ | 418,986 | $ | 277,855 | $ | 277,855 | $ | 277,855 | $ | 277,855 | $ | 277,855 | $ | 16,126,760 | |||||||||||||
Publicity Expenses | |||||||||||||||||||||||||||||||||||||
| Domestic Theatrical | |||||||||||||||||||||||||||||||||||||
| Advertising | $ | 933,435 | $ | 8,400,912 | $ | 0 | $ | 0 | $ | 0 | $ | 0 | $ | 0 | $ | 0 | $ | 0 | $ | 0 | $ | 0 | $ | 9,334,347 | |||||||||||||
| Prints | 0 | 1,164,134 | 0 | 0 | 0 | 0 | 0 | 0 | 0 | 0 | 0 | 1,164,134 | |||||||||||||||||||||||||
| International Theatrical | |||||||||||||||||||||||||||||||||||||
| Advertising | 466,717 | 4,200,456 | 0 | 0 | 0 | 0 | 0 | 0 | 0 | 0 | 0 | 4,667,173 | |||||||||||||||||||||||||
| Prints | 0 | 494,757 | 87,310 | 0 | 0 | 0 | 0 | 0 | 0 | 0 | 0 | 582,067 | |||||||||||||||||||||||||
Total Publicity Expenses | $ | 1,400,152 | $ | 14,260,258 | $ | 87,310 | $ | 0 | $ | 0 | $ | 0 | $ | 0 | $ | 0 | $ | 0 | $ | 0 | $ | 0 | $ | 15,747,720 | |||||||||||||
Negative Costs | $ | 20,000,000 | $ | 0 | $ | 0 | $ | 0 | $ | 0 | $ | 0 | $ | 0 | $ | 0 | $ | 0 | $ | 0 | $ | 0 | $ | 20,000,000 | |||||||||||||
Contribution Profit | $ | (21,400,152 | ) | $ | 24,357,915 | $ | 12,056,319 | $ | 4,464,710 | $ | 3,824,001 | $ | 1,906,085 | $ | 1,416,366 | $ | 692,945 | $ | 553,445 | $ | 552,360 | $ | 552,360 | $ | 28,976,355 | ||||||||||||
Source: Exhibit 8 (Ultimate Revenues and Costs) multiplied by Exhibit 2 (Time of Cash Flow from Ultimates).
SANLI PASTORE & HILL, INC.
109
Exhibit 12: Time of Cash Flow from Horror Film
Platinum Studios, Inc.
Film Entertainment: Joint Venture Film Division: Horror
Year of Cash Flow | 0 | 1 | 2 | 3 | 4 | 5 | 6 | 7 | 8 | 9 | 10 | Total | |||||||||||||||||||||||||
Gross Receipts | |||||||||||||||||||||||||||||||||||||
| Domestic Theatrical | $ | 0 | $ | 6,075,000 | $ | 0 | $ | 0 | $ | 0 | $ | 0 | $ | 0 | $ | 0 | $ | 0 | $ | 0 | $ | 0 | $ | 6,075,000 | |||||||||||||
| International Theatrical | 0 | 5,100,000 | 900,000 | 0 | 0 | 0 | 0 | 0 | 0 | 0 | 0 | 6,000,000 | |||||||||||||||||||||||||
| Domestic Home Video | 0 | 7,107,750 | 663,390 | 568,620 | 379,080 | 284,310 | 94,770 | 94,770 | 94,770 | 94,770 | 94,770 | 9,477,000 | |||||||||||||||||||||||||
| International Home Video | 0 | 2,843,100 | 1,990,170 | 284,310 | 170,586 | 113,724 | 56,862 | 56,862 | 56,862 | 56,862 | 56,862 | 5,686,200 | |||||||||||||||||||||||||
| Domestic Television | |||||||||||||||||||||||||||||||||||||
| PPV | 0 | 22,781 | 736,594 | 0 | 0 | 0 | 0 | 0 | 0 | 0 | 0 | 759,375 | |||||||||||||||||||||||||
| Pay TV | 0 | 82,013 | 2,050,313 | 601,425 | 0 | 0 | 0 | 0 | 0 | 0 | 0 | 2,733,750 | |||||||||||||||||||||||||
| Network TV | 0 | 0 | 0 | 164,025 | 546,750 | 164,025 | 164,025 | 54,675 | 0 | 0 | 0 | 1,093,500 | |||||||||||||||||||||||||
| Syndicated TV | 0 | 0 | 0 | 0 | 42,525 | 42,525 | 42,525 | 21,263 | 21,263 | 21,263 | 21,263 | 212,625 | |||||||||||||||||||||||||
| International Television | |||||||||||||||||||||||||||||||||||||
| Pay TV | 0 | 0 | 297,000 | 1,089,000 | 594,000 | 0 | 0 | 0 | 0 | 0 | 0 | 1,980,000 | |||||||||||||||||||||||||
| Syndicated TV | 0 | 0 | 0 | 0 | 600,000 | 600,000 | 600,000 | 300,000 | 300,000 | 300,000 | 300,000 | 3,000,000 | |||||||||||||||||||||||||
| Domestic Merchandising | 0 | 19,620 | 1,831 | 1,570 | 1,046 | 785 | 523 | 262 | 262 | 131 | 131 | 26,160 | |||||||||||||||||||||||||
| International Merchandising | 0 | 24,223 | 2,261 | 1,938 | 1,292 | 969 | 646 | 323 | 323 | 161 | 161 | 32,297 | |||||||||||||||||||||||||
Total Gross Receipts | $ | 0 | $ | 21,274,487 | $ | 6,641,558 | $ | 2,710,887 | $ | 2,335,279 | $ | 1,206,338 | $ | 959,351 | $ | 528,154 | $ | 473,479 | $ | 473,187 | $ | 473,187 | $ | 37,075,907 | |||||||||||||
Distribution Costs | |||||||||||||||||||||||||||||||||||||
| Domestic Theatrical | $ | 0 | $ | 1,215,000 | $ | 0 | $ | 0 | $ | 0 | $ | 0 | $ | 0 | $ | 0 | $ | 0 | $ | 0 | $ | 0 | $ | 1,215,000 | |||||||||||||
| International Theatrical | 0 | 1,020,000 | 180,000 | 0 | 0 | 0 | 0 | 0 | 0 | 0 | 0 | 1,200,000 | |||||||||||||||||||||||||
| Domestic Home Video | 0 | 1,326,780 | 94,770 | 75,816 | 56,862 | 56,862 | 56,862 | 56,862 | 56,862 | 56,862 | 56,862 | 1,895,400 | |||||||||||||||||||||||||
| International Home Video | 0 | 511,758 | 375,289 | 56,862 | 45,490 | 34,117 | 22,745 | 22,745 | 22,745 | 22,745 | 22,745 | 1,137,240 | |||||||||||||||||||||||||
| Domestic Television Cost | 0 | 47,993 | 479,925 | 191,970 | 95,985 | 47,993 | 19,197 | 19,197 | 19,197 | 19,197 | 19,197 | 959,850 | |||||||||||||||||||||||||
| International Television Cost | 0 | 49,800 | 498,000 | 199,200 | 99,600 | 49,800 | 19,920 | 19,920 | 19,920 | 19,920 | 19,920 | 996,000 | |||||||||||||||||||||||||
Total Distribution Costs | $ | 0 | $ | 4,171,331 | $ | 1,627,984 | $ | 523,848 | $ | 297,937 | $ | 188,772 | $ | 118,724 | $ | 118,724 | $ | 118,724 | $ | 118,724 | $ | 118,724 | $ | 7,403,490 | |||||||||||||
Publicity Expenses | |||||||||||||||||||||||||||||||||||||
| Domestic Theatrical | |||||||||||||||||||||||||||||||||||||
| Advertising | $ | 700,076 | $ | 6,300,684 | $ | 0 | $ | 0 | $ | 0 | $ | 0 | $ | 0 | $ | 0 | $ | 0 | $ | 0 | $ | 0 | $ | 7,000,760 | |||||||||||||
| Prints | 0 | 873,100 | 0 | 0 | 0 | 0 | 0 | 0 | 0 | 0 | 0 | 873,100 | |||||||||||||||||||||||||
| International Theatrical | |||||||||||||||||||||||||||||||||||||
| Advertising | 350,038 | 3,150,342 | 0 | 0 | 0 | 0 | 0 | 0 | 0 | 0 | 0 | 3,500,380 | |||||||||||||||||||||||||
| Prints | 0 | 371,068 | 65,483 | 0 | 0 | 0 | 0 | 0 | 0 | 0 | 0 | 436,550 | |||||||||||||||||||||||||
Total Publicity Expenses | $ | 1,050,114 | $ | 10,695,194 | $ | 65,483 | $ | 0 | $ | 0 | $ | 0 | $ | 0 | $ | 0 | $ | 0 | $ | 0 | $ | 0 | $ | 11,810,790 | |||||||||||||
Negative Costs | $ | 15,000,000 | $ | 0 | $ | 0 | $ | 0 | $ | 0 | $ | 0 | $ | 0 | $ | 0 | $ | 0 | $ | 0 | $ | 0 | $ | 15,000,000 | |||||||||||||
Contribution Profit | $ | (16,050,114 | ) | $ | 6,407,962 | $ | 4,948,092 | $ | 2,187,039 | $ | 2,037,343 | $ | 1,017,566 | $ | 840,627 | $ | 409,430 | $ | 354,755 | $ | 354,463 | $ | 354,463 | $ | 2,861,627 | ||||||||||||
Source: Exhibit 8 (Ultimate Revenues and Costs) multiplied by Exhibit 2 (Time of Cash Flow from Ultimates).
SANLI PASTORE & HILL, INC.
110
Exhibit 13: Ultimate Revenues and Costs
Platinum Studios, Inc.
Film Entertainment: Film Fund Division
Film Fund | ||||||||||
| Projected Budget | $ | 10,000,000 | ||||||||
| Implied Domestic Box Office | Median of Low Budget Comic Book Movies, Based on Box Office Mojo data | $ | 13,500,000 | 1.35 | ||||||
| Implied International Box Office | Median of Low Budget Comic Book Movies, Based on Box Office Mojo data | $ | 8,800,000 | 0.88 | ||||||
Gross Receipts | Notes | |||||||||
| Domestic Theatrical | Based on Industry Estimates, Baselineresearch and Vogel 2007 | $ | 6,750,000 | 50.0 | % | |||||
| International Theatrical | Based on Industry Estimates, Baselineresearch and Vogel 2007 | 3,520,000 | 40.0 | % | ||||||
| Domestic Home Video | % of Domestic Box Office, Based on Historical Actual of Marvel PG-13 Films | 10,530,000 | 78.0 | % | ||||||
| International Home Video | % of Domestic Home Video, Based on Historical Actual of Marvel PG-13 Films | 6,318,000 | 60.0 | % | ||||||
| Domestic Television | ||||||||||
| PPV | % of Domestic Theatrical, cap of $7.5M, Based on Industry Estimates, Marvel | 843,750 | 12.5 | % | ||||||
| Pay TV | % of Domestic Theatrical, cap of $17.5M, Based on Industry Estimates, Marvel | 3,037,500 | 45.0 | % | ||||||
| Network TV | % of Domestic Theatrical, cap of $40M, Based on Industry Estimates, Marvel | 1,215,000 | 18.0 | % | ||||||
| Syndicated TV | % of Domestic Theatrical | 236,250 | 3.5 | % | ||||||
| International Television | ||||||||||
| Pay TV | % of International Theatrical, cap of $30M, Based on Industry Estimates, Marvel | 1,161,600 | 33.0 | % | ||||||
| Network TV | % of International Theatrical, cap of $30M, Based on Industry Estimates, Marvel | 1,760,000 | 50.0 | % | ||||||
| Domestic Merchandising | % of Domestic Box Office less 35% Distribution Fees based on SNL Kagan 2007; Platinum collects 25% of Net | 65,401 | 0.5 | % | ||||||
| International Merchandising | % of International Box Office less 35% Distribution Fees based on SNL Kagan 2007; Platinum collects 25% of Net | 42,632 | 0.5 | % | ||||||
Total Gross Receipts | $ | 35,480,133 | ||||||||
Distribution Costs | ||||||||||
| Domestic Theatrical | % of Domestic Theatrical, Vogel 2007 | $ | 1,350,000 | 20.0 | % | |||||
| International Theatrical | % of International Theatrical, Vogel 2007 | 704,000 | 20.0 | % | ||||||
| Domestic Home Video | % of Domestic Home Video Revenue, Based on Industry Estimates, Vogel 2007 | 2,106,000 | 20.0 | % | ||||||
| International Home Video | % of International Home Video Revenue, Based on Industry Estimates, Vogel 2007 | 1,263,600 | 20.0 | % | ||||||
| Domestic Television Cost | % of Television Revenue, Based on Industry Estimates, Marvel | 1,066,500 | 20.0 | % | ||||||
| International Television Cost | % of Television Revenue, Based on Industry Estimates, Marvel | 584,320 | 20.0 | % | ||||||
Total Distribution Costs | $ | 7,074,420 | ||||||||
Publicity Expenses | ||||||||||
| Domestic Theatrical | ||||||||||
| Advertising | % of Budget, 2006 Average Ad / Negative Costs, MPAA | $ | 4,667,173 | 46.7 | % | |||||
| Publicity | % of Budget, 2006 Average Print / Negative Costs, MPAA | 582,067 | 5.8 | % | ||||||
| International Theatrical | ||||||||||
| Advertising | % of Domestic Advertising | 2,333,587 | 50.0 | % | ||||||
| Publicity | % of Domestic Publicity | 291,033 | 50.0 | % | ||||||
Total Publicity Expense | $ | 7,873,860 | ||||||||
Negative Costs | Same as Projected Budget | $ | 10,000,000 | |||||||
Contribution Profit | % of Total Gross Receipts | $ | 10,531,853 | 29.7 | % | |||||
= Inputs/Assumptions
SANLI PASTORE & HILL, INC.
111
Exhibit 14: Time of Cash Flow from Film Fund per Film
Platinum Studios, Inc.
Film Entertainment: Film Fund Division
Year of Cash Flow | 0 | 1 | 2 | 3 | 4 | 5 | 6 | 7 | 8 | 9 | 10 | Total | |||||||||||||||||||||||||
Gross Receipts | |||||||||||||||||||||||||||||||||||||
| Domestic Theatrical | $ | 0 | $ | 6,750,000 | $ | 0 | $ | 0 | $ | 0 | $ | 0 | $ | 0 | $ | 0 | $ | 0 | $ | 0 | $ | 0 | $ | 6,750,000 | |||||||||||||
| International Theatrical | 0 | 2,992,000 | 528,000 | 0 | 0 | 0 | 0 | 0 | 0 | 0 | 0 | 3,520,000 | |||||||||||||||||||||||||
| Domestic Home Video | 0 | 7,897,500 | 737,100 | 631,800 | 421,200 | 315,900 | 105,300 | 105,300 | 105,300 | 105,300 | 105,300 | 10,530,000 | |||||||||||||||||||||||||
| International Home Video | 0 | 3,159,000 | 2,211,300 | 315,900 | 189,540 | 126,360 | 63,180 | 63,180 | 63,180 | 63,180 | 63,180 | 6,318,000 | |||||||||||||||||||||||||
| Domestic Television | 0 | 0 | 0 | 0 | 0 | 0 | 0 | 0 | 0 | 0 | 0 | ||||||||||||||||||||||||||
| PPV | 0 | 25,313 | 818,438 | 0 | 0 | 0 | 0 | 0 | 0 | 0 | 0 | 843,750 | |||||||||||||||||||||||||
| Pay TV | 0 | 91,125 | 2,278,125 | 668,250 | 0 | 0 | 0 | 0 | 0 | 0 | 0 | 3,037,500 | |||||||||||||||||||||||||
| Network TV | 0 | 0 | 0 | 182,250 | 607,500 | 182,250 | 182,250 | 60,750 | 0 | 0 | 0 | 1,215,000 | |||||||||||||||||||||||||
| Syndicated TV | 0 | 0 | 0 | 0 | 47,250 | 47,250 | 47,250 | 23,625 | 23,625 | 23,625 | 23,625 | 236,250 | |||||||||||||||||||||||||
| International Television | 0 | 0 | 0 | 0 | 0 | 0 | 0 | 0 | 0 | 0 | 0 | ||||||||||||||||||||||||||
| Pay TV | 0 | 0 | 174,240 | 638,880 | 348,480 | 0 | 0 | 0 | 0 | 0 | 0 | 1,161,600 | |||||||||||||||||||||||||
| Syndicated TV | 0 | 0 | 0 | 0 | 352,000 | 352,000 | 352,000 | 176,000 | 176,000 | 176,000 | 176,000 | 1,760,000 | |||||||||||||||||||||||||
| Domestic Merchandising | 0 | 49,051 | 4,578 | 3,924 | 2,616 | 1,962 | 1,308 | 654 | 654 | 327 | 327 | 65,401 | |||||||||||||||||||||||||
| International Merchandising | 0 | 31,974 | 2,984 | 2,558 | 1,705 | 1,279 | 853 | 426 | 426 | 213 | 213 | 42,632 | |||||||||||||||||||||||||
Total Gross Receipts | $ | 0 | $ | 20,995,962 | $ | 6,754,765 | $ | 2,443,562 | $ | 1,970,291 | $ | 1,027,001 | $ | 752,141 | $ | 429,935 | $ | 369,185 | $ | 368,645 | $ | 368,645 | $ | 35,480,133 | |||||||||||||
Distribution Costs | |||||||||||||||||||||||||||||||||||||
| Domestic Theatrical | $ | 0 | $ | 1,350,000 | $ | 0 | $ | 0 | $ | 0 | $ | 0 | $ | 0 | $ | 0 | $ | 0 | $ | 0 | $ | 0 | $ | 1,350,000 | |||||||||||||
| International Theatrical | 0 | 598,400 | 105,600 | 0 | 0 | 0 | 0 | 0 | 0 | 0 | 0 | 704,000 | |||||||||||||||||||||||||
| Domestic Home Video | 0 | 1,474,200 | 105,300 | 84,240 | 63,180 | 63,180 | 63,180 | 63,180 | 63,180 | 63,180 | 63,180 | 2,106,000 | |||||||||||||||||||||||||
| International Home Video | 0 | 568,620 | 416,988 | 63,180 | 50,544 | 37,908 | 25,272 | 25,272 | 25,272 | 25,272 | 25,272 | 1,263,600 | |||||||||||||||||||||||||
| Domestic Television Cost | 0 | 53,325 | 533,250 | 213,300 | 106,650 | 53,325 | 21,330 | 21,330 | 21,330 | 21,330 | 21,330 | 1,066,500 | |||||||||||||||||||||||||
| International Television Cost | 0 | 29,216 | 292,160 | 116,864 | 58,432 | 29,216 | 11,686 | 11,686 | 11,686 | 11,686 | 11,686 | 584,320 | |||||||||||||||||||||||||
Total Distribution Costs | $ | 0 | $ | 4,073,761 | $ | 1,453,298 | $ | 477,584 | $ | 278,806 | $ | 183,629 | $ | 121,468 | $ | 121,468 | $ | 121,468 | $ | 121,468 | $ | 121,468 | $ | 7,074,420 | |||||||||||||
Publicity Expenses | |||||||||||||||||||||||||||||||||||||
| Domestic Theatrical | |||||||||||||||||||||||||||||||||||||
| Advertising | $ | 466,717 | $ | 4,200,456 | $ | 0 | $ | 0 | $ | 0 | $ | 0 | $ | 0 | $ | 0 | $ | 0 | $ | 0 | $ | 0 | $ | 4,667,173 | |||||||||||||
| Prints | 0 | 582,067 | 0 | 0 | 0 | 0 | 0 | 0 | 0 | 0 | 0 | 582,067 | |||||||||||||||||||||||||
| International Theatrical | |||||||||||||||||||||||||||||||||||||
| Advertising | 233,359 | 2,100,228 | 0 | 0 | 0 | 0 | 0 | 0 | 0 | 0 | 0 | 2,333,587 | |||||||||||||||||||||||||
| Prints | 0 | 247,378 | 43,655 | 0 | 0 | 0 | 0 | 0 | 0 | 0 | 0 | 291,033 | |||||||||||||||||||||||||
Total Publicity Expenses | $ | 700,076 | $ | 7,130,129 | $ | 43,655 | $ | 0 | $ | 0 | $ | 0 | $ | 0 | $ | 0 | $ | 0 | $ | 0 | $ | 0 | $ | 7,873,860 | |||||||||||||
Negative Costs | $ | 10,000,000 | $ | 0 | $ | 0 | $ | 0 | $ | 0 | $ | 0 | $ | 0 | $ | 0 | $ | 0 | $ | 0 | $ | 0 | $ | 10,000,000 | |||||||||||||
Contribution Profit | $ | (10,700,076 | ) | $ | 9,792,072 | $ | 5,257,812 | $ | 1,965,978 | $ | 1,691,485 | $ | 843,372 | $ | 630,672 | $ | 308,467 | $ | 247,717 | $ | 247,177 | $ | 247,177 | $ | 10,531,853 | ||||||||||||
Source: Exhibit 13 (Ultimate Revenues and Costs) multiplied by Exhibit 2 (Time of Cash Flow from Ultimates).
SANLI PASTORE & HILL, INC.
112
Exhibit 15: Ultimate Revenues and Costs for Direct to DVD Films
Platinum Studios, Inc.
Film Entertainment: Direct to DVD Division
Direct to DVD | ||||||||||
| Projected Budget | $ | 1,500,000 | ||||||||
Gross Receipts | Notes | |||||||||
| Home Video | Multiple of Budget; Average of Minimum and Lower Quartile of Top 25 Direct to DVD Releases in 2005; Video Business | 2,737,500 | 1.8 | |||||||
| Television | ||||||||||
| PPV | % of Home Video Revenues | 54,750 | 2.0 | % | ||||||
| Pay TV/ Free TV | % of Home Video Revenues | 1,267,463 | 46.3 | % | ||||||
Total Gross Receipts | $ | 4,059,713 | ||||||||
Distribution Costs | ||||||||||
| Home Video | % of Home Video Revenue, Based on Industry Estimates, Vogel 2007 | 958,125 | 35.0 | % | ||||||
| Television Cost | % of Television Revenue, Based on Industry Estimates, Marvel | 66,111 | 5.0 | % | ||||||
Total Distribution Costs | $ | 1,024,236 | ||||||||
Negative Costs | Same as Projected Budget | $ | 1,500,000 | |||||||
Contribution Profit | % of Total Gross Receipts | $ | 1,535,477 | 37.8 | % | |||||
= Inputs/Assumptions
SANLI PASTORE & HILL, INC.
113
Exhibit 16: Time of Cash Flows from Ultimates
Platinum Studios, Inc.
Film Entertainment: Direct to DVD Films
Year of Cash Flow | 0 | 1 | 2 | 3 | 4 | 5 | 6 | 7 | 8 | 9 | 10 | Total | |||||||||||||||||||||||||
Gross Receipts | |||||||||||||||||||||||||||||||||||||
| Home Video | 0.0 | % | 80.0 | % | 10.0 | % | 5.0 | % | 1.0 | % | 1.0 | % | 1.0 | % | 0.5 | % | 0.5 | % | 0.5 | % | 0.5 | % | 100.0 | % | |||||||||||||
| Television | |||||||||||||||||||||||||||||||||||||
| PPV | 0.0 | % | 100.0 | % | 0.0 | % | 0.0 | % | 0.0 | % | 0.0 | % | 0.0 | % | 0.0 | % | 0.0 | % | 0.0 | % | 0.0 | % | 100.0 | % | |||||||||||||
| Pay TV/ Free TV | 0.0 | % | 0.0 | % | 75.0 | % | 15.0 | % | 7.5 | % | 2.5 | % | 0.0 | % | 0.0 | % | 0.0 | % | 0.0 | % | 0.0 | % | 100.0 | % | |||||||||||||
Total Gross Receipts | 0.0 | % | 60.0 | % | 28.3 | % | 6.7 | % | 2.8 | % | 1.2 | % | 0.3 | % | 0.2 | % | 0.2 | % | 0.2 | % | 0.2 | % | 100.0 | % | |||||||||||||
Distribution Costs | |||||||||||||||||||||||||||||||||||||
| Home Video | 0.0 | % | 80.0 | % | 10.0 | % | 5.0 | % | 1.0 | % | 1.0 | % | 1.0 | % | 0.5 | % | 0.5 | % | 0.5 | % | 0.5 | % | 100.0 | % | |||||||||||||
| Television Cost | 0.0 | % | 0.0 | % | 75.0 | % | 15.0 | % | 7.5 | % | 2.5 | % | 0.0 | % | 0.0 | % | 0.0 | % | 0.0 | % | 0.0 | % | 100.0 | % | |||||||||||||
Total Distribution Costs | 0.0 | % | 40.0 | % | 42.5 | % | 10.0 | % | 4.3 | % | 1.8 | % | 0.5 | % | 0.3 | % | 0.3 | % | 0.3 | % | 0.3 | % | 100.0 | % | |||||||||||||
| �� | |||||||||||||||||||||||||||||||||||||
Negative Costs | 25.0 | % | 75.0 | % | 0.0 | % | 0.0 | % | 0.0 | % | 0.0 | % | 0.0 | % | 0.0 | % | 0.0 | % | 0.0 | % | 0.0 | % | 100.0 | % | |||||||||||||
SANLI PASTORE & HILL, INC.
114
Exhibit 17: Time of Cash Flow from Direct to DVD Films
Platinum Studios, Inc.
Film Entertainment: Direct to DVD Division
Year of Cash Flow | 0 | 1 | 2 | 3 | 4 | 5 | 6 | 7 | 8 | 9 | 10 | Total | |||||||||||||||||||||||||
Gross Receipts | |||||||||||||||||||||||||||||||||||||
| Home Video | 0 | 2,190,000 | 273,750 | 136,875 | 27,375 | 27,375 | 27,375 | 13,688 | 13,688 | 13,688 | 13,688 | 2,737,500 | |||||||||||||||||||||||||
| Television | |||||||||||||||||||||||||||||||||||||
| PPV | 0 | 54,750 | 0 | 0 | 0 | 0 | 0 | 0 | 0 | 0 | 0 | 54,750 | |||||||||||||||||||||||||
| Pay TV/ Free TV | 0 | 0 | 950,597 | 190,119 | 95,060 | 31,687 | 0 | 0 | 0 | 0 | 0 | 1,267,463 | |||||||||||||||||||||||||
Total Gross Receipts | $ | 0 | $ | 2,244,750 | $ | 1,224,347 | $ | 326,994 | $ | 122,435 | $ | 59,062 | $ | 27,375 | $ | 13,688 | $ | 13,688 | $ | 13,688 | $ | 13,688 | $ | 4,059,713 | |||||||||||||
Distribution Costs | |||||||||||||||||||||||||||||||||||||
| Home Video | 0 | 766,500 | 95,813 | 47,906 | 9,581 | 9,581 | 9,581 | 4,791 | 4,791 | 4,791 | 4,791 | 958,125 | |||||||||||||||||||||||||
| Television Cost | 0 | 0 | 49,583 | 9,917 | 4,958 | 1,653 | 0 | 0 | 0 | 0 | 0 | 66,111 | |||||||||||||||||||||||||
Total Distribution Costs | $ | 0 | $ | 766,500 | $ | 145,395 | $ | 57,823 | $ | 14,540 | $ | 11,234 | $ | 9,581 | $ | 4,791 | $ | 4,791 | $ | 4,791 | $ | 4,791 | $ | 1,024,236 | |||||||||||||
Negative Costs | $ | 375,000 | $ | 1,125,000 | $ | 0 | $ | 0 | $ | 0 | $ | 0 | $ | 0 | $ | 0 | $ | 0 | $ | 0 | $ | 0 | $ | 1,500,000 | |||||||||||||
Contribution Profit | $ | (375,000 | ) | $ | 353,250 | $ | 1,078,951 | $ | 269,172 | $ | 107,895 | $ | 47,828 | $ | 17,794 | $ | 8,897 | $ | 8,897 | $ | 8,897 | $ | 8,897 | $ | 1,535,477 | ||||||||||||
Source: Exhibit 15 (Ultimate Revenues and Costs) multiplied by Exhibit 16 (Time of Cash Flow from Ultimates).
SANLI PASTORE & HILL, INC.
115
Exhibit 18: Traffic Analysis of Digital Publishing Division
Platinum Studios, Inc.
Digital Publishing Division
Jan-08 | Feb-08 | Mar-08 | Monthly Average | Annualized Average | ||||||||||||
| PageViews | 16,373,541 | 14,470,090 | 15,371,530 | 15,405,054 | 184,860,644 | |||||||||||
Total Visitors | 2,852,061 | 2,202,324 | 2,482,136 | 2,512,174 | 30,146,084 | |||||||||||
Source: Provided by Management.
SANLI PASTORE & HILL, INC.
116
Exhibit 19: Base Year Assumptions of Digital Publishing Division
Platinum Studios, Inc.
Digital Publishing Division
MERCHANDISE SALES: | Assumptions | Calculation | Notes | ||||||||||
# of Visitors1 | 22,609,563 | A1 | Exhibit 18 | ||||||||||
| Conversion of Visitor to Purchaser | 4 | % | B1 | Source: Neilsen/NetRatings | |||||||||
| Purchasers | 904,383 | C1=A1*B1 | |||||||||||
| Average Purchase Amount | $ | 50.00 | D1 | Ebay's 10Ks and 10Qs | |||||||||
| Gross Purchases | $ | 45,219,126 | E1=C1*D1 | ||||||||||
| Proceeds Rate to PlatinumStudios.com | 15.00 | % | F1 | ||||||||||
TOTAL NET SALES OF MERCHANDISE REVENUES | $ | 6,782,869 | G1=E1*F1 | ||||||||||
ADVERTISING SALES: | |||||||||||||
Banners: | |||||||||||||
# of Page Views1 | 138,645,483 | A2 | Exhibit 18 | ||||||||||
| CPM | $ | 5.00 | B2 | ||||||||||
| Banner Ads / Page | 3 | C2 | |||||||||||
| % of Inventory Sold | 60 | % | D2 | ||||||||||
| Gross Banner Ad Revenues | 1,247,809 | E2=A2*B2*C2*D2/1000 | |||||||||||
| Ad Agency/Partner Fee Y/E % | 50 | % | F2 | ||||||||||
| Ad Agency/Partner % Fee | 623,905 | G2=E2*F2 | |||||||||||
| Total Banner Advertising Revenues | 623,905 | H2=E2-G2 | |||||||||||
Mini-Banners: | |||||||||||||
| # of Page Views | 138,645,483 | A3 | Exhibit 18 | ||||||||||
| CPM | $ | 5.00 | B3 | ||||||||||
| Mini-Banner Ads / Page | 2 | C3 | |||||||||||
| % of Inventory Sold | 100 | % | D3 | ||||||||||
| Gross Mini-Banner Ad Revenues | 1,386,455 | E3=A3*B3*C3*D3/1000 | |||||||||||
| Ad Agency/Partner Fee Y/E % | 50 | % | F3 | ||||||||||
| Ad Agency/Partner % Fee | 693,227 | G3=E3*F3 | |||||||||||
| Total Mini-Banner Advertising Revenues | 693,227 | H3=E3-G3 | |||||||||||
Total Banner & Mini-Banner Ad Revenues | |||||||||||||
Sponsored Webisodes: | |||||||||||||
| # of Episodes Produced | 180 | A4 | Start Year 2 | ||||||||||
| Revenue / Episode | 2,500 | B4 | |||||||||||
| % of Inventory Sold | 50 | % | C4 | ||||||||||
| Gross Sponsored Webisode Ad Revenues | 225,000 | D4=A4*B4*C4 | |||||||||||
| Ad Agency/Partner Fee Y/E % | 50 | % | E4 | ||||||||||
| Ad Agency/Partner % Fee | 112,500 | F4=D4*E4 | |||||||||||
Total Sponsored Webisodes Ad Revenues | 112,500 | G4=D4-F4 | |||||||||||
Total Gross Advertising Sales Revenues (before fees) | 2,859,264 | A6=E2+E3+D4 | |||||||||||
Advertising Agency/Partner Sales Fees | 1,429,632 | B6=G2+G3+F4 | |||||||||||
TOTAL ADVERTISING SALES REVENUES (net of fees) | $ | 1,429,632 | C6=A6-B6 | ||||||||||
GAMING REVENUES | |||||||||||||
| # Skinned Games | 50 | A7 | Add 50 each year, start year 2 | ||||||||||
| 1 | % | B7 | 1% of traffic | ||||||||||
| 1 | % | C7 | 1% of games | ||||||||||
| $ | 10.00 | D7 | $10/download | ||||||||||
| Gaming Downloads | 1,130,478 | E7=A1*A7*B7*C7*D7 | |||||||||||
| 0.50 | % | F7 | 0.5% of traffic | ||||||||||
| $ | 5.00 | G7 | $5/month | ||||||||||
| Gaming Subscriptions | 565,239 | H7=A1*F7*G7 | |||||||||||
| 10.00 | % | I7 | 10% of traffic | ||||||||||
| 50 | % | J7 | 50% of games | ||||||||||
| $ | 8.00 | K7 | $8 CPM | ||||||||||
| In-game Advertising | 452,191 | L7=A1*I7*J7*K7/1000 | |||||||||||
TOTAL GAME REVENUES | 2,147,908 | M7=E7+H7+L7 | |||||||||||
SUBSCRIPTION SALES: | |||||||||||||
| Visitors | 22,609,563 | A8 | Exhibit 18 | ||||||||||
| Conversion Rate of New to Annual Subscribers | 0.5 | % | B8 | ||||||||||
| Annual Subscribers | 113,048 | C8=A8*B8 | |||||||||||
| Annual Subscription Price | $ | 20 | D8 | ||||||||||
GROSS SUBSCRIPTION SALES: | $ | 2,260,956 | E8=C8*D8 | ||||||||||
SYNDICATION REVENUES | |||||||||||||
| Gross Advertising Revenue | 2,859,264 | A9=A6 | |||||||||||
| Syndication Revenue, % of Ad Revenue | 50 | % | B9 | ||||||||||
| % of Shows Syndicated | 50 | % | C9 | ||||||||||
| Total Gross Syndication Revenue | 714,816 | D9=A9*B9*C9 | |||||||||||
| Ad Agency/Partner Fee Y/E % | 35 | % | E9 | ||||||||||
| Ad Agency/Partner % Fee | 250,186 | F9=D9*E9 | |||||||||||
SYNDICATION REVENUES (net of fees) | 464,630 | G9=D9-F9 | |||||||||||
COST OF SALES | |||||||||||||
| 2.50 | % | A10 | % of Subscription Revenues | ||||||||||
Credit Card Processing Fees | $ | 56,524 | B10=E8*A10 | ||||||||||
| 15 | % | C10 | |||||||||||
Properties License Fees | $ | 107,222 | D10=D9*C10 | % of Gross Syndication Revenues | |||||||||
License Fee to Creator/epi | 10,000 | E10 | |||||||||||
License Fee to Creator | $ | 2,300,000 | F10=E10*(A4+A7) | ||||||||||
TOTAL COST OF SALES | $ | 2,463,746 | G10=B10+D10+F10 | ||||||||||
SELLING GENERAL & ADMINISTRATIVE | 30.00 | % | % of Total Revenues | ||||||||||
OTHER OPERATING EXPENSE | |||||||||||||
| 12,500 | A11 | $5,000/minute for each 2.5-minute episode | |||||||||||
| 3rd Party Production Costs | 2,875,000 | B11=A11*(A4+A7) | Costs incur 1 year before revenue | ||||||||||
| Technical & Management Consulting | 125,000 | ||||||||||||
| Marketing | 1,000,000 | ||||||||||||
| Software and Technical Support | 50,000 | ||||||||||||
| Equipment Maintenance | 7,500 | ||||||||||||
| Site & Content Acquisition/Aggregation | 300,000 | ||||||||||||
| Web Publishing | 2,672,500 | ||||||||||||
| Translations | 572,500 | ||||||||||||
| Depreciation | 100,000 | ||||||||||||
TOTAL OTHER OPERATING EXPENSE | 7,702,500 | ||||||||||||
Note 1:Page Views and Total Visitors data is 9 months data starting from April 1, 2008 to December 31, 2008.
SANLI PASTORE & HILL, INC.
117
Exhibit 20: Growth Assumptions of Digital Publishing Division
Platinum Studios, Inc.
Digital Publishing Division
Year 0 | Year 1 | Year 2 | Year 3 | Year 4 | Year 5 | Year 6 | Year 7 | Year 8 | Year 9 | Year 10 | |||||||||||||||||||||||
1) TRAFFIC | |||||||||||||||||||||||||||||||||
| Increase % | |||||||||||||||||||||||||||||||||
| PageViews | 10.00 | % | 10.00 | % | 10.00 | % | 10.00 | % | 10.00 | % | 10.00 | % | 10.00 | % | 10.00 | % | 10.00 | % | |||||||||||||||
Total Visitors | 10.00 | % | 10.00 | % | 10.00 | % | 10.00 | % | 10.00 | % | 10.00 | % | 10.00 | % | 10.00 | % | 10.00 | % | |||||||||||||||
| PageViews | 138,645,483 | 203,346,708 | 223,681,379 | 246,049,517 | 270,654,469 | 297,719,916 | 327,491,907 | 360,241,098 | 396,265,208 | 435,891,729 | |||||||||||||||||||||||
Total Visitors | 22,609,563 | 33,160,692 | 36,476,762 | 40,124,438 | 44,136,882 | 48,550,570 | 53,405,627 | 58,746,189 | 64,620,808 | 71,082,889 | |||||||||||||||||||||||
2) Capacity/Bandwidth | |||||||||||||||||||||||||||||||||
| Cost / Visitor | 0.14 | 0.14 | 0.14 | 0.14 | 0.14 | 0.14 | 0.14 | 0.14 | 0.14 | 0.14 | |||||||||||||||||||||||
3) REVENUES (See Revenues Worksheet): | |||||||||||||||||||||||||||||||||
Online Merchandise Sales Revenue | |||||||||||||||||||||||||||||||||
| Conversion of Visitor to Purchase | 0.0 | % | 1.0 | % | 2.0 | % | 3.0 | % | 3.0 | % | 3.0 | % | 3.0 | % | 3.0 | % | 3.0 | % | 3.0 | % | |||||||||||||
| Average Purchase Amount | $ | 50.00 | $ | 50.00 | $ | 52.00 | $ | 54.08 | $ | 56.24 | $ | 58.49 | $ | 60.83 | $ | 63.27 | $ | 65.80 | $ | 68.43 | |||||||||||||
| Average Net Proceeds from Merchandise Sales* | 15.0 | % | 15.0 | % | 15.0 | % | 15.0 | % | 15.0 | % | 15.0 | % | 15.0 | % | 15.0 | % | 15.0 | % | 15.0 | % | |||||||||||||
Advertising Revenues: | |||||||||||||||||||||||||||||||||
Banners | |||||||||||||||||||||||||||||||||
| CPM Annual Growth Rate | 10 | % | 10 | % | 10 | % | 10 | % | 10 | % | 10 | % | 10 | % | 10 | % | 10 | % | |||||||||||||||
| CPM | $ | 5.00 | $ | 5.50 | $ | 6.05 | $ | 6.66 | $ | 7.32 | $ | 8.05 | $ | 8.86 | $ | 9.74 | $ | 10.72 | $ | 11.79 | |||||||||||||
| Banner Ads / Page | 3 | 3 | 3 | 3 | 3 | 3 | 3 | 3 | 3 | 3 | |||||||||||||||||||||||
| % of Inventory Sold | 60.0 | % | 60.0 | % | 60.0 | % | 60.0 | % | 60.0 | % | 60.0 | % | 60.0 | % | 60.0 | % | 60.0 | % | 60.0 | % | |||||||||||||
| Ad Agency/Partner Fee Y/E % | 50.0 | % | 50.0 | % | 50.0 | % | 50.0 | % | 35.0 | % | 35.0 | % | 35.0 | % | 35.0 | % | 35.0 | % | 35.0 | % | |||||||||||||
"Bugs" | |||||||||||||||||||||||||||||||||
| CPM Annual Growth Rate | 10 | % | 10 | % | 10 | % | 10 | % | 10 | % | 10 | % | 10 | % | 10 | % | 10 | % | |||||||||||||||
| CPM | $ | 5.00 | $ | 5.50 | $ | 6.05 | $ | 6.66 | $ | 7.32 | $ | 8.05 | $ | 8.86 | $ | 9.74 | $ | 10.72 | $ | 11.79 | |||||||||||||
| Mini-Banner Ads / Page | 2 | 2 | 2 | 2 | 2 | 2 | 2 | 2 | 2 | 2 | |||||||||||||||||||||||
| % of Inventory Sold | 100.0 | % | 100.0 | % | 100.0 | % | 100.0 | % | 100.0 | % | 100.0 | % | 100.0 | % | 100.0 | % | 100.0 | % | 100.0 | % | |||||||||||||
| Ad Agency/Partner Fee Y/E % | 50.0 | % | 50.0 | % | 50.0 | % | 50.0 | % | 35.0 | % | 35.0 | % | 35.0 | % | 35.0 | % | 35.0 | % | 35.0 | % | |||||||||||||
Sponsored Webisodes: | |||||||||||||||||||||||||||||||||
| First Year of Webisodes productions | 2 | ||||||||||||||||||||||||||||||||
| 15 | % | 15 | % | 15 | % | 15 | % | 15 | % | 15 | % | 15 | % | 15 | % | 15 | % | ||||||||||||||||
| # of Episodes/Games Produced | 0 | 180 | 207 | 238 | 274 | 315 | 362 | 416 | 478 | 550 | |||||||||||||||||||||||
| Revenue/Episode Annual Growth Rate | 15 | % | 15 | % | 15 | % | 15 | % | 15 | % | 15 | % | 15 | % | 15 | % | 15 | % | |||||||||||||||
| Revenue / Episode | $ | 2,500 | $ | 2,875 | $ | 3,306 | $ | 3,802 | $ | 4,373 | $ | 5,028 | $ | 5,783 | $ | 6,650 | $ | 7,648 | $ | 8,795 | |||||||||||||
| % of Inventory Sold | 50.0 | % | 50.0 | % | 50.0 | % | 50.0 | % | 50.0 | % | 50.0 | % | 50.0 | % | 50.0 | % | 50.0 | % | 50.0 | % | |||||||||||||
| Ad Agency/Partner Fee Y/E % | 50.0 | % | 50.0 | % | 50.0 | % | 50.0 | % | 35.0 | % | 35.0 | % | 35.0 | % | 35.0 | % | 35.0 | % | 35.0 | % | |||||||||||||
Gaming Revenues | |||||||||||||||||||||||||||||||||
| First Year of Gaming Revenues | 2 | ||||||||||||||||||||||||||||||||
| # Skinned Games | 0 | - | 50 | 100 | 150 | 200 | 250 | 300 | 350 | 400 | 450 | ||||||||||||||||||||||
| Gaming Downloads | $ | - | $ | 1,658,035 | $ | 3,647,676 | $ | 6,018,666 | $ | 8,827,376 | $ | 12,137,642 | $ | 16,021,688 | $ | 20,561,166 | $ | 25,848,323 | $ | 31,987,300 | |||||||||||||
| Gaming Subscriptions | $ | - | $ | 829,017 | $ | 911,919 | $ | 1,003,111 | $ | 1,103,422 | $ | 1,213,764 | $ | 1,335,141 | $ | 1,468,655 | $ | 1,615,520 | $ | 1,777,072 | |||||||||||||
| In-game Advertising | $ | - | $ | 663,214 | $ | 1,459,070 | $ | 2,407,466 | $ | 3,530,951 | $ | 4,855,057 | $ | 6,408,675 | $ | 8,224,467 | $ | 10,339,329 | $ | 12,794,920 | |||||||||||||
Subscription Sales | |||||||||||||||||||||||||||||||||
| First Year of Subscription Sales | 2 | ||||||||||||||||||||||||||||||||
| Conversion Rate of Regulars to Annual Subscribers | - | 0.50 | % | 1.00 | % | 1.50 | % | 1.50 | % | 2.00 | % | 2.00 | % | 2.50 | % | 2.50 | % | 3.00 | % | ||||||||||||||
| Annual Subscription Price | $ | 20.00 | $ | 20.00 | $ | 20.00 | $ | 20.00 | $ | 20.00 | $ | 20.00 | $ | 20.00 | $ | 20.00 | $ | 20.00 | $ | 20.00 | |||||||||||||
Syndication Revenues: | |||||||||||||||||||||||||||||||||
| Dom. Syndication Revenue, % of Ad Revenue | 50 | % | 50 | % | 50 | % | 50 | % | 50 | % | 50 | % | 50 | % | 50 | % | 50 | % | 50 | % | |||||||||||||
| % of Shows syndicated | 50 | % | 50 | % | 50 | % | 50 | % | 50 | % | 50 | % | 50 | % | 50 | % | 50 | % | 50 | % | |||||||||||||
| Ad Agency/Partner Fee Y/E % | 35.0 | % | 35.0 | % | 35.0 | % | 35.0 | % | 35.0 | % | 35.0 | % | 35.0 | % | 35.0 | % | 35.0 | % | 35.0 | % | |||||||||||||
4) COST OF SALES: | |||||||||||||||||||||||||||||||||
| Credit Card Fees (% of Subscription Revenues) | 2.5 | % | 2.5 | % | 2.5 | % | 2.5 | % | 2.5 | % | 2.5 | % | 2.5 | % | 2.5 | % | 2.5 | % | 2.5 | % | |||||||||||||
| Property License Fee (as a % of Syndication Rev) | 15.0 | % | 15.0 | % | 15.0 | % | 15.0 | % | 15.0 | % | 15.0 | % | 15.0 | % | 15.0 | % | 15.0 | % | 15.0 | % | |||||||||||||
| Content License Fees to Creator | $ | 2,300,000 | $ | 3,070,000 | $ | 3,880,000 | $ | 4,740,000 | $ | 5,650,000 | $ | 6,620,000 | $ | 7,660,000 | $ | 8,780,000 | $ | 10,000,000 | $ | 11,330,000 | |||||||||||||
| Web Hosting Fees | $ | 3,165,339 | $ | 4,642,497 | $ | 5,106,747 | $ | 5,617,421 | $ | 6,179,163 | $ | 6,797,080 | $ | 7,476,788 | $ | 8,224,467 | $ | 9,046,913 | $ | 9,951,604 | |||||||||||||
5) General and Administrative Expenses | 30.0 | % | 29.0 | % | 28.0 | % | 27.0 | % | 25.0 | % | 24.0 | % | 22.0 | % | 22.0 | % | 22.0 | % | 22.0 | % | |||||||||||||
(% of Gross Revenue) | |||||||||||||||||||||||||||||||||
6) OTHER OPERATING EXP.: | |||||||||||||||||||||||||||||||||
| First Year of 3rd Party Productions | 1 | ||||||||||||||||||||||||||||||||
| Inflation | 3.1 | % | |||||||||||||||||||||||||||||||
# of Episodes Producedfor 3rd party prodn | 0 | 180 | 207 | 238 | 274 | 315 | 362 | 416 | 478 | 550 | |||||||||||||||||||||||
| 3rd Party Production Costs / Episode | 12,500 | 12,888 | 13,287 | 13,699 | 14,124 | 14,561 | 15,013 | 15,478 | 15,958 | 16,453 | |||||||||||||||||||||||
| Site Build/Maintenance | 125,000 | 128,875 | 132,870 | 136,989 | 141,236 | 145,614 | 150,128 | 154,782 | 159,580 | 164,527 | |||||||||||||||||||||||
| Marketing | 1,000,000 | 1,031,000 | 1,062,961 | 1,095,913 | 1,129,886 | 1,164,913 | 1,201,025 | 1,238,257 | 1,276,643 | 1,316,218 | |||||||||||||||||||||||
| Software/Tech Support, Annual | 50,000 | 51,550 | 53,148 | 54,796 | 56,494 | 58,246 | 60,051 | 61,913 | 63,832 | 65,811 | |||||||||||||||||||||||
| Equipment Maintenance | 7,500 | 10,000 | 15,000 | 15,465 | 15,944 | 16,439 | 16,948 | 17,474 | 18,015 | 18,574 | |||||||||||||||||||||||
| Site & Content Acquisition/Aggregation | 300,000 | 309,300 | 318,888 | 328,774 | 338,966 | 349,474 | 360,307 | 371,477 | 382,993 | 394,866 | |||||||||||||||||||||||
| Web Publishing | 2,672,500 | 2,755,348 | 2,840,763 | 2,928,827 | 3,019,621 | 3,113,229 | 3,209,739 | 3,309,241 | 3,411,827 | 3,517,594 | |||||||||||||||||||||||
| Translations | 572,500 | 590,248 | 608,545 | 627,410 | 646,860 | 666,912 | 687,587 | 708,902 | 730,878 | 753,535 | |||||||||||||||||||||||
| Depreciation | 100,000 | 110,000 | 121,000 | 133,100 | 146,410 | 161,051 | 177,156 | 194,872 | 214,359 | 235,795 | |||||||||||||||||||||||
6) CAPITAL EXPENDITURES | �� | ||||||||||||||||||||||||||||||||
| Equipment Maint., % of Purch. Price/Yr | 1.3 | 125,000 | 137,500 | 151,250 | 166,375 | 183,013 | 201,314 | 221,445 | 243,590 | 267,949 | 294,743 | ||||||||||||||||||||||
7) FINANCIAL, Income Statement | |||||||||||||||||||||||||||||||||
| Tax Rate | 40.0 | % | 40.0 | % | 40.0 | % | 40.0 | % | 40.0 | % | 40.0 | % | 40.0 | % | 40.0 | % | 40.0 | % | 40.0 | % | |||||||||||||
SANLI PASTORE & HILL, INC.
118
Exhibit 21A
Platinum Studios, Inc.
Development of Equity Discount Rate
Date of Value: March 31, 2008
Sources: | |||||||||||
| Federal Reserve Statistical | |||||||||||
| Long-Term Risk-Free Rate | 4.30 | % | Release dated March 31, 2008 | ||||||||
| (20-Year Government Treasury Bonds) | |||||||||||
Add: | |||||||||||
| Equity Risk Premium | 6.30 | % | Ibbotson Associates'Stocks, Bonds, Bills & Inflation, 2007 Yearbook | ||||||||
| Size Premium | 4.35 | % | Ibid. | ||||||||
| Industry Premium Adjustment | 4.71 | % | Average of Industry Premium for SIC Codes 731, 7373, 7375, 7379 per Ibbotson Associates'Stocks, Bonds, Bills & Inflation Valuation Edition (2007 Yearbook) | ||||||||
| Adjusted Equity Risk Premium | 15.36 | % | 15.36 | % | |||||||
Specific Company Risk1 | 7.00 | % | Per company research and analysis | ||||||||
After-Tax Equity Discount Rate: | 26.66 | % | |||||||||
After-Tax Equity Discount Rate (rounded): | 26.7 | % | |||||||||
SANLI PASTORE & HILL, INC.
119
Exhibit 21B
Platinum Studios, Inc.
Development of Rate of Return on Debt
Date of Value: March 31, 2008
Sources: | |||||||||||||
Bank Prime Rate: | 5.25 | % | Federal Reserve Statistical Release | ||||||||||
| Rate as of March 31, 2008 | |||||||||||||
Corporate Bonds: | |||||||||||||
| Moody's Seasonal | Aaa | 5.66 | % | Ibid. | |||||||||
| Baa | 6.48 | % | Ibid. | ||||||||||
Weighted Average Interest Rate on Platinum's Interest Bearing Debt | 8.25 | % | Per Management and SP&H Analysis | ||||||||||
After-Tax Rate of Return on Debt (rounded): | 5.0 | % | |||||||||||
| (Rate of Return on Debt x (1 - tax rate of 40%)) |
SANLI PASTORE & HILL, INC.
120
Exhibit 21C
Platinum Studios, Inc.
Development of Weighted Average Cost of Capital (WACC)
Date of Value: March 31, 2008
Rate | Weight | WACC | ||||||||
| After-Tax Equity Discount Rate: (Exhibit 21A) | 26.7 | % | 80 | % | 21.4 | % | ||||
| After-Tax Rate of Return on Debt: (Exhibit 21B) | 5.0 | % | 20 | % | 1.0 | % | ||||
After-Tax WACC | 100 | % | 22.4 | % | ||||||
| �� | ||||||||||
| Less: | ||||||||||
| Long-Term Growth Rate | 3.1 | % | ||||||||
After-Tax Capitalization Rate | 19.3 | % | ||||||||
SANLI PASTORE & HILL, INC.
121
Exhibit 22: Base Year Assumptions of Video Network Division
Platinum Studios, Inc.
Video Network Division
Assumptions | Calculation | Notes | ||||||||||||||
ADVERTISING SALES: | ||||||||||||||||
Video Pre-Rolls | ||||||||||||||||
| # of Page Views | 1,800,000,000 | A1 | Management Estimates | |||||||||||||
| CPM | $ | 18.00 | B1 | |||||||||||||
| Ads / Video | 1 | C1 | ||||||||||||||
| % of Inventory Sold | 75 | % | D1 | |||||||||||||
| Gross Banner Ad Revenues | 24,300,000 | E1=A1*B1*C1*D1/1000 | ||||||||||||||
| Ad Agency/Partner Fee Y/E % | 50 | % | F1 | |||||||||||||
| Ad Agency/Partner % Fee | 12,150,000 | G1=E1*F1 | ||||||||||||||
Total Video Pre-Rolls Advertising Revenues | 12,150,000 | H1=E1-G1 | ||||||||||||||
Mini-Banners: | ||||||||||||||||
| # of Page Views | 1,800,000,000 | A2 | ||||||||||||||
| CPM | $ | 5.00 | B2 | |||||||||||||
| Banner Ads / Page | 3 | C2 | ||||||||||||||
| % of Inventory Sold | 60 | % | D2 | |||||||||||||
| Gross Mini-Banner Ad Revenues | 16,200,000 | E2=A2*B2*C2*D2/1000 | ||||||||||||||
| Ad Agency/Partner Fee Y/E % | 50 | % | F2 | |||||||||||||
| Ad Agency/Partner % Fee | 8,100,000 | G2=E2*F2 | ||||||||||||||
Total Mini-Banner Advertising Revenues | 8,100,000 | H2=E2-G2 | ||||||||||||||
Sponsored Webisodes: | ||||||||||||||||
| # of Episodes Produced | 100 | A3 | ||||||||||||||
| Revenue / Episode | 2,500 | B3 | ||||||||||||||
| % of Inventory Sold | 50 | % | C3 | |||||||||||||
| Gross Sponsored Webisode Ad Revenues | 125,000 | D3=A3*B3*C3 | ||||||||||||||
| Ad Agency/Partner Fee Y/E % | 50 | % | E3 | |||||||||||||
| Ad Agency/Partner % Fee | 62,500 | F3=D3*E3 | ||||||||||||||
Total Sponsored Webisodes Ad Revenues | 62,500 | G3=D3-F3 | ||||||||||||||
Sponsorship: | ||||||||||||||||
| # of Sponsorships / Year | 2 | A4 | ||||||||||||||
| Life of Sponsorship (in months) | 6 | B4 | ||||||||||||||
| Cost of Sponsorship / Show | 250,000 | C4 | ||||||||||||||
Total Sponsorship Revenues: | 3,000,000 | D4=A4*B4*C4 | ||||||||||||||
Total Gross Advertising Sales Revenues (before fees) | 43,625,000 | A5=E1+E2+D3+D4 | ||||||||||||||
Advertising Sales Fees (Ad Agency) | 20,312,500 | B5=G1+G2+F3 | ||||||||||||||
TOTAL ADVERTISING SALES REVENUES (net of fees) | $ | 23,312,500 | C5=A5-B5 | |||||||||||||
COST OF SALES | ||||||||||||||||
| 10,000 | C7 | |||||||||||||||
License Fee to Creator/epi | $ | 1,000,000 | D7=A3*C7 | |||||||||||||
TOTAL COST OF SALES | $ | 1,000,000 | E7=B7+D7 | |||||||||||||
SELLING GENERAL & ADMINISTRATIVE | 30.00 | % | % of Total Revenues | |||||||||||||
OTHER OPERATING EXPENSE | ||||||||||||||||
| 12,500 | A8 | $5,000/minute for each 2.5-minute episode | ||||||||||||||
| 3rd Party Production Costs | 1,250,000 | B8=A3*A8 | ||||||||||||||
| Technical & Management Consulting | 125,000 | |||||||||||||||
| Marketing | 500,000 | |||||||||||||||
| Software and Technical Support | 50,000 | |||||||||||||||
| Equipment Maintenance | 7,500 | |||||||||||||||
| Site & Content Acquisition/Aggregation | 300,000 | |||||||||||||||
| Web Publishing | 2,512,500 | |||||||||||||||
| Translations | 572,500 | |||||||||||||||
| Depreciation | 100,000 | |||||||||||||||
TOTAL OTHER OPERATING EXPENSE | 5,417,500 | |||||||||||||||
SANLI PASTORE & HILL, INC.
122
Exhibit 23: Growth Assumptions of Video Network Division
Platinum Studios, Inc.
Video Network Division
Year 1 | Year 2 | Year 3 | Year 4 | Year 5 | Year 6 | Year 7 | Year 8 | Year 9 | Year 10 | Year 11 | |||||||||||||||||||||||||||
1) TRAFFIC | |||||||||||||||||||||||||||||||||||||
| Increase % | |||||||||||||||||||||||||||||||||||||
| PageViews | 33.33 | % | 17.50 | % | 17.50 | % | 10.00 | % | 10.00 | % | 10.00 | % | 7.50 | % | 7.50 | % | 7.50 | % | |||||||||||||||||||
Total Visitors | 30.00 | % | 15.00 | % | 15.00 | % | 7.50 | % | 7.50 | % | 7.50 | % | 5.00 | % | 5.00 | % | 5.00 | % | |||||||||||||||||||
| PageViews | 1,800,000,000 | 2,400,000,000 | 2,820,000,000 | 3,313,500,000 | 3,644,850,000 | 4,009,335,000 | 4,410,268,500 | 4,741,038,638 | 5,096,616,535 | 5,478,862,775 | |||||||||||||||||||||||||||
Total Visitors | 90,000,000 | 117,000,000 | 134,550,000 | 154,732,500 | 166,337,438 | 178,812,745 | 192,223,701 | 201,834,886 | 211,926,631 | 222,522,962 | |||||||||||||||||||||||||||
2) Capacity/Bandwidth | |||||||||||||||||||||||||||||||||||||
| Cost / Visitor | 0.10 | 0.10 | 0.10 | 0.10 | 0.10 | 0.10 | 0.10 | 0.10 | 0.10 | 0.10 | |||||||||||||||||||||||||||
3) REVENUES (See Revenues Worksheet): | |||||||||||||||||||||||||||||||||||||
Advertising Revenues: | |||||||||||||||||||||||||||||||||||||
Video Pre-Rolls | |||||||||||||||||||||||||||||||||||||
| CPM Annual Growth Rate | 10 | % | 10 | % | 10 | % | 10 | % | 10 | % | 10 | % | 10 | % | 10 | % | 10 | % | |||||||||||||||||||
| CPM | $ | 18.00 | $ | 19.80 | $ | 21.78 | $ | 23.96 | $ | 26.35 | $ | 28.99 | $ | 31.89 | $ | 35.08 | $ | 38.58 | $ | 42.44 | |||||||||||||||||
| Ads / Video | 1 | 1 | 1 | 1 | 1 | 1 | 1 | 1 | 1 | 1 | |||||||||||||||||||||||||||
| % of Inventory Sold | 75.0 | % | 75.0 | % | 75.0 | % | 75.0 | % | 75.0 | % | 75.0 | % | 75.0 | % | 75.0 | % | 75.0 | % | 75.0 | % | |||||||||||||||||
| Ad Agency/Partner Fee Y/E % | 50.0 | % | 50.0 | % | 50.0 | % | 50.0 | % | 35.0 | % | 35.0 | % | 35.0 | % | 35.0 | % | 35.0 | % | 35.0 | % | |||||||||||||||||
"Bugs" | |||||||||||||||||||||||||||||||||||||
| CPM Annual Growth Rate | 10 | % | 10 | % | 10 | % | 10 | % | 10 | % | 10 | % | 10 | % | 10 | % | 10 | % | |||||||||||||||||||
| CPM | $ | 5.00 | $ | 5.50 | $ | 6.05 | $ | 6.66 | $ | 7.32 | $ | 8.05 | $ | 8.86 | $ | 9.74 | $ | 10.72 | $ | 11.79 | |||||||||||||||||
| Mini-Banner Ads / Page | 3 | 3 | 3 | 3 | 3 | 3 | 3 | 3 | 3 | 3 | |||||||||||||||||||||||||||
| % of Inventory Sold | 60.0 | % | 60.0 | % | 60.0 | % | 60.0 | % | 60.0 | % | 60.0 | % | 60.0 | % | 60.0 | % | 60.0 | % | 60.0 | % | |||||||||||||||||
| Ad Agency/Partner Fee Y/E % | 50.0 | % | 50.0 | % | 50.0 | % | 50.0 | % | 35.0 | % | 35.0 | % | 35.0 | % | 35.0 | % | 35.0 | % | 35.0 | % | |||||||||||||||||
Sponsored Webisodes: | |||||||||||||||||||||||||||||||||||||
| 35 | % | 35 | % | 20 | % | 20 | % | 20 | % | 15 | % | 15 | % | 15 | % | ||||||||||||||||||||||
| # of Episodes Produced | 60 | 100 | 135 | 182 | 218 | 262 | 314 | 361 | 415 | 477 | |||||||||||||||||||||||||||
| Revenue/Episode Annual Growth Rate | 15 | % | 15 | % | 15 | % | 15 | % | 15 | % | 15 | % | 15 | % | 15 | % | 15 | % | |||||||||||||||||||
| Revenue / Episode | $ | 2,500 | $ | 2,875 | $ | 3,306 | $ | 3,802 | $ | 4,373 | $ | 5,028 | $ | 5,783 | $ | 6,650 | $ | 7,648 | $ | 8,795 | |||||||||||||||||
| % of Inventory Sold | 50.0 | % | 50.0 | % | 50.0 | % | 50.0 | % | 50.0 | % | 50.0 | % | 50.0 | % | 50.0 | % | 50.0 | % | 50.0 | % | |||||||||||||||||
| Ad Agency/Partner Fee Y/E % | 50.0 | % | 50.0 | % | 50.0 | % | 50.0 | % | 35.0 | % | 35.0 | % | 35.0 | % | 35.0 | % | 35.0 | % | 35.0 | % | |||||||||||||||||
Sponsorship Revenue: | |||||||||||||||||||||||||||||||||||||
| # of Sponsorships / Year | 0 | 2 | 2 | 2 | 2 | 2 | 2 | 2 | 2 | 2 | |||||||||||||||||||||||||||
| Life of Sponsorship (in months) | 6 | 6 | 6 | 6 | 6 | 6 | 6 | 6 | 6 | 6 | |||||||||||||||||||||||||||
| Site Sponsorship Revenues | $ | 250,000 | $ | 250,000 | $ | 250,000 | $ | 250,000 | $ | 250,000 | $ | 250,000 | $ | 250,000 | $ | 250,000 | $ | 250,000 | $ | 250,000 | |||||||||||||||||
4) COST OF SALES (COS & Op. Exp. Sheet): | |||||||||||||||||||||||||||||||||||||
| Content License Fees to Creator | $ | 1,000,000 | $ | 1,350,000 | $ | 1,820,000 | $ | 2,180,000 | $ | 2,620,000 | $ | 3,140,000 | $ | 3,610,000 | $ | 4,150,000 | $ | 4,770,000 | $ | 5,490,000 | |||||||||||||||||
| Web Hosting Fees | $ | 9,000,000 | $ | 11,700,000 | $ | 13,455,000 | $ | 15,473,250 | $ | 16,633,744 | $ | 17,881,275 | $ | 19,222,370 | $ | 20,183,489 | $ | 21,192,663 | $ | 22,252,296 | |||||||||||||||||
5) General and Administrative Expenses | 30.0 | % | 29.0 | % | 28.0 | % | 27.0 | % | 25.0 | % | 24.0 | % | 22.0 | % | 22.0 | % | 22.0 | % | 22.0 | % | |||||||||||||||||
(% of Gross Revenue) | |||||||||||||||||||||||||||||||||||||
6) OTHER OPERATING EXP. : | |||||||||||||||||||||||||||||||||||||
| First Year of 3rd Party Productions | 1 | ||||||||||||||||||||||||||||||||||||
| Inflation | 3.1 | % | |||||||||||||||||||||||||||||||||||
# of Episodes Producedfor 3rd party prodn | 60 | 100 | 135 | 182 | 218 | 262 | 314 | 361 | 415 | 477 | |||||||||||||||||||||||||||
| 3rd Party Production Costs / Episode | 12,500 | 12,888 | 13,287 | 13,699 | 14,124 | 14,561 | 15,013 | 15,478 | 15,958 | 16,453 | |||||||||||||||||||||||||||
| Site Build/Maintenance | 125,000 | 128,875 | 132,870 | 136,989 | 141,236 | 145,614 | 150,128 | 154,782 | 159,580 | 164,527 | |||||||||||||||||||||||||||
| Marketing | 500,000 | 515,500 | 531,481 | 547,956 | 564,943 | 582,456 | 600,512 | 619,128 | 638,321 | 658,109 | |||||||||||||||||||||||||||
| Software/Tech Support, Annual | 50,000 | 51,550 | 53,148 | 54,796 | 56,494 | 58,246 | 60,051 | 61,913 | 63,832 | 65,811 | |||||||||||||||||||||||||||
| Equipment Maintenance | 7,500 | 10,000 | 15,000 | 15,465 | 15,944 | 16,439 | 16,948 | 17,474 | 18,015 | 18,574 | |||||||||||||||||||||||||||
| Site & Content Acquisition/Aggregation | 300,000 | 309,300 | 318,888 | 328,774 | 338,966 | 349,474 | 360,307 | 371,477 | 382,993 | 394,866 | |||||||||||||||||||||||||||
| Web Publishing | 2,512,500 | 2,590,388 | 2,670,690 | 2,753,481 | 2,838,839 | 2,926,843 | 3,017,575 | 3,111,120 | 3,207,564 | 3,306,999 | |||||||||||||||||||||||||||
| Translations | 572,500 | 590,248 | 608,545 | 627,410 | 646,860 | 666,912 | 687,587 | 708,902 | 730,878 | 753,535 | |||||||||||||||||||||||||||
| Depreciation | 100,000 | 130,000 | 149,500 | 171,925 | 184,819 | 198,681 | 213,582 | 224,261 | 235,474 | 247,248 | |||||||||||||||||||||||||||
6) CAPITAL EXPENDITURES | |||||||||||||||||||||||||||||||||||||
| Equipment Maint., % of Purch. Price/Yr | 1.3 | 125,000 | 162,500 | 186,875 | 214,906 | 231,024 | 248,351 | 266,977 | 280,326 | 294,343 | 309,060 | ||||||||||||||||||||||||||
7) FINANCIAL, Income Statement | |||||||||||||||||||||||||||||||||||||
| Tax Rate | 40.0 | % | 40.0 | % | 40.0 | % | 40.0 | % | 40.0 | % | 40.0 | % | 40.0 | % | 40.0 | % | 40.0 | % | 40.0 | % | |||||||||||||||||
SANLI PASTORE & HILL, INC.
123
Exhibit 24: Time of Revenues from Licensed Video Games
Platinum Studios, Inc.
Video Games: Licensed Video Game Division
Assumptions: | |||||
| Ultimate Units Sold per Video Game Release | 1,000,000 | ||||
| Average Price per Unit (PS3, PSP, Xbox, Wii) | $ | 50 | |||
| Ultimate Gross Receipts | $ | 50,000,000 | |||
Year of Cash Flow | 0 | 1 | 2 | 3 | Total | ||||||||||||
| Decay Curve of Total Gross Receipts | 0 | % | 85 | % | 13 | % | 2 | % | 100 | % | |||||||
Total Gross Receipts | $ | 0 | $ | 42,500,000 | $ | 6,500,000 | $ | 1,000,000 | $ | 50,000,000 | |||||||
Source: www.vgchartz.com, www.npd.com, and other SP&H industry research.
SANLI PASTORE & HILL, INC.
124
Appendix A - 1
Platinum Studios, Inc.
Comic Book Adaptation Movies
Date of Value: March 31,2008
Data from Box Office Mojo | Calculated by SP&H | |||||||||||||||||||||||||||||||||||||||
Title | Genre | Studio | Date Released | Demestic Revenues | International Revenues | Worldwide Revenues | Theaters | Budget | Demestic as % of WorldwideRevenues | International as % of WorldwideRevenues | Demestic Revenues / Budget | International Revenues / Budget | Worldwide Revenues / Budget | |||||||||||||||||||||||||||
| Ghost World | Comedy | MGM | 7/20/2001 | 6,217,849 | 2,546,158 | 8,764,007 | 128 | 7,000,000 | 70.95 | % | 29.05 | % | 0.89 | 0.36 | 1.25 | |||||||||||||||||||||||||
| Spider-Man | Action/Adventure | Sony | 5/3/2002 | 403,706,375 | 418,002,176 | 821,708,551 | 3,876 | 139,000,000 | 49.13 | % | 50.87 | % | 2.90 | 3.01 | 5.91 | |||||||||||||||||||||||||
| Spider-Man 2 | Action/Adventure | Sony | 6/30/2004 | 373,585,825 | 410,180,516 | 783,766,341 | 4,166 | 200,000,000 | 47.67 | % | 52.33 | % | 1.87 | 2.05 | 3.92 | |||||||||||||||||||||||||
| Spider-Man 3 | Action/Adventure | Sony | 5/4/2007 | 336,530,303 | 554,341,323 | 890,871,626 | 4,324 | 258,000,000 | 37.78 | % | 62.22 | % | 1.30 | 2.15 | 3.45 | |||||||||||||||||||||||||
| Batman | Action/Adventure | WB | 6/23/1989 | 251,188,924 | 160,160,000 | 411,348,924 | 2,201 | 35,000,000 | 61.06 | % | 38.94 | % | 7.18 | 4.58 | 11.75 | |||||||||||||||||||||||||
| Men in Black | Action | Sony | 7/2/1997 | 250,690,539 | 338,700,000 | 589,390,539 | 3,180 | 90,000,000 | 42.53 | % | 57.47 | % | 2.79 | 3.76 | 6.55 | |||||||||||||||||||||||||
| X-Men: The Last Stand | Action/Adventure | Fox | 5/26/2006 | 234,362,462 | 224,893,546 | 459,256,008 | 3,714 | 210,000,000 | 51.03 | % | 48.97 | % | 1.12 | 1.07 | 2.19 | |||||||||||||||||||||||||
| X2: X-Men United | Action/Adventure | Fox | 5/2/2003 | 214,949,694 | 192,607,919 | 407,557,613 | 3,749 | 110,000,000 | 52.74 | % | 47.26 | % | 1.95 | 1.75 | 3.71 | |||||||||||||||||||||||||
| 300 | Action | WB | 3/9/2007 | 210,614,939 | 245,453,242 | 456,068,181 | 3,280 | 65,000,000 | 46.18 | % | 53.82 | % | 3.24 | 3.78 | 7.02 | |||||||||||||||||||||||||
| Batman Begins | Action/Adventure | WB | 6/15/2005 | 205,343,774 | 166,510,009 | 371,853,783 | 3,858 | 150,000,000 | 55.22 | % | 44.78 | % | 1.37 | 1.11 | 2.48 | |||||||||||||||||||||||||
| Superman Returns | Action/Adventure | WB | 6/28/2006 | 200,081,192 | 191,000,000 | 391,081,192 | 4,065 | 270,000,000 | 51.16 | % | 48.84 | % | 0.74 | 0.71 | 1.45 | |||||||||||||||||||||||||
| Men in Black II | Action | Sony | 7/3/2002 | 190,418,803 | 251,400,000 | 441,818,803 | 3,641 | 140,000,000 | 43.10 | % | 56.90 | % | 1.36 | 1.80 | 3.16 | |||||||||||||||||||||||||
| Batman Forever | Action/Adventure | WB | 6/16/1995 | 184,031,112 | 152,500,000 | 336,531,112 | 2,893 | 100,000,000 | 54.68 | % | 45.32 | % | 1.84 | 1.53 | 3.37 | |||||||||||||||||||||||||
| Batman Returns | Action/Adventure | WB | 6/19/1992 | 162,831,698 | 104,000,000 | 266,831,698 | 2,644 | 80,000,000 | 61.02 | % | 38.98 | % | 2.04 | 1.30 | 3.34 | |||||||||||||||||||||||||
| X-Men | Action/Adventure | Fox | 7/14/2000 | 157,299,717 | 138,950,336 | 296,250,053 | 3,112 | 75,000,000 | 53.10 | % | 46.90 | % | 2.10 | 1.85 | 3.95 | |||||||||||||||||||||||||
| Fantastic Four | Action/Adventure | Fox | 7/8/2005 | 154,696,080 | 175,424,795 | 330,120,875 | 3,619 | 100,000,000 | 46.86 | % | 53.14 | % | 1.55 | 1.75 | 3.30 | |||||||||||||||||||||||||
| Teenage Mutant Ninja Turtles | Action/Adventure | NL | 3/30/1990 | 135,265,915 | 66,700,000 | 201,965,915 | 2,377 | 13,500,000 | 66.97 | % | 33.03 | % | 10.02 | 4.94 | 14.96 | |||||||||||||||||||||||||
| Superman | Action/Adventure | WB | 12/15/1978 | 134,218,018 | 166,000,000 | 300,218,018 | 817 | 55,000,000 | 44.71 | % | 55.29 | % | 2.44 | 3.02 | 5.46 | |||||||||||||||||||||||||
| Hulk | Action/Adventure | Uni. | 6/20/2003 | 132,177,234 | 113,183,246 | 245,360,480 | 3,674 | 137,000,000 | 53.87 | % | 46.13 | % | 0.96 | 0.83 | 1.79 | |||||||||||||||||||||||||
| Fantastic Four: Rise of the Silver Surfer | Action/Adventure | Fox | 6/15/2007 | 131,921,738 | 156,489,459 | 288,411,197 | 3,963 | 130,000,000 | 45.74 | % | 54.26 | % | 1.01 | 1.20 | 2.22 | |||||||||||||||||||||||||
| The Mask | Comedy | NL | 7/29/1994 | 119,938,730 | 231,644,677 | 351,583,407 | 2,516 | 23,000,000 | 34.11 | % | 65.89 | % | 5.21 | 10.07 | 15.29 | |||||||||||||||||||||||||
| Ghost Rider | Action Horror | Sony | 2/16/2007 | 115,802,596 | 112,935,797 | 228,738,393 | 3,620 | 110,000,000 | 50.63 | % | 49.37 | % | 1.05 | 1.03 | 2.08 | |||||||||||||||||||||||||
| Superman II | Action/Adventure | WB | 6/19/1981 | 108,185,706 | - | - | 1,878 | 54,000,000 | - | - | 2.00 | - | - | |||||||||||||||||||||||||||
| Batman and Robin | Action/Adventure | WB | 6/20/1997 | 107,325,195 | 130,881,927 | 238,207,122 | 2,942 | 125,000,000 | 45.06 | % | 54.94 | % | 0.86 | 1.05 | 1.91 | |||||||||||||||||||||||||
| Road to Perdition | Crime Drama/Thriller | DW | 7/12/2002 | 104,454,762 | 76,546,716 | 181,001,478 | 2,332 | 80,000,000 | 57.71 | % | 42.29 | % | 1.31 | 0.96 | 2.26 | |||||||||||||||||||||||||
| Dick Tracy | Action | BV | 6/15/1990 | 103,738,726 | 59,000,000 | 162,738,726 | 2,332 | 47,000,000 | 63.75 | % | 36.25 | % | 2.21 | 1.26 | 3.46 | |||||||||||||||||||||||||
| Daredevil | Action/Adventure | Fox | 2/14/2003 | 102,543,518 | 76,636,200 | 179,179,718 | 3,474 | 78,000,000 | 57.23 | % | 42.77 | % | 1.31 | 0.98 | 2.30 | |||||||||||||||||||||||||
| Casper | Comedy | Uni. | 5/26/1995 | 100,328,194 | 187,600,000 | 287,928,194 | 2,757 | 55,000,000 | 34.84 | % | 65.16 | % | 1.82 | 3.41 | 5.24 | |||||||||||||||||||||||||
| Blade II | Action Horror | NL | 3/22/2002 | 82,348,319 | 72,661,713 | 155,010,032 | 2,707 | 54,000,000 | 53.12 | % | 46.88 | % | 1.52 | 1.35 | 2.87 | |||||||||||||||||||||||||
| Teenage Mutant Ninja Turtles II | Action/Adventure | NL | 3/22/1991 | 78,656,813 | - | - | 2,868 | 25,000,000 | - | - | 3.15 | - | - | |||||||||||||||||||||||||||
| Constantine | Horror | WB | 2/18/2005 | 75,976,178 | 154,908,550 | 230,884,728 | 3,006 | 100,000,000 | 32.91 | % | 67.09 | % | 0.76 | 1.55 | 2.31 | |||||||||||||||||||||||||
| Sin City | Crime Horror | Dim. | 4/1/2005 | 74,103,820 | 84,650,000 | 158,753,820 | 3,230 | 40,000,000 | 46.68 | % | 53.32 | % | 1.85 | 2.12 | 3.97 | |||||||||||||||||||||||||
| V for Vendetta | Action Thriller | WB | 3/17/2006 | 70,511,035 | 62,000,000 | 132,511,035 | 3,365 | 54,000,000 | 53.21 | % | 46.79 | % | 1.31 | 1.15 | 2.45 | |||||||||||||||||||||||||
| Blade | Action Horror | NL | 8/21/1998 | 70,087,718 | 61,095,812 | 131,183,530 | 2,389 | 45,000,000 | 53.43 | % | 46.57 | % | 1.56 | 1.36 | 2.92 | |||||||||||||||||||||||||
| The League of Extraordinary Gentlemen | Adventure/Action | Fox | 7/11/2003 | 66,465,204 | 112,800,000 | 179,265,204 | 3,002 | 78,000,000 | 37.08 | % | 62.92 | % | 0.85 | 1.45 | 2.30 | |||||||||||||||||||||||||
| Superman III | Action/Adventure | WB | 6/17/1983 | 59,950,623 | - | - | 1,763 | 39,000,000 | - | - | 1.54 | - | - | |||||||||||||||||||||||||||
| Hellboy | Action Horror | SonR | 4/2/2004 | 59,623,958 | 39,695,029 | 99,318,987 | 3,043 | 66,000,000 | 60.03 | % | 39.97 | % | 0.90 | 0.60 | 1.50 | |||||||||||||||||||||||||
| Annie | Musical | Col. | 5/21/1982 | 57,059,003 | - | - | 1,102 | 50,000,000 | - | - | 1.14 | - | - | |||||||||||||||||||||||||||
| Spawn | Action Horror | NL | 8/1/1997 | 54,870,175 | 32,969,867 | 87,840,042 | 2,604 | 40,000,000 | 62.47 | % | 37.53 | % | 1.37 | 0.82 | 2.20 | |||||||||||||||||||||||||
| TMNT | Action/Adventure | WB | 3/23/2007 | 54,149,098 | 40,853,078 | 95,002,176 | 3,120 | 34,000,000 | 57.00 | % | 43.00 | % | 1.59 | 1.20 | 2.79 | |||||||||||||||||||||||||
| Blade: Trinity | Action Horror | NL | 12/8/2004 | 52,411,906 | 76,493,460 | 128,905,366 | 2,912 | 65,000,000 | 40.66 | % | 59.34 | % | 0.81 | 1.18 | 1.98 | |||||||||||||||||||||||||
| Dennis the Menace | Comedy | WB | 6/25/1993 | 51,270,765 | 66,000,000 | 117,270,765 | 2,085 | n/a | 43.72 | % | 56.28 | % | - | - | - | |||||||||||||||||||||||||
| The Crow | Action Horror | Mira. | 5/13/1994 | 50,693,129 | - | - | 2,119 | 15,000,000 | - | - | 3.38 | - | - | |||||||||||||||||||||||||||
| Popeye | Musical | Par. | 12/12/1980 | 49,823,037 | - | - | 901 | 20,000,000 | - | - | 2.49 | - | - | |||||||||||||||||||||||||||
| The Rocketeer | Action | BV | 6/21/1991 | 46,704,056 | - | - | 1,903 | 40,000,000 | - | - | 1.17 | - | - | |||||||||||||||||||||||||||
| Timecop | Action | Uni. | 9/16/1994 | 44,853,581 | 56,793,000 | 101,646,581 | 2,274 | 28,000,000 | 44.13 | % | 55.87 | % | 1.60 | 2.03 | 3.63 | |||||||||||||||||||||||||
| Teenage Mutant Ninja Turtles III | Action/Adventure | NL | 3/19/1993 | 42,273,609 | - | - | 2,087 | 21,000,000 | - | - | 2.01 | - | - | |||||||||||||||||||||||||||
| Catwoman | Action/Adventure | WB | 7/23/2004 | 40,202,379 | 41,900,000 | 82,102,379 | 3,117 | 100,000,000 | 48.97 | % | 51.03 | % | 0.40 | 0.42 | 0.82 | |||||||||||||||||||||||||
| 30 Days of Night | Horror | Sony | 10/19/2007 | 39,568,996 | 25,513,520 | 65,082,516 | 2,859 | 30,000,000 | 60.80 | % | 39.20 | % | 1.32 | 0.85 | 2.17 | |||||||||||||||||||||||||
| Richie Rich | Comedy | WB | 12/21/1994 | 38,087,756 | - | - | 1,761 | 40,000,000 | - | - | 0.95 | - | - | |||||||||||||||||||||||||||
| Judge Dredd | Action/Adventure | BV | 6/30/1995 | 34,693,481 | 78,800,000 | 113,493,481 | 2,204 | 90,000,000 | 30.57 | % | 69.43 | % | 0.39 | 0.88 | 1.26 | |||||||||||||||||||||||||
| The Punisher | Action/Crime | Lions | 4/16/2004 | 33,810,189 | 20,889,916 | 54,700,105 | 2,649 | 33,000,000 | 61.81 | % | 38.19 | % | 1.02 | 0.63 | 1.66 | |||||||||||||||||||||||||
| The Shadow | Action | Uni. | 7/1/1994 | 32,063,435 | 16,000,000 | 48,063,435 | 1,769 | 40,000,000 | 66.71 | % | 33.29 | % | 0.80 | 0.40 | 1.20 | |||||||||||||||||||||||||
| From Hell | Horror | Fox | 10/19/2001 | 31,602,566 | 42,955,549 | 74,558,115 | 2,334 | 35,000,000 | 42.39 | % | 57.61 | % | 0.90 | 1.23 | 2.13 | |||||||||||||||||||||||||
| A History of Violence | Crime Drama/Thriller | NL | 9/23/2005 | 31,504,633 | 28,829,431 | 60,334,064 | 1,348 | 32,000,000 | 52.22 | % | 47.78 | % | 0.98 | 0.90 | 1.89 | |||||||||||||||||||||||||
| Mystery Men | Comedy | Uni. | 8/6/1999 | 29,762,011 | 3,699,000 | 33,461,011 | 2,142 | 68,000,000 | 88.95 | % | 11.05 | % | 0.44 | 0.05 | 0.49 | |||||||||||||||||||||||||
| Flash Gordon | Action/Adventure | Uni. | 12/5/1980 | 27,107,960 | - | - | - | 35,000,000 | - | - | 0.77 | - | - | |||||||||||||||||||||||||||
| Elektra | Action/Adventure | Fox | 1/14/2005 | 24,409,722 | 32,271,844 | 56,681,566 | 3,204 | 43,000,000 | 43.06 | % | 56.94 | % | 0.57 | 0.75 | 1.32 | |||||||||||||||||||||||||
| Bulletproof Monk | Action | MGM | 4/16/2003 | 23,358,708 | 14,355,171 | 37,713,879 | 2,955 | 52,000,000 | 61.94 | % | 38.06 | % | 0.45 | 0.28 | 0.73 | |||||||||||||||||||||||||
| Buck Rogers in the 25th Century | Adventure | Uni. | 3/30/1979 | 21,671,241 | - | - | 934 | n/a | - | - | - | - | - | |||||||||||||||||||||||||||
| The Crow: City of Angels | Action Horror | Mira. | 8/30/1996 | 17,917,287 | - | - | 2,423 | 13,000,000 | - | - | 1.38 | - | - | |||||||||||||||||||||||||||
| The Phantom | Action | Par. | 6/7/1996 | 17,323,326 | - | - | 2,163 | 45,000,000 | - | - | 0.38 | - | - | |||||||||||||||||||||||||||
| Howard the Duck | Comedy | Uni. | 8/1/1986 | 16,295,774 | 21,667,000 | 37,962,774 | 1,563 | 37,000,000 | 42.93 | % | 57.07 | % | 0.44 | 0.59 | 1.03 | |||||||||||||||||||||||||
| Superman IV: The Quest for Peace | Action/Adventure | WB | 7/24/1987 | 15,681,020 | - | - | 1,511 | 17,000,000 | - | - | 0.92 | - | - | |||||||||||||||||||||||||||
| Supergirl | Action/Adventure | TriS | 11/21/1984 | 14,296,438 | - | - | 1,620 | 35,000,000 | - | - | 0.41 | - | - | |||||||||||||||||||||||||||
| Josie and the Pussycats | Comedy | Uni. | 4/11/2001 | 14,271,015 | 595,000 | 14,866,015 | 2,558 | 39,000,000 | 96.00 | % | 4.00 | % | 0.37 | 0.02 | 0.38 | |||||||||||||||||||||||||
| Virus | Horror | Uni. | 1/15/1999 | 14,036,005 | 16,616,000 | 30,652,005 | 2,018 | 75,000,000 | 45.79 | % | 54.21 | % | 0.19 | 0.22 | 0.41 | |||||||||||||||||||||||||
| American Splendor | Comedy | FL | 8/15/2003 | 6,010,990 | 1,975,094 | 7,986,084 | 272 | 2,000,000 | 75.27 | % | 24.73 | % | 3.01 | 0.99 | 3.99 | |||||||||||||||||||||||||
| Sheena | Action/Adventure | Col. | 8/17/1984 | 5,778,353 | - | - | 1,496 | 25,000,000 | - | - | 0.23 | - | - | |||||||||||||||||||||||||||
| Batman: Mask of the Phantasm | Animation | WB | 12/25/1993 | 5,617,391 | - | - | 1,506 | 6,000,000 | - | - | 0.94 | - | - | |||||||||||||||||||||||||||
| Tank Girl | Comedy | MGM | 3/31/1995 | 4,064,495 | - | - | 1,363 | 25,000,000 | - | - | 0.16 | - | - | |||||||||||||||||||||||||||
| Barb Wire | Action | Gram. | 5/3/1996 | 3,793,614 | - | - | 1,312 | n/a | - | - | - | - | - | |||||||||||||||||||||||||||
| Steel | Action/Adventure | WB | 8/15/1997 | 1,710,972 | - | - | 1,260 | 16,000,000 | - | - | 0.11 | - | - | |||||||||||||||||||||||||||
| Little Nemo: Adventures in Slumberland | Animation | Hemd | 8/21/1992 | 1,368,000 | - | - | 579 | 35,000,000 | - | - | 0.04 | - | - | |||||||||||||||||||||||||||
| Brenda Starr | Unkown | Triu | 4/17/1992 | 67,878 | - | - | 48 | n/a | - | - | - | - | - | |||||||||||||||||||||||||||
| Man-Thing | Unkown | Lions | N/A | n/a | - | - | - | 103,400,000 | - | - | - | - | - | |||||||||||||||||||||||||||
| The Green Hornet | Action/Adventure | Sony | N/A | n/a | - | - | - | 585,600,000 | - | - | - | - | - | |||||||||||||||||||||||||||
Summary Statistics | |||||||||||||||||||||||||||||||
Demestic Revenues | International Revenues | Worldwide Revenues | Theaters | Budget | Demestic as % of Worldwide Revenues | International as% of WorldwideRevenues | Demestic Revenues /Budget | International Revenues /Budget | Worldwide Revenues /Budget | ||||||||||||||||||||||
Count | 75 | 53 | 53 | 74 | 73 | 53 | 53 | 71 | 52 | 52 | |||||||||||||||||||||
Min | 67,878 | 595,000 | 7,986,084 | 48 | 2,000,000 | 0.31 | 0.04 | 0.04 | 0.02 | 0.38 | |||||||||||||||||||||
LQ | 25,758,841 | 39,695,029 | 82,102,379 | 1,765 | 34,000,000 | 0.44 | 0.40 | 0.80 | 0.83 | 1.76 | |||||||||||||||||||||
Median | 54,870,175 | 76,636,200 | 179,179,718 | 2,470 | 50,000,000 | 0.51 | 0.49 | 1.30 | 1.19 | 2.30 | |||||||||||||||||||||
Mean | 88,271,430 | 119,080,681 | 231,392,484 | 2,440 | 74,075,342 | 0.52 | 0.48 | 1.56 | 1.62 | 3.31 | |||||||||||||||||||||
UQ | 125,930,234 | 166,000,000 | 330,120,875 | 3,119 | 90,000,000 | 0.60 | 0.56 | 1.86 | 1.81 | 3.65 | |||||||||||||||||||||
Max | 403,706,375 | 554,341,323 | 890,871,626 | 4,324 | 585,600,000 | 0.96 | 0.69 | 10.02 | 10.07 | 15.29 | |||||||||||||||||||||
Std Dev | 88,626,346 | 115,220,075 | 204,725,854 | 1,002 | 81,601,824 | 0.13 | 0.13 | 1.53 | 1.62 | 3.08 | |||||||||||||||||||||
Mean + 2*Std Dev | 265,524,123 | 349,520,830 | 640,844,192 | 4,444 | 237,278,991 | 0.78 | 0.73 | 4.63 | 4.85 | 9.47 | |||||||||||||||||||||
Mean - 2*Std Dev | (88,981,262 | ) | (111,359,469 | ) | (178,059,225 | ) | 437 | (89,128,306 | ) | 0.27 | 0.22 | (1.50 | ) | (1.61 | ) | (2.85 | ) | ||||||||||||||
CV | 1.00 | 0.97 | 0.88 | 0.41 | 1.10 | 0.24 | 0.27 | 0.98 | 1.00 | 0.93 | |||||||||||||||||||||
SANLI PASTORE & HILL, INC.
125
Appendix A - 2
Platinum Studios, Inc.
Comic Book Adaptation Movies: Action - High Budget
Date of Value: March 31,2008
Data from Box Office Mojo | Calculated by SP&H | |||||||||||||||||||||||||||||||||||||||
Title | Genre | Studio | Date Released | Demestic Revenues | International Revenues | Worldwide Revenues | Theaters | Budget | Demestic as % of WorldwideRevenues | International as % of WorldwideRevenues | Demestic Revenues /Budget | International Revenues /Budget | Worldwide Revenues /Budget | |||||||||||||||||||||||||||
| Bulletproof Monk | Action | MGM | 4/16/2003 | 23,358,708 | 14,355,171 | 37,713,879 | 2,955 | 52,000,000 | 61.94 | % | 38.06 | % | 0.45 | 0.28 | 0.73 | |||||||||||||||||||||||||
| Superman II | Action/Adventure | WB | 6/19/1981 | 108,185,706 | - | - | 1,878 | 54,000,000 | - | - | 2.00 | - | - | |||||||||||||||||||||||||||
| Superman | Action/Adventure | WB | 12/15/1978 | 134,218,018 | 166,000,000 | 300,218,018 | 817 | 55,000,000 | 44.71 | % | 55.29 | % | 2.44 | 3.02 | 5.46 | |||||||||||||||||||||||||
| 300 | Action | WB | 3/9/2007 | 210,614,939 | 245,453,242 | 456,068,181 | 3,280 | 65,000,000 | 46.18 | % | 53.82 | % | 3.24 | 3.78 | 7.02 | |||||||||||||||||||||||||
| X-Men | Action/Adventure | Fox | 7/14/2000 | 157,299,717 | 138,950,336 | 296,250,053 | 3,112 | 75,000,000 | 53.10 | % | 46.90 | % | 2.10 | 1.85 | 3.95 | |||||||||||||||||||||||||
| Daredevil | Action/Adventure | Fox | 2/14/2003 | 102,543,518 | 76,636,200 | 179,179,718 | 3,474 | 78,000,000 | 57.23 | % | 42.77 | % | 1.31 | 0.98 | 2.30 | |||||||||||||||||||||||||
| The League of Extraordinary Gentlemen | Adventure/Action | Fox | 7/11/2003 | 66,465,204 | 112,800,000 | 179,265,204 | 3,002 | 78,000,000 | 37.08 | % | 62.92 | % | 0.85 | 1.45 | 2.30 | |||||||||||||||||||||||||
| Batman Returns | Action/Adventure | WB | 6/19/1992 | 162,831,698 | 104,000,000 | 266,831,698 | 2,644 | 80,000,000 | 61.02 | % | 38.98 | % | 2.04 | 1.30 | 3.34 | |||||||||||||||||||||||||
| Judge Dredd | Action/Adventure | BV | 6/30/1995 | 34,693,481 | 78,800,000 | 113,493,481 | 2,204 | 90,000,000 | 30.57 | % | 69.43 | % | 0.39 | 0.88 | 1.26 | |||||||||||||||||||||||||
| Men in Black | Action | Sony | 7/2/1997 | 250,690,539 | 338,700,000 | 589,390,539 | 3,180 | 90,000,000 | 42.53 | % | 57.47 | % | 2.79 | 3.76 | 6.55 | |||||||||||||||||||||||||
| Batman Forever | Action/Adventure | WB | 6/16/1995 | 184,031,112 | 152,500,000 | 336,531,112 | 2,893 | 100,000,000 | 54.68 | % | 45.32 | % | 1.84 | 1.53 | 3.37 | |||||||||||||||||||||||||
| Catwoman | Action/Adventure | WB | 7/23/2004 | 40,202,379 | 41,900,000 | 82,102,379 | 3,117 | 100,000,000 | 48.97 | % | 51.03 | % | 0.40 | 0.42 | 0.82 | |||||||||||||||||||||||||
| Fantastic Four | Action/Adventure | Fox | 7/8/2005 | 154,696,080 | 175,424,795 | 330,120,875 | 3,619 | 100,000,000 | 46.86 | % | 53.14 | % | 1.55 | 1.75 | 3.30 | |||||||||||||||||||||||||
| X2: X-Men United | Action/Adventure | Fox | 5/2/2003 | 214,949,694 | 192,607,919 | 407,557,613 | 3,749 | 110,000,000 | 52.74 | % | 47.26 | % | 1.95 | 1.75 | 3.71 | |||||||||||||||||||||||||
| Batman and Robin | Action/Adventure | WB | 6/20/1997 | 107,325,195 | 130,881,927 | 238,207,122 | 2,942 | 125,000,000 | 45.06 | % | 54.94 | % | 0.86 | 1.05 | 1.91 | |||||||||||||||||||||||||
| Fantastic Four: Rise of the Silver Surfer | Action/Adventure | Fox | 6/15/2007 | 131,921,738 | 156,489,459 | 288,411,197 | 3,963 | 130,000,000 | 45.74 | % | 54.26 | % | 1.01 | 1.20 | 2.22 | |||||||||||||||||||||||||
| Hulk | Action/Adventure | Uni. | 6/20/2003 | 132,177,234 | 113,183,246 | 245,360,480 | 3,674 | 137,000,000 | 53.87 | % | 46.13 | % | 0.96 | 0.83 | 1.79 | |||||||||||||||||||||||||
| Spider-Man | Action/Adventure | Sony | 5/3/2002 | 403,706,375 | 418,002,176 | 821,708,551 | 3,876 | 139,000,000 | 49.13 | % | 50.87 | % | 2.90 | 3.01 | 5.91 | |||||||||||||||||||||||||
| Men in Black II | Action | Sony | 7/3/2002 | 190,418,803 | 251,400,000 | 441,818,803 | 3,641 | 140,000,000 | 43.10 | % | 56.90 | % | 1.36 | 1.80 | 3.16 | |||||||||||||||||||||||||
| Batman Begins | Action/Adventure | WB | 6/15/2005 | 205,343,774 | 166,510,009 | 371,853,783 | 3,858 | 150,000,000 | 55.22 | % | 44.78 | % | 1.37 | 1.11 | 2.48 | |||||||||||||||||||||||||
| Spider-Man 2 | Action/Adventure | Sony | 6/30/2004 | 373,585,825 | 410,180,516 | 783,766,341 | 4,166 | 200,000,000 | 47.67 | % | 52.33 | % | 1.87 | 2.05 | 3.92 | |||||||||||||||||||||||||
| X-Men: The Last Stand | Action/Adventure | Fox | 5/26/2006 | 234,362,462 | 224,893,546 | 459,256,008 | 3,714 | 210,000,000 | 51.03 | % | 48.97 | % | 1.12 | 1.07 | 2.19 | |||||||||||||||||||||||||
| Spider-Man 3 | Action/Adventure | Sony | 5/4/2007 | 336,530,303 | 554,341,323 | 890,871,626 | 4,324 | 258,000,000 | 37.78 | % | 62.22 | % | 1.30 | 2.15 | 3.45 | |||||||||||||||||||||||||
| Superman Returns | Action/Adventure | WB | 6/28/2006 | 200,081,192 | 191,000,000 | 391,081,192 | 4,065 | 270,000,000 | 51.16 | % | 48.84 | % | 0.74 | 0.71 | 1.45 | |||||||||||||||||||||||||
| The Green Hornet | Action/Adventure | Sony | N/A | n/a | - | - | - | 585,600,000 | - | - | - | - | - | |||||||||||||||||||||||||||
Summary Statistics | |||||||||||||||||||||||||||||||
Demestic Revenues | InternationalRevenues | Worldwide Revenues | Theaters | Budget | Demestic as % of Worldwide Revenues | International as % of WorldwideRevenues | Demestic Revenues /Budget | International Revenues /Budget | Worldwide Revenues /Budget | ||||||||||||||||||||||
Count | 24 | 23 | 23 | 24 | 25 | 23 | 23 | 24 | 23 | 23 | |||||||||||||||||||||
Min | 23,358,708 | 14,355,171 | 37,713,879 | 817 | 52,000,000 | 0.31 | 0.38 | 0.39 | 0.28 | 0.73 | |||||||||||||||||||||
LQ | 107,970,578 | 112,991,623 | 241,783,801 | 2,952 | 78,000,000 | 0.45 | 0.47 | 0.94 | 1.01 | 2.05 | |||||||||||||||||||||
Median | 160,065,708 | 166,000,000 | 330,120,875 | 3,377 | 100,000,000 | 0.49 | 0.51 | 1.36 | 1.45 | 3.16 | |||||||||||||||||||||
Mean | 173,343,071 | 193,696,081 | 369,872,081 | 3,256 | 138,864,000 | 0.49 | 0.51 | 1.54 | 1.64 | 3.15 | |||||||||||||||||||||
UQ | 211,698,628 | 235,173,394 | 448,943,492 | 3,776 | 140,000,000 | 0.53 | 0.55 | 2.01 | 1.95 | 3.81 | |||||||||||||||||||||
Max | 403,706,375 | 554,341,323 | 890,871,626 | 4,324 | 585,600,000 | 0.62 | 0.69 | 3.24 | 3.78 | 7.02 | |||||||||||||||||||||
Std Dev | 98,886,637 | 129,738,464 | 224,841,738 | 796 | 110,394,953 | 0.08 | 0.08 | 0.80 | 0.97 | 1.73 | |||||||||||||||||||||
Mean + 2*Std Dev | 371,116,345 | 453,173,009 | 819,555,556 | 4,849 | 359,653,907 | 0.64 | 0.67 | 3.13 | 3.57 | 6.62 | |||||||||||||||||||||
Mean - 2*Std Dev | (24,430,204 | ) | (65,780,847 | ) | (79,811,395 | ) | 1,663 | (81,925,907 | ) | 0.33 | 0.36 | (0.06 | ) | (0.29 | ) | (0.31 | ) | ||||||||||||||
CV | 0.57 | 0.67 | 0.61 | 0.24 | 0.79 | 0.16 | 0.15 | 0.52 | 0.59 | 0.55 | |||||||||||||||||||||
SANLI PASTORE & HILL, INC.
126
Appendix A - 3
Platinum Studios, Inc.
Comic Book Adaptation Movies: Comedy - High Budget
Date of Value: March 31,2008
Data from Box Office Mojo | Calculated by SP&H | |||||||||||||||||||||||||||||||||||||||
Title | Genre | Studio | Date Released | DemesticRevenues | InternationalRevenues | WorldwideRevenues | Theaters | Budget | Demestic as % of WorldwideRevenues | International as % of WorldwideRevenues | Demestic Revenues /Budget | International Revenues /Budget | Worldwide Revenues /Budget | |||||||||||||||||||||||||||
| Richie Rich | Comedy | WB | 12/21/1994 | 38,087,756 | - | - | 1,761 | 40,000,000 | - | - | 0.95 | - | - | |||||||||||||||||||||||||||
| Casper | Comedy | Uni. | 5/26/1995 | 100,328,194 | 187,600,000 | 287,928,194 | 2,757 | 55,000,000 | 34.84 | % | 65.16 | % | 1.82 | 3.41 | 5.24 | |||||||||||||||||||||||||
| Mystery Men | Comedy | Uni. | 8/6/1999 | 29,762,011 | 3,699,000 | 33,461,011 | 2,142 | 68,000,000 | 88.95 | % | 11.05 | % | 0.44 | 0.05 | 0.49 | |||||||||||||||||||||||||
Summary Statistics | |||||||||||||||||||||||||||||||
Demestic Revenues | International Revenues | Worldwide Revenues | Theaters | Budget | Demestic as % of Worldwide Revenues | International as% of Worldwide Revenues | Demestic Revenues / Budget | International Revenues / Budget | Worldwide Revenues / Budget | ||||||||||||||||||||||
Count | 3 | 2 | 2 | 3 | 3 | 2 | 2 | 3 | 2 | 2 | |||||||||||||||||||||
Min | 29,762,011 | 3,699,000 | 33,461,011 | 1,761 | 40,000,000 | 0.35 | 0.11 | 0.44 | 0.05 | 0.49 | |||||||||||||||||||||
LQ | 33,924,884 | 49,674,250 | 97,077,807 | 1,952 | 47,500,000 | 0.48 | 0.25 | 0.69 | 0.89 | 1.68 | |||||||||||||||||||||
Median | 38,087,756 | 95,649,500 | 160,694,603 | 2,142 | 55,000,000 | 0.62 | 0.38 | 0.95 | 1.73 | 2.86 | |||||||||||||||||||||
Mean | 56,059,320 | 95,649,500 | 160,694,603 | 2,220 | 54,333,333 | 0.62 | 0.38 | 1.07 | 1.73 | 2.86 | |||||||||||||||||||||
UQ | 69,207,975 | 141,624,750 | 224,311,398 | 2,450 | 61,500,000 | 0.75 | 0.52 | 1.39 | 2.57 | 4.05 | |||||||||||||||||||||
Max | 100,328,194 | 187,600,000 | 287,928,194 | 2,757 | 68,000,000 | 0.89 | 0.65 | 1.82 | 3.41 | 5.24 | |||||||||||||||||||||
Std Dev | 38,563,317 | 130,037,644 | 179,935,471 | 503 | 14,011,900 | 0.38 | 0.38 | 0.70 | 2.37 | 3.35 | |||||||||||||||||||||
Mean + 2*Std Dev | 133,185,954 | 355,724,788 | 520,565,544 | 3,225 | 82,357,133 | 1.38 | 1.15 | 2.47 | 6.48 | 9.57 | |||||||||||||||||||||
Mean - 2*Std Dev | (21,067,313 | ) | (164,425,788 | ) | (199,176,339 | ) | 1,215 | 26,309,534 | (0.15 | ) | (0.38 | ) | (0.33 | ) | (3.01 | ) | (3.84 | ) | |||||||||||||
CV | 0.69 | 1.36 | 1.12 | 0.23 | 0.26 | 0.62 | 1.00 | 0.65 | 1.37 | 1.17 | |||||||||||||||||||||
SANLI PASTORE & HILL, INC.
127
Appendix A - 4
Platinum Studios, Inc.
Comic Book Adaptation Movies: Thriller - High Budget
Date of Value: March 31,2008
Data from Box Office Mojo | Calculated by SP&H | |||||||||||||||||||||||||||||||||||||||
Title | Genre | Studio | Date Released | DemesticRevenues | InternationalRevenues | WorldwideRevenues | Theaters | Budget | Demestic as % of WorldwideRevenues | International as % of WorldwideRevenues | Demestic Revenues /Budget | International Revenues /Budget | Worldwide Revenues /Budget | |||||||||||||||||||||||||||
| Blade II | Action Horror | NL | 3/22/2002 | 82,348,319 | 72,661,713 | 155,010,032 | 2,707 | 54,000,000 | 53.12 | % | 46.88 | % | 1.52 | 1.35 | 2.87 | |||||||||||||||||||||||||
| V for Vendetta | Action Thriller | WB | 3/17/2006 | 70,511,035 | 62,000,000 | 132,511,035 | 3,365 | 54,000,000 | 53.21 | % | 46.79 | % | 1.31 | 1.15 | 2.45 | |||||||||||||||||||||||||
| Blade: Trinity | Action Horror | NL | 12/8/2004 | 52,411,906 | 76,493,460 | 128,905,366 | 2,912 | 65,000,000 | 40.66 | % | 59.34 | % | 0.81 | 1.18 | 1.98 | |||||||||||||||||||||||||
| Hellboy | Action Horror | SonR | 4/2/2004 | 59,623,958 | 39,695,029 | 99,318,987 | 3,043 | 66,000,000 | 60.03 | % | 39.97 | % | 0.90 | 0.60 | 1.50 | |||||||||||||||||||||||||
| Road to Perdition | Crime Drama/Thriller | DW | 7/12/2002 | 104,454,762 | 76,546,716 | 181,001,478 | 2,332 | 80,000,000 | 57.71 | % | 42.29 | % | 1.31 | 0.96 | 2.26 | |||||||||||||||||||||||||
| Ghost Rider | Action Horror | Sony | 2/16/2007 | 115,802,596 | 112,935,797 | 228,738,393 | 3,620 | 110,000,000 | 50.63 | % | 49.37 | % | 1.05 | 1.03 | 2.08 | |||||||||||||||||||||||||
Summary Statistics | |||||||||||||||||||||||||||||||
Demestic Revenues | International Revenues | Worldwide Revenues | Theaters | Budget | Demestic as % of Worldwide Revenues | International as % of Worldwide Revenues | Demestic Revenues / Budget | International Revenues / Budget | Worldwide Revenues / Budget | ||||||||||||||||||||||
Count | 6 | 6 | 6 | 6 | 6 | 6 | 6 | 6 | 6 | 6 | |||||||||||||||||||||
Min | 52,411,906 | 39,695,029 | 99,318,987 | 2,332 | 54,000,000 | 0.41 | 0.40 | 0.81 | 0.60 | 1.50 | |||||||||||||||||||||
LQ | 62,345,727 | 64,665,428 | 129,806,783 | 2,758 | 56,750,000 | 0.51 | 0.43 | 0.94 | 0.97 | 2.01 | |||||||||||||||||||||
Median | 76,429,677 | 74,577,587 | 143,760,534 | 2,978 | 65,500,000 | 0.53 | 0.47 | 1.18 | 1.09 | 2.17 | |||||||||||||||||||||
Mean | 80,858,763 | 73,388,786 | 154,247,549 | 2,997 | 71,500,000 | 0.53 | 0.47 | 1.15 | 1.04 | 2.19 | |||||||||||||||||||||
UQ | 98,928,151 | 76,533,402 | 174,503,617 | 3,285 | 76,500,000 | 0.57 | 0.49 | 1.31 | 1.17 | 2.41 | |||||||||||||||||||||
Max | 115,802,596 | 112,935,797 | 228,738,393 | 3,620 | 110,000,000 | 0.60 | 0.59 | 1.52 | 1.35 | 2.87 | |||||||||||||||||||||
Std Dev | 25,088,952 | 23,870,819 | 45,600,634 | 460 | 21,163,648 | 0.07 | 0.07 | 0.27 | 0.25 | 0.46 | |||||||||||||||||||||
Mean + 2*Std Dev | 131,036,666 | 121,130,423 | 245,448,817 | 3,917 | 113,827,296 | 0.66 | 0.61 | 1.70 | 1.55 | 3.11 | |||||||||||||||||||||
Mean - 2*Std Dev | 30,680,859 | 25,647,148 | 63,046,280 | 2,076 | 29,172,704 | 0.39 | 0.34 | 0.60 | 0.53 | 1.27 | |||||||||||||||||||||
CV | 0.31 | 0.33 | 0.30 | 0.15 | 0.30 | 0.13 | 0.14 | 0.24 | 0.24 | 0.21 | |||||||||||||||||||||
SANLI PASTORE & HILL, INC.
128
Appendix A - 5
Platinum Studios, Inc.
Comic Book Adaptation Movies: Action - Low Budget
Date of Value: March 31,2008
Data from Box Office Mojo | Calculated by SP&H | |||||||||||||||||||||||||||||||||||||||
Title | Genre | Studio | Date Released | DemesticRevenues | InternationalRevenues | WorldwideRevenues | Theaters | Budget | Demestic as % of WorldwideRevenues | International as % of WorldwideRevenues | Demestic Revenues /Budget | International Revenues /Budget | Worldwide Revenues /Budget | |||||||||||||||||||||||||||
| Teenage Mutant Ninja Turtles | Action/Adventure | NL | 3/30/1990 | 135,265,915 | 66,700,000 | 201,965,915 | 2,377 | 13,500,000 | 66.97 | % | 33.03 | % | n/a | 4.94 | 14.96 | |||||||||||||||||||||||||
| Steel | Action/Adventure | WB | 8/15/1997 | 1,710,972 | - | - | 1,260 | 16,000,000 | - | - | 0.11 | - | - | |||||||||||||||||||||||||||
| Superman IV: The Quest for Peace | Action/Adventure | WB | 7/24/1987 | 15,681,020 | - | - | 1,511 | 17,000,000 | - | - | 0.92 | - | - | |||||||||||||||||||||||||||
| Teenage Mutant Ninja Turtles III | Action/Adventure | NL | 3/19/1993 | 42,273,609 | - | - | 2,087 | 21,000,000 | - | - | 2.01 | - | - | |||||||||||||||||||||||||||
| Sheena | Action/Adventure | Col. | 8/17/1984 | 5,778,353 | - | - | 1,496 | 25,000,000 | - | - | 0.23 | - | - | |||||||||||||||||||||||||||
| Teenage Mutant Ninja Turtles II | Action/Adventure | NL | 3/22/1991 | 78,656,813 | - | - | 2,868 | 25,000,000 | - | - | 3.15 | - | - | |||||||||||||||||||||||||||
| Timecop | Action | Uni. | 9/16/1994 | 44,853,581 | 56,793,000 | 101,646,581 | 2,274 | 28,000,000 | 44.13 | % | 55.87 | % | 1.60 | 2.03 | 3.63 | |||||||||||||||||||||||||
| The Punisher | Action/Crime | Lions | 4/16/2004 | 33,810,189 | 20,889,916 | 54,700,105 | 2,649 | 33,000,000 | 61.81 | % | 38.19 | % | 1.02 | 0.63 | 1.66 | |||||||||||||||||||||||||
| TMNT | Action/Adventure | WB | 3/23/2007 | 54,149,098 | 40,853,078 | 95,002,176 | 3,120 | 34,000,000 | 57.00 | % | 43.00 | % | 1.59 | 1.20 | 2.79 | |||||||||||||||||||||||||
| Flash Gordon | Action/Adventure | Uni. | 12/5/1980 | 27,107,960 | - | - | - | 35,000,000 | - | - | 0.77 | - | - | |||||||||||||||||||||||||||
| Batman | Action/Adventure | WB | 6/23/1989 | 251,188,924 | 160,160,000 | 411,348,924 | 2,201 | 35,000,000 | 61.06 | % | 38.94 | % | 7.18 | 4.58 | 11.75 | |||||||||||||||||||||||||
| Supergirl | Action/Adventure | TriS | 11/21/1984 | 14,296,438 | - | - | 1,620 | 35,000,000 | - | - | 0.41 | - | - | |||||||||||||||||||||||||||
| Superman III | Action/Adventure | WB | 6/17/1983 | 59,950,623 | - | - | 1,763 | 39,000,000 | - | - | 1.54 | - | - | |||||||||||||||||||||||||||
| Sin City | Crime Horror | Dim. | 4/1/2005 | 74,103,820 | 84,650,000 | 158,753,820 | 3,230 | 40,000,000 | 46.68 | % | 53.32 | % | 1.85 | 2.12 | 3.97 | |||||||||||||||||||||||||
| The Rocketeer | Action | BV | 6/21/1991 | 46,704,056 | - | - | 1,903 | 40,000,000 | - | - | 1.17 | - | - | |||||||||||||||||||||||||||
| The Shadow | Action | Uni. | 7/1/1994 | 32,063,435 | 16,000,000 | 48,063,435 | 1,769 | 40,000,000 | 66.71 | % | 33.29 | % | 0.80 | 0.40 | 1.20 | |||||||||||||||||||||||||
| Elektra | Action/Adventure | Fox | 1/14/2005 | 24,409,722 | 32,271,844 | 56,681,566 | 3,204 | 43,000,000 | 43.06 | % | 56.94 | % | 0.57 | 0.75 | 1.32 | |||||||||||||||||||||||||
| The Phantom | Action | Par. | 6/7/1996 | 17,323,326 | - | - | 2,163 | 45,000,000 | - | - | 0.38 | - | - | |||||||||||||||||||||||||||
| Dick Tracy | Action | BV | 6/15/1990 | 103,738,726 | 59,000,000 | 162,738,726 | 2,332 | 47,000,000 | 63.75 | % | 36.25 | % | 2.21 | 1.26 | 3.46 | |||||||||||||||||||||||||
Summary Statistics | |||||||||||||||||||||||||||||||
Demestic Revenues | International Revenues | Worldwide Revenues | Theaters | Budget | Demestic as % of Worldwide Revenues | International as % of Worldwide Revenues | Demestic Revenues / Budget | International Revenues / Budget | Worldwide Revenues / Budget | ||||||||||||||||||||||
Count | 19 | 9 | 9 | 18 | 19 | 9 | 9 | 18 | 9 | 9 | |||||||||||||||||||||
Min | 1,710,972 | 16,000,000 | 48,063,435 | 1,260 | 13,500,000 | 0.43 | 0.33 | 0.11 | 0.40 | 1.20 | |||||||||||||||||||||
LQ | 20,866,524 | 32,271,844 | 56,681,566 | 1,765 | 25,000,000 | 0.47 | 0.36 | 0.62 | 0.75 | 1.66 | |||||||||||||||||||||
Median | 42,273,609 | 56,793,000 | 101,646,581 | 2,182 | 35,000,000 | 0.61 | 0.39 | 1.10 | 1.26 | 3.46 | |||||||||||||||||||||
Mean | 55,950,873 | 59,701,982 | 143,433,472 | 2,213 | 32,184,211 | 0.57 | 0.43 | 1.53 | 1.99 | 4.97 | |||||||||||||||||||||
UQ | 67,027,222 | 66,700,000 | 162,738,726 | 2,581 | 40,000,000 | 0.64 | 0.53 | 1.79 | 2.12 | 3.97 | |||||||||||||||||||||
Max | 251,188,924 | 160,160,000 | 411,348,924 | 3,230 | 47,000,000 | 0.67 | 0.57 | 7.18 | 4.94 | 14.96 | |||||||||||||||||||||
Std Dev | 58,284,824 | 43,726,533 | 114,235,953 | 608 | 10,125,889 | 0.10 | 0.10 | 1.62 | 1.68 | 4.93 | |||||||||||||||||||||
Mean + 2*Std Dev | 172,520,520 | 147,155,048 | 371,905,379 | 3,429 | 52,435,988 | 0.76 | 0.63 | 4.76 | 5.34 | 14.82 | |||||||||||||||||||||
Mean - 2*Std Dev | (60,618,775 | ) | (27,751,084 | ) | (85,038,435 | ) | 997 | 11,932,433 | 0.37 | 0.24 | (1.70 | ) | (1.36 | ) | (4.88 | ) | |||||||||||||||
CV | 1.04 | 0.73 | 0.80 | 0.27 | 0.31 | 0.17 | 0.22 | 1.06 | 0.84 | 0.99 | |||||||||||||||||||||
SANLI PASTORE & HILL, INC.
129
Appendix A - 6
Platinum Studios, Inc.
Comic Book Adaptation Movies: Comedy - Low Budget
Date of Value: March 31,2008
Data from Box Office Mojo | Calculated by SP&H | |||||||||||||||||||||||||||||||||||||||
Title | Genre | Studio | Date Released | DemesticRevenues | InternationalRevenues | WorldwideRevenues | Theaters | Budget | Demestic as % of WorldwideRevenues | International as % of WorldwideRevenues | Demestic Revenues /Budget | International Revenues /Budget | Worldwide Revenues /Budget | |||||||||||||||||||||||||||
| Ghost World | Comedy | MGM | 7/20/2001 | 6,217,849 | 2,546,158 | 8,764,007 | 128 | 7,000,000 | 70.95 | % | 29.05 | % | 0.89 | 0.36 | 1.25 | |||||||||||||||||||||||||
| American Splendor | Comedy | FL | 8/15/2003 | 6,010,990 | 1,975,094 | 7,986,084 | 272 | 2,000,000 | 75.27 | % | 24.73 | % | 3.01 | 0.99 | 3.99 | |||||||||||||||||||||||||
| The Mask | Comedy | NL | 7/29/1994 | 119,938,730 | 231,644,677 | 351,583,407 | 2,516 | 23,000,000 | 34.11 | % | 65.89 | % | 5.21 | n/a | 15.29 | |||||||||||||||||||||||||
| Tank Girl | Comedy | MGM | 3/31/1995 | 4,064,495 | - | - | 1,363 | 25,000,000 | - | - | 0.16 | - | - | |||||||||||||||||||||||||||
| Howard the Duck | Comedy | Uni. | 8/1/1986 | 16,295,774 | 21,667,000 | 37,962,774 | 1,563 | 37,000,000 | 42.93 | % | 57.07 | % | 0.44 | 0.59 | 1.03 | |||||||||||||||||||||||||
| Josie and the Pussycats | Comedy | Uni. | 4/11/2001 | 14,271,015 | 595,000 | 14,866,015 | 2,558 | 39,000,000 | 96.00 | % | 4.00 | % | 0.37 | 0.02 | 0.38 | |||||||||||||||||||||||||
Summary Statistics | |||||||||||||||||||||||||||||||
Demestic Revenues | International Revenues | Worldwide Revenues | Theaters | Budget | Demestic as % of Worldwide Revenues | International as % of Worldwide Revenues | Demestic Revenues / Budget | International Revenues / Budget | Worldwide Revenues / Budget | ||||||||||||||||||||||
Count | 6 | 5 | 5 | 6 | 6 | 5 | 5 | 6 | 4 | 5 | |||||||||||||||||||||
Min | 4,064,495 | 595,000 | 7,986,084 | 128 | 2,000,000 | 0.34 | 0.04 | 0.16 | 0.02 | 0.38 | |||||||||||||||||||||
LQ | 6,062,705 | 1,975,094 | 8,764,007 | 545 | 11,000,000 | 0.43 | 0.25 | 0.38 | 0.28 | 1.03 | |||||||||||||||||||||
Median | 10,244,432 | 2,546,158 | 14,866,015 | 1,463 | 24,000,000 | 0.71 | 0.29 | 0.66 | 0.47 | 1.25 | |||||||||||||||||||||
Mean | 27,799,809 | 51,685,586 | 84,232,457 | 1,400 | 22,166,667 | 0.64 | 0.36 | 1.68 | 0.49 | 4.39 | |||||||||||||||||||||
UQ | 15,789,584 | 21,667,000 | 37,962,774 | 2,278 | 34,000,000 | 0.75 | 0.57 | 2.48 | 0.69 | 3.99 | |||||||||||||||||||||
Max | 119,938,730 | 231,644,677 | 351,583,407 | 2,558 | 39,000,000 | 0.96 | 0.66 | 5.21 | 0.99 | 15.29 | |||||||||||||||||||||
Std Dev | 45,406,719 | 100,973,331 | 149,948,419 | 1,049 | 15,158,056 | 0.25 | 0.25 | 2.02 | 0.41 | 6.25 | |||||||||||||||||||||
Mean + 2*Std Dev | 118,613,247 | 253,632,248 | 384,129,296 | 3,499 | 52,482,779 | 1.14 | 0.87 | 5.72 | 1.30 | 16.88 | |||||||||||||||||||||
Mean - 2*Std Dev | (63,013,629 | ) | (150,261,076 | ) | (215,664,381 | ) | (699 | ) | (8,149,446 | ) | 0.13 | (0.14 | ) | (2.36 | ) | (0.33 | ) | (8.11 | ) | ||||||||||||
CV | 1.63 | 1.95 | 1.78 | 0.75 | 0.68 | 0.39 | 0.70 | 1.20 | 0.83 | 1.42 | |||||||||||||||||||||
SANLI PASTORE & HILL, INC.
130
Appendix A - 7
Platinum Studios, Inc.
Comic Book Adaptation Movies: Thriller - Low Budget
Date of Value: March 31,2008
Data from Box Office Mojo | Calculated by SP&H | |||||||||||||||||||||||||||||||||||||||
Title | Genre | Studio | Date Released | DemesticRevenues | InternationalRevenues | WorldwideRevenues | Theaters | Budget | Demestic as % of WorldwideRevenues | International as % of WorldwideRevenues | Demestic Revenues /Budget | International Revenues /Budget | Worldwide Revenues /Budget | |||||||||||||||||||||||||||
| The Crow: City of Angels | Action Horror | Mira. | 8/30/1996 | 17,917,287 | - | - | 2,423 | 13,000,000 | - | - | 1.38 | - | - | |||||||||||||||||||||||||||
| The Crow | Action Horror | Mira. | 5/13/1994 | 50,693,129 | - | - | 2,119 | 15,000,000 | - | - | 3.38 | - | - | |||||||||||||||||||||||||||
| A History of Violence | Crime Drama/Thriller | NL | 9/23/2005 | 31,504,633 | 28,829,431 | 60,334,064 | 1,348 | 32,000,000 | 52.22 | % | 47.78 | % | 0.98 | 0.90 | 1.89 | |||||||||||||||||||||||||
| Spawn | Action Horror | NL | 8/1/1997 | 54,870,175 | 32,969,867 | 87,840,042 | 2,604 | 40,000,000 | 62.47 | % | 37.53 | % | 1.37 | 0.82 | 2.20 | |||||||||||||||||||||||||
| Blade | Action Horror | NL | 8/21/1998 | 70,087,718 | 61,095,812 | 131,183,530 | 2,389 | 45,000,000 | 53.43 | % | 46.57 | % | 1.56 | 1.36 | 2.92 | |||||||||||||||||||||||||
Summary Statistics | |||||||||||||||||||||||||||||||
Demestic Revenues | International Revenues | Worldwide Revenues | Theaters | Budget | Demestic as % of Worldwide Revenues | International as % of Worldwide Revenues | Demestic Revenues / Budget | International Revenues / Budget | Worldwide Revenues / Budget | ||||||||||||||||||||||
Count | 5 | 3 | �� | 3 | 5 | 5 | 3 | 3 | 5 | 3 | 3 | ||||||||||||||||||||
Min | 17,917,287 | 28,829,431 | 60,334,064 | 1,348 | 13,000,000 | 0.52 | 0.38 | 0.98 | 0.82 | 1.89 | |||||||||||||||||||||
LQ | 31,504,633 | 30,899,649 | 74,087,053 | 2,119 | 15,000,000 | 0.53 | 0.42 | 1.37 | 0.86 | 2.04 | |||||||||||||||||||||
Median | 50,693,129 | 32,969,867 | 87,840,042 | 2,389 | 32,000,000 | 0.53 | 0.47 | 1.38 | 0.90 | 2.20 | |||||||||||||||||||||
Mean | 45,014,588 | 40,965,037 | 93,119,212 | 2,177 | 29,000,000 | 0.56 | 0.44 | 1.73 | 1.03 | 2.33 | |||||||||||||||||||||
UQ | 54,870,175 | 47,032,840 | 109,511,786 | 2,423 | 40,000,000 | 0.58 | 0.47 | 1.56 | 1.13 | 2.56 | |||||||||||||||||||||
Max | 70,087,718 | 61,095,812 | 131,183,530 | 2,604 | 45,000,000 | 0.62 | 0.48 | 3.38 | 1.36 | 2.92 | |||||||||||||||||||||
Std Dev | 20,462,300 | 17,556,249 | 35,718,538 | 495 | 14,474,115 | 0.06 | 0.06 | 0.94 | 0.29 | 0.53 | |||||||||||||||||||||
Mean + 2*Std Dev | 85,939,188 | 76,077,535 | 164,556,287 | 3,166 | 57,948,230 | 0.67 | 0.55 | 3.62 | 1.60 | 3.39 | |||||||||||||||||||||
Mean - 2*Std Dev | 4,089,989 | 5,852,538 | 21,682,137 | 1,187 | 51,770 | 0.45 | 0.33 | (0.15 | ) | 0.45 | 1.28 | ||||||||||||||||||||
CV | 0.45 | 0.43 | 0.38 | 0.23 | 0.50 | 0.10 | 0.13 | 0.54 | 0.28 | 0.23 | |||||||||||||||||||||
SANLI PASTORE & HILL, INC.
131
Appendix A - 8
Platinum Studios, Inc.
Comic Book Adaptation Movies: Horror
Date of Value: March 31,2008
Data from Box Office Mojo | Calculated by SP&H | |||||||||||||||||||||||||||||||||||||||
Title | Genre | Studio | Date Released | DemesticRevenues | InternationalRevenues | WorldwideRevenues | Theaters | Budget | Demestic as % of WorldwideRevenues | International as % of WorldwideRevenues | Demestic Revenues /Budget | International Revenues /Budget | Worldwide Revenues /Budget | |||||||||||||||||||||||||||
| 30 Days of Night | Horror | Sony | 10/19/2007 | 39,568,996 | 25,513,520 | 65,082,516 | 2,859 | 30,000,000 | 60.80 | % | 39.20 | % | 1.32 | 0.85 | 2.17 | |||||||||||||||||||||||||
| From Hell | Horror | Fox | 10/19/2001 | 31,602,566 | 42,955,549 | 74,558,115 | 2,334 | 35,000,000 | 42.39 | % | 57.61 | % | 0.90 | 1.23 | 2.13 | |||||||||||||||||||||||||
| Virus | Horror | Uni. | 1/15/1999 | 14,036,005 | 16,616,000 | 30,652,005 | 2,018 | 75,000,000 | 45.79 | % | 54.21 | % | 0.19 | 0.22 | 0.41 | |||||||||||||||||||||||||
| Constantine | Horror | WB | 2/18/2005 | 75,976,178 | 154,908,550 | 230,884,728 | 3,006 | 100,000,000 | 32.91 | % | 67.09 | % | 0.76 | 1.55 | 2.31 | |||||||||||||||||||||||||
Summary Statistics | |||||||||||||||||||||||||||||||
Demestic Revenues | International Revenues | Worldwide Revenues | Theaters | Budget | Demestic as % of Worldwide Revenues | International as % of Worldwide Revenues | Demestic Revenues / Budget | International Revenues / Budget | Worldwide Revenues / Budget | ||||||||||||||||||||||
Count | 4 | 4 | 4 | 4 | 4 | 4 | 4 | 4 | 4 | 4 | |||||||||||||||||||||
Min | 14,036,005 | 16,616,000 | 30,652,005 | 2,018 | 30,000,000 | 0.33 | 0.39 | 0.19 | 0.22 | 0.41 | |||||||||||||||||||||
LQ | 27,210,926 | 23,289,140 | 56,474,888 | 2,255 | 33,750,000 | 0.40 | 0.50 | 0.62 | 0.69 | 1.70 | |||||||||||||||||||||
Median | 35,585,781 | 34,234,535 | 69,820,316 | 2,597 | 55,000,000 | 0.44 | 0.56 | 0.83 | 1.04 | 2.15 | |||||||||||||||||||||
Mean | 40,295,936 | 59,998,405 | 100,294,341 | 2,554 | 60,000,000 | 0.45 | 0.55 | 0.79 | 0.96 | 1.75 | |||||||||||||||||||||
UQ | 48,670,792 | 70,943,799 | 113,639,768 | 2,896 | 81,250,000 | 0.50 | 0.60 | 1.01 | 1.31 | 2.20 | |||||||||||||||||||||
Max | 75,976,178 | 154,908,550 | 230,884,728 | 3,006 | 100,000,000 | 0.61 | 0.67 | 1.32 | 1.55 | 2.31 | |||||||||||||||||||||
Std Dev | 26,068,926 | 64,212,239 | 89,080,731 | 459 | 33,416,563 | 0.12 | 0.12 | 0.47 | 0.57 | 0.90 | |||||||||||||||||||||
Mean + 2*Std Dev | 92,433,789 | 188,422,883 | 278,455,804 | 3,473 | 126,833,126 | 0.69 | 0.78 | 1.73 | 2.10 | 3.55 | |||||||||||||||||||||
Mean - 2*Std Dev | (11,841,917 | ) | (68,426,073 | ) | (77,867,122 | ) | 1,636 | (6,833,126 | ) | 0.22 | 0.31 | (0.14 | ) | (0.18 | ) | (0.05 | ) | ||||||||||||||
CV | 0.65 | 1.07 | 0.89 | 0.18 | 0.56 | 0.25 | 0.21 | 0.59 | 0.59 | 0.51 | |||||||||||||||||||||
SANLI PASTORE & HILL, INC.
132
Appendix A - 9
Platinum Studios, Inc.
Comic Book Adaptation Movies: Low Budget All Genres
Date of Value: March 31,2008
Data from Box Office Mojo | Calculated by SP&H | |||||||||||||||||||||||||||||||||||||||
Title | Genre | Studio | Date Released | DemesticRevenues | InternationalRevenues | WorldwideRevenues | Theaters | Budget | Demestic as % of WorldwideRevenues | International as % of WorldwideRevenues | Demestic Revenues /Budget | International Revenues /Budget | Worldwide Revenues /Budget | |||||||||||||||||||||||||||
| Ghost World | Comedy | MGM | 7/20/2001 | 6,217,849 | 2,546,158 | 8,764,007 | 128 | 7,000,000 | 70.95 | % | 29.05 | % | 0.89 | 0.36 | 1.25 | |||||||||||||||||||||||||
| American Splendor | Comedy | FL | 8/15/2003 | 6,010,990 | 1,975,094 | 7,986,084 | 272 | 2,000,000 | 75.27 | % | 24.73 | % | 3.01 | 0.99 | 3.99 | |||||||||||||||||||||||||
| Batman: Mask of the Phantasm | Animation | WB | 12/25/1993 | 5,617,391 | - | - | 1,506 | 6,000,000 | - | - | 0.94 | - | - | |||||||||||||||||||||||||||
| The Crow: City of Angels | Action Horror | Mira. | 8/30/1996 | 17,917,287 | - | - | 2,423 | 13,000,000 | - | - | 1.38 | - | - | |||||||||||||||||||||||||||
| Teenage Mutant Ninja Turtles | Action/Adventure | NL | 3/30/1990 | 135,265,915 | 66,700,000 | 201,965,915 | 2,377 | 13,500,000 | 66.97 | % | 33.03 | % | n/a | n/a | 14.96 | |||||||||||||||||||||||||
| The Crow | Action Horror | Mira. | 5/13/1994 | 50,693,129 | - | - | 2,119 | 15,000,000 | - | - | 3.38 | - | - | |||||||||||||||||||||||||||
| Steel | Action/Adventure | WB | 8/15/1997 | 1,710,972 | - | - | 1,260 | 16,000,000 | - | - | 0.11 | - | - | |||||||||||||||||||||||||||
| Superman IV: The Quest for Peace | Action/Adventure | WB | 7/24/1987 | 15,681,020 | - | - | 1,511 | 17,000,000 | - | - | 0.92 | - | - | |||||||||||||||||||||||||||
| Popeye | Musical | Par. | 12/12/1980 | 49,823,037 | - | - | 901 | 20,000,000 | - | - | 2.49 | - | - | |||||||||||||||||||||||||||
| Teenage Mutant Ninja Turtles III | Action/Adventure | NL | 3/19/1993 | 42,273,609 | - | - | 2,087 | 21,000,000 | - | - | 2.01 | - | - | |||||||||||||||||||||||||||
| The Mask | Comedy | NL | 7/29/1994 | 119,938,730 | 231,644,677 | 351,583,407 | 2,516 | 23,000,000 | 34.11 | % | 65.89 | % | 5.21 | n/a | 15.29 | |||||||||||||||||||||||||
| Teenage Mutant Ninja Turtles II | Action/Adventure | NL | 3/22/1991 | 78,656,813 | - | - | 2,868 | 25,000,000 | - | - | 3.15 | - | - | |||||||||||||||||||||||||||
| Sheena | Action/Adventure | Col. | 8/17/1984 | 5,778,353 | - | - | 1,496 | 25,000,000 | - | - | 0.23 | - | - | |||||||||||||||||||||||||||
| Tank Girl | Comedy | MGM | 3/31/1995 | 4,064,495 | - | - | 1,363 | 25,000,000 | - | - | 0.16 | - | - | |||||||||||||||||||||||||||
| Timecop | Action | Uni. | 9/16/1994 | 44,853,581 | 56,793,000 | 101,646,581 | 2,274 | 28,000,000 | 44.13 | % | 55.87 | % | 1.60 | n/a | 3.63 | |||||||||||||||||||||||||
| 30 Days of Night | Horror | Sony | 10/19/2007 | 39,568,996 | 25,513,520 | 65,082,516 | 2,859 | 30,000,000 | 60.80 | % | 39.20 | % | 1.32 | 0.85 | 2.17 | |||||||||||||||||||||||||
| A History of Violence | Crime Drama/Thriller | NL | 9/23/2005 | 31,504,633 | 28,829,431 | 60,334,064 | 1,348 | 32,000,000 | 52.22 | % | 47.78 | % | 0.98 | 0.90 | 1.89 | |||||||||||||||||||||||||
| The Punisher | Action/Crime | Lions | 4/16/2004 | 33,810,189 | 20,889,916 | 54,700,105 | 2,649 | 33,000,000 | 61.81 | % | 38.19 | % | 1.02 | 0.63 | 1.66 | |||||||||||||||||||||||||
| TMNT | Action/Adventure | WB | 3/23/2007 | 54,149,098 | 40,853,078 | 95,002,176 | 3,120 | 34,000,000 | 57.00 | % | 43.00 | % | 1.59 | 1.20 | 2.79 | |||||||||||||||||||||||||
Summary Statistics | |||||||||||||||||||||||||||||||
Demestic Revenues | International Revenues | Worldwide Revenues | Theaters | Budget | Demestic as % of Worldwide Revenues | International as % of Worldwide Revenues | Demestic Revenues / Budget | International Revenues / Budget | Worldwide Revenues / Budget | ||||||||||||||||||||||
Count | 19 | 9 | 9 | 19 | 19 | 9 | 9 | 18 | 6 | 9 | |||||||||||||||||||||
Min | 1,710,972 | 1,975,094 | 7,986,084 | 128 | 2,000,000 | 0.34 | 0.25 | 0.11 | 0.36 | 1.25 | |||||||||||||||||||||
LQ | 6,114,420 | 20,889,916 | 54,700,105 | 1,356 | 14,250,000 | 0.52 | 0.33 | 0.93 | 0.69 | 1.89 | |||||||||||||||||||||
Median | 33,810,189 | 28,829,431 | 65,082,516 | 2,087 | 21,000,000 | 0.61 | 0.39 | 1.35 | 0.88 | 2.79 | |||||||||||||||||||||
Mean | 39,133,478 | 52,860,542 | 105,229,428 | 1,846 | 20,289,474 | 0.58 | 0.42 | 1.69 | 0.82 | 5.29 | |||||||||||||||||||||
UQ | 50,258,083 | 56,793,000 | 101,646,581 | 2,470 | 26,500,000 | 0.67 | 0.48 | 2.37 | 0.97 | 3.99 | |||||||||||||||||||||
Max | 135,265,915 | 231,644,677 | 351,583,407 | 3,120 | 34,000,000 | 0.75 | 0.66 | 5.21 | 1.20 | 15.29 | |||||||||||||||||||||
Std Dev | 37,993,090 | 70,518,864 | 109,034,450 | 857 | 9,388,699 | 0.13 | 0.13 | 1.32 | 0.29 | 5.65 | |||||||||||||||||||||
Mean + 2*Std Dev | 115,119,658 | 193,898,270 | 323,298,329 | 3,560 | 39,066,871 | 0.84 | 0.68 | 4.34 | 1.41 | 16.58 | |||||||||||||||||||||
Mean - 2*Std Dev | (36,852,702 | ) | (88,177,187 | ) | (112,839,472 | ) | 132 | 1,512,077 | 0.32 | 0.16 | (0.96 | ) | 0.24 | (6.00 | ) | ||||||||||||||||
CV | 0.97 | 1.33 | 1.04 | 0.46 | 0.46 | 0.22 | 0.31 | 0.78 | 0.35 | 1.07 | |||||||||||||||||||||
SANLI PASTORE & HILL, INC.
133
Appendix B
Platinum Studios, Inc.
Horror Movies
Date of Value: March 31,2008
Data from Box Office Mojo | Calculated by SP&H | |||||||||||||||||||||||||||||||||||||||
Type | Title | Studio | DateReleased | DemesticRevenues | InternationalRevenues | WorldwideRevenues | Theaters | Budget | Demestic as % of WorldwideRevenues | International as % of WorldwideRevenues | Demestic Revenues /Budget | International Revenues /Budget | Worldwide Revenues /Budget | |||||||||||||||||||||||||||
| Horror - Comedy | Black Sheep (2007) | IFC | 6/22/2007 | $ | 84,283 | 4,377,321 | 4,461,604 | 8 | n/a | 1.89 | % | 98.11 | % | - | - | - | ||||||||||||||||||||||||
| Horror - Terror in the water | Open Water | Lions | 8/6/2004 | $ | 30,610,863 | 24,057,091 | 54,667,954 | 2,709 | 500,000 | 55.99 | % | 44.01 | % | 61.22 | 48.11 | 109.34 | ||||||||||||||||||||||||
| SCI-FI Horror | Re-Animator | EP | 10/18/1985 | $ | 2,023,414 | - | - | 185 | 900,000 | - | - | 2.25 | - | - | ||||||||||||||||||||||||||
| Horror - Comedy | Re-Animator | EP | 10/18/1985 | $ | 2,023,414 | - | - | 185 | 900,000 | - | - | - | - | - | ||||||||||||||||||||||||||
| Horror - Torture | Saw | Lions | 10/29/2004 | $ | 55,185,045 | 47,911,300 | 103,096,345 | 2,467 | 1,200,000 | 53.53 | % | 46.47 | % | 45.99 | 39.93 | 85.91 | ||||||||||||||||||||||||
| Horror - Comedy | Parents | Vest | 1/27/1989 | $ | 870,532 | - | - | 94 | 3,000,000 | - | - | - | - | - | ||||||||||||||||||||||||||
| Horror - Torture | Saw II | Lions | 10/28/2005 | $ | 87,039,965 | 60,700,000 | 147,739,965 | 2,949 | 4,000,000 | 58.91 | % | 41.09 | % | 21.76 | 15.18 | 36.93 | ||||||||||||||||||||||||
| Horror - Torture | Hostel | Lions | 1/6/2006 | $ | 47,326,473 | 33,252,461 | 80,578,934 | 2,337 | 4,800,000 | 58.73 | % | 41.27 | % | - | - | - | ||||||||||||||||||||||||
| Horror - Anthology | Snoop Dogg's Hood of Horror | Xen. | 5/4/2007 | $ | 25,900 | - | - | 117 | 5,000,000 | - | - | 0.01 | - | - | ||||||||||||||||||||||||||
| Horror - Terror in the water | Jaws | Uni. | 6/20/1975 | $ | 260,000,000 | 210,653,000 | 470,653,000 | 675 | 7,000,000 | 55.24 | % | 44.76 | % | 37.14 | 30.09 | 67.24 | ||||||||||||||||||||||||
| Horror - Torture | House of 1,000 Corpses | Lions | 4/11/2003 | $ | 12,634,962 | 4,194,583 | 16,829,545 | 847 | 7,000,000 | 75.08 | % | 24.92 | % | 1.80 | 0.60 | 2.40 | ||||||||||||||||||||||||
| Horror - Torture | The Devil's Rejects | Lions | 7/22/2005 | $ | 17,044,981 | 2,345,048 | 19,390,029 | 1,757 | 7,000,000 | 87.91 | % | 12.09 | % | 2.43 | 0.34 | 2.77 | ||||||||||||||||||||||||
| Horror - Torture | The Texas Chainsaw Massacre | NL | 10/17/2003 | $ | 80,571,655 | 26,500,000 | 107,071,655 | 3,018 | 9,500,000 | 75.25 | % | 24.75 | % | - | - | - | ||||||||||||||||||||||||
| Horror - Torture | Saw III | LGF | 10/27/2006 | $ | 80,238,724 | 84,635,551 | 164,874,275 | 3,167 | 10,000,000 | 48.67 | % | 51.33 | % | 8.02 | 8.46 | 16.49 | ||||||||||||||||||||||||
| Horror - Torture | Turistas | FoxA | 12/1/2006 | $ | 7,027,762 | 7,293,308 | 14,321,070 | 1,572 | 10,000,000 | 49.07 | % | 50.93 | % | 0.70 | 0.73 | 1.43 | ||||||||||||||||||||||||
| Horror - Remake | The Grudge | Sony | 10/22/2004 | $ | 110,359,362 | 76,921,753 | 187,281,115 | 3,348 | 10,000,000 | 58.93 | % | 41.07 | % | 11.04 | 7.69 | 18.73 | ||||||||||||||||||||||||
| Horror - Torture | Hostel Part II | LGF | 6/8/2007 | $ | 17,609,452 | 18,010,069 | 35,619,521 | 2,350 | 10,200,000 | 49.44 | % | 50.56 | % | 1.73 | 1.77 | 3.49 | ||||||||||||||||||||||||
| SCI-FI Horror | Alien | Fox | 5/25/1979 | $ | 80,931,801 | 24,000,000 | 104,931,801 | 757 | 11,000,000 | 77.13 | % | 22.87 | % | 7.36 | 2.18 | 9.54 | ||||||||||||||||||||||||
| SCI-FI Horror | Jason X | NL | 4/26/2002 | $ | 13,121,555 | 3,830,243 | 16,951,798 | 1,879 | 11,000,000 | - | - | - | - | - | ||||||||||||||||||||||||||
| Horror - Comedy | Seed of Chucky | Rog. | 11/12/2004 | $ | 17,083,732 | 7,745,912 | 24,829,644 | 2,062 | 12,000,000 | 68.80 | % | 31.20 | % | 1.42 | 0.65 | 2.07 | ||||||||||||||||||||||||
| Horror - Period | Ravenous | Fox | 3/19/1999 | $ | 2,062,405 | - | - | 1,040 | 12,000,000 | - | - | 0.17 | - | - | ||||||||||||||||||||||||||
| Horror - Period | An American Haunting | Free | 5/5/2006 | $ | 16,298,046 | 11,174,455 | 27,472,501 | 1,703 | 14,000,000 | - | - | 1.16 | 0.80 | - | ||||||||||||||||||||||||||
| Horror - Remake | The Hills Have Eyes 2 | FoxA | 3/23/2007 | $ | 20,804,166 | 16,651,361 | 37,455,527 | 2,465 | 15,000,000 | 55.54 | % | 44.46 | % | 1.39 | 1.11 | 2.50 | ||||||||||||||||||||||||
| Horror - Torture | The Hills Have Eyes | FoxS | 3/10/2006 | $ | 41,778,863 | 27,791,169 | 69,570,032 | 2,621 | 15,000,000 | 60.05 | % | 39.95 | % | - | - | - | ||||||||||||||||||||||||
| Horror - Comedy | Slither | Uni. | 3/31/2006 | $ | 7,802,450 | 4,453,340 | 12,255,790 | 1,946 | 15,000,000 | 63.66 | % | 36.34 | % | 0.52 | 0.30 | 0.82 | ||||||||||||||||||||||||
| Horror - Remake | When a Stranger Calls | SGem | 2/3/2006 | $ | 47,860,214 | 19,106,773 | 66,966,987 | 3,004 | 15,000,000 | 71.47 | % | 28.53 | % | 3.19 | 1.27 | 4.46 | ||||||||||||||||||||||||
| Horror - Torture | The Texas Chainsaw Massacre: The Beginning | NL | 10/6/2006 | $ | 39,517,763 | 12,168,200 | 51,685,963 | 2,820 | 16,000,000 | 76.46 | % | 23.54 | % | - | - | - | ||||||||||||||||||||||||
| Horror - Period | The Others | Mira. | 8/10/2001 | $ | 96,522,687 | 113,424,350 | 209,947,037 | 2,843 | 17,000,000 | 45.97 | % | 54.03 | % | 5.68 | 6.67 | 12.35 | ||||||||||||||||||||||||
| Horror - Remake | The Fog | SonR | 10/14/2005 | $ | 29,550,869 | 16,650,563 | 46,201,432 | 2,972 | 18,000,000 | 63.96 | % | 36.04 | % | 1.64 | 0.93 | 2.57 | ||||||||||||||||||||||||
| Horror - Torture | Vacancy | SGem | 4/20/2007 | $ | 19,363,565 | 15,925,771 | 35,289,336 | 2,551 | 19,000,000 | 54.87 | % | 45.13 | % | - | - | - | ||||||||||||||||||||||||
| Horror - Comedy | Scary Movie | Mira. | 7/7/2000 | $ | 157,019,771 | 121,000,000 | 278,019,771 | 3,301 | 19,000,000 | 56.48 | % | 43.52 | % | 8.26 | 6.37 | 14.63 | ||||||||||||||||||||||||
| Horror - Remake | The Amityville Horror (2005) | MGM | 4/15/2005 | $ | 65,233,369 | 42,813,762 | 108,047,131 | 3,323 | 19,000,000 | 60.37 | % | 39.63 | % | 3.43 | 2.25 | 5.69 | ||||||||||||||||||||||||
| Horror - Terror in the water | Anacondas: The Hunt for the Blood Orchid | SGem | 8/27/2004 | $ | 32,238,923 | 38,753,975 | 70,992,898 | 2,905 | 20,000,000 | 45.41 | % | 54.59 | % | - | - | - | ||||||||||||||||||||||||
| Horror - Remake | The Grudge 2 | Sony | 10/13/2006 | $ | 39,143,839 | 31,567,336 | 70,711,175 | 3,214 | 20,000,000 | �� | 55.36 | % | 44.64 | % | 1.96 | 1.58 | 3.54 | |||||||||||||||||||||||
| Horror - Remake | Willard | NL | 3/14/2003 | $ | 6,886,089 | 1,660,577 | 8,546,666 | 1,762 | 20,000,000 | 80.57 | % | 19.43 | % | 0.34 | 0.08 | 0.43 | ||||||||||||||||||||||||
| Horror - Remake | Pulse | W/Dim. | 8/11/2006 | $ | 20,264,436 | 9,507,049 | 29,771,485 | 2,323 | 20,500,000 | 68.07 | % | 31.93 | % | 0.99 | 0.46 | 1.45 | ||||||||||||||||||||||||
| SCI-FI Horror | Pitch Black | USA | 2/18/2000 | $ | 39,240,659 | 13,947,000 | 53,187,659 | 1,930 | 23,000,000 | 73.78 | % | 26.22 | % | 1.71 | 0.61 | 2.31 | ||||||||||||||||||||||||
| Horror - Remake | The Omen (2006) | Fox | 6/6/2006 | $ | 54,607,383 | 64,891,526 | 119,498,909 | 2,723 | 25,000,000 | 45.70 | % | 54.30 | % | 2.18 | 2.60 | 4.78 | ||||||||||||||||||||||||
| Horror - Comedy | Bride of Chucky | Uni. | 10/16/1998 | $ | 32,383,850 | 18,288,000 | 50,671,850 | 2,467 | 25,000,000 | 63.91 | % | 36.09 | % | 1.30 | 0.73 | 2.03 | ||||||||||||||||||||||||
| Horror - Comedy | An American Werewolf in Paris | BV | 12/25/1997 | $ | 26,570,463 | - | - | 1,731 | 25,000,000 | - | - | 1.06 | - | - | ||||||||||||||||||||||||||
| Horror - Remake | Dawn of the Dead | Uni. | 3/19/2004 | $ | 59,020,957 | 43,335,424 | 102,356,381 | 2,748 | 26,000,000 | 57.66 | % | 42.34 | % | 2.27 | 1.67 | 3.94 | ||||||||||||||||||||||||
| Horror - Comedy | Eight Legged Freaks | WB | 7/17/2002 | $ | 17,322,606 | 28,544,727 | 45,867,333 | 2,530 | 30,000,000 | 37.77 | % | 62.23 | % | 0.58 | 0.95 | 1.53 | ||||||||||||||||||||||||
| Horror - Comedy | Ghostbusters | Col. | 6/8/1984 | $ | 238,632,124 | 53,000,000 | 291,632,124 | 1,506 | 30,000,000 | 81.83 | % | 18.17 | % | 7.95 | 1.77 | 9.72 | ||||||||||||||||||||||||
| SCI-FI Horror | Mimic | Mira. | 8/22/1997 | $ | 25,480,490 | - | - | 2,255 | 30,000,000 | - | - | 0.85 | - | - | ||||||||||||||||||||||||||
| SCI-FI Horror | Resident Evil | SGem | 3/15/2002 | $ | 40,119,709 | 62,321,369 | 102,441,078 | 2,528 | 33,000,000 | 39.16 | % | 60.84 | % | 1.22 | 1.89 | 3.10 | ||||||||||||||||||||||||
| Horror - Comedy | Snakes on a Plane | NL | 8/18/2006 | $ | 34,020,814 | 28,001,200 | 62,022,014 | 3,555 | 33,000,000 | 54.85 | % | 45.15 | % | 1.03 | 0.85 | 1.88 | ||||||||||||||||||||||||
| Horror - Period | From Hell | Fox | 10/19/2001 | $ | 31,602,566 | 42,955,549 | 74,558,115 | 2,334 | 35,000,000 | 42.39 | % | 57.61 | % | 0.90 | 1.23 | 2.13 | ||||||||||||||||||||||||
| Horror - Terror in the water | Lake Placid | Fox | 7/16/1999 | $ | 31,770,414 | 25,100,000 | 56,870,414 | 2,102 | 35,000,000 | 55.86 | % | 44.14 | % | 0.91 | 0.72 | 1.62 | ||||||||||||||||||||||||
| Horror - Remake | House on Haunted Hill | WB | 10/29/1999 | $ | 40,846,082 | n/a | - | 2,710 | 37,000,000 | - | - | 1.10 | - | - | ||||||||||||||||||||||||||
| SCI-FI Horror | Aliens Vs. Predator - Requiem | Fox | 12/25/2007 | $ | 41,315,275 | 70,133,980 | 111,449,255 | 2,617 | 40,000,000 | 37.07 | % | 62.93 | % | 1.03 | 1.75 | 2.79 | ||||||||||||||||||||||||
| Horror - Period | Bram Stoker's Dracula | Col. | 11/13/1992 | $ | 82,522,790 | 133,339,902 | 215,862,692 | 2,491 | 40,000,000 | 38.23 | % | 61.77 | % | 2.06 | 3.33 | 5.40 | ||||||||||||||||||||||||
| Horror - Remake | House of Wax | WB | 5/6/2005 | $ | 32,064,800 | 36,701,321 | 68,766,121 | 3,111 | 40,000,000 | 46.63 | % | 53.37 | % | 0.80 | 0.92 | 1.72 | ||||||||||||||||||||||||
| SCI-FI Horror | The Island of Dr. Moreau | NL | 8/23/1996 | $ | 27,663,982 | 21,963,797 | 49,627,779 | 2,039 | 40,000,000 | 55.74 | % | 44.26 | % | 0.69 | 0.55 | 1.24 | ||||||||||||||||||||||||
| Horror - Remake | The Wicker Man | WB | 9/1/2006 | $ | 23,649,127 | 15,052,837 | 38,701,964 | 2,784 | 40,000,000 | 61.11 | % | 38.89 | % | 0.59 | 0.38 | 0.97 | ||||||||||||||||||||||||
| Horror - Remake | Thirteen Ghosts | WB | 10/26/2001 | $ | 41,867,960 | 26,600,000 | 68,467,960 | 2,781 | 42,000,000 | 61.15 | % | 38.85 | % | 1.00 | 0.63 | 1.63 | ||||||||||||||||||||||||
| Horror - Period | Mary Shelley's Frankenstein | Sony | 11/4/1994 | $ | 22,006,296 | 90,000,000 | 112,006,296 | 2,177 | 45,000,000 | 19.65 | % | 80.35 | % | 0.49 | 2.00 | 2.49 | ||||||||||||||||||||||||
| SCI-FI Horror | Resident Evil: Extinction | SGem | 9/21/2007 | $ | 50,648,679 | 96,748,650 | 147,397,329 | 2,848 | 45,000,000 | 34.36 | % | 65.64 | % | 1.13 | 2.15 | 3.28 | ||||||||||||||||||||||||
| SCI-FI Horror | Resident Evil: Apocalypse | SGem | 9/10/2004 | $ | 51,201,453 | 78,193,382 | 129,394,835 | 3,284 | 45,000,000 | 39.57 | % | 60.43 | % | 1.14 | 1.74 | 2.88 | ||||||||||||||||||||||||
| Horror - Comedy | Scary Movie 2 | Mira. | 7/4/2001 | $ | 71,308,997 | 69,911,681 | 141,220,678 | 3,220 | 45,000,000 | 50.49 | % | 49.51 | % | 1.58 | 1.55 | 3.14 | ||||||||||||||||||||||||
| Horror - Comedy | Scary Movie 4 | W/Dim. | 4/14/2006 | $ | 90,710,620 | 87,552,000 | 178,262,620 | 3,674 | 45,000,000 | 50.89 | % | 49.11 | % | 2.02 | 1.95 | 3.96 | ||||||||||||||||||||||||
| Horror - Comedy | Scary Movie 3 | Dim. | 10/24/2003 | $ | 110,003,217 | 110,670,000 | 220,673,217 | 3,505 | 48,000,000 | 49.85 | % | 50.15 | % | 2.29 | 2.31 | 4.60 | ||||||||||||||||||||||||
| Horror - Remake | The Ring | DW | 10/18/2002 | $ | 129,128,133 | 120,220,800 | 249,348,933 | 2,927 | 48,000,000 | 51.79 | % | 48.21 | % | 2.69 | 2.50 | 5.19 | ||||||||||||||||||||||||
| Horror - Remake | The Ring Two | DW | 3/18/2005 | $ | 76,231,249 | 85,220,289 | 161,451,538 | 3,341 | 50,000,000 | 47.22 | % | 52.78 | % | 1.52 | 1.70 | 3.23 | ||||||||||||||||||||||||
| SCI-FI Horror | Alien 3 | Fox | 5/22/1992 | $ | 55,473,545 | 104,300,000 | 159,773,545 | 2,227 | 50,000,000 | - | - | 1.11 | 2.09 | 3.20 | ||||||||||||||||||||||||||
| Horror - Period | The Village | BV | 7/30/2004 | $ | 114,197,520 | 142,500,000 | 256,697,520 | 3,733 | 60,000,000 | 44.49 | % | 55.51 | % | 1.90 | 2.38 | 4.28 | ||||||||||||||||||||||||
| Horror - Terror in the water | Deep Blue Sea | WB | 7/30/1999 | $ | 73,648,142 | 91,000,000 | 164,648,142 | 2,901 | 60,000,000 | 44.73 | % | 55.27 | % | 1.23 | 1.52 | 2.74 | ||||||||||||||||||||||||
| SCI-FI Horror | Alien Vs. Predator | Fox | 8/13/2004 | $ | 80,282,231 | 90,969,765 | 171,251,996 | 3,401 | 60,000,000 | 46.88 | % | 53.12 | % | 1.34 | 1.52 | 2.85 | ||||||||||||||||||||||||
| Horror - Period | Interview with the Vampire | WB | 11/11/1994 | $ | 105,264,608 | 118,400,000 | 223,664,608 | 2,604 | 60,000,000 | 47.06 | % | 52.94 | % | 1.75 | 1.97 | 3.73 | ||||||||||||||||||||||||
| SCI-FI Horror | Doom | Uni. | 10/21/2005 | $ | 28,212,337 | 27,774,984 | 55,987,321 | 3,044 | 60,000,000 | 50.39 | % | 49.61 | % | 0.47 | 0.46 | 0.93 | ||||||||||||||||||||||||
| Horror - Remake | Psycho (1998) | Uni. | 12/4/1998 | $ | 21,456,130 | 15,685,000 | 37,141,130 | 2,489 | 60,000,000 | 57.77 | % | 42.23 | % | 0.36 | 0.26 | 0.62 | ||||||||||||||||||||||||
| Horror - Anthology | Grindhouse | W/Dim. | 4/6/2007 | $ | 25,037,897 | 20,315 | 25,058,212 | 2,629 | 67,000,000 | 99.92 | % | 0.08 | % | 0.37 | 0.00 | 0.37 | ||||||||||||||||||||||||
| SCI-FI Horror | Signs | BV | 8/2/2002 | $ | 227,966,634 | 180,281,283 | 408,247,917 | 3,453 | 72,000,000 | 55.84 | % | 44.16 | % | 3.17 | 2.50 | 5.67 | ||||||||||||||||||||||||
| SCI-FI Horror | Alien Resurrection | Fox | 11/26/1997 | $ | 47,795,658 | 113,500,000 | 161,295,658 | 2,449 | 75,000,000 | 29.63 | % | 70.37 | % | 0.64 | 1.51 | 2.15 | ||||||||||||||||||||||||
| SCI-FI Horror | Virus | Uni. | 1/15/1999 | $ | 14,036,005 | 16,616,000 | 30,652,005 | 2,018 | 75,000,000 | 45.79 | % | 54.21 | % | 0.19 | 0.22 | 0.41 | ||||||||||||||||||||||||
| Horror - Remake | The Invasion | WB | 8/17/2007 | $ | 15,074,191 | 25,072,871 | 40,147,062 | 2,776 | 80,000,000 | 37.55 | % | 62.45 | % | 0.19 | 0.31 | 0.50 | ||||||||||||||||||||||||
| Horror - Remake | The Haunting | DW | 7/23/1999 | $ | 91,411,151 | 85,900,000 | 177,311,151 | 2,881 | 80,000,000 | 51.55 | % | 48.45 | % | 1.14 | 1.07 | 2.22 | ||||||||||||||||||||||||
| Horror - Period | Exorcist: The Beginning | WB | 8/20/2004 | $ | 41,821,986 | 36,178,600 | 78,000,586 | 2,813 | 80,000,000 | 53.62 | % | 46.38 | % | 0.52 | 0.45 | 0.98 | ||||||||||||||||||||||||
| Horror - Terror in the water | Sphere | WB | 2/13/1998 | $ | 37,020,277 | - | - | 2,814 | 80,000,000 | - | - | 0.46 | - | - | ||||||||||||||||||||||||||
| Horror - Remake | The Stepford Wives | Par. | 6/11/2004 | $ | 59,484,742 | 42,516,884 | 102,001,626 | 3,057 | 90,000,000 | 58.32 | % | 41.68 | % | 0.66 | 0.47 | 1.13 | ||||||||||||||||||||||||
| Horror - Period | Sleepy Hollow | Par. | 11/19/1999 | $ | 101,071,502 | 105,000,000 | 206,071,502 | 3,069 | 100,000,000 | 49.05 | % | 50.95 | % | 1.01 | 1.05 | 2.06 | ||||||||||||||||||||||||
| SCI-FI Horror | War of the Worlds | Par. | 6/29/2005 | $ | 234,280,354 | 357,465,174 | 591,745,528 | 3,910 | 132,000,000 | - | - | 1.77 | 2.71 | 4.48 | ||||||||||||||||||||||||||
| SCI-FI Horror | I Am Legend | WB | 12/14/2007 | $ | 248,815,030 | 262,500,000 | 511,315,030 | 3,648 | 150,000,000 | 48.66 | % | 51.34 | % | 1.66 | 1.75 | 3.41 | ||||||||||||||||||||||||
| Horror - Period | Van Helsing | Uni. | 5/7/2004 | $ | 120,177,084 | 180,080,391 | 300,257,475 | 3,580 | 160,000,000 | 40.02 | % | 59.98 | % | 0.75 | 1.13 | 1.88 | ||||||||||||||||||||||||
| Horror - Comedy | Feast | W/Dim. | 9/22/2006 | $ | 56,131 | 285,677 | 341,808 | 146 | - | 16.42 | % | 83.58 | % | - | - | - | ||||||||||||||||||||||||
| Horror - Torture | Captivity | ADF | 7/13/2007 | $ | 2,626,800 | 6,772,940 | 9,399,740 | 1,061 | - | 27.95 | % | 72.05 | % | - | - | - | ||||||||||||||||||||||||
| Horror - Terror in the water | Jaws IV: The Revenge | Uni. | 7/17/1987 | $ | 20,763,013 | 31,118,000 | 51,881,013 | 1,611 | - | 40.02 | % | 59.98 | % | - | - | - | ||||||||||||||||||||||||
| Horror - Terror in the water | Into the Blue | Sony | 9/30/2005 | $ | 18,801,234 | 25,633,205 | 44,434,439 | 2,789 | - | 42.31 | % | 57.69 | % | - | - | - | ||||||||||||||||||||||||
| Horror - Terror in the water | Jaws 2 | Uni. | 6/16/1978 | $ | 81,766,007 | 106,118,000 | 187,884,007 | 640 | - | 43.52 | % | 56.48 | % | - | - | - | ||||||||||||||||||||||||
| Horror - Comedy | Shaun of the Dead | Rog. | 9/24/2004 | $ | 13,542,874 | 16,496,518 | 30,039,392 | 675 | - | 45.08 | % | 54.92 | % | - | - | - | ||||||||||||||||||||||||
| Horror - Terror in the water | Anaconda | Sony | 4/11/1997 | $ | 65,885,767 | 71,000,000 | 136,885,767 | 2,456 | - | 48.13 | % | 51.87 | % | - | - | - | ||||||||||||||||||||||||
| SCI-FI Horror | The Fly II | Fox | 2/10/1989 | $ | 20,021,322 | 18,881,857 | 38,903,179 | 1,528 | - | 51.46 | % | 48.54 | % | - | - | - | ||||||||||||||||||||||||
| Horror - Remake | Dark Water | BV | 7/8/2005 | $ | 25,473,352 | 24,010,000 | 49,483,352 | 2,657 | - | 51.48 | % | 48.52 | % | - | - | - | ||||||||||||||||||||||||
| Horror - Terror in the water | Jaws 3-D | Uni. | 7/22/1983 | $ | 45,517,055 | 42,470,000 | 87,987,055 | 1,311 | - | 51.73 | % | 48.27 | % | - | - | - | ||||||||||||||||||||||||
| Horror - Comedy | Ghostbusters II | Col. | 6/16/1989 | $ | 112,494,738 | 102,900,000 | 215,394,738 | 2,410 | - | 52.23 | % | 47.77 | % | - | - | - | ||||||||||||||||||||||||
| Horror - Torture | Saw IV | LGF | 10/26/2007 | $ | 63,300,095 | 56,235,824 | 119,535,919 | 3,183 | - | 52.95 | % | 47.05 | % | - | - | - | ||||||||||||||||||||||||
| Horror - Comedy | The Frighteners | Uni. | 7/19/1996 | $ | 16,759,216 | 12,600,000 | 29,359,216 | 1,675 | - | 57.08 | % | 42.92 | % | - | - | - | ||||||||||||||||||||||||
| Horror - Torture | High Tension | Lions | 6/10/2005 | $ | 3,681,066 | 2,610,892 | 6,291,958 | 1,323 | - | 58.50 | % | 41.50 | % | - | - | - | ||||||||||||||||||||||||
| Horror - Torture | Wolf Creek | W/Dim. | 12/25/2005 | $ | 16,188,180 | 11,463,426 | 27,651,606 | 1,761 | - | 58.54 | % | 41.46 | % | - | - | - | ||||||||||||||||||||||||
| SCI-FI Horror | Aliens | Fox | 7/18/1986 | $ | 85,160,248 | 45,900,000 | 131,060,248 | 1,454 | - | 64.98 | % | 35.02 | % | - | - | - | ||||||||||||||||||||||||
| Horror - Comedy | Club Dread | FoxS | 2/27/2004 | $ | 5,001,708 | 2,564,099 | 7,565,807 | 1,807 | - | 66.11 | % | 33.89 | % | - | - | - | ||||||||||||||||||||||||
| Horror - Remake | The Fly | Fox | 8/15/1986 | $ | 40,456,565 | 20,172,594 | 60,629,159 | 1,201 | - | 66.73 | % | 33.27 | % | - | - | - | ||||||||||||||||||||||||
| Horror - Period | The Missing | SonR | 11/26/2003 | $ | 27,011,180 | 11,353,097 | 38,364,277 | 2,756 | - | 70.41 | % | 29.59 | % | - | - | - | ||||||||||||||||||||||||
| Horror - Torture | The Hitcher (2007) | Rog. | 1/19/2007 | $ | 16,472,961 | 6,722,295 | 23,195,256 | 2,836 | - | 71.02 | % | 28.98 | % | - | - | - | ||||||||||||||||||||||||
| Horror - Comedy | Fido | RAtt. | 6/15/2007 | $ | 304,533 | 121,691 | 426,224 | 67 | - | 71.45 | % | 28.55 | % | - | - | - | ||||||||||||||||||||||||
| Horror - Remake | Halloween (2007) | MGM/W | 8/31/2007 | $ | 58,272,029 | 19,892,630 | 78,164,659 | 3,475 | - | 74.55 | % | 25.45 | % | - | - | - | ||||||||||||||||||||||||
SANLI PASTORE & HILL, INC.
134
Appendix B
Platinum Studios, Inc.
Horror Movies
Date of Value: March 31,2008
Data from Box Office Mojo | Calculated by SP&H | |||||||||||||||||||||||||||||||||||||||
Type | Title | Studio | DateReleased | DemesticRevenues | InternationalRevenues | WorldwideRevenues | Theaters | Budget | Demestic as % of WorldwideRevenues | International as % of WorldwideRevenues | Demestic Revenues /Budget | International Revenues /Budget | Worldwide Revenues /Budget | |||||||||||||||||||||||||||
| Horror - Remake | Black Christmas (2006) | MGM/W | 12/25/2006 | $ | 16,273,581 | 4,083,539 | 20,357,120 | 1,544 | - | 79.94 | % | 20.06 | % | - | - | - | ||||||||||||||||||||||||
| Horror - Remake | One Missed Call | WB | 1/4/2008 | $ | 25,082,427 | 290,329 | 25,372,756 | 2,240 | - | 98.86 | % | 1.14 | % | - | - | - | ||||||||||||||||||||||||
| Horror - Terror in the water | Orca | Par. | 7/13/1977 | $ | 14,717,854 | - | - | - | - | - | - | - | - | - | ||||||||||||||||||||||||||
| Horror - Comedy | Return of the Living Dead 2 | Lori | 1/15/1988 | $ | 9,205,924 | - | - | 1,467 | - | - | - | - | - | - | ||||||||||||||||||||||||||
| Horror - Comedy | Critters 2: The Main Course | NL | 4/29/1988 | $ | 3,813,293 | - | - | 1,114 | - | - | - | - | - | - | ||||||||||||||||||||||||||
| Horror - Terror in the water | Deepstar Six | TriS | 1/13/1989 | $ | 8,143,225 | - | - | 1,118 | - | - | - | - | - | - | ||||||||||||||||||||||||||
| Horror - Comedy | Fright Night II | NCeV | 5/19/1989 | $ | 2,983,784 | - | - | 161 | - | - | - | - | - | - | ||||||||||||||||||||||||||
| Horror - Comedy | Behind the Mask: The Rise of Leslie Vernon | Anch. | 3/16/2007 | $ | 69,136 | - | - | 72 | - | - | - | - | - | - | ||||||||||||||||||||||||||
| Horror - Terror in the water | The Deep | Col. | 6/17/1977 | $ | 47,346,365 | - | - | 731 | - | - | - | - | - | - | ||||||||||||||||||||||||||
| Horror - Remake | Invasion of the Body Snatchers | UA | 12/22/1978 | $ | 24,946,533 | - | - | 445 | - | - | - | - | - | - | ||||||||||||||||||||||||||
| SCI-FI Horror | Altered States | WB | 12/25/1980 | $ | 19,853,892 | - | - | - | - | - | - | - | - | - | ||||||||||||||||||||||||||
| SCI-FI Horror | Scanners (1981) | Emb | 1/14/1981 | $ | 14,225,876 | - | - | - | - | - | - | - | - | - | ||||||||||||||||||||||||||
| Horror - Comedy | An American Werewolf in London | Uni. | 8/21/1981 | $ | 30,565,292 | - | - | - | - | - | - | - | - | - | ||||||||||||||||||||||||||
| Horror - Remake | Cat People | Uni. | 4/2/1982 | $ | 7,000,000 | - | - | 600 | - | - | - | - | - | - | ||||||||||||||||||||||||||
| Horror - Remake | The Thing | Uni. | 6/25/1982 | $ | 13,782,838 | - | - | 910 | - | - | - | - | - | - | ||||||||||||||||||||||||||
| SCI-FI Horror | The Thing | Uni. | 6/25/1982 | $ | 13,782,838 | - | - | 910 | - | - | - | - | - | - | ||||||||||||||||||||||||||
| Horror - Comedy | National Lampoon's Class Reunion | Fox | 10/29/1982 | $ | 10,054,150 | - | - | 1,125 | - | - | - | - | - | - | ||||||||||||||||||||||||||
| Horror - Anthology | Creepshow | WB | 11/12/1982 | $ | 21,028,755 | - | - | 1,132 | - | - | - | - | - | - | ||||||||||||||||||||||||||
| SCI-FI Horror | Videodrome | Uni. | 2/4/1983 | $ | 2,120,439 | - | - | 600 | - | - | - | - | - | - | ||||||||||||||||||||||||||
| Horror - Anthology | Twilight Zone: The Movie | WB | 6/24/1983 | $ | 29,450,919 | - | - | 1,288 | - | - | - | - | - | - | ||||||||||||||||||||||||||
| Horror - Anthology | Nightmares | Uni. | 9/2/1983 | $ | 6,670,680 | - | - | 1,025 | - | - | - | - | - | - | ||||||||||||||||||||||||||
| Horror - Comedy | Gremlins | WB | 6/8/1984 | $ | 153,083,102 | - | - | 1,537 | - | - | - | - | - | - | ||||||||||||||||||||||||||
| Horror - Anthology | Cat's Eye | MGM | 4/12/1985 | $ | 13,086,298 | - | - | 1,492 | - | - | - | - | - | - | ||||||||||||||||||||||||||
| SCI-FI Horror | Lifeforce | TriS | 6/21/1985 | $ | 11,603,545 | - | - | 1,526 | - | - | - | - | - | - | ||||||||||||||||||||||||||
| Horror - Comedy | Fright Night | Col. | 8/2/1985 | $ | 24,922,237 | - | - | 1,545 | - | - | - | - | - | - | ||||||||||||||||||||||||||
| Horror - Comedy | Return of the Living Dead | Orion | 8/16/1985 | $ | 14,237,880 | - | - | 1,506 | - | - | - | - | - | - | ||||||||||||||||||||||||||
| Horror - Comedy | Once Bitten | Gold. | 11/15/1985 | $ | 10,000,000 | - | - | 1,095 | - | - | - | - | - | - | ||||||||||||||||||||||||||
| Horror - Comedy | Critters | NL | 4/11/1986 | $ | 13,167,232 | - | - | 633 | - | - | - | - | - | - | ||||||||||||||||||||||||||
| Horror - Remake | Invaders From Mars | Can. | 6/6/1986 | $ | 4,884,663 | - | - | 1,212 | - | - | - | - | - | - | ||||||||||||||||||||||||||
| Horror - Comedy | Vamp | NW | 7/18/1986 | $ | 4,941,117 | - | - | 1,104 | - | - | - | - | - | - | ||||||||||||||||||||||||||
| SCI-FI Horror | Maximum Overdrive | DEG | 7/25/1986 | $ | 7,433,663 | - | - | 1,198 | - | - | - | - | - | - | ||||||||||||||||||||||||||
| Horror - Anthology | Deadtime Stories | PEC | 11/28/1986 | $ | 2,750,741 | - | - | 255 | - | - | - | - | - | - | ||||||||||||||||||||||||||
| Horror - Comedy | Little Shop of Horrors | WB | 12/19/1986 | $ | 38,748,395 | - | - | 1,183 | - | - | - | - | - | - | ||||||||||||||||||||||||||
| SCI-FI Horror | The Kindred | FMEnt | 1/9/1987 | $ | 2,407,024 | - | - | 566 | - | - | - | - | - | - | ||||||||||||||||||||||||||
| Horror - Comedy | Evil Dead 2 | DEG | 3/13/1987 | $ | 5,923,044 | - | - | 310 | - | - | - | - | - | - | ||||||||||||||||||||||||||
| Horror - Period | Gothic | Vest | 4/10/1987 | $ | 916,172 | - | - | 20 | - | - | - | - | - | - | ||||||||||||||||||||||||||
| Horror - Anthology | Creepshow 2 | NW | 5/1/1987 | $ | 14,000,000 | - | - | 1,012 | - | - | - | - | - | - | ||||||||||||||||||||||||||
| Horror - Anthology | The Offspring | MovE | 9/4/1987 | $ | 1,355,728 | - | - | 137 | - | - | - | - | - | - | ||||||||||||||||||||||||||
| SCI-FI Horror | Monkey Shines | Orion | 7/29/1988 | $ | 5,344,577 | - | - | 1,181 | - | - | - | - | - | - | ||||||||||||||||||||||||||
| SCI-FI Horror | The Blob | TriS | 8/5/1988 | $ | 8,247,943 | - | - | 1,081 | - | - | - | - | - | - | ||||||||||||||||||||||||||
| SCI-FI Horror | Watchers | Uni. | 12/2/1988 | $ | 940,173 | - | - | 161 | - | - | - | - | - | - | ||||||||||||||||||||||||||
| SCI-FI Horror | Deepstar Six | TriS | 1/13/1989 | $ | 8,143,225 | - | - | 1,118 | - | - | - | - | - | - | ||||||||||||||||||||||||||
| SCI-FI Horror | Leviathan | MGM | 3/17/1989 | $ | 15,704,614 | - | - | 1,393 | - | - | - | - | - | - | ||||||||||||||||||||||||||
| Horror - Anthology | After Midnight | MGM | 11/3/1989 | $ | 76,325 | - | - | 224 | - | - | - | - | - | - | ||||||||||||||||||||||||||
| Horror - Comedy | Tremors | Uni. | 1/19/1990 | $ | 16,667,084 | - | - | 1,477 | - | - | - | - | - | - | ||||||||||||||||||||||||||
| Horror - Anthology | Tales From the Darkside: The Movie | Par. | 5/4/1990 | $ | 16,324,573 | - | - | 1,535 | - | - | - | - | - | - | ||||||||||||||||||||||||||
| Horror - Comedy | Gremlins 2: The New Batch | WB | 6/15/1990 | $ | 41,482,207 | - | - | 2,155 | - | - | - | - | - | - | ||||||||||||||||||||||||||
| Horror - Comedy | Arachnophobia | BV | 7/20/1990 | $ | 53,208,180 | - | - | 2,005 | - | - | - | - | - | - | ||||||||||||||||||||||||||
| Horror - Comedy | Repossessed | NL | 9/14/1990 | $ | 1,382,462 | - | - | 115 | - | - | - | - | - | - | ||||||||||||||||||||||||||
| SCI-FI Horror | Hardware | Mira. | 9/14/1990 | $ | 5,728,953 | - | - | 695 | - | - | - | - | - | - | ||||||||||||||||||||||||||
| Horror - Remake | Night of the Living Dead | Col. | 10/19/1990 | $ | 5,835,247 | - | - | 1,544 | - | - | - | - | - | - | ||||||||||||||||||||||||||
| Horror - Anthology | Two Evil Eyes | Tau | 10/25/1991 | $ | 349,618 | - | - | 150 | - | - | - | - | - | - | ||||||||||||||||||||||||||
| Horror - Comedy | Buffy the Vampire Slayer | Fox | 7/31/1992 | $ | 16,624,456 | - | - | 1,981 | - | - | - | - | - | - | ||||||||||||||||||||||||||
| Horror - Comedy | Innocent Blood | WB | 9/25/1992 | $ | 4,943,279 | - | - | 1,326 | - | - | - | - | - | - | ||||||||||||||||||||||||||
| Horror - Comedy | Dead Alive | Trim. | 2/12/1993 | $ | 242,623 | - | - | 11 | - | - | - | - | - | - | ||||||||||||||||||||||||||
| Horror - Comedy | Army of Darkness | Uni. | 2/19/1993 | $ | 11,502,976 | - | - | 1,391 | - | - | - | - | - | - | ||||||||||||||||||||||||||
| SCI-FI Horror | Body Snatchers | WB | 1/14/1994 | $ | 428,868 | - | - | 34 | - | - | - | - | - | - | ||||||||||||||||||||||||||
| Horror - Period | Cronos | Oct. | 4/1/1994 | $ | 621,392 | - | - | 28 | - | - | - | - | - | - | ||||||||||||||||||||||||||
| Horror - Remake | Village of the Damned | Uni. | 4/28/1995 | $ | 9,418,365 | - | - | 1,919 | - | - | - | - | - | - | ||||||||||||||||||||||||||
| Horror - Anthology | Tales from the Hood | Sav. | 5/26/1995 | $ | 11,837,928 | - | - | 862 | - | - | - | - | - | - | ||||||||||||||||||||||||||
| Horror - Comedy | Vampire in Brooklyn | Par. | 10/27/1995 | $ | 19,751,736 | - | - | 2,307 | - | - | - | - | - | - | ||||||||||||||||||||||||||
| Horror - Comedy | Dracula: Dead and Loving It | Sony | 12/22/1995 | $ | 10,772,144 | - | - | 1,425 | - | - | - | - | - | - | ||||||||||||||||||||||||||
| SCI-FI Horror | Screamers | Sony | 1/26/1996 | $ | 5,711,695 | - | - | 1,560 | - | - | - | - | - | - | ||||||||||||||||||||||||||
| Horror - Comedy | Cemetary Man | Oct. | 4/26/1996 | $ | 253,986 | - | - | 25 | - | - | - | - | - | - | ||||||||||||||||||||||||||
| Horror - Comedy | Bordello of Blood | Uni. | 8/16/1996 | $ | 5,781,045 | - | - | 1,695 | - | - | - | - | - | - | ||||||||||||||||||||||||||
| Horror - Period | The Ghost and the Darkness | Par. | 10/11/1996 | $ | 38,619,405 | - | - | 2,202 | - | - | - | - | - | - | ||||||||||||||||||||||||||
| SCI-FI Horror | Event Horizon | Par. | 8/15/1997 | $ | 26,673,242 | - | - | 2,328 | - | - | - | - | - | - | ||||||||||||||||||||||||||
| Horror - Terror in the water | Deep Rising | BV | 1/30/1998 | $ | 11,203,026 | - | - | 1,788 | - | - | - | - | - | - | ||||||||||||||||||||||||||
| Horror - Torture | Strangeland | Art. | 10/2/1998 | $ | 713,239 | - | - | 315 | - | - | - | - | - | - | ||||||||||||||||||||||||||
| Horror - Period | The Devil's Backbone | SPC | 11/21/2001 | $ | 755,249 | - | - | 35 | - | - | - | - | - | - | ||||||||||||||||||||||||||
| Horror - Period | Dominion: Prequel to the Exorcist | WB | 5/20/2005 | $ | 251,495 | - | - | 110 | - | - | - | - | - | - | ||||||||||||||||||||||||||
| Horror - Anthology | After Dark's Horror Fest: 8 Films to Die For | Free | 11/17/2006 | $ | 2,575,000 | - | - | 488 | - | - | - | - | - | - | ||||||||||||||||||||||||||
| Horror - Anthology | After Dark's Horror fest 2 | ADF | 11/9/2007 | $ | 874,635 | 0 | 874,635 | 323 | - | 100.00 | % | 0.00 | % | - | - | - | ||||||||||||||||||||||||
| Horror - Comedy | Teeth | RAtt. | 1/18/2008 | $ | 36,530 | - | - | 4 | - | - | - | - | - | - | ||||||||||||||||||||||||||
| SCI-FI Horror | The Fly | Fox | 8/15/1986 | $ | 40,456,565 | 20,172,594 | 60,629,159 | 1,201 | - | - | - | - | - | - | ||||||||||||||||||||||||||
| Horror - Period | Mary Reilly | Sony | 2/23/1996 | $ | 5,707,094 | 6,672,308 | 12,379,402 | 1,470 | - | - | - | - | - | - | ||||||||||||||||||||||||||
| Horror - Torture | Cube | Trim. | 9/11/1998 | $ | 501,818 | - | - | 24 | - | - | - | - | - | - | ||||||||||||||||||||||||||
| Horror - Period | Below | Dim. | 10/11/2002 | $ | 605,562 | - | - | 353 | - | - | - | - | - | - | ||||||||||||||||||||||||||
| Horror - Torture | Chaos | Din. | 8/10/2005 | $ | 10,289 | - | - | 2 | - | - | - | - | - | - | ||||||||||||||||||||||||||
| Horror - Remake | Night of the Living Dead 3D | MME | 11/10/2006 | $ | 271,000 | 1,178,945 | 1,449,945 | 145 | - | - | - | - | - | - | ||||||||||||||||||||||||||
| Horror - Comedy | Hatchet | Anch. | 9/7/2007 | - | - | - | 78 | - | - | - | - | - | - | |||||||||||||||||||||||||||
| Horror - Torture | The Strangers | Rog. | - | - | - | - | - | - | - | - | - | - | - | |||||||||||||||||||||||||||
| Horror - Comedy | Dead 5: Rave to the Grave | Free | - | - | - | - | - | - | - | - | - | - | - | |||||||||||||||||||||||||||
Summary Statistics | |||||||||||||||||||||||||||||||
Demestic Revenues | International Revenues | Worldwide Revenues | Theaters | Budget | Demestic as % of Worldwide Revenues | International as % of Worldwide Revenues | Demestic Revenues / Budget | International Revenues / Budget | Worldwide Revenues / Budget | ||||||||||||||||||||||
Count | 185 | 102 | 102 | 182 | 82 | 95 | 95 | 73 | 66 | 65 | |||||||||||||||||||||
Min | 10,289 | 0 | 341,808 | 2 | 500,000 | 0.02 | 0.00 | 0.01 | 0.00 | 0.37 | |||||||||||||||||||||
LQ | 5,923,044 | 12,936,750 | 31,811,338 | 910 | 14,250,000 | 0.46 | 0.36 | 0.75 | 0.66 | 1.72 | |||||||||||||||||||||
Median | 19,363,565 | 27,783,077 | 68,617,041 | 1,699 | 30,000,000 | 0.55 | 0.45 | 1.23 | 1.52 | 2.79 | |||||||||||||||||||||
Mean | 35,780,236 | 51,031,877 | 105,148,813 | 1,740 | 37,201,220 | 0.55 | 0.45 | 4.03 | 3.60 | 8.06 | |||||||||||||||||||||
UQ | 41,867,960 | 77,875,475 | 147,654,306 | 2,696 | 49,500,000 | 0.64 | 0.54 | 2.18 | 2.17 | 4.48 | |||||||||||||||||||||
Max | 260,000,000 | 357,465,174 | 591,745,528 | 3,910 | 160,000,000 | 1.00 | 0.98 | 61.22 | 48.11 | 109.34 | |||||||||||||||||||||
Std Dev | 47,174,557 | 58,585,396 | 108,810,944 | 1,084 | 32,480,682 | 0.16 | 0.16 | 9.91 | 8.36 | 18.81 | |||||||||||||||||||||
Mean + 2*Std Dev | 130,129,349 | 168,202,670 | 322,770,701 | 3,907 | 102,162,583 | 0.88 | 0.77 | 23.85 | 20.31 | 45.69 | |||||||||||||||||||||
Mean - 2*Std Dev | (58,568,877 | ) | (66,138,915 | ) | (112,473,075 | ) | (428 | ) | (27,760,144 | ) | 0.23 | 0.12 | (15.79 | ) | (13.12 | ) | (29.57 | ) | |||||||||||||
CV | 1.32 | 1.15 | 1.03 | 0.62 | 0.87 | 0.30 | 0.36 | 2.46 | 2.32 | 2.33 | |||||||||||||||||||||
SANLI PASTORE & HILL, INC.
135
Appendix C
Platinum Studios, Inc.
Film Library Deals
Date of Value: March 31,2008
Data from Vogel & Press Releases | Calc. by SP&H | ||||||||||||||||||
Year | Assets Transferred | Sold by | Bought by | Number of Features | Approximate Price | Price per Feature | |||||||||||||
| 1957 | 700 WB features, shorts, cartoons | Associated Artist | United Artist | 700 | 30,000,000 | 42,857 | |||||||||||||
| 1958 | 750 pre-1948 features | Paramount | MCA | 750 | 50,000,000 | 66,667 | |||||||||||||
| 1979 | 500 features | American International Pictures | Filmways | 500 | 25,000,000 | 50,000 | |||||||||||||
| 1982 | 500 features | Filmways | Orion Pictures | 500 | 26,000,000 | 52,000 | |||||||||||||
| 1993 | 200 features | New Line | Turner Broadcasting | 200 | 500,000,000 | n/a | |||||||||||||
| 1997 | 2,000 features | Orion/Samuel Goldwyn | Metro-Goldwyn-Mayer | 2,000 | 573,000,000 | 286,500 | |||||||||||||
| 1/9/2008 | Acquisition results in getting all-rights library of 1900 movie titles | RCV Entertainment | Entertainment One Ltd. | 1,900 | 41,500,000 | 21,842 | |||||||||||||
| 12/3/2006 | Acquisition results in ownership of library of 7000 filmtitles | Artisan Entertainment | Lions Gate Entertainment | 7,000 | 220,000,000 | 31,429 | |||||||||||||
| 10/5/2006 | Library of over 600 TV movies, mini series | Crown Media | RHI Entertainment | 600 | 160,000,000 | 266,667 | |||||||||||||
| 3/17/2006 | Acquisition of Paramount Pictures' Dreamworks film library | Viacom | Soros Strategic Partners LP & Dune Entertainment II LLC | - | 900,000,000 | - | |||||||||||||
| 6/22/2001 | Acquisition results in ownership of branded characters including Casper, Richie Rich | Harvey Entertainment Co. | Classic Media LLC | - | 17,000,000 | - | |||||||||||||
Summary Statistics | ||||||||||
Number of Features | Approximate Price | Price per Feature | ||||||||
Count | 9 | 11 | 8 | |||||||
Min | 200 | 17,000,000 | 21,842 | |||||||
LQ | 500 | 28,000,000 | 40,000 | |||||||
Median | 700 | 50,000,000 | 51,000 | |||||||
Mean | 1,572 | 231,136,364 | 102,245 | |||||||
UQ | 1,900 | 360,000,000 | 116,667 | |||||||
Max | 7,000 | 900,000,000 | 286,500 | |||||||
Std Dev | 2,131 | 296,879,950 | 108,569 | |||||||
Mean + 2*Std Dev | 5,833 | 824,896,263 | 319,383 | |||||||
Mean - 2*Std Dev | (2,689 | ) | (362,623,536 | ) | (114,893 | ) | ||||
CV | 1.36 | 1.28 | 1.06 | |||||||
Source: Vogel, Harold L.: "Entertainment Industry Economics" Seventh Edition; and Press Releases.
SANLI PASTORE & HILL, INC.
136
Appendix D
Platinum Studios, Inc.
Direct-to-DVD Movies
Date of Value: March 31,2008
Data from Video Business | Calc. by SP&H | ||||||||||||||||||
Release Date | Direct-to-DVD Title | Label / Distributor | Revenues | Average Budget | Rank | Revenue to Avgerage Budget | |||||||||||||
| Sept 27/05 | Family Guy Stwewie Griffin: The Untold Story | Fox | 78,200,000 | 4,000,000 | 1 | 19.6 | |||||||||||||
| Feb 1/05 | Mulan II | BV | 61,600,000 | 4,000,000 | 2 | 15.4 | |||||||||||||
| Jun 14/05 | Tarzan II | BV | 47,100,000 | 4,000,000 | 3 | 11.8 | |||||||||||||
| Aug 30/05 | Lilo & Stitch 2: StitchHas a Glitch | BV | 43,700,000 | 4,000,000 | 4 | 10.9 | |||||||||||||
| Dec 13/05 | Kronk's New Groove | BV | 24,200,000 | 4,000,000 | 5 | 6.1 | |||||||||||||
| Sept 27/05 | Carlito's Way: Rise to Power | Universal | 22,100,000 | 4,000,000 | 6 | 5.5 | |||||||||||||
| Sept 20/05 | Barbie Fairytopia | Lions Gate | 20,600,000 | 4,000,000 | 7 | 5.2 | |||||||||||||
| May 3/05 | The Sandlot 2 | Fox | 19,600,000 | 4,000,000 | 8 | 4.9 | |||||||||||||
| Jan 18/05 | Aladdin 2&3 Collection | BV | 19,000,000 | 4,000,000 | 9 | 4.8 | |||||||||||||
| Dec 26/05 | American Pie: Band Camp | Universal | 18,600,000 | 4,000,000 | 10 | 4.7 | |||||||||||||
| Dec 7/05 | Blue Collar Comedy Tour Rides | Par | 17,600,000 | 4,000,000 | 11 | 4.4 | |||||||||||||
| Sept 20/05 | Barbie and the Magic of Pegasus | Lions Gate | 16,000,000 | 4,000,000 | 12 | 4.0 | |||||||||||||
| Feb 8/05 | Aloha Scooby-Doo | WB | 14,000,000 | 4,000,000 | 13 | 3.5 | |||||||||||||
| Feb 15/05 | Into the Sun | Sony | 12,700,000 | 4,000,000 | 14 | 3.2 | |||||||||||||
| Jan 11/05 | LBT: Tinysauruses | Universal | 11,500,000 | 4,000,000 | 15 | 2.9 | |||||||||||||
| Sept 13/05 | Pooh's Heffalump Halloween Movie | BV | 11,100,000 | 4,000,000 | 16 | 2.8 | |||||||||||||
| Dec 28/05 | Wake of Death | Sony | 10,500,000 | 4,000,000 | 17 | 2.6 | |||||||||||||
| Aug 31/05 | The Lion King 2 | BV | 9,900,000 | 4,000,000 | 18 | 2.5 | |||||||||||||
| Feb 15/05 | Control | Sony | 8,700,000 | 4,000,000 | 19 | 2.2 | |||||||||||||
| Sept 28/05 | Barbie as the Princess and Pauper | Lions Gate | 8,400,000 | 4,000,000 | 20 | 2.1 | |||||||||||||
| Sept 13/05 | Rock Angelz | Fox | 7,900,000 | 4,000,000 | 21 | 2.0 | |||||||||||||
| May 31/05 | Submerged | Sony | 7,800,000 | 4,000,000 | 22 | 2.0 | |||||||||||||
| Oct 11/05 | 11:14 | NL / WB | 6,700,000 | 4,000,000 | 23 | 1.7 | |||||||||||||
| Feb 15/05 | PokemonL Destiny Deoxys | BV | 6,100,000 | 4,000,000 | 24 | 1.5 | |||||||||||||
| Oct 11/05 | Bionicle 3 | BV | 5,900,000 | 4,000,000 | 25 | 1.5 | |||||||||||||
Summary Statistics | ||||||||||
Revenues | Average Budget | Revenue to Avgerage Budget | ||||||||
Count | 25 | 25 | 25 | |||||||
Min | 5,900,000 | 4,000,000 | 1.5 | |||||||
LQ | 8,700,000 | 4,000,000 | 2.2 | |||||||
Median | 14,000,000 | 4,000,000 | 3.5 | |||||||
Mean | 20,380,000 | 4,000,000 | 5.1 | |||||||
UQ | 20,600,000 | 4,000,000 | 5.2 | |||||||
Max | 78,200,000 | 4,000,000 | 19.6 | |||||||
Std Dev | 18,276,807 | 0 | 4.6 | |||||||
Mean + 2*Std Dev | 56,933,614 | 4,000,000 | 14.2 | |||||||
Mean - 2*Std Dev | (16,173,614 | ) | 4,000,000 | (4.0 | ) | |||||
CV | 0.90 | 0.00 | 0.90 | |||||||
Source: Video Business; Year End 2005 Top DVD Premiere Titles
SANLI PASTORE & HILL, INC.
137
Appendix E
Platinum Studios, Inc.
User generated Content Sites Deals
Date of Value: March 31,2008
Data from Press Releases | Calc. by SP&H | ||||||||||||||||||||||||||||||||||||
Date | User Generated Content Sites | Bought by | Deal Price | Inbound Links | Compete Monthly Visitors | Quantcast Monthly Visitors | Average Uniques | Alexa Ranking | Page Rank | Deal Price/CMV | Deal Price/QMV | Deal Price/Avg Uniques | |||||||||||||||||||||||||
| Jan-07 | MyBlogLog.com | Yahoo! | $ | 10,000,000 | 1,746,490 | 1,972,847 | 84,992 | 1,028,920 | 432 | 7 | 5.07 | 117.66 | 9.72 | ||||||||||||||||||||||||
| Aug-07 | TreeHugger | Discovery Communications | $ | 10,000,000 | - | 597,574 | 1,574,718 | 1,086,146 | - | - | 16.73 | 6.35 | 9.21 | ||||||||||||||||||||||||
| Mar-07 | Insider Pages | CitySearch | $ | 13,000,000 | - | 1,738,119 | 3,300,252 | 2,519,186 | - | - | 7.48 | 3.94 | 5.16 | ||||||||||||||||||||||||
| Jun-05 | Flickr.com | Yahoo! | $ | 25,000,000 | 51,779,871 | 23,643,614 | 9,700,000 | 16,671,807 | 36 | 8 | 1.06 | 2.58 | 1.50 | ||||||||||||||||||||||||
| Jul-07 | Recipezaar.com | Scripps Networks | $ | 25,000,000 | - | 4,017,077 | 3,587,948 | 3,802,513 | - | - | 6.22 | 6.97 | 6.57 | ||||||||||||||||||||||||
| Aug-07 | Kaboodle | Hearst Interactive Media | $ | 30,000,000 | - | 2,428,997 | 4,039,611 | 3,234,304 | - | - | 12.35 | 7.43 | 9.28 | ||||||||||||||||||||||||
| May-07 | StumbleUpon.com | Ebay | $ | 75,000,000 | 1,983,910 | 1,313,586 | 659,239 | 986,413 | 300 | 8 | 57.10 | 113.77 | - | ||||||||||||||||||||||||
| Jun-07 | Feedburner.com | $ | 100,000,000 | 100,244,672 | 5,478,321 | 592,976 | 3,035,649 | 323 | 8 | 18.25 | 168.64 | 32.94 | |||||||||||||||||||||||||
| Dec-05 | del.icio.us | Yahoo! | $ | 250,000,000 | 171,905,738 | 1,699,128 | 1,300,000 | 1,499,564 | 248 | 8 | 147.13 | 192.31 | - | ||||||||||||||||||||||||
| May-07 | PhotoBucket.com | MySpace | $ | 250,000,000 | 144,789,477 | 25,548,801 | 14,000,000 | 19,774,401 | 40 | 8 | 9.79 | 17.86 | 12.64 | ||||||||||||||||||||||||
| May-07 | last.fm | CBS Interactive | $ | 280,000,000 | 14,448,992 | 1,150,875 | 713,976 | 932,426 | 304 | 7 | 243.29 | 392.17 | - | ||||||||||||||||||||||||
| Jul-05 | MySpace.com | News Corporation | $ | 580,000,000 | 92,285,806 | 62,285,849 | 53,000,000 | 57,642,925 | 6 | 8 | 9.31 | 10.94 | 10.06 | ||||||||||||||||||||||||
| Oct-06 | YouTube.com | $ | 1,650,000,000 | 75,539,411 | 41,422,790 | 43,000,000 | 42,211,395 | 9 | 8 | 39.83 | 38.37 | 39.09 | |||||||||||||||||||||||||
Summary Statistics | |||||||||||||||||||||||||
Deal Price | Inbound Links | Compete Monthly Visitors | Quantcast Monthly Visitors | Average Uniques | Deal Price/CMV | Deal Price/QMV | Deal Price/Avg Uniques | ||||||||||||||||||
Count | 13 | 9 | 13 | 13 | 13 | 13 | 13 | 10 | |||||||||||||||||
Min | 10,000,000 | 1,746,490 | 597,574 | 84,992 | 932,426 | 1.06 | 2.58 | 1.50 | |||||||||||||||||
LQ | 25,000,000 | 14,448,992 | 1,699,128 | 713,976 | 1,086,146 | 7.48 | 6.97 | 7.23 | |||||||||||||||||
Median | 75,000,000 | 75,539,411 | 2,428,997 | 3,300,252 | 3,035,649 | 12.35 | 17.86 | 9.50 | |||||||||||||||||
Mean | 253,692,308 | 72,747,152 | 13,330,583 | 10,427,209 | 11,878,896 | 44.12 | 83.00 | 13.62 | |||||||||||||||||
UQ | 250,000,000 | 100,244,672 | 23,643,614 | 9,700,000 | 16,671,807 | 39.83 | 117.66 | 12.00 | |||||||||||||||||
Max | 1,650,000,000 | 171,905,738 | 62,285,849 | 53,000,000 | 57,642,925 | 243.29 | 392.17 | 39.09 | |||||||||||||||||
Std Dev | 451,272,901 | 61,293,376 | 19,498,365 | 17,272,810 | 18,225,187 | 71.56 | 114.94 | 12.28 | |||||||||||||||||
Mean + 2*Std Dev | 1,156,238,109 | 195,333,905 | 52,327,313 | 44,972,829 | 48,329,270 | 187.24 | 312.87 | 38.18 | |||||||||||||||||
Mean - 2*Std Dev | (648,853,493 | ) | (49,839,601 | ) | (25,666,147 | ) | (24,118,411 | ) | (24,571,478 | ) | (98.99 | ) | (146.88 | ) | (10.94 | ) | |||||||||
CV | 1.78 | 0.84 | 1.46 | 1.66 | 1.53 | 1.62 | 1.38 | 0.90 | |||||||||||||||||
SANLI PASTORE & HILL, INC.
138
Appendix F
Platinum Studios, Inc.
General Content/E-commerce Sites Deals Under $30 million
Date of Value: March 31,2008
Data from Press Releases | Calc. by SP&H | |||||||||||||||||||||||||||
Date | General Content Sites | Bought by | Deal Price | Compete Monthly Visitors | Quantcast Monthly Visitors | Avgerage Monthly Uniques | Deal Price/CMV | Deal Price/QMV | Deal Price/Average Monthly Uniques | |||||||||||||||||||
| 10/2/2006 | Renovation Experts.com (Renex, Inc.) | Website Pros, Inc. | $ | 8,000,000 | 92,671 | 119,161 | 105,916 | 86.33 | 67.14 | - | ||||||||||||||||||
| 10/2/2006 | 1ShoppingCart.com | Website Pros, Inc. | $ | 12,452,888 | 517,007 | 755,066 | 636,037 | 24.09 | 16.49 | 19.58 | ||||||||||||||||||
| 7/18/2007 | Mediabistro | Jupiter Media | $ | 23,000,000 | 962,698 | 733,445 | 848,072 | 23.89 | 31.36 | 27.12 | ||||||||||||||||||
| 9/14/2007 | BuzzTracker | Yahoo | $ | 5,000,000 | 739,796 | 2,404,722 | 1,572,259 | 6.76 | 2.08 | 3.18 | ||||||||||||||||||
| 5/22/2007 | Wallstrip | CBS | $ | 5,000,000 | 32,769 | 45,404 | 39,087 | 152.58 | 110.12 | - | ||||||||||||||||||
| 10/23/2007 | SmartShopper | Zango | $ | 9,000,000 | 56,630 | 1,671 | 29,151 | 158.93 | 5,386.00 | - | ||||||||||||||||||
| 10/12/2007 | Dotspotter | CBS | $ | 10,000,000 | 39,696 | 53,244 | 46,470 | 251.91 | 187.81 | - | ||||||||||||||||||
Summary Statistics | ||||||||||||||||||||||
Deal Price | Compete Monthly Visitors | Quantcast Monthly Visitors | Avgerage Monthly Uniques | Deal Price/CMV | Deal Price/QMV | Deal Price/Average Monthly Uniques | ||||||||||||||||
Count | 7 | 7 | 7 | 7 | 7 | 7 | 3 | |||||||||||||||
Min | 5,000,000 | 32,769 | 1,671 | 29,151 | 6.76 | 2.08 | 3.18 | |||||||||||||||
LQ | 6,500,000 | 48,163 | 49,324 | 42,778 | 23.99 | 23.93 | 11.38 | |||||||||||||||
Median | 9,000,000 | 92,671 | 119,161 | 105,916 | 86.33 | 67.14 | 19.58 | |||||||||||||||
Mean | 10,350,413 | 348,752 | 587,530 | 468,141 | 100.64 | 828.71 | 16.63 | |||||||||||||||
UQ | 11,226,444 | 628,402 | 744,256 | 742,054 | 155.75 | 148.97 | 23.35 | |||||||||||||||
Max | 23,000,000 | 962,698 | 2,404,722 | 1,572,259 | 251.91 | 5,386.00 | 27.12 | |||||||||||||||
Std Dev | 6,180,037 | 388,250 | 865,401 | 588,420 | 91.06 | 2,010.59 | 12.24 | |||||||||||||||
Mean + 2*Std Dev | 22,710,486 | 1,125,252 | 2,318,332 | 1,644,981 | 282.76 | 4,849.89 | 41.11 | |||||||||||||||
Mean - 2*Std Dev | (2,009,661 | ) | (427,748 | ) | (1,143,271 | ) | (708,698 | ) | (81.47 | ) | (3,192.46 | ) | (7.85 | ) | ||||||||
CV | 0.60 | 1.11 | 1.47 | 1.26 | 0.90 | 2.43 | 0.74 | |||||||||||||||
SANLI PASTORE & HILL, INC.
139
Appendix G-1
Platinum Studios, Inc.
Video Game Unit Sales
Date of Value: March 31, 2008
Data from VGChartz.com | ||||||||||||||||||||||||||||
Annual Unit Sales Volume (North America) | ||||||||||||||||||||||||||||
Title | Publisher | Release (M) | Release (Y) | 2004 | 2005 | 2006 | 2007 | 2008 1 | Total | |||||||||||||||||||
| Spider-Man 2 | Activision | June | 2004 | 263,598 | 299,598 | 90,263 | 0 | 0 | 653,459 | |||||||||||||||||||
| Dragon Ball Z: Budokai 3 | Atari | November | 2004 | 739,647 | 250,637 | 96,762 | 6,483 | 460 | 1,093,989 | |||||||||||||||||||
| The Incredibles | THQ | October | 2004 | 711,816 | 589,529 | 192,602 | 37,820 | 1,763 | 1,533,530 | |||||||||||||||||||
| Yu-Gi-Oh: Nightmare Troubadour | Konami | August | 2005 | - | 111,345 | 38,890 | 3,195 | 303 | 153,733 | |||||||||||||||||||
| Fantastic Four | Activision | July | 2005 | - | 281,043 | 98,748 | 0 | 0 | 379,791 | |||||||||||||||||||
| Megaman Battle Team 5: Double Team | Capcom | June | 2005 | - | 29,819 | 24,131 | 1,677 | 132 | 55,759 | |||||||||||||||||||
| Pokemon Dash | Nintendo | March | 2005 | - | 175,193 | 25,383 | 5,547 | 1,208 | 207,331 | |||||||||||||||||||
| Dragon Ball Z: Sagas | Atari | March | 2005 | - | 305,479 | 57,336 | 1,332 | 0 | 364,147 | |||||||||||||||||||
| Madagascar | Activision | May | 2005 | - | 816,267 | 570,972 | 91,910 | 8,280 | 1,487,429 | |||||||||||||||||||
| Dragon Ball Z: Supersonic Warriors 2 | Atari | November | 2005 | - | 54,860 | 63,067 | 5,650 | 485 | 124,062 | |||||||||||||||||||
| Kim Possible: Kimmunicator | Buena Vista | November | 2005 | - | 34,647 | 47,630 | 2,874 | 265 | 85,416 | |||||||||||||||||||
| Sponge Bob Square Pants: Yellow Avenger | THQ | November | 2005 | - | 79,165 | 169,897 | 24,676 | 4,459 | 278,197 | |||||||||||||||||||
| Teenage Mutant Ninja Turtles 3: Mutant Nightmare | Konami | November | 2005 | - | 12,323 | 36,646 | 6,073 | 484 | 55,526 | |||||||||||||||||||
| The Incredibles 2 | THQ | November | 2005 | - | 43,425 | 46,633 | 5,686 | 488 | 96,232 | |||||||||||||||||||
| Ed, Edd n Eddy: The Mis-Edventures | Midway | October | 2005 | - | 135,357 | 183,708 | 29,979 | 2,146 | 351,190 | |||||||||||||||||||
| Pokemon XD: Gale of Darkness | Nintendo | October | 2005 | - | 381,058 | 174,981 | 82,615 | 0 | 638,654 | |||||||||||||||||||
| Shrek Superslam | Activision | October | 2005 | - | 46,663 | 106,938 | 17,948 | 1,386 | 172,935 | |||||||||||||||||||
| Sponge Bob Square Pants: Lights Camera Pants | THQ | October | 2005 | - | 208,512 | 111,108 | 32,912 | 3,841 | 356,373 | |||||||||||||||||||
| Chicken Little | Buena Vista | October | 2005 | - | 201,342 | 97,178 | 7,066 | 393 | 305,979 | |||||||||||||||||||
| Dragon Ball Z: Budokai Tenkaichi | Atari | October | 2005 | - | 535,385 | 332,122 | 60,007 | 4,014 | 931,528 | |||||||||||||||||||
| Ghost in the Shell: Stand Alone Complex | Namco Bandai | October | 2005 | - | 24,909 | 32,850 | 4,283 | 415 | 62,457 | |||||||||||||||||||
| Nicktoons: Unite! | THQ | October | 2005 | - | 206,788 | 213,532 | 17,337 | 1,864 | 439,521 | |||||||||||||||||||
| Marvel Nemesis: Rise of the Imperfects | Electronic Arts | September | 2005 | - | 322,989 | 503,837 | 137,166 | 4,985 | 968,977 | |||||||||||||||||||
| Ultimate Spider-Man | Activision | September | 2005 | - | 411,458 | 273,840 | 0 | 0 | 685,298 | |||||||||||||||||||
| X-Men Legends II - Rise of Apocalypse | Activision | September | 2005 | - | 380,766 | 333,684 | 24,322 | 0 | 738,772 | |||||||||||||||||||
| Scooby Doo: Unmasked | THQ | September | 2005 | - | 20,157 | 28,827 | 16,052 | 1,647 | 66,683 | |||||||||||||||||||
| Megaman: Maverick Hunter X | Capcom | January | 2006 | - | - | 118,586 | 4,228 | 466 | 123,280 | |||||||||||||||||||
| Monster House | THQ | July | 2006 | - | - | 77,278 | 10,309 | 883 | 88,470 | |||||||||||||||||||
| Cars | THQ | June | 2006 | - | - | 2,697,719 | 755,959 | 74,382 | 3,528,060 | |||||||||||||||||||
| Ice Age 2: The Meltdown | Vivendi | March | 2006 | - | - | 124,101 | 48,082 | 4,291 | 176,474 | |||||||||||||||||||
| Kingdom Hearts II | Square | March | 2006 | - | - | 1,914,037 | 132,677 | 10,059 | 2,056,773 | |||||||||||||||||||
| Naruto: Clash of Ninja Revolution | D3Publisher | March | 2006 | - | - | 425,407 | 277,614 | 141,511 | 844,532 | |||||||||||||||||||
| Dragon Ball Z: Shin Budokai | Atari | March | 2006 | - | - | 192,359 | 25,838 | 5,022 | 223,219 | |||||||||||||||||||
| Pokemon Trozei | Nintendo | March | 2006 | - | - | 176,527 | 33,816 | 5,124 | 215,467 | |||||||||||||||||||
| X-Men: The Official Game | Activision | May | 2006 | - | - | 73,766 | 0 | 0 | 73,766 | |||||||||||||||||||
| Over the Hedge | Activision | May | 2006 | - | - | 524,501 | 141,953 | 8,353 | 674,807 | |||||||||||||||||||
| Dragon Ball Z: Budokai Tenkaichi 2 | Atari | November | 2006 | - | - | 533,916 | 274,084 | 20,153 | 828,153 | |||||||||||||||||||
| Happy Feet | Midway | November | 2006 | - | - | 237,331 | 117,333 | 16,941 | 371,605 | |||||||||||||||||||
| Spider-Man Battle for New York | Activision | November | 2006 | - | - | 33,253 | 38,024 | 0 | 71,277 | |||||||||||||||||||
| Superman Returns | Electronic Arts | November | 2006 | - | - | 150,968 | 38,486 | 0 | 189,454 | |||||||||||||||||||
| Marvel Ultimate Alliance | Activision | October | 2006 | - | - | 1,209,246 | 2,337,079 | 231,033 | 3,777,358 | |||||||||||||||||||
| Naruto: Ninja Council 2 | Tomy | October | 2006 | - | - | 6,061 | 6,504 | 618 | 13,183 | |||||||||||||||||||
| Pokemon Ranger | Nintendo | October | 2006 | - | - | 522,294 | 445,178 | 64,845 | 1,032,317 | |||||||||||||||||||
| Avatar : The Last Airbender | THQ | October | 2006 | - | - | 251,546 | 161,759 | 17,226 | 430,531 | |||||||||||||||||||
| Family Guy | 2K Games | October | 2006 | - | - | 74,188 | 58,369 | 7,230 | 139,787 | |||||||||||||||||||
| Nicktoons: Battle for Volcano Island | THQ | October | 2006 | - | - | 111,481 | 91,861 | 14,354 | 217,696 | |||||||||||||||||||
| Bratz: Forever Diamonds | THQ | September | 2006 | - | - | 202,681 | 87,279 | 7,665 | 297,625 | |||||||||||||||||||
| Little Mermaid: Ariel's Undersea Adventure | Buena Vista | September | 2006 | - | - | 77,393 | 25,918 | 1,767 | 105,078 | |||||||||||||||||||
| Megaman ZX | Capcom | September | 2006 | - | - | 85,306 | 29,154 | 2,465 | 116,925 | |||||||||||||||||||
| Open Season | Ubisoft | September | 2006 | - | - | 179,849 | 115,808 | 12,735 | 308,392 | |||||||||||||||||||
| Pokemon Mystery Dungeon: Blue Team Rescue Team | Nintendo | September | 2006 | - | - | 808,695 | 267,112 | 30,010 | 1,105,817 | |||||||||||||||||||
| Pokemon Mystery Dungeon: Red Team Rescue Team | Nintendo | September | 2006 | - | - | 675,387 | 152,966 | 0 | 828,353 | |||||||||||||||||||
| Ghost Rider | 2K Games | February | 2007 | - | - | - | 174,015 | 22,201 | 196,216 | |||||||||||||||||||
| Marvel Trading Card Game | Konami | February | 2007 | - | - | - | 48,749 | 7,054 | 55,803 | |||||||||||||||||||
| Fantastic Four: Rise of the Silver Surfer | 2K Games | June | 2007 | - | - | - | 290,532 | 52,094 | 342,626 | |||||||||||||||||||
| TMNT | Ubisoft | March | 2007 | - | - | - | 552,520 | 66,055 | 618,575 | |||||||||||||||||||
| Naruto: Ninja Council 3 | Tomy | May | 2007 | - | - | - | 273,187 | 39,277 | 312,464 | |||||||||||||||||||
| Spider-Man 3 | Activision | May | 2007 | - | - | - | 1,696,372 | 114,076 | 1,810,448 | |||||||||||||||||||
| Surf's Up | Ubisoft | May | 2007 | - | - | - | 436,301 | 99,306 | 535,607 | |||||||||||||||||||
| Ben 10: Protectors of Earth | D3Publisher | October | 2007 | - | - | - | 321,172 | 202,018 | 523,190 | |||||||||||||||||||
| Naruto: Path of the Ninja | Tomy | October | 2007 | - | - | - | 169,069 | 70,086 | 239,155 | |||||||||||||||||||
| Spider-Man: Friend or Foe | Activision | October | 2007 | - | - | - | 462,196 | 172,787 | 634,983 | |||||||||||||||||||
| Naruto: Ninja Destiny | D3Publisher | March | 2008 | - | - | - | - | 132,992 | 132,992 | |||||||||||||||||||
| Iron Man | Sega | May | 2008 | - | - | - | - | 188,421 | 188,421 | |||||||||||||||||||
Summary Statistics | ||||
Total Annual Unit Sales Volume (North America) | ||||
Count | 64 | |||
Min | 13,183 | |||
LQ | 138,088 | |||
Median | 310,428 | |||
Mean | 558,060 | |||
UQ | 677,430 | |||
Max | 3,777,358 | |||
Std Dev | 713,618 | |||
Mean + 2*Std Dev | 1,985,296 | |||
Mean - 2*Std Dev | (869,176 | ) | ||
CV | 1.28 | |||
Note:
1Annual Unit Sales Volume (North America) for 2008 includes data for the period of January through April.
Source: VGChartz, American Chart (Yearly). http://vgchartz.com/ayearly.php
SANLI PASTORE & HILL, INC.
140
Appendix G-2
Platinum Studios, Inc.
Video Game Unit Sales: Comic and Manga Titles Released from 2004 - 2006
Date of Value: March 31, 2008
Data from VGChartz.com | ||||||||||||||||||||||||||||
Annual Unit Sales Volume (North America) | ||||||||||||||||||||||||||||
Title | Publisher | Release (M) | Release (Y) | 2004 | 2005 | 2006 | 2007 | 2008 1 | Total | |||||||||||||||||||
| Spider-Man 2 | Activision | June | 2004 | 263,598 | 299,598 | 90,263 | 0 | 0 | 653,459 | |||||||||||||||||||
| Fantastic Four | Activision | July | 2005 | - | 281,043 | 98,748 | 0 | 0 | 379,791 | |||||||||||||||||||
| Ultimate Spider-Man | Activision | September | 2005 | - | 411,458 | 273,840 | 0 | 0 | 685,298 | |||||||||||||||||||
| X-Men Legends II - Rise of Apocalypse | Activision | September | 2005 | - | 380,766 | 333,684 | 24,322 | 0 | 738,772 | |||||||||||||||||||
| X-Men: The Official Game | Activision | May | 2006 | - | - | 73,766 | 0 | 0 | 73,766 | |||||||||||||||||||
| Spider-Man Battle for New York | Activision | November | 2006 | - | - | 33,253 | 38,024 | 0 | 71,277 | |||||||||||||||||||
| Marvel Ultimate Alliance | Activision | October | 2006 | - | - | 1,209,246 | 2,337,079 | 231,033 | 3,777,358 | |||||||||||||||||||
| Dragon Ball Z: Budokai 3 | Atari | November | 2004 | 739,647 | 250,637 | 96,762 | 6,483 | 460 | 1,093,989 | |||||||||||||||||||
| Dragon Ball Z: Sagas | Atari | March | 2005 | - | 305,479 | 57,336 | 1,332 | 0 | 364,147 | |||||||||||||||||||
| Dragon Ball Z: Supersonic Warriors 2 | Atari | November | 2005 | - | 54,860 | 63,067 | 5,650 | 485 | 124,062 | |||||||||||||||||||
| Dragon Ball Z: Budokai Tenkaichi | Atari | October | 2005 | - | 535,385 | 332,122 | 60,007 | 4,014 | 931,528 | |||||||||||||||||||
| Dragon Ball Z: Shin Budokai | Atari | March | 2006 | - | - | 192,359 | 25,838 | 5,022 | 223,219 | |||||||||||||||||||
| Dragon Ball Z: Budokai Tenkaichi 2 | Atari | November | 2006 | - | - | 533,916 | 274,084 | 20,153 | 828,153 | |||||||||||||||||||
| Megaman Battle Team 5: Double Team | Capcom | June | 2005 | - | 29,819 | 24,131 | 1,677 | 132 | 55,759 | |||||||||||||||||||
| Megaman: Maverick Hunter X | Capcom | January | 2006 | - | - | 118,586 | 4,228 | 466 | 123,280 | |||||||||||||||||||
| Megaman ZX | Capcom | September | 2006 | - | - | 85,306 | 29,154 | 2,465 | 116,925 | |||||||||||||||||||
| Naruto: Clash of Ninja Revolution | D3Publisher | March | 2006 | - | - | 425,407 | 277,614 | 141,511 | 844,532 | |||||||||||||||||||
| Marvel Nemesis: Rise of the Imperfects | Electronic Arts | September | 2005 | - | 322,989 | 503,837 | 137,166 | 4,985 | 968,977 | |||||||||||||||||||
| Superman Returns | Electronic Arts | November | 2006 | - | - | 150,968 | 38,486 | 0 | 189,454 | |||||||||||||||||||
| Yu-Gi-Oh: Nightmare Troubadour | Konami | August | 2005 | - | 111,345 | 38,890 | 3,195 | 303 | 153,733 | |||||||||||||||||||
| Ghost in the Shell: Stand Alone Complex | Namco Bandai | October | 2005 | - | 24,909 | 32,850 | 4,283 | 415 | 62,457 | |||||||||||||||||||
| Pokemon Dash | Nintendo | March | 2005 | - | 175,193 | 25,383 | 5,547 | 1,208 | 207,331 | |||||||||||||||||||
| Pokemon XD: Gale of Darkness | Nintendo | October | 2005 | - | 381,058 | 174,981 | 82,615 | 0 | 638,654 | |||||||||||||||||||
| Pokemon Trozei | Nintendo | March | 2006 | - | - | 176,527 | 33,816 | 5,124 | 215,467 | |||||||||||||||||||
| Pokemon Ranger | Nintendo | October | 2006 | - | - | 522,294 | 445,178 | 64,845 | 1,032,317 | |||||||||||||||||||
| Pokemon Mystery Dungeon: Blue Team Rescue Team | Nintendo | September | 2006 | - | - | 808,695 | 267,112 | 30,010 | 1,105,817 | |||||||||||||||||||
| Pokemon Mystery Dungeon: Red Team Rescue Team | Nintendo | September | 2006 | - | - | 675,387 | 152,966 | 0 | 828,353 | |||||||||||||||||||
| Naruto: Ninja Council 2 | Tomy | October | 2006 | - | - | 6,061 | 6,504 | 618 | 13,183 | |||||||||||||||||||
Summary Statistics | ||||
Total Annual Unit Sales Volume (North America) | ||||
Count | 28 | |||
Min | 13,183 | |||
LQ | 123,867 | |||
Median | 371,969 | |||
Mean | 589,324 | |||
UQ | 832,398 | |||
Max | 3,777,358 | |||
Std Dev | 727,987 | |||
Mean + 2*Std Dev | 2,045,298 | |||
Mean - 2*Std Dev | (866,651 | ) | ||
CV | 1.24 | |||
Note:
1Annual Unit Sales Volume (North America) for 2008 includes data for the period of January through April.
Source:VGChartz, American Chart (Yearly). http://vgchartz.com/ayearly.php
SANLI PASTORE & HILL, INC.
141
Appendix H: The Process of Business Valuation and Diligence Procedures
The process of performing a business valuation and the necessary diligence procedures and information requirements for a business valuation are dictated by the professional standards by which a professional appraiser must abide. The following excerpts present relevant appraisal standards set forth by the American Society of Appraisers and the Appraisal Foundation in addition to factors to be considered in Internal Revenue ServiceRevenue Ruling 59-60.
American Society of Appraisers’Business Valuation Standards
BVS-I: General Requirements for Developing a Business Valuation
Section III — Information Collection and Analysis:
The appraiser shall gather, analyze, and adjust relevant information to perform the valuation as appropriate to the scope of work. Such information shall include the following:
A. | Characteristics of the business, business ownership interest or security to be valued including rights, privileges and conditions, quantity, factors affecting control and agreements restricting sale or transfer. |
B. | Nature, history, and outlook of the business. |
C. | Historical financial information for the business. |
D. | Assets and liabilities of the business. |
E. | Nature and conditions of the relevant industries which have an impact on the business. |
F. | Economic factors affecting the business. |
G. | Capital markets providing relevant information, e.g. available rates of return on alternative investments, relevant public stock transactions, and relevant mergers and acquisitions. |
H. | Prior transactions involving subject business, interest in subject business, or its securities. |
I. | Other information deemed by the appraiser to be relevant. |
The Appraisal Foundation’sUniform Standards of Professional Appraisal Practice
Standards Rule 9-4(b)
Collect and analyze relevant data regarding:
| (i) | the nature and history of the business; |
| (ii) | financial and economic conditions affecting the business enterprise, its industry, and the general economy; |
| (iii) | past results, current operations, and future prospects of the business enterprise; |
| (iv) | past sales of capital stock or other ownership interest in the business enterprise being appraised; |
| (v) | sales of similar businesses or capital stock of publicly held similar businesses; and |
| (vi) | prices, terms, and conditions affecting past sales of similar assets. |
142
Internal Revenue ServiceRevenue Ruling 59-60
Section 4. Factors to Consider.
.01 | It is advisable to emphasize that in the valuation of the stock of closely held corporation or the stock of corporations where market quotations are either lacking or too scarce to be recognized, all available financial data, as well as all relevant factors affecting the fair market value, should be considered. The following factors, although not all-inclusive are fundamental and require careful analysis in each case: |
(a) | The nature of the business and the history of the enterprise from its inception. |
(b) | The economic outlook in general and the condition and outlook of the specific industry in particular. |
(c) | The book value of the stock and the financial condition of the business. |
(d) | The earning capacity of the business. |
(e) | The dividend-paying capacity. |
(f) | Whether or not the enterprise has goodwill or other intangible value. |
(g) | Sales of the stock and the size of the block of stock to be valued. |
(h) | The market prices of stock of corporations engaged in the same or a similar line of business having their stocks actively traded in a free and open market, either on an exchange or over-the-counter. |
Based on the above standards, it is clear that the business valuation process includes the following:
| 1. | Analysis of business operations |
| 2. | Financial statement analysis |
| 3. | Projections of revenues and earnings based on reasonable expectations of future performance |
| 4. | Qualitative and quantitative industry analysis |
| 5. | Competition analysis |
| 6. | Economic analysis |
| 7. | Valuation analysis |
| 8. | Reach a conclusion of value |
143
APPRAISERS CERTIFICATION AND CONTINGENT AND LIMITING CONDITIONS
The appraisers whose signatures appear below certify that except as otherwise noted in this appraisal report and to the best of our knowledge and belief:
| 1. | The statements of fact contained in this report are true and correct to the best of SP&H and its staff members' knowledge and belief. No matters affecting the conclusions have been knowingly withheld or omitted. |
| 2. | The reported analyses, opinions, and conclusions are limited only by the reported assumptions and limiting conditions, and are our personal, unbiased professional analyses, opinions, and conclusions. |
| 3. | Our compensation for this appraisal is not contingent on an action or event resulting from the analyses, opinions, or conclusions in, or use of, this report. |
| 4. | Our analyses, opinions, and conclusions were developed, and this report has been prepared, in conformity with the Uniform Standards of Professional Appraisal Practice and the American Society of Appraisers’ Business Valuation Standards. |
| 5. | No one provided significant professional assistance to the persons signing this report. |
| 6. | No responsibility can be taken by SP&H for the inability of the owners to sell Platinum Studios, Inc., or any of its divisions or subsidiaries, or the Intellectual Property, or any other equity interest or other ownership interests at the appraised values. |
| 7. | This appraisal and its conclusions are subject to review upon presentation of data that is undisclosed or not available as of the date of this report. |
| 8. | No responsibility is assumed for matters legal in nature nor is any opinion rendered as to the title, which is assumed to be good. |
| 9. | The ownership information furnished to the appraisers is assumed to be correct. |
| 10. | The only liabilities and encumbrances against assets considered are those reflected on the financial statements provided. |
| 11. | The fee for this appraisal report does not contemplate appearance in court or before other governmental agencies as an expert witness. However, the appraiser will appear if prior arrangements are made. Expert witness testimony will be compensated for at the appraisers' professional fee rates. |
144
| 12. | Neither all nor any part of this report, particularly as to the conclusion and the identity of SP&H and its staff members, shall be conveyed to the public through advertising, public relations, news or other media without the prior written consent of SP&H. SP&H’s report is confidential and includes proprietary data that is the property of SP&H. Disclosure of any portion of SP&H’s report to unauthorized third parties, including competitors of SP&H or other consulting entities, can result in significant economic damages to SP&H. Client hereby agrees that SP&H’s report will not be disclosed to any third parties without SP&H’s expressed written consent. |
| 13. | Our opinion is necessarily based on economic, market, financial, and other conditions, as they exist, and on the information made available to us, as of the date of value, March 31, 2008. We reserve the right to amend our opinion if additional information is made available. |
| 14. | The business being valued is Platinum Studios, Inc. The purpose of this appraisal is to determine the fair market value and fair value of a 100% equity ownership in the Intellectual Property held and controlled by Platinum Studios, Inc. The function of the valuation is to provide information that may be used by management to raise additional capital for the Company. |
| 15. | The date of value utilized in our analysis is March 31, 2008. The use of a different date of value could substantially impact the opinions herein. |
Dated: June 12, 2008
 |  | |
| Nevin Sanli, ASA | Thomas E. Pastore, CFA, ASA | |
| President | Chief Executive Officer | |
| SANLI PASTORE & HILL, INC. | ||
| a California Corporation | a California Corporation |
145