Exhibit 99.1
StrategicStorageTrust
Update From the CEO
April 5, 2012
Hosted By
H. MICHAEL SCHWARTZ
Charman and CEO
Risk Factors and Other Information
Risk Factors
See page 18 of the prospectus for specific risks associated with this offering.
We are a “blind pool” because we have not identified any properties to acquire with the net proceeds from this offering. As a result, you will not be able to evaluate the economic
merits of our future investments prior to their purchase. We may be unable to invest the net proceeds from this offering on acceptable terms to investors, or at all.
As of September 30, 2011, our accumulated deficit was approximately $37.2 million, and we anticipate that our operations will not be profitable in 2011.
No public market currently exists for shares of our common stock and we may not list our shares on a national securities exchange before three to five years after completion of
this offering, if at all. It may be difficult to sell your shares. If you sell your shares, it will likely be at a substantial discount.
We have paid distributions from sources other than our cash flows from operations, including from the net proceeds from our initial public offering. We are not prohibited from undertaking such activities by our charter, bylaws or investment policies, and we may use an unlimited amount from any source to pay our distributions. Until we generate operating cash flows sufficient to pay distributions to you, we may pay distributions from the net proceeds of this offering or from borrowings in anticipation of future cash flows. We also may be required to sell assets or issue new securities for cash in order to pay distributions. Any such actons could reduce the amount of capital we ultimately invest in assets and negatively impact the amount of income available for future distributions.
We have no employees and must depend on our advisor to select investments and conduct our operations, and there is no guarantee that our advisor will devote adequate time or resources to us.
Our board of directors may change any of our investment objectives, including our focus on self storage facilities.
We will pay substantial fees and expenses to our advisor, its affiliates and participating broker-dealers, which will reduce cash available for investment and distribution. There are substantial conflicts of interest among us and our sponsor, advisor, property manager and dealer manager.
This is a “best efforts” offering. If we raise substantially less than the maximum offering, we may not be able to invest in a diverse portfolio of real estate and real estate-related investments, and the value of your investment may fluctuate more widely with the performance of specific investments. We may fail to remain qualified as a REIT, which could adversely affect our operations and our ability to make distributions.
We may incur substantial debt, which could hinder our ability to pay distributions to our stockholders or could decrease the value of your investment.
Future distribution declarations are at the sole discretion of our board of directors and are not guaranteed. Since our inception, our cumulative distributions have exceeded
cumulative GAAP earnings. We cannot assure you that we will achieve any of our investment objectives.
Otherjnformation
We encourage you to review our SEC filings at www.sec.gov.
An investment in our shares is not suitable for all investors. An investment in our shares involves significant risks and is only suitable for persons who have adequate financial means, desire a relatively long-term investment and will not need immediate liquidity from their investment. Investors should only purchase shares if they can afford a complete loss of their investment. Generally, a purchaser of shares must have, excluding the value of a purchaser’s home, furnishings and automobiles, either:
| | • | | a net worth of at least $250,000: or |
| | • | | a gross annual income of at least $70,000 and a net worth of at least $70,000. |
Please see the prospectus for a full description of suitability standards. Residents of Alabama, Iowa, Kansas, Kentucky, Massachusetts, Michigan, Missouri, North Dakota, Ohio, Oregon, Pennsylvania and Tennessee should consult the prospectus for details regarding the more stringent suitability standards that apply to them based on their states of residence.
Disclaimer
CAUTIONARY NOTE REGARDING FORWARD-LOOKING STATEMENTS
Certain statements contained in this material, other than historical facts, may be considered forward-looking statements within the meaning of Section 27A of the Securities Act of 1933, as amended (the “Securities Act”) and Section 21E of the Securities Exchange Act of 1934, as amended (the “Exchange Act”). We intend for all such forward looking statements to be covered by the applicable safe harbor provisions for forward-looking statements contained in Section 27A of the Securities Act and Section 21E of the Exchange Act, as applicable. Such statements include, in particular, statements about our plans, strategies, and prospects and are subject to certain risks and uncertainties, including known and unknown risks, which could cause actual results to differ materially from those projected or anticipated. Therefore, such statements are not intended to be a guarantee of our performance in future periods. Such forward-looking statements can generally be identified by our use of forward-looking terminology such as “may,” “will,” “expect,” “intend,” “anticipate,” “estimate,” “believe,” “continue,” or other similar words. Readers are cautioned not to place undue reliance on these forward-looking statements, which speak only as of the date this report is filed with the Securities and Exchange Commission. We cannot guarantee the accuracy of any such forward looking statements contained in this material, and we do not intend to publicly update or revise any forward-looking statements, whether as a result of new information, future events, or otherwise.
Any such forward-looking statements are subject to risks, uncertainties, and other factors and are based on a number of assumptions involving judgments with respect to, among other things, future economic, competitive, and market conditions, all of which are difficult or impossible to predict accurately. To the extent that our assumptions differ from actual results, our ability to meet such forward-looking statements, including our ability to generate positive cash flow from operations and provide distributions to stockholders, and our ability to find suitable investment properties, may be significantly hindered.
All forward-looking statements should be read in light of the risks identified in our prospectus and supplements.
Strategic Storage Trust, Inc.
About Us
First and only publicly registered non-traded REIT focused on self storage
Sponsor was ranked 8th in Mini-Storage Messenger’s Top Operators List in 2011
As of 12/31/11, SSTI wholly owns 91 properties in 17 states and Ontario, Canada with approximately 60,140 units and approximately 7.5 million rentable square feet
Closed approximately $245 Million in acquisitions in 2011
Agenda
Net Asset Value Per Share
Modified Funds From Operations
Financial Update
Portfolio Growth
Branding
Strategic Vision
Net Asset Value Per Share
Independent Valuation
Methodology
Limitations of Estimated Value Per Share

Agenda
Net Asset Value per Share
Modified Funds From Operations
Financial Update
Portfolio Growth
Branding
Strategic Vision
Where MFFO Comes From
MFFO VALUE
Modified Funds From Operations
Agenda
Net Asset Value Per Share
Modified Funds From Operations
Financial Update
Porfolio Growth
Branding
Strategic Vision
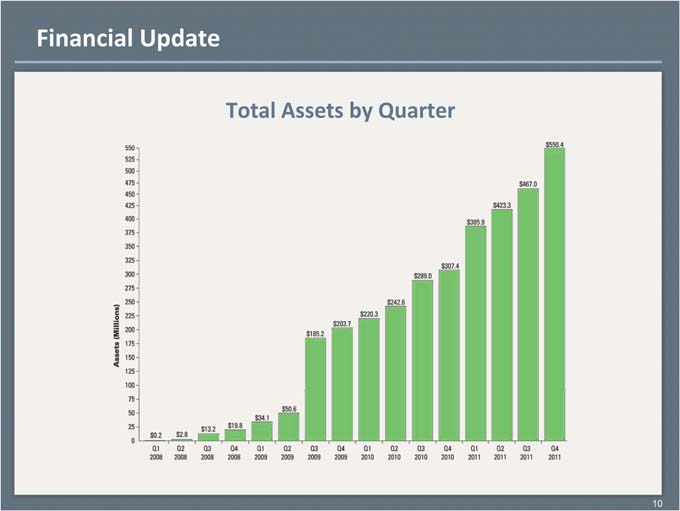
Financial Update
Total Assets by Quarter
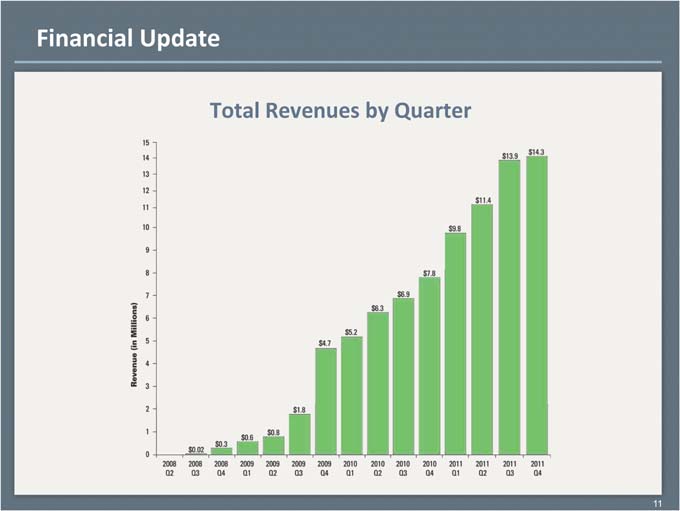
Financial Update
Total Revenues by Quarter
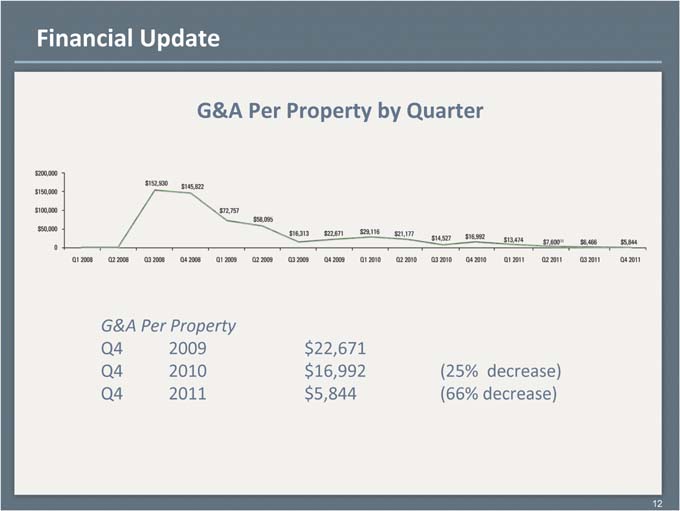
Financial Update
G&A Per Property by Quarter
G&A Per Property
Q4 2009 $22,671
Q4 2010 $16,992 (25% decrease)
Q4 2011 $5,844 (66% decrease

Agenda
Net Asset Value Per Share
Modified Funds From Operations
Financial Update
Portfolio Growth
Branding
Strategic Vision
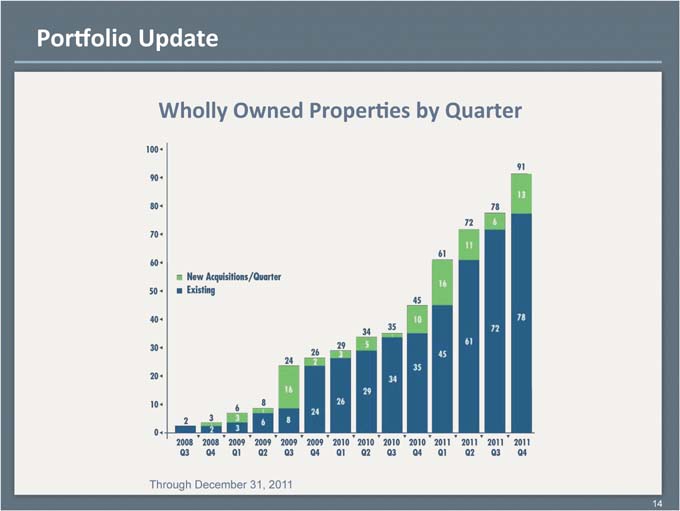
Portfolio Update
Wholly Owned Properties by Quarter
Through December 31, 2011
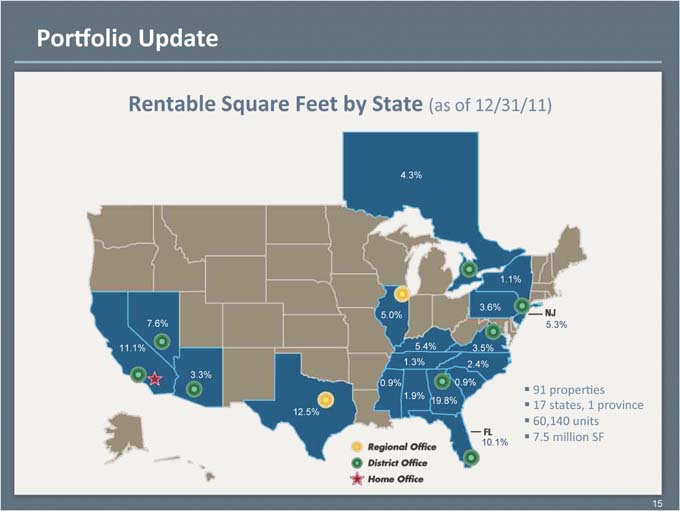
Porfolio Update
Rentable Square Feet by State (as of 12/31/11
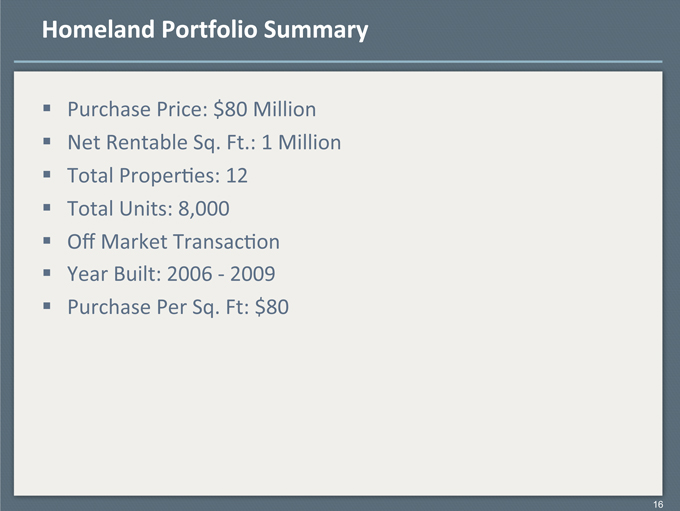
? Homeland Portfolio Summary
? Purchase Price: $80 Million
? Net Rentable Sq. Ft.: 1 Million
? Total Properties: 12
? Total Units: 8,000
? Off Market Transaction
? Year Built: 2006—2009
? Purchase Per Sq. Ft: $80
16
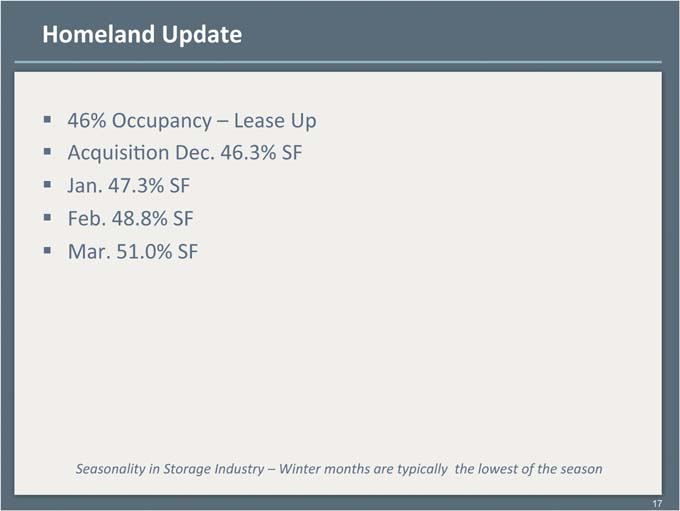
Homeland Update
? 46% Occupancy—Lease Up
? Acquisition Dec. 46.3% SF
? Jan. 47.3% SF
? Feb. 48.8% SF
? Mar. 51.0% SF
Seasonality in Storage Industry—Winter months are typically the lowest of the season
17

Agenda
Net Asset Value Per Share
Modified Funds From Operations
Financial Update
Portfolio Growth
Branding
Strategic Vision
Branding Update
The POWER of the Brand
Branding Update
Market Clusters Internet Marketing Advanced Strategies

Agenda
Net Asset Value Per Share
Modified Funds From Operations
Financial Update
Porfolio Growth
Branding
Strategic Vision
Strategic Vision
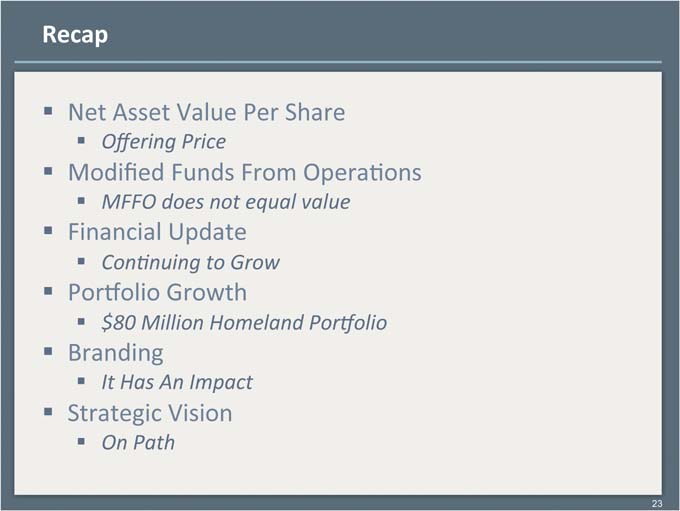
Recap
“ Net Ass#t Value Per Share
? Offering Price
? Modified Funds From Operations
? MFFO does not equal value
? Financial Update
? Continuing to Grow
? Portfolio Growth
? $80 Million Homeland Portfolio
? Branding
? It Has An Impact
? Strategic Vision
? On Path
23
StrategicStorageTrust
Financial Professionals
877-327-3485
Investment Information
Strategicstroragetrust.com
Self Storage Rentals
Smartstopselfstorages.com
Select Capital Corptration (Mumber Finra and Sipc)
Dealer Manager for SSTI
866.699.5338