UNITED STATES
SECURITIES AND EXCHANGE COMMISSION
WASHINGTON, D.C. 20549
FORM 10-K
(Mark One)
| x | ANNUAL REPORT PURSUANT TO SECTION 13 OR 15(d) OF THE SECURITIES EXCHANGE ACT OF 1934 |
For the fiscal year ended December 31, 2012
OR
| ¨ | TRANSITION REPORT PURSUANT TO SECTION 13 OR 15(d) OF THE SECURITIES EXCHANGE ACT OF 1934 |
For the transition period from to
Commission File Number: 000-53644
Strategic Storage Trust, Inc.
(Exact name of Registrant as specified in its charter)
| | |
| Maryland | | 32-0211624 |
(State or other jurisdiction of incorporation or organization) | | (IRS Employer Identification No.) |
111 Corporate Drive, Suite 120, Ladera Ranch,
California 92694
(Address of principal executive offices)
(877) 327-3485
(Registrant’s telephone number)
Securities registered pursuant to Section 12(b) of the Act:
| | |
Title of Each Class | | Name of Each Exchange on Which Registered |
| None | | None |
Securities registered pursuant to Section 12(g) of the Act:
Common Stock, $0.001 par value per share
Indicate by check mark if the registrant is a well-known seasoned issuer, as defined in Rule 405 of the Securities Act. Yes ¨ No x
Indicate by check mark if the registrant is not required to file reports pursuant to Section 13 or Section 15(d) of the Act. Yes ¨ No x
Indicate by check mark whether the registrant (1) has filed all reports required to be filed by Section 13 or 15(d) of the Securities Exchange Act of 1934 during the preceding 12 months (or for such shorter period that the registrant was required to file such reports) and (2) has been subject to such filing requirements for the past 90 days. Yes x No ¨
Indicate by check mark whether the registrant has submitted electronically and posted on its corporate Web site, if any, every Interactive Data File required to be submitted and posted pursuant to Rule 405 of Regulation S-T (§ 232.405 of this chapter) during the preceding 12 months (or for such shorter period that the registrant was required to submit and post such files). Yes x No ¨
Indicate by check mark if disclosure of delinquent filers pursuant to Item 405 of Regulation S-K is not contained herein, and will not be contained, to the best of registrant’s knowledge, in definitive proxy or information statements incorporated by reference in Part III of the Form 10-K or any amendment of this Form 10-K. x
Indicate by check mark whether the registrant is a large accelerated filer, an accelerated filer, a non-accelerated filer or a smaller reporting company. See definitions of “large accelerated filer”, “accelerated filer” and “smaller reporting company” in Rule 12b-2 of the Exchange Act. (Check one):
| | | | | | |
| Large Accelerated Filer | | ¨ | | Accelerated Filer | | ¨ |
| Non-Accelerated Filer | | x (Do not check if a smaller reporting company) | | Smaller reporting company | | ¨ |
Indicate by check mark whether the registrant is a shell company (as defined in Rule 12b-2 of the Exchange Act). Yes ¨ No x
The aggregate market value of voting common stock held by non-affiliates was approximately $467,000,000 assuming a market value of $10.79 per share, as of June 30, 2012.
As of March 21, 2013, there were 47,235,295 outstanding shares of common stock of the registrant.
Documents Incorporated by Reference:
Registrant incorporates by reference in Part III (Items 10, 11, 12, 13 and 14) of this Form 10-K portions of its Definitive Proxy Statement for the 2013 Annual Meeting of Stockholders.
TABLE OF CONTENTS
CAUTIONARY NOTE REGARDING FORWARD-LOOKING STATEMENTS
Certain statements contained in this Form 10-K of Strategic Storage Trust, Inc., other than historical facts, may be considered forward-looking statements within the meaning of Section 27A of the Securities Act of 1933, as amended (the “Securities Act”) and Section 21E of the Securities Exchange Act of 1934, as amended (the “Exchange Act”). We intend for all such forward-looking statements to be covered by the applicable safe harbor provisions for forward-looking statements contained in Section 27A of the Securities Act and Section 21E of the Exchange Act, as applicable. Such statements include, in particular, statements about our plans, strategies, and prospects and are subject to certain risks and uncertainties, including known and unknown risks, which could cause actual results to differ materially from those projected or anticipated. Therefore, such statements are not intended to be a guarantee of our performance in future periods. Such forward-looking statements can generally be identified by our use of forward-looking terminology such as “may,” “will,” “expect,” “intend,” “anticipate,” “estimate,” “believe,” “continue,” or other similar words. Readers are cautioned not to place undue reliance on these forward-looking statements, which speak only as of the date this report is filed with the Securities and Exchange Commission. We cannot guarantee the accuracy of any such forward-looking statements contained in this Form 10-K, and we do not intend to publicly update or revise any forward-looking statements, whether as a result of new information, future events, or otherwise.
Any such forward-looking statements are subject to risks, uncertainties, and other factors and are based on a number of assumptions involving judgments with respect to, among other things, future economic, competitive, and market conditions, all of which are difficult or impossible to predict accurately. To the extent that our assumptions differ from actual results, our ability to meet such forward-looking statements, including our ability to generate positive cash flow from operations and provide distributions to stockholders, and our ability to find suitable investment properties, may be significantly hindered.
All forward-looking statements should be read in light of the risks identified in Part I, Item 1A of this Form 10-K.
1
PART I
Overview
Strategic Storage Trust, Inc., a Maryland corporation (the “Company”), was formed on August 14, 2007 for the purpose of engaging in the business of investing in self storage facilities. The Company made an election to be taxed as a real estate investment trust (“REIT”) beginning with the taxable year ended December 31, 2008. As used in this report, “we” “us” and “our” refer to Strategic Storage Trust, Inc.
Strategic Capital Holdings, LLC (our “Sponsor”), is the sponsor of our Offering (as defined below). Our Sponsor was formed on July 21, 2004 to engage in private structured offerings of limited partnerships and other entities with respect to the acquisition, management and disposition of commercial real estate assets. Our Sponsor owns a majority of Strategic Storage Holdings, LLC, which is the sole member of our advisor, Strategic Storage Advisor, LLC (our “Advisor”), and our property manager, Strategic Storage Property Management, LLC (our “Property Manager”). We have no paid employees. Our Advisor is responsible for managing our affairs on a day-to-day basis and identifying and making acquisitions and investments on our behalf under the terms of an advisory agreement with our Advisor. Our Advisor was formed on August 13, 2007. See Note 1 of the Notes to the Consolidated Financial Statements contained in this report for further details about our affiliates.
On March 17, 2008, we began our initial public offering of common stock (our “Initial Offering”). On May 22, 2008, we satisfied the minimum offering requirements of the Initial Offering and commenced formal operations. On September 16, 2011, we terminated the Initial Offering, having sold approximately 29 million shares for gross proceeds of approximately $289 million. On September 22, 2011, we commenced our follow-on public offering of stock for a maximum of 110,000,000 shares of common stock, consisting of 100,000,000 shares for sale to the public (our “Primary Offering”) and 10,000,000 shares for sale pursuant to our distribution reinvestment plan (collectively, our “Offering”). We intend to invest a substantial amount of the net proceeds from our Offering in self storage facilities and related self storage real estate investments. Based on the current expiration date of our Offering on September 22, 2013, and our current sales pace, which our board of directors believes should allow us to raise sufficient capital to move to the next phase of our life cycle, our board of directors approved closing our Offering within the original two year offering period. We currently expect to close our Offering on or around September 22, 2013, although the board of directors has reserved its right to close the Offering prior to that date if the board of directors deems it appropriate. Our board may also extend our Offering for an additional year, or in certain circumstances, longer. We currently plan to continue to offer shares under our distribution reinvestment plan beyond the above date; however, we may terminate the distribution reinvestment plan offering at any time. As of December 31, 2012, we had issued approximately 42.7 million shares of common stock for approximately $426 million in our Initial Offering and our Offering and also issued 6.2 million shares in a private offering. As of December 31, 2012, we had approximately 46.2 million shares issued and outstanding.
Effective June 1, 2012, the offering price of our shares of common stock increased from $10.00 per share to $10.79 per share. This increase was primarily based on the April 2, 2012 estimated per share value of our common stock of $10.79 which was calculated based on the estimated value of our assets less the estimated value of our liabilities, or net asset value, divided by the number of shares outstanding on an adjusted fully diluted basis, calculated as of December 31, 2011. In light of the above-described net asset value calculation, our board of directors determined that it was appropriate to increase the per share offering price for new purchases of our shares commencing on June 1, 2012. This determination by our board of directors was subjective and was primarily based on (i) the estimated net asset value per share, which was predominantly based on an independent third party appraiser’s valuation of our properties as of December 31, 2011, (ii) the commissions and dealer manager fees payable in connection with the offering of our shares, (iii) our historical and anticipated results of operations and financial condition, (iv) our current and anticipated distribution payments, (v) our current and anticipated capital and debt structure, and (vi) our Advisor’s recommendations and assessment of our prospects and continued execution of our investment and operating strategies.
2
As of December 31, 2012, we wholly-owned 110 self storage facilities located in 17 states (Alabama, Arizona, California, Florida, Georgia, Illinois, Kentucky, Mississippi, Nevada, New Jersey, New York, North Carolina, Pennsylvania, South Carolina, Tennessee, Texas and Virginia) and Canada comprising approximately 70,190 units and approximately 9.2 million rentable square feet. As of December 31, 2012, we also had minority interests in eight additional self storage facilities. Of those interests, one has been deemed to be a controlling interest and is therefore consolidated in our consolidated financial statements as discussed in Note 2. Additionally, we have an interest in a net leased industrial property in California with 356,000 rentable square feet leased to a single tenant. While our properties are branded under the “SmartStop® Self Storage” brand, we do not own or control this brand. Strategic Storage Holdings, LLC, the parent company of our Advisor and Property Manager, owns and controls the intellectual property rights to the “SmartStop® Self Storage” brand, the websitewww.smartstopselfstorage.com and other intellectual property currently being used by us in connection with our self storage properties. We are currently authorized to use this brand and other intellectual property pursuant to a license. In the event that we ever cease to operate under this brand, which has garnered substantial value due to its goodwill and reputation associated therewith, we may lose market share and customers, and we could incur significant costs to change the signage and otherwise change our brand.
Industry Summary
“Self storage” refers to properties that offer do-it-yourself, month-to-month storage space rental for personal or business use. Self storage offers a cost-effective and flexible storage alternative. Tenants rent fully-enclosed spaces or parking spaces that can vary in size according to their specific needs and to which they have unlimited, exclusive access. Tenants have responsibility for moving their items into and out of their units. Self storage unit sizes typically range from five feet by five feet to 10 feet by 30 feet.
Self storage provides a convenient way for individuals and businesses to store their possessions, whether due to a life change or simply because of a need for additional storage space. According to the 2012 Self Storage Almanac, self storage facilities generally have a tenant mix of approximately 75% residential, 19% commercial, 3% military and 3% students. The mix of residential tenants using a self storage property is determined by a property’s local demographics and often includes people who are looking to downsize their living space or who are not yet settled in a large home. The items residential tenants place in self storage properties range from cars, boats and recreational vehicles to furniture, household items and appliances. Commercial tenants tend to include small business owners who require easy and frequent access to their goods, records or extra inventory, or storage for seasonal goods. Self storage properties provide an accessible storage alternative at a relatively low cost. Properties generally have on-site managers who supervise and run the day-to-day operations, providing tenants with assistance as needed. The six key demand drivers of self storage are: (1) population growth; (2) percentage of renter-occupied housing units; (3) average household size; (4) average household income; (5) supply constraints; and (6) economic growth. Tenants choose a self storage property based largely on the convenience of the site to their home or business. Therefore, high-density, high-traffic population centers are ideal locations for a self storage property. A property’s perceived security and the general professionalism of the site managers and staff are also contributing factors to a site’s ability to secure rentals. Although most self storage properties are leased to tenants on a month-to-month basis, tenants tend to continue their leases for extended periods of time. However, there are seasonal fluctuations in occupancy rates for self storage properties. Generally, there is increased leasing activity at self storage properties during the summer months due to the higher number of people who relocate during this period.
As population densities have increased in the U.S., there has been an increase in self storage awareness and development. According to the Self Storage Association’s Self Storage Industry Fact Sheet (June 2012):
| | • | | at year-end 1984 there were 6,601 facilities with 289.7 million square feet of rentable self storage in the U.S. At year-end 2011 there were approximately 49,940 “primary” self storage facilities in the U.S. representing approximately 2.3 billion square feet; |
| | • | | at year end 2011 there were approximately 58,500 self storage facilities worldwide including more than 3,000 self storage facilities in Canada; |
3
| | • | | the top five self storage companies own and operate just 9.8% of all “primary” facilities; |
| | • | | 75% of all self storage companies own and operate just one “primary” self storage facility; and |
| | • | | it took the self storage industry more than 25 years to build its first billion square feet of space; it added the second billion square feet in just eight years (1998-2005). |
The growth in the industry has created more competition in various geographic regions. This has led to an increased emphasis on site location, property design, innovation and functionality to accommodate local planning and zoning boards and to distinguish a facility from other offerings in the market. This is especially true for new sites slated for high-density population centers.
Recently, self storage operators have placed increased emphasis on offering ancillary products which provide incremental revenues. Moving and packing supplies, such as locks and boxes, and the offering of other services, such as tenant insurance, truck rentals, help to increase revenues. As more sophisticated self storage operators continue to develop innovative products and services such as online rentals, 24-hour accessibility, automated kiosk rentals, climate-controlled storage, wine storage, tenant-service call center access and after-hours storage, local operators may be increasingly unable to meet higher tenant expectations, which could encourage consolidation in the industry.
We expect the “baby boomer” generation to have a major impact on the future of the self storage industry. During the 19-year period from 1946 to 1964, approximately 77 million babies, or “baby boomers,” were born in the U.S. According to the U.S. Census Bureau, “baby boomers” make up nearly 27% of the U.S. population. These “baby boomers” are heading towards retirement age and have accumulated possessions which they wish to retain. As the “baby boomers” move into retirement age and begin to downsize their households, we believe there will be a great need for self storage facilities to assist them in protecting and housing these possessions for prolonged periods of time.
We also believe that the self storage industry possesses attractive characteristics not found in other commercial real estate sectors, including the following:
| | • | | no reliance on a “single large tenant” whose vacating can have a devastating impact on rental revenue; |
| | • | | no leasing commissions and/or tenant improvements; |
| | • | | relatively low capital expenditures; |
| | • | | brand names can be developed at local, regional and even national levels; |
| | • | | opportunity for a great deal of geographic diversification, which could enhance the stability and predictability of cash flows; and |
| | • | | the lowest loan default rate of any commercial property type. |
Business Overview
Unlike many other REITs and real estate companies, we are an operating business. We acquire, develop, redevelop, own, operate and manage self storage facilities. Our self storage facilities offer inexpensive, easily accessible, enclosed storage space or parking space to residential and commercial users on a month-to-month basis. Most of our facilities are fenced with computerized gates and are well lighted. Many of our properties are single-story, thereby providing customers with the convenience of direct vehicle access to their storage spaces. At certain facilities, we offer climate-controlled units that generally offer heating in the winter and cooling in the summer. Many of our facilities also offer outside vehicle, boat and recreational vehicle storage areas. Our facilities generally are constructed of masonry or steel walls resting on concrete slabs and have standing seam metal, shingle, or tar and gravel roofs. Customers have access to their storage units from 6:00AM – 10:00PM
4
(365 days per year), and some of our facilities provide 24-hour access. Individual storage spaces are secured by a lock furnished by the customer to provide the customer with control of access to the space. Our facilities range in size from approximately 21,700 to approximately 311,800 net rentable square feet, with an average of approximately 84,000 net rentable square feet.
As an operating business, self storage requires a much greater focus on strategic and operational management. Below are some of the strategies and tactics we are utilizing to grow a diversified portfolio of self storage facilities that we believe will maximize cash available for distributions and potential for appreciation in the value of our properties over the long term.
Initial Growth and Branding Stage.
Since our inception, we have been focused on building a diversified portfolio of self storage facilities. As of December 31, 2012, we had acquired 110 facilities in 17 states and Canada. We have been branding our facilities under the “SmartStop® Self Storage” brand. We utilize a call center which focuses on generating reservations and assisting customers with their current storage accounts, such as taking payments or answering general questions. Additionally, we developed a customer-friendly and mobile phone-friendly self storage website,www.smartstopselfstorage.com, which allows potential self storage customers to locate available units at any of our properties, and our SmartTracker Inventory ListSM App, which allows customers to organize and track the contents of their self storage units via their iPhone or Android device. We believe that the implementation of these and other branding and marketing initiatives will enhance brand awareness and drive revenue growth in the future.
Focus on Increasing Revenue and Creating Greater Efficiencies.
We continue to place a significant amount of focus on revenue generation opportunities at our self storage facilities and capitalizing on economies of scale from our growing portfolio. Below are a few of the specific measures we have taken to improve our operating performance at our existing facilities:
| | • | | Standardized Sales Processes.We have put forth a standardized sales approach so that the rental experience is consistent at each of our facilities. All employees are trained in our sales approach and techniques that facilitate the generation of business. |
| | • | | Integrated Marketing Strategy.We have developed an integrated marketing strategy for our online, phone and walk-in customers, which includes our customer-friendly and mobile-friendly self storage website, allowing potential customers to locate available units at any of our properties. Also, our web marketing tools, pay-per-click campaign (to generate leads and improve brand recognition), search engine optimization process to obtain a dominant position in browser listings and our social media campaigns provide us with a technological edge over competitors. |
| | • | | Facility Monitoring Activities. We are seeking to increase revenue and net operating income at each of our facilities by (i) closely monitoring call volume, reservation activity and occupancy in relation to our marketing activities, (ii) analyzing market supply and demand factors, as well as occupancy trends, in setting rental rates, promotional discounts and target marketing initiatives, (iii) continuous refinement of our algorithms that manage our rental rate increases to existing customers at our self storage facilities (“Revenue Optimization System”), and (iv) closely managing our controllable operating costs. |
| | • | | Revenue Optimization System.We utilize a Revenue Optimization System (“ROS”) which allows us to analyze every unit at every property individually and manage our available unit inventory through a sophisticated system of algorithms which automatically triggers pricing adjustments. This system allows us to instantly respond to market demand and maximize revenues. |
| | • | | Creating Operational Efficiencies. As we continue to grow our portfolio of self storage facilities, we will be able to consolidate and streamline a number of aspects of our operations through economies of |
5
| | scale. For example, as a result of our size and geographic diversification, as well as our institution of a blanket property and casualty insurance program over all of our properties nationwide, we have reduced our total insurance costs per property. We are also negotiating national contracts and rates with other key vendors and service providers. Additionally, we have implemented a labor scheduling model that takes a standardized approach to staffing our facilities. This allows us to better manage our labor hours and better predict our labor costs. To the extent we can continue to acquire facilities in clusters within geographic regions, we believe efficiencies will continue to improve. |
| | • | | Increasing Focus on Ancillary Revenue. We are increasing our focus on certain ancillary revenue opportunities. We have increased the emphasis on selling our customers tenant insurance to protect their belongings against loss or damage. We offer a wide assortment of packing and moving supplies that a customer would need to properly protect their items while in storage. We have implemented a standardized approach on how to sell these items to our customers as well. Additionally, we have national truck rental contracts with Penske and Budget to assist customers with their move. Furthermore, we have added the capability for customers to purchase boxes, locks and packing supplies online through our website. Users of this service pick up the supplies at their nearest SmartStop® facility, which increases revenue and increases the likelihood of such customers becoming self storage customers at one of our facilities. |
Growth Opportunities.
While our primary focus is on acquiring stabilized self storage facilities that contribute to net cash flow, we have acquired a number of facilities that are either in the lease-up or development stage. By purchasing facilities that are still in the lease-up stage, we believe we can enhance stockholder value through the leasing efforts of our Property Manager and efficiencies created by our brand, website and other marketing efforts. Due to a lack of new supply in certain markets, we believe we can also create long-term stockholder value by developing or redeveloping certain self storage facilities.
Investment Objectives
Overview
We will invest a substantial amount of the net proceeds of the Offering in self storage facilities and related self storage real estate investments. In the event we raise the maximum offering from our Primary Offering, we anticipate that approximately 88.25% of our gross offering proceeds will be used to primarily make investments in self storage facilities and related self storage real estate investments and pay real estate-related acquisition fees and acquisition expenses, while the remaining 11.75% will be used to pay sales commissions, dealer manager fees and other offering expenses. We may also use net offering proceeds to pay down debt or make distributions if our cash flows from operations are insufficient. Our investment objectives, strategy and policies may be amended or changed at any time by our board of directors. Although we have no plans at this time to change any of our investment objectives, our board of directors may change any and all such investment objectives, including our focus on self storage facilities, if our board believes such changes are in the best interests of our stockholders. In addition, we may invest in real estate properties other than self storage facilities if our board deems such investments to be in the best interests of our stockholders. We cannot assure our stockholders that our policies or investment objectives will be attained or that the value of our common stock will not decrease.
Primary Investment Objectives
Our primary investment objectives are to:
| | • | | invest in income-producing real property in a manner that allows us to qualify as a REIT for federal income tax purposes; |
| | • | | provide regular cash distributions to our stockholders; |
6
| | • | | preserve and protect our stockholders’ invested capital; and |
| | • | | achieve appreciation in the value of our properties over the long term. |
We cannot assure our stockholders that we will attain these primary investment objectives.
Exchange Listing and Other Liquidity Events
Our board will determine when, and if, to apply to have our shares of common stock listed for trading on a national securities exchange subject to satisfying then-existing applicable listing requirements. Subject to then-existing market conditions and the sole discretion of our board of directors, we intend to seek one or more of the following liquidity events within three to five years after completion of the Offering:
| | • | | list our shares on a national securities exchange; |
| | • | | merge, reorganize or otherwise transfer our company or its assets to another entity with listed securities; |
| | • | | commence the sale of all of our properties and liquidate our company; or |
| | • | | otherwise create a liquidity event for our stockholders. |
However, we cannot assure our stockholders that we will achieve one or more of the above-described liquidity events within the time frame contemplated or at all. This time frame represents our best faith estimate of the time necessary to build a portfolio sufficient enough to effectuate one of the liquidity events listed above. Our board of directors has the sole discretion to continue operations beyond five years after completion of the Offering if it deems such continuation to be in the best interests of our stockholders. Even if we do accomplish one or more of these liquidity events, we cannot guarantee that a public market will develop for the securities listed or that such securities will trade at a price higher than what our stockholders paid for their shares in our Offering. At the time it becomes necessary for our board of directors to determine which liquidity event, if any, is in the best interests of us and our stockholders, we expect that the board will take all relevant factors at that time into consideration when making a liquidity event decision. We expect that the board will consider various factors including, but not limited to, costs and expenses related to each possible liquidity event and the potential subordinated fees or other consideration that would be paid to our Advisor.
Our Self Storage Acquisition Strategy
We will focus on the acquisition, ownership, operation and development of self storage facilities and activities relating to this type of property. Self storage refers to properties that offer do-it-yourself, month-to-month storage space rental for personal or business use. According to the Self Storage Association’s Self Storage Industry Fact Sheet, the self storage industry in the United States consists of approximately 2.3 billion rentable square feet at approximately 49,940 facilities (where self storage is the primary source of revenue). The industry is highly fragmented, comprised mainly of local operators and a few national owners and operators, including, we believe, only four publicly traded self storage REITs. We believe the following factors will allow us to achieve market penetration, name recognition and national brand awareness and loyalty in the self storage industry, which will result in greater economies of scale:
| | • | | the size and diversification of our self storage portfolio, which, as of December 31, 2012, consisted of 110 properties in 17 states and Canada with approximately 70,190 units and approximately 9.2 million square feet; |
| | • | | the management team of our Advisor and Property Manager which, in addition to our executive officers, includes regional and district property management professionals and on-site property management personnel; |
| | • | | our self storage branding strategy whereby we intend to re-brand every self storage facility we acquire under the “SmartStop® Self Storage” brand and our call center which provides access to information regarding our self storage facilities; and |
7
| | • | | our integrated marketing strategy for our online, phone and walk-in customers, which includes our customer-friendly and mobile-friendly self storage website, allowing potential customers to locate available units at any of our properties. Also, our web marketing tools, pay-per-click campaign (to generate leads and improve brand recognition), search engine optimization process to obtain a dominant position in browser listings and our social media campaigns provide us with a technological edge over competitors. |
We intend to focus on pursuing acquisitions of self storage facilities in markets with varying economic and demographic characteristics, including large urban cities, densely populated suburban cities and smaller rural cities, as long as the property meets our acquisition criteria. We also intend to expand and develop certain facilities we purchase in order to capitalize on underutilization and excess demand. The development of certain facilities we purchase may include an expansion of the self storage units or the services and ancillary products offered as well as making units available for office space. However, future investments will not be limited to any geographic area, to a type of facility or to a specified percentage of our total assets. We may invest a portion of the net proceeds we raise in self storage facilities outside the United States. We will strategically invest in specific domestic or foreign markets when opportunities that meet our investment criteria are available. In general, when evaluating potential acquisitions of self storage facilities, the primary factor we will consider is the property’s current and projected cash flow.
General Acquisition and Investment Policies
While we intend to focus our investment strategy on self storage facilities and related self storage real estate investments, we may invest in other storage-related investments such as storage facilities for automobiles, recreation vehicles and boats. We may additionally invest in other types of commercial real estate properties if our board of directors deems appropriate; however, we have no current intention of investing more than 20% of the net proceeds of the Offering in such other commercial real estate properties. We will seek to make investments that will satisfy the primary investment objective of providing regular cash distributions to our stockholders. However, because a significant factor in the valuation of income-producing real property is its potential for future appreciation, we anticipate that some properties we acquire may have the potential for both growth in value and for providing regular cash distributions to our stockholders. As a secondary focus, in an effort to maximize stockholder value, we have also acquired, and may continue to acquire, value-added properties in lease-up stage, as well as development properties. We believe that this strategy will benefit the overall composition of our portfolio in the future.
Our Advisor will have substantial discretion with respect to the selection of specific properties. However, each acquisition will be approved by our board of directors. The consideration paid for a property will ordinarily be based on the fair market value of the property as determined by a majority of our board of directors. In selecting a potential property for acquisition, we and our Advisor will consider a number of factors, including, but not limited to, the following:
| | • | | projected demand for self storage facilities in the area; |
| | • | | a property’s geographic location and type; |
| | • | | a property’s physical location in relation to population density, traffic counts and access; |
| | • | | construction quality and condition; |
| | • | | potential for capital appreciation; |
| | • | | proposed purchase price, terms and conditions; |
| | • | | historical financial performance; |
| | • | | rental rates and occupancy levels for the property and competing properties in the area; |
| | • | | potential for rent increases; |
8
| | • | | demographics of the area; |
| | • | | operating expenses being incurred and expected to be incurred, including, but not limited to property taxes and insurance costs; |
| | • | | potential capital improvements and reserves required to maintain the property; |
| | • | | prospects for liquidity through sale, financing or refinancing of the property; |
| | • | | potential competitors for expanding the physical layout of the property; |
| | • | | the potential for the construction of new properties in the area; |
| | • | | treatment under applicable federal, state and local tax and other laws and regulations; |
| | • | | evaluation of title and obtaining of satisfactory title insurance; and |
| | • | | evaluation of any reasonably ascertainable risks such as environmental contamination. |
There is no limitation on the number, size or type of properties that we may acquire or on the percentage of net offering proceeds that may be invested in any particular property type or single property. The number and mix of properties will depend upon real estate market conditions and other circumstances existing at the time of acquisition and the amount of proceeds raised in the Offering. In determining whether to purchase a particular property, we may obtain an option on such property. The amount paid for an option, if any, is normally surrendered if the property is not purchased and may or may not be credited against the purchase price if the property is ultimately purchased.
Our Borrowing Strategy and Policies
Although we intend to use low leverage (50% or less) to make our investments during the Offering, at certain times during the Offering, including the present, our debt leverage levels may be temporarily higher as we acquire properties in advance of funds being raised in the Offering. At the current time, the debt markets are attractive, and our board believes that a higher debt leverage in these markets is beneficial to our long-term interests. Our board of directors will regularly monitor our investment pipeline in relation to our projected fundraising efforts and otherwise evaluate market conditions related to our debt leverage ratios throughout the Offering. As of December 31, 2012, our book value based debt leverage was approximately 56% (leverage as of December 31, 2012 calculated based on gross asset value was approximately 51%).
We may incur our indebtedness in the form of bank borrowings, purchase money obligations to the sellers of properties and publicly—or privately-placed debt instruments or financing from institutional investors or other lenders. We may obtain a credit facility or separate loans for each acquisition. Our indebtedness may be unsecured or may be secured by mortgages or other interests in our properties. We may use borrowing proceeds to finance acquisitions of new properties, to pay for capital improvements, repairs or buildouts, to refinance existing indebtedness, to pay distributions, to fund redemptions of our shares or to provide working capital.
There is no limitation on the amount we can borrow for the purchase of any property. Our aggregate borrowings, secured and unsecured, must be reasonable in relation to our net assets and must be reviewed by our board of directors at least quarterly. Our charter limits our borrowing to 300% of our net assets, as defined (approximately 75% of the cost basis of our assets), unless any excess borrowing is approved by a majority of our independent directors and is disclosed to our stockholders in our next quarterly report, with a justification for such excess.
We may borrow amounts from our Advisor or its affiliates only if such loan is approved by a majority of our directors, including a majority of our independent directors, not otherwise interested in the transaction, as fair, competitive, commercially reasonable and no less favorable to us than comparable loans between unaffiliated parties under the circumstances.
9
Except as set forth in our charter regarding debt limits, we may re-evaluate and change our debt strategy and policies in the future without a stockholder vote. Factors that we could consider when re-evaluating or changing our debt strategy and policies include then-current economic and market conditions, the relative cost of debt and equity capital, any acquisition opportunities, the ability of our properties to generate sufficient cash flow to cover debt service requirements and other similar factors. Further, we may increase or decrease our ratio of debt to equity in connection with any change of our borrowing policies.
Acquisition Structure
Although we are not limited as to the form our investments may take, our investments in real estate will generally constitute acquiring fee title or interests in joint ventures or similar entities that own and operate real estate. We may also enter into the following types of leases relating to real property:
| | • | | a ground lease in which we enter into a long-term lease (generally greater than 30 years) with the owner for use of the property during the term whereby the owner retains title to the land; or |
| | • | | a master lease in which we enter into a long-term lease (typically ten years with multiple renewal options) with the owner in which we agree to pay rent to the owner and pay all costs of operating and maintaining the property (a net lease) and typically have an option to purchase the property in the future. |
We will make acquisitions of our real estate investments directly or indirectly through our Operating Partnership. We will acquire interests in real estate either directly through our Operating Partnership or indirectly through limited liability companies or limited partnerships, or through investments in joint ventures, partnerships, co-tenancies or other co-ownership arrangements with other owners of properties, affiliates of our Advisor or other persons.
Conditions to Closing Acquisitions
We will not purchase any property unless and until we obtain at least a Phase I environmental assessment and history for the property and we are sufficiently satisfied with the property’s environmental status. In addition, we will generally condition our obligation to close the purchase of any property on the delivery and verification of certain documents from the seller or other independent professionals, including but not limited to, where appropriate:
| | • | | property surveys and site audits; |
| | • | | building plans and specifications, if available; |
| | • | | soil reports, seismic studies, flood zone studies, if available; |
| | • | | licenses, permits, maps and governmental approvals; |
| | • | | historical financial statements and tax statement summaries of the properties; |
| | • | | proof of marketable title, subject to such liens and encumbrances as are acceptable to us; and |
| | • | | liability and title insurance policies. |
Joint Venture Investments
As of December 31, 2012, we had entered into several joint venture arrangements (see Note 2 of the Notes to the Consolidated Financial Statements contained in this report). In the future we may acquire some of our properties in joint ventures, some of which may be entered into with affiliates of our Advisor. We may also enter into joint ventures, general partnerships, co-tenancies and other participations with real estate developers, owners and others for the purpose of owning and leasing real properties. Among other reasons, we may want to acquire properties through a joint venture with third parties or affiliates in order to diversify our portfolio of properties in
10
terms of geographic region or property type or to co-invest with one of our property management partners. Joint ventures may also allow us to acquire an interest in a property without requiring that we fund the entire purchase price. In addition, certain properties may be available to us only through joint ventures. In determining whether to recommend a particular joint venture, our Advisor will evaluate the real property which such joint venture owns or is being formed to own under the same criteria described elsewhere in this annual report.
We may enter into joint ventures with affiliates of our Sponsor, Advisor or any affiliate thereof for the acquisition of properties, but only provided that:
| | • | | a majority of our directors, including a majority of our independent directors not otherwise interested in the transaction, approve the transaction as being fair and reasonable to us; and |
| | • | | the investment by us and the joint venture partner are on substantially the same terms and conditions. |
To the extent possible and if approved by our board of directors, including a majority of our independent directors, we will attempt to obtain a right of first refusal or option to buy if such venture partner elects to sell its interest in the joint venture or the property held by the joint venture. In the event that the venture partner were to elect to sell such interest, however, we may not have sufficient funds to exercise our right of first refusal to buy the venture partner’s interest. Entering into joint ventures with affiliates of our Advisor will result in certain conflicts of interest.
Co-Investment with Tenant-In-Common Programs and Delaware Statutory Trusts
Persons selling real estate held for investment often seek to reinvest the proceeds of that sale in another real estate investment in an effort to obtain favorable tax treatment under Section 1031 of the Internal Revenue Code (the “Code”). Our Sponsor has been and may continue to be a sponsor of tenant-in-common programs and Delaware Statutory Trusts (“DSTs”), such transactions referred to as like-kind exchanges.
For each tenant-in-common program, our Sponsor or one of its affiliates will create a single member limited liability company (each of which we refer to as a Strategic Capital Exchange Entity). A Strategic Capital Exchange Entity will acquire all or part of a real estate property to be owned in co-tenancy arrangements with persons wishing to engage in like-kind exchanges (tenant-in-common participants). Generally, a Strategic Capital Exchange Entity will acquire the subject property, and through a registered broker-dealer, market a private placement memorandum for the sale of co-tenancy interests in that property. In many instances, affiliates of our Advisor will sell or contribute a property to a Strategic Capital Exchange Entity for the purpose of selling off the property. Properties acquired in connection with the tenant-in-common program, if any, initially may be partially or entirely financed with debt. When a tenant-in-common participant wishes to acquire a co-tenancy interest, the Strategic Capital Exchange Entity will deed an undivided co-tenancy interest in the subject property to a newly-formed single-member limited liability company that is owned by the tenant-in-common participant.
A DST is a separate legal entity created as a trust under Delaware law that allows persons wishing to engage in like-kind exchanges to reinvest their proceeds in commercial real estate. In such a transaction, the DST acquires title to the property or properties and borrows money, which is secured by such properties, from the lender, and the exchange participant owns a beneficial interest in the DST.
In 2010 we increased our ownership in Self Storage I DST, one of the DSTs acquired in a previous merger, from 3.05% to 19.75%. We subsequently acquired the remaining interests in Self Storage I DST, such that we owned 100% of the interests as of February 2011. During 2012, we also acquired all of the interests in Madison County Self Storage DST, a DST sponsored by our Sponsor, such that we owned 100% of the interests as of December 28, 2012. We may in the future make additional investments in the other DSTs sponsored by our Sponsor or invest in other similar programs, but will only do so if our board of directors, including a majority of our independent directors, determines that our participation is in the best interest of our stockholders.
11
We may co-invest in a property or DST only if a majority of our directors, including a majority of our independent directors, not otherwise interested in the transaction approves of the transaction as being fair, competitive and commercially reasonable to us. We anticipate that in the event we purchase a tenant-in-common or DST interest from a Strategic Capital Exchange Entity, generally we will purchase the interest at the Strategic Capital Exchange Entity’s cost (before offering expenses and fees). However, if the price to us is in excess of the cost of the asset paid by our affiliate, a majority of our directors, including a majority of our independent directors not otherwise interested in the transaction, must determine that substantial justification for such excess exists and that such excess is reasonable. In no event shall the cost to us of such asset exceed the greater of the Strategic Capital Exchange Entity’s cost or the current appraised value for the property or DST interest as determined by an independent appraiser. Although the Strategic Capital Exchange Entity will charge fees and expenses to tenant-in-common participants and/or will sell the tenant-in-common or DST interests at a price above the price it paid for the property, we will not pay any fees or expenses to the Strategic Capital Exchange Entity. We intend to pay our Advisor the acquisition fees and reimburse our Advisor for its expenses to the same extent as with other types of property acquisitions.
All purchasers of co-tenancy interests, including our Operating Partnership if it purchases co-tenancy interests, will be required to execute a tenant-in-common agreement with the other purchasers of co-tenancy interests in that particular property. For a DST investment, each investor is required to execute a trust agreement. If we purchase these co-ownership interests, we will be subject to various risks associated with co-ownership arrangements which are not otherwise present in real estate investments, such as the risk that the interests of the non-affiliated investors will become adverse to our interests.
In any co-ownership arrangement, our Sponsor, the Strategic Capital Exchange Entity, or the other investors may have economic or business interests or goals that are or may become inconsistent with our business interests or goals. For instance, our Sponsor will receive substantial fees in connection with its sponsoring of a co-ownership arrangement (although we will not be required to pay such fees) and our participation in such a transaction likely would facilitate its consummation of the transactions. For these reasons, our Advisor may face a conflict in structuring the terms of the relationship between our interests and the interest of our Sponsor or the Strategic Capital Exchange Entity. As a result, agreements and transactions between the parties with respect to the property will not have the benefit of arm’s-length negotiation of the type normally conducted between unrelated parties.
Construction and Development Activities
From time to time, we may construct and develop real estate assets or render services in connection with these activities. We may be able to reduce overall purchase costs by constructing and developing a property versus purchasing a completed property. Developing and constructing properties would, however, expose us to risks such as cost overruns, carrying costs of projects under construction or development, availability and costs of materials and labor, weather conditions and government regulation. To comply with the applicable requirements under federal income tax law, we intend to limit our construction and development activities to performing oversight and review functions, including reviewing the construction design proposals, negotiating and contracting for feasibility studies and supervising compliance with local, state or federal laws and regulations, negotiating contracts, overseeing construction, and obtaining financing. In addition, we may use taxable REIT subsidiaries or certain independent contractors to carry out these oversights and review functions. We will retain independent contractors to perform the actual construction work. As of December 31, 2012, we had one property that was under construction in Canada.
Government Regulations
Our business will be subject to many laws and governmental regulations. Changes in these laws and regulations, or their interpretation by agencies and courts, occur frequently.
12
Americans with Disabilities Act
Under the Americans with Disabilities Act of 1990, or ADA, all public accommodations and commercial facilities are required to meet certain federal requirements related to access and use by disabled persons. These requirements became effective in 1992. Complying with the ADA requirements could require us to remove access barriers. Failing to comply could result in the imposition of fines by the federal government or an award of damages to private litigants. Although we intend to acquire properties that substantially comply with these requirements, we may incur additional costs to comply with the ADA. In addition, a number of additional federal, state and local laws may require us to modify any properties we purchase, or may restrict further renovations thereof, with respect to access by disabled persons. Additional legislation could impose financial obligations or restrictions with respect to access by disabled persons. Although we believe that these costs will not have a material adverse effect on us, if required changes involve a greater amount of expenditures than we currently anticipate, our ability to make expected distributions could be adversely affected.
Environmental Matters
Under various federal, state and local laws, ordinances and regulations, a current or previous owner or operator of real property may be held liable for the costs of removing or remediating hazardous or toxic substances. These laws often impose clean-up responsibility and liability without regard to whether the owner or operator was responsible for, or even knew of, the presence of the hazardous or toxic substances. The costs of investigating, removing or remediating these substances may be substantial, and the presence of these substances may adversely affect our ability to rent units or sell the property, or to borrow using the property as collateral, and may expose us to liability resulting from any release of or exposure to these substances. If we arrange for the disposal or treatment of hazardous or toxic substances at another location, we may be liable for the costs of removing or remediating these substances at the disposal or treatment facility, whether or not the facility is owned or operated by us. We may be subject to common law claims by third parties based on damages and costs resulting from environmental contamination emanating from a site that we own or operate. Certain environmental laws also impose liability in connection with the handling of or exposure to asbestos-containing materials, pursuant to which third parties may seek recovery from owners or operators of real properties for personal injury associated with asbestos-containing materials and other hazardous or toxic substances.
Other Regulations
The properties we acquire likely will be subject to various federal, state and local regulatory requirements, such as zoning and state and local fire and life safety requirements. Failure to comply with these requirements could result in the imposition of fines by governmental authorities or awards of damages to private litigants. We intend to acquire properties that are in material compliance with all such regulatory requirements. However, we cannot assure our stockholders that these requirements will not be changed or that new requirements will not be imposed which would require significant unanticipated expenditures by us and could have an adverse effect on our financial condition and results of operations.
Disposition Policies
As of December 31, 2012, we had not disposed of any of our self storage facilities. We generally intend to hold each property we acquire for an extended period. However, we may sell a property at any time if, in our judgment, the sale of the property is in the best interests of our stockholders.
The determination of whether a particular property should be sold or otherwise disposed of will generally be made after consideration of relevant factors, including prevailing economic conditions, other investment opportunities and considerations specific to the condition, value and financial performance of the property. In connection with our sales of properties, we may lend the purchaser all or a portion of the purchase price. In these instances, our taxable income may exceed the cash received in the sale.
13
We may sell assets to third parties or to affiliates of our Advisor. Our nominating and corporate governance committee of our board of directors, which is comprised solely of independent directors, must review and approve all transactions between us and our Advisor and its affiliates.
Investment Limitations in Our Charter
Our charter places numerous limitations on us with respect to the manner in which we may invest our funds, most of which are required by various provisions of the Statement of Policy Regarding Real Estate Investment Trusts published by the North American Securities Administrators Association (NASAA REIT Guidelines). So long as our shares are not listed on a national securities exchange, the NASAA REIT Guidelines apply to us, and we will not:
| | • | | Invest in equity securities unless a majority of our directors, including a majority of our independent directors, not otherwise interested in the transaction approve such investment as being fair, competitive and commercially reasonable. |
| | �� | | Invest in commodities or commodity futures contracts, except for futures contracts when used solely for the purpose of hedging in connection with our ordinary business of investing in real estate assets and mortgages. |
| | • | | Invest in real estate contracts of sale, otherwise known as land sale contracts, unless the contract is in recordable form and is appropriately recorded in the chain of title. |
| | • | | Make or invest in mortgage loans unless an appraisal is obtained concerning the underlying property, except for those mortgage loans insured or guaranteed by a government or government agency. In cases where our independent directors determine, and in all cases in which the transaction is with any of our directors or our Advisor and its affiliates, we will obtain an appraisal from an independent appraiser. We will maintain such appraisal in our records for at least five years and it will be available to our stockholders for inspection and duplication. We will also obtain a mortgagee’s or owner’s title insurance policy as to the priority of the mortgage or condition of the title. |
| | • | | Make or invest in mortgage loans, including construction loans, on any one property if the aggregate amount of all mortgage loans on such property would exceed an amount equal to 85% of the appraised value of such property, as determined by an appraisal, unless substantial justification exists for exceeding such limit because of the presence of other loan underwriting criteria. |
| | • | | Make or invest in mortgage loans that are subordinate to any mortgage or equity interest of any of our directors, our Advisor or their respective affiliates. |
| | • | | Make investments in unimproved property or indebtedness secured by a deed of trust or mortgage loans on unimproved property in excess of 10% of our total assets. |
| | • | | Issue equity securities on a deferred payment basis or other similar arrangement. |
| | • | | Issue debt securities in the absence of adequate cash flow to cover debt service. |
| | • | | Issue equity securities that are assessable after we have received the consideration for which our board of directors authorized their issuance. |
| | • | | Issue “redeemable securities” redeemable solely at the option of the holder, which restriction has no effect on our ability to implement our share redemption program. |
| | • | | When applicable, grant warrants or options to purchase shares to our Advisor or its affiliates or to officers or directors affiliated with our Advisor except on the same terms as options or warrants that are sold to the general public. Further, the amount of the options or warrants cannot exceed an amount equal to 10% of outstanding shares on the date of grant of the warrants and options. |
| | • | | Lend money to our directors, or to our Advisor or its affiliates, except for certain mortgage loans described above. |
14
Changes in Investment Policies and Limitations
Our charter requires that our independent directors review our investment policies at least annually to determine that the policies we are following are in the best interests of our stockholders. Each determination and the basis therefor is required to be set forth in the applicable meeting minutes. The methods of implementing our investment policies may also vary as new investment techniques are developed. The methods of implementing our investment objectives and policies, except as otherwise provided in our charter, may be altered by a majority of our directors, including a majority of our independent directors, without the approval of our stockholders. The determination by our board of directors that it is no longer in our best interests to continue to be qualified as a REIT shall require the concurrence of two-thirds of the board of directors. Investment policies and limitations specifically set forth in our charter, however, may only be amended by a vote of the stockholders holding a majority of our outstanding shares.
Investments in Mortgages
As of December 31, 2012, we had not invested in any mortgages. While we intend to emphasize equity real estate investments and, hence, operate as what is generally referred to as an “equity REIT,” as opposed to a “mortgage REIT,” we may invest in first or second mortgage loans, mezzanine loans secured by an interest in the entity owning the real estate or other similar real estate loans consistent with our REIT status. We may make such loans to developers in connection with construction and redevelopment of self storage facilities. Such mortgages may or may not be insured or guaranteed by the Federal Housing Administration, the Veterans Benefits Administration or another third party. We may also invest in participating or convertible mortgages if our directors conclude that we and our stockholders may benefit from the cash flow or any appreciation in the value of the subject property. Such mortgages are similar to equity participation.
Affiliate Transaction Policy
During 2010 we increased our ownership in Self Storage I DST, a DST sponsored by our Sponsor, from 3.05% to 19.75%. We subsequently acquired the remaining interests, such that we owned 100% of the interests as of February 2011. In 2011 and 2012, we increased our preferred equity investment in USA Hawthorne, LLC, the entity which has a direct interest in a net leased industrial property (“Hawthorne property”) in California with 356,000 rentable square feet leased to a single tenant, by approximately $0.7 million to approximately $6.9 million. During 2012, we acquired all of the interests in Madison County Self Storage DST, a DST sponsored by our Sponsor, such that we owned 100% of the interests as of December 28, 2012. See Note 2 of the Notes to the Consolidated Financial Statements contained in this report. We may purchase additional properties from one or more affiliates of our Advisor in the future. Our board of directors has established a nominating and corporate governance committee, which will review and approve all matters the board believes may involve a conflict of interest. This committee is composed solely of independent directors. This committee of our board of directors will approve all transactions between us and our Advisor and its affiliates.
Investment Company Act of 1940 and Certain Other Policies
We intend to operate in such a manner that we will not be subject to regulation under the Investment Company Act of 1940, or the 1940 Act. Our Advisor will continually review our investment activity to attempt to ensure that we do not come within the application of the 1940 Act. Among other things, our Advisor will attempt to monitor the proportion of our portfolio that is placed in various investments so that we do not come within the definition of an “investment company” under the 1940 Act. If at any time the character of our investments could cause us to be deemed as an investment company for purposes of the 1940 Act, we will take all necessary actions to attempt to ensure that we are not deemed to be an “investment company.” In addition, we do not intend to underwrite securities of other issuers or actively trade in loans or other investments.
Subject to the restrictions we must follow in order to qualify to be taxed as a REIT, we may make investments other than as previously described, although we do not currently intend to do so. We have authority to purchase or otherwise reacquire our common shares or any of our other securities. We have no present
15
intention of repurchasing any of our common shares except pursuant to our share redemption program, and we would only take such action in conformity with applicable federal and state laws and the requirements for qualifying as a REIT under the Code.
Employees
We have no paid employees. The employees of our Advisor provide management, acquisition, advisory and certain administrative services for us.
Competition
The extent of competition in the market area depends significantly on local market conditions. The primary factors upon which competition in the self storage industry is based are location, rental rates, suitability of the property’s design and the manner in which the property is operated and marketed. We believe we compete successfully on these bases.
Many of our competitors are larger and have substantially greater resources than we do. Such competitors may, among other possible advantages, be capable of paying higher prices for acquisitions and obtaining financing on better terms than us.
Industry Segments
We internally evaluate all of our properties and interests therein as one industry segment and, accordingly, we do not report segment information.
Geographic Information
Our Canadian real estate assets represent approximately $34.2 million or approximately 6.0% of our net carrying value of real estate assets as of December 31, 2012. For the year ended December 31, 2012, approximately $1.7 million, or approximately 2.6% of our revenues, were generated by our Canadian real estate assets. As of December 31, 2012, one of our Canadian real estate assets is in the construction stage and is not yet generating revenue.
Below are risks and uncertainties that could adversely affect our operations that we believe are material to stockholders. Other risks and uncertainties may exist that we do not consider material based on the information currently available to us at this time.
Risks Related to this Offering and an Investment in Strategic Storage Trust, Inc.
We have limited established financing sources and we cannot assure our stockholders that we will be successful in the marketplace.
We were incorporated in August 2007 and commenced active business operations on May 22, 2008. As of December 31, 2012, we owned 110 properties in 17 states and Canada. Our stockholders should consider our prospects in light of the risks, uncertainties and difficulties frequently encountered by companies that are in a similar stage of development.
To be successful in this market, we must, among other things:
| | • | | identify and acquire investments that further our investment objectives; |
| | • | | increase awareness of the “Strategic Storage Trust, Inc.” name within the investment products market; |
16
| | • | | expand and maintain our network of participating broker-dealers; |
| | • | | attract, integrate, motivate and retain qualified personnel to manage our day-to-day operations; |
| | • | | respond to competition for our targeted real estate properties and other investments as well as for potential investors; and |
| | • | | continue to build and expand our operational structure to support our business. |
We cannot guarantee that we will succeed in achieving these goals, and our failure to do so could cause stockholders to lose a portion of their investment.
We have incurred losses to date, have an accumulated deficit and we will not be profitable in 2013.
We incurred net losses of approximately $19.0 million, $21.4 million and $12.8 million for the fiscal years ended December 31, 2012, 2011 and 2010, respectively. Our accumulated deficits were approximately $61.9 million, $43.0 million and $21.6 million as of December 31, 2012, 2011 and 2010, respectively. Given that we are still in our fundraising and acquisition stage of development, we will not be profitable in 2013.
To date, we have paid a majority of our distributions from sources other than cash flow from operations; therefore, we will have fewer funds available for the acquisition of properties, and our stockholders’ overall return may be reduced.
In the event we do not have enough cash from operations to fund our distributions, we may borrow, issue additional securities or sell assets in order to fund the distributions or make the distributions out of net proceeds from the Offering. We are not prohibited from undertaking such activities by our charter, bylaws or investment policies, and we may use an unlimited amount from any source to pay our distributions. Through December 31, 2012, we had received aggregate gross offering proceeds of approximately $137 million from the sale of approximately 13.7 million shares in our Offering, and aggregate gross offering proceeds of approximately $426 million from the sale of approximately 42.7 million shares in our Initial Offering and Offering. For the years ended December 31, 2008 and 2009, we funded 100% of our distributions using proceeds from our Initial Offering. For the year ended December 31, 2010, we funded 6.5% of our distributions using cash flow from operations and 93.5% using proceeds from our Initial Offering. For the year ended December 31, 2011, we funded 13.3% of our distributions using cash flow from operations and 86.7% using proceeds from our Initial Offering and Offering. For the year ended December 31, 2012, we funded 33.9% of our distributions using cash flow from operations and 66.1% using proceeds from our Initial Offering and Offering. If we continue to pay distributions from sources other than cash flow from operations, we will have fewer funds available for acquiring properties, which may reduce our stockholders’ overall returns.
We may be unable to pay or maintain cash distributions or increase distributions over time.
There are many factors that can affect the availability and timing of cash distributions to stockholders. During the term of the Offering, distributions will be based principally on distribution expectations of our potential investors and cash available from our operations. The amount of cash available for distribution will be affected by many factors, such as our ability to buy properties as offering proceeds become available, the yields on securities of other real estate programs that we invest in and our operating expense levels, as well as many other variables. Actual cash available for distribution may vary substantially from estimates. We cannot assure our stockholders that we will be able to pay or maintain distributions or that distributions will increase over time, nor can we give any assurance that rents from the properties will increase, that the securities we buy will increase in value or provide constant or increased distributions over time, or that future acquisitions of real properties will increase our cash available for distribution to stockholders. Our actual results may differ significantly from the assumptions used by our board of directors in establishing the distribution rate to stockholders.
17
In determining our estimated net asset value per share, we primarily relied upon a valuation of our portfolio of properties as of December 31, 2011. Valuations and appraisals of our properties are estimates of fair value and may not necessarily correspond to realizable value upon the sale of such properties; therefore our estimated net asset value per share may not reflect the amount that would be realized upon a sale of each of our properties.
For the purposes of calculating the estimated net asset value per share, an independent third party appraiser valued our properties as of December 31, 2011. The valuation methodologies used to value our properties involved certain subjective judgments. Ultimate realization of the value of an asset depends to a great extent on economic and other conditions beyond our control and the control of our advisor and independent appraiser. Further, valuations do not necessarily represent the price at which an asset would sell, since market prices of assets can only be determined by negotiation between a willing buyer and seller. Therefore, the valuations of our properties and our investments in real estate related assets may not correspond to the timely realizable value upon a sale of those assets. Because the price our stockholders will pay for shares in this offering is primarily based on the estimated net asset value per share, our stockholders may pay more than realizable value when they purchase shares or receive less than realizable value for their investment when they sell shares.
Our share price is primarily based on the estimated per share value of our shares, but also based upon subjective judgments, assumptions and opinions by management, which may or may not turn out to be correct. Therefore, our share price may not reflect the precise amount that might be paid to a stockholder for their shares in a market transaction.
Our current share price is primarily based on our net asset value per share, which was based on an estimate of the value of our properties—consisting principally of illiquid commercial real estate—as of December 31, 2011. The valuation methodologies used by the independent appraiser retained by our board of directors to estimate the value of our wholly-owned self storage facilities as of December 31, 2011 involved subjective judgments, assumptions and opinions, which may or may not turn out to be correct. In addition, our board of directors based our share price primarily on the estimated net asset value per share which, although heavily reliant upon the independent appraisal, involved certain subjective judgments, assumptions and opinions of management. As a result, our share price may not reflect the precise amount that might be paid to for our stockholders’ shares in a market transaction.
If we, through our Advisor, are unable to find suitable investments, then we may not be able to achieve our investment objectives or pay distributions.
Our ability to achieve our investment objectives and to pay distributions is dependent upon the performance of our Advisor in selecting our investments and arranging financing. As of December 31, 2012, we owned 110 properties in 17 states and Canada. Our stockholders will essentially have no opportunity to evaluate the terms of transactions or other economic or financial data concerning our investments prior to the time we make them. Our stockholders must rely entirely on the management ability of our Advisor and the oversight of our board of directors. We cannot be sure that our Advisor will be successful in obtaining suitable investments on financially attractive terms or that, if it makes investments on our behalf, our objectives will be achieved. If we are unable to find suitable investments, we will hold the proceeds of the Offering in an interest-bearing account or invest the proceeds in short-term, investment-grade investments. In such an event, our ability to pay distributions to our stockholders would be adversely affected.
We may suffer from delays in locating suitable investments, which could adversely affect our ability to make distributions and the value of our stockholders’ investments.
We could suffer from delays in locating suitable investments, particularly as a result of our reliance on our Advisor at times when management of our Advisor is simultaneously seeking to locate suitable investments for other affiliated programs. Delays we encounter in the selection, acquisition and development of income-producing properties are likely to adversely affect our ability to make distributions and may also adversely affect
18
the value of our stockholders’ investments. In such event, we may pay all or a substantial portion of our distributions from the proceeds of the Offering or from borrowings in anticipation of future cash flow, which may constitute a return of our stockholders’ capital. We are not prohibited from undertaking such activities by our charter, bylaws or investment policies. We have established no maximum of distributions to be paid from such funds. Distributions from the proceeds of the Offering or from borrowings also could reduce the amount of capital we ultimately invest in properties. This, in turn, would reduce the value of our stockholders’ investments. In particular, if we acquire properties prior to the start of construction or during the early stages of construction, it will typically take several months to complete construction and rent available storage space. Therefore, our stockholders could suffer delays in the receipt of cash distributions attributable to those particular properties.
If our Advisor or Property Manager loses or is unable to obtain key personnel, our ability to implement our investment objectives could be delayed or hindered, which could adversely affect our ability to make distributions and the value of our stockholders’ investments.
Our success depends to a significant degree upon the contributions of certain of our executive officers and other key personnel of our Advisor and Property Manager, including H. Michael Schwartz, Paula Mathews, Michael S. McClure, Ken Morrison and Wayne Johnson, each of whom would be difficult to replace. Our Advisor does not have an employment agreement with any of these key personnel and we cannot guarantee that all, or any particular one, will remain affiliated with us and/or our Advisor. If any of our key personnel were to cease their affiliation with our Advisor, our operating results could suffer. Further, we do not intend to separately maintain key person life insurance on any of these individuals. We believe that our future success depends, in large part, upon our Advisor’s ability to hire and retain highly skilled managerial, operational and marketing personnel. Competition for such personnel is intense, and we cannot assure our stockholders that our Advisor will be successful in attracting and retaining such skilled personnel. If our Advisor loses or is unable to obtain the services of key personnel or does not establish or maintain appropriate strategic relationships, our ability to implement our investment strategies could be delayed or hindered, and the value of our stockholders’ investments may decline.
Our ability to operate profitably will depend upon the ability of our Advisor to efficiently manage our day-to-day operations and the ability of our Property Manager to effectively manage our properties.
We will rely on our Advisor to manage our business and assets. Our Advisor will make all decisions with respect to our day-to-day operations. In addition, we will rely on our Property Manager to effectively manage our properties. Thus, the success of our business will depend in large part on the ability of our Advisor and Property Manager to manage our operations. Any adversity experienced by our Advisor or our Property Manager or problems in our relationship with our Advisor or Property Manager could adversely impact our operations and, consequently, our cash flow and ability to make distributions to our stockholders.
We do not own or control the intellectual property rights to the “SmartStop® Self Storage” brand and other trademarks and intellectual property used by us in connection with our self storage facilities; therefore, we could potentially lose revenues and incur significant costs if we cease to operate under this brand.
Strategic Storage Holdings, LLC, the parent company of our Advisor and Property Manager, owns and controls the intellectual property rights to the “SmartStop® Self Storage” brand, the websitewww.smartstopselfstorage.com and other intellectual property currently being used by us in connection with our self storage properties. We are currently authorized to use this brand and other intellectual property pursuant to a license. In the event that we ever cease to operate under this brand, which has garnered substantial value due to its goodwill and reputation associated therewith, we may lose market share and customers, which could result in lost revenues. In addition, we could incur significant costs to change the signage and otherwise change our brand.
19
We may loan a portion of the proceeds of the Offering to fund the development or purchase of self storage facilities, and we may invest in mortgage or other loans, but if these loans are not fully repaid, the resulting losses could reduce the expected cash available for distribution to our stockholders and the value of our stockholders’ investments.
We will use the net proceeds of the Offering primarily to purchase self storage facilities, to repay debt financing that we may incur when acquiring properties, and to pay real estate commissions, acquisition fees and acquisition expenses relating to the selection and acquisition of properties, including amounts paid to our Advisor and its affiliates. In addition, we may loan a portion of the net offering proceeds to entities developing or acquiring self storage facilities, including affiliates of our Advisor, subject to the limitations in our charter. We may also invest in first or second mortgage loans, mezzanine loans secured by an interest in the entity owning the real estate or other similar real estate loans consistent with our REIT status. We may also invest in participating or convertible mortgages if our directors conclude that we and our stockholders may benefit from the cash flow or any appreciation in the value of the subject property. There can be no assurance that these loans will be repaid to us in part or in full in accordance with the terms of the loan or that we will receive interest payments on the outstanding balance of the loan. We anticipate that these loans will be secured by mortgages on the underlying properties, but in the event of a foreclosure, there can be no assurances that we will recover the outstanding balance of the loan. If there are defaults under these loans, we may not be able to repossess and sell the underlying properties quickly. The resulting time delay and associated costs could reduce the value of our investment in the defaulted loans. An action to foreclose on a property securing a mortgage loan is regulated by state statutes and regulations and is subject to many of the delays and expenses of other lawsuits if the defendant raises defenses or counterclaims. In the event of default by a mortgagor, these restrictions, among other things, may impede our ability to foreclose on or sell the mortgaged property or to obtain proceeds sufficient to repay all amounts due to us on the mortgage loan.
Certain of our stockholders in the State of Washington may be entitled to rescission of their respective investments in our shares.
In the third quarter of 2012, we discovered that, due to a clerical error, we exceeded our registration amount in the State of Washington during a three month period in 2012. Upon this discovery, we immediately took action to increase our registration amount; however, stockholders who purchased shares in excess of the amount then-registered in the State of Washington may be entitled to rescission of their respective investment in our shares. If any of these Washington stockholders seek a rescission, we will be required to redeem their shares.
Risks Related to Conflicts of Interest
Our Advisor, Property Manager and their officers and certain of our key personnel will face competing demands relating to their time, and this may cause our operating results to suffer.
Our Advisor, Property Manager and their officers and certain of our key personnel and their respective affiliates are key personnel, advisors, managers and sponsors of other real estate programs having investment objectives and legal and financial obligations similar to ours, and may have other business interests as well. Because these persons have competing demands on their time and resources, they may have conflicts of interest in allocating their time between our business and these other activities. During times of intense activity in other programs and ventures, they may devote less time and fewer resources to our business than is necessary or appropriate. If this occurs, the returns on our stockholders’ investments may suffer.
Our officers and one of our directors face conflicts of interest related to the positions they hold with affiliated entities, which could hinder our ability to successfully implement our investment objectives and to generate returns to our stockholders.
Our executive officers and one of our directors are also officers of our Advisor, our Property Manager, and other affiliated entities. As a result, these individuals owe fiduciary duties to these other entities and their owners, which fiduciary duties may conflict with the duties that they owe to our stockholders and us. Their loyalties to
20
these other entities could result in actions or inactions that are detrimental to our business, which could harm the implementation of our investment objectives. Conflicts with our business and interests are most likely to arise from involvement in activities related to (1) allocation of new investments and management time and services between us and the other entities, (2) our purchase of properties from, or sale of properties to, affiliated entities, (3) the timing and terms of the investment in or sale of an asset, (4) development of our properties by affiliates, (5) investments with affiliates of our Advisor, (6) compensation to our Advisor, and (7) our relationship with our dealer manager and Property Manager. If we do not successfully implement our investment objectives, we may be unable to generate cash needed to make distributions to our stockholders and to maintain or increase the value of our assets.
Our Advisor will face conflicts of interest relating to the purchase of properties, and such conflicts may not be resolved in our favor, which could adversely affect our investment opportunities.
We may be buying properties at the same time as one or more of the other programs managed by officers and key personnel of our Advisor. Our Advisor and its affiliates are actively involved in 11 other real estate programs (three of which invest in or own self storage properties) that may compete with us or otherwise have similar business interests. Our Advisor and our Property Manager will have conflicts of interest in allocating potential properties, acquisition expenses, management time, services and other functions between various existing enterprises or future enterprises with which they may be or become involved. There is a risk that our Advisor will choose a property that provides lower returns to us than a property purchased by another program sponsored by our Sponsor. We cannot be sure that officers and key personnel acting on behalf of our Advisor and on behalf of these other programs will act in our best interests when deciding whether to allocate any particular property to us. Such conflicts that are not resolved in our favor could result in a reduced level of distributions we may be able to pay to our stockholders and a reduction in the value of our stockholders’ investments. If our Advisor or its affiliates breach their legal or other obligations or duties to us, or do not resolve conflicts of interest in the appropriate manner, we may not meet our investment objectives, which could reduce the expected cash available for distribution to our stockholders and the value of our stockholders’ investments.
We may face a conflict of interest if we purchase properties from affiliates of our Advisor.
In the past, we completed two mergers with private real estate investment trusts sponsored by our Sponsor. During 2010 we increased our ownership from 3.05% to 19.75% in Self Storage I DST, a DST sponsored by our Sponsor. We subsequently acquired the remaining interests in Self Storage I DST, such that we owned 100% of the interests as of February 2011. In 2012 we also acquired all of the interests in Madison County Self Storage DST, a DST sponsored by our Sponsor, such that we owned 100% of the interests as of December 28, 2012. We may purchase properties from one or more affiliates of our Advisor in the future. A conflict of interest may exist if such acquisition occurs. The business interests of our Advisor and its affiliates may be adverse to, or to the detriment of, our interests. Additionally, the prices we pay to affiliates of our Advisor for our properties may be equal to, or in excess of, the prices paid by them plus the costs incurred by them relating to the acquisition and financing of the properties. These prices will not be the subject of arm’s-length negotiations, which could mean that the acquisitions may be on terms less favorable to us than those negotiated in an arm’s-length transaction. Even though we will use an independent third-party appraiser to determine fair market value when acquiring properties from our Advisor and its affiliates, we may pay more for particular properties than we would have in an arm’s-length transaction, which would reduce our cash available for investment in other properties or distribution to our stockholders.
Furthermore, because any agreement that we enter into with affiliates of our Advisor will not be negotiated in an arm’s-length transaction, and as a result of the affiliation between our Advisor and its affiliates, our Advisor may be reluctant to enforce the agreements against such entities. Our nominating and corporate governance committee of our board of directors approved all of the transactions discussed above and will approve all future transactions between us and our Advisor and its affiliates.
21
Our Advisor will face conflicts of interest relating to the incentive fee structure under our advisory agreement, which could result in actions that are not necessarily in the long-term best interests of our stockholders.
Pursuant to our advisory agreement, our Advisor and its affiliates will perform services for us in connection with the offer and sale of our shares and the selection, acquisition and management of our properties. Our Advisor will be entitled to fees that are structured in a manner intended to provide incentives to our Advisor to perform in our best interests and in the best interests of our stockholders. The amount of such compensation has not been determined as a result of arm’s-length negotiations, and such amounts may be greater than otherwise would be payable to independent third parties. However, because our Advisor does not maintain a significant equity interest in us and is entitled to receive substantial minimum compensation regardless of performance, our Advisor’s interests will not be wholly aligned with those of our stockholders. In that regard, our Advisor could be motivated to recommend riskier or more speculative investments in order for us to generate the specified levels of performance or sales proceeds that would entitle our Advisor to fees. In addition, our Advisor’s entitlement to receive fees upon the sale of our assets and to participate in sale proceeds could result in our Advisor recommending sales of our investments at the earliest possible time at which such sales would produce the level of return that would entitle our Advisor to compensation from the sales, even if continued ownership of those investments might be in our best long-term interest.
Our advisory agreement will require us to pay a performance-based fee to our Advisor in the event that we terminate our Advisor prior to the listing of our shares for trading on an exchange or, absent such listing, in respect of its participation in net sale proceeds. To avoid paying this fee, our independent directors may decide against terminating the advisory agreement prior to our listing of our shares or disposition of our investments even if, but for the performance fee, termination of the advisory agreement would be in our best interest. In addition, the requirement to pay the fee to our Advisor at termination could cause us to make different investment or disposition decisions than we would otherwise make in order to satisfy our obligation to pay the fee to the terminated Advisor.
At the time it becomes necessary for our board of directors to determine which liquidity event, if any, is in the best interests of us and our stockholders, our Advisor may not agree with the decision of our board as to which liquidity event, if any, we should pursue. If there is a substantial difference in the amount of subordinated fees our Advisor may receive for each liquidity event, our Advisor may prefer a liquidity event with higher subordinated fees. If our board of directors decides to list our shares for trading on an exchange, our board may also decide to merge with our Advisor in anticipation of the listing process. Such merger may result in substantial compensation to our Advisor which may create certain conflicts of interest.
Our Advisor will face conflicts of interest relating to joint ventures that we may form with affiliates of our Advisor, which conflicts could result in a disproportionate benefit to other joint venture partners at our expense.
We may enter into joint ventures with other programs sponsored by our Sponsor for the acquisition, development or improvement of properties. Our Advisor may have conflicts of interest in determining which program should enter into any particular joint venture agreement. The co-venturer may have economic or business interests or goals that are or may become inconsistent with our business interests or goals. In addition, our Advisor may face a conflict in structuring the terms of the relationship between our interests and the interest of the affiliated co-venturer and in managing the joint venture. Since our Advisor and its affiliates will control both the affiliated co-venturer and, to a certain extent, us, agreements and transactions between the co-venturers with respect to any such joint venture will not have the benefit of arm’s-length negotiation of the type normally conducted between unrelated co-venturers, which may result in the co-venturer receiving benefits greater than the benefits that we receive. In addition, we may assume liabilities, related to the joint venture, that exceed the percentage of our investment in the joint venture, and this could reduce the returns on our stockholders’ investments.
22
There is no separate counsel for us and our affiliates, which could result in conflicts of interest.
Baker, Donelson, Bearman, Caldwell & Berkowitz, PC (Baker Donelson) acts as legal counsel to us and also represents our Sponsor, Advisor and some of their affiliates. There is a possibility in the future that the interests of the various parties may become adverse and, under the code of professional responsibility of the legal profession, Baker Donelson may be precluded from representing any one or all of such parties. If any situation arises in which our interests appear to be in conflict with those of our Advisor or its affiliates, additional counsel may be retained by one or more of the parties to assure that their interests are adequately protected. Moreover, should a conflict of interest not be readily apparent, Baker Donelson may inadvertently act in derogation of the interest of the parties, which could affect our ability to meet our investment objectives.
Risks Related to Our Corporate Structure
The limit on the number of shares a person may own may discourage a takeover that could otherwise result in a premium price to our stockholders.
In order for us to qualify as a REIT, no more than 50% of our outstanding stock may be beneficially owned, directly or indirectly, by five or fewer individuals (including certain types of entities) at any time during the last half of each taxable year. To ensure that we do not fail to qualify as a REIT under this test, our charter restricts ownership by one person or entity to no more than 9.8% in value or number, whichever is more restrictive, of any class of our outstanding stock. This restriction may have the effect of delaying, deferring or preventing a change in control of our company, including an extraordinary transaction (such as a merger, tender offer or sale of all or substantially all of our assets) that might provide a premium price for holders of our common stock.
Our charter permits our board of directors to issue stock with terms that may subordinate the rights of common stockholders or discourage a third party from acquiring us in a manner that might result in a premium price to our stockholders.
Our charter permits our board of directors to issue up to 900,000,000 shares of capital stock. In addition, our board of directors, without any action by our stockholders, may amend our charter from time to time to increase or decrease the aggregate number of shares or the number of shares of any class or series of stock that we have authority to issue. Our board of directors may classify or reclassify any unissued common stock or preferred stock and establish the preferences, conversion or other rights, voting powers, restrictions, limitations as to distributions, qualifications and terms or conditions of redemption of any such stock. Thus, our board of directors could authorize the issuance of preferred stock with terms and conditions that could have a priority as to distributions and amounts payable upon liquidation over the rights of the holders of our common stock. Preferred stock could also have the effect of delaying, deferring or preventing a change in control of our company, including an extraordinary transaction (such as a merger, tender offer or sale of all or substantially all of our assets) that might provide a premium price for holders of our common stock.
We will not be afforded the protection of Maryland law relating to business combinations.
Under Maryland law, “business combinations” between a Maryland corporation and an interested stockholder or an affiliate of an interested stockholder are prohibited for five years after the most recent date on which the interested stockholder becomes an interested stockholder. These business combinations include a merger, consolidation, share exchange, or, in circumstances specified in the statute, an asset transfer or issuance or reclassification of equity securities. An interested stockholder is defined as:
| | • | | any person who beneficially owns 10% or more of the voting power of the corporation’s shares; or |
| | • | | an affiliate or associate of the corporation who, at any time within the two-year period prior to the date in question, was the beneficial owner of 10% or more of the voting power of the then outstanding voting stock of the corporation. |
23
These prohibitions are intended to prevent a change of control by interested stockholders who do not have the support of our board of directors. Since our articles of incorporation, as amended, contain limitations on ownership of 9.8% or more of our common stock, we opted out of the business combinations statute in our charter. Therefore, we will not be afforded the protections of this statute and, accordingly, there is no guarantee that the ownership limitations in our articles of incorporation would provide the same measure of protection as the business combinations statute and prevent an undesired change of control by an interested stockholder.
Our stockholders’ investment returns may be reduced if we are required to register as an investment company under the Investment Company Act of 1940. If we become an unregistered investment company, we will not be able to continue our business.
We do not intend to register as an investment company under the Investment Company Act of 1940 (1940 Act). Currently, our investments in real estate will represent the substantial majority of our total asset mix, which would not subject us to the 1940 Act. In order to maintain an exemption from regulation under the 1940 Act, we must engage primarily in the business of buying real estate, and these investments must be made within a year after the Offering ends. If we are unable to invest a significant portion of the proceeds of the Offering in properties within one year of the termination of the Offering, we may avoid being required to register as an investment company by temporarily investing any unused proceeds in government securities with low returns, which would reduce the cash available for distribution to investors and possibly lower our stockholders’ returns.
To maintain compliance with our 1940 Act exemption, we may be unable to sell assets we would otherwise want to sell and may need to sell assets we would otherwise wish to retain. In addition, we may be required to acquire additional income—or loss-generating assets that we might not otherwise acquire or forego opportunities to acquire interests in companies that we would otherwise want to acquire. If we are required to register as an investment company but fail to do so, we would be prohibited from engaging in our business, and criminal and civil actions could be brought against us. In addition, our contracts would be unenforceable unless a court required enforcement, and a court could appoint a receiver to take control of us and liquidate our business.
Our stockholders are bound by the majority vote on matters on which our stockholders are entitled to vote and, therefore, each stockholder’s vote on a particular matter may be superseded by the vote of other stockholders.
Our stockholders may vote on certain matters at any annual or special meeting of stockholders, including the election of directors. However, each stockholder will be bound by the majority vote on matters requiring approval of a majority of the stockholders even if the stockholder does not vote with the majority on any such matter.
If one of our stockholders does not agree with the decisions of our board of directors, the stockholder only has limited control over changes in our policies and operations and may not be able to change such policies and operations, except as provided for in our charter and under applicable law.
Our board of directors determines our major policies, including our policies regarding investments, financing, growth, REIT qualification and distributions. Our board of directors may amend or revise these and other policies without a vote of our stockholders. Under the Maryland General Corporation Law and our charter, our stockholders have a right to vote only on the following:
| | • | | the election or removal of directors; |
| | • | | any amendment of our charter (including a change in our primary investment objectives), except that our board of directors may amend our charter without stockholder approval to increase or decrease the aggregate number of our shares, to increase or decrease the number of our shares of any class or series that we have the authority to issue, or to classify or reclassify any unissued shares by setting or changing the preferences, conversion or other rights, restrictions, limitations as to distributions, qualifications or terms and conditions of redemption of such shares, provided however, that any such amendment does not adversely affect the rights, preferences and privileges of our stockholders; |
24
| | • | | our liquidation or dissolution; and |
| | • | | any merger, consolidation or sale or other disposition of substantially all of our assets. |
All other matters are subject to the discretion of our board of directors. Therefore, our stockholders are limited in their ability to change our policies and operations.
Our rights and the rights of our stockholders to recover claims against our officers, directors and our Advisor are limited, which could reduce our stockholders’ and our recovery against them if they cause us to incur losses.
Maryland law provides that a director has no liability in that capacity if he or she performs his or her duties in good faith, in a manner he or she reasonably believes to be in the corporation’s best interests and with the care that an ordinarily prudent person in a like position would use under similar circumstances. Our charter, in the case of our directors, officers, employees and agents, and our advisory agreement, in the case of our Advisor, requires us to indemnify our directors, officers, employees and agents, and our Advisor and its affiliates, for actions taken by them in good faith and without negligence or misconduct. Additionally, our charter limits the liability of our directors and officers for monetary damages to the maximum extent permitted under Maryland law. As a result, we and our stockholders may have more limited rights against our directors, officers, employees and agents, and our Advisor and its affiliates, than might otherwise exist under common law, which could reduce our stockholders’ and our recovery against them. In addition, we may be obligated to fund the defense costs incurred by our directors, officers, employees and agents or our Advisor in some cases which would decrease the cash otherwise available for distribution to our stockholders.
Our board of directors may change any of our investment objectives, including our focus on self storage facilities.
Our board of directors may change any of our investment objectives, including our focus on self storage facilities. If our stockholders do not agree with a decision of our board to change any of our investment objectives, our stockholders only have limited control over such changes. Additionally, we cannot assure our stockholders that we would be successful in attaining any of these investment objectives, which may adversely impact our financial performance and ability to make distributions to our stockholders.
Our stockholders’ interests in us will be diluted as we issue additional shares, and upon purchasing shares our stockholders’ investments may immediately be diluted based on the net book value per share of our common stock.
Our stockholders will not have preemptive rights to any shares issued by us in the future. Subject to any limitations set forth under Maryland law, our board of directors may increase the number of authorized shares of stock (currently 900,000,000 shares), increase or decrease the number of shares of any class or series of stock designated, or reclassify any unissued shares without the necessity of obtaining stockholder approval. All such shares may be issued in the discretion of our board of directors. Therefore, as we (1) sell shares in the Offering or sell additional shares in the future, including those issued pursuant to our distribution reinvestment plan, (2) sell securities that are convertible into shares of our common stock, (3) issue shares of our common stock in a private offering of securities to institutional investors, (4) issue shares of our common stock upon the exercise of the options granted to our independent directors, (5) issue shares to our Advisor, its successors or assigns, in payment of an outstanding fee obligation as set forth under our advisory agreement, or (6) issue shares of our common stock in a merger or to sellers of properties acquired by us in connection with an exchange of limited partnership interests of our Operating Partnership, existing stockholders and investors purchasing shares in the Offering will experience dilution of their equity investment in us. Because the limited partnership interests of our Operating Partnership may, in the discretion of our board of directors, be exchanged for shares of our common stock, any merger, exchange or conversion between our Operating Partnership and another entity ultimately could result in the issuance of a substantial number of shares of our common stock, thereby diluting the percentage ownership interest of other stockholders. Because of these and other reasons described in this “Risk Factors” section, our stockholders should not expect to be able to own a significant percentage of our shares.
25
In addition, the net book value per share of our common stock was approximately $5.48 as of December 31, 2012 as compared to our offering price per share of $10.79 as of December 31, 2012. Therefore, upon a purchase of our shares, our stockholders will be immediately diluted based on the net book value. Net book value takes into account a deduction of selling commissions, the dealer manager fee and estimated offering expenses paid by us, and is calculated to include depreciated tangible assets, deferred financing costs, and amortized identified intangible assets, which include in-place market leases. Net book value is not an estimate of net asset value, or of the market value or other value of our common stock.
If we merge with our Advisor, the percentage of our outstanding common stock owned by our other stockholders could be reduced, and we could incur additional costs associated with being self-administered.
In the future, our board of directors may consider internalizing the functions performed for us by our Advisor. One method by which we could internalize these functions would be to merge with our Advisor and issue shares to our Advisor as merger consideration. A merger with our Advisor could result in dilution of our stockholders’ interests and could reduce earnings per share and funds from operations per share. Internalization transactions have also, in some cases, been the subject of litigation. Even if these claims are without merit, we could be forced to spend significant amounts of money defending claims, which would reduce the amount of funds available for us to invest in properties or other investments and to pay distributions. These factors could have a material adverse effect on our results of operations, financial condition and ability to pay distributions.
Payment of fees to our Advisor and its affiliates will reduce cash available for investment and distribution.
Our Advisor and its affiliates will perform services for us in connection with the offer and sale of our shares, the selection and acquisition of our investments, and the management of our properties. They will be paid substantial fees for these services, which will reduce the amount of cash available for investment in properties or distribution to stockholders.
We are uncertain of our sources of debt or equity for funding our future capital needs. If we cannot obtain funding on acceptable terms, our ability to make necessary capital improvements to our properties, pay other expenses or expand our business may be impaired or delayed.
The gross proceeds of the Offering will be used to purchase real estate investments and to pay various commissions, fees and expenses. In addition, in order to continue to qualify as a REIT, we generally must distribute to our stockholders at least 90% of our taxable income each year, excluding capital gains. Because of this distribution requirement, it is not likely that we will be able to fund a significant portion of our future capital needs from retained earnings. We have not identified any sources of debt or equity for future funding, and such sources of funding may not be available to us on favorable terms or at all. If we do not have access to sufficient funding in the future, we may not be able to make necessary capital improvements to our properties, pay other expenses or expand our business.
Risks Related to the Self Storage Industry
Because we are focused on the self storage industry, our rental revenues will be significantly influenced by demand for self storage space generally, and a decrease in such demand would likely have a greater adverse effect on our rental revenues than if we owned a more diversified real estate portfolio.
Because our portfolio of properties will consist primarily of self storage facilities, we are subject to risks inherent in investments in a single industry. A decrease in the demand for self storage space would likely have a greater adverse effect on our rental revenues than if we owned a more diversified real estate portfolio. Demand for self storage space has been and could be adversely affected by weakness in the national, regional and local economies and changes in supply of or demand for similar or competing self storage facilities in an area. To the extent that any of these conditions occur, they are likely to affect market rents for self storage space, which could
26
cause a decrease in our rental revenue. Any such decrease could impair our ability to make distributions to our stockholders. We do not expect to invest in other real estate or businesses to hedge against the risk that industry trends might decrease the profitability of our self storage-related investments.
We will face significant competition in the self storage industry, which may increase the cost of acquisitions or developments or impede our ability to retain customers or re-let space when existing customers vacate.
We will face intense competition in every market in which we purchase self storage facilities. We will compete with numerous national, regional, and local developers, owners and operators in the self storage industry, including other REITs, some of which own or may in the future own facilities similar to, or in the same markets as, the self storage properties we acquire, and some of which will have greater capital resources, greater cash reserves, less demanding rules governing distributions to stockholders and a greater ability to borrow funds to acquire facilities. In addition, due to the low cost of each individual self storage facility, other developers, owners and operators have the capability to build additional facilities that may compete with our facilities. This competition for investments may reduce the number of suitable investment opportunities available to us, may increase acquisition costs and may reduce demand for self storage space in certain areas where our facilities are located, all of which may adversely affect our operating results. Additionally, an economic slowdown in a particular market could have a negative effect on our self storage revenues.
If competitors build new facilities that compete with our facilities or offer space at rental rates below the rental rates we charge our customers, we may lose potential or existing customers and we may be pressured to discount our rental rates to retain customers. As a result, our rental revenues may become insufficient to make distributions to our stockholders. In addition, increased competition for customers may require us to make capital improvements to facilities that we would not otherwise make, which could reduce cash available for distribution to our stockholders.
The acquisition of new properties may give rise to difficulties in predicting revenue potential.
New acquisitions could fail to perform in accordance with our expectations. If we fail to accurately estimate occupancy levels, rental rates, operating costs or costs of improvements to bring an acquired facility up to our standards, the performance of the facility may be below expectations. Properties we acquire may have characteristics or deficiencies affecting their valuation or revenue potential that we have not yet discovered. We cannot assure our stockholders that the performance of properties we acquire will increase or be maintained under our management.
We may be unable to promptly re-let units within our facilities at satisfactory rental rates.
Generally our unit leases will be on a month-to-month basis. Delays in re-letting units as vacancies arise would reduce our revenues and could adversely affect our operating performance. In addition, lower-than-expected rental rates and rental concessions upon re-letting could adversely affect our rental revenues and impede our growth.
We will depend on our on-site personnel to maximize customer satisfaction at each of our facilities, and any difficulties we encounter in hiring, training and retaining skilled field personnel may adversely affect our rental revenues.
The customer service, marketing skills, knowledge of local market demand and competitive dynamics of our facility managers will be contributing factors to our ability to maximize our rental income and to achieve the highest sustainable rent levels at each of our facilities. If we are unable to successfully recruit, train and retain qualified field personnel, our rental revenues may be adversely affected, which could impair our ability to make distributions to our stockholders.
27
Legal claims related to moisture infiltration and mold could arise in one or more of our properties, which could adversely affect our revenues.
There has been an increasing number of claims and litigation against owners and managers of rental and self storage properties relating to moisture infiltration, which can result in mold or other property damage. We cannot guarantee that moisture infiltration will not occur at one or more of our properties. When we receive a complaint concerning moisture infiltration, condensation or mold problems and/or become aware that an air quality concern exists, we will implement corrective measures in accordance with guidelines and protocols we have developed with the assistance of outside experts. We cannot assure our stockholders that material legal claims relating to moisture infiltration and the presence of, or exposure to, mold will not arise in the future. These legal claims could require significant expenditures for legal defense representation which could adversely affect our revenues.
Delays in development and lease-up of our properties would reduce our profitability.
With certain properties we plan to acquire, our business plan contemplates repositioning or redeveloping that property with the goal of increasing its cash flow, value or both. Construction delays to new or existing self storage properties due to weather, unforeseen site conditions, personnel problems, and other factors could delay our anticipated tenant occupancy plan which could adversely affect our profitability. Furthermore, our estimate of the costs of repositioning or redeveloping an acquired property may prove to be inaccurate, which may result in our failure to meet our profitability goals. Additionally, we may acquire new properties not fully leased, and the cash flow from existing operations may be insufficient to pay the operating expenses associated with that property until the property is fully leased. If one or more of these properties does not perform as expected or we are unable to successfully integrate new properties into our existing operations, our financial performance and our ability to make distributions may be adversely affected.
Our inability to increase revenue in our current development and lease-up properties could negatively affect our ability to cover distributions.
As of December 31, 2012, we owned several development and lease-up properties, including the Homeland Portfolio properties. Such properties are currently negatively impacting our results of operations and will continue to do so until the occupancy stabilizes. If several of these properties do not continue to perform as expected, our results of operations and our ability to cover distributions may be adversely affected.
The risks associated with storage contents may increase our operating costs or expose us to potential liability that may not be covered by insurance, which may have adverse effects on our results of operations and returns to our stockholders.
The self storage facilities we own and operate are leased directly to tenants who store their belongings without any immediate inspections or oversight from us. We may unintentionally lease space to groups engaged in illegal and dangerous activities. Damage to storage contents may occur due to, among other occurrences, the following: war, acts of terrorism, earthquakes, fire, floods, hurricanes, pollution, environmental matters or events caused by fault of a tenant, fault of a third party or fault of our own. Such damage may or may not be covered by insurance maintained by us, if any. Our customers are required to acquire their own insurance coverage on storage contents or assume all of the risk. Our Advisor will determine the amounts and types of insurance coverage that we will maintain, including any coverage over the contents of any properties in which we may invest. Such determinations will be made on a case-by-case basis by our Advisor based on the type, value, location and risks associated with each investment, as well as any lender requirements, and any other factors our Advisor may consider relevant. Historically, our Sponsor has maintained coverage that includes comprehensive property and general liability coverage, including customer goods legal liability coverage, which covers damage to customer goods due to liability on our part. However, there is no guarantee that such insurance will be obtained for any investments that we may make and there is no guarantee that any particular damage to storage contents would be covered by such insurance, even if obtained. The costs associated with maintaining such insurance, as well as any liability imposed upon us due to damage to storage contents, may have an adverse effect on our results of operations and returns to our stockholders.
28
Additionally, although we will require our tenants to sign an agreement stating that they will not store flammable, hazardous, illegal or dangerous contents in the self storage units, we cannot ensure that our tenants will abide by such agreement. The storage of such materials might cause destruction to a facility or impose liability on us for the costs of removal or remediation if these various contents or substances are released on, from or in a facility, which may have an adverse effect on our results of operations and returns to our stockholders.
Our operating results may be affected by regulatory changes that have an adverse impact on our specific facilities, which may adversely affect our results of operations and returns to our stockholders.
Certain regulatory changes may have a direct impact on our self storage facilities, including but not limited to, land use, zoning and permitting requirements by governmental authorities at the local level, which can restrict the availability of land for development, and special zoning codes which omit certain uses of property from a zoning category. These special uses (i.e., hospitals, schools, and self storage facilities) are allowed in that particular zoning classification only by obtaining a special use permit and the permission of local zoning authority. If we are delayed in obtaining or unable to obtain a special use permit where one is required, new developments or expansion of existing developments could be delayed or reduced. Additionally, certain municipalities require holders of a special use permit to have higher levels of liability coverage than is normally required. The acquisition of, or the inability to obtain, a special use permit and the possibility of higher levels of insurance coverage associated therewith may have an adverse effect on our results of operations and returns to our stockholders.
If we enter into non-compete agreements with the sellers of the self storage properties that we acquire, and the terms of those agreements expire, the sellers may compete with us within the general location of one of our self storage facilities, which could have an adverse effect on our operating results and returns to our stockholders.
We may enter into non-compete agreements with the sellers of the self storage properties that we acquire in order to prohibit the seller from owning, operating, or being employed by a competing self storage property for a predetermined time frame and within a geographic radius of a self storage facility we acquire. When these non-compete agreements expire, we may face the risk that the seller will develop, own, operate or become employed by a competing self storage facility within the general location of one of our properties, which could have an adverse effect on our operating results and returns to our stockholders.
General Risks Related to Investments in Real Estate
Our operating results will be affected by economic and regulatory changes that have an adverse impact on the real estate market in general, and we cannot assure our stockholders that we will be profitable or that we will realize growth in the value of our real estate properties.
Our operating results will be subject to risks generally incident to the ownership of real estate, including:
| | • | | changes in general economic or local conditions; |
| | • | | changes in supply of or demand for similar or competing properties in an area; |
| | • | | changes in interest rates and availability of permanent mortgage funds that may render the sale of a property difficult or unattractive; |
| | • | | changes in tax, real estate, environmental and zoning laws; |
| | • | | changes in property tax assessments and insurance costs; and |
| | • | | increases in interest rates and tight money supply. |
29
These and other reasons may prevent us from being profitable or from realizing growth or maintaining the value of our real estate properties.
We may suffer reduced or delayed revenues for, or have difficulty selling, properties with vacancies.
We anticipate that the majority of the properties we acquire will have stabilized occupancy levels (generally at or above 80%). However, certain of the real properties we acquire may have a higher level of vacancy at the time of closing either because the property is in the process of being developed and constructed, is newly constructed and in the process of obtaining tenants, or because of economic or competitive or other factors. Shortly after a new property is opened, during a time of development and construction, or because of economic or competitive or other factors, we may suffer reduced revenues potentially resulting in lower cash distributions to our stockholders due to a lack of an optimum level of tenants. In addition, the resale value of the real property could be diminished because the market value may depend principally upon the value of the leases of such real property. Also, because a property’s market value depends principally upon its occupancy rate, the resale value of properties with prolonged low occupancy rates could suffer, which could further reduce our stockholders’ returns.
We may obtain only limited warranties when we purchase a property.
The seller of a property will often sell such property in its “as is” condition on a “where is” basis and “with all faults,” without any warranties of merchantability or fitness for a particular use or purpose. In addition, purchase agreements may contain only limited warranties, representations and indemnifications that will only survive for a limited period after the closing. Also, many sellers of real estate are single purpose entities without significant other assets. The purchase of properties with limited warranties or from undercapitalized sellers increases the risk that we may lose some or all of our invested capital in the property as well as rental income from that property.
Our inability to sell a property when we desire to do so could adversely impact our ability to pay cash distributions to our stockholders.
The real estate market is affected by many factors, such as general economic conditions, availability of financing, interest rates and other factors, including supply and demand, that are beyond our control. We cannot predict whether we will be able to sell any property for the price or on the terms set by us, or whether any price or other terms offered by a prospective purchaser would be acceptable to us. We cannot predict the length of time needed to find a willing purchaser and to close the sale of a property. Real estate generally cannot be sold quickly. Also, the tax laws applicable to REITs require that we hold our facilities for investment, rather than for sale in the ordinary course of business, which may cause us to forego or defer sales of facilities that otherwise would be in our best interest. Therefore, we may not be able to dispose of facilities promptly, or on favorable terms, in response to economic or other market conditions, and this may adversely impact our ability to make distributions to our stockholders.
In addition, we may be required to expend funds to correct defects or to make improvements before a property can be sold. We cannot assure our stockholders that we will have funds available to correct such defects or to make such improvements.
In acquiring a property, we may agree to restrictions that prohibit the sale of that property for a period of time or impose other restrictions, such as a limitation on the amount of debt that can be placed or repaid on that property. These provisions would also restrict our ability to sell a property.
We may not be able to sell our properties at a price equal to, or greater than, the price for which we purchased such properties, which may lead to a decrease in the value of our assets.
We may be purchasing our properties at a time when capitalization rates are at historically low levels and purchase prices are high. Therefore, the value of our properties may not increase over time, which may restrict
30
our ability to sell our properties, or in the event we are able to sell such property, may lead to a sale price less than the price that we paid to purchase the properties.
We may acquire or finance properties with lock-out provisions, which may prohibit us from selling a property, or may require us to maintain specified debt levels for a period of years on some properties.
Lock-out provisions are provisions that generally prohibit repayment of a loan balance for a certain number of years following the origination date of a loan. Such provisions are typically provided for by the Code or the terms of the agreement underlying a loan. Lock-out provisions could materially restrict us from selling or otherwise disposing of or refinancing properties. These provisions would affect our ability to turn our investments into cash and thus affect cash available for distribution to our stockholders. Lock-out provisions may prohibit us from reducing the outstanding indebtedness with respect to any properties, refinancing such indebtedness on a non-recourse basis at maturity, or increasing the amount of indebtedness with respect to such properties.
Lock-out provisions could impair our ability to take actions during the lock-out period that would otherwise be in our stockholders’ best interests and, therefore, may have an adverse impact on the value of the shares, relative to the value that would result if the lock-out provisions did not exist. In particular, lock-out provisions could preclude us from participating in major transactions that could result in a disposition of our assets or a change in control, even though that disposition or change in control might be in our stockholders’ best interests.
Rising expenses could reduce cash available for distribution.
Any properties that we buy in the future will be subject to operating risks common to real estate in general, any or all of which may negatively affect us. If any property is not fully occupied or if rents are being paid in an amount that is insufficient to cover operating expenses, we could be required to expend funds for that property’s operating expenses. Our properties will be subject to increases in tax rates, utility costs, operating expenses, insurance costs, repairs and maintenance and administrative expenses.
If we are unable to offset such cost increases through rent increases, we could be required to fund those increases in operating costs which could adversely affect cash available for distribution.
Adverse economic conditions will negatively affect our returns and profitability.
Recent geopolitical events have exacerbated the general economic slowdown that has affected the nation as a whole and the local economies where our properties may be located. Economic weakness and higher unemployment, combined with higher costs, especially for energy, food and commodities, has put considerable pressure on consumer spending, which, along with reduced availability of debt financing, has resulted in many U.S. companies experiencing poorer financial and operating performance over the past few years than in prior periods. The following market and economic challenges may adversely affect our operating results:
| | • | | poor economic times may result in tenant defaults under leases or bankruptcy; |
| | • | | re-leasing may require reduced rental rates under the new leases; and |
| | • | | increased insurance premiums, resulting in part from the increased risk of terrorism and natural disasters, may reduce funds available for distribution. |
A continuing environment of declining prices could further weaken real estate markets. We do not know how long the slowdown will last, or when, or even if, real estate markets will return to more normal conditions. Since we cannot predict when real estate markets may recover, the value of our properties may decline if market conditions persist or worsen. Further, the results of operations for a property in any one period may not be indicative of results in future periods, and the long-term performance of such property generally may not be comparable to, and cash flows may not be as predictable as, other properties owned by third parties in the same
31
or similar industry. The already weak conditions in the real estate markets could be further exacerbated by a deterioration of national or regional economic conditions. Our property values and operations could be negatively affected to the extent that the current economic downturn is prolonged or becomes more severe.
If we suffer losses that are not covered by insurance or that are in excess of insurance coverage, we could lose invested capital and anticipated profits.
Material losses may occur in excess of insurance proceeds with respect to any property, as insurance may not be sufficient to fund the losses. However, there are types of losses, generally of a catastrophic nature, such as losses due to wars, acts of terrorism, earthquakes, floods, hurricanes, pollution or environmental matters, which are either uninsurable or not economically insurable, or may be insured subject to limitations such as large deductibles or co-payments. Insurance risks associated with potential terrorist acts could sharply increase the premiums we pay for coverage against property and casualty claims. Additionally, mortgage lenders in some cases have begun to insist that commercial property owners purchase specific coverage against terrorism as a condition for providing mortgage loans. It is uncertain whether such insurance policies will be available, or available at reasonable cost, which could inhibit our ability to finance or refinance our potential properties. In these instances, we may be required to provide other financial support, either through financial assurances or self-insurance, to cover potential losses. We cannot assure our stockholders that we will have adequate coverage for such losses. The Terrorism Risk Insurance Act of 2002 is designed for a sharing of terrorism losses between insurance companies and the federal government. We cannot be certain how this act will impact us or what additional cost to us, if any, could result. If such an event damaged or destroyed one or more of our properties, we could lose both our invested capital and anticipated profits from such property.
Delays in the acquisition, development and construction of properties may have adverse effects on our results of operations and returns to our stockholders.
Delays we encounter in the selection, acquisition and development of real properties could adversely affect our stockholders’ returns. Although we expect that we will invest primarily in properties that have operating histories or in which construction is complete, from time to time we may acquire unimproved real property, properties that are in need of redevelopment or properties that are under development or construction. Investments in such properties will be subject to the uncertainties associated with the development and construction of real property, including those related to re-zoning land for development, environmental concerns of governmental entities and/or community groups and our builders’ ability to build in conformity with plans, specifications, budgets and timetables. If a builder fails to perform, we may resort to legal action to rescind the purchase or the construction contract or to compel performance. A builder’s performance may also be affected or delayed by conditions beyond the builder’s control.
Where properties are acquired prior to the start of construction or during the early stages of construction, it will typically take several months to complete construction and lease available space. Therefore, our stockholders could suffer delays in the receipt of cash distributions attributable to those particular real properties. We may incur additional risks when we make periodic progress payments or other advances to builders before they complete construction. These and other factors can result in increased costs of a project or loss of our investment. We also must rely on rental income and expense projections and estimates of the fair market value of a property upon completion of construction when agreeing upon a purchase price at the time we acquire the property. If our projections are inaccurate, we may pay too much for a property, and the return on our investment could suffer.
Costs of complying with governmental laws and regulations, including those relating to environmental matters, may adversely affect our income and the cash available for distribution.
All real property, including any self storage properties we acquire, and the operations conducted on real property are subject to federal, state and local laws and regulations relating to environmental protection and human health and safety. These laws and regulations generally govern wastewater discharges, air emissions, the operation and removal of underground and above-ground storage tanks, the use, storage, treatment, transportation
32
and disposal of solid and hazardous materials, and the remediation of contamination associated with disposals. Some of these laws and regulations may impose joint and several liabilities on tenants, owners or operators for the costs to investigate or remediate contaminated properties, regardless of fault or whether the acts causing the contamination were legal. This liability could be substantial. In addition, the presence of hazardous substances, or the failure to properly remediate these substances, may adversely affect our ability to sell or rent a property, or to pledge such property as collateral for future borrowings.
Some of these laws and regulations have been amended so as to require compliance with new or more stringent standards as of future dates. Compliance with new or more stringent laws or regulations or stricter interpretation of existing laws may require us to incur material expenditures. Future laws, ordinances or regulations may impose material environmental liability. Additionally, our tenants’ operations, the existing condition of land when we buy it, operations in the vicinity of our properties, such as the presence of underground storage tanks, or activities of unrelated third parties may affect our properties. In addition, there are various local, state and federal fire, health, life-safety and similar regulations with which we may be required to comply, and that may subject us to liability in the form of fines or damages for noncompliance. Any material expenditures, fines, or damages we must pay will reduce our ability to make distributions to our stockholders and may reduce the value of our stockholders’ investments.
We cannot assure our stockholders that any environmental assessment that we obtain will reveal all environmental liabilities or that a prior owner of a property did not create a material environmental condition not known to us. We cannot predict what other environmental legislation or regulations will be enacted in the future, how existing or future laws or regulations will be administered or interpreted, or what environmental conditions may be found to exist in the future. We cannot assure our stockholders that our business, assets, results of operations, liquidity or financial condition will not be adversely affected by these laws, which may adversely affect cash available for distribution, and the amount of distributions to our stockholders.
Our costs associated with complying with the Americans with Disabilities Act may affect cash available for distribution.
Our properties will be subject to the Americans with Disabilities Act of 1990, or ADA. Under the ADA, all places of public accommodation are required to comply with federal requirements related to access and use by disabled persons. The ADA has separate compliance requirements for “public accommodations” and “commercial facilities” that generally require that buildings and services, including restaurants and retail stores, be made accessible and available to people with disabilities. The ADA’s requirements could require removal of access barriers and could result in the imposition of injunctive relief, monetary penalties, or, in some cases, an award of damages. We will attempt to acquire properties that comply with the ADA or place the burden on the seller or other third party to ensure compliance with the ADA. However, we cannot assure our stockholders that we will be able to acquire properties or allocate responsibilities in this manner. If we cannot, our funds used for ADA compliance may affect cash available for distribution and the amount of distributions to our stockholders.
If we sell properties by providing financing to purchasers, defaults by the purchasers would adversely affect our cash flows.
In some instances we may sell our properties by providing financing to purchasers. When we provide financing to purchasers, we will bear the risk that the purchaser may default, which could negatively impact our cash distributions to stockholders. Additionally, the distribution of the proceeds of sales to our stockholders, or their reinvestment in other assets, will be delayed until the promissory notes or other property we may accept upon the sale are actually paid, sold, refinanced or otherwise disposed of. In some cases, we may receive initial down payments in cash and other property in the year of sale in an amount less than the selling price and subsequent payments will be spread over a number of years. If any purchaser defaults under a financing arrangement with us, it could negatively impact our ability to make distributions to our stockholders.
33
Increases in interest rates may adversely affect the demand for our shares.
One of the factors that influences the demand for purchase of our shares is the annual rate of distributions that we pay on our shares, as compared with interest rates. An increase in interest rates may lead potential purchasers of our shares to demand higher annual distribution rates, which could adversely affect our ability to sell our shares and raise proceeds in the Offering. This could also result in us owning a less diversified portfolio of real estate.
Property taxes may increase, which will adversely affect our net operating income and cash available for distributions.
Each of our properties is subject to real property taxes. Some local real property tax assessors may seek to reassess some of our properties as a result of our acquisition of the property. From time to time, our property taxes may increase as property values or assessment rates change or for other reasons deemed relevant by the assessors. Recent local government shortfalls in tax revenue may cause pressure to increase tax rates or assessment levels. Increases in real property taxes will adversely affect our net operating income and cash available for distributions.
Risks Associated with Debt Financing
If we breach covenants under our loan with KeyBank National Association, we could be held in default under such loan, which could accelerate our repayment date and materially adversely affect the value of our stockholders’ investments in us.On December 27, 2011, we entered into a secured credit facility with KeyBank National Association (“KeyBank”), and as of December 31, 2012 there was approximately $51.7 million outstanding on this loan. The KeyBank loan is secured by cross-collateralized first mortgage liens or first lien deeds of trust on all properties in the Homeland Portfolio and is cross-defaulted to other recourse debt of $25 million or greater in the aggregate or non-recourse debt of $75 million or greater in the aggregate. The loan imposes a number of financial covenant requirements on us. If we should breach certain of those financial covenant requirements or otherwise default on the KeyBank loan, Key Bank could accelerate our repayment date. If we do not have sufficient cash to repay this loan at that time, KeyBank could foreclose on the properties securing the loan. Such foreclosure could result in a material loss for us and would adversely affect the value of our stockholders’ investments in us.
If we breach certain covenants or restrictions under certain of our debt agreements, we could be held in default thereunder, which could allow the lender to accelerate our repayment date or take other action that could materially adversely affect distributions to our stockholders and the value of our stockholders’ investments in us.
Certain of our loans contain various customary covenant requirements and restrictions. If we should breach those requirements or restrictions, or otherwise default on the loans, the respective lenders could accelerate our repayment date or take other action that could be detrimental to us and negatively affect our cash flow. Such actions could adversely affect the distributions we pay to our stockholders and the value of our stockholders’ investments in us.
We have broad authority to incur debt, and high debt levels could hinder our ability to make distributions and could decrease the value of our stockholders’ investments.
Although, technically, our board may approve unlimited levels of debt, our charter generally limits us to incurring debt no greater than 300% of our net assets before deducting depreciation or other non-cash reserves (approximately 75% leverage), unless any excess borrowing is approved by a majority of our independent directors and disclosed to our stockholders in our next quarterly report, along with a justification for such excess borrowing. High debt levels would cause us to incur higher interest charges, would result in higher debt service payments, and could be accompanied by restrictive covenants. These factors could limit the amount of cash we have available to distribute and could result in a decline in the value of our stockholders’ investments.
34
We have incurred, and intend to continue to incur, mortgage indebtedness and other borrowings, which may increase our business risks.
We have placed, and intend to continue to place, permanent financing on our properties or obtain a credit facility or other similar financing arrangement in order to acquire properties as funds are being raised in the Offering. We may also decide to later further leverage our properties. We may incur mortgage debt and pledge all or some of our real properties as security for that debt to obtain funds to acquire real properties. We may borrow if we need funds to pay a desired distribution rate to our stockholders. We may also borrow if we deem it necessary or advisable to assure that we maintain our qualification as a REIT for federal income tax purposes. If there is a shortfall between the cash flow from our properties and the cash flow needed to service mortgage debt, then the amount available for distribution to our stockholders may be reduced.
We have incurred, and intend to continue to incur, indebtedness secured by our properties, which may result in foreclosure.
Most of our borrowings to acquire properties have been and will be secured by mortgages on our properties. If we default on our secured indebtedness, the lender may foreclose and we could lose our entire investment in the properties securing such loan, which could adversely affect distributions to our stockholders. To the extent lenders require us to cross-collateralize our properties, or our loan agreements contain cross-default provisions, a default under a single loan agreement could subject multiple properties to foreclosure.
High interest rates may make it difficult for us to refinance properties, which could reduce the number of properties we can acquire and the amount of cash distributions we can make.
For mortgage debt we have placed on our properties, we run the risk of being unable to refinance the properties when the loans come due, or of being unable to refinance on favorable terms. If interest rates are higher when the properties are refinanced, we may not be able to finance the properties and our income could be reduced. If any of these events occur, our cash flow would be reduced. This, in turn, would reduce cash available for distribution to our stockholders and may hinder our ability to raise more capital by issuing more stock or by borrowing more money.
Lenders have required and will likely continue to require us to enter into restrictive covenants relating to our operations, which could limit our ability to make distributions to our stockholders.
When providing financing, lenders often impose restrictions on us that affect our distribution and operating policies and our ability to incur additional debt. Loan documents we enter into typically contain covenants that limit our ability to further mortgage the property, discontinue insurance coverage or replace our Advisor or our Property Manager. These or other limitations may adversely affect our flexibility and limit our ability to make distributions to our stockholders.
Increases in interest rates could increase the amount of our debt payments and adversely affect our ability to make distributions to our stockholders.
We have incurred indebtedness and expect that we will incur further indebtedness in the future. Interest we pay will reduce cash available for distribution. Additionally, if we incur variable rate debt, increases in interest rates would increase our interest costs, which could reduce our cash flows and our ability to make distributions to our stockholders. In addition, if we need to repay existing debt during periods of rising interest rates, we could be required to liquidate one or more of our investments in properties at times that may not permit realization of the maximum return on such investments.
Continued disruptions in the credit markets could have a material adverse effect on our results of operations, financial condition and ability to pay distributions to our stockholders.
Domestic and international financial markets have experienced significant disruptions which have been brought about in large part by failures in the U.S. banking system. These disruptions have severely impacted the
35
availability of credit and have contributed to rising costs associated with obtaining credit. If debt financing is not available on terms and conditions we find acceptable, we may not be able to obtain financing for investments. If these disruptions in the credit markets persist, our ability to borrow monies to finance the purchase of, or other activities related to, real estate assets will be negatively impacted. If we are unable to borrow monies on terms and conditions that we find acceptable, we likely will have to reduce the number of properties we can purchase, and the return on the properties we do purchase may be lower. In addition, if we pay fees to lock in a favorable interest rate, falling interest rates or other factors could require us to forfeit these fees. All of these events would have a material adverse effect on our results of operations, financial condition and ability to pay distributions.
Risks Associated with Co-Ownership of Real Estate
We may have increased exposure to liabilities from litigation as a result of our participation in a tenant-in-common program.
Strategic Capital Holdings, LLC, our Sponsor and an affiliate of our Advisor, has developed tenant-in-common programs to facilitate the acquisition of real estate properties to be owned in co-tenancy arrangements with persons who are looking to invest proceeds from a sale of real estate to qualify for like-kind exchange treatment under Section 1031 of the Code. We may participate in a tenant-in-common program by either co-investing in the property with the exchange investors or purchasing a tenant-in common interest from an affiliate of our Advisor, generally at the cost of the property paid by such affiliate. Changes in tax laws may result in tenant-in-common programs no longer being available, which may adversely affect such programs or cause them not to achieve their intended value. Even though we will not sponsor these tenant-in-common programs, we may be named in or otherwise required to defend against any lawsuits brought by tenant-in-common participants because of our affiliation with sponsors of such transactions. Furthermore, in the event that the Internal Revenue Service (IRS) conducts an audit of the purchasers of co-tenancy interests and successfully challenges the qualification of the transaction as a like-kind exchange, purchasers of co-tenancy interests may file a lawsuit against the entity offering the co-tenancy interests, its sponsors, and/or us. In such event, we may be involved in one or more such offerings and could therefore be named in or otherwise required to defend against lawsuits brought by other tenant-in-common participants. Any amounts we are required to expend defending any such claims will reduce the amount of funds available for investment by us in properties or other investments and may reduce the amount of funds available for distribution to our stockholders. In addition, disclosure of any such litigation may adversely affect our ability to raise additional capital in the future through the sale of stock.
We may be subject to risks associated with tenant-in-common programs inherent in ownership of co-tenancy interests with non-affiliated third parties.
In connection with some of our property acquisitions, we currently or subsequently may become tenant-in-common owners of properties in which an affiliate of our Advisor sells tenant-in-common interests to tenant-in-common participants. As an owner of tenant-in-common interests in properties, we will be subject to the risks inherent to the ownership of co-tenancy interests with unrelated third parties. In a substantial majority of these transactions, the underlying property serves as collateral for the mortgage loan to finance the purchase of the property. To the extent the loan is not repaid in full as part of the tenant-in-common program, the loan remains outstanding after the sale of the co-tenancy interests to the tenant-in-common participants. Each co-tenant is a borrower under the loan agreements. These loans generally are non-recourse against the tenant-in-common participants’ interests and are secured by the real property. However, the tenant-in-common participants are required to indemnify, and become liable to, the lender for customary carve-outs under the applicable financing documents, including, but not limited to, fraud or intentional misrepresentation by a co-tenant or a guarantor of the loan, physical waste of the property, misapplication or misappropriation of insurance proceeds, and failure to pay taxes.
36
We will be subject to risks associated with the co-tenants in our co-ownership arrangements that otherwise may not be present in other real estate investments.
We may enter into tenant-in-common, Delaware Statutory Trust (DST), or other co-ownership arrangements with respect to a portion of the properties we acquire. In connection with the two mergers with private real estate investment trusts we completed on September 24, 2009, we acquired minority interests in several DSTs affiliated with our Sponsor. We also acquired additional interests in some of those DSTs subsequent to the mergers. Ownership of co-ownership interests involves risks generally not otherwise present with an investment in real estate, particularly in respect to tenant-in-common programs, such as the following:
| | • | | the risk that a co-owner may at any time have economic or business interests or goals that are or become inconsistent with our business interests or goals; |
| | • | | the risk that a co-owner may be in a position to take action contrary to our instructions or requests or contrary to our policies or objectives; |
| | • | | the possibility that an individual co-owner might become insolvent or bankrupt, or otherwise default under the applicable mortgage loan financing documents, which may constitute an event of default under all of the applicable mortgage loan financing documents or allow the bankruptcy court to reject the tenants-in-common agreement or management agreement entered into by the co-owner owning interests in the property; |
| | • | | the possibility that a co-owner might not have adequate liquid assets to make cash advances that may be required in order to fund operations, maintenance and other expenses related to the property, which could result in the loss of current or prospective tenants and may otherwise adversely affect the operation and maintenance of the property, and could cause a default under the mortgage loan financing documents applicable to the property and may result in late charges, penalties and interest, and may lead to the exercise of foreclosure and other remedies by the lender; |
| | • | | the risk that a co-owner could breach agreements related to the property, which may cause a default under, or result in personal liability for, the applicable mortgage loan financing documents, violate applicable securities law and otherwise adversely affect the property and the co-ownership arrangement; or |
| | • | | the risk that a default by any co-owner would constitute a default under the applicable mortgage loan financing documents that could result in a foreclosure and the loss of all or a substantial portion of the investment made by the co-owner. |
Any of the above might subject a property to liabilities in excess of those contemplated and thus reduce the amount available for distribution to our stockholders.
In the event that our interests become adverse to those of the other co-owners, we will not have the contractual right to purchase the co-ownership interests from the other co-owners. Even if we are given the opportunity to purchase such co-ownership interests in the future, we cannot guarantee that we will have sufficient funds available at the time to purchase co-ownership interests from the co-owners.
We might want to sell our co-ownership interests in a given property at a time when the other co-owners in such property do not desire to sell their interests. Therefore, we may not be able to sell our interest in a property at the time we would like to sell. In addition, we anticipate that it will be much more difficult to find a willing buyer for our co-ownership interests in a property than it would be to find a buyer for a property we owned outright.
Federal Income Tax Risks
Failure to qualify as a REIT would adversely affect our operations and our ability to make distributions, as we would incur additional tax liabilities.
Baker Donelson, our legal counsel, has rendered its opinion that we have been organized in conformity with the requirements for qualification and taxation as a REIT pursuant to Sections 856 through 860 of the Code
37
beginning with our taxable year ended December 31, 2008, and that our organization and method of operation will enable us to meet the qualifications and requirements for taxation as a REIT under the Code, based upon our representations as to the manner in which we are and will be owned and our investment in assets and manner of operation, among other things. However, our qualification as a REIT will depend upon our ability to meet, through investments, actual operating results, distributions and satisfaction of specific stockholder rules, the various tests imposed by the Code. Baker Donelson will not review these operating results or compliance with the qualification standards on an ongoing basis. This means that we may fail to satisfy the REIT requirements in the future. Also, this opinion represents Baker Donelson’s legal judgment based on the law in effect as of the date of the opinion. Baker Donelson’s opinion is not binding on the IRS or the courts and we will not apply for a ruling from the IRS regarding our status as a REIT. Future legislative, judicial or administrative changes to the federal income tax laws could be applied retroactively, which could result in our disqualification as a REIT.
If we fail to qualify as a REIT for any taxable year, we will be subject to federal income tax and any applicable alternative minimum tax on our taxable income at regular corporate rates. In addition, we would generally be disqualified from treatment as a REIT for the four taxable years following the year of losing our REIT status. Losing our REIT status would reduce our net earnings available for investment or distribution to stockholders because of the additional tax liability. In addition, distributions to stockholders would no longer qualify for the distributions paid deduction, and we would no longer be required to make distributions. If this occurs, we might be required to borrow funds or liquidate some investments in order to pay the applicable tax.
To qualify as a REIT, and to avoid the payment of federal income and excise taxes and maintain our REIT status, we may be forced to borrow funds, use proceeds from the issuance of securities (including the Offering), or sell assets to pay distributions, which may result in our distributing amounts that may otherwise be used for our operations.
To obtain the favorable tax treatment accorded to REITs, we normally will be required each year to distribute to our stockholders at least 90% of our real estate investment trust taxable income, determined without regard to the deduction for distributions paid and excluding net capital gains. We will be subject to federal income tax on our undistributed taxable income and net capital gain and subject to a 4% nondeductible excise tax on any amount by which distributions we pay with respect to any calendar year are less than the sum of (1) 85% of our ordinary income, (2) 95% of our capital gain net income, and (3) 100% of our undistributed income from prior years. These requirements could cause us to distribute amounts that otherwise would be spent on acquisitions of properties, and it is possible that we might be required to borrow funds, use proceeds from the issuance of securities (including the Offering) or sell assets in order to distribute enough of our taxable income to maintain our REIT status and to avoid the payment of federal income and excise taxes. These methods of obtaining funding could affect future distributions by increasing operating costs and decreasing available cash. In addition, such distributions may constitute a return of investors’ capital.
If any of our partnerships fails to maintain its status as a partnership for federal income tax purposes, its income would be subject to taxation and our REIT status would be terminated.
We intend to maintain the status of our partnerships, including our Operating Partnership, as partnerships for federal income tax purposes. However, if the IRS were to successfully challenge the status of any of our partnerships as a partnership, it would be taxable as a corporation. Such an event would reduce the amount of distributions that such partnership could make to us. This would also result in our losing REIT status and becoming subject to a corporate level tax on our own income. This would substantially reduce our cash available to pay distributions and the return on our stockholders’ investments. In addition, if any of the entities through which any of our partnerships owns its properties, in whole or in part, loses its characterization as a partnership for federal income tax purposes, it would be subject to taxation as a corporation, thereby reducing distributions to such partnership. Such a recharacterization of any of our partnerships or an underlying property owner could also threaten our ability to maintain REIT status.
38
Our stockholders may have tax liability on distributions they elect to reinvest in our common stock.
If our stockholders participate in our distribution reinvestment plan, they will be deemed to have received, and for income tax purposes will be taxed on, the amount reinvested in common stock to the extent the amount reinvested was not a tax-free return of investors’ capital. As a result, unless our stockholders are a tax-exempt entity, our stockholders may have to use funds from other sources to pay their tax liability on the value of the common stock received.
In certain circumstances, we may be subject to federal and state income taxes as a REIT, which would reduce our cash available for distribution to our stockholders.
Even if we qualify and maintain our status as a REIT, we may be subject to federal income taxes or state taxes. For example, net income from a “prohibited transaction” will be subject to a 100% tax. We may not be able to make sufficient distributions to avoid excise taxes applicable to REITs. We may also decide to retain income we earn from the sale or other disposition of our property and pay income tax directly on such income. In that event, our stockholders would be treated as if they earned that income and paid the tax on it directly. However, stockholders that are tax-exempt, such as charities or qualified pension plans, would have no benefit from their deemed payment of such tax liability. We may also be subject to state and local taxes on our income or property, either directly, at the level of the operating partnership, or at the level of the other companies through which we indirectly own our assets. Any federal or state taxes we pay will reduce our cash available for distribution to our stockholders.
We may be required to pay some taxes due to actions of our taxable REIT subsidiaries, which would reduce our cash available for distribution to our stockholders.
Any net taxable income earned directly by our taxable REIT subsidiaries, or through entities that are disregarded for federal income tax purposes as entities separate from our taxable REIT subsidiaries, will be subject to federal and possibly state corporate income tax. We have elected to treat Strategic Storage TRS, Inc., along with our Canadian taxable REIT subsidiary, as taxable REIT subsidiaries, and we may elect to treat other subsidiaries as taxable REIT subsidiaries in the future. In this regard, several provisions of the laws applicable to REITs and their subsidiaries ensure that a taxable REIT subsidiary will be subject to an appropriate level of federal income taxation. For example, a taxable REIT subsidiary is limited in its ability to deduct certain interest payments made to an affiliated REIT. In addition, the REIT has to pay a 100% penalty tax on some payments that it receives or on some deductions taken by a taxable REIT subsidiary if the economic arrangements between the REIT, the REIT’s customers, and the taxable REIT subsidiary are not comparable to similar arrangements between unrelated parties. Finally, some state and local jurisdictions may tax some of our income even though as a REIT we are not subject to federal income tax on that income, because not all states and localities follow the federal income tax treatment of REITs. To the extent that we and our affiliates are required to pay federal, state and local taxes, we will have less cash available for distributions to our stockholders.
Distributions to tax-exempt investors may be classified as unrelated business taxable income.
Neither ordinary nor capital gain distributions with respect to our common stock nor gain from the sale of common stock should generally constitute unrelated business taxable income (UBTI) to a tax-exempt investor. However, there are certain exceptions to this rule. In particular:
| | • | | part of the income and gain recognized by certain qualified employee pension trusts with respect to our common stock may be treated as UBTI if shares of our common stock are predominately held by qualified employee pension trusts, we are required to rely on a special look-through rule for purposes of meeting one of the REIT share ownership tests, and we are not operated in a manner to avoid treatment of such income or gain as UBTI; |
| | • | | part of the income and gain recognized by a tax exempt investor with respect to our common stock would constitute UBTI if the investor incurs debt in order to acquire the common stock; and |
39
| | • | | part or all of the income or gain recognized with respect to our common stock by social clubs, voluntary employee benefit associations, supplemental unemployment benefit trusts and qualified group legal services plans which are exempt from federal income taxation under Sections 501(c)(7), (9), (17) or (20) of the Code may be treated as UBTI. |
Complying with the REIT requirements may cause us to forego otherwise attractive opportunities.
To qualify as a REIT for federal income tax purposes, we must continually satisfy tests concerning, among other things, the sources of our income, the nature and diversification of our assets, the amounts we distribute to our stockholders and the ownership of shares of our common stock. We may be required to make distributions to stockholders at disadvantageous times or when we do not have funds readily available for distribution, or we may be required to liquidate otherwise attractive investments in order to comply with the REIT tests. Thus, compliance with the REIT requirements may hinder our ability to operate solely on the basis of maximizing profits.
Legislative or regulatory action could adversely affect investors.
On January 2, 2013, President Obama signed into law the American Taxpayer Relief Act of 2012, extending the existing 15% qualified dividend rate for 2013 and subsequent taxable years for those individuals with incomes below certain thresholds. For those with income above such thresholds, the qualified dividend rate is 20%. These tax rates are generally not applicable to distributions paid by a REIT, unless such distributions represent earnings on which the REIT itself has been taxed. As a result, distributions (other than capital gain distributions) we pay to individual investors generally will be subject to the tax rates that are otherwise applicable to ordinary income for federal income tax purposes, which currently are as high as 39.6%. This disparity in tax treatment may make an investment in our shares comparatively less attractive to individual investors than an investment in the shares of non-REIT corporations, and could have an adverse effect on the value of our common stock. Our stockholders are urged to consult with their own tax advisors with respect to the impact of recent legislation on our stockholders’ investments in our common stock and the status of legislative, regulatory or administrative developments and proposals and their potential effect on an investment in our common stock.
Foreign purchasers of our common stock may be subject to FIRPTA tax upon the sale of their shares.
A foreign person disposing of a U.S. real property interest, including shares of a U.S. corporation whose assets consist principally of U.S. real property interests, is generally subject to a tax, known as FIRPTA tax, on the gain recognized on the disposition. Such FIRPTA tax does not apply, however, to the disposition of stock in a REIT if the REIT is “domestically controlled.” A REIT is “domestically controlled” if less than 50% of the REIT’s stock, by value, has been owned directly or indirectly by persons who are not qualifying U.S. persons during a continuous five-year period ending on the date of disposition or, if shorter, during the entire period of the REIT’s existence.
We cannot assure our stockholders that we will qualify as a “domestically controlled” REIT. If we were to fail to so qualify, gain realized by foreign investors on a sale of our shares would be subject to FIRPTA tax, unless our shares were traded on an established securities market and the foreign investor did not at any time during a specified testing period directly or indirectly own more than 5% of the value of our outstanding common stock.
40
ERISA Risks
There are special considerations that apply to pension or profit-sharing trusts or IRAs investing in our shares which could cause an investment in our company to be a prohibited transaction and could result in additional tax consequences.
If our stockholders are investing the assets of a pension, profit-sharing, 401(k), Keogh or other qualified retirement plan or the assets of an IRA in our common stock, stockholders should satisfy themselves that, among other things:
| | • | | their investment is consistent with their fiduciary obligations under ERISA and the Code; |
| | • | | their investment is made in accordance with the documents and instruments governing their plan or IRA, including their plan’s investment policy; |
| | • | | their investment satisfies the prudence and diversification requirements of ERISA; |
| | • | | their investment will not impair the liquidity of the plan or IRA; |
| | • | | their investment will not produce UBTI for the plan or IRA; |
| | • | | they will be able to value the assets of the plan annually in accordance with ERISA requirements; and |
| | • | | their investment will not constitute a prohibited transaction under Section 406 of ERISA or Section 4975 of the Code. |
Persons investing the assets of employee benefit plans should consider ERISA risks of investing in our shares.
ERISA and Code Section 4975 prohibit certain transactions that involve (1) certain pension, profit-sharing, employee benefit, or retirement plans or individual retirement accounts and Keogh plans, and (2) any person who is a “party-in-interest” or “disqualified person” with respect to such a plan. Consequently, the fiduciary of a plan contemplating an investment in the shares should consider whether we, any other person associated with the issuance of the shares, or any of their affiliates is or might become a “party-in-interest” or “disqualified person” with respect to the plan and, if so, whether an exception from such prohibited transaction rules is applicable. In addition, the Department of Labor plan asset regulations provide that, subject to certain exceptions, the assets of an entity in which a plan holds an equity interest may be treated as assets of an investing plan, in which event the underlying assets of such entity (and transactions involving such assets) would be subject to the prohibited transaction provisions. We intend to take such steps as may be necessary to qualify us for one or more of the exceptions available, and thereby prevent our assets as being treated as assets of any investing plan.
| ITEM 1B. | UNRESOLVED STAFF COMMENTS |
Not Applicable.
As of December 31, 2012, we wholly-owned 110 self storage facilities located in 17 states (Alabama, Arizona, California, Florida, Georgia, Illinois, Kentucky, Mississippi, Nevada, New Jersey, New York, North Carolina, Pennsylvania, South Carolina, Tennessee, Texas and Virginia) and Canada comprising approximately 70,190 units and approximately 9.2 million rentable square feet. Of the 110 properties we wholly-owned as of December 31, 2012, 19 were acquired during 2012. As of December 31, 2012, we also had minority interests in eight additional self storage facilities located in three states, comprising approximately 5,550 units and approximately 600,400 rentable square feet. Our interests in these properties range from 0.28% to 12.26%. Additionally, we have a minority interest in a net leased industrial property in California with 356,000 rentable square feet leased to a single tenant.
41
As of December 31, 2012, our wholly-owned self storage portfolio was comprised as follows:
| | | | | | | | | | | | | | | | | | | | | | | | | | | | |
State | | No. of
Properties | | | Units | | | Sq. Ft.
(net) | | | % of Total
Rentable
Sq. Ft. | | | Physical
Occupancy
%(1) | | | Climate-
Controlled
%(2) | | | Rental
Income
%(3) | |
Alabama(4) | | | 2 | | | | 1,075 | | | | 148,200 | | | | 1.6 | % | | | 73.2 | % | | | 45.6 | % | | | 1.1 | % |
Arizona | | | 4 | | | | 1,975 | | | | 243,900 | | | | 2.7 | % | | | 83.0 | % | | | 21.0 | % | | | 2.2 | % |
California(4) | | | 8 | | | | 6,400 | | | | 849,600 | | | | 9.2 | % | | | 91.0 | % | | | 19.2 | % | | | 15.2 | % |
Florida | | | 10 | | | | 7,750 | | | | 877,300 | | | | 9.5 | % | | | 81.6 | % | | | 44.7 | % | | | 11.0 | % |
Georgia | | | 22 | | | | 12,990 | | | | 1,708,900 | | | | 18.6 | % | | | 70.6 | % | | | 52.3 | % | | | 14.3 | % |
Illinois | | | 4 | | | | 2,455 | | | | 394,000 | (5) | | | 4.3 | % | | | 75.5 | % | | | 1.8 | % | | | 4.3 | % |
Kentucky | | | 5 | | | | 2,870 | | | | 415,700 | | | | 4.5 | % | | | 85.0 | % | | | 2.0 | % | | | 4.3 | % |
Mississippi | | | 3 | | | | 1,495 | | | | 224,300 | | | | 2.4 | % | | | 79.1 | % | | | 24.3 | % | | | 0.5 | % |
Nevada | | | 8 | | | | 4,735 | | | | 639,000 | | | | 7.0 | % | | | 80.0 | % | | | 60.0 | % | | | 6.0 | % |
New Jersey | | | 5 | | | | 4,180 | | | | 399,600 | | | | 4.4 | % | | | 86.3 | % | | | 59.7 | % | | | 9.1 | % |
New York | | | 1 | | | | 700 | | | | 82,800 | | | | 0.9 | % | | | 86.4 | % | | | 20.2 | % | | | 1.1 | % |
North Carolina | | | 3 | | | | 1,560 | | | | 207,600 | | | | 2.3 | % | | | 83.5 | % | | | 17.8 | % | | | 1.8 | % |
Ontario, Canada(6) | | | 3 | | | | 2,805 | | | | 320,600 | | | | 3.5 | % | | | 55.8 | % (7) | | | 67.9 | % | | | 2.9 | % |
Pennsylvania | | | 4 | | | | 2,210 | | | | 285,700 | | | | 3.1 | % | | | 72.2 | % | | | 10.6 | % | | | 2.8 | % |
South Carolina | | | 12 | | | | 6,605 | | | | 859,100 | | | | 9.3 | % | | | 75.0 | % | | | 21.6 | % | | | 8.4 | % |
Tennessee | | | 1 | | | | 855 | | | | 157,100 | | | | 1.7 | % | | | 80.2 | % | | | 0.0 | % | | | 0.9 | % |
Texas(4) | | | 10 | | | | 6,250 | | | | 1,036,600 | | | | 11.3 | % | | | 85.5 | % | | | 21.8 | % | | | 9.4 | % |
Virginia | | | 5 | | | | 3,280 | | | | 343,900 | | | | 3.7 | % | | | 78.5 | % | | | 42.4 | % | | | 4.7 | % |
| | | | | | | | | | | | | | | | | | | | | | | | | | | | |
Total | | | 110 | | | | 70,190 | | | | 9,193,900 | | | | 100 | % | | | 79.1 | % | | | 33.5 | % | | | 100 | % |
| | | | | | | | | | | | | | | | | | | | | | | | | | | | |
| (1) | Represents the occupied square feet of all facilities we own in a state divided by total rentable square feet of all the facilities we owned in such state as of December 31, 2012. |
| (2) | Represents the percentage of rentable square feet in climate-controlled units as of December 31, 2012 for each state. |
| (3) | Represents rental income (excludes administrative fees, late fees, and ancillary income) for all facilities we owned in a state divided by our total rental income for the month of December 2012. |
| (4) | Does not include properties in which we own a minority interest, including the interests owned in the Montgomery County Self Storage, DST properties, the San Francisco Self Storage DST property, the Hawthorne property, and the Southwest Colonial, DST properties. |
| (5) | Includes approximately 85,000 rentable square feet of industrial warehouse/office space at the Chicago – Ogden Ave. property. |
| (6) | The Brewster property is currently under construction, thus the related occupancy statistics exclude this property. |
| (7) | Included in the occupancy calculation for Ontario, Canada is the Mississauga property, which was 34% occupied as of December 31, 2012. The construction on this property was fully completed in December 2012. |
42
The map below shows the geographic location of our self storage portfolio as of December 31, 2012.
The weighted average capitalization rate at acquisition for these 110 self storage facilities we owned as of December 31, 2012 was approximately 7.22% (7.58% for the 85 properties we acquired that were stabilized upon acquisition and 4.51% for the 23 that were lease-up properties at acquisition, and we had two properties that were under development at acquisition). Upon stabilization of the lease-up properties, we expect the capitalization rate of these properties to increase. The weighted average capitalization rate is calculated as the estimated first year annual net operating income at the respective property divided by the property purchase price, exclusive of offering costs, closing costs and fees paid to our Advisor. Estimated first year net operating income on our real estate investments is total estimated revenues generally derived from the terms of in-place leases at the time we acquire the property, less property operating expenses generally based on the operating history of the property. In instances where management determines that historical amounts will not be representative of first year revenues or property operating expenses, management uses its best faith estimate of such amounts based on anticipated property operations. Estimated first year net operating income excludes interest expense, asset management fees, depreciation and amortization and our company-level general and administrative expenses. Historical operating income for these properties is not necessarily indicative of future operating results.
| (a) | From time to time, we are party to legal proceedings that arise in the ordinary course of our business. We are not aware of any legal proceedings of which the outcome is reasonably likely to have a material adverse effect on our results of operations or financial condition, nor are we aware of any such legal proceedings contemplated by governmental authorities. |
| ITEM 4. | MINE SAFETY DISCLOSURES |
Not Applicable.
43
PART II
| ITEM 5. | MARKET FOR REGISTRANT’S COMMON EQUITY, RELATED STOCKHOLDER MATTERS AND ISSUER PURCHASES OF EQUITY SECURITIES |
Market Information
As of March 21, 2013, we had approximately 47.2 million shares of common stock outstanding, including approximately 3.3 million shares issued pursuant to our distribution reinvestment plan, held by a total of approximately 14,100 stockholders of record. There is no established trading market for our common stock. Therefore, there is a risk that a stockholder may not be able to sell our stock at a time or price acceptable to the stockholder, or at all. We are currently selling shares of our common stock to the public at a price of $10.79 per share and at a price of approximately $10.25 per share pursuant to our distribution reinvestment plan. Additionally, we provide discounts in our Offering for certain categories of purchasers, including based on volume discounts. Pursuant to the terms of our charter, certain restrictions are imposed on the ownership and transfer of shares.
Unless and until our shares are listed on a national securities exchange, it is not expected that a public market for our shares will develop. To assist fiduciaries of plans subject to the annual reporting requirements of ERISA and IRA trustees or custodians to prepare reports relating to an investment in our shares, we intend to provide reports of our quarterly and annual determinations of the current value of our net assets per outstanding share to those fiduciaries (including IRA trustees and custodians) who identify themselves to us and request the reports. We intend to provide the estimated value of our shares in our annual report each year.
Effective June 1, 2012, the offering price of our shares of common stock increased from $10.00 per share to $10.79 per share. This increase was primarily based on the April 2, 2012 estimated per share value of our common stock of $10.79 which was calculated based on the estimated value of our assets less the estimated value of our liabilities, or net asset value, divided by the number of shares outstanding on an adjusted fully diluted basis, calculated as of December 31, 2011. In light of the above-described net asset value calculation, our board of directors determined that it was appropriate to increase the per share offering price for new purchases of our shares commencing on June 1, 2012. This determination by our board of directors was subjective and was primarily based on (i) the estimated net asset value per share, which was predominantly based on an independent third party appraiser’s valuation of our properties as of December 31, 2011, (ii) the commissions and dealer manager fees payable in connection with the offering of our shares, (iii) our historical and anticipated results of operations and financial condition, (iv) our current and anticipated distribution payments, (v) our current and anticipated capital and debt structure, and (vi) our Advisor’s recommendations and assessment of our prospects and continued execution of our investment and operating strategies. Please see our Form 8-K filed with the SEC on April 3, 2012 for more detailed information relating to the key assumptions used by the independent third-party appraiser and the methodology used by our board of directors to determine the per share offering price. We intend to use this net asset valuation as the estimated per share value of our shares until the next net asset valuation approved by our board of directors, which we expect to occur subsequent to the closing of our current Offering and in conformity with applicable FINRA rules. The estimated value per share does not represent the fair value of our assets less our liabilities according to GAAP nor does it represent a liquidation value of our assets and liabilities or the amount at which our shares of common stock would trade on a national securities exchange.
We will provide annual reports of our determination of value (1) to IRA trustees and custodians not later than January 15 of each year, and (2) to other plan fiduciaries within 75 days after the end of each calendar year. Each determination may be based upon valuation information available as of October 31 of the preceding year, updated, however, for any material changes occurring between October 31 and December 31.
There can be no assurance, however, with respect to any estimate of value that we prepare, that:
| | • | | the estimated value per share would actually be realized by our stockholders upon liquidation, because these estimates do not necessarily indicate the price at which properties can be sold; |
44
| | • | | our stockholders would be able to realize estimated net asset values if they were to attempt to sell their shares, because no public market for our shares exists or is likely to develop; or |
| | • | | that the value, or method used to establish value, would comply with ERISA or Code requirements described above. |
Distributions
We made an election to be taxed as a REIT under Sections 856 through 860 of the Code beginning with the taxable year ended December 31, 2008. To qualify as a REIT, we must meet certain organizational and operational requirements, including a requirement to currently distribute at least 90% of the REIT’s ordinary taxable income to stockholders. As a REIT, we generally will not be subject to federal income tax on taxable income that we distribute to our stockholders. If we fail to qualify as a REIT in any taxable year, we will then be subject to federal income taxes on our taxable income at regular corporate rates and will not be permitted to qualify for treatment as a REIT for federal income tax purposes for four years following the year during which qualification is lost unless the IRS grants us relief under certain statutory provisions. Such an event could materially adversely affect our net income and net cash available for distribution to stockholders. However, we believe that we will be organized and operate in such a manner as to qualify for treatment as a REIT and intend to operate in the foreseeable future in such a manner that we will remain qualified as a REIT for federal income tax purposes.
For income tax purposes, distributions to common stockholders are characterized as ordinary dividends, capital gain dividends, or as nontaxable distributions. To the extent that we make a distribution in excess of our current or accumulated earnings and profits, the distribution will be a non-taxable return of capital, reducing the tax basis in each U.S. stockholder’s shares, and the amount of each distribution in excess of a U.S. stockholder’s tax basis in its shares will be taxable as gain realized from the sale of its shares. For 2008 and 2009 all of our distributions constituted non-taxable returns of capital, which were paid from offering proceeds. For 2010, we paid a total of approximately $14.6 million in distributions, of which approximately $12.7 million constituted a non-taxable return of capital. For 2011, we paid a total of approximately $21.4 million in distributions, of which approximately $19.5 million constituted a non-taxable return of capital. For 2012, we paid a total of approximately $28.1 million in distributions, all of which constituted a non-taxable return of capital. In addition, approximately $12.3 million of distributions in 2012 were re-invested pursuant to our distribution reinvestment plan.
The following table shows the distributions we have declared and paid during the years ended December 31, 2012 and 2011:
| | | | | | | | |
Quarter | | Total Distributions
Declared and Paid (1) | | | Distributions
Declared per
Common Share | |
1st Quarter 2011 | | $ | 4,656,227 | | | $ | .175 | |
2nd Quarter 2011 | | $ | 5,188,650 | | | $ | .175 | |
3rd Quarter 2011 | | $ | 5,566,844 | | | $ | .175 | |
4th Quarter 2011 | | $ | 5,945,668 | | | $ | .175 | |
1st Quarter 2012 | | $ | 6,135,014 | | | $ | .175 | |
2nd Quarter 2012 | | $ | 6,576,722 | | | $ | .175 | |
3rd Quarter 2012 | | $ | 7,645,017 | | | $ | .175 | |
4th Quarter 2012 | | $ | 7,786,627 | | | $ | .175 | |
| (1) | Declared distributions are paid monthly in arrears. All declared amounts were paid as of December 31, 2012, except for distributions related to shares owned during December 2012, which were paid on January 15, 2013. |
45
Securities Authorized for Issuance Under Equity Compensation Plans
The following table provides details of our Employee and Director Long-Term Incentive Plan as of December 31, 2012, under which shares of our common stock are authorized for issuance.
| | | | | | | | | | | | |
Plan Category | | Number of
Securities to be
Issued Upon
Exercise of
Outstanding
Options, Warrants
and Rights | | | Weighted
Average Exercise
Price of
Outstanding
Options,
Warrants and
Rights | | | Number of Securities
Remaining for Future
Issuance Under
Equity Compensation
Plans | |
Equity Compensation Plans Approved by Security Holders | | | — | | | | — | | | | 4,603,474 | |
Equity Compensation Plans Not Approved by Security Holders | | | — | | | | — | | | | — | |
| | | | | | | | | | | | |
Total | | | — | | | | — | | | | 4,603,474 | |
| | | | | | | | | | | | |
Use of Proceeds from Registered Securities
On March 17, 2008, our Initial Offering (SEC File No. 333-146959) for a maximum of 110,000,000 shares of common stock, consisting of 100,000,000 shares for sale to the public and 10,000,000 shares for sale pursuant to our distribution reinvestment plan, was declared effective by the SEC. We terminated the Initial Offering on September 16, 2011, prior to the sale of all securities registered in the Initial Offering. On September 22, 2011, our Offering (SEC File No. 333-168905) for a maximum of 110,000,000 shares of common stock, consisting of 100,000,000 shares for sale to the public and 10,000,000 shares for sale pursuant to our distribution reinvestment plan, was declared effective by the SEC. As of December 31, 2012, we had issued approximately 42.7 million shares of common stock in our Initial Offering and Offering, raising gross offering proceeds of approximately $426 million. From this amount, we incurred approximately $12.6 million in acquisition fees to our Advisor, approximately $39 million in selling commissions and dealer manager fees (of which approximately $31 million was reallowed to third party broker-dealers), and approximately $4.4 million in organization and offering costs to our Advisor. With the net offering proceeds and indebtedness, we acquired approximately $463 million in self storage facilities and made the other payments reflected under “Cash Flows from Financing Activities” in our consolidated statements of cash flows included in this report.
Purchases of Equity Securities by the Issuer and Affiliated Purchasers
As noted in Notes 2 and 8 of the Notes to the Consolidated Financial Statements included in this report, and more fully described in our prospectus, as supplemented from time to time, our board of directors adopted a share redemption program on February 25, 2008 as revised in October 2011 and March 2012, which enables our stockholders to have their shares redeemed by us, subject to the significant conditions and limitations described in our prospectus. Our share redemption program has no set termination date, but our ability to redeem shares under the program is limited as described in our prospectus. During the year ended December 31, 2012, we redeemed approximately 1.3 million shares of common stock for approximately $12.6 million ($9.60 per share). During the year ended December 31, 2011, we redeemed approximately 993,300 shares of common stock for approximately $9.7 million ($9.75 per share). During the year ended December 31, 2010, we redeemed 381,800 shares of common stock for approximately $3.7 million ($9.57 per share). During the year ended December 31, 2009, we redeemed 11,916 shares of common stock for approximately $114,300 ($9.59 per share). We redeemed no shares of common stock in the year ended December 31, 2008. We have funded all redemptions using proceeds from the sale of shares pursuant to our distribution reinvestment plan.
46
As of December 31, 2012, we had redemption requests for approximately 444,000 shares of common stock for approximately $4.3 million that, if honored in full, would have caused us to exceed the limits of the share redemption program. We honored such redemption requests, pursuant to the terms of the share redemption program, redeeming all death and disability redemption requests and approximately 76% of the other redemption requests. Such redemptions totaled approximately 343,600 shares for approximately $3.3 million ($9.69 per share) and were redeemed on January 31, 2013 and such amount was reclassified from redeemable common stock to accounts payable and accrued liabilities in the consolidated balance sheets as of December 31, 2012. As of December 31, 2012, we had approximately 100,400 shares that were requested for redemption, but could not be redeemed as it would have caused us to exceed the limits of the share redemption program. We treated the remainder of each redemption request as a request for redemption in the first quarter of 2013. We have funded all redemptions using proceeds from the sale of shares pursuant to our distribution reinvestment plan. Our board of directors may choose to amend, suspend or terminate our share redemption program upon 30 days’ written notice at any time.
During the year ended December 31, 2012, we redeemed shares as follows:
| | | | | | | | | | | | |
For the Quarter Ended(1) | | Total Number of Shares
Redeemed | | | Average Price
Paid per Share | | | Total Number of Shares Redeemed
as Part of Publicly Announced
Plans or Programs | |
March 31, 2012 | | | 92,002 | | | $ | 9.65 | | | | 92,002 | |
June 30, 2012 | | | 566,969 | | | $ | 9.57 | | | | 566,969 | |
September 30, 2012 | | | 295,897 | | | $ | 9.62 | | | | 295,897 | |
December 31, 2012 | | | 355,659 | | | $ | 9.61 | | | | 355,659 | |
| (1) | We redeem shares on a quarterly basis; shares are redeemed on the last business day of the month following the end of each quarter. |
47
| ITEM 6. | SELECTED FINANCIAL DATA |
The following selected financial and operating information should be read in conjunction with “Management’s Discussion and Analysis of Financial Condition and Results of Operations,” and the financial statements and related notes thereto included elsewhere in this Form 10-K:
| | | | | | | | | | | | | | | | | | | | |
| | | For the Year
Ended
December 31,
2012 | | | For the Year
Ended
December 31,
2011 | | | For the Year
Ended
December 31,
2010 | | | For the Year
Ended
December 31,
2009 | | | For the Year
Ended
December 31,
2008 | |
| | | | | |
Operating Data | | | | | | | | | | | | | | | | | | | | |
Total revenues | | $ | 66,610,504 | | | $ | 49,396,078 | | | $ | 26,161,182 | | | $ | 7,875,143 | | | $ | 365,651 | |
Loss from continuing operations | | | (19,015,142 | ) | | | (21,834,237 | ) | | | (13,247,015 | ) | | | (7,404,519 | ) | | | (1,595,043 | ) |
Net loss attributable to Strategic Storage Trust, Inc. | | | (18,973,712 | ) | | | (21,357,429 | ) | | | (12,790,815 | ) | | | (7,302,896 | ) | | | (1,504,293 | ) |
Loss from continuing operations per common share-basic and diluted | | | (0.46 | ) | | | (0.68 | ) | | | (0.59 | ) | | | (1.00 | ) | | | (2.50 | ) |
Dividends declared per common share (annualized) | | | 0.70 | | | | 0.70 | | | | 0.70 | | | | 0.70 | | | | 0.70 | |
| | | | | |
Balance Sheet Data | | | | | | | | | | | | | | | | | | | | |
Real estate facilities | | $ | 604,727,895 | | | $ | 510,395,576 | | | $ | 274,568,200 | | | $ | 155,058,360 | | | $ | 15,166,724 | |
Total assets | | | 631,235,662 | | | | 550,434,267 | | | | 307,361,213 | | | | 203,701,303 | | | | 19,819,983 | |
Total debt | | | 353,440,758 | | | | 330,043,207 | | | | 119,811,948 | | | | 78,256,583 | | | | 4,000,000 | |
Total liabilities | | | 371,174,593 | | | | 342,035,731 | | | | 126,805,993 | | | | 82,997,383 | | | | 5,532,519 | |
Stockholders’ equity | | | 256,100,405 | | | | 205,590,699 | | | | 176,224,923 | | | | 119,068,866 | | | | 14,287,464 | |
| | | | | |
Other Data | | | | | | | | | | | | | | | | | | | | |
Net cash provided by (used in) operating activities | | $ | 9,550,340 | | | $ | 2,838,807 | | | $ | 944,256 | | | $ | (2,595,891 | ) | | $ | (1,106,248 | ) |
Net cash used in investing activities | | | (95,632,616 | ) | | | (206,361,756 | ) | | | (124,477,551 | ) | | | (44,300,463 | ) | | | (16,311,595 | ) |
Net cash provided by financing activities | | | 86,814,473 | | | | 210,297,834 | | | | 106,192,928 | | | | 68,060,180 | | | | 19,831,475 | |
48
| ITEM 7. | MANAGEMENT’S DISCUSSION AND ANALYSIS OF FINANCIAL CONDITION AND RESULTS OF OPERATIONS |
The following discussion and analysis should be read in conjunction with the “Selected Financial Data” above and our accompanying consolidated financial statements and the notes thereto. See also “Cautionary Note Regarding Forward-Looking Statements” preceding Part I.
Overview
As described in more detail in Item 1 of this report, we are a public, non-traded REIT that invests primarily in self storage facilities and related self storage real estate investments. We were formed on August 14, 2007. We made an election to be taxed as a REIT beginning with the taxable year ended December 31, 2008. We have no paid employees. Our Advisor is responsible for managing our affairs on a day-to-day basis and identifying and making acquisitions and investments on our behalf under the terms of the advisory agreement with our Advisor. Our Advisor was formed on August 13, 2007.
On March 17, 2008, we began our Initial Offering. On May 22, 2008, we satisfied the minimum offering requirements of the Initial Offering and commenced formal operations. On September 16, 2011, we terminated the Initial Offering, having sold approximately 29 million shares for gross proceeds of approximately $289 million. On September 22, 2011, we commenced our Offering. As of December 31, 2012, we had raised gross offering proceeds of approximately $426 million in our Initial Offering and our Offering.
As of December 31, 2012, we wholly-owned 110 self storage facilities located in 17 states (Alabama, Arizona, California, Florida, Georgia, Illinois, Kentucky, Mississippi, Nevada, New Jersey, New York, North Carolina, Pennsylvania, South Carolina, Tennessee, Texas and Virginia) and Canada comprising approximately 70,190 units and approximately 9.2 million rentable square feet. As of December 31, 2012, we also had minority interests in eight additional self storage facilities. Additionally, we have an interest in a net leased industrial property in California with 356,000 rentable square feet leased to a single tenant.
Critical Accounting Estimates
We have established accounting policies which conform to generally accepted accounting principles (“GAAP”). Preparing financial statements in conformity with GAAP requires management to use judgment in the application of accounting policies, including making estimates and assumptions. Following is a discussion of the estimates and assumptions used in setting accounting policies that we consider critical in the presentation of our financial statements. Many estimates and assumptions involved in the application of GAAP may have a material impact on our financial condition or operating performance, or on the comparability of such information to amounts reported for other periods, because of the subjectivity and judgment required to account for highly uncertain items or the susceptibility of such items to change. These estimates and assumptions affect our reported amounts of assets and liabilities, our disclosure of contingent assets and liabilities at the dates of the financial statements and our reported amounts of revenue and expenses during the period covered by this report. If management’s judgment or interpretation of the facts and circumstances relating to various transactions had been different, it is possible that different accounting policies would have been applied or different amounts of assets, liabilities, revenues and expenses would have been recorded, thus resulting in a materially different presentation of the financial statements or materially different amounts being reported in the financial statements. Additionally, other companies may use different estimates and assumptions that may impact the comparability of our financial condition and results of operations to those companies.
We believe that our critical accounting policies include the following: real estate purchase price allocations; the evaluation of whether any of our long-lived assets have been impaired; the determination of the useful lives of our long-lived assets; and the evaluation of the consolidation of our interests in joint ventures. The following discussion of these policies supplements, but does not supplant the description of our significant accounting policies, as contained in Note 2 of the Notes to the Consolidated Financial Statements contained in this report, and is intended to present our analysis of the uncertainties involved in arriving upon and applying each policy.
49
Real Estate Purchase Price Allocation
We allocate the purchase prices of acquired properties based on a number of estimates and assumptions. We allocate the purchase prices to the tangible and intangible assets acquired and the liabilities assumed based on estimated fair values. These estimated fair values are based upon comparable market sales information for land and estimates of depreciated replacement cost of equipment, building and site improvements. Acquisitions of portfolios of properties are allocated to the individual properties based upon an income approach or a cash flow analysis using appropriate risk adjusted capitalization rates which we estimate based upon the relative size, age, and location of the individual property along with actual historical and estimated occupancy and rental rate levels, and other relevant factors. If available, and determined by management to be appropriate, appraised values are used, rather than these estimated values. Because we believe that substantially all of the leases in place at properties we will acquire will be at market rates, as the majority of the leases are month-to-month contracts, we do not expect to allocate any portion of the purchase prices to above or below market leases. The determination of market rates is also subject to a number of estimates and assumptions. Our allocations of purchase prices could result in a materially different presentation of the financial statements or materially different amounts being reported in the financial statements, as such allocations may vary dramatically based on the estimates and assumptions we use.
Impairment of Long-Lived Assets
The majority of our assets consist of long-lived real estate assets as well as intangible assets related to our acquisitions. We will continually evaluate such assets for impairment based on events and changes in circumstances that may arise in the future and that may impact the carrying amounts of our long-lived assets. When indicators of potential impairment are present, we will assess the recoverability of the particular asset by determining whether the carrying value of the asset will be recovered, through an evaluation of the undiscounted future operating cash flows expected from the use of the asset and its eventual disposition. This evaluation is based on a number of estimates and assumptions. Based on this evaluation, if the expected undiscounted future cash flows do not exceed the carrying value, we will adjust the value of the long-lived asset and recognize an impairment loss. Our evaluation of the impairment of long-lived assets could result in a materially different presentation of the financial statements or materially different amounts being reported in the financial statements, as the amount of impairment loss, if any, recognized may vary based on the estimates and assumptions we use.
Estimated Useful Lives of Long-Lived Assets
We assess the useful lives of the assets underlying our properties based upon a subjective determination of the period of future benefit for each asset. We will record depreciation expense with respect to these assets based upon the estimated useful lives we determine. Our determinations of the useful lives of the assets could result in a materially different presentation of the financial statements or materially different amounts being reported in the financial statements, as such determinations, and the corresponding amount of depreciation expense, may vary dramatically based on the estimates and assumptions we use.
Consolidation of Investments in Joint Ventures
We evaluate the consolidation of our investments in joint ventures in accordance with relevant accounting guidance. This evaluation requires us to determine whether we have a controlling interest in a joint venture through a means other than voting rights, and, if so, such joint venture may be required to be consolidated in our financial statements. Our evaluation of our joint ventures under such accounting guidance could result in a materially different presentation of the financial statements or materially different amounts being reported in the financial statements, as the entities included in our financial statements may vary based on the estimates and assumptions we use.
50
REIT Qualification
We made an election under Section 856(c) of the Code to be taxed as a REIT commencing with the taxable year ended December 31, 2008. By qualifying as a REIT for federal income tax purposes, we generally will not be subject to federal income tax on income that we distribute to our stockholders. If we fail to qualify as a REIT in any taxable year, we will be subject to federal income tax on our taxable income at regular corporate rates and will not be permitted to qualify for treatment as a REIT for federal income tax purposes for four years following the year in which our qualification is denied. Such an event could materially and adversely affect our net income and could have a material adverse impact on our financial condition and results of operations. However, we believe that we are organized and will operate in a manner that will enable us to qualify for treatment as a REIT for federal income tax purposes commencing with the year ended December 31, 2008, and we intend to continue to operate as to remain qualified as a REIT for federal income tax purposes.
Results of Operations
Overview
We derive revenues principally from rents received from our customers who rent units at our self storage facilities under month-to-month leases. Therefore, our operating results depend significantly on our ability to retain our existing customers and lease our available self storage units to new customers, while maintaining and, where possible, increasing the prices for our self storage units. Additionally, our operating results depend on our customers making their required rental payments to us. We believe that our Property Manager’s approach to the management and operation of our facilities, which emphasizes local market oversight and control, results in quick and effective response to changes in local market conditions, including increasing rents and/or increasing occupancy levels where appropriate.
Competition in the market areas in which we operate is significant and affects the occupancy levels, rental rates, rental revenues and operating expenses of our facilities. Development of any new self storage facilities would intensify competition of self storage operators in markets in which we operate.
As of December 31, 2012, 2011 and 2010, we wholly-owned 110, 91 and 45 self storage facilities, respectively. The comparability of our results of operations is significantly affected by our acquisition activity in 2012, 2011 and 2010 as listed below.
| | • | | In 2012, we acquired 19 self storage facilities for consideration of approximately $93 million. Of the 110 properties we owned as of December 31, 2012, we owned them for an average of approximately ten months during 2012. |
| | • | | In 2011, we acquired 46 self storage facilities for consideration of approximately $245 million. Of the 91 properties we owned as of December 31, 2011, we owned them for an average of approximately nine months during 2011. |
| | • | | In 2010, we acquired 19 self storage facilities for consideration of approximately $126 million. Of the 45 properties we owned as of December 31, 2010, we owned them for an average of approximately nine months during 2010. |
Related to the acquisition activity noted above, we acquired the Homeland Portfolio (a lease-up portfolio with initial occupancy of 46%) on December 27, 2011. In connection therewith we incurred additional debt by entering into the Second Restated KeyBank Loan and the KeyBank Bridge Loan. Additional discussion of the aforementioned is included below.
Due to the items noted above, we believe there is little basis for comparison between the years ended December 31, 2012, 2011 and 2010.
51
Homeland Portfolio
On December 27, 2011, we acquired the Homeland Portfolio (consisting of 12 self storage lease-up facilities with initial occupancy of 46%) for $80 million. We believe that in 2013 the Homeland Portfolio will provide additional operating income and cash flows. However, we expect the Homeland Portfolio to continue to negatively impact our results of operations as it did in the year ended December 31, 2012, albeit to a lesser extent, for at least the next several fiscal quarters for several reasons. First, the Homeland Portfolio is a lease-up portfolio and while occupancy is increasing (69% as of December 31, 2012), these properties are currently operating at a loss, after considering interest expense and deferred financing amortization expense. Second, during 2012, we offered additional concessions to increase occupancy. However, as the occupancy begins to stabilize, such concessions will decrease and rental revenues should be positively impacted. Third, we incurred additional debt by entering into the Second Restated KeyBank Loan and the KeyBank Bridge Loan to acquire the Homeland Portfolio. See “Note 5 – Secured Debt”. This additional debt, the majority of which was utilized to fund the acquisition of the Homeland Portfolio, resulted in the recognition of approximately $4.2 million of interest expense and approximately $1.8 million deferred financing amortization expense (a non-cash expense) for the year ended December 31, 2012, which negatively impacted our operating results. Furthermore, for the year ended December 31, 2012, included in interest expense was $0.8 million and included in deferred financing amortization expense was $1.0 million of amounts related to the KeyBank Bridge Loan, which was repaid in full on August 7, 2012 and as such, these amounts will not impact future results. Below is a chart illustrating the increase in the Homeland Portfolio occupancy since our acquisition:
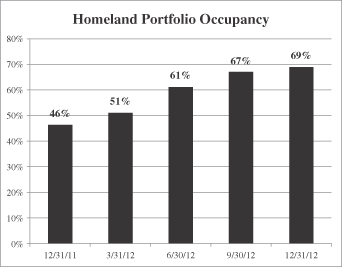
Comparison of the Years Ended December 31, 2012 and 2011
Self Storage Rental Revenue
Rental revenue for the year ended December 31, 2012 was approximately $64.5 million, as compared to rental revenue for the year ended December 31, 2011 of approximately $48.1 million, an increase of approximately $16.4 million. The increase in rental revenue arises primarily from a full year of rental revenue from the 46 properties acquired in 2011 (approximately $12.1 million), the acquisition of 19 properties during 2012 (approximately $2.4 million) and an increase in same-store rental revenue (approximately $1.9 million). We expect rental revenue to increase in future periods as we derive rental revenue for the entire year for properties acquired during 2012 and as we acquire additional operating facilities.
52
Ancillary Operating Revenue
Ancillary operating revenue for the year ended December 31, 2012 was approximately $2.1 million, as compared to ancillary operating revenue for the year ended December 31, 2011 of approximately $1.3 million. The increase in ancillary operating revenue is due to the same factors as noted above in self storage rental revenue and as a result of our emphasis on increasing tenant insurance sales. We expect ancillary operating revenue to increase in future periods as we derive ancillary operating revenue for the entire year for properties acquired during 2012 and as we acquire additional self storage facilities.
Property Operating Expenses
Property operating expenses for the year ended December 31, 2012 were approximately $25.9 million (approximately 38.9% of total revenues) as compared to property operating expenses for the year ended December 31, 2011 of approximately $19.4 million (approximately 39.3% of total revenues). Property operating expenses includes the costs to operate our facilities including payroll, utilities, insurance, real estate taxes and marketing. The majority of the increase in property operating expenses arises from the increase in the number of self storage facilities we owned, partially off-set by a decrease in same-store property operating expenses of approximately $0.4 million. As a percentage of total revenues, our property operating expenses decreased by approximately 0.4% over 2011, primarily due to increased same-store revenues and cost reduction initiatives. Our same-store property operating expenses as a percentage of revenues decreased by 3.2% for the year ended December 31, 2012 (approximately 36.5% of total revenues) compared to the same period in 2011 (approximately 39.7% of total revenues) due to increased same-store revenues and cost reduction initiatives. We expect property operating expenses to increase in future periods as we incur such expenses for the entire year for properties acquired during 2012 and as we acquire additional self storage facilities.
Property Operating Expenses—affiliates
Property operating expenses—affiliates for the year ended December 31, 2012 were approximately $8.3 million (approximately 12.4% of total revenues) as compared to property operating expenses—affiliates for the year ended December 31, 2011 of approximately $5.7 million (approximately 11.5% of total revenues). Property operating expenses – affiliates includes property management fees and asset management fees. The increase in property operating expenses—affiliates primarily arises from the increase in the number of self storage facilities we owned. Property operating expenses—affiliates as a percentage of revenues increased by approximately 0.9% for the year ended December 31, 2012 compared to 2011, as the year ended December 31, 2012 included the Homeland Portfolio lease-up properties and the Mississauga lease-up property. Such lease-up properties’ operating expenses are significantly higher as a percentage of revenues than our stabilized properties. We expect that as these properties achieve stabilization their property operating expenses—affiliates as a percentage of revenues will decrease. Our same-store property operating expenses—affiliates as a percentage of revenues decreased by 0.4% for the year ended December 31, 2012 (approximately 10.9% of total revenues) compared to the same period in 2011 (approximately 11.3% of total revenues) primarily due to increased same-store revenues. We expect property operating expenses—affiliates to increase in future periods as we incur such expenses for the entire year for properties acquired during 2012 and as we acquire additional self storage facilities.
General and Administrative Expenses
General and administrative expenses were approximately $2.4 million for each of the years ended December 31, 2012 and 2011. Such expenses consist primarily of legal expenses, accounting expenses, transfer agent fees, directors’ and officers’ insurance expense and board of directors related costs. During the year ended December 31, 2012 and the three final quarters of 2011, our Advisor permanently waived certain reimbursable amounts that were due pursuant to the advisory agreement. Such reimbursements, totaling approximately $250,000, were not waived in the first quarter of 2011. The reduction in general and administrative expenses in 2012, due to the waiver of such reimbursements for an additional quarter, was primarily off-set by an increase in
53
transfer agent costs, as our investor base increased. We expect general and administrative expenses to increase in future periods as we acquire additional self storage facilities, but expect such expenses to decrease as a percentage of total revenues.
Depreciation and Intangible Amortization Expenses
Depreciation and amortization expenses for the year ended December 31, 2012 were approximately $25.8 million, compared to approximately $23.4 million for year ended December 31, 2011. Depreciation expense consists primarily of depreciation on the buildings and site improvements at our properties. Amortization expense consists of the amortization of intangible assets resulting from our acquisitions. The increase in depreciation expense is attributable to the increase in the number of self storage facilities we owned, while the decrease in amortization expense primarily relates to certain of our intangible assets that became fully amortized during the year ended December 31, 2012. We expect depreciation and amortization expenses to increase in future periods as we acquire additional operating facilities.
Property Acquisition Expenses
Property acquisition expenses for the year ended December 31, 2012 were approximately $3.6 million, as compared to approximately $7.7 million for the year ended December 31, 2011. The decrease in property acquisition expenses arises primarily from acquiring fewer properties in 2012 compared to 2011. We expect property acquisition expenses to fluctuate commensurate with our acquisition activity.
Interest Expense
Interest expense for the year ended December 31, 2012 was approximately $17.8 million, as compared to interest expense of approximately $11.9 million for the year ended December 31, 2011. The increase primarily relates to additional interest incurred on the Second Restated KeyBank Loan (approximately $3.8 million), the KeyBank Bridge Loan (approximately $0.8 million) and other new debt. We expect interest expense to increase in future periods as such expense is incurred for the entire year for debt transactions completed in 2012 and to the extent we acquire additional properties through the issuance or assumption of secured debt.
Deferred Financing Amortization Expense
Deferred financing amortization expense for the year ended December 31, 2012 was approximately $3.5 million, as compared to approximately $1.3 million for the year ended December 31, 2011. The increase primarily relates to the additional amortization of deferred financing fees incurred on the Second Restated KeyBank Loan (approximately $1.1 million), the KeyBank Bridge Loan (approximately $0.9 million) and other new debt incurred.
Gain on Sale of Investment in Unconsolidated Joint Venture
Gain on sale of investment in unconsolidated joint venture for the year ended December 31, 2012 was approximately $0.8 million compared to none for the year ended December 31, 2011. The gain relates to the sale of our interests in an unconsolidated joint venture which owns a self storage facility in Baltimore, Maryland.
54
Same-Store Facility Results
The following table sets forth operating data for our same-store facilities. We consider the following data to be meaningful as this allows for the comparison of results without the effects of acquisition or development activity.
| | | | | | | | | | | | | | | | | | | | | | | | | | | | | | | | | | | | |
| | | Same-Store Facilities | | | Non Same-Store Facilities | | | Total | |
| | | 2012 | | | 2011 | | | %
Change | | | 2012 | | | 2011 | | | %
Change | | | 2012 | | | 2011 | | | %
Change | |
Revenue (1) | | $ | 38,828,725 | | | $ | 36,614,516 | | | | 6.0 | % | | $ | 27,781,779 | | | $ | 12,781,562 | | | | 117 | % | | $ | 66,610,504 | | | $ | 49,396,078 | | | | 34.8 | % |
Property operating expenses (2) | | | 16,189,611 | | | | 16,306,189 | | | | (0.7 | %) | | | 13,421,094 | | | | 5,779,488 | | | | 132 | % | | | 29,610,705 | | | | 22,085,677 | | | | 34.1 | % |
| | | | | | | | | | | | | | | | | | | | | | | | | | | | | | | | | | | | |
Operating income | | $ | 22,639,114 | | | $ | 20,308,327 | | | | 11.5 | % | | $ | 14,360,685 | | | $ | 7,002,074 | | | | 105 | % | | $ | 36,999,799 | | | $ | 27,310,401 | | | | 35.5 | % |
| | | | | | | | | | | | | | | | | | | | | | | | | | | | | | | | | | | | |
Number of facilities (3) | | | 46 | | | | 46 | | | | | | | | 65 | | | | 46 | | | | | | | | 111 | | | | 92 | | | | | |
Rentable square feet | | | 4,265,000 | | | | 4,265,000 | | | | | | | | 5,006,800 | | | | 3,667,700 | | | | | | | | 9,271,800 | | | | 7,932,700 | | | | | |
Average physical occupancy (4) | | | 80 | % | | | 76 | % | | | | | | | N/M | | | | N/M | | | | | | | | 77 | % | | | 77 | % | | | | |
Rent per occupied square foot (5) | | $ | 0.87 | | | $ | 0.87 | | | | | | | | N/M | | | | N/M | | | | | | | $ | 0.81 | | | $ | 0.83 | | | | | |
N/M Not meaningful
| (1) | Revenue includes rental revenue, ancillary revenue, and administrative and late fees. |
| (2) | Property operating expenses excludes corporate general and administrative expenses, asset management fees, interest expense, depreciation, amortization expense and acquisition expenses. |
| (3) | For purposes of this comparison, we have included our consolidated joint venture, SF Property, in same-store facilities. |
| (4) | Determined by dividing the sum of the month-end occupied square feet for the applicable group of facilities for each applicable period by the sum of their month-end rentable square feet for the period. Properties are included in the respective calculations in their first full month of operations, as appropriate. |
| (5) | Determined by dividing the aggregate realized rental revenue for each applicable period by the aggregate of the month-end occupied square feet for the period. Properties are included in the respective calculations in their first full month of operations, as appropriate. |
Our increase in same-store revenue was primarily the result of increased average physical occupancy for the year of approximately 400 basis points over 2011 and increased tenant insurance revenue due to increased penetration rates year over year. Same-store operating income increased year over year due to the increased revenue noted above along with decreases in payroll, utilities and repairs and maintenance expenses.
55
In addition to the annual same-store comparison above, we have included the table below to illustrate the change of both same-store revenue and operating income in each quarter of 2012 over the same quarter in 2011:
| | | | | | | | | | | | | | | | |
| | | Three months ended | |
| | | March 31, 2012 | | | June 30, 2012 | | | September 30, 2012 | | | December 31, 2012 | |
Same-store revenue growth(1) | | | 3.5 | % | | | 4.5 | % | | | 5.5 | % | | | 5.8 | % |
Same-store operating income growth(2) | | | 7.5 | % | | | 5.7 | % | | | 8.5 | % | | | 10.4 | % |
Number of properties | �� | | 46 | | | | 61 | | | | 72 | | | | 77 | |
| (1) | Represents the percentage change in revenue of our same-store facilities for the respective quarter in 2012 compared to the same quarter of 2011. Same-store revenue includes rental revenue, ancillary revenue, and administrative and late fees. |
| (2) | Represents the percentage change in operating income of our same-store facilities for the respective quarter in 2012 compared to the same quarter of 2011. Same-store operating income is calculated as revenue, as defined above, less property operating expenses (which excludes corporate general and administrative expenses, asset management fees, interest expense, depreciation, amortization and acquisition expenses). |
Comparison of the Years Ended December 31, 2011 and 2010
Self Storage Rental Revenue
Rental revenue for the year ended December 31, 2011 was approximately $48.1 million, as compared to rental revenue for the year ended December 31, 2010 of approximately $25.6 million. The increase in rental revenue arises primarily from the acquisition of 46 properties during 2011 (approximately $12.4 million) and a full year of rental revenue from the 19 properties acquired in 2010 (approximately $9.8 million).
Ancillary Operating Revenue
Ancillary operating revenue for the year ended December 31, 2011 was approximately $1.3 million, as compared to ancillary operating revenue for the year ended December 31, 2010 of approximately $0.6 million. The increase in ancillary operating revenue is due to the same factors as noted above in self storage rental revenue and as a result of our increased emphasis on tenant insurance sales.
Property Operating Expenses
Property operating expenses for the year ended December 31, 2011 were approximately $19.4 million as compared to property operating expenses for the year ended December 31, 2010 of approximately $10.1 million. The increase in property operating expenses arises primarily from the acquisition of 46 properties during 2011 and a full year of property operating expenses from the 19 properties acquired in 2010. Property operating expenses include the costs to operate our facilities including payroll, utilities, insurance, real estate taxes and marketing.
Property Operating Expenses—affiliates
Property operating expenses—affiliates for the year ended December 31, 2011 were approximately $5.7 million as compared to property operating expenses—affiliates for the year ended December 31, 2010 of approximately $2.7 million. Property operating expenses—affiliates include property management fees and asset management fees. The increase in property operating expenses—affiliates is due to the same factors as noted above in property operating expenses.
56
General and Administrative Expenses
General and administrative expenses for the year ended December 31, 2011 were approximately $2.4 million as compared to general and administrative expenses for the year ended December 31, 2010 of approximately $2.8 million. Such expenses consist primarily of legal and accounting expenses, directors’ and officers’ insurance expense, transfer agent costs, an allocation of a portion of our Advisor’s payroll related costs and board of director’s related costs. The decrease is primarily due to our Advisor’s permanent waiver of certain reimbursable amounts due pursuant to the advisory agreement; such amounts were waived for the last three fiscal quarters of 2011 and totaled approximately $740,000 for the year ended December 31, 2011. Partially offsetting the reduction related to the aforementioned waived reimbursable amounts were additional costs related to branding and other increases commensurate with our increased size.
Depreciation and Intangible Amortization Expenses
Depreciation and amortization expenses for the year ended December 31, 2011 were approximately $23.4 million, as compared to depreciation and amortization expenses for the year ended December 31, 2010 of approximately $13.1 million. The increase in depreciation and amortization expenses arises primarily from the acquisition of 46 properties during 2011 and a full year of such expenses on the 2010 acquisitions. Depreciation expense consists primarily of deprecation on the buildings and site improvements at our properties. Amortization expense consists of the amortization of intangible assets resulting from our acquisitions.
Property Acquisition Expenses
Property acquisition expenses for the year ended December 31, 2011 were approximately $7.7 million, as compared to approximately $5.2 million for the year ended December 31, 2010. The increase in property acquisition expenses arises primarily from the acquisition of 46 properties during 2011 as compared to 19 properties during 2010.
Interest Expense
Interest expense for the year ended December 31, 2011 was approximately $11.9 million, as compared to interest expense of approximately $6.0 million for the year ended December 31, 2010. The increase between 2010 and 2011 is primarily due to increased debt levels.
Deferred Financing Amortization Expense
Deferred financing amortization expense for the year ended December 31, 2011 was approximately $1.3 million, as compared to approximately $0.3 million for the year ended December 31, 2010. The increase between 2010 and 2011 is primarily due to increased debt levels.
Equity in Earnings of Real Estate Ventures
Equity in earnings of real estate ventures for the year ended December 31, 2011 was approximately $0.9 million compared to approximately $0.9 million for the year ended December 31, 2010.
57
Same-Store Facility Results
The following table sets forth operating data for our same-store facilities. We consider the following data to be meaningful as this allows for the comparison of results without the effects of acquisition or development activity.
| | | | | | | | | | | | | | | | | | | | | | | | | | | | | | | | | | | | |
| | | Same-Store Facilities | | | Non Same-Store Facilities | | | Total | |
| | | 2011 | | | 2010 | | | %
Change | | | 2011 | | | 2010 | | | %
Change | | | 2011 | | | 2010 | | | %
Change | |
Revenue (1) | | $ | 19,987,673 | | | $ | 19,567,237 | | | | 2.1 | % | | $ | 29,408,405 | | | $ | 6,593,945 | | | | 346 | % | | $ | 49,396,078 | | | $ | 26,161,182 | | | | 88.8 | % |
Property operating expenses (2) | | | 8,558,310 | | | | 8,432,797 | | | | 1.5 | % | | | 13,527,367 | | | | 2,948,320 | | | | 359 | % | | | 22,085,677 | | | | 11,381,117 | | | | 94.1 | % |
| | | | | | | | | | | | | | | | | | | | | | | | | | | | | | | | | | | | |
Operating income | | $ | 11,429,363 | | | $ | 11,134,440 | | | | 2.6 | % | | $ | 15,881,038 | | | $ | 3,645,625 | | | | 336 | % | | $ | 27,310,401 | | | $ | 14,780,065 | | | | 84.8 | % |
| | | | | | | | | | | | | | | | | | | | | | | | | | | | | | | | | | | | |
Number of facilities (3) | | | 27 | | | | 27 | | | | | | | | 65 | | | | 19 | | | | | | | | 92 | | | | 46 | | | | | |
Rentable square feet | | | 2,630,400 | | | | 2,630,400 | | | | | | | | 5,302,300 | | | | 1,634,600 | | | | | | | | 7,932,700 | | | | 4,265,000 | | | | | |
Average physical occupancy (4) | | | 79 | % | | | 79 | % | | | | | | | N/M | | | | N/M | | | | | | | | 77 | % | | | 78 | % | | | | |
Rent per occupied square foot (5) | | $ | 0.74 | | | $ | 0.74 | | | | | | | | N/M | | | | N/M | | | | | | | $ | 0.83 | | | $ | 0.82 | | | | | |
N/M Not meaningful
| (1) | Revenue includes rental revenue, ancillary revenue, and administrative and late fees. |
| (2) | Property operating expenses excludes corporate general and administrative expenses, asset management fees, interest expense, depreciation, amortization expense and acquisition expenses. |
| (3) | For purposes of this comparison, we have included our consolidated joint venture, SF Property, in same-store facilities. |
| (4) | Determined by dividing the sum of the month-end occupied square feet for the applicable group of facilities for each applicable period by the sum of their month-end rentable square feet for the period. Properties are included in the respective calculations in their first full month of operations, as appropriate. |
| (5) | Determined by dividing the aggregate realized rental revenue for each applicable period by the aggregate of the month-end occupied square feet for the period. Properties are included in the respective calculations in their first full month of operations, as appropriate. |
Our increase in same-store revenue was primarily the result of slightly increased average physical occupancy of approximately 30 basis points over the prior year and increased tenant insurance revenue due to increased penetration rates achieved in the fourth quarter of 2011. Same-store operating income increased year over year due to the increased revenue noted above, off-set primarily by moderate increases in property taxes and repairs and maintenance, while other costs generally remained constant.
58
In addition to the annual same-store analysis above, we have included the table below to illustrate the change of both same-store revenue and operating income in each quarter of 2011 relative to the same quarter in 2010:
| | | | | | | | | | | | | | | | |
| | | Three months ended | |
| | | March 31, 2011 | | | June 30, 2011 | | | September 30, 2011 | | | December 31, 2011 | |
Same-store revenue change(1) | | | 2.1 | % | | | 1.7 | % | | | 0.9 | % | | | 2.3 | % |
Same-store operating income change(2) | | | 4.6 | % | | | 2.9 | % | | | 0.1 | % | | | (0.4 | %) |
Number of properties | | | 27 | | | | 30 | | | | 35 | | | | 36 | |
| (1) | Represents the percentage change in revenue of our same-store facilities for the respective quarter in 2011 compared to the same quarter of 2010. Same-store revenue includes rental revenue, ancillary revenue, and administrative and late fees. |
| (2) | Represents the percentage change in operating income of our same-store facilities for the respective quarter in 2011 compared to the same quarter of 2010. Same-store operating income is calculated as revenue, as defined above, less property operating expenses (which exclude corporate general and administrative expenses, asset management fees, interest expense, depreciation, amortization and acquisition expenses). |
Non-GAAP Financial Measures
Funds from Operations and Modified Funds from Operations
Due to certain unique operating characteristics of real estate companies, the National Association of Real Estate Investment Trusts, or NAREIT, an industry trade group, has promulgated a measure known as funds from operations, or FFO, which we believe to be an appropriate supplemental measure to reflect the operating performance of a REIT. The use of FFO is recommended by the REIT industry as a supplemental performance measure. FFO is not equivalent to our net income (loss) as determined under GAAP.
We define FFO, a non-GAAP measure, consistent with the standards established by the White Paper on FFO approved by the Board of Governors of NAREIT, as revised in February 2004, or the White Paper. The White Paper defines FFO as net income (loss) computed in accordance with GAAP, excluding gains or losses from sales of property and asset impairment writedowns, plus depreciation and amortization, and after adjustments for unconsolidated partnerships and joint ventures. Adjustments for unconsolidated partnerships and joint ventures are calculated to reflect FFO on the same basis. Our FFO calculation complies with NAREIT’s policy described above.
The historical accounting convention used for real estate assets requires straight-line depreciation of buildings and improvements, which implies that the value of real estate assets diminishes predictably over time. Diminution in value may occur if such assets are not adequately maintained or repaired and renovated as required by relevant circumstances or other measures necessary to maintain the assets are not undertaken. However, we believe that, since real estate values historically rise and fall with market conditions, including inflation, interest rates, the business cycle, unemployment and consumer spending, presentations of operating results for a REIT using historical accounting for depreciation may be less informative. In addition, in the determination of FFO, we believe it is appropriate to disregard impairment charges, as this is a fair value adjustment that is largely based on market fluctuations and assessments regarding general market conditions which can change over time. An asset will only be evaluated for impairment if certain impairment indications exist and if the carrying value, or book value, exceeds the total estimated undiscounted future cash flows (including net rental revenues, net proceeds on the sale of the property, and any other ancillary cash flows at a property or group level under GAAP) from such asset. Testing for impairment is a continuous process and is analyzed on a quarterly basis. Investors should note, however, that determinations of whether impairment charges have been incurred are based partly on anticipated operating performance, because estimated undiscounted future cash flows from a property, including estimated
59
future net rental revenues, net proceeds on the sale of the property, and certain other ancillary cash flows, are taken into account in determining whether an impairment charge has been incurred. While impairment charges are excluded from the calculation of FFO as described above, investors are cautioned that due to the fact that impairments are based on estimated future undiscounted cash flows and that we intend to have a relatively limited term of our operations; it could be difficult to recover any impairment charges through the eventual sale of the property. To date, we have not recognized any impairments.
Historical accounting for real estate involves the use of GAAP. Any other method of accounting for real estate such as the fair value method cannot be construed to be any more accurate or relevant than the comparable methodologies of real estate valuation found in GAAP. Nevertheless, we believe that the use of FFO, which excludes the impact of real estate related depreciation and amortization and impairments, assists in providing a more complete understanding of our performance to investors and to our management, and when compared year over year, reflects the impact on our operations from trends in occupancy rates, rental rates, operating costs, general and administrative expenses, and interest costs, which may not be immediately apparent from net income (loss).
However, FFO or Modified FFO (“MFFO”), discussed below, should not be construed to be more relevant or accurate than the current GAAP methodology in calculating net income (loss) or in its applicability in evaluating our operating performance. The method utilized to evaluate the value and performance of real estate under GAAP should be considered a more relevant measure of operational performance and is, therefore, given more prominence than the non-GAAP FFO and MFFO measures and the adjustments to GAAP in calculating FFO and MFFO.
Changes in the accounting and reporting rules under GAAP that were put into effect and other changes to GAAP accounting for real estate subsequent to the establishment of NAREIT’s definition of FFO have prompted an increase in cash-settled expenses, specifically acquisition fees and expenses, as items that are expensed as operating expenses under GAAP. We believe these fees and expenses do not affect our overall long-term operating performance. Publicly registered, non-traded REITs typically have a significant amount of acquisition activity and are substantially more dynamic during their initial years of investment and operation. The purchase of properties, and the corresponding expenses associated with that process, is a key feature of our business plan in order to generate operational income and cash flow in order to make distributions to investors. While other start-up entities may also experience significant acquisition activity during their initial years, we believe that publicly registered, non-traded REITs are unique in that they typically have a limited life with targeted exit strategies within a relatively limited time frame after the acquisition activity ceases. As disclosed in the prospectus for our Offering, we will use the proceeds raised in our Offering to acquire properties, and we expect to begin the process of achieving a liquidity event (i.e., listing of our shares of common stock on a national securities exchange, a merger or sale, the sale of all or substantially all of our assets, or another similar transaction) within three to five years after the completion of our Offering, which is generally comparable to other publicly registered, non-traded REITs. Thus, we do not intend to continuously purchase assets and intend to have a limited life. The decision whether to engage in any liquidity event is in the sole discretion of our board of directors. Due to the above factors and other unique features of publicly registered, non-traded REITs, the Investment Program Association, or the IPA, an industry trade group, has standardized a measure known as modified funds from operations, or MFFO, which the IPA has recommended as a supplemental measure for publicly registered, non-traded REITs and which we believe to be another appropriate supplemental measure to reflect the operating performance of a publicly registered, non-traded REIT having the characteristics described above. MFFO is not equivalent to our net income (loss) as determined under GAAP, and MFFO may not be a useful measure of the impact of long-term operating performance on value if we do not ultimately engage in a liquidity event. We believe that, because MFFO excludes acquisition fees and expenses that affect our operations only in periods in which properties are acquired and that we consider more reflective of investing activities, as well as other non-operating items included in FFO, MFFO can provide, on a going-forward basis, an indication of the sustainability (that is, the capacity to continue to be maintained) of our operating performance after the period in which we are acquiring our properties and once our portfolio is in place. By providing MFFO, we believe we are presenting useful information that assists investors and analysts to better assess the sustainability
60
of our operating performance after our Offering has been completed and our properties have been acquired. We also believe that MFFO is a recognized measure of sustainable operating performance by the publicly registered, non-traded REIT industry. Further, we believe MFFO is useful in comparing the sustainability of our operating performance after our Offering and acquisitions are completed with the sustainability of the operating performance of other real estate companies that are not as involved in acquisition activities. Investors are cautioned that MFFO should only be used to assess the sustainability of our operating performance after our Offering has been completed and properties have been acquired, as it excludes acquisition fees and expenses that have a negative effect on our operating performance during the periods in which properties are acquired.
We define MFFO, a non-GAAP measure, consistent with the IPA’s Guideline 2010-01, Supplemental Performance Measure for Publicly Registered, Non-Listed REITs: Modified Funds from Operations (“the Practice Guideline”) issued by the IPA in November 2010. The Practice Guideline defines MFFO as FFO further adjusted for the following items included in the determination of GAAP net income (loss): acquisition fees and expenses; amounts relating to straight line rents and amortization of above or below intangible lease assets and liabilities; accretion of discounts and amortization of premiums on debt investments; non-recurring impairments of real estate related investments; mark-to-market adjustments included in net income; non-recurring gains or losses included in net income from the extinguishment or sale of debt, hedges, foreign exchange, derivatives or securities holdings where trading of such holdings is not a fundamental attribute of the business plan, unrealized gains or losses resulting from consolidation from, or deconsolidation to, equity accounting, and after adjustments for consolidated and unconsolidated partnerships and joint ventures, with such adjustments calculated to reflect MFFO on the same basis. The accretion of discounts and amortization of premiums on debt investments, unrealized gains and losses on hedges, foreign exchange, derivatives or securities holdings, unrealized gains and losses resulting from consolidations, as well as other listed cash flow adjustments are adjustments made to net income (loss) in calculating cash flows from operations and, in some cases, reflect gains or losses which are unrealized and may not ultimately be realized.
Our MFFO calculation complies with the IPA’s Practice Guideline described above. In calculating MFFO, we exclude acquisition related expenses, the amortization of fair value adjustments related to debt, gains or losses from debt defeasance, realized and unrealized gains and losses on foreign exchange holdings and the adjustments of such items related to noncontrolling interests. The other adjustments included in the IPA’s Practice Guideline are not applicable to us for the periods presented. Acquisition fees and expenses are paid in cash by us, and we have not set aside or put into escrow any specific amount of proceeds from our offering to be used to fund acquisition fees and expenses. We do not intend to fund acquisition fees and expenses in the future from operating revenues and cash flows, nor from the sale of properties and subsequent re-deployment of capital and concurrent incurring of acquisition fees and expenses. Acquisition fees and expenses include payments to our Advisor and third parties. Acquisition related expenses under GAAP are considered operating expenses and as expenses included in the determination of net income (loss) and income (loss) from continuing operations, both of which are performance measures under GAAP. All paid and accrued acquisition fees and expenses will have negative effects on returns to investors, the potential for future distributions, and cash flows generated by us, unless earnings from operations or net sales proceeds from the disposition of other properties are generated to cover the purchase price of the property, these fees and expenses and other costs related to such property. In the future, if we are not able to raise additional proceeds from our offering, this could result in us paying acquisition fees or reimbursing acquisition expenses due to our Advisor, or a portion thereof, with net proceeds from borrowed funds, operational earnings or cash flows, net proceeds from the sale of properties, or ancillary cash flows. As a result, the amount of proceeds available for investment and operations would be reduced, or we may incur additional interest expense as a result of borrowed funds.
Further, under GAAP, certain contemplated non-cash fair value and other non-cash adjustments are considered operating non-cash adjustments to net income (loss) in determining cash flows from operations. In addition, we view fair value adjustments of derivatives and the amortization of fair value adjustments related to debt as items which are unrealized and may not ultimately be realized or as items which are not reflective of on-going operations and are therefore typically adjusted for when assessing operating performance.
61
We use MFFO and the adjustments used to calculate it in order to evaluate our performance against other publicly registered, non-traded REITs which intend to have limited lives with short and defined acquisition periods and targeted exit strategies shortly thereafter. As noted above, MFFO may not be a useful measure of the impact of long-term operating performance if we do not continue to operate in this manner. We believe that our use of MFFO and the adjustments used to calculate it allow us to present our performance in a manner that reflects certain characteristics that are unique to publicly registered, non-traded REITs, such as their limited life, limited and defined acquisition period and targeted exit strategy, and hence that the use of such measures may be useful to investors. For example, acquisition fees and expenses are intended to be funded from the proceeds of our offering and other financing sources and not from operations. By excluding expensed acquisition fees and expenses, the use of MFFO provides information consistent with management’s analysis of the operating performance of the properties. Additionally, fair value adjustments, which are based on the impact of current market fluctuations and underlying assessments of general market conditions, but can also result from operational factors such as rental and occupancy rates, may not be directly related or attributable to our current operating performance. By excluding such charges that may reflect anticipated and unrealized gains or losses, we believe MFFO provides useful supplemental information.
Presentation of this information is intended to provide useful information to investors as they compare the operating performance of different REITs, although it should be noted that not all REITs calculate FFO and MFFO the same way, so comparisons with other REITs may not be meaningful. Furthermore, FFO and MFFO are not necessarily indicative of cash flow available to fund cash needs and should not be considered as an alternative to net income (loss) or income (loss) from continuing operations as an indication of our performance, as an alternative to cash flows from operations, which is an indication of our liquidity, or indicative of funds available to fund our cash needs including our ability to make distributions to our stockholders. FFO and MFFO should be reviewed in conjunction with other measurements as an indication of our performance. MFFO may be useful in assisting management and investors in assessing the sustainability of operating performance in future operating periods, and in particular, after the offering and acquisition stages are complete and net asset value is disclosed. FFO and MFFO are not useful measures in evaluating net asset value because impairments are taken into account in determining net asset value but not in determining FFO and MFFO.
62
Neither the SEC, NAREIT nor any other regulatory body has passed judgment on the acceptability of the adjustments that we use to calculate FFO or MFFO. In the future, the SEC, NAREIT or another regulatory body may decide to standardize the allowable adjustments across the publicly registered, non-traded REIT industry and we would have to adjust our calculation and characterization of FFO or MFFO. The following is a reconciliation of net income (loss), which is the most directly comparable GAAP financial measure, to FFO and MFFO for each of the periods presented below:
| | | | | | | | | | | | |
| | | Year Ended
December 31,
2012 | | | Year Ended
December 31,
2011 | | | Year Ended
December 31,
2010 | |
Net loss attributable to Strategic Storage Trust, Inc. | | $ | (18,973,712 | ) | | $ | (21,357,429 | ) | | $ | (12,790,815 | ) |
Add: | | | | | | | | | | | | |
Depreciation | | | 13,882,475 | | | | 9,303,615 | | | | 4,943,856 | |
Amortization of intangible assets | | | 11,547,843 | | | | 13,935,903 | | | | 8,143,379 | |
Deduct: | | | | | | | | | | | | |
Gain on sale of investment in unconsolidated joint venture | | | (815,000 | ) | | | — | | | | — | |
Adjustment for noncontrolling Interests(2) | | | (335,036 | ) | | | (750,351 | ) | | | (737,227 | ) |
| | | | | | | | | | | | |
FFO | | | 5,306,570 | | | | 1,131,738 | | | | (440,807 | ) |
Other Adjustments: | | | | | | | | | | | | |
Acquisition expenses(3) | | | 3,647,635 | | | | 7,743,034 | | | | 5,243,604 | |
Amortization of fair value adjustments of secured debt(4) | | | 190,724 | | | | 364,438 | | | | 288,684 | |
Realized and unrealized (gains) losses on foreign exchange holdings(5) | | | (60,281 | ) | | | 16,833 | | | | (106,427 | ) |
Debt defeasance costs(6) | | | — | | | | 49,750 | | | | — | |
Adjustment for noncontrolling Interests(2) | | | (78,091 | ) | | | (112,654 | ) | | | (48,160 | ) |
| | | | | | | | | | | | |
Modified FFO(1) | | $ | 9,006,557 | | | $ | 9,193,139 | | | $ | 4,936,894 | |
| | | | | | | | | | | | |
As discussed in Results of Operations, our net loss and MFFO for the year ended December 31, 2012, has been significantly impacted by our acquisition of the Homeland Portfolio and additional debt we incurred to purchase such properties. The information below should be read in conjunction with the discussion regarding the Homeland Portfolio acquisition in Results of Operations.
| (1) | Changes in MFFO between the year ended December 31, 2012 and 2011 include the following: |
| | • | | Total revenues less all property operating expenses were approximately $32.5 million for the year ended December 31, 2012 compared to approximately $24.3 million for the year ended December 31, 2011, thereby increasing MFFO by approximately $8.2 million. Such increase was primarily due to the acquisition of 65 properties during 2011 and 2012, along with an increase in same store operating income of approximately $2.3 million or approximately 11.5%. |
| | • | | A decrease in MFFO of approximately $6.0 million due to increased interest expense, primarily related to additional interest incurred on the Second Restated KeyBank Loan (approximately $3.8 million), the KeyBank Bridge Loan (approximately $0.8 million) and other new debt incurred. The KeyBank Bridge Loan was repaid in full on August 7, 2012. |
| | • | | A decrease in MFFO of approximately $2.1 million due to increased amortization of deferred financing costs, which increased for principally the same reasons as interest expense. Of the increase, approximately $0.9 million related to the KeyBank Bridge Loan, which was repaid in full on August 7, 2012. |
63
Changes in MFFO between the year ended December 31, 2011 and 2010 include the following:
| | • | | Total revenues less all property operating expenses were approximately $24.3 million for the year ended December 31, 2011 compared to approximately $13.4 million for the year ended December 31, 2010, thereby increasing MFFO by approximately $10.9 million. Such increase was primarily due to the acquisition of 65 properties during 2010 and 2011. |
| | • | | A decrease in MFFO of approximately $5.8 million due to increased interest expense, primarily related to interest on new debt incurred in 2011. |
| | • | | A decrease in MFFO of approximately $1.0 million due to increased amortization of deferred financing costs, which increased for principally the same reasons as interest expense. Of the increase, approximately $0.7 million related to the Second Restated KeyBank Loan. |
| (2) | Relates to the noncontrolling interest in our consolidated joint venture and the noncontrolling interests in our Operating Partnership. The noncontrolling interest holder’s share of our consolidated venture’s real estate depreciation and amortization of intangible assets was $225,000, $621,000 and $737,000, respectively, for the years ended December 31, 2012, 2011 and 2010. |
| (3) | In evaluating investments in real estate, we differentiate the costs to acquire the investment from the operations derived from the investment. Such information would be comparable only for publicly registered, non-traded REITs that have generally completed their acquisition activity and have other similar operating characteristics. By excluding expensed acquisition related expenses, we believe MFFO provides useful supplemental information that is comparable for each type of real estate investment and is consistent with management’s analysis of the investing and operating performance of our properties. Acquisition fees and expenses include payments to our Advisor and third parties. Acquisition related expenses under GAAP are considered operating expenses and as expenses included in the determination of net income (loss) and income (loss) from continuing operations, both of which are performance measures under GAAP. All paid and accrued acquisition fees and expenses will have negative effects on returns to investors, the potential for future distributions, and cash flows generated by us, unless earnings from operations or net sales proceeds from the disposition of other properties are generated to cover the purchase price of the property, these fees and expenses and other costs related to such property. |
| (4) | This expense represents the difference between the stated interest rate and the estimated market interest rate on assumed notes or seller notes issued, as of the date of acquisition. Such amounts have been excluded from MFFO because we believe MFFO provides useful supplementary information by focusing on operating fundamentals, rather than events not related to our normal operations. We are responsible for managing interest rate risk and do not rely on another party to manage such risk. |
| (5) | These amounts primarily relate to transactions with our non-U.S. functional currency entities. The gains and losses are the result of fluctuations between the U.S. dollar and the Canadian dollar. Such amounts have been excluded from MFFO because we believe MFFO provides useful supplementary information by focusing on operating fundamentals, rather than events not related to our normal operations. We are responsible for managing hedge and foreign exchange risk and do not rely on another party to manage such risk. |
| (6) | We believe that adjusting for the gain or loss on extinguishment of debt provides useful information because such gain or loss on extinguishment of debt may not be reflective of on-going operations. |
Non-cash Items Included in Net Loss:
Provided below is additional information related to selected non-cash items included in net loss above, which may be helpful in assessing our operating results:
| | • | | Amortization of deferred financing costs of approximately $3.5 million, $1.3 million and $0.3 million was recognized as interest expense for the years ended December 31, 2012, 2011 and 2010, respectively. |
64
Cash Flows
A comparison of cash flows for operating, investing and financing activities for the years ended December 31, 2012 and 2011 is as follows:
| | | | | | | | | | | | |
| | | Year Ended | | | | |
| | | December 31, 2012 | | | December 31, 2011 | | | Change | |
Net cash flow provided by (used in): | | | | | | | | | | | | |
Operating activities | | $ | 9,550,340 | | | $ | 2,838,807 | | | $ | 6,711,533 | |
Investing activities | | | (95,632,616 | ) | | | (206,361,756 | ) | | | 110,729,140 | |
Financing activities | | | 86,814,473 | | | | 210,297,834 | | | | (123,483,361 | ) |
Cash flows provided by operating activities for the years ended December 31, 2012 and 2011 were approximately $9.6 million and $2.8 million, respectively, an increase in cash provided year to year of approximately $6.8 million. The increase in cash provided compared to the prior period primarily relates to an improvement in the net loss, adjusted for depreciation and amortization.
Cash flows used in investing activities for the years ended December 31, 2012 and 2011 were approximately $95.6 million and $206.4 million, respectively, a decrease in the use of cash of approximately $110.7 million. The decrease compared to the prior period primarily relates to the decreased amount spent on acquisitions.
Cash flows provided by financing activities for the years ended December 31, 2012 and 2011 were approximately $86.8 million and $210.3 million, respectively, a decrease in the cash provided of approximately $123.5 million. The decrease in cash provided by financing activities over the prior period primarily relates to a decrease in proceeds from new debt and an increase in repayments of debt, partially off-set by an increase of cash raised from the Offering.
Liquidity and Capital Resources
Short-Term Liquidity and Capital Resources
We generally expect that we will meet our short-term operating liquidity requirements from the combination of proceeds of our Offering, proceeds from secured or unsecured financing from banks or other lenders, net cash provided by property operations and advances from our Advisor which will be repaid, without interest, as funds are available after meeting our current liquidity requirements, subject to the limitations on reimbursement set forth in our advisory agreement with our Advisor.
As set forth earlier, the current expiration date of our Offering is September 22, 2013, and based on our current sales pace, we believe the proceeds from our Offering should be sufficient to allow us to meet our short-term capital needs and move to the next phase of our life cycle.
Distribution Policy and Distributions
Our board of directors will determine the amount and timing of distributions to our stockholders and will base such determination on a number of factors, including funds available for payment of distributions, financial condition, capital expenditure requirements and annual distribution requirements needed to maintain our status as a REIT under the Code. Distributions will be paid to our stockholders as of the record date selected by our board of directors. We declare and pay distributions monthly based on daily declaration and record dates so that
65
investors may be entitled to distributions immediately upon purchasing our shares. We expect to continue to regularly pay distributions unless our results of operations, our general financial condition, general economic conditions, or other factors inhibit us from doing so. Distributions will be authorized at the discretion of our board of directors, which will be directed, in substantial part, by its obligation to cause us to comply with the REIT requirements of the Code. The funds we receive from operations that are available for distribution may be affected by a number of factors, including the following:
| | • | | the amount of time required for us to invest the funds received in the offering; |
| | • | | our operating and interest expenses; |
| | • | | the amount of distributions or dividends received by us from our indirect real estate investments; |
| | • | | our ability to keep our properties occupied; |
| | • | | our ability to maintain or increase rental rates; |
| | • | | capital expenditures and reserves for such expenditures; |
| | • | | the issuance of additional shares; and |
| | • | | financings and refinancings. |
Our distributions paid over the last two years and the sources of such distributions are detailed below.
| | | | | | | | | | | | | | | | |
| | | Year Ended
December 31,
2012 | | | | | | Year Ended
December 31,
2011 | | | | |
Distributions paid in cash | | $ | 15,831,397 | | | | | | | $ | 12,311,945 | | | | | |
Distributions reinvested | | | 12,311,983 | | | | | | | | 9,045,444 | | | | | |
| | | | | | | | | | | | | | | | |
Total distributions | | $ | 28,143,380 | | | | | | | $ | 21,357,389 | | | | | |
| | | | | | | | | | | | | | | | |
Source of distributions | | | | | | | | | | | | | | | | |
Cash flows provided by operations | | $ | 9,550,340 | | | | 33.9 | % | | $ | 2,838,807 | | | | 13.3 | % |
Proceeds from issuance of common stock | | | 18,593,040 | | | | 66.1 | % | | | 18,518,582 | | | | 86.7 | % |
| | | | | | | | | | | | | | | | |
Total sources | | $ | 28,143,380 | | | | 100.0 | % | | $ | 21,357,389 | | | | 100.0 | % |
| | | | | | | | | | | | | | | | |
Cash flows provided by operations for the years ended December 31, 2012 and 2011 include approximately $3.6 million and $7.7 million, respectively, of real estate acquisition related expenses expensed in accordance with GAAP. We consider the real estate acquisition related expenses to have been funded by proceeds from our ongoing public offering of shares of our common stock because the expenses were incurred to acquire our real estate investments.
During our Offering, when we may raise capital more quickly than we acquire income-producing assets, and for some period after our Offering, we may not be able to pay distributions from our cash flows from operations, in which case distributions may be paid in part from debt financing or from proceeds from the issuance of common stock.
From our inception through December 31, 2012, we paid cumulative distributions of approximately $71 million, as compared to cumulative FFO of approximately $1.5 million. For the year ended December 31, 2012, we incurred distributions of approximately $28.8 million, as compared to FFO of approximately $5.3 million. For the year ended December 31, 2011, we incurred distributions of approximately $21.9 million, as compared to FFO of approximately $1.1 million. The payment of distributions from sources other than FFO may reduce the amount of proceeds available for investment and operations or cause us to incur additional interest expense as a result of borrowed funds.
Over the long-term, we expect that a greater percentage of our distributions will be paid from cash flows from operations. However, our operating performance cannot be accurately predicted and may deteriorate in the future due
66
to numerous factors, including our ability to raise and invest capital at favorable yields, the financial performance of our investments in the current real estate and financial environment and the types and mix of investments in our portfolio. As a result, future distributions declared and paid may exceed cash flow from operations.
Indebtedness
As of December 31, 2012, we had approximately $354.0 million of outstanding consolidated indebtedness (excluding net unamortized debt discounts of approximately $0.6 million). The weighted average interest rate on our consolidated fixed rate indebtedness as of December 31, 2012 was approximately 5.4%. As of December 31, 2012, approximately $65.5 million of our total consolidated indebtedness was variable rate debt.
Long-Term Liquidity and Capital Resources
On a long-term basis, our principal demands for funds will be for property acquisitions, either directly or through equity investments, for the payment of operating expenses, capital improvements on our properties, equity distributions and for debt service on our outstanding indebtedness. As set forth above, our board of directors has approved the closing of our Offering and we currently expect our Offering to close on or around September 22, 2013. Our board of directors is currently contemplating a number of strategies for the next steps in our life cycle. Absent the implementation of those strategies, we generally expect our cash needs for items, other than property acquisitions, will be met from operations and the issuance of additional debt or equity instruments.
Long-term potential future sources of capital include proceeds from secured or unsecured financings from banks or other lenders, issuance of equity instruments and undistributed funds from operations. We believe our ability to refinance or secure new debt will in part be affected by our ability to continue to lease-up certain development projects and other lease-up acquisitions. If such facilities continue to progress we believe our ability to borrow against those assets will be favorably impacted. To the extent we are not able to secure requisite additional financing in the form of a credit facility or other debt, we will be dependent upon proceeds from the issuance of equity instruments and cash flows from operating activities in order to meet our long-term liquidity requirements and to fund our distributions.
Contractual Obligations
The following table summarizes our contractual obligations as of December 31, 2012:
| | | | | | | | | | | | | | | | | | | | |
| | | Payments due by period: | |
| | | Total | | | Less than
1 Year | | | 1-3 Years | | | 3-5 Years | | | More than
5 Years | |
Mortgage interest(1) | | $ | 111,241,852 | | | $ | 18,309,225 | | | $ | 31,846,379 | | | $ | 21,676,046 | | | $ | 39,410,202 | |
Mortgage principal(1) | | | 354,016,931 | | | | 19,682,080 | | | | 97,356,043 | | | | 80,858,250 | | | | 156,120,558 | |
Operating leases | | | 3,236,256 | | | | 132,300 | | | | 272,318 | | | | 277,830 | | | | 2,553,808 | |
| | | | | | | | | | | | | | | | | | | | |
Total contractual obligations | | $ | 468,495,039 | | | $ | 38,123,605 | | | $ | 129,474,740 | | | $ | 102,812,126 | | | $ | 198,084,568 | |
| | | | | | | | | | | | | | | | | | | | |
| (1) | Interest expense was calculated based upon the contractual rates. The interest expense on variable rate debt was calculated based on the rate in effect as of December 31, 2012. Debt denominated in foreign currency has been converted at the conversion rate in effect as of the end of the period. |
Off-Balance Sheet Arrangements
Except as disclosed in the Note 2 of the Notes to the Consolidated Financial Statements contained in this report, we do not currently have any relationships with unconsolidated entities or financial partnerships. Such entities are often referred to as structured finance or special purposes entities, which typically are established for
67
the purpose of facilitating off-balance sheet arrangements or other contractually narrow or limited purposes. Further, except as disclosed in the notes to our financial statements, we have not guaranteed any obligations of unconsolidated entities nor do we have any commitments or intent to provide funding to any such entities.
Subsequent Events
Please see Note 12 of the Notes to the Consolidated Financial Statements contained in this report.
Seasonality
We believe that we will experience minor seasonal fluctuations in the occupancy levels of our facilities, which we believe will be slightly higher over the summer months due to increased moving activity.
| ITEM 7A. | QUANTITATIVE AND QUALITATIVE DISCLOSURES ABOUT MARKET RISK |
Market risk includes risks that arise from changes in interest rates, foreign currency exchange rates, commodity prices, equity prices and other market changes that affect market sensitive instruments. In pursuing our business plan, we expect that the primary market risk to which we will be exposed is interest rate risk.
As of December 31, 2012 and 2011, our debt consisted of approximately $288.5 million and $217.4 million, respectively, in fixed rate debt and approximately $65.5 million and $113.7 million, respectively, in variable rate debt. These instruments were entered into for other than trading purposes. Changes in interest rates have different impacts on the fixed and variable portions of our debt portfolio. A change in interest rates on the fixed portion of our debt portfolio impacts its fair value but has no impact on interest incurred or cash flows. A change in interest rates on the variable portion of our debt portfolio could impact the interest incurred and cash flows and its fair value. If the underlying rate of the related index on our variable rate debt were to increase or decrease by 100 basis points, the increase or decrease in interest expense (excluding variable rate date that was effectively fixed through an interest rate swap) would increase or decrease future earnings and cash flows by approximately $0.2 million annually.
Interest rate risk amounts were determined by considering the impact of hypothetical interest rates on our financial instruments. These analyses do not consider the effect of any change in overall economic activity that could occur. Further, in the event of a change of that magnitude, we may take actions to further mitigate our exposure to the change. However, due to the uncertainty of the specific actions that would be taken and their possible effects, these analyses assume no changes in our financial structure.
The following table summarizes annual debt maturities, average interest rates and estimated fair values on our outstanding debt as of December 31, 2012:
| | | | | | | | | | | | | | | | | | | | | | | | | | | | | | | | |
| | | Year Ending December 31, | | | | | | | | | | |
| | | 2013 | | | 2014 | | | 2015 | | | 2016 | | | 2017 | | | Thereafter | | | Total | | | Fair Value | |
Fixed rate debt | | $ | 6,202,559 | | | $ | 14,935,356 | | | $ | 30,579,553 | | | $ | 46,668,493 | | | $ | 33,981,671 | | | $ | 156,120,558 | | | $ | 288,488,190 | | | $ | 298,636,303 | |
Average interest rate | | | 5.41 | % | | | 5.41 | % | | | 5.42 | % | | | 5.39 | % | | | 5.23 | % | | | 5.13 | % | | | — | | | | — | |
Variable rate debt(1) | | $ | 13,479,521 | | | $ | 51,841,134 | | | $ | — | | | $ | 208,086 | | | $ | — | | | $ | — | | | $ | 65,528,741 | | | $ | 65,528,741 | |
Average interest rate | | | 4.78 | % | | | 4.75 | % | | | 5.25 | % | | | 5.25 | % | | | — | | | | — | | | | — | | | | — | |
| (1) | Foreign currency obligations have been converted at the conversion rate in effect as of the end of the period. |
In the future, we may be exposed to the effects of interest rate changes primarily as a result of borrowings used to maintain liquidity and fund acquisition, expansion, and financing of our real estate investment portfolio and operations. Our interest rate risk management objectives will be to limit the impact of interest rate changes on earnings and cash flows and to lower overall borrowing costs. To achieve our objectives, we may borrow at
68
fixed rates or variable rates. We may also enter into additional derivative financial instruments such as interest rate swaps and caps in order to mitigate our interest rate risk on a related financial instrument or foreign currency hedges to mitigate our risk to foreign currency exposure. We will not enter into derivative or interest rate transactions for speculative purposes. The following table summarizes annually the notional amounts and related pay rates on our derivative instrument as of December 31, 2012:
| | | | | | | | | | | | | | | | | | | | | | | | |
| | | Year Ending December 31, | |
| | | 2013 | | | 2014 | | | 2015 | | | 2016 | | | 2017 | | | Thereafter | |
Variable to Fixed – Average receive rate is one month LIBOR(1) | | $ | 45,000,000 | | | $ | — | | | $ | — | | | $ | — | | | $ | — | | | $ | — | |
Average pay rate | | | 0.9075 | % | | | — | | | | — | | | | — | | | | — | | | | — | |
| (1) | The $45,000,000 notional amount is effective through the maturity of the debt, December 24, 2014. |
| ITEM 8. | FINANCIAL STATEMENTS AND SUPPLEMENTARY DATA |
The financial statements and supplementary data filed as part of this annual report are set forth below beginning on page F-1 of this annual report.
| ITEM 9. | CHANGES IN AND DISAGREEMENTS WITH ACCOUNTANTS ON ACCOUNTING AND FINANCIAL DISCLOSURE |
None.
| ITEM 9A. | CONTROLS AND PROCEDURES |
Disclosure Controls and Procedures
As of the end of the period covered by this report, management, including our chief executive officer and chief financial officer, evaluated the effectiveness of the design and operation of our disclosure controls and procedures. Based upon this evaluation, our chief executive officer and chief financial officer concluded that the disclosure controls and procedures were effective as of the end of the period covered by this report to ensure that information required to be disclosed in the reports we file and submit under the Exchange Act is recorded, processed, summarized and reported as and when required. Disclosure controls and procedures include, without limitation, controls and procedures designed to ensure that information required to be disclosed by us in the reports we file and submit under the Exchange Act is accumulated and communicated to our management, including our chief executive officer and our chief financial officer, as appropriate to allow timely decisions regarding required disclosure.
Internal Control Over Financial Reporting
Our management is responsible for establishing and maintaining adequate internal control over financial reporting (as defined in Exchange Act Rules 13a-15(f) and 15d-15(f)) for us. Our management, including our chief executive officer and chief financial officer, evaluated, as of December 31, 2012, the effectiveness of our internal control over financial reporting using the framework inInternal Control — Integrated Frameworkissued by the Committee of Sponsoring Organizations of the Treadway Commission. Based on that evaluation, our management concluded that our internal control over financial reporting was effective as of December 31, 2012.
There have been no changes in our internal control over financial reporting that occurred during the quarter ended December 31, 2012 that have materially affected, or are reasonably likely to materially affect, our internal control over financial reporting.
| ITEM 9B. | OTHER INFORMATION |
During the year ended December 31, 2012, there was no information required to be disclosed in a report on Form 8-K which was not disclosed in a report on Form 8-K.
69
PART III
We expect to file a definitive Proxy Statement for our 2013 Annual Meeting of Stockholders (the “2013 Proxy Statement”) with the SEC, pursuant to Regulation 14A, not later than 120 days after the end of our fiscal year. Accordingly, certain information required by Part III has been omitted under General Instruction G(3) to Form 10-K and is incorporated by reference to the 2013 Proxy Statement. Only those sections of the 2013 Proxy Statement that specifically address the items required to be set forth herein are incorporated by reference.
| ITEM 10. | DIRECTORS, EXECUTIVE OFFICERS AND CORPORATE GOVERNANCE |
The information required by this Item is incorporated by reference to the 2013 Proxy Statement to be filed with the SEC.
| ITEM 11. | EXECUTIVE COMPENSATION |
The information required by this Item is incorporated by reference to the 2013 Proxy Statement to be filed with the SEC.
| ITEM 12. | SECURITY OWNERSHIP OF CERTAIN BENEFICIAL OWNERS AND MANAGEMENT AND RELATED STOCKHOLDER MATTERS |
The information required by this Item is incorporated by reference to the 2013 Proxy Statement to be filed with the SEC.
| ITEM 13. | CERTAIN RELATIONSHIPS AND RELATED TRANSACTIONS AND DIRECTOR INDEPENDENCE |
The information required by this Item is incorporated by reference to the 2013 Proxy Statement to be filed with the SEC.
| ITEM 14. | PRINCIPAL ACCOUNTING FEES AND SERVICES |
The information required by this Item is incorporated by reference to the 2013 Proxy Statement to be filed with the SEC.
70
PART IV
| ITEM 15. | EXHIBITS, FINANCIAL STATEMENT SCHEDULES |
| | (a) | List of Documents Filed. |
1. The list of the financial statements contained herein is set forth on page F-1 hereof.
2. Schedule III—Real Estate and Accumulated Depreciation is set forth beginning on page S-1 hereof. All other schedules for which provision is made in the applicable accounting regulations of the SEC are not required under the related instructions or are not applicable and therefore have been omitted.
3. The Exhibits filed in response to Item 601 of Regulation S-K are listed on the Exhibit Index below.
71
SIGNATURES
Pursuant to the requirements of Section 13 or 15(d) of the Securities Exchange Act of 1934, the registrant has duly caused this report to be signed on its behalf by the undersigned, thereunto duly authorized, in the City of Ladera Ranch, State of California, on March 29, 2013.
| | |
| STRATEGIC STORAGE TRUST, INC. |
| |
| By: | | /s/ H. Michael Schwartz |
| | H. Michael Schwartz |
| | Chief Executive Officer, President and Director |
Pursuant to the requirements of the Securities Exchange Act of 1934, this report has been signed below by the following persons on behalf of the registrant and in the capacities and on the dates indicated:
| | | | |
Signature | | Title | | Date |
| | |
/S/ H. MICHAEL SCHWARTZ H. Michael Schwartz | | Chief Executive Officer, President and Director (Principal Executive Officer) | | March 29, 2013 |
| | |
/s/ MICHAEL S. MCCLURE Michael S. McClure | | Executive Vice President, Chief Financial Officer and Treasurer (Principal Financial and Accounting Officer) | | March 29, 2013 |
| | |
/S/ HAROLD “SKIP” PERRY Harold “Skip” Perry | | Independent Director | | March 29, 2013 |
| | |
/S/ TIMOTHY S. MORRIS Timothy S. Morris | | Independent Director | | March 29, 2013 |
72
INDEX TO CONSOLIDATED FINANCIAL STATEMENTS
AND FINANCIAL STATEMENT SCHEDULE
FOR THE YEAR ENDED DECEMBER 31, 2012
F-1
REPORT OF INDEPENDENT REGISTERED PUBLIC ACCOUNTING FIRM
To the Board of Directors and
Stockholders of Strategic Storage Trust, Inc.
We have audited the accompanying consolidated balance sheet of Strategic Storage Trust, Inc. and Subsidiaries as of December 31, 2012, and the related consolidated statements of operations, comprehensive loss, stockholders’ equity, and cash flows for the year ended December 31, 2012. In connection with our audit of the consolidated financial statements, we also have audited the financial statement schedule listed in the accompanying index. Strategic Storage Trust, Inc.’s management is responsible for these consolidated financial statements and the financial statement schedule. Our responsibility is to express an opinion on these consolidated financial statements and financial statement schedule based on our audit.
We conducted our audit in accordance with the standards of the Public Company Accounting Oversight Board (United States). Those standards require that we plan and perform the audit to obtain reasonable assurance about whether the financial statements are free of material misstatement. The company is not required to have, nor were we engaged to perform, an audit of its internal control over financial reporting. Our audit included consideration of internal control over financial reporting as a basis for designing audit procedures that are appropriate in the circumstances, but not for the purpose of expressing an opinion on the effectiveness of the company’s internal control over financial reporting. Accordingly, we express no such opinion. An audit also includes examining, on a test basis, evidence supporting the amounts and disclosures in the financial statements, assessing the accounting principles used and significant estimates made by management, as well as evaluating the overall financial statement presentation. We believe that our audit provides a reasonable basis for our opinion.
In our opinion, the consolidated financial statements referred to above present fairly, in all material respects, the consolidated financial position of Strategic Storage Trust, Inc. and Subsidiaries as of December 31, 2012 and the consolidated results of its operations and its cash flows for the year ended December 31, 2012 in conformity with accounting principles generally accepted in the United States of America. Also in our opinion, the related financial statement schedule, when considered in relation to the basic consolidated financial statements taken as a whole, presents fairly, in all material respects, the information set forth therein.
|
| /s/ CohnReznick, LLC |
|
Los Angeles, CA |
March 29, 2013 |
F-2
REPORT OF INDEPENDENT REGISTERED PUBLIC ACCOUNTING FIRM
To the Board of Directors and
Stockholders of Strategic Storage Trust, Inc.
We have audited the accompanying consolidated balance sheet of Strategic Storage Trust, Inc. and Subsidiaries of December 31, 2011 and the related consolidated statements of operations, comprehensive loss, stockholders’ equity, and cash flows for each of the years in the two-year period ended December 31, 2011. Strategic Storage Trust, Inc.’s management is responsible for these consolidated financial statements. Our responsibility is to express an opinion on these consolidated financial statements based on our audits.
We conducted our audits in accordance with the standards of the Public Company Accounting Oversight Board (United States). Those standards require that we plan and perform the audit to obtain reasonable assurance about whether the financial statements are free of material misstatement. The company is not required to have, nor were we engaged to perform, an audit of its internal control over financial reporting. Our audit included consideration of internal control over financial reporting as a basis for designing audit procedures that are appropriate in the circumstances, but not for the purpose of expressing an opinion on the effectiveness of the company’s internal control over financial reporting. Accordingly, we express no such opinion. An audit also includes examining, on a test basis, evidence supporting the amounts and disclosures in the financial statements, assessing the accounting principles used and significant estimates made by management, as well as evaluating the overall financial statement presentation. We believe that our audits provide a reasonable basis for our opinion.
In our opinion, the consolidated financial statements referred to above present fairly, in all material respects, the consolidated financial position of Strategic Storage Trust, Inc. and Subsidiaries as of December 31, 2011 and the consolidated results of its operations and its cash flows for each of the years in the two-year period ended December 31, 2011, in conformity with accounting principles generally accepted in the United States of America.
|
/s/ REZNICK GROUP, P.C. |
|
Baltimore, Maryland |
March 29, 2013 |
F-3
STRATEGIC STORAGE TRUST, INC. AND SUBSIDIARIES
CONSOLIDATED BALANCE SHEETS
December 31, 2012 and 2011
| | | | | | | | |
| | | December 31, | |
| | | 2012 | | | 2011 | |
ASSETS | | | | | | | | |
Cash and cash equivalents | | $ | 13,998,391 | | | $ | 13,217,410 | |
Real estate facilities: | | | | | | | | |
Land | | | 178,459,163 | | | | 149,269,391 | |
Buildings | | | 389,149,948 | | | | 330,842,349 | |
Site improvements | | | 37,118,784 | | | | 30,283,836 | |
| | | | | | | | |
| | | 604,727,895 | | | | 510,395,576 | |
Accumulated depreciation | | | (29,840,320 | ) | | | (15,971,288 | ) |
| | | | | | | | |
| | | 574,887,575 | | | | 494,424,288 | |
Construction in process | | | 5,233,426 | | | | 1,754,582 | |
| | | | | | | | |
Real estate facilities, net ($16,829,789 and $17,070,146 related to VIEs) | | | 580,121,001 | | | | 496,178,870 | |
Deferred financing costs, net of accumulated amortization | | | 5,989,290 | | | | 7,449,525 | |
Intangible assets, net of accumulated amortization | | | 11,635,112 | | | | 15,922,955 | |
Restricted cash | | | 6,449,225 | | | | 5,234,479 | |
Investments in unconsolidated joint ventures | | | 8,772,005 | | | | 9,180,538 | |
Other assets | | | 4,270,638 | | | | 3,250,490 | |
| | | | | | | | |
Total assets | | $ | 631,235,662 | | | $ | 550,434,267 | |
| | | | | | | | |
LIABILITIES AND STOCKHOLDERS’ EQUITY | | | | | | | | |
Secured debt ($10,149,024 and $10,210,249 related to VIEs) | | $ | 353,440,758 | | | $ | 330,043,207 | |
Accounts payable and accrued liabilities | | | 12,726,888 | | | | 7,855,033 | |
Due to affiliates | | | 2,282,344 | | | | 2,065,615 | |
Distributions payable | | | 2,724,603 | | | | 2,071,876 | |
| | | | | | | | |
Total liabilities | | | 371,174,593 | | | | 342,035,731 | |
| | |
Commitments and contingencies (Note 8) | | | | | | | | |
| | |
Redeemable common stock | | | 3,960,664 | | | | 2,807,837 | |
| | |
Stockholders’ equity: | | | | | | | | |
| | |
Strategic Storage Trust, Inc. stockholders’ equity: | | | | | | | | |
Common stock, $0.001 par value; 700,000,000 shares authorized; 46,184,742 and 35,020,561 shares issued and outstanding at December 31, 2012 and 2011, respectively | | | 46,184 | | | | 35,021 | |
Additional paid-in capital | | | 383,072,118 | | | | 285,211,557 | |
Distributions | | | (71,401,126 | ) | | | (42,602,530 | ) |
Accumulated deficit | | | (61,929,145 | ) | | | (42,955,433 | ) |
Accumulated other comprehensive loss | | | (682,692 | ) | | | (829,652 | ) |
| | | | | | | | |
Total Strategic Storage Trust, Inc. stockholders’ equity | | | 249,105,339 | | | | 198,858,963 | |
| | | | | | | | |
Noncontrolling interest in operating partnership | | | 1,149,679 | | | | 718,907 | |
Other noncontrolling interests | | | 5,845,387 | | | | 6,012,829 | |
| | | | | | | | |
Total noncontrolling interests | | | 6,995,066 | | | | 6,731,736 | |
| | | | | | | | |
Total stockholders’ equity | | | 256,100,405 | | | | 205,590,699 | |
| | | | | | | | |
Total liabilities and stockholders’ equity | | $ | 631,235,662 | | | $ | 550,434,267 | |
| | | | | | | | |
See notes to consolidated financial statements.
F-4
STRATEGIC STORAGE TRUST, INC. AND SUBSIDIARIES
CONSOLIDATED STATEMENTS OF OPERATIONS
Years Ended December 31, 2012, 2011 and 2010
| | | | | | | | | | | | |
| | | 2012 | | | 2011 | | | 2010 | |
Revenues: | | | | | | | | | | | | |
Self storage rental revenue | | $ | 64,464,466 | | | $ | 48,109,145 | | | $ | 25,576,080 | |
Ancillary operating revenue | | | 2,146,038 | | | | 1,286,933 | | | | 585,102 | |
| | | | | | | | | | | | |
Total revenues | | | 66,610,504 | | | | 49,396,078 | | | | 26,161,182 | |
| | | | | | | | | | | | |
Operating expenses: | | | | | | | | | | | | |
Property operating expenses | | | 25,878,556 | | | | 19,402,185 | | | | 10,114,722 | |
Property operating expenses – affiliates | | | 8,254,016 | | | | 5,702,921 | | | | 2,667,357 | |
General and administrative | | | 2,361,229 | | | | 2,405,218 | | | | 2,837,481 | |
Depreciation | | | 14,254,525 | | | | 9,422,606 | | | | 5,002,442 | |
Intangible amortization expense | | | 11,547,843 | | | | 13,935,903 | | | | 8,143,379 | |
Property acquisition expenses—affiliates | | | 2,415,200 | | | | 5,706,838 | | | | 3,206,832 | |
Other property acquisition expenses | | | 1,232,435 | | | | 2,036,196 | | | | 2,036,772 | |
| | | | | | | | | | | | |
Total operating expenses | | | 65,943,804 | | | | 58,611,867 | | | | 34,008,985 | |
| | | | | | | | | | | | |
Operating income (loss) | | | 666,700 | | | | (9,215,789 | ) | | | (7,847,803 | ) |
| | | |
Other income (expense): | | | | | | | | | | | | |
Interest expense | | | (17,813,762 | ) | | | (11,859,146 | ) | | | (5,957,460 | ) |
Deferred financing amortization expense | | | (3,466,463 | ) | | | (1,331,514 | ) | | | (314,637 | ) |
Equity in earnings of real estate ventures | | | 887,551 | | | | 852,728 | | | | 867,178 | |
Gain on sale of investment in unconsolidated joint venture | | | 815,000 | | | | — | | | | — | |
Other | | | (104,168 | ) | | | (280,516 | ) | | | 5,707 | |
| | | | | | | | | | | | |
Net loss | | | (19,015,142 | ) | | | (21,834,237 | ) | | | (13,247,015 | ) |
Less: Net loss attributable to the noncontrolling interest in our operating partnership | | | 83,435 | | | | 118,601 | | | | 9,935 | |
Net (income) loss attributable to other noncontrolling interests | | | (42,005 | ) | | | 358,207 | | | | 446,265 | |
| | | | | | | | | | | | |
Net loss attributable to Strategic Storage Trust, Inc. | | $ | (18,973,712 | ) | | $ | (21,357,429 | ) | | $ | (12,790,815 | ) |
| | | | | | | | | | | | |
Net loss per share—basic | | $ | (0.46 | ) | | $ | (0.68 | ) | | $ | (0.59 | ) |
Net loss per share—diluted | | $ | (0.46 | ) | | $ | (0.68 | ) | | $ | (0.59 | ) |
| | | | | | | | | | | | |
Weighted average shares outstanding—basic | | | 41,103,477 | | | | 31,243,109 | | | | 21,706,053 | |
Weighted average shares outstanding—diluted | | | 41,103,477 | | | | 31,243,109 | | | | 21,706,053 | |
| | | | | | | | | | | | |
See notes to consolidated financial statements.
F-5
STRATEGIC STORAGE TRUST, INC. AND SUBSIDIARIES
CONSOLIDATED STATEMENTS OF COMPREHENSIVE LOSS
Years Ended December 31, 2012, 2011 and 2010
| | | | | | | | | | | | |
| | | 2012 | | | 2011 | | | 2010 | |
Net loss | | $ | (19,015,142 | ) | | $ | (21,834,237 | ) | | $ | (13,247,015 | ) |
Other comprehensive income (loss): | | | | | | | | | | | | |
Foreign currency translation adjustments | | | 381,663 | | | | (642,434 | ) | | | 124,412 | |
Change in fair value of interest rate swap | | | (234,703 | ) | | | (311,630 | ) | | | — | |
| | | | | | | | | | | | |
Other comprehensive income (loss) | | | 146,960 | | | | (954,064 | ) | | | 124,412 | |
| | | | | | | | | | | | |
Comprehensive loss | | | (18,868,182 | ) | | | (22,788,301 | ) | | | (13,122,603 | ) |
Comprehensive loss allocated to noncontrolling interests: | | | | | | | | | | | | |
Comprehensive loss attributable to the noncontrolling interests in our Operating Partnership | | | 82,806 | | | | 123,963 | | | | 9,820 | |
Comprehensive (income) loss attributable to other noncontrolling interests | | | (42,005 | ) | | | 358,207 | | | | 446,265 | |
| | | | | | | | | | | | |
Comprehensive loss attributable to Strategic Storage Trust, Inc. | | $ | (18,827,381 | ) | | $ | (22,306,131 | ) | | $ | (12,666,518 | ) |
| | | | | | | | | | | | |
See notes to consolidated financial statements.
F-6
STRATEGIC STORAGE TRUST, INC. AND SUBSIDIARIES
CONSOLIDATED STATEMENTS OF STOCKHOLDERS’ EQUITY
Years Ended December 31, 2012, 2011 and 2010
| | | | | | | | | | | | | | | | | | | | | | | | | | | | | | | | |
| | | Number of
Shares | | | Common
Stock
Par Value | | | Additional
Paid-in
Capital | | | Distributions | | | Accumulated
Deficit | | | Accumulated
Other
Comprehensive
Income (Loss) | | | Noncontrolling
Interests | | | Total | |
Balance as of December 31, 2009 | | | 16,638,556 | | | $ | 16,639 | | | $ | 125,714,066 | | | $ | (5,540,748 | ) | | $ | (8,807,189 | ) | | $ | — | | | $ | 7,686,098 | | | $ | 119,068,866 | |
Gross proceeds from issuance of common stock | | | 9,748,692 | | | | 9,749 | | | | 97,232,099 | | | | — | | | | — | | | | — | | | | — | | | | 97,241,848 | |
Offering costs | | | — | | | | — | | | | (11,282,720 | ) | | | — | | | | — | | | | — | | | | — | | | | (11,282,720 | ) |
Changes to redeemable common stock | | | — | | | | — | | | | (2,526,838 | ) | | | — | | | | — | | | | — | | | | — | | | | (2,526,838 | ) |
Redemptions of common stock | | | (381,834 | ) | | | (382 | ) | | | (3,655,114 | ) | | | — | | | | — | | | | — | | | | — | | | | (3,655,496 | ) |
Issuance of restricted stock | | | 1,875 | | | | 2 | | | | — | | | | — | | | | — | | | | — | | | | — | | | | 2 | |
Distributions ($0.70 per share) | | | — | | | | — | | | | — | | | | (15,194,030 | ) | | | — | | | | — | | | | — | | | | (15,194,030 | ) |
Distributions for noncontrolling interests | | | — | | | | — | | | | — | | | | — | | | | — | | | | — | | | | (324,582 | ) | | | (324,582 | ) |
Issuance of shares for distribution reinvestment plan | | | 650,772 | | | | 651 | | | | 6,181,683 | | | | — | | | | — | | | | — | | | | — | | | | 6,182,334 | |
Reduction of noncontrolling interests through additional investment | | | — | | | | — | | | | — | | | | — | | | | — | | | | — | | | | (184,251 | ) | | | (184,251 | ) |
Stock based compensation expense | | | — | | | | — | | | | 22,393 | | | | — | | | | — | | | | — | | | | — | | | | 22,393 | |
Net loss attributable to Strategic Storage Trust, Inc. | | | — | | | | — | | | | — | | | | — | | | | (12,790,815 | ) | | | — | | | | — | | | | (12,790,815 | ) |
Net loss attributable to the noncontrolling interests | | | — | | | | — | | | | — | | | | — | | | | — | | | | — | | | | (456,200 | ) | | | (456,200 | ) |
Foreign currency translation adjustment | | | — | | | | — | | | | — | | | | — | | | | — | | | | 124,412 | | | | — | | | | 124,412 | |
| | | | | | | | | | | | | | | | | | | | | | | | | | | | | | | | |
Balance as of December 31, 2010 | | | 26,658,061 | | | | 26,659 | | | | 211,685,569 | | | | (20,734,778 | ) | | | (21,598,004 | ) | | | 124,412 | | | | 6,721,065 | | | | 176,224,923 | |
| | | | | | | | | | | | | | | | | | | | | | | | | | | | | | | | |
Gross proceeds from issuance of common stock | | | 8,401,149 | | | | 8,401 | | | | 83,847,852 | | | | — | | | | — | | | | — | | | | — | | | | 83,856,253 | |
Offering costs | | | — | | | | — | | | | (10,350,548 | ) | | | — | | | | — | | | | — | | | | (76,055 | ) | | | (10,426,603 | ) |
Changes to redeemable common stock | | | — | | | | — | | | | 634,694 | | | | — | | | | — | | | | — | | | | — | | | | 634,694 | |
Redemptions of common stock | | | (993,301 | ) | | | (993 | ) | | | (9,679,145 | ) | | | — | | | | — | | | | — | | | | — | | | | (9,680,138 | ) |
Issuance of restricted stock | | | 2,500 | | | | 2 | | | | — | | | | — | | | | — | | | | — | | | | — | | | | 2 | |
Distributions ($0.70 per share) | | | — | | | | — | | | | — | | | | (21,867,752 | ) | | | — | | | | — | | | | — | | | | (21,867,752 | ) |
Distributions for noncontrolling interests | | | — | | | | — | | | | — | | | | — | | | | — | | | | — | | | | (367,225 | ) | | | (367,225 | ) |
Issuance of shares for distribution reinvestment plan | | | 952,152 | | | | 952 | | | | 9,044,492 | | | | — | | | | — | | | | — | | | | — | | | | 9,045,444 | |
Issuance of limited partnership units in our Operating Partnership | | | — | | | | — | | | | — | | | | — | | | | — | | | | — | | | | 930,759 | | | | 930,759 | |
Stock based compensation expense | | | — | | | | — | | | | 28,643 | | | | — | | | | — | | | | — | | | | — | | | | 28,643 | |
Net loss attributable to Strategic Storage Trust, Inc. | | | — | | | | — | | | | — | | | | — | | | | (21,357,429 | ) | | | — | | | | — | | | | (21,357,429 | ) |
Net loss attributable to the noncontrolling interests | | | — | | | | — | | | | — | | | | — | | | | — | | | | — | | | | (476,808 | ) | | | (476,808 | ) |
Foreign currency translation adjustment | | | — | | | | — | | | | — | | | | — | | | | — | | | | (642,434 | ) | | | — | | | | (642,434 | ) |
Change in fair value of interest rate swap | | | — | | | | — | | | | — | | | | — | | | | — | | | | (311,630 | ) | | | — | | | | (311,630 | ) |
| | | | | | | | | | | | | | | | | | | | | | | | | | | | | | | | |
Balance as of December 31, 2011 | | | 35,020,561 | | | $ | 35,021 | | | $ | 285,211,557 | | | $ | (42,602,530 | ) | | $ | (42,955,433 | ) | | $ | (829,652 | ) | | $ | 6,731,736 | | | $ | 205,590,699 | |
| | | | | | | | | | | | | | | | | | | | | | | | | | | | | | | | |
F-7
| | | | | | | | | | | | | | | | | | | | | | | | | | | | | | | | |
| | | Number of
Shares | | | Common
Stock
Par Value | | | Additional
Paid-in
Capital | | | Distributions | | | Accumulated
Deficit | | | Accumulated
Other
Comprehensive
Income (Loss) | | | Noncontrolling
Interests | | | Total | |
Gross proceeds from issuance of common stock | | | 11,235,955 | | | | 11,236 | | | | 113,932,158 | | | | — | | | | — | | | | — | | | | — | | | | 113,943,394 | |
Offering costs | | | — | | | | — | | | | (12,016,241 | ) | | | — | | | | — | | | | — | | | | — | | | | (12,016,241 | ) |
Changes to redeemable common stock | | | — | | | | — | | | | (3,593,608 | ) | | | — | | | | — | | | | — | | | | — | | | | (3,593,608 | ) |
Redemptions of common stock | | | (1,310,527 | ) | | | (1,311 | ) | | | (12,575,925 | ) | | | — | | | | — | | | | — | | | | — | | | | (12,577,236 | ) |
Issuance of restricted stock | | | 3,125 | | | | 3 | | | | — | | | | — | | | | — | | | | — | | | | — | | | | 3 | |
Distributions ($0.70 per share) | | | — | | | | — | | | | — | | | | (28,798,596 | ) | | | — | | | | — | | | | — | | | | (28,798,596 | ) |
Distributions for noncontrolling interests | | | — | | | | — | | | | — | | | | — | | | | — | | | | — | | | | (249,055 | ) | | | (249,055 | ) |
Issuance of shares for distribution reinvestment plan | | | 1,235,628 | | | | 1,235 | | | | 12,310,748 | | | | — | | | | — | | | | — | | | | — | | | | 12,311,983 | |
Repurchase of limited partnership units in our Operating Partnership | | | — | | | | — | | | | (221,335 | ) | | | — | | | | — | | | | — | | | | (175,403 | ) | | | (396,738 | ) |
Issuance of limited partnership units in our Operating Partnership | | | — | | | | — | | | | — | | | | — | | | | — | | | | — | | | | 729,218 | | | | 729,218 | |
Stock based compensation expense | | | — | | | | — | | | | 24,764 | | | | — | | | | — | | | | — | �� | | | — | | | | 24,764 | |
Net loss attributable to Strategic Storage Trust, Inc. | | | — | | | | — | | | | — | | | | — | | | | (18,973,712 | ) | | | — | | | | — | | | | (18,973,712 | ) |
Net loss attributable to the noncontrolling interests in our Operating Partnership | | | — | | | | — | | | | — | | | | — | | | | — | | | | — | | | | (41,430 | ) | | | (41,430 | ) |
Foreign currency translation adjustment | | | — | | | | — | | | | — | | | | — | | | | — | | | | 381,663 | | | | — | | | | 381,663 | |
Change in fair value of interest rate swap | | | — | | | | — | | | | — | | | | — | | | | — | | | | (234,703 | ) | | | — | | | | (234,703 | ) |
| | | | | | | | | | | | | | | | | | | | | | | | | | | | | | | | |
Balance as of December 31, 2012 | | | 46,184,742 | | | $ | 46,184 | | | $ | 383,072,118 | | | $ | (71,401,126 | ) | | $ | (61,929,145 | ) | | $ | (682,692 | ) | | $ | 6,995,066 | | | $ | 256,100,405 | |
| | | | | | | | | | | | | | | | | | | | | | | | | | | | | | | | |
See notes to consolidated financial statements.
F-8
STRATEGIC STORAGE TRUST, INC. AND SUBSIDIARIES
CONSOLIDATED STATEMENTS OF CASH FLOWS
Years Ended December 31, 2012, 2011 and 2010
| | | | | | | | | | | | |
| | | 2012 | | | 2011 | | | 2010 | |
Cash flows from operating activities: | | | | | | | | | | | | |
Net loss | | $ | (19,015,142 | ) | | $ | (21,834,237 | ) | | $ | (13,247,015 | ) |
Adjustments to reconcile net loss to cash provided by operating activities: | | | | | | | | | | | | |
Depreciation and amortization expense | | | 29,268,831 | | | | 24,690,023 | | | | 13,460,458 | |
Noncash interest expense | | | 190,724 | | | | 364,438 | | | | 288,684 | |
Expense related to issuance of restricted stock | | | 24,767 | | | | 28,645 | | | | 22,396 | |
Equity in income of unconsolidated joint ventures | | | (783,452 | ) | | | (710,616 | ) | | | (726,958 | ) |
Distributions from unconsolidated joint ventures | | | 816,720 | | | | 802,086 | | | | 448,623 | |
Gain on sale of unconsolidated joint venture | | | (815,000 | ) | | | — | | | | — | |
Foreign currency exchange (gain) loss | | | (60,281 | ) | | | 16,833 | | | | (106,427 | ) |
Increase (decrease) in cash from changes in assets and liabilities: | | | | | | | | | | | | |
Restricted cash | | | (1,214,746 | ) | | | (1,763,420 | ) | | | (73,211 | ) |
Other assets | | | (1,184,733 | ) | | | (1,649,563 | ) | | | (478,356 | ) |
Accounts payable and other accrued liabilities | | | 2,033,098 | | | | 1,464,568 | | | | 1,703,801 | |
Due to affiliates | | | 289,554 | | | | 1,430,050 | | | | (347,739 | ) |
| | | | | | | | | | | | |
Net cash provided by operating activities | | | 9,550,340 | | | | 2,838,807 | | | | 944,256 | |
| | | | | | | | | | | | |
Cash flows from investing activities: | | | | | | | | | | | | |
Purchase of real estate | | | (85,546,702 | ) | | | (198,143,849 | ) | | | (118,405,477 | ) |
Additions to real estate facilities | | | (5,330,259 | ) | | | (4,467,642 | ) | | | (2,464,930 | ) |
Development and construction of real estate facilities | | | (7,924,666 | ) | | | (4,307,108 | ) | | | — | |
Deposits on acquisition of real estate facilities | | | — | | | | 1,069,201 | | | | (1,069,201 | ) |
Additional investment in unconsolidated joint ventures | | | (234,735 | ) | | | (512,358 | ) | | | (2,353,692 | ) |
Proceeds from land disposition | | | 1,978,746 | | | | — | | | | — | |
Proceeds from sale of investment in unconsolidated joint venture | | | 1,425,000 | | | | — | | | | — | |
Additional investment in noncontrolling interest | | | — | | | | — | | | | (184,251 | ) |
| | | | | | | | | | | | |
Net cash flows used in investing activities | | | (95,632,616 | ) | | | (206,361,756 | ) | | | (124,477,551 | ) |
| | | | | | | | | | | | |
Cash flows from financing activities: | | | | | | | | | | | | |
Proceeds from issuance of secured debt | | | 82,217,152 | | | | 179,290,017 | | | | 37,585,000 | |
Principal payments on secured debt | | | (3,157,375 | ) | | | (1,752,724 | ) | | | (640,927 | ) |
Repayment of secured debt | | | (62,833,334 | ) | | | (9,939,555 | ) | | | (3,255,000 | ) |
Deferred financing costs | | | (2,001,411 | ) | | | (6,462,085 | ) | | | (1,649,241 | ) |
Gross proceeds from issuance of common stock | | | 113,943,394 | | | | 83,856,253 | | | | 97,241,848 | |
Offering costs | | | (12,016,241 | ) | | | (10,426,603 | ) | | | (11,282,720 | ) |
Repurchase of limited partnership units in our Operating Partnership | | | (396,738 | ) | | | — | | | | — | |
Redemptions of common stock | | | (12,577,236 | ) | | | (9,680,138 | ) | | | (3,655,496 | ) |
Distributions paid to common stockholders | | | (15,831,397 | ) | | | (12,311,945 | ) | | | (8,429,845 | ) |
Distributions paid to noncontrolling interests | | | (251,541 | ) | | | (363,078 | ) | | | (324,582 | ) |
Escrow receivable | | | (182,290 | ) | | | (181,750 | ) | | | 120,154 | |
Due to affiliates | | | (98,510 | ) | | | (180,558 | ) | | | 483,737 | |
Restricted cash | | | — | | | | (1,550,000 | ) | | | — | |
| | | | | | | | | | | | |
Net cash flows provided by financing activities | | | 86,814,473 | | | | 210,297,834 | | | | 106,192,928 | |
| | | | | | | | | | | | |
Effect of exchange rate changes on cash | | | 48,784 | | | | 4,434 | | | | — | |
Increase (decrease) in cash and cash equivalents | | | 780,981 | | | | 6,779,319 | | | | (17,340,367 | ) |
Cash and cash equivalents, beginning of period | | | 13,217,410 | | | | 6,438,091 | | | | 23,778,458 | |
| | | | | | | | | | | | |
Cash and cash equivalents, end of period | | $ | 13,998,391 | | | $ | 13,217,410 | | | $ | 6,438,091 | |
| | | | | | | | | | | | |
Supplemental disclosures and non-cash transactions: | | | | | | | | | | | | |
Cash paid for interest | | $ | 17,903,925 | | | $ | 10,965,627 | | | $ | 5,494,139 | |
Interest capitalized | | $ | 498,772 | | | $ | 352,095 | | | $ | — | |
Distributions payable | | $ | 2,724,603 | | | $ | 2,071,876 | | | $ | 1,557,367 | |
Issuance of shares pursuant to distribution reinvestment plan | | $ | 12,311,983 | | | $ | 9,045,444 | | | $ | 6,182,334 | |
Seller notes payable issued in connection with purchase of real estate | | $ | — | | | $ | — | | | $ | 4,800,000 | |
Assumption of notes payable issued in connection with purchase of real estate | | $ | 6,706,790 | | | $ | 42,580,540 | | | $ | 3,199,696 | |
Issuance of limited partnership units in our Operating Partnership in connection with the purchase of real estate facilities | | $ | 729,218 | | | $ | 930,759 | | | $ | — | |
Foreign currency translation adjustment – Real estate facilities, net | | $ | 614,721 | | | $ | (695,064 | ) | | $ | 220,547 | |
See notes to consolidated financial statements.
F-9
STRATEGIC STORAGE TRUST, INC. AND SUBSIDIARIES
NOTES TO CONSOLIDATED FINANCIAL STATEMENTS
December 31, 2012
Note 1. Organization
Strategic Storage Trust, Inc., a Maryland corporation (the “Company”), was formed on August 14, 2007 under the Maryland General Corporation Law for the purpose of engaging in the business of investing in self storage facilities. The Company’s year-end is December 31. As used in this report, “we” “us” and “our” refer to Strategic Storage Trust, Inc.
Strategic Capital Holdings, LLC, a Virginia limited liability company (our “Sponsor”), is the sponsor of our Offering. Our Sponsor was formed on July 21, 2004 to engage in private structured offerings of limited partnerships and other entities with respect to the acquisition, management and disposition of commercial real estate assets. Our Sponsor owns a majority of Strategic Storage Holdings, LLC, which is the sole member of our advisor and our property manager.
Our advisor is Strategic Storage Advisor, LLC, a Delaware limited liability company (our “Advisor”) which was formed on August 13, 2007. Our Advisor is responsible for managing our affairs on a day-to-day basis and identifying and making acquisitions and investments on our behalf under the terms of an advisory agreement we have with our Advisor (our “Advisory Agreement”). Some of the officers of our Advisor are also officers of our Sponsor and of us.
On August 24, 2007, our Advisor purchased 100 shares of our common stock for $1,000 and became our initial stockholder. Our Articles of Amendment and Restatement authorize 700,000,000 shares of common stock with a par value of $0.001 and 200,000,000 shares of preferred stock with a par value of $0.001.
Our operating partnership, Strategic Storage Operating Partnership, L.P., a Delaware limited partnership (our “Operating Partnership”), was formed on August 14, 2007. On August 24, 2007, our Advisor purchased a limited partnership interest in our Operating Partnership for $200,000 and on August 24, 2007, we contributed the initial $1,000 capital contribution we received to our Operating Partnership in exchange for the general partner interest. Our Operating Partnership owns, directly or indirectly through one or more special purpose entities, all of the self storage properties that we have acquired. As of December 31, 2012, we owned 99.46% of the limited partnership interests of our Operating Partnership. The remaining limited partnership interests are owned by our Advisor (0.04%) and unaffiliated third parties (0.50%). As the sole general partner of our Operating Partnership, we have the exclusive power to manage and conduct business of our Operating Partnership. We will conduct certain activities (such as selling packing supplies and locks and renting trucks or other moving equipment) through our taxable REIT subsidiaries (the “TRSs”), which are our wholly-owned subsidiaries.
Our property manager is Strategic Storage Property Management, LLC, a Delaware limited liability company (our “Property Manager”), which was formed in August 2007 to manage our properties. Our Property Manager derives substantially all of its income from the property management services it performs for us.
On March 17, 2008, we began our initial public offering of common stock (our “Initial Offering”). On May 22, 2008, we satisfied the minimum offering requirements of the Initial Offering and commenced formal operations. On September 16, 2011, we terminated the Initial Offering, having sold approximately 29 million shares for gross proceeds of approximately $289 million. On September 22, 2011, we commenced our follow-on public offering of stock for a maximum of 110,000,000 shares of common stock, consisting of 100,000,000 shares for sale to the public (our “Primary Offering”) and 10,000,000 shares for sale pursuant to our distribution reinvestment plan (collectively, our “Offering”). We intend to invest a substantial amount of the net proceeds from our Offering in self storage facilities and related self storage real estate investments. Based on the current
F-10
STRATEGIC STORAGE TRUST, INC. AND SUBSIDIARIES
NOTES TO CONSOLIDATED FINANCIAL STATEMENTS
December 31, 2012
expiration date of our Offering on September 22, 2013, and our current sales pace, which our board of directors believes should allow us to raise sufficient capital to move to the next phase of our life cycle, our board of directors approved closing our Offering within the original two year offering period. We currently expect to close our Offering on or around September 22, 2013, although the board of directors has reserved its right to close the Offering prior to that date if the board of directors deems it appropriate. Our board may also extend our Offering for an additional year, or in certain circumstances, longer. We currently plan to continue to offer shares under our distribution reinvestment plan beyond the above date; however, we may terminate the distribution reinvestment plan offering at any time. As of December 31, 2012, we had issued approximately 42.7 million shares of common stock for approximately $426 million in our Initial Offering and our Offering and also issued 6.2 million shares in a private offering.
Effective June 1, 2012, the offering price of our shares of common stock increased from $10.00 per share to $10.79 per share. This increase was primarily based on the April 2, 2012 estimated per share value of our common stock of $10.79 which was calculated based on the estimated value of our assets less the estimated value of our liabilities, or net asset value, divided by the number of shares outstanding on an adjusted fully diluted basis, calculated as of December 31, 2011. In light of the above-described net asset value calculation, our board of directors determined that it was appropriate to increase the per share offering price for new purchases of our shares commencing on June 1, 2012. This determination by our board of directors was subjective and was primarily based on (i) the estimated net asset value per share, which was predominantly based on an independent third party appraiser’s valuation of our properties as of December 31, 2011, (ii) the commissions and dealer manager fees payable in connection with the offering of our shares, (iii) our historical and anticipated results of operations and financial condition, (iv) our current and anticipated distribution payments, (v) our current and anticipated capital and debt structure, and (vi) our Advisor’s recommendations and assessment of our prospects and continued execution of our investment and operating strategies.
Our dealer manager is Select Capital Corporation, a California corporation (our “Dealer Manager”). Our Dealer Manager is responsible for marketing our shares being offered pursuant to the Offering. Our president owns a 15% beneficial non-voting equity interest in our Dealer Manager.
As we accept subscriptions for shares of our common stock, we transfer substantially all of the net proceeds of the Offering to our Operating Partnership as capital contributions in exchange for additional units of interest in our Operating Partnership. However, we are deemed to have made capital contributions in the amount of the gross offering proceeds received from investors and our Operating Partnership is deemed to have simultaneously paid the sales commissions and other costs associated with the Offering. In addition, our Operating Partnership is structured to make distributions with respect to limited partnership units (except for Class D units) that will be equivalent to the distributions made to holders of our common stock. In March 2011, we adopted Amendment No. 1 to our Operating Partnership’s First Amended and Restated Limited Partnership Agreement, which established Class D Units, and our Operating Partnership issued approximately 120,000 Class D Units in connection with our acquisition of the Las Vegas VII and Las Vegas VIII properties. The Class D Units have all of the rights, powers, duties and preferences of our Operating Partnership’s other limited partnership units, except that they are subject to an annual distribution limit (initially zero percent) and the holders of the Class D Units have agreed to modified exchange rights that prevent them from exercising their exchange rights until the occurrence of a specified event (see Note 8). Finally, a limited partner in our Operating Partnership may later exchange his or her limited partnership units in our Operating Partnership for shares of our common stock at any time after one year following the date of issuance of their limited partnership units, subject to certain restrictions as outlined in the limited partnership agreement. Our Advisor is prohibited from exchanging or otherwise transferring its limited partnership units so long as it is acting as our Advisor pursuant to our Advisory Agreement.
F-11
STRATEGIC STORAGE TRUST, INC. AND SUBSIDIARIES
NOTES TO CONSOLIDATED FINANCIAL STATEMENTS
December 31, 2012
As of December 31, 2012, we wholly-owned 110 self storage facilities located in 17 states (Alabama, Arizona, California, Florida, Georgia, Illinois, Kentucky, Mississippi, Nevada, New Jersey, New York, North Carolina, Pennsylvania, South Carolina, Tennessee, Texas and Virginia) and Canada comprising approximately 70,190 units and approximately 9.2 million rentable square feet. As of December 31, 2012, we also had minority interests in eight additional self storage facilities. Of those interests, one has been deemed to be a controlling interest and is therefore consolidated in our consolidated financial statements as discussed in Note 2. Additionally, we have an interest in a net leased industrial property in California with 356,000 rentable square feet leased to a single tenant.
Note 2. Summary of Significant Accounting Policies
Basis of Presentation
The accompanying consolidated financial statements have been prepared in accordance with U.S. generally accepted accounting principles (“GAAP”) as contained within the Financial Accounting Standards Board (“FASB”) Accounting Standards Codification (“ASC”) and the rules and regulations of the SEC.
Effective September 15, 2009, the ASC was established as the single source of authoritative nongovernmental GAAP. Prior to the issuance of the ASC, all GAAP pronouncements were issued in separate topical pronouncements in the form of statements, staff positions or Emerging Issues Task Force Abstracts, and were referred to as such. While the ASC does not change GAAP, it introduces a new structure and supersedes all previously issued non-SEC accounting and reporting standards. In addition to the ASC, the Company is still required to follow SEC rules and regulations relating to the preparation of financial statements. The Company’s accounting policies are consistent with the guidance set forth by both ASC and the SEC.
Reclassifications
Certain amounts previously reported in our 2010 and 2011 financial statements have been reclassified to conform to the fiscal 2012 presentation.
Principles of Consolidation
Our financial statements, the financial statements of our Operating Partnership, including its wholly-owned subsidiaries, the financial statements of Self Storage REIT, Inc. (now Self Storage REIT, LLC) (REIT I) and Self Storage REIT II, Inc. (now Self Storage REIT II, LLC) (REIT II), and the accounts of variable interest entities (VIEs) for which we are the primary beneficiary are consolidated in the accompanying consolidated financial statements. The portion of these entities not wholly-owned by us is presented as noncontrolling interests both as of and during the periods presented. All significant intercompany accounts and transactions have been eliminated in consolidation.
Consolidation Considerations for Our Investments in Joint Ventures
Current accounting guidance provides a framework for identifying VIEs and determining when a company should include the assets, liabilities, noncontrolling interests, and results of activities of the VIE in its consolidated financial statements. In general, a VIE is an entity or other legal structure used to conduct activities or hold assets that either (1) has an insufficient amount of equity to carry out its principal activities without additional subordinated financial support, (2) has a group of equity owners that are unable to make significant decisions about its activities, or (3) has a group of equity owners that do not have the obligation to absorb losses
F-12
STRATEGIC STORAGE TRUST, INC. AND SUBSIDIARIES
NOTES TO CONSOLIDATED FINANCIAL STATEMENTS
December 31, 2012
or the right to receive returns generated by its operations. Generally, a VIE should be consolidated if a party with an ownership, contractual, or other financial interest in the VIE (a variable interest holder) has the power to direct the VIE’s most significant activities and the obligation to absorb losses or right to receive benefits of the VIE that could be significant to the VIE. A variable interest holder that consolidates the VIE is called the primary beneficiary. Upon consolidation, the primary beneficiary generally must initially record all of the VIE’s assets, liabilities, and noncontrolling interest at fair value and subsequently account for the VIE as if it were consolidated based on majority voting interest. As of December 31, 2012 and 2011, we had entered into contracts/interests that are deemed to be variable interests in VIEs; those variable interests include both lease agreements and equity investments. We have evaluated those variable interests against the criteria for consolidation and determined that we are not the primary beneficiary of certain investments discussed further in the“Equity Investments” section of this note.
As of December 31, 2012 and 2011, we had an equity interest in a self storage property located in San Francisco, California (“SF property”) which was deemed to be a VIE of which we are the primary beneficiary. As such, the SF property has been consolidated in our consolidated financial statements since we acquired our interest in the property through the REIT I merger. In January 2010, we acquired an approximately 2% additional interest in the SF property, bringing our total interest to approximately 12%. The SF property is owned by a Delaware Statutory Trust (DST), and by virtue of the trust agreement the investors in the trust have no direct or indirect ability through voting rights to make decisions about the DST’s significant activities. The REIT I operating partnership (the “REIT I Operating Partnership”) has also entered into a lease agreement for the SF property, in which the REIT I Operating Partnership is the tenant, which exposes it to losses of the VIE that could be significant to the VIE and also allows it to direct activities of the VIE that determine its economic performance by means of its operation of the leased facility. The lease has an initial term of ten years which commenced on December 19, 2006. The initial term of the lease may be extended at the option of the REIT I Operating Partnership for up to four successive five year terms. As of December 31, 2012, the consolidated joint venture had net real estate assets of approximately $16.8 million. Such assets are only available to satisfy the obligations of the SF property. We have also consolidated approximately $10.1 million of secured debt and approximately $5.8 million of noncontrolling interest related to this entity. The lenders of the secured debt have no recourse to other Company assets. Our Sponsor has entered into an agreement to indemnify us for any losses as a result of potential shortfalls in the lease payments required to be made by the REIT I Operating Partnership. Despite such indemnification, we continue to be deemed the primary beneficiary as our Sponsor is not deemed to have a variable interest in the SF property.
Use of Estimates
The preparation of the consolidated financial statements in conformity with accounting principles generally accepted in the United States requires management to make estimates and assumptions that affect the amounts reported in the consolidated financial statements and accompanying notes. The current economic environment has increased the degree of uncertainty inherent in these estimates and assumptions. Management adjusts such estimates when facts and circumstances dictate. The most significant estimates made include the allocation of property purchase price to tangible and intangible assets acquired and liabilities assumed at fair value, the determination if certain entities should be consolidated, the evaluation of potential impairment of long-lived assets and of assets held by equity method investees, and the useful lives of real estate assets and intangibles. Actual results could materially differ from those estimates.
Cash and Cash Equivalents
We consider all short-term, highly liquid investments that are readily convertible to cash with a maturity of three months or less at the time of purchase to be cash equivalents.
F-13
STRATEGIC STORAGE TRUST, INC. AND SUBSIDIARIES
NOTES TO CONSOLIDATED FINANCIAL STATEMENTS
December 31, 2012
We may maintain cash equivalents in financial institutions in excess of insured limits, but believe this risk is mitigated by only investing in or through major financial institutions.
Restricted Cash
Restricted cash consists primarily of impound reserve accounts for property taxes, insurance and capital improvements in connection with the requirements of certain of our loan agreements.
Real Estate Purchase Price Allocation
We account for acquisitions in accordance with accounting guidance which requires that we allocate the purchase price of the property to the tangible and intangible assets acquired and the liabilities assumed based on estimated fair values. This guidance requires us to make significant estimates and assumptions, including fair value estimates, as of the acquisition date and to adjust those estimates as necessary during the measurement period (defined as the period, not to exceed one year, in which we may adjust the provisional amounts recognized for an acquisition). Acquisitions of portfolios of facilities are allocated to the individual facilities based upon an income approach or a cash flow analysis using appropriate risk adjusted capitalization rates which take into account the relative size, age, and location of the individual facility along with current and projected occupancy and rental rate levels or appraised values, if available. Allocations to the individual assets and liabilities are based upon comparable market sales information for land and estimates of depreciated replacement cost of equipment, building and site improvements. In allocating the purchase price, we determine whether the acquisition includes intangible assets or liabilities. Substantially all of the leases in place at acquired properties are at market rates, as the majority of the leases are month-to-month contracts. Accordingly, to date we have not allocated any portion of the purchase price to above or below market leases. We also consider whether in-place, market leases represent an intangible asset. We recorded approximately $7.3 million and approximately $15.7 million in intangible assets to recognize the value of in-place leases related to our acquisitions in 2012 and 2011, respectively. We do not expect, nor to date have we recorded, intangible assets for the value of tenant relationships because we will not have concentrations of significant tenants and the average tenant turnover is fairly frequent. Our acquisition-related transaction costs are required to be expensed as incurred. During the years ended December 31, 2012, 2011 and 2010 we expensed approximately $3.6 million, $7.7 million and $5.2 million, respectively, of acquisition related transaction costs.
Should the initial accounting for an acquisition be incomplete by the end of a reporting period that falls within the measurement period, we report provisional amounts in our financial statements. During the measurement period, we adjust the provisional amounts recognized at the acquisition date to reflect new information obtained about facts and circumstances that existed as of the acquisition date that, if known, would have affected the measurement of the amounts recognized as of that date and we record those adjustments to our financial statements. We apply those measurement period adjustments that we determine to be significant retrospectively to comparative information in our financial statements, potentially including adjustments to interest, depreciation and amortization expense.
Evaluation of Possible Impairment of Long-Lived Assets
Management will continually monitor events and changes in circumstances that could indicate that the carrying amounts of our long-lived assets, including those held through joint ventures, may not be recoverable. When indicators of potential impairment are present that indicate that the carrying amounts of the assets may not be recoverable, we will assess the recoverability of the assets by determining whether the carrying value of the long-lived assets will be recovered through the undiscounted future operating cash flows expected from the use of the asset and its eventual disposition. In the event that such expected undiscounted future cash flows do not
F-14
STRATEGIC STORAGE TRUST, INC. AND SUBSIDIARIES
NOTES TO CONSOLIDATED FINANCIAL STATEMENTS
December 31, 2012
exceed the carrying value, we will adjust the value of the long-lived assets to the fair value and recognize an impairment loss. As of December 31, 2012, 2011 and 2010, no impairment losses have been recognized.
Equity Investments
Our investments in unconsolidated real estate joint ventures and VIEs in which we are not the primary beneficiary, where we have significant influence, but not control, are recorded under the equity method of accounting in the accompanying consolidated financial statements. Under the equity method, our investments in real estate ventures are stated at cost and adjusted for our share of net earnings or losses and reduced by distributions. Equity in earnings of real estate ventures is generally recognized based on the allocation of cash distributions upon liquidation of the investment in accordance with the joint venture agreements.
Investments representing passive preferred equity and/or minority interests are accounted for under the cost method. Under the cost method, our investments in real estate ventures are carried at cost and adjusted for other-than-temporary declines in fair value, distributions representing a return of capital and additional investments.
Through mergers with REIT I and REIT II in 2009, we acquired five preferred equity and/or minority interests in unconsolidated joint ventures (one of which became wholly-owned in 2011, as further described in Note 3 and another which was sold in May 2012 as further described below), all of which were deemed to be VIEs. We have evaluated each variable interest against the amended criteria for consolidation and determined that we are not the primary beneficiary, generally due to our inability to direct significant activities that determine the economic performance of the VIE. Two of those investments are passive or limited partner interests in self storage facilities (such properties are owned by DSTs, and by virtue of the related trust agreements, the investors have no direct or indirect ability through voting rights to make decisions about the DSTs significant activities) and are therefore accounted for under the cost method; our aggregate investment therein is approximately $0.1 million. Individually our ownership interest in those investments ranges from approximately 0.28% to 1.49%; the carrying value of the investments ranged from approximately $27,000 to $100,000 and our risk of loss is limited to our individual investment therein.
In May 2012, our equity interests in an unconsolidated joint venture which owns a self storage facility in Baltimore, Maryland were redeemed for approximately $1.4 million. This resulted in a gain of approximately $0.8 million, which is included in gain on sale of investment in unconsolidated joint venture in our Consolidated Statements of Operations for the year ended December 31, 2012.
The remaining interest is in a net leased industrial property (“Hawthorne property”) in California with 356,000 rentable square feet leased to a single tenant. This investment is accounted for under the equity method of accounting and our risk of loss is limited to our investment, including our maximum exposure under the terms of a debt guarantee. We own a 12% interest in Westport LAX LLC, the joint venture that acquired the Hawthorne property and the carrying value in such investment is approximately $1.3 million. Hawthorne LLC, an affiliate of our Sponsor, owns 78% of Westport LAX LLC, and we have a preferred equity interest in Hawthorne LLC which entitles us to distributions equal to 10% per annum on our investment of approximately $6.9 million and a non-interest bearing receivable of approximately $0.4 million. The preferred equity interest has a redemption date in November 2013, subject to extension at our sole discretion. The preferred equity interest may be called at any time in whole or part by Hawthorne LLC or redeemed at any time by us. The remaining 10% interest in Westport LAX LLC is owned by a third party, who is also the co-manager, along with our Sponsor, of the Hawthorne property. Such third party is the acting property manager and directs the operating activities of the property that determine its economic performance. We, along with other non-affiliated parties, are guarantors on the approximately $19.3 million loan used to secure the Hawthorne property; the loan has a maturity date of
F-15
STRATEGIC STORAGE TRUST, INC. AND SUBSIDIARIES
NOTES TO CONSOLIDATED FINANCIAL STATEMENTS
December 31, 2012
August 1, 2020. As of December 31, 2012, our maximum exposure to loss as a result of our involvement with this VIE, consisting of our investment balance and our guarantee of the secured debt, totaled approximately $27.9 million.
Revenue Recognition
Management believes that all of our leases are operating leases. Rental income is recognized in accordance with the terms of the leases, which generally are month-to-month. Revenues from any long-term operating leases are recognized on a straight-line basis over the term of the lease. The excess of rents received over amounts contractually due pursuant to the underlying leases is included in accounts payable and accrued liabilities in our consolidated balance sheets and contractually due but unpaid rent is included in other assets.
Allowance for Doubtful Accounts
Tenant accounts receivable are reported net of an allowance for doubtful accounts. Management’s estimate of the allowance is based upon a review of the current status of tenant accounts receivable. It is reasonably possible that management’s estimate of the allowance will change in the future.
Real Estate Facilities
Real estate facilities are recorded at cost. We capitalize costs incurred to develop, construct, renovate and improve properties, including interest and property taxes incurred during the construction period. The construction period begins when expenditures for the real estate assets have been made and activities that are necessary to prepare the asset for its intended use are in progress. The construction period ends when the asset is substantially complete and ready for its intended use.
Depreciation of Real Property Assets
Our management is required to make subjective assessments as to the useful lives of our depreciable assets. We consider the period of future benefit of the asset to determine the appropriate useful lives.
Depreciation of our real property assets is charged to expense on a straight-line basis over the estimated useful lives as follows:
| | |
Description | | Standard Depreciable Life |
Land | | Not Depreciated |
Buildings | | 30 to 35 years |
Site Improvements | | 7 to 15 years |
Depreciation of Personal Property Assets
Personal property assets, consisting primarily of furniture, fixtures and equipment are depreciated on a straight-line basis over the estimated useful lives generally ranging from 3 to 5 years, and are included in other assets on our consolidated balance sheets.
Intangible Assets
We have allocated a portion of our real estate purchase price to in-place leases. We are amortizing in-place leases on a straight-line basis over the estimated future benefit period. As of December 31, 2012 and 2011, accumulated amortization of in-place lease intangibles totaled approximately $36.4 million and $24.9 million, respectively.
F-16
STRATEGIC STORAGE TRUST, INC. AND SUBSIDIARIES
NOTES TO CONSOLIDATED FINANCIAL STATEMENTS
December 31, 2012
The total estimated amortization expense of intangible assets for the years ending December 31, 2013, 2014, 2015, 2016 and 2017 is approximately $7.7 million, $2.9 million, $1.1 million, $0 and $0, respectively.
Amortization of Deferred Financing Costs
Costs incurred in connection with obtaining financing are deferred and amortized on a straight-line basis over the term of the related loan, which is not materially different than the effective interest method. As of December 31, 2012 and 2011, accumulated amortization of deferred financing costs totaled approximately $4.4 million and $1.5 million, respectively.
Organization and Offering Costs
Our Advisor may fund organization and offering costs on our behalf. We are required to reimburse our Advisor for such organization and offering costs; provided, however, our Advisor must reimburse us within 60 days after the end of the month in which the Offering terminates to the extent we paid or reimbursed organization and offering costs (excluding sales commissions and dealer manager fees) in excess of 3.5% of the gross offering proceeds from the Primary Offering. Such costs will be recognized as a liability when we have a present responsibility to reimburse our Advisor, which is defined in our Advisory Agreement as the date we satisfied the minimum offering requirements of the primary offering portion of our Initial Offering (which occurred on May 22, 2008). If at any point in time we determine that the total organization and offering costs are expected to exceed 3.5% of the gross proceeds anticipated to be received from the Primary Offering, we will recognize such excess as a capital contribution from our Advisor. As of December 31, 2012, we do not believe total organization and offering costs will exceed 3.5% of the gross proceeds anticipated to be received from the Primary Offering. Offering costs are recorded as an offset to additional paid-in capital, and organization costs are recorded as an expense.
Redeemable Common Stock
We have adopted a share redemption program that may enable stockholders to sell their shares to us in limited circumstances.
We record amounts that are redeemable under the share redemption program as redeemable common stock in the accompanying consolidated balance sheets since the shares are mandatorily redeemable at the option of the holder and therefore their redemption is outside our control. The maximum amount redeemable under our share redemption program is limited to the number of shares we could repurchase with the amount of the net proceeds from the sale of shares under the distribution reinvestment plan. However, accounting guidance states that determinable amounts that can become redeemable but that are contingent on an event that is likely to occur (e.g., the passage of time) should be presented as redeemable when such amount is known. Therefore, the net proceeds from the distribution reinvestment plan are considered to be temporary equity and are presented as redeemable common stock in the accompanying consolidated balance sheets.
In addition, current accounting guidance requires, among other things, that financial instruments that represent a mandatory obligation of us to repurchase shares be classified as liabilities and reported at settlement value. Our redeemable common shares are contingently redeemable at the option of the holder. When we determine we have a mandatory obligation to repurchase shares under the share redemption program, we will reclassify such obligations from temporary equity to a liability based upon their respective settlement values.
During the year ended December 31, 2012, we redeemed approximately 1.3 million shares of common stock for approximately $12.6 million ($9.60 per share). As of December 31, 2012, we had redemption requests for approximately 444,000 shares of common stock for approximately $4.3 million that, if honored in full, would
F-17
STRATEGIC STORAGE TRUST, INC. AND SUBSIDIARIES
NOTES TO CONSOLIDATED FINANCIAL STATEMENTS
December 31, 2012
have caused us to exceed the limits of the share redemption program. We honored such redemption requests, pursuant to the terms of the share redemption program, redeeming all death and disability redemption requests and approximately 76% of the other redemption requests. Such redemptions totaled approximately 343,600 shares for approximately $3.3 million ($9.69 per share) and were redeemed on January 31, 2013 and such amount was reclassified from redeemable common stock to accounts payable and accrued liabilities in the consolidated balance sheets as of December 31, 2012. As of December 31, 2012, we had approximately 100,400 shares that were requested for redemption, but could not be redeemed as it would have caused us to exceed the limits of the share redemption program. We treated the remainder of each redemption request as a request for redemption in the first quarter of 2013. We have funded all redemptions using proceeds from the sale of shares pursuant to our distribution reinvestment plan. Our board of directors may choose to amend, suspend or terminate our share redemption program upon 30 days’ written notice at any time.
Foreign Currency Translation
For non-U.S. functional currency operations, assets and liabilities are translated to U.S. dollars at current exchange rates. Revenues and expenses are translated at the average rates for the period. All related adjustments are recorded in other comprehensive income (loss) as a separate component of stockholders’ equity. Transactions denominated in a currency other than the functional currency of the related operation are recorded at rates of exchange in effect at the date of the transaction. Gains or losses on foreign currency transactions are recorded in other income (expense). For the years ended December 31, 2012, 2011 and 2010, we recorded a gain of approximately $60,000, a loss of approximately $17,000 and a gain of approximately $106,000, respectively.
Accounting for Equity Awards
The cost of restricted stock is required to be measured based on the grant-date fair value and the cost to be recognized over the relevant service period.
Fair Value Measurements
The accounting standard for fair value measurements and disclosures defines fair value, establishes a framework for measuring fair value, and provides for expanded disclosure about fair value measurements. Fair value is defined by the accounting standard for fair value measurements and disclosures as the exchange price that would be received for an asset or paid to transfer a liability (an exit price) in the principal or most advantageous market for the asset or liability in an orderly transaction between market participants on the measurement date. It also establishes a fair value hierarchy that prioritizes observable and unobservable inputs used to measure fair value into three levels. The following summarizes the three levels of inputs and hierarchy of fair value we use when measuring fair value:
| | • | | Level 1 inputs utilize quoted prices (unadjusted) in active markets for identical assets or liabilities that we have the ability to access; |
| | • | | Level 2 inputs may include quoted prices for similar assets and liabilities in active markets, as well as interest rates and yield curves that are observable at commonly quoted intervals; and |
| | • | | Level 3 inputs are unobservable inputs for the assets or liabilities that are typically based on an entity’s own assumptions as there is little, if any, related market activity. |
In instances where the determination of the fair value measurement is based on inputs from different levels of the fair value hierarchy, the fair value measurement will fall within the lowest level that is significant to the fair value measurement in its entirety.
F-18
STRATEGIC STORAGE TRUST, INC. AND SUBSIDIARIES
NOTES TO CONSOLIDATED FINANCIAL STATEMENTS
December 31, 2012
The accounting guidance for fair value measurements and disclosures provides a framework for measuring fair value and establishes a fair value hierarchy which requires an entity to maximize the use of observable inputs and minimize the use of unobservable inputs when measuring fair value. In determining fair value, we utilize valuation techniques that maximize the use of observable inputs and minimize the use of unobservable inputs to the extent possible as well as consider counterparty credit risk in our assessment of fair value. Considerable judgment is necessary to interpret Level 2 and 3 inputs in determining fair value of our financial and non-financial assets and liabilities. Accordingly, there can be no assurance that the fair values we present herein are indicative of amounts that may ultimately be realized upon sale or other disposition of these assets.
Financial and non-financial assets and liabilities measured at fair value on a non-recurring basis in our consolidated financial statements consist of real estate and related assets and investments in unconsolidated joint ventures and related liabilities assumed and equity consideration related to acquisitions we made during 2012 and 2011. The fair values of these assets, liabilities and equity consideration were determined as of the acquisition dates using widely accepted valuation techniques, including (i) discounted cash flow analysis, which considers, among other things, leasing assumptions, growth rates, discount rates and terminal capitalization rates, (ii) income capitalization approach, which considers prevailing market capitalization rates, and (iii) comparable sales activity. In general, we consider multiple valuation techniques when measuring fair values. However, in certain circumstances, a single valuation technique may be appropriate. All of the fair values of the assets, liabilities and common stock as of the acquisition dates were derived using Level 3 inputs.
The carrying amounts of cash and cash equivalents, tenant accounts receivable, other assets, accounts payable and accrued liabilities, distributions payable and amounts due to affiliates approximate fair value because of the relatively short-term nature of these instruments.
The table below summarizes our fixed rate notes payable at December 31, 2012. The estimated fair value of financial instruments is subjective in nature and is dependent on a number of important assumptions, including discount rates and relevant comparable market information associated with each financial instrument. The fair value of the fixed rate notes payable was estimated by discounting the future cash flows using the current rates at which similar loans would be made to borrowers with similar credit ratings and for the same remaining maturities. The use of different market assumptions and estimation methodologies may have a material effect on the reported estimated fair value amounts. Accordingly, the estimates presented below are not necessarily indicative of the amounts we would realize in a current market exchange.
| | | | | | | | |
| | | December 31, 2012 | |
| | | Fair Value | | | Carrying Value | |
Fixed Rate Secured Debt | | $ | 298,636,303 | | | $ | 287,912,016 | |
As of December 31, 2012, we had an interest rate swap on one of our loans (See Note 5). The valuation of this instrument was determined using widely accepted valuation techniques including discounted cash flow analysis on the expected cash flows of each derivative. This analysis reflects the contractual terms of the derivatives, including the period to maturity, and uses observable market-based inputs, including interest rate curves and implied volatilities. The fair values of interest rate swaps are determined using the market standard methodology of netting the discounted future fixed cash payments and the discounted expected variable cash receipts. The variable cash receipts are based on an expectation of future interest rates (forward curves) derived from observable market interest rate curves.
To comply with GAAP, we incorporate credit valuation adjustments to appropriately reflect both our own nonperformance risk and the respective counterparty’s nonperformance risk in the fair value measurements. In
F-19
STRATEGIC STORAGE TRUST, INC. AND SUBSIDIARIES
NOTES TO CONSOLIDATED FINANCIAL STATEMENTS
December 31, 2012
adjusting the fair value of our derivative contracts for the effect of nonperformance risk, we have considered the impact of netting and any applicable credit enhancements, such as collateral postings, thresholds, mutual puts, and guarantees.
Although we have determined that the majority of the inputs used to value our derivatives fall within Level 2 of the fair value hierarchy, the credit valuation adjustments associated with our derivatives utilize Level 3 inputs, such as estimates of current credit spreads to evaluate the likelihood of default by us and our counterparties. However, as of December 31, 2012, we have assessed the significance of the impact of the credit valuation adjustments on the overall valuation of our derivative positions and have determined that the credit valuation adjustments are not significant to the overall valuation of our derivatives. As a result, we have determined that our derivative valuations in their entirety are classified in Level 2 of the fair value hierarchy. As of December 31, 2012, we had $546,333 of Level 2 derivatives (interest rate swap) classified in accounts payable and accrued liabilities on our consolidated balance sheet.
Derivative Instruments and Hedging Activities
The accounting for changes in the fair value of derivatives depends on the intended use of the derivative and the resulting designation. Derivatives used to hedge exposure to changes in the fair value of an asset, liability or firm commitment attributable to a particular risk are considered fair value hedges. Derivatives used to hedge the exposure to variability in expected future cash flows or other types of forecasted transactions are considered cash flow hedges.
For derivatives designated as fair value hedges, changes in the fair value of the derivative and the hedged item related to the hedged risk are recognized in the statements of operations. For derivatives designated as cash flow hedges, the effective portion of changes in the fair value of the derivative is initially reported in other comprehensive income, outside of earnings and subsequently reclassified to earnings when the hedged transaction affects earnings.
Noncontrolling Interest in Consolidated Entities
We account for the noncontrolling interest in our Operating Partnership in accordance with amended accounting guidance. Due to our control through our general partnership interest in our Operating Partnership and the limited rights of the limited partner, our Operating Partnership, including its wholly-owned subsidiaries, is consolidated with the Company and the limited partner interest is reflected as a noncontrolling interest in the accompanying consolidated balance sheets. In addition, we account for the noncontrolling interest in the SF property in accordance with the amended accounting guidance. The noncontrolling interests shall continue to be attributed their share of income and losses, even if that attribution results in a deficit noncontrolling interest balance.
Income Taxes
We made an election to be taxed as a Real Estate Investment Trust (“REIT”), under Sections 856 through 860 of the Internal Revenue Code of 1986, as amended (the “Code”), commencing with our taxable year ended December 31, 2008. To qualify as a REIT, we must meet certain organizational and operational requirements, including a requirement to currently distribute at least 90% of the REIT’s ordinary taxable income to stockholders. As a REIT, we generally will not be subject to federal income tax on taxable income that we distribute to our stockholders. If we fail to qualify as a REIT in any taxable year, we will then be subject to federal income taxes on our taxable income at regular corporate rates and will not be permitted to qualify for
F-20
STRATEGIC STORAGE TRUST, INC. AND SUBSIDIARIES
NOTES TO CONSOLIDATED FINANCIAL STATEMENTS
December 31, 2012
treatment as a REIT for federal income tax purposes for four years following the year during which qualification is lost unless the IRS grants us relief under certain statutory provisions. Such an event could materially adversely affect our net income and net cash available for distribution to stockholders. However, we believe that we will be organized and operate in such a manner as to qualify for treatment as a REIT and intend to operate in the foreseeable future in such a manner that we will remain qualified as a REIT for federal income tax purposes. We have concluded that there are no significant uncertain tax positions requiring recognition or disclosure in our consolidated financial statements.
Even if we qualify for taxation as a REIT, we may be subject to certain state and local taxes on our income and property, and federal income and excise taxes on our undistributed income.
We have filed an election to treat the TRSs as taxable REIT subsidiaries. In general, the TRSs may perform additional services for our tenants and generally may engage in any real estate or non-real estate related business. The TRSs are subject to corporate federal and state income tax. The TRSs follow accounting guidance which requires the use of the asset and liability method. Deferred income taxes will represent the tax effect of future differences between the book and tax bases of assets and liabilities.
Per Share Data
Basic earnings per share attributable for all periods presented are computed by dividing net income (loss) by the weighted average number of shares outstanding during the period. Diluted earnings per share are computed by dividing net income (loss) by the weighted average number of shares outstanding, including all restricted stock grants as though fully vested. For the years ended December 31, 2012, 2011 and 2010, 6,250, 6,875 and 6,875 shares, respectively, of unvested restricted stock were not included in the diluted weighted average shares as such shares were antidilutive.
Recently Issued Accounting Guidance
ASU No. 2011-05, “Presentation of Comprehensive Income” (“ASU 2011-05”), was issued in June 2011 to allow an entity the option to present the total of comprehensive income, the components of net income, and the components of other comprehensive income in either a single continuous statement of comprehensive income or two separate but consecutive statements. Under either option, an entity is required to present each component of net income along with total net income, each component of other comprehensive income along with a total for other comprehensive income, and a total amount for comprehensive income. ASU 2011-05 eliminates the option to present the components of other comprehensive income as part of the statement of changes in stockholders’ equity. ASU 2011-05 does not change the items that are required to be reported in other comprehensive income or when an item of other comprehensive income must be reclassified to net income and is required to be applied retrospectively. For public entities, this ASU is effective for fiscal years beginning after December 15, 2011. We adopted this ASU in the interim period ending March 31, 2012 by selecting the option of two separate but consecutive statements.
Note 3. USA Self Storage I, DST and Madison County Self Storage, DST Acquisitions
In February 2011, we, through an indirect wholly-owned subsidiary, closed on the purchase of the remaining 80.247% in beneficial interests (“Interests”) in USA Self Storage I, DST (“SS I, DST”), a Delaware statutory trust sponsored by our Sponsor, from approximately 40 third-party sellers pursuant to separate purchase agreements with each seller. None of the purchases were contingent upon any of the others. The agreed upon purchase price the Interests acquired, which was based on the aggregate appraised value of the properties, was approximately $30.1 million ($37.55 million total purchase price multiplied by 80.247%). The consideration consisted of approximately $10.2 million in cash along with approximately 70,000 limited partnership units in our Operating Partnership and the ratable portion of approximately $23.3 million of three separate bank loans held by the three property owning subtrusts (the “Subtrusts”) of SS I, DST (the “Bank of America Loans”).
F-21
STRATEGIC STORAGE TRUST, INC. AND SUBSIDIARIES
NOTES TO CONSOLIDATED FINANCIAL STATEMENTS
December 31, 2012
We paid our Advisor approximately $377,000 in acquisition fees in connection with these acquisitions.
SS I, DST, through the Subtrusts, owns 10 self storage facilities located in Georgia, North Carolina and Texas with an aggregate of approximately 5,425 units and 800,400 rentable square feet. The three Subtrusts lease their respective properties to master tenants (the “Tenants”) on a triple-net basis pursuant to master leases (the “Leases”) that have terms of 10 years and expire on November 1, 2015. The Tenants are owned by affiliates of the Sponsor. Under the Leases, the Tenants pay a stated monthly rent equivalent to the monthly debt service payment under the Bank of America Loans, which is paid directly to the lender on behalf of the Subtrusts, a monthly stated rent equivalent to an investor return of 7.0% per annum, and may pay certain annual bonus rent per the terms of the Leases, both of which stated rent and bonus rent are remitted to the Subtrusts. As an Interest holder, we are entitled to our pro rata share of the total rent less the debt service under the Bank of America Loans. The Tenants are entitled to retain any cash flow in excess of these rent payments. We and our Sponsor along with its affiliates have agreed to assign 100% of the economic benefits and obligations from these properties to us in exchange for indemnification by us for any potential liability incurred subsequent to the assignment by the Sponsor in connection with the Leases.
The properties owned by the Subtrusts are subject to the three Bank of America Loans, which had an aggregate principal balance of approximately $23.3 million as of February 1, 2011. The Bank of America Loans bear a fixed interest rate of 5.18%, had original terms of 10 years and mature on November 1, 2015. The Bank of America Loans required monthly interest-only payments during the first three years of their terms and now require monthly principal-and-interest payments based on a 30-year amortization period. Each of the Bank of America Loans is secured only by the properties owned by the respective Subtrust that obtained such loan.
During the third and fourth quarters of 2012, we purchased beneficial interests (the “Madison Interests”) in Madison County Self Storage, DST (“Madison DST”), a Delaware statutory trust sponsored by our Sponsor, from 13 third-party sellers pursuant to separate purchase agreements with each seller. None of the purchases were contingent upon any of the others. Such purchases were completed on December 28, 2012, when we acquired the remaining 52%, such that we then owned 100% of the Madison Interests. The agreed upon purchase price of the Madison Interests acquired, based on the aggregate appraised value of the two properties owned by Madison DST, was approximately $10.7 million, consideration provided consisted of approximately $3.1 million in cash along with the issuance of approximately 84,000 limited partnership units in our Operating Partnership and the assumption of an approximately $6.5 million bank loan held by Madison DST (the “Bank of America Loan –4”). Madison DST leased its properties to a master tenant (the “Tenant”) on a triple-net basis pursuant to a master lease (the “Lease”). The Tenant is owned by affiliates of the Sponsor. Such Lease was terminated effective December 28, 2012.
We paid our Advisor approximately $133,000 in acquisition fees in connection with these acquisitions.
The Madison DST owns two self storage facilities located in Mississippi with an aggregate of approximately 895 units and 149,300 rentable square feet. The properties owned by the Madison DST are subject to the Bank of America Loan – 4, which had an aggregate principal balance of approximately $6.5 million as of the acquisition dates of the Madison Interests. The loan bears a fixed interest rate of 6.33% and had an original term of ten years and matures on October 1, 2017. The loan is secured only by the two properties owned by the Madison DST that obtained such loan.
F-22
STRATEGIC STORAGE TRUST, INC. AND SUBSIDIARIES
NOTES TO CONSOLIDATED FINANCIAL STATEMENTS
December 31, 2012
Note 4. Acquisitions of Real Estate Facilities
The following summarizes the activity in real estate facilities during the years ended December 31, 2012 and 2011:
| | | | |
Real estate facilities | | | | |
Balance at December 31, 2010 | | $ | 274,568,200 | |
Facility acquisitions | | | 229,116,716 | |
Impact of foreign exchange rate changes | | | (695,064 | ) |
Improvements and additions | | | 7,405,724 | |
| | | | |
Balance at December 31, 2011 | | | 510,395,576 | |
Facility acquisitions | | | 85,722,709 | |
Land disposition | | | (1,675,860 | ) |
Impact of foreign exchange rate changes | | | 614,721 | |
Improvements and additions | | | 9,670,749 | |
| | | | |
Balance at December 31, 2012 | | $ | 604,727,895 | |
| | | | |
Accumulated depreciation | | | | |
Balance at December 31, 2010 | | $ | (6,677,014 | ) |
Depreciation expense | | | (9,294,274 | ) |
| | | | |
Balance at December 31, 2011 | | | (15,971,288 | ) |
Depreciation expense | | | (13,869,032 | ) |
| | | | |
Balance at December 31, 2012 | | $ | (29,840,320 | ) |
| | | | |
F-23
STRATEGIC STORAGE TRUST, INC. AND SUBSIDIARIES
NOTES TO CONSOLIDATED FINANCIAL STATEMENTS
December 31, 2012
2012 and 2011 Acquisitions
The following table summarizes the purchase price allocation for our acquisitions for the years ended December 31, 2012 and 2011:
| | | | | | | | | | | | | | | | | | | | | | | | | | | | |
Property | | Acquisition
Date | | | Real Estate
Assets | | | Intangibles | | | Total | | | Debt Assumed
or Issued
(2)(3) | | | Revenue
(4) | | | Operating
Income
(4) (5) | |
Concord—NC | | | 2/1/2011 | | | $ | 2,809,179 | | | $ | 290,000 | | | $ | 3,099,179 | | | $ | 2,262,355 | | | $ | 359,402 | | | $ | 174,126 | |
Hickory—NC | | | 2/1/2011 | | | | 3,068,239 | | | | 300,000 | | | | 3,368,239 | | | | 2,458,764 | | | | 392,250 | | | | 242,308 | |
Morganton—NC | | | 2/1/2011 | | | | 2,479,875 | | | | 420,000 | | | | 2,899,875 | | | | 2,116,866 | | | | 375,052 | | | | 215,520 | |
El Paso II—TX | | | 2/1/2011 | | | | 4,028,337 | | | | 560,000 | | | | 4,588,337 | | | | 2,493,626 | | | | 559,578 | | | | 349,077 | |
El Paso III—TX | | | 2/1/2011 | | | | 5,584,356 | | | | 510,000 | | | | 6,094,356 | | | | 3,312,103 | | | | 679,569 | | | | 447,752 | |
El Paso IV—TX | | | 2/1/2011 | | | | 3,394,766 | | | | 300,000 | | | | 3,694,766 | | | | 2,007,996 | | | | 422,220 | | | | 240,614 | |
El Paso V—TX | | | 2/1/2011 | | | | 3,535,809 | | | | 420,000 | | | | 3,955,809 | | | | 2,149,865 | | | | 488,422 | | | | 300,408 | |
Dallas—TX | | | 2/1/2011 | | | | 4,108,217 | | | | 450,000 | | | | 4,558,217 | | | | 2,477,257 | | | | 626,727 | | | | 288,850 | |
Lawrenceville I—GA | | | 2/1/2011 | | | | 1,529,603 | | | | 150,000 | | | | 1,679,603 | | | | 1,493,828 | | | | 289,609 | | | | 118,239 | |
Lawrenceville II—GA | | | 2/1/2011 | | | | 2,832,445 | | | | 260,000 | | | | 3,092,445 | | | | 2,750,402 | | | | 324,684 | | | | 147,055 | |
Mississauga—Ontario, Canada (6) (7) | | | 3/11/2011 | | | | 5,662,250 | | | | — | | | | 5,662,250 | | | | — | | | | — | | | | — | |
El Paso—TX | | | 3/17/2011 | | | | 1,560,000 | | | | 40,000 | | | | 1,600,000 | | | | — | | | | 116,539 | | | | (10,575 | ) |
Las Vegas VII—NV (8) | | | 3/25/2011 | | | | 4,573,052 | | | | 460,000 | | | | 5,033,052 | | | | — | | | | 471,845 | | | | 268,298 | |
Las Vegas VIII—NV (8) | | | 3/25/2011 | | | | 4,901,631 | | | | 390,000 | | | | 5,291,631 | | | | — | | | | 440,722 | | | | 237,019 | |
SF Bay Area—Morgan Hill—CA | | | 3/30/2011 | | | | 5,654,098 | | | | 680,000 | | | | 6,334,098 | | | | 3,089,522 | | | | 599,567 | | | | 382,773 | |
SF Bay Area—Vallejo—CA | | | 3/30/2011 | | | | 7,266,974 | | | | 670,000 | | | | 7,936,974 | | | | 4,678,535 | | | | 705,234 | | | | 434,485 | |
Peachtree City—GA | | | 6/10/2011 | | | | 4,890,000 | | | | 520,000 | | | | 5,410,000 | | | | 2,645,000 | | | | 339,918 | | | | 203,860 | |
Buford—GA | | | 6/10/2011 | | | | 2,357,000 | | | | 200,000 | | | | 2,557,000 | | | | 1,350,000 | | | | 260,648 | | | | 140,894 | |
Jonesboro—GA | | | 6/10/2011 | | | | 2,295,000 | | | | 200,000 | | | | 2,495,000 | | | | 1,100,000 | | | | 282,064 | | | | 146,999 | |
Ellenwood—GA | | | 6/10/2011 | | | | 2,114,225 | | | | 196,775 | | | | 2,311,000 | | | | 1,260,000 | | | | 213,964 | | | | 114,992 | |
Marietta II—GA | | | 6/10/2011 | | | | 2,452,200 | | | | 227,800 | | | | 2,680,000 | | | | 1,200,000 | | | | 214,388 | | | | 88,804 | |
Collegeville—PA | | | 6/10/2011 | | | | 2,835,500 | | | | 263,500 | | | | 3,099,000 | | | | 1,515,000 | | | | 280,461 | | | | 151,887 | |
Skippack—PA | | | 6/10/2011 | | | | 2,113,000 | | | | 280,000 | | | | 2,393,000 | | | | 1,170,000 | | | | 263,982 | | | | 144,337 | |
Ballston Spa—NY | | | 6/10/2011 | | | | 4,706,760 | | | | 437,240 | | | | 5,144,000 | | | | 2,515,000 | | | | 453,754 | | | | 304,218 | |
Trenton—NJ | | | 6/10/2011 | | | | 6,993,000 | | | | 800,000 | | | | 7,793,000 | | | | 3,810,000 | | | | 531,504 | | | | 349,152 | |
Fredericksburg—VA | | | 6/10/2011 | | | | 3,911,625 | | | | 363,375 | | | | 4,275,000 | | | | 2,090,000 | | | | 335,181 | | | | 183,271 | |
Sandston—VA | | | 6/10/2011 | | | | 6,143,000 | | | | 730,000 | | | | 6,873,000 | | | | 3,360,000 | | | | 461,938 | | | | 297,451 | |
Ladera Ranch—CA (9) | | | 7/6/2011 | | | | 19,661,489 | | | | 1,630,000 | | | | 21,291,489 | | | | 7,381,049 | | | | 893,084 | | | | 535,859 | |
SF Bay Area—San Lorenzo—CA | | | 7/15/2011 | | | | 2,450,880 | | | | 350,000 | | | | 2,800,880 | | | | 2,192,560 | | | | 289,188 | | | | 107,777 | |
Hampton—VA | | | 7/20/2011 | | | | 4,330,000 | | | | 570,000 | | | | 4,900,000 | | | | 3,000,000 | | | | 307,478 | | | | 184,012 | |
Las Vegas V—NV | | | 7/21/2011 | | | | 4,050,000 | | | | 420,000 | | | | 4,470,000 | | | | 1,715,812 | | | | 267,278 | | | | 128,814 | |
SF Bay Area—Gilroy—CA | | | 8/12/2011 | | | | 5,890,000 | | | | 670,000 | | | | 6,560,000 | | | | 4,000,000 | | | | 343,669 | | | | 199,731 | |
Brampton—Ontario, Canada (6) (7) | | | 9/12/2011 | | | | 5,174,205 | | | | — | | | | 5,174,205 | | | | — | | | | — | | | | — | |
Toms River—NJ | | | 10/21/2011 | | | | 5,220,000 | | | | 480,000 | | | | 5,700,000 | | | | — | | | | 145,874 | | | | 84,436 | |
Kennesaw—GA (10) | | | 12/27/2011 | | | | 6,008,992 | | | | 140,000 | | | | 6,148,992 | | | | 3,484,000 | | | | 4,401 | | | | 441 | |
Sharpsburg—GA (10) | | | 12/27/2011 | | | | 6,042,241 | | | | 210,000 | | | | 6,252,241 | | | | 3,542,500 | | | | 5,476 | | | | 2,094 | |
Duluth—N. Berkeley Lake—GA (10) | | | 12/27/2011 | | | | 6,611,120 | | | | 100,000 | | | | 6,711,120 | | | | 3,802,500 | | | | 4,594 | | | | (916 | ) |
Duluth II—Peachtree Industrial—GA (10) | | | 12/27/2011 | | | | 6,693,201 | | | | 190,000 | | | | 6,883,201 | | | | 3,900,000 | | | | 5,735 | | | | 1,359 | |
Duluth III—Breckenridge—GA (10) | | | 12/27/2011 | | | | 6,840,561 | | | | 100,000 | | | | 6,940,561 | | | | 3,932,500 | | | | 4,304 | | | | 814 | |
Marietta III—GA (10) | | | 12/27/2011 | | | | 6,503,761 | | | | 150,000 | | | | 6,653,761 | | | | 3,770,000 | | | | 4,971 | | | | 765 | |
Austell—GA (10) | | | 12/27/2011 | | | | 4,528,801 | | | | 60,000 | | | | 4,588,801 | | | | 2,600,000 | | | | 2,583 | | | | (72 | ) |
Sandy Springs—GA (10) | | | 12/27/2011 | | | | 8,441,761 | | | | 80,000 | | | | 8,521,761 | | | | 8,060,000 | | | | 5,858 | | | | 1,390 | |
Smyrna—GA (10) | | | 12/27/2011 | | | | 6,648,480 | | | | 120,000 | | | | 6,768,480 | | | | 3,835,000 | | | | 4,402 | | | | (30 | ) |
Lawrenceville III—GA (10) | | | 12/27/2011 | | | | 7,017,721 | | | | 50,000 | | | | 7,067,721 | | | | 3,721,250 | | | | 3,253 | | | | (641 | ) |
Jacksonville—Monument—FL (10) | | | 12/27/2011 | | | | 8,069,841 | | | | 190,000 | | | | 8,259,841 | | | | 4,680,000 | | | | 6,828 | | | | (891 | ) |
Jacksonville—Timuquana—FL (10) | | | 12/27/2011 | | | | 5,133,521 | | | | 70,000 | | | | 5,203,521 | | | | 2,665,000 | | | | 3,134 | | | | (203 | ) |
| | | | | | | | | | | | | | | | | | | | | | | | | | | | |
2011 Total | | | | | | $ | 229,116,716 | | | $ | 15,698,690 | | | $ | 244,815,406 | | | $ | 119,588,290 | | | $ | 12,791,332 | | | $ | 7,206,553 | |
| | | | | | | | | | | | | | | | | | | | | | | | | | | | |
F-24
STRATEGIC STORAGE TRUST, INC. AND SUBSIDIARIES
NOTES TO CONSOLIDATED FINANCIAL STATEMENTS
December 31, 2012
| | | | | | | | | | | | | | | | | | | | | | | | | | | | |
Property | | Acquisition
Date | | | Real Estate
Assets | | | Intangibles | | | Total | | | Debt Assumed
or Issued
(2)(3) | | | Revenue
(4) | | | Operating
Income
(4) (5) | |
Chantilly—VA | | | 5/24/2012 | | | $ | 6,400,000 | | | $ | 900,000 | | | $ | 7,300,000 | | | $ | 3,500,000 | | | $ | 550,910 | | | $ | 359,387 | |
Savannah I—GA(11) | | | 8/16/2012 | | | | 2,560,000 | | | | 140,000 | | | | 2,700,000 | | | | — | | | | 123,372 | | | | 57,061 | |
Savannah II—GA(11) | | | 8/16/2012 | | | | 2,490,000 | | | | 110,000 | | | | 2,600,000 | | | | — | | | | 113,223 | | | | 46,759 | |
Columbia—SC(11) | | | 8/16/2012 | | | | 2,630,000 | | | | 70,000 | | | | 2,700,000 | | | | — | | | | 99,115 | | | | 20,289 | |
Lexington I—SC(11) | | | 8/16/2012 | | | | 1,810,000 | | | | 190,000 | | | | 2,000,000 | | | | — | | | | 81,112 | | | | 23,272 | |
Stuart I—FL(11) | | | 8/16/2012 | | | | 2,890,000 | | | | 110,000 | | | | 3,000,000 | | | | — | | | | 106,495 | | | | 43,489 | |
Lexington II—SC(11) | | | 8/16/2012 | | | | 4,130,000 | | | | 170,000 | | | | 4,300,000 | | | | — | | | | 151,327 | | | | 71,512 | |
Stuart II—FL(11) | | | 8/16/2012 | | | | 3,300,000 | | | | 100,000 | | | | 3,400,000 | | | | — | | | | 148,858 | | | | 76,937 | |
Bluffton—SC(11) | | | 8/16/2012 | | | | 5,230,000 | | | | 270,000 | | | | 5,500,000 | | | | — | | | | 210,482 | | | | 114,010 | |
Wilmington Island—GA (11) | | | 10/1/2012 | | | | 5,810,000 | | | | 690,000 | | | | 6,500,000 | | | | 4,330,000 | | | | 191,219 | | | | 135,144 | |
Myrtle Beach—SC(11) | | | 10/1/2012 | | | | 3,510,000 | | | | 190,000 | | | | 3,700,000 | | | | 1,500,000 | | | | 74,102 | | | | 31,355 | |
Mt. Pleasant I—SC(11) | | | 11/5/2012 | | | | 2,680,000 | | | | 320,000 | | | | 3,000,000 | | | | 1,500,000 | | | | 51,787 | | | | 23,551 | |
Charleston I—SC(11) | | | 11/5/2012 | | | | 2,810,000 | | | | 190,000 | | | | 3,000,000 | | | | 1,500,000 | | | | 53,393 | | | | 20,811 | |
Charleston II—SC(11) | | | 11/5/2012 | | | | 3,150,000 | | | | 350,000 | | | | 3,500,000 | | | | 1,650,000 | | | | 63,445 | | | | 35,634 | |
Mt. Pleasant II—SC(11) | | | 11/5/2012 | | | | 5,200,000 | | | | 600,000 | | | | 5,800,000 | | | | 3,350,000 | | | | 91,692 | | | | 55,170 | |
Charleston III—SC(11) | | | 11/5/2012 | | | | 6,305,000 | | | | 620,000 | | | | 6,925,000 | | | | 3,362,500 | | | | 99,124 | | | | 64,738 | |
Mt. Pleasant III—SC(11) | | | 11/5/2012 | | | | 15,410,000 | | | | 1,090,000 | | | | 16,500,000 | | | | 8,000,000 | | | | 221,524 | | | | 146,105 | |
Ridgeland—MS(1) | | | 12/28/2012 | | | | 4,910,788 | | | | 610,000 | | | | 5,520,788 | | | | 3,510,095 | | | | — | | | | — | |
Canton—MS(1) | | | 12/28/2012 | | | | 4,496,921 | | | | 540,000 | | | | 5,036,921 | | | | 3,196,694 | | | | — | | | | — | |
| | | | | | | | | | | | | | | | | | | | | | | | | | | | |
2012 Total | | | | | | $ | 85,722,709 | | | $ | 7,260,000 | | | $ | 92,982,709 | | | $ | 35,399,289 | | | $ | 2,431,180 | | | $ | 1,325,224 | |
| | | | | | | | | | | | | | | | | | | | | | | | | | | | |
| (1) | The allocations noted above are based on a preliminary determination of the fair value of the total consideration provided. Such valuations may change as we complete our purchase price accounting. |
| (2) | See Note 5 for specific terms of the Company’s debt. |
| (3) | Amounts include the purchase accounting fair value adjustment of debt, as applicable |
| (4) | The operating results of the facilities acquired above have been included in the Company’s statement of operations since their respective acquisition date. The revenue and operating income in the table above represents such metrics from the respective acquisition date through the end of the respective fiscal year. |
| (5) | Property operating income excludes corporate general and administrative expenses, asset management fees, interest expense, depreciation, amortization and acquisition expenses. |
| (6) | Allocation (excludes development costs) based on Canadian/U.S. exchange rate as of the date of acquisition. |
| (7) | Property was under construction; therefore no revenue or operating income is included above. |
| (8) | Consideration provided included approximately 120,000 Class D Units. |
| (9) | Acquisition included 3.57 acres of undeveloped land, which we purchased for approximately $3.9 million. |
| (10) | These above noted properties are collectively referred to as the “Homeland Portfolio”. |
| (11) | These above noted properties are collectively referred to as the “Stockade Portfolio”. |
All of the above properties were acquired from unaffiliated third parties. We incurred acquisition fees due to our Advisor for the above acquisitions. For the years ending December 31, 2012 and 2011, such fees were approximately $2.2 million and $5.5 million, respectively.
During the quarter ended December 31, 2012, we finalized the purchase price accounting for the last 13 acquisitions completed in 2011 and for all of the 2012 acquisitions, excluding those acquired on December 28, 2012, and made revisions to preliminary estimates including real estate facilities and intangible assets as further evaluations were completed and additional information was received from third parties subsequent to the acquisition dates. We anticipate finalizing the purchase price allocations for the remaining 2012 acquisitions by December 31, 2013, as further evaluations are completed and additional information is received from third parties.
The impact related to the finalization of purchase price accounting was not material to our consolidated financial statements. For acquisitions where the purchase price accounting was finalized in 2012 and 2011 the weighted-average amortization period of the intangibles as of the date of acquisition was 29 months and 29 months, respectively.
F-25
STRATEGIC STORAGE TRUST, INC. AND SUBSIDIARIES
NOTES TO CONSOLIDATED FINANCIAL STATEMENTS
December 31, 2012
Note 5. Secured Debt
The Company’s secured debt is summarized as follows:
| | | | | | | | | | | | | | | | |
| | | Carrying value as of: | | | | | | | |
Debt/Encumbered Property | | December 31,
2012 | | | December 31,
2011 | | | Stated Interest
Rate | | | Maturity
Date | |
Crescent Springs(1) | | $ | — | | | $ | 800,000 | | | | 5.00 | % | | | 2/11/2014 | |
Florence, Walton(1) | | | — | | | | 3,700,000 | | | | 5.00 | % | | | 2/11/2014 | |
Montgomery | | | 2,768,704 | | | | 2,838,810 | | | | 6.42 | % | | | 7/1/2016 | |
Seabrook | | | 4,516,470 | | | | 4,584,013 | | | | 5.73 | % | | | 1/1/2016 | |
Greenville | | | 2,263,211 | | | | 2,297,069 | | | | 5.65 | % | | | 3/1/2016 | |
Kemah | | | 8,858,838 | | | | 8,975,529 | | | | 6.20 | % | | | 6/1/2016 | |
Memphis | | | 2,502,922 | | | | 2,538,295 | | | | 5.67 | % | | | 12/1/2016 | |
Tallahassee | | | 7,537,926 | | | | 7,622,854 | | | | 6.16 | % | | | 8/1/2016 | |
Houston | | | 2,018,754 | | | | 2,053,995 | | | | 5.67 | % | | | 2/1/2017 | |
San Francisco (consolidated VIE) | | | 10,387,192 | | | | 10,500,000 | | | | 5.84 | % | | | 12/1/2016 | |
Lake Forest | | | 18,000,000 | | | | 18,000,000 | | | | 6.47 | % | | | 10/1/2017 | |
Las Vegas I | | | 1,530,923 | | | | 1,540,000 | | | | 5.72 | % | | | 6/1/2017 | |
Pearland | | | 3,480,298 | | | | 3,500,000 | | | | 5.93 | % | | | 7/1/2017 | |
Daphne | | | 1,544,325 | | | | 1,698,407 | | | | 5.47 | % | | | 8/1/2020 | |
Mesa | | | 3,036,098 | | | | 3,100,077 | | | | 5.38 | % | | | 4/1/2015 | |
Riverdale | | | 4,800,000 | | | | 4,800,000 | | | | 4.00 | % | | | 5/14/2014 | |
Prudential Portfolio Loan (2) (3) | | | 31,547,772 | | | | 32,024,379 | | | | 5.42 | % | | | 9/5/2019 | |
Dufferin—Toronto—Ontario, Canada(4) | | | 6,812,855 | | | | 6,862,800 | | | | 5.22 | % | | | 12/15/2013 | |
Citi Loan(5) | | | 28,466,942 | | | | 28,829,407 | | | | 5.77 | % | | | 2/6/2021 | |
Bank of America Loan—1(6) | | | 4,400,398 | | | | 4,474,310 | | | | 5.18 | % | | | 11/1/2015 | |
Bank of America Loan—2(7) | | | 6,667,782 | | | | 6,779,778 | | | | 5.18 | % | | | 11/1/2015 | |
Bank of America Loan—3(8) | | | 11,984,654 | | | | 12,185,955 | | | | 5.18 | % | | | 11/1/2015 | |
Prudential—Long Beach(9) | | | 6,637,926 | | | | 6,736,892 | | | | 5.27 | % | | | 9/5/2019 | |
SF Bay Area—Morgan Hill—CA | | | 2,928,860 | | | | 2,997,061 | | | | 5.75 | % | | | 4/1/2013 | |
SF Bay Area—Vallejo—CA | | | 4,390,176 | | | | 4,478,882 | | | | 6.04 | % | | | 6/1/2014 | |
Citi Las Vegas Loan(10) | | | 7,545,688 | | | | 7,649,929 | | | | 5.26 | % | | | 6/6/2021 | |
ING Loan(11) | | | 21,587,669 | | | | 21,892,726 | | | | 5.47 | % | | | 7/1/2021 | |
Ladera Ranch | | | 6,821,300 | | | | 6,942,734 | | | | 5.84 | % | | | 6/1/2016 | |
SF Bay Area—San Lorenzo—CA | | | 2,099,622 | | | | 2,170,037 | | | | 6.07 | % | | | 1/1/2014 | |
Las Vegas V | | | 1,667,485 | | | | 1,704,037 | | | | 5.02 | % | | | 7/1/2015 | |
Second Restated KeyBank Loan(12) | | | 51,666,666 | | | | 76,635,000 | | | | 4.71 | % | | | 12/24/2014 | |
KeyBank Bridge Loan(13) | | | — | | | | 28,000,000 | | | | 6.79 | % | | | 8/31/2012 | |
Mississauga(14)—Ontario, Canada | | | 6,841,134 | | | | 2,194,874 | | | | 5.00 | % | | | 10/31/2014 | |
Chantilly(15) | | | 3,474,712 | | | | — | | | | 4.75 | % | | | 6/6/2022 | |
Brampton(16)—Ontario, Canada | | | 208,086 | | | | — | | | | 5.25 | % | | | 6/30/2016 | |
Citi Stockade Loan—1(17) | | | 18,200,000 | | | | — | | | | 4.60 | % | | | 10/1/2022 | |
KeyBank CMBS Loan(18) | | | 31,000,000 | | | | — | | | | 4.65 | % | | | 11/1/2022 | |
Citi Stockade Loan—2(19) | | | 19,362,500 | | | | — | | | | 4.61 | % | | | 11/6/2022 | |
Bank of America Loan—4(20) | | | 6,459,043 | | | | — | | | | 6.33 | % | | | 10/1/2017 | |
Net fair value adjustment | | | (576,173 | ) | | | (1,064,643 | ) | | | | | | | | |
| | | | | | | | | | | | | | | | |
Total secured debt | | $ | 353,440,758 | | | $ | 330,043,207 | | | | | | | | | |
| | | | | | | | | | | | | | | | |
| (1) | These loans were refinanced in January 2012 through the Second Restated KeyBank Loan. |
F-26
STRATEGIC STORAGE TRUST, INC. AND SUBSIDIARIES
NOTES TO CONSOLIDATED FINANCIAL STATEMENTS
December 31, 2012
| (2) | This portfolio loan is comprised of 11 discrete mortgage loans on 11 respective properties (Manassas, Marietta, Erlanger, Pittsburgh, Weston, Fort Lee, Oakland Park, Tempe, Phoenix II, Davie and Las Vegas II). Each of the individual loans is cross-collateralized by the other 10. |
| (3) | Ten of the loans in this portfolio loan bear an interest rate of 5.43% and the remaining loan bears an interest rate of 5.31%. The weighted average interest rate of this portfolio is 5.42%. |
| (4) | On January 12, 2011, we encumbered the Dufferin property with a Canadian dollar denominated loan of $7 million which bears interest at the bank’s floating rate plus 3.5% (subject to a reduction in certain circumstances). The rate in effect at December 31, 2012 was 5.22%. |
| (5) | This portfolio loan encumbers 11 properties (Biloxi, Gulf Breeze I, Alpharetta, Florence II, Jersey City, West Mifflin, Chicago—95th St. Chicago—Western Ave., Chicago—Ogden Ave., Chicago—Roosevelt Rd. and Las Vegas IV). The net book value of the encumbered properties as of December 31, 2012 was approximately $56 million. Such amounts are only available to satisfy the obligations of this loan. |
| (6) | This loan encumbers the Lawrenceville I and II properties. |
| (7) | This loan encumbers the Concord, Hickory and Morganton properties. |
| (8) | This loan encumbers the El Paso II, III, IV & V properties as well as the Dallas property. |
| (9) | This loan is cross-collateralized by the 11 properties discussed in (2). |
| (10) | This loan encumbers the Las Vegas VII and Las Vegas VIII properties. The net book value of the encumbered properties as of December 31, 2012 was approximately $9.3 million. Such amounts are only available to satisfy the obligations of this loan. |
| (11) | This portfolio loan is comprised of 11 discrete mortgage loans on 11 respective properties (Peachtree City, Buford, Jonesboro, Ellenwood, Marietta II, Collegeville, Skippack, Ballston Spa, Trenton, Fredericksburg and Sandston). Each of the individual loans has a term of 30 years and matures on July 1, 2041. ING has the option to require payment of the loan in full every five years beginning on July 1, 2021. |
| (12) | As of December 31, 2012, this loan was collateralized by the Homeland Portfolio. For additional discussion, see “Second Restated KeyBank Loan” below. |
| (13) | This loan was repaid in full on August 7, 2012. Refer to discussion below regarding the KeyBank Bridge Loan. |
| (14) | In December 2011, we entered into a Canadian dollar denominated construction loan with an aggregate potential commitment amount of approximately $9.2 million. Such loan bears interest at the bank’s floating rate, plus 2% (totaling 5.0% as of December 31, 2012). |
| (15) | The net book value of the Chantilly property as of December 31, 2012 was approximately $6.5 million. Such amounts are only available to satisfy the obligations of this loan. |
| (16) | In September 2012, we entered into a Canadian dollar denominated construction loan with an aggregate potential commitment amount of approximately $9.2 million. Such loan bears interest at the bank’s floating rate, plus 2.25% (totaling 5.25% as of December 31, 2012). |
| (17) | This portfolio loan encumbers 10 properties (Savannah I, Savannah II, Columbia, Lexington I, Stuart I, Lexington II, Stuart II, Bluffton, Wilmington Island and Myrtle Beach). The net book value of the encumbered properties as of December 31, 2012 was approximately $34.4 million. Such amounts are only available to satisfy the obligations of this loan. |
| (18) | This portfolio loan encumbers nine properties (Los Angeles—La Cienega, Las Vegas III, Las Vegas VI, Hampton, SF Bay Area—Gilroy, Toms River, Crescent Springs, Florence and Walton). The net book value of the encumbered properties as of December 31, 2012 was approximately $42.5 million. |
| (19) | This portfolio loan encumbers six properties (Mt. Pleasant I, Charleston I, Charleston II, Mt. Pleasant II, Charleston III, and Mt. Pleasant III). The net book value of the encumbered properties as of December 31, 2012 was approximately $35.5 million. Such amounts are only available to satisfy the obligations of this loan. |
| (20) | This loan encumbers the Ridgeland and Canton properties. |
F-27
STRATEGIC STORAGE TRUST, INC. AND SUBSIDIARIES
NOTES TO CONSOLIDATED FINANCIAL STATEMENTS
December 31, 2012
As of December 31, 2012 and 2011, the Company’s secured debt shown above was secured by the properties shown above, which properties had net book values of approximately $570 million and $489 million, respectively.
Second Restated KeyBank Loan
On December 27, 2011, in connection with the acquisition of the Homeland Portfolio (an $80 million portfolio of 10 properties in Atlanta, GA and two properties in Jacksonville, FL), our Operating Partnership and various property owning SPEs entered into a second amended and restated secured credit facility with KeyBank, National Association (“KeyBank”) with total commitments of $82 million (such facility replaced our then existing $30 million Restated KeyBank Credit Facility, which had approximately $20 million outstanding before the purchase of the Homeland Portfolio) and we drew down an additional approximately $56.6 million thereunder. On January 12, 2012, we drew down an additional approximately $5.4 million in connection with the repayment of the previously outstanding debt on our Crescent Springs, Florence and Walton properties, bringing the total amount outstanding to $82 million. Such credit facility, as amended (the “Second Restated KeyBank Loan”) was converted from a revolving credit facility to a term loan on August 15, 2012 and the principal balance was reduced on October 10, 2012, from $82 million to $55 million, through the use of the majority of the proceeds from the KeyBank CMBS Loan (see below).
Beginning on November 30, 2012, we are required to make monthly payments in the amount of $1,666,667 until the outstanding principal balance of the Second Restated KeyBank Loan is reduced to $45 million. The remaining $45 million matures on December 24, 2014, subject to two, one-year extension options (subject to the fulfillment of certain conditions), and requires monthly interest-only payments
We were required to purchase an interest rate swap with a notional amount of $45 million, which requires us to pay an effective fixed interest rate of approximately 5.41% on the hedged portion of the debt. For the remaining amount outstanding, under the terms of the Second Restated KeyBank Loan, our Operating Partnership has the option of selecting one of three variable interest rates which have applicable spreads. Our Operating Partnership has elected to have a 30-day LIBOR rate apply, which, including the applicable spread, equaled an interest rate of approximately 4.71% as of December 31, 2012. Our Operating Partnership may change this election from time to time for the non-hedged portion of the debt, as provided in the agreement.
The Second Restated KeyBank Loan is secured by cross-collateralized first mortgage liens or first lien deeds of trust on all properties in the Homeland Portfolio and is cross-defaulted to any recourse debt of $25 million or greater in the aggregate or non-recourse debt of $75 million or greater in the aggregate (it was originally cross-defaulted to the KeyBank Bridge Loan, defined below, which was repaid in full on August 7, 2012). Our Operating Partnership may prepay the Second Restated KeyBank Loan, in whole or in part, at any time without penalty. Pursuant to that certain guaranty dated December 27, 2011 in favor of KeyBank, we serve as a guarantor of all obligations due under the Second Restated KeyBank Loan.
In connection with the Second Restated KeyBank Loan, our Operating Partnership paid customary lender fees, legal fees and other expenses.
Per the terms of the Second Restated KeyBank Loan, we were required to fund a $1.55 million interest reserve account at closing, which KeyBank may draw upon on a monthly basis in an amount equal to the shortfall between the net operating income of the mortgaged properties and the interest on the Second Restated KeyBank Loan. We are required to replenish interest reserve account if it falls below a certain threshold, but will be refunded the entire balance upon achieving (as defined therein) a debt service coverage ratio (“DSCR”) of 1.30 to 1 for two consecutive quarters provided no event of default then exists.
F-28
STRATEGIC STORAGE TRUST, INC. AND SUBSIDIARIES
NOTES TO CONSOLIDATED FINANCIAL STATEMENTS
December 31, 2012
The Second Restated KeyBank Loan contains a number of customary representations, warranties, indemnities and covenants, including, but not limited to, the following (as defined therein and tested as of the close of each fiscal quarter):
| | • | | a maximum total leverage ratio (60% on July 1, 2012, and decreasing to 57.5% on October 1, 2012, 55% on October 1, 2013 and 50% on October 1, 2014); |
| | • | | a minimum interest service coverage ratio (1.60 to 1 on July 1, 2012 and increasing to 1.75 to 1 on January 1, 2014); |
| | • | | a minimum fixed charge ratio (1.35 to 1 on July 1, 2012 and increasing to 1.50 to 1 on January 1, 2014); |
| | • | | a minimum DSCR (beginning on March 31, 2014 at 1.10 to 1 and increasing to 1.30 to 1 on March 31, 2015 and 1.40 to 1 on March 31, 2016); |
| | • | | a minimum liquidity (unencumbered cash and cash equivalents plus marketable securities) of $2 million; |
| | • | | a minimum tangible net worth of at least $175 million plus 75% of the net proceeds of our ongoing public offering (less funded share redemptions, but in no event may our net worth be less than $175 million); |
| | • | | a required loan to value ratio related to the Homeland Portfolio equal to no more than 65%; and |
| | • | | a required debt yield related to the Homeland Portfolio of 3% commencing on January 1, 2013 and increasing to 4% on July 1, 2013, 6% on January 1, 2014, 8% on July 1, 2014 and 10.5% on January 1, 2015. |
We have ten business days from the date on which any violation of the above covenants occurs in which to cure the violation, to the extent the violation can be cured with a cash payment. The terms of the Second Restated KeyBank Loan also limit the extent to which we and our Operating Partnership may incur additional debt without the consent of KeyBank.
KeyBank Bridge Loan
On December 27, 2011, in connection with the acquisition of the Homeland Portfolio, our Operating Partnership and certain property owning SPEs also obtained a bridge loan with total commitments of $28 million (the “KeyBank Bridge Loan”) from KeyBank ($10 million of which was previously committed with nothing outstanding under our previously existing KeyBank Working Capital Line, which was terminated) and drew down the entire committed amount.
The KeyBank Bridge Loan required monthly principal and interest payments and was repaid in full on August 7, 2012. Under the terms of the KeyBank Bridge Loan, our Operating Partnership had the option of selecting one of three variable interest rates, which had applicable spreads. Our Operating Partnership elected to have a 30-day LIBOR rate apply, which, including the applicable spread, equaled an interest rate of approximately 6.7% for the period outstanding during 2012.
Citi Stockade Loan—1
On October 1, 2012, we, through 10 property owning special purpose entities (“SPEs”) wholly-owned by our Operating Partnership, entered into a loan agreement with Citigroup Global Markets Realty Corp. with a total principal amount of $18.2 million (the “Citi Stockade Loan—1”). The Citi Stockade Loan—1 has a term of ten years, maturing on October 1, 2022, and requires monthly payments of interest only for the first two years, with
F-29
STRATEGIC STORAGE TRUST, INC. AND SUBSIDIARIES
NOTES TO CONSOLIDATED FINANCIAL STATEMENTS
December 31, 2012
fixed monthly payments of principal and interest thereafter. The Citi Stockade Loan—1 bears interest at a fixed rate of 4.6%. We serve as a guarantor of the obligations under the Citi Stockade Loan—1. The Citi Stockade Loan—1 contains a number of other customary terms and covenants.
KeyBank CMBS Loan
On October 10, 2012, we and nine SPEs wholly-owned by our Operating Partnership, (the “KeyBank CMBS Properties”) entered into a CMBS loan obtained from KeyBank National Association (the “KeyBank CMBS Loan”) in the principal amount of $31 million. Such loan is cross-collateralized and cross-defaulted amongst the KeyBank CMBS Properties. The majority of the proceeds from the KeyBank CMBS Loan were used to reduce the outstanding principal amount under the Second Restated KeyBank Loan from $82 million to $55 million. KeyBank released the nine KeyBank CMBS Properties, along with three additional properties, from the security interests granted under the Second Restated KeyBank Loan.
The KeyBank CMBS Loan has a term of 10 years and matures on November 1, 2022. Additionally, the KeyBank CMBS Loan bears a fixed interest rate of 4.65% per annum, is interest only for the first year and thereafter requires amortization on a 30-year amortization schedule. The KeyBank CMBS Loan contains a number of other customary terms and covenants. We serve as guarantor of the obligations under the KeyBank CMBS Loan.
Citi Stockade Loan—2
On November 5, 2012, we, through six SPEs wholly-owned by our Operating Partnership, entered into a loan agreement with Citigroup Global Markets Realty Corp. with a total principal amount of approximately $19.4 million (the “Citi Stockade Loan—2”). The Citi Stockade Loan—2 has a term of ten years, maturing on November 6, 2022, and requires monthly payments of interest only for the first two years, with fixed monthly payments of principal and interest thereafter. The Citi Stockade Loan—2 bears interest at a fixed rate of 4.61%. We serve as a guarantor of the obligations under the Citi Stockade Loan—2. The Citi Stockade Loan—2 contains a number of other customary terms and covenants.
The following table presents the future principal payment requirements on outstanding secured debt as of December 31, 2012:
| | | | |
2013 | | $ | 19,682,080 | |
2014 | | | 66,776,490 | |
2015 | | | 30,579,553 | |
2016 | | | 46,876,579 | |
2017 | | | 33,981,671 | |
2018 and thereafter | | | 156,120,558 | |
| | | | |
Total payments | | | 354,016,931 | |
Unamortized fair value adjustment | | | (576,173 | ) |
| | | | |
Total | | $ | 353,440,758 | |
| | | | |
We record the amortization of debt discounts related to fair value adjustments to interest expense. The weighted average interest rate of the Company’s fixed rate debt as of December 31, 2012 was approximately 5.4%.
F-30
STRATEGIC STORAGE TRUST, INC. AND SUBSIDIARIES
NOTES TO CONSOLIDATED FINANCIAL STATEMENTS
December 31, 2012
Note 6. Derivative Instruments—Cash Flow Hedge of Interest Rate Risk
Our objectives in using interest rate derivatives are to add stability to interest expense and to manage our exposure to interest rate movements. To accomplish this objective, we use interest rate swaps as part of our interest rate risk management strategy. Interest rate swaps designated as cash flow hedges involve the receipt of variable amounts from a counterparty in exchange for us making fixed-rate payments over the life of the agreements without exchange of the underlying notional amount.
The effective portion of the change in the fair value of the derivative designated and that qualifies as a cash flow hedge is recorded in accumulated other comprehensive income (“AOCI”) and is subsequently reclassified into earnings in the period that the hedged forecasted transaction affects earnings. During 2012 and 2011, such derivatives were used to hedge the variable cash flows associated with existing variable-rate debt. The ineffective portion of the change in fair value of the derivatives is recognized directly in earnings, of which there were none during the years ended December 31, 2012 and 2011.
Amounts reported in AOCI related to derivatives will be reclassified to interest expense as interest payments are made on our variable-rate debt. Over the next 12 months, we estimate that an additional $313,000 will be reclassified as an increase to interest expense.
As of December 31, 2012, we had one derivative outstanding, which was an interest rate derivative that was designated as a cash flow hedge of interest rate risk:
| | | | | | | | |
Interest Rate Derivative | | Number of Instruments | | | Notional | |
Interest Rate Swaps | | | 1 | | | $ | 45,000,000 | |
The table below presents the fair value of the Company’s derivative financial instruments as well as their classification on the balance sheet as of December 31, 2012 and 2011:
| | | | | | | | | | | | |
| | | As of December 31, 2012 | | | As of December 31, 2011 | |
| | | Balance Sheet Location | | Fair Value | | | Balance Sheet Location | | Fair Value | |
Interest rate derivatives | | | | | | | | | | | | |
Assets | | Other assets | | $ | — | | | Other assets | | $ | — | |
| | | | | | | | | | | | |
Liabilities | | Accounts payable and accrued liabilities | | $ | 546,333 | | | Accounts payable and accrued liabilities | | $ | 311,630 | |
| | | | | | | | | | | | |
We have agreements with our derivative counterparty that contain a provision where if we either default or are capable of being declared in default, including default where repayment of the indebtedness has not been accelerated, on any of our indebtedness, then we could also be declared in default on our derivative obligations.
Certain of our agreements with our derivative counterparties contain provisions where if a specified event or condition (Credit Event Upon Merger) occurs that materially changes our creditworthiness in an adverse manner, we may be required to fully collateralize our obligations under the derivative instrument. As of December 31, 2012 we had not posted any collateral.
As of December 31, 2012, the fair value of derivatives in a net liability position, which includes accrued interest but excludes any adjustment for nonperformance risk, related to these agreements was approximately $575,000. If we had breached any of these provisions at December 31, 2012, we could have been required to settle our obligations under the agreements at their termination value of approximately $575,000.
F-31
STRATEGIC STORAGE TRUST, INC. AND SUBSIDIARIES
NOTES TO CONSOLIDATED FINANCIAL STATEMENTS
December 31, 2012
Note 7. Related Party Transactions
Fees to Affiliates
Our Advisory Agreement with our Advisor and dealer manager agreement (“Dealer Manager Agreement”) with our Dealer Manager entitle our Advisor and our Dealer Manager to specified fees upon the provision of certain services with regard to the Offering and investment of funds in real estate properties, among other services, as well as reimbursement for organizational and offering costs incurred by our Advisor on our behalf and reimbursement of certain costs and expenses incurred by our Advisor in providing services to us.
Organization and Offering Costs
Organization and offering costs of the Offering may be paid by our Advisor on our behalf and will be reimbursed to our Advisor from the proceeds of the Offering. Organization and offering costs consist of all expenses (other than sales commissions and the dealer manager fee) to be paid by us in connection with the Offering, including our legal, accounting, printing, mailing and filing fees , charges of our escrow holder and other accountable offering expenses, including, but not limited to, (i) amounts to reimburse our Advisor for all marketing related costs and expenses such as salaries and direct expenses of employees of our Advisor and its affiliates in connection with registering and marketing our shares; (ii) technology costs associated with the Offering; (iii) our costs of conducting our training and education meetings; (iv) our costs of attending retail seminars conducted by participating broker-dealers; and (v) payment or reimbursement of bona fide due diligence expenses. Our Advisor must reimburse us within 60 days after the end of the month which the Offering terminates to the extent we paid or reimbursed organization and offering costs (excluding sales commissions and dealer manager fees) in excess of 3.5% of the gross offering proceeds from the Primary Offering.
Advisory Agreement
We do not expect to have any employees. Our Advisor is primarily responsible for managing our business affairs and carrying out the directives of our board of directors. Our Advisor receives various fees and expenses under the terms of our Advisory Agreement. As discussed above, we are required under our Advisory Agreement to reimburse our Advisor for organization and offering costs; provided, however, our Advisor must reimburse us within 60 days after the end of the month in which the Offering terminates to the extent we paid or reimbursed organization and offering costs (excluding sales commissions and dealer manager fees) in excess of 3.5% of the gross offering proceeds from the Primary Offering.
Our Advisory Agreement also requires our Advisor to reimburse us to the extent that offering expenses, including sales commissions, dealer manager fees and organization and offering expenses, are in excess of 15% of gross proceeds from the Offering. Our Advisor receives acquisition fees equal to 2.5% of the contract purchase price of each property we acquire plus reimbursement of any acquisition expenses the Advisor incurs. Our Advisor also receives a monthly asset management fee equal to one-twelfth of 1.0% of the average of the aggregate asset value, as defined, of our assets, excluding those properties acquired through our mergers with REIT I and REIT II and the SS I, DST and Madison DST acquisitions; provided, however, that if the average of the aggregate asset value, as defined, of our assets exceeds $500 million, the monthly asset management fee shall be reduced to one-twelfth of 0.75% of the average of the aggregate asset value, as defined, of those assets exceeding $500 million unless our modified funds from operations (as defined in the Advisory Agreement), including payment of the fee, is greater than 100% of our distributions in any month (see footnote (2) in the following table for a discussion of the Advisor’s permanent waiver of certain asset management fees for the year ended December 31, 2012). The monthly asset management fees for our properties acquired through our mergers with REIT I and REIT II and the SS I, DST and Madison DST acquisitions are equal to 2.0% of the gross
F-32
STRATEGIC STORAGE TRUST, INC. AND SUBSIDIARIES
NOTES TO CONSOLIDATED FINANCIAL STATEMENTS
December 31, 2012
revenues from the properties and are paid to affiliates of our Sponsor. Under our Advisory Agreement, our Advisor receives fees in an amount equal to 3.0% of the contract sale price for each property we sell as long as our Advisor provides substantial assistance in connection with the sale. The total real estate commissions paid (including disposition fee paid to our Advisor) may not exceed the lesser of a competitive real estate commission or an amount equal to 6.0% of the contract sale price of the property and are subordinated to receipt of our stockholders of a 6% cumulative, non-compounded, annual return on such stockholders’ invested capital. Our Advisor may also be entitled to various subordinated fees if we (1) list our shares of common stock on a national exchange, (2) terminate our Advisory Agreement, or (3) liquidate our portfolio.
The advisors of REIT I and REIT II are entitled to various fees related to their properties if we (1) dispose of a property, (2) liquidate our portfolio, or (3) terminate their advisory agreement.
Our Advisory Agreement provides for reimbursement of our Advisor’s direct and indirect costs of providing administrative and management services to us (see footnote (1) in the following table for a discussion of the Advisor’s permanent waiver of certain reimbursements for the years ended December 31, 2012 and 2011). Beginning October 1, 2009 (four fiscal quarters after the acquisition of our first real estate asset), our Advisor must pay or reimburse us the amount by which our aggregate annual operating expenses, as defined, exceed the greater of 2% of our average invested assets or 25% of our net income, as defined, unless a majority of our independent directors determine that such excess expenses were justified based on unusual and non-recurring factors. For any fiscal quarter for which total operating expenses for the 12 months then ended exceed the limitation, we will disclose this fact in our next quarterly report or within 60 days of the end of that quarter and send a written disclosure of this fact to our stockholders. In each case the disclosure will include an explanation of the factors that the independent directors considered in arriving at the conclusion that the excess expenses were justified. For the 12 months ended December 31, 2012, our aggregate annual operating expenses, as defined, did not exceed the thresholds described above.
On September 27, 2012, we entered into a Second Amended and Restated Advisory Agreement (the “Amended Advisory Agreement”) with our Advisor. The material terms of the Advisory Agreement were not changed. However, certain provisions were added, the most significant of which was a provision restricting us, during the term of the Amended Advisory Agreement and for a period of two years after the termination of the Amended Advisory Agreement, from soliciting or hiring any employee of, or person performing services on behalf of, our Advisor.
Dealer Manager Agreement
Our Dealer Manager receives a sales commission of up to 7.0% of gross proceeds from sales in the Primary Offering and a dealer manager fee equal to up to 3.0% of gross proceeds from sales in the Primary Offering under the terms of our Dealer Manager Agreement. Our Dealer Manager has entered into participating dealer agreements with certain other broker-dealers which authorizes them to sell our shares. Upon sale of our shares by such broker-dealers, our Dealer Manager will re-allow all of the sales commissions paid in connection with sales made by these broker-dealers. Our Dealer Manager may also re-allow to these broker-dealers a portion of the 3.0% dealer manager fee as marketing fees, reimbursement of certain costs and expenses of attending training and education meetings sponsored by our Dealer Manager, payment of attendance fees required for employees of our Dealer Manager or other affiliates to attend retail seminars and public seminars sponsored by these broker-dealers, or to defray other distribution related expenses. Our Dealer Manager also receives reimbursement of bona fide due diligence expenses; however, to the extent these due diligence expenses cannot be justified, any excess over actual due diligence expenses will be considered underwriting compensation subject to a 10% FINRA limitation and, when aggregated with all other non-accountable expenses may not exceed 3% of gross offering proceeds from sales in the Primary Offering.
F-33
STRATEGIC STORAGE TRUST, INC. AND SUBSIDIARIES
NOTES TO CONSOLIDATED FINANCIAL STATEMENTS
December 31, 2012
Our dealer manager agreement with our prior dealer manager for our Initial Offering was substantially equivalent to the terms described above.
Affiliated Dealer Manager
Our president owns a 15% beneficial non-voting equity interest in our Dealer Manager.
Property Management Agreement
Our Property Manager receives a fee for its services in managing our properties, except for those properties acquired in the USA Self Storage I, DST acquisition, generally equal to 6% of the gross revenues from the properties plus reimbursement of the direct costs of managing the properties under our property management agreement. The properties acquired in the USA Self Storage I, DST acquisition are managed by an affiliate of our Sponsor. As a condition of the REIT II merger transaction, the monthly property management fees for properties acquired from REIT II have been waived until the FFO of the properties acquired from REIT II, as defined in the merger agreement relating to the REIT II merger transaction, reaches $0.70 per share. In the event that our Property Manager assists with the development or redevelopment of a property, we may pay a separate market-based fee for such services.
On September 27, 2012, our board of directors approved revisions to our property management agreements that we expect to enter into in the future as we acquire additional properties and as our current property management agreements are renewed. These revisions include increasing the term to three years, with automatic three-year extensions; revising the property owner’s obligation to reimburse the Property Manager for certain expenses; the addition of a construction management fee (as defined); the addition of a tenant insurance administrative fee; adding a nonsolicitation provision; and adding a provision regarding the Property Manager’s use of trademarks and other intellectual property owned by Strategic Storage Holdings, LLC.
Pursuant to the terms of the agreements described above, the following summarizes the related party costs incurred for the years ended December 31, 2012, 2011 and 2010:
| | | | | | | | | | | | |
| | | Year Ended
December 31, 2012 | | | Year Ended
December 31, 2011 | | | Year Ended
December 31, 2010 | |
Expensed | | | | | | | | | | | | |
Reimbursement of operating expenses (including organizational costs)(1) | | $ | 33,476 | | | $ | 330,993 | | | $ | 850,691 | |
Asset management fees(2) | | | 4,521,867 | | | | 3,019,429 | | | | 1,400,962 | |
Property management fees(3) | | | 3,732,149 | | | | 2,683,492 | | | | 1,266,395 | |
Acquisition expenses | | | 2,415,200 | | | | 5,706,838 | | | | 3,206,832 | |
Capitalized | | | | | | | | | | | | |
Acquisition expenses(4) | | | — | | | | — | | | | 69,016 | |
Additional Paid-in Capital | | | | | | | | | | | | |
Selling commissions | | | 7,402,084 | | | | 5,798,197 | | | | 6,681,016 | |
Dealer Manager fee | | | 3,172,322 | | | | 2,484,942 | | | | 2,863,292 | |
Reimbursement of offering costs | | | 487,235 | | | | 555,839 | | | | 435,712 | |
| | | | | | | | | | | | |
Total | | $ | 21,764,333 | | | $ | 20,579,730 | | | $ | 16,773,916 | |
| | | | | | | | | | | | |
F-34
STRATEGIC STORAGE TRUST, INC. AND SUBSIDIARIES
NOTES TO CONSOLIDATED FINANCIAL STATEMENTS
December 31, 2012
| (1)�� | During the years ended December 31, 2012 and 2011, our Advisor permanently waived certain reimbursable indirect costs, primarily payroll and related overhead costs, related to administrative and management services, totaling approximately $960,000 and $740,000, respectively. Such amounts were waived permanently and accordingly, will not be paid to our Advisor. |
| (2) | During the year ended December 31, 2012, our Advisor permanently waived asset management fees related to the Stockade Portfolio and our Dufferin property totaling approximately $186,000 and $37,000, respectively. Such amounts were waived permanently and accordingly, will not be paid to our Advisor. |
| (3) | During the years ended December 31, 2012, 2011 and 2010, property management fees include approximately $100,000, $60,000 and $11,000, respectively, of fees paid to the sub-property manager of our Canadian properties. |
| (4) | Acquisition fees paid to our Advisor in connection with the additional investments in unconsolidated joint ventures. |
As of December 31, 2012 and 2011, we had amounts due to affiliates totaling $2,282,344 and $2,065,615, respectively.
Tenant Reinsurance Program
Beginning in 2011, affiliates of our Sponsor, including our president, are participating in a tenant reinsurance program whereby tenants of our self storage facilities can purchase insurance to cover damage or destruction to their property while stored at our facilities. Such affiliates have invested in a Cayman Islands company (the “Reinsurance Company”) that will insure a portion of the insurance required by the program insurer to cover the risks of loss at participating facilities in the program. The program insurer provides fees (approximately 50% of the tenant premium paid) to us as owner of the facilities. The Reinsurance Company may be required to fund additional capital or entitled to receive distributions of profits depending on actual losses incurred under the program. For the years ended December 31, 2012 and 2011, we recorded revenue of approximately $1.3 million and $0.4 million, respectively, in connection with this tenant reinsurance program.
Note 8. Commitments and Contingencies
Distribution Reinvestment Plan
We have adopted a distribution reinvestment plan that allows our stockholders to have distributions otherwise distributable to them invested in additional shares of our common stock. The plan became effective on the effective date of our initial public offering. The purchase price per share was the higher of $9.50 per share or 95% of the fair market value of a share of our common stock. Effective March 28, 2012, the purchase price per share under the distribution reinvestment plan was changed to 95% of the offering price of our shares. No sales commission or dealer manager fee will be paid on shares sold through the distribution reinvestment plan. We may amend or terminate the distribution reinvestment plan for any reason at any time upon 10 days’ prior written notice to stockholders. As of December 31, 2012, we have sold approximately 3 million shares through our distribution reinvestment plan.
Share Redemption Program
We have adopted a share redemption program that may enable stockholders to sell their shares to us in limited circumstances. As long as our common stock is not listed on a national securities exchange or over-the-counter market, our stockholders who have held their stock for at least one year may be able to have all or any
F-35
STRATEGIC STORAGE TRUST, INC. AND SUBSIDIARIES
NOTES TO CONSOLIDATED FINANCIAL STATEMENTS
December 31, 2012
portion of their shares of stock redeemed by us. We may redeem the shares of stock presented for redemption for cash to the extent that we have sufficient funds available to fund such redemption.
Our board of directors may amend, suspend or terminate the share redemption program with 30 days’ notice to our stockholders. We may provide this notice by including such information in a Current Report on Form 8-K or in our annual or quarterly reports, all publicly filed with the SEC, or by a separate mailing to our stockholders. Our share redemption program was amended in October 2011 and March 2012. The complete terms of our share redemption program, as so revised, are described in detail in our prospectus, as supplemented. You may also see our Form 8-K filed with the SEC on February 24, 2012.
The amount that we may pay to redeem stock for redemptions is the redemption price set forth in the following table which is based upon the number of years the stock is held:
| | |
| Number Years Held | | Redemption Price |
Less than 1 | | No Redemption Allowed |
1 or more but less than 2 | | 90.0% of Redemption Amount |
2 or more but less than 3 | | 92.5% of Redemption Amount |
3 or more but less than 4 | | 95.0% of Redemption Amount |
4 or more | | 100.0% of Redemption Amount |
At any time we are engaged in an offering of shares, the Redemption Amount for shares purchased under our share redemption program will always be equal to or lower than the applicable per share offering price. As long as we are engaged in an offering, the Redemption Amount shall be the lesser of the amount the stockholder paid for their shares or the price per share in the current offering. If we are no longer engaged in an offering, the per share Redemption Amount will be determined by our board of directors. Our board will announce any redemption price adjustment and the time period of its effectiveness as a part of its regular communications with our stockholders. At any time the redemption price during an offering is determined by any method other than the offering price, if we have sold property and have made one or more special distributions to our stockholders of all or a portion of the net proceeds from such sales, the per share redemption price will be reduced by the net sale proceeds per share distributed to investors prior to the redemption date as a result of the sale of such property in the special distribution. Our board will, in its sole discretion, determine which distributions, if any, constitute a special distribution. While our board does not have specific criteria for determining a special distribution, we expect that a special distribution will only occur upon the sale of a property and the subsequent distribution of the net sale proceeds.
There are several limitations on our ability to redeem shares under the share redemption program including, but not limited to:
| | • | | Unless the shares are being redeemed in connection with a stockholder’s death, “qualifying disability” (as defined under the share redemption program) or bankruptcy, we may not redeem shares until the stockholder has held his or her shares for one year. |
| | • | | During any calendar year, we will not redeem in excess of 5% of the weighted-average number of shares outstanding during the prior calendar year. |
| | • | | The cash available for redemption is limited to the proceeds from the sale of shares pursuant to our distribution reinvestment plan. |
| | • | | We have no obligation to redeem shares if the redemption would violate the restrictions on distributions under Maryland law, which prohibits distributions that would cause a corporation to fail to meet statutory tests of solvency. |
F-36
STRATEGIC STORAGE TRUST, INC. AND SUBSIDIARIES
NOTES TO CONSOLIDATED FINANCIAL STATEMENTS
December 31, 2012
Redeemable Common Stock—State of Washington
In the third quarter of 2012, we discovered that, due to a clerical error, we exceeded our registration amount in the State of Washington during a three month period in 2012. Upon this discovery, we immediately took action to increase our registration amount; however, stockholders who purchased shares in excess of the amount then-registered in the State of Washington may be entitled to a rescission of their respective investments (totaling approximately $3.9 million) in our shares, as the shares they originally purchased were unregistered. If any of those stockholders seek a rescission, we will be required to redeem their shares. Such shares were subsequently registered and we do not expect a significant amount of requests for rescission.
Operating Partnership Redemption Rights
The limited partners of our Operating Partnership have the right to cause our Operating Partnership to redeem their limited partnership units for cash equal to the value of an equivalent number of our shares, or, at our option, we may purchase their limited partnership units by issuing one share of our common stock for each limited partnership unit redeemed. The holders of the Class D Units have agreed to modified exchange rights that prevent them from exercising their exchange rights: (1) until the earlier of (a) a listing of our shares or (b) our merger into another entity whereby our stockholders receive securities listed on a national securities exchange; or (2) until FFO of the properties contributed by the holders of the Class D Units reaches $0.70 per share, based on our fully-loaded cost of equity. These rights may not be exercised under certain circumstances that could cause us to lose our REIT election. Furthermore, limited partners may exercise their redemption rights only after their limited partnership units have been outstanding for one year. Our Advisor is prohibited from exchanging or otherwise transferring its limited partnership units so long as our Sponsor is acting as our sponsor.
Ground Lease Commitment—SF Bay Area—San Lorenzo
In connection with the acquisition of our SF Bay Area – San Lorenzo property, we assumed a land lease, with a remaining term of approximately 22 years as of December 31, 2012 and recorded rent expense of approximately $147,000 for the year ended December 31, 2012. The lease has minimum lease payments of approximately $132,000, $133,000, $139,000, $139,000 and $139,000 for the years ending 2013, 2014, 2015, 2016 and 2017.
Other Contingencies
We have been involved in routine litigation and threatened litigation arising in the ordinary course of business. While the outcome of any litigation is inherently unpredictable, we believe the likelihood of these pending legal matters having a material adverse effect on our financial condition or results of operations is remote.
Note 9. Declaration of Distributions
On December 13, 2012, our board of directors declared a distribution rate for the first quarter of 2013 of $0.001917808 per day per share on the outstanding shares of common stock payable to stockholders of record of such shares as shown on our books at the close of business on each day during the period, commencing on January 1, 2013 and continuing on each day thereafter through and including March 31, 2013.
Note 10. Pro Forma Financial Information (Unaudited)
The table set forth below summarizes on an unaudited pro forma basis the combined results of operations of the Company for the years ended December 31, 2012 and 2011 as if the Company’s acquisitions discussed in Notes 3 and 4 were completed as of January 1, 2012 and 2011. This pro forma information does not purport to
F-37
STRATEGIC STORAGE TRUST, INC. AND SUBSIDIARIES
NOTES TO CONSOLIDATED FINANCIAL STATEMENTS
December 31, 2012
represent what the actual results of operations of the Company would have been for the periods indicated, nor do they purport to predict the results of operations for future periods.
The following table summarizes, on a pro forma basis, our consolidated results of operations for the years ended December 31, 2012 and 2011 based on the assumptions described above:
| | | | | | | | |
| | | Year Ended | |
| | | December 31, 2012 | | | December 31, 2011 | |
Pro forma revenue | | $ | 73,753,403 | | | $ | 70,052,375 | |
Pro forma operating expenses | | $ | 72,773,108 | | | $ | 85,052,121 | |
Pro forma net loss attributable to the Company | | $ | (20,622,487 | ) | | $ | (37,136,667 | ) |
Pro forma net loss per common share, basic and diluted | | $ | (0.48 | ) | | $ | (0.89 | ) |
Weighted average number of common shares outstanding, basic and diluted | | | 42,723,209 | | | | 41,560,769 | |
Note 11. Selected Quarterly Data (Unaudited)
The following is a summary of quarterly financial information for the years ended December, 31, 2012 and 2011, respectively:
| | | | | | | | | | | | | | | | |
| | | Three months ended | |
| | | March 31, 2012 | | | June 30, 2012 | | | September 30, 2012 | | | December 31, 2012 | |
Total revenues | | $ | 15,351,917 | | | $ | 15,705,274 | | | $ | 17,098,173 | | | $ | 18,455,140 | |
Total operating expenses | | $ | 15,455,345 | | | $ | 16,136,742 | | | $ | 17,000,260 | | | $ | 17,351,457 | |
Net loss | | $ | (5,451,145 | ) | | $ | (5,091,133 | ) | | $ | (4,620,823 | ) | | $ | (3,852,041 | ) |
Net loss attributable to the Company | | $ | (5,432,094 | ) | | $ | (5,087,074 | ) | | $ | (4,610,650 | ) | | $ | (3,843,894 | ) |
Net loss per share-basic and diluted | | $ | (0.15 | ) | | $ | (0.12 | ) | | $ | (0.11 | ) | | $ | (0.08 | ) |
| |
| | | Three months ended | |
| | | March 31, 2011 | | | June 30, 2011 | | | September 30, 2011 | | | December 31, 2011 | |
Total revenues | | $ | 9,804,613 | | | $ | 11,371,860 | | | $ | 13,930,807 | | | $ | 14,288,798 | |
Total operating expenses | | $ | 12,661,013 | | | $ | 13,895,617 | | | $ | 15,657,652 | | | $ | 16,397,585 | |
Net loss | | $ | (5,341,819 | ) | | $ | (5,399,076 | ) | | $ | (5,292,070 | ) | | $ | (5,801,272 | ) |
Net loss attributable to the Company | | $ | (5,216,063 | ) | | $ | (5,248,767 | ) | | $ | (5,146,419 | ) | | $ | (5,746,180 | ) |
Net loss per share-basic and diluted | | $ | (0.19 | ) | | $ | (0.17 | ) | | $ | (0.16 | ) | | $ | (0.17 | ) |
Note 12. Subsequent Events
Offering Status
As of March 21, 2013, in connection with our Offering we have issued approximately 44.1 million shares of our common stock for gross proceeds of approximately $441 million.
F-38
STRATEGIC STORAGE TRUST, INC. AND SUBSIDIARIES
NOTES TO CONSOLIDATED FINANCIAL STATEMENTS
December 31, 2012
Declaration of Dividends
On March 20, 2013, our board of directors declared a distribution rate for the second quarter of 2013 of $0.001917808 per day per share on the outstanding shares of common stock payable to stockholders of record of such shares as shown on our books at the close of business on each day during the period, commencing on April 1, 2013 and continuing on each day thereafter through and including June 30, 2013.
Financing
Citi Morgan Hill Loan
On March 5, 2013, we entered into a loan agreement with Citigroup Global Markets Realty Corp. (the “Citi Morgan Hill Loan”) totaling $3 million. The Citi Morgan Hill Loan has a term of ten years, maturing on March 5, 2023, and requires monthly payments of interest only for the first five years, with fixed monthly payments of principal and interest thereafter. The Citi Morgan Hill Loan bears interest at a fixed rate of 4.08%. The proceeds from the loan were used to pay off in full the previously outstanding mortgage on the SF Bay Area—Morgan Hill property.
Potential Acquisition
On March 25, 2013, we entered into a purchase and sale agreement for a facility located in Charleston, South Carolina. The purchase price for the facility is approximately $6.6 million. We expect to close this acquisition by the end of the second quarter of 2013. There can be no assurance that we will complete such acquisition. In some circumstances, if we fail to complete such acquisition, we may forfeit some earnest money as a result.
F-39
STRATEGIC STORAGE TRUST, INC. AND SUBSIDIARIES
SCHEDULE III
REAL ESTATE AND ACCUMULATED DEPRECIATION
December 31, 2012
| | | | | | | | | | | | | | | | | | | | | | | | | | | | | | | | | | | | | | | | | | | | | | |
| | | | | | | | | Initial Cost to Company | | | | | | Gross Carrying Amount at December 31, 2012 | | | | | | |
| Description | | ST | | | Encumbrance | | | Land | | | Building and
Improvements | | | Total | | | Cost Capitalized Subsequent to Acquisition | | | Land | | | Building and Improvements | | | Total | | | Accumulated Depreciation | | | Date of Construction | | Date Acquired | |
Biloxi | | | MS | | | $ | 1,172,887 | | | $ | 518,701 | | | $ | 2,847,676 | | | $ | 3,366,377 | | | $ | 83,702 | | | $ | 518,701 | | | $ | 2,931,378 | | | $ | 3,450,079 | | | $ | (559,451 | ) | | 1980/1984/1992 | | | 9/25/2008 | |
Gulf Breeze | | | FL | | | | 3,796,244 | | | | 1,943,144 | | | | 5,043,905 | | | | 6,987,049 | | | | 94,988 | | | | 1,943,144 | | | | 5,138,893 | | | | 7,082,037 | | | | (840,171 | ) | | 1978/1982/2004 | | | 9/25/2008 | |
Manassas | | | VA | | | | 1,500,750 | | | | 1,050,519 | | | | 3,741,305 | | | | 4,791,824 | | | | 90,104 | | | | 1,050,519 | | | | 3,831,409 | | | | 4,881,928 | | | | (547,556 | ) | | 1996/2000 | | | 12/19/2008 | |
Walton | | | KY | | | | 2,300,000 | | | | 650,000 | | | | 2,634,959 | | | | 3,284,959 | | | | 152,640 | | | | 650,000 | | | | 2,787,599 | | | | 3,437,599 | | | | (430,884 | ) | | 1991 | | | 2/12/2009 | |
Crescent Springs | | | KY | | | | 1,960,000 | | | | 280,000 | | | | 1,637,802 | | | | 1,917,802 | | | | 106,203 | | | | 280,000 | | | | 1,744,005 | | | | 2,024,005 | | | | (249,178 | ) | | 1999/2003 | | | 2/12/2009 | |
Florence | | | KY | | | | 3,100,000 | | | | 840,000 | | | | 2,691,629 | | | | 3,531,629 | | | | 65,885 | | | | 840,000 | | | | 2,757,514 | | | | 3,597,514 | | | | (431,563 | ) | | 1996 | | | 2/12/2009 | |
Alpharetta | | | GA | | | | 2,628,244 | | | | 1,060,107 | | | | 3,752,629 | | | | 4,812,736 | | | | 125,526 | | | | 1,060,107 | | | | 3,878,155 | | | | 4,938,262 | | | | (476,481 | ) | | 2003 | | | 6/1/2009 | |
Marietta | | | GA | | | | 2,178,509 | | | | 1,060,000 | | | | 2,705,806 | | | | 3,765,806 | | | | 58,951 | | | | 1,060,000 | | | | 2,764,757 | | | | 3,824,757 | | | | (321,213 | ) | | 2006 | | | 6/1/2009 | |
Erlanger | | | KY | | | | 1,549,161 | | | | 565,790 | | | | 2,463,269 | | | | 3,029,059 | | | | 192,569 | | | | 565,790 | | | | 2,655,838 | | | | 3,221,628 | | | | (381,771 | ) | | 1987 | | | 7/17/2009 | |
Florence II | | | KY | | | | 3,225,439 | | | | 871,200 | | | | 4,877,025 | | | | 5,748,225 | | | | 336,694 | | | | 871,200 | | | | 5,213,719 | | | | 6,084,919 | | | | (664,797 | ) | | 1982/1995 | | | 7/17/2009 | |
Jersey City | | | NJ | | | | 5,864,434 | | | | 3,625,048 | | | | 6,999,952 | | | | 10,625,000 | | | | 477,044 | | | | 3,625,048 | | | | 7,476,996 | | | | 11,102,044 | | | | (799,593 | ) | | 1985 | | | 8/21/2009 | |
Montgomery | | | AL | | | | 2,768,704 | | | | 1,197,900 | | | | 2,389,873 | | | | 3,587,773 | | | | 65,293 | | | | 1,197,900 | | | | 2,455,166 | | | | 3,653,066 | | | | (316,147 | ) | | 1995/2004 | | | 9/3/2009 | |
Phoenix | | | AZ | | | | — | | | | 680,620 | | | | 1,259,380 | | | | 1,940,000 | | | | 455,315 | | | | 680,620 | | | | 1,714,695 | | | | 2,395,315 | | | | (285,988 | ) | | 1974 | | | 9/4/2009 | |
Seabrook | | | TX | | | | 4,422,199 | | | | 1,520,000 | | | | 3,860,000 | | | | 5,380,000 | | | | 61,345 | | | | 1,520,000 | | | | 3,921,345 | | | | 5,441,345 | | | | (498,976 | ) | | 2001-2003 | | | 9/24/2009 | |
Greenville | | | SC | | | | 2,209,003 | | | | 530,000 | | | | 2,570,000 | | | | 3,100,000 | | | | 148,176 | | | | 530,000 | | | | 2,718,176 | | | | 3,248,176 | | | | (279,884 | ) | | 1948/1995 | | | 9/24/2009 | |
Kemah | | | TX | | | | 8,778,064 | | | | 2,510,000 | | | | 8,970,000 | | | | 11,480,000 | | | | 80,904 | | | | 2,510,000 | | | | 9,050,904 | | | | 11,560,904 | | | | (1,180,741 | ) | | 1985/2005/
1999/2002 | | | 9/24/2009 | |
Tallahassee | | | FL | | | | 7,455,825 | | | | 1,230,000 | | | | 6,310,000 | | | | 7,540,000 | | | | 299,960 | | | | 1,230,000 | | | | 6,609,960 | | | | 7,839,960 | | | | (724,407 | ) | | 1979-1987 | | | 9/24/2009 | |
Memphis | | | TN | | | | 2,432,410 | | | | 790,000 | | | | 2,560,000 | | | | 3,350,000 | | | | 219,130 | | | | 790,000 | | | | 2,779,130 | | | | 3,569,130 | | | | (430,226 | ) | | 1987/1994 | | | 9/24/2009 | |
Houston | | | TX | | | | 1,960,422 | | | | 420,000 | | | | 1,650,000 | | | | 2,070,000 | | | | 170,673 | | | | 420,000 | | | | 1,820,673 | | | | 2,240,673 | | | | (293,306 | ) | | 1984/2005 | | | 9/24/2009 | |
Las Vegas | | | NV | | | | 1,476,537 | | | | 1,460,000 | | | | 4,220,000 | | | | 5,680,000 | | | | 33,381 | | | | 1,460,000 | | | | 4,253,381 | | | | 5,713,381 | | | | (458,669 | ) | | 2006 | | | 9/24/2009 | |
Las Vegas II | | | NV | | | | 1,485,736 | | | | 1,050,000 | | | | 970,000 | | | | 2,020,000 | | | | 35,472 | | | | 1,050,000 | | | | 1,005,472 | | | | 2,055,472 | | | | (126,580 | ) | | 1998 | | | 9/24/2009 | |
Pearland | | | TX | | | | 3,404,082 | | | | 1,060,000 | | | | 4,540,000 | | | | 5,600,000 | | | | 37,731 | | | | 1,060,000 | | | | 4,577,731 | | | | 5,637,731 | | | | (606,444 | ) | | 2004/2005 | | | 9/24/2009 | |
Daphne | | | AL | | | | 1,489,371 | | | | 1,530,000 | | | | 2,510,000 | | | | 4,040,000 | | | | 91,676 | | | | 1,530,000 | | | | 2,601,676 | | | | 4,131,676 | | | | (274,714 | ) | | 2000 | | | 9/24/2009 | |
Lake Forest | | | CA | | | | 17,977,679 | | | | 15,840,000 | | | | 8,860,000 | | | | 24,700,000 | | | | 106,471 | | | | 15,840,000 | | | | 8,966,471 | | | | 24,806,471 | | | | (1,500,013 | ) | | 2003 | | | 9/24/2009 | |
San Francisco | | | CA | | | | 10,149,024 | | | | 9,280,000 | | | | 8,200,000 | | | | 17,480,000 | | | | 156,018 | | | | 9,284,076 | | | | 8,351,942 | | | | 17,636,018 | | | | (806,226 | ) | | 1909/2000 | | | 9/24/2009 | |
Pittsburgh | | | PA | | | | 1,307,105 | | | | 680,189 | | | | 1,379,025 | | | | 2,059,214 | | | | 36,778 | | | | 680,189 | | | | 1,415,803 | | | | 2,095,992 | | | | (182,252 | ) | | 1990 | | | 12/11/2009 | |
West Mifflin | | | PA | | | | 1,859,026 | | | | 868,872 | | | | 2,114,578 | | | | 2,983,450 | | | | 221,545 | | | | 868,872 | | | | 2,336,123 | | | | 3,204,995 | | | | (226,593 | ) | | 1983 | | | 12/11/2009 | |
Fort Lee | | | NJ | | | | 8,423,565 | | | | 2,000,000 | | | | 13,630,000 | | | | 15,630,000 | | | | 157,797 | | | | 2,000,000 | | | | 13,787,797 | | | | 15,787,797 | | | | (1,210,197 | ) | | 2000 | | | 2/24/2010 | |
Weston | | | FL | | | | 3,195,146 | | | | 1,500,000 | | | | 4,330,000 | | | | 5,830,000 | | | | 134,699 | | | | 1,500,000 | | | | 4,464,699 | | | | 5,964,699 | | | | (407,161 | ) | | 2005 | | | 2/24/2010 | |
Gulf Breeze II | | | FL | | | | — | | | | 270,000 | | | | 895,000 | | | | 1,165,000 | | | | 37,844 | | | | 270,000 | | | | 932,844 | | | | 1,202,844 | | | | (123,725 | ) | | 2004/2005 | | | 3/10/2010 | |
Mesa | | | AZ | | | | 2,997,096 | | | | 600,000 | | | | 2,633,728 | | | | 3,233,728 | | | | 35,302 | | | | 600,000 | | | | 2,669,030 | | | | 3,269,030 | | | | (269,306 | ) | | 2002 | | | 4/9/2010 | |
Oakland Park | | | FL | | | | 7,479,545 | | | | 4,530,650 | | | | 8,729,350 | | | | 13,260,000 | | | | 229,225 | | | | 4,530,650 | | | | 8,958,575 | | | | 13,489,225 | | | | (759,155 | ) | | 1987 | | | 4/16/2010 | |
Phoenix II | | | AZ | | | | 822,988 | | | | 1,020,000 | | | | 515,000 | | | | 1,535,000 | | | | 417,564 | | | | 1,020,000 | | | | 932,564 | | | | 1,952,564 | | | | (145,697 | ) | | 1974 | | | 5/16/2010 | |
Tempe | | | AZ | | | | 968,226 | | | | 900,000 | | | | 740,000 | | | | 1,640,000 | | | | 375,066 | | | | 900,000 | | | | 1,115,066 | | | | 2,015,066 | | | | (147,530 | ) | | 1973 | | | 5/16/2010 | |
Riverdale | | | NJ | | | | 4,677,280 | | | | 1,050,000 | | | | 4,794,357 | | | | 5,844,357 | | | | 128,273 | | | | 1,050,000 | | | | 4,922,630 | | | | 5,972,630 | | | | (393,015 | ) | | 2007 | | | 5/14/2010 | |
S-1
| | | | | | | | | | | | | | | | | | | | | | | | | | | | | | | | | | | | | | | | | | | | | | |
| | | | | | | | | Initial Cost to Company | | | | | | Gross Carrying Amount at December 31, 2012 | | | | | | |
| Description | | ST | | | Encumbrance | | | Land | | | Building and
Improvements | | | Total | | | Cost Capitalized Subsequent to Acquisition | | | Land | | | Building and Improvements | | | Total | | | Accumulated Depreciation | | | Date of Construction | | Date Acquired | |
Davie | | | FL | | | | 2,646,240 | | | | 2,840,000 | | | | 2,040,000 | | | | 4,880,000 | | | | 769,209 | | | | 2,840,000 | | | | 2,809,209 | | | | 5,649,209 | | | | (286,148 | ) | | 1988 | | | 7/14/2010 | |
95thSt. | | | IL | | | | 3,078,828 | | | | 1,600,000 | | | | 4,230,000 | | | | 5,830,000 | | | | 71,765 | | | | 1,600,000 | | | | 4,301,765 | | | | 5,901,765 | | | | (353,243 | ) | | 2002 | | | 10/22/2010 | |
Western | | | IL | | | | 586,443 | | | | 900,000 | | | | 400,000 | | | | 1,300,000 | | | | 139,234 | | | | 900,000 | | | | 539,234 | | | | 1,439,234 | | | | (58,317 | ) | | 2004 | | | 10/22/2010 | |
Ogden | | | IL | | | | 2,150,293 | | | | 1,703,370 | | | | 1,766,630 | | | | 3,470,000 | | | | 296,297 | | | | 1,703,370 | | | | 2,062,927 | | | | 3,766,297 | | | | (209,198 | ) | | 2002 | | | 10/26/2010 | |
Las Vegas III | | | NV | | | | 1,800,000 | | | | 1,130,000 | | | | 2,985,000 | | | | 4,115,000 | | | | 81,397 | | | | 1,130,000 | | | | 3,066,397 | | | | 4,196,397 | | | | (211,691 | ) | | 2005 | | | 10/29/2010 | |
Roosevelt | | | IL | | | | 684,184 | | | | 1,207,135 | | | | 502,865 | | | | 1,710,000 | | | | 97,577 | | | | 1,207,135 | | | | 600,442 | | | | 1,807,577 | | | | (65,461 | ) | | 2004 | | | 11/16/2010 | |
Dufferin(1) | | | | | | | 6,812,855 | | | | 4,576,772 | | | | 9,120,472 | | | | 13,697,244 | | | | 307,541 | (2) | | | 4,664,415 | | | | 9,340,370 | | | | 14,004,785 | | | | (602,644 | ) | | 1965/2008 | | | 11/23/2010 | |
La Cienega | | | CA | | | | 7,950,000 | | | | 3,260,000 | | | | 8,990,000 | | | | 12,250,000 | | | | 82,863 | | | | 3,260,000 | | | | 9,072,863 | | | | 12,332,863 | | | | (554,931 | ) | | 2004 | | | 12/16/2010 | |
Long Beach | | | CA | | | | 6,637,926 | | | | 4,810,000 | | | | 7,040,000 | | | | 11,850,000 | | | | 90,954 | | | | 4,810,000 | | | | 7,130,954 | | | | 11,940,954 | | | | (479,056 | ) | | 1999 | | | 12/16/2010 | |
Las Vegas IV | | | NV | | | | 3,420,920 | | | | 1,470,000 | | | | 4,835,000 | | | | 6,305,000 | | | | 271,146 | | | | 1,470,000 | | | | 5,106,146 | | | | 6,576,146 | | | | (324,900 | ) | | 1996 | | | 12/21/2010 | |
Rancho | | | NV | | | | 2,365,000 | | | | 990,000 | | | | 2,830,000 | | | | 3,820,000 | | | | 85,657 | | | | 990,000 | | | | 2,915,657 | | | | 3,905,657 | | | | (206,182 | ) | | 2006 | | | 12/29/2010 | |
Concord | | | NC | | | | 2,199,620 | | | | 1,250,000 | | | | 1,559,179 | | | | 2,809,179 | | | | 95,709 | | | | 1,250,000 | | | | 1,654,888 | | | | 2,904,888 | | | | (148,113 | ) | | 1996/2001 | | | 2/15/2011 | |
Hickory | | | NC | | | | 2,390,589 | | | | 660,000 | | | | 2,408,239 | | | | 3,068,239 | | | | 52,304 | | | | 660,000 | | | | 2,460,543 | | | | 3,120,543 | | | | (175,948 | ) | | 1997 | | | 2/15/2011 | |
Morganton | | | NC | | | | 2,058,189 | | | | 620,000 | | | | 1,859,875 | | | | 2,479,875 | | | | 66,631 | | | | 620,000 | | | | 1,926,506 | | | | 2,546,506 | | | | (164,432 | ) | | 2001 | | | 2/15/2011 | |
El Paso II | | | TX | | | | 2,413,886 | | | | 1,110,000 | | | | 2,918,337 | | | | 4,028,337 | | | | 89,817 | | | | 1,110,000 | | | | 3,008,154 | | | | 4,118,154 | | | | (232,512 | ) | | 2001/2003 | | | 2/15/2011 | |
El Paso III | | | TX | | | | 3,206,184 | | | | 1,330,000 | | | | 4,254,356 | | | | 5,584,356 | | | | 108,708 | | | | 1,330,000 | | | | 4,363,064 | | | | 5,693,064 | | | | (315,759 | ) | | 1985/2000 | | | 2/15/2011 | |
El Paso IV | | | TX | | | | 1,943,740 | | | | 790,000 | | | | 2,604,766 | | | | 3,394,766 | | | | 59,644 | | | | 790,000 | | | | 2,664,410 | | | | 3,454,410 | | | | (198,353 | ) | | 1999/2004 | | | 2/15/2011 | |
El Paso V | | | TX | | | | 2,081,109 | | | | 930,000 | | | | 2,605,809 | | | | 3,535,809 | | | | 59,902 | | | | 930,000 | | | | 2,665,711 | | | | 3,595,711 | | | | (195,451 | ) | | 2004 | | | 2/15/2011 | |
Dallas | | | TX | | | | 2,398,036 | | | | 520,000 | | | | 3,588,217 | | | | 4,108,217 | | | | 64,800 | | | | 520,000 | | | | 3,653,017 | | | | 4,173,017 | | | | (243,735 | ) | | 1986/1999-2000 | | | 2/15/2011 | |
Lawrenceville I | | | GA | | | | 1,484,791 | | | | 820,000 | | | | 709,603 | | | | 1,529,603 | | | | 90,984 | | | | 820,000 | | | | 800,587 | | | | 1,620,587 | | | | (54,573 | ) | | 1996 | | | 2/15/2011 | |
Lawrenceville II | | | GA | | | | 2,733,773 | | | | 990,000 | | | | 1,842,445 | | | | 2,832,445 | | | | 71,009 | | | | 990,000 | | | | 1,913,454 | | | | 2,903,454 | | | | (149,978 | ) | | 1999 | | | 2/15/2011 | |
Mississauga(1) | | | | | | | 6,841,134 | | | | 2,573,750 | | | | 3,088,500 | | | | 5,662,250 | | | | 7,892,930 | (2) | | | 2,507,750 | | | | 11,047,430 | | | | 13,555,180 | | | | (214,896 | ) | | 1963/2011 | | | 3/11/2011 | |
El Paso | | | TX | | | | — | | | | 330,000 | | | | 1,230,000 | | | | 1,560,000 | | | | 10,234 | | | | 330,000 | | | | 1,240,234 | | | | 1,570,234 | | | | (97,728 | ) | | 2010 | | | 3/17/2011 | |
Las Vegas VII | | | NV | | | | 3,738,545 | | | | 2,030,000 | | | | 2,543,052 | | | | 4,573,052 | | | | 125,959 | | | | 2,030,000 | | | | 2,669,011 | | | | 4,699,011 | | | | (202,242 | ) | | 1996 | | | 3/25/2011 | |
Las Vegas VIII | | | NV | | | | 3,807,143 | | | | 1,520,000 | | | | 3,381,631 | | | | 4,901,631 | | | | 133,600 | | | | 1,520,000 | | | | 3,515,231 | | | | 5,035,231 | | | | (245,291 | ) | | 1997 | | | 3/25/2011 | |
SF Bay Area –Morgan Hill | | | CA | | | | 2,936,550 | | | | 1,000,000 | | | | 4,654,098 | | | | 5,654,098 | | | | 72,620 | | | | 1,000,000 | | | | 4,726,718 | | | | 5,726,718 | | | | (286,308 | ) | | 1997 | | | 3/30/2011 | |
SF Bay Area –Vallejo | | | CA | | | | 4,455,483 | | | | 2,000,000 | | | | 5,266,974 | | | | 7,266,974 | | | | 67,179 | | | | 2,000,000 | | | | 5,334,153 | | | | 7,334,153 | | | | (326,982 | ) | | 2001 | | | 3/30/2011 | |
Peachtree City | | | GA | | | | 2,593,658 | | | | 800,000 | | | | 4,090,000 | | | | 4,890,000 | | | | 369,702 | | | | 800,000 | | | | 4,459,702 | | | | 5,259,702 | | | | (226,354 | ) | | 1988/1992 | | | 6/10/2011 | |
Buford | | | GA | | | | 1,323,795 | | | | 1,000,000 | | | | 1,357,000 | | | | 2,357,000 | | | | 82,581 | | | | 1,000,000 | | | | 1,439,581 | | | | 2,439,581 | | | | (80,020 | ) | | 2002 | | | 6/10/2011 | |
Jonesboro | | | GA | | | | 1,078,648 | | | | 800,000 | | | | 1,495,000 | | | | 2,295,000 | | | | 56,889 | | | | 800,000 | | | | 1,551,889 | | | | 2,351,889 | | | | (90,358 | ) | | 2002 | | | 6/10/2011 | |
Ellenwood | | | GA | | | | 1,235,542 | | | | 550,000 | | | | 1,564,225 | | | | 2,114,225 | | | | 192,690 | | | | 550,000 | | | | 1,756,915 | | | | 2,306,915 | | | | (102,164 | ) | | 1998 | | | 6/10/2011 | |
Marietta II | | | GA | | | | 1,176,707 | | | | 1,050,000 | | | | 1,402,200 | | | | 2,452,200 | | | | 43,836 | | | | 1,050,000 | | | | 1,446,036 | | | | 2,496,036 | | | | (88,119 | ) | | 1998/2008 | | | 6/10/2011 | |
Collegeville | | | P A | | | | 1,485,592 | | | | 440,000 | | | | 2,395,500 | | | | 2,835,500 | | | | 130,922 | | | | 440,000 | | | | 2,526,422 | | | | 2,966,422 | | | | (133,146 | ) | | 1996 | | | 6/10/2011 | |
Skippack | | | P A | | | | 1,147,289 | | | | 600,000 | | | | 1,513,000 | | | | 2,113,000 | | | | 79,911 | | | | 600,000 | | | | 1,592,911 | | | | 2,192,911 | | | | (92,637 | ) | | 2004 | | | 6/10/2011 | |
Ballston Spa | | | NY | | | | 2,466,182 | | | | 900,000 | | | | 3,806,760 | | | | 4,706,760 | | | | 30,057 | | | | 900,000 | | | | 3,836,817 | | | | 4,736,817 | | | | (265,399 | ) | | 2002 | | | 6/10/2011 | |
Trenton | | | NJ | | | | 3,736,045 | | | | 2,250,000 | | | | 4,743,000 | | | | 6,993,000 | | | | 13,342 | | | | 2,250,000 | | | | 4,756,342 | | | | 7,006,342 | | | | (260,252 | ) | | 2003 | | | 6/10/2011 | |
Fredericksburg | | | VA | | | | 2,049,431 | | | | 1,600,000 | | | | 2,311,625 | | | | 3,911,625 | | | | 61,354 | | | | 1,600,000 | | | | 2,372,979 | | | | 3,972,979 | | | | (179,395 | ) | | 2000 | | | 6/10/2011 | |
Sandston | | | VA | | | | 3,294,780 | | | | 1,550,000 | | | | 4,593,000 | | | | 6,143,000 | | | | 35,270 | | | | 1,550,000 | | | | 4,628,270 | | | | 6,178,270 | | | | (288,825 | ) | | 2005/2006 | | | 6/10/2011 | |
Ladera Ranch | | | CA | | | | 7,106,066 | | | | 4,800,000 | | | | 10,969,414 | | | | 15,769,414 | | | | 31,918 | | | | 4,800,000 | | | | 11,001,332 | | | | 15,801,332 | | | | (540,318 | ) | | 2003 | | | 7/6/2011 | |
Ladera Ranch—Land | | | CA | | | | — | | | | 3,953,282 | | | | — | | | | 3,953,282 | | | | — | | | | 3,953,282 | | | | — | | | | 3,953,282 | | | | — | | | 2003 | | | 7/6/2011 | |
S-2
| | | | | | | | | | | | | | | | | | | | | | | | | | | | | | | | | | | | | | | | | | | | | | |
| | | | | | | | | Initial Cost to Company | | | | | | Gross Carrying Amount at December 31, 2012 | | | | | | |
| Description | | ST | | | Encumbrance | | | Land | | | Building and Improvements | | | Total | | | Cost Capitalized Subsequent to Acquisition | | | Land | | | Building and Improvements | | | Total | | | Accumulated Depreciation | | | Date of Construction | | Date Acquired | |
SF Bay Area –San Lorenzo | | | CA | | | | 2,099,622 | | | | — | | | | 2,450,880 | | | | 2,450,880 | | | | 54,750 | | | | — | | | | 2,505,630 | | | | 2,505,630 | | | | (130,933 | ) | | 2000 | | | 7/15/2011 | |
Hampton | | | VA | | | | 3,500,000 | | | | 400,000 | | | | 3,930,000 | | | | 4,330,000 | | | | 97,290 | | | | 400,000 | | | | 4,027,290 | | | | 4,427,290 | | | | (187,269 | ) | | 2007 | | | 7/20/2011 | |
Las Vegas V | | | NV | | | | 1,667,485 | | | | 890,000 | | | | 3,160,000 | | | | 4,050,000 | | | | 98,455 | | | | 890,000 | | | | 3,258,455 | | | | 4,148,455 | | | | (154,522 | ) | | 1997 | | | 7/21/2011 | |
SF Bay Area –Gilroy | | | CA | | | | 4,450,000 | | | | 1,200,000 | | | | 4,690,000 | | | | 5,890,000 | | | | 110,617 | | | | 1,200,000 | | | | 4,800,617 | | | | 6,000,617 | | | | (264,639 | ) | | 1999 | | | 8/12/2011 | |
Brewster – Brampton(1) | | | | | | | 208,086 | | | | 5,174,205 | | | | — | | | | 5,174,205 | | | | (1,763,665 | ) (2) (3) | | | 3,410,540 | | | | — | | | | 3,410,540 | | | | — | | | n/a | | | 9/13/2011 | |
Toms River | | | NJ | | | | 3,575,000 | | | | 1,490,000 | | | | 3,730,000 | | | | 5,220,000 | | | | 42,227 | | | | 1,490,000 | | | | 3,772,227 | | | | 5,262,227 | | | | (143,528 | ) | | 2006 | | | 10/21/2011 | |
Kennesaw | | | GA | | | | 3,266,743 | | | | 875,000 | | | | 5,133,992 | | | | 6,008,992 | | | | 23,822 | | | | 875,000 | | | | 5,157,814 | | | | 6,032,814 | | | | (170,634 | ) | | 2006 | | | 12/27/2011 | |
Sharpsburg | | | GA | | | | 3,321,595 | | | | 1,250,000 | | | | 4,792,241 | | | | 6,042,241 | | | | 29,428 | | | | 1,250,000 | | | | 4,821,669 | | | | 6,071,669 | | | | (168,976 | ) | | 2006 | | | 12/27/2011 | |
Duluth | | | GA | | | | 3,565,382 | | | | 900,000 | | | | 5,711,120 | | | | 6,611,120 | | | | 23,231 | | | | 900,000 | | | | 5,734,351 | | | | 6,634,351 | | | | (196,109 | ) | | 2007 | | | 12/27/2011 | |
Duluth II | | | GA | | | | 3,656,802 | | | | 800,000 | | | | 5,893,201 | | | | 6,693,201 | | | | 20,996 | | | | 800,000 | | | | 5,914,197 | | | | 6,714,197 | | | | (182,731 | ) | | 2007 | | | 12/27/2011 | |
Duluth III | | | GA | | | | 3,687,276 | | | | 750,000 | | | | 6,090,561 | | | | 6,840,561 | | | | 39,534 | | | | 750,000 | | | | 6,130,095 | | | | 6,880,095 | | | | (194,815 | ) | | 2007 | | | 12/27/2011 | |
Marietta III | | | GA | | | | 3,534,909 | | | | 450,000 | | | | 6,053,761 | | | | 6,503,761 | | | | 31,259 | | | | 450,000 | | | | 6,085,020 | | | | 6,535,020 | | | | (190,643 | ) | | 2007 | | | 12/27/2011 | |
Austell | | | GA | | | | 2,437,868 | | | | 800,000 | | | | 3,728,801 | | | | 4,528,801 | | | | 31,874 | | | | 800,000 | | | | 3,760,675 | | | | 4,560,675 | | | | (125,263 | ) | | 2007 | | | 12/27/2011 | |
Sandy Springs | | | GA | | | | 7,557,392 | | | | 563,888 | | | | 7,877,873 | | | | 8,441,761 | | | | 33,293 | | | | 563,888 | | | | 7,911,166 | | | | 8,475,054 | | | | (240,691 | ) | | 2009 | | | 12/27/2011 | |
Smyrna | | | GA | | | | 3,595,856 | | | | 1,475,000 | | | | 5,173,480 | | | | 6,648,480 | | | | 36,748 | | | | 1,475,000 | | | | 5,210,228 | | | | 6,685,228 | | | | (168,028 | ) | | 2007 | | | 12/27/2011 | |
Lawrenceville III | | | GA | | | | 3,489,199 | | | | 1,325,000 | | | | 5,692,721 | | | | 7,017,721 | | | | 29,704 | | | | 1,325,000 | | | | 5,722,425 | | | | 7,047,425 | | | | (192,397 | ) | | 2009 | | | 12/27/2011 | |
Jacksonville | | | FL | | | | 4,388,163 | | | | 900,000 | | | | 7,169,841 | | | | 8,069,841 | | | | 24,255 | | | | 900,000 | | | | 7,194,096 | | | | 8,094,096 | | | | (223,503 | ) | | 2008 | | | 12/27/2011 | |
Jacksonville II | | | FL | | | | 2,498,815 | | | | 2,100,000 | | | | 3,033,522 | | | | 5,133,522 | | | | 32,274 | | | | 2,100,000 | | | | 3,065,796 | | | | 5,165,796 | | | | (128,895 | ) | | 2009 | | | 12/27/2011 | |
Chantilly | | | VA | | | | 3,474,712 | | | | 2,431,905 | | | | 3,968,095 | | | | 6,400,000 | | | | 229,442 | | | | 2,431,905 | | | | 4,197,537 | | | | 6,629,442 | | | | (93,995 | ) | | 1985 | | | 5/24/2012 | |
Savannah I | | | GA | | | | 1,400,000 | | | | 987,000 | | | | 1,573,000 | | | | 2,560,000 | | | | 93,471 | | | | 987,000 | | | | 1,666,471 | | | | 2,653,471 | | | | (22,850 | ) | | 2002 | | | 8/16/2012 | |
Savannah II | | | GA | | | | 1,250,000 | | | | 1,026,000 | | | | 1,464,000 | | | | 2,490,000 | | | | 36,238 | | | | 1,026,000 | | | | 1,500,238 | | | | 2,526,238 | | | | (20,048 | ) | | 2001 | | | 8/16/2012 | |
Columbia | | | SC | | | | 935,000 | | | | 1,002,000 | | | | 1,628,000 | | | | 2,630,000 | | | | 27,308 | | | | 1,002,000 | �� | | | 1,655,308 | | | | 2,657,308 | | | | (21,078 | ) | | 2003 | | | 8/16/2012 | |
Lexington I | | | SC | | | | 900,000 | | | | 789,000 | | | | 1,021,000 | | | | 1,810,000 | | | | 17,284 | | | | 789,000 | | | | 1,038,284 | | | | 1,827,284 | | | | (15,619 | ) | | 2010 | | | 8/16/2012 | |
Stuart I | | | FL | | | | 1,425,000 | | | | 875,000 | | | | 2,015,000 | | | | 2,890,000 | | | | 45,345 | | | | 875,000 | | | | 2,060,345 | | | | 2,935,345 | | | | (24,952 | ) | | 2004 | | | 8/16/2012 | |
Lexington II | | | SC | | | | 1,875,000 | | | | 1,090,000 | | | | 3,040,000 | | | | 4,130,000 | | | | 75,612 | | | | 1,090,000 | | | | 3,115,612 | | | | 4,205,612 | | | | (43,218 | ) | | 1998/2003 | | | 8/16/2012 | |
Stuart II | | | FL | | | | 2,085,000 | | | | 2,100,000 | | | | 1,200,000 | | | | 3,300,000 | | | | 26,804 | | | | 2,100,000 | | | | 1,226,804 | | | | 3,326,804 | | | | (18,654 | ) | | 2008 | | | 8/16/2012 | |
Bluffton | | | SC | | | | 2,500,000 | | | | 1,240,000 | | | | 3,990,000 | | | | 5,230,000 | | | | 5,048 | | | | 1,240,000 | | | | 3,995,048 | | | | 5,235,048 | | | | (51,195 | ) | | 2008 | | | 8/16/2012 | |
Wilmington Island | | | SC | | | | 4,330,000 | | | | 1,616,000 | | | | 4,194,000 | | | | 5,810,000 | | | | 11,299 | | | | 1,616,000 | | | | 4,205,299 | | | | 5,821,299 | | | | (33,188 | ) | | 1999 | | | 10/1/2012 | |
Myrtle Beach | | | SC | | | | 1,500,000 | | | | 1,956,000 | | | | 1,554,000 | | | | 3,510,000 | | | | 5,249 | | | | 1,956,000 | | | | 1,559,249 | | | | 3,515,249 | | | | (17,514 | ) | | 2002 | | | 10/1/2012 | |
Mt. Pleasant I | | | SC | | | | 1,500,000 | | | | 1,360,000 | | | | 1,320,000 | | | | 2,680,000 | | | | 1,500 | | | | 1,360,000 | | | | 1,321,500 | | | | 2,681,500 | | | | (6,784 | ) | | 1989 | | | 11/5/2012 | |
Charleston I | | | SC | | | | 1,500,000 | | | | 725,000 | | | | 2,085,000 | | | | 2,810,000 | | | | 1,080 | | | | 725,000 | | | | 2,086,080 | | | | 2,811,080 | | | | (10,865 | ) | | 2011 | | | 11/5/2012 | |
Charleston II | | | SC | | | | 1,650,000 | | | | 775,000 | | | | 2,375,000 | | | | 3,150,000 | | | | 2,500 | | | | 775,000 | | | | 2,377,500 | | | | 3,152,500 | | | | (11,600 | ) | | 1992 | | | 11/5/2012 | |
Mt. Pleasant II | | | SC | | | | 3,350,000 | | | | 2,630,000 | | | | 2,570,000 | | | | 5,200,000 | | | | 1,500 | | | | 2,630,000 | | | | 2,571,500 | | | | 5,201,500 | | | | (15,857 | ) | | 1995 | | | 11/5/2012 | |
Charleston III | | | SC | | | | 3,362,500 | | | | 1,563,000 | | | | 4,742,000 | | | | 6,305,000 | | | | 2,100 | | | | 1,563,000 | | | | 4,744,100 | | | | 6,307,100 | | | | (24,665 | ) | | 1986/1996 | | | 11/5/2012 | |
Mt. Pleasant III | | | SC | | | | 8,000,000 | | | | 7,190,000 | | | | 8,220,000 | | | | 15,410,000 | | | | 9,072 | | | | 7,190,000 | | | | 8,229,072 | | | | 15,419,072 | | | | (43,993 | ) | | 1997/2007 | | | 11/5/2012 | |
S-3
| | | | | | | | | | | | | | | | | | | | | | | | | | | | | | | | | | | | | | | | | | | | | | | | |
| | | | | | | | | Initial Cost to Company | | | | | | Gross Carrying Amount at December 31, 2012 | | | | | | | |
| Description | | ST | | | Encumbrance | | | Land | | | Building and Improvements | | | Total | | | Cost Capitalized Subsequent to Acquisition | | | Land | | | Building and Improvements | | | Total | | | Accumulated Depreciation | | | Date of Construction | | | Date Acquired | |
Ridgeland | | | MS | | | | 3,510,096 | | | | 574,992 | | | | 4,335,796 | | | | 4,910,788 | | | | — | | | | 574,992 | | | | 4,335,796 | | | | 4,910,788 | | | | — | | | | 1989/2004 | | | | 12/28/2012 | |
Canton | | | MS | | | | 3,196,694 | | | | 686,070 | | | | 3,810,851 | | | | 4,496,921 | | | | — | | | | 686,070 | | | | 3,810,851 | | | | 4,496,921 | | | | — | | | | 1996/2004 | | | | 12/28/2012 | |
| | | | | | | | | | | | | | | | | | | | | | | | | | | | | | | | | | | | | | | | | | | | | | | | |
| | | | | | $ | 346,774,092 | | | $ | 180,197,109 | | | $ | 406,939,756 | | | $ | 587,136,865 | | | $ | 17,591,030 | | | $ | 178,459,163 | | | $ | 426,268,732 | | | $ | 604,727,895 | | | ($ | 29,840,320 | ) | | | | | | | | |
| | | | | | | | | | | | | | | | | | | | | | | | | | | | | | | | | | | | | | | | | | | | | | | | |
| (1) | This property is located in Ontario, Canada. |
| (2) | The change in cost at this self storage facility is the net of the impact of foreign exchange rate changes and any actual additions. |
| (3) | This amount is the net of the impact of foreign exchange rate changes and a reduction in basis due to a sale of a parcel of land at this facility. |
S-4
Activity in real estate facilities during 2012 was as follows:
| | | | |
| | | 2012 | |
Real estate facilities | | | | |
Balance at beginning of year | | $ | 510,395,576 | |
Acquisitions | | | 85,722,709 | |
Land disposition | | | (1,675,860 | ) |
Impact of foreign exchange rate changes | | | 614,721 | |
Improvements | | | 9,670,749 | |
| | | | |
Balance at end of year | | $ | 604,727,895 | |
| | | | |
Accumulated depreciation | | | | |
Balance at beginning of year | | $ | 15,971,288 | |
Depreciation expense | | | 13,869,032 | |
| | | | |
Balance at end of year | | $ | 29,840,320 | |
| | | | |
Real estate facilities, net | | $ | 574,887,575 | |
| | | | |
S-5
EXHIBIT INDEX
| | |
Exhibit No. | | Description |
| |
| 3.1 | | Second Articles of Amendment and Restatement of Strategic Storage Trust, Inc., incorporated by reference to Exhibit 3.1 to the Company’s Form 8-K, filed on June 21, 2011, Commission File No. 000-53644 |
| |
| 3.2 | | Articles of Amendment to the Second Articles of Amendment and Restatement of Strategic Storage Trust, Inc., incorporated by reference to Exhibit 3.1 to the Company’s Form 8-K, filed on June 13, 2012, Commission File No. 000-53644 |
| |
| 3.3 | | Bylaws of Strategic Storage Trust, Inc., incorporated by reference to Exhibit 3.2 to Pre-Effective Amendment No. 3 to the Company’s Registration Statement on Form S-11, filed on March 7, 2008, Commission File No. 333-146959 |
| |
| 4.1 | | Form of Subscription Agreement and Subscription Agreement Signature Page (included as Appendix A to prospectus), incorporated by reference to Post-Effective Amendment No. 6 to the Company’s Registration Statement on Form S-11, filed on November 15, 2012, Commission File No. 333-168905 |
| |
| 10.1 | | First Amended and Restated Limited Partnership Agreement of Strategic Storage Operating Partnership, L.P., incorporated by reference to Exhibit 10.1 to Post-Effective Amendment No. 1 to the Company’s Registration Statement on Form S-11, filed on April 29, 2008, Commission File No. 333-146959 |
| |
| 10.2 | | Employee and Director Long-Term Incentive Plan of Strategic Storage Trust, Inc., incorporated by reference to Exhibit 10.4 to Pre-Effective Amendment No. 3 to the Company’s Registration Statement on Form S-11, filed on March 7, 2008, Commission File No. 333-146959 |
| |
| 10.3 | | Strategic Storage Trust, Inc. Distribution Reinvestment Plan (included as Appendix B to prospectus), incorporated by reference to Post-Effective Amendment No. 6 to the Company’s Registration Statement on Form S-11, filed on November 15, 2012, Commission File No. 333-168905 |
| |
| 10.4 | | Collateral Loan Agreement for Prudential Loan by and among The Prudential Life Insurance Company of America and Eleven Special-Purpose Entities dated August 25, 2010, incorporated by reference to Exhibit 10.1 to the Company’s Form 8-K, filed on August 31, 2010, Commission File No. 000-53644 |
| |
| 10.5 | | Form of Promissory Note for Prudential Loan, incorporated by reference to Exhibit 10.2 to the Company’s Form 8-K, filed on August 31, 2010, Commission File No. 000-53644 |
| |
| 10.6 | | Form of Mortgage or Deed of Trust and Security Agreement for Prudential Loan, incorporated by reference to Exhibit 10.3 to the Company’s Form 8-K, filed on August 31, 2010, Commission File No. 000-53644 |
| |
| 10.7 | | Form of Assignment of Leases and Rents for Prudential Loan, incorporated by reference to Exhibit 10.4 to the Company’s Form 8-K, filed on August 31, 2010, Commission File No. 000-53644 |
| |
| 10.8 | | Form of Supplemental Guaranty for Prudential Loan, incorporated by reference to Exhibit 10.5 to the Company’s Form 8-K, filed on August 31, 2010, Commission File No. 000-53644 |
| |
| 10.9 | | Form of Recourse Liabilities Guaranty for Prudential Loan, incorporated by reference to Exhibit 10.6 to the Company’s Form 8-K, filed on August 31, 2010, Commission File No. 000-53644 |
| |
| 10.10 | | Promissory Note for Citi Loan in favor of The Citigroup Global Markets Realty Corp. dated January 28, 2011, incorporated by reference to Exhibit 10.1 to the Company’s Form 8-K, filed on February 3, 2011, Commission File No. 000-53644 |
| |
| 10.11 | | Loan Agreement for Citi Loan, incorporated by reference to Exhibit 10.2 to the Company’s Form 8-K, filed on February 3, 2011, Commission File No. 000-53644 |
| |
| 10.12 | | Limited Recourse Guaranty for Citi Loan, incorporated by reference to Exhibit 10.3 to the Company’s Form 8-K, filed on February 3, 2011, Commission File No. 000-53644 |
| | |
Exhibit No. | | Description |
| |
| 10.13 | | Loan Agreement for Bank of America Loan between EP Rhino, DST and Bank of America, N.A. dated November 1, 2005, incorporated by reference to Exhibit 10.1 to the Company’s Form 8-K, filed on February 7, 2011, Commission File No. 000-53644 |
| |
| 10.14 | | Promissory Note for Bank of America Loan, incorporated by reference to Exhibit 10.2 to the Company’s Form 8-K, filed on February 7, 2011, Commission File No. 000-53644 |
| |
| 10.15 | | Amendment No. 1 to First Amended and Restated Limited Partnership Agreement of Strategic Storage Operating Partnership, L.P., incorporated by reference to Exhibit 10.1 to the Company’s Form 8-K, filed on March 31, 2011, Commission File No. 000-53644 |
| |
| 10.16 | | Purchase and Sale Agreement Related to B&B Portfolio dated March 25, 2011, incorporated by reference to Exhibit 10.2 to the Company’s Form 8-K, filed on March 31, 2011, Commission File No. 000-53644 |
| |
| 10.17 | | Loan Agreement for ING Loan by and among ING Life Insurance and Annuity Company, 11 Special-Purpose Entities, and Strategic Storage Trust, Inc. dated June 10, 2011, incorporated by reference to Exhibit 10.1 to the Company’s Form 8-K, filed on June 14, 2011, Commission File No. 000-53644 |
| |
| 10.18 | | Form of Mortgage, Deed of Trust or Deed to Secure Debt for ING Loan, incorporated by reference to Exhibit 10.2 to the Company’s Form 8-K, filed on June 14, 2011, Commission File No. 000-53644 |
| |
| 10.19 | | Form of Security Agreement for ING Loan, incorporated by reference to Exhibit 10.3 to the Company’s Form 8-K, filed on June 14, 2011, Commission File No. 000-53644 |
| |
| 10.20 | | Form of Promissory Note for ING Loan, incorporated by reference to Exhibit 10.4 to the Company’s Form 8-K, filed on June 14, 2011, Commission File No. 000-53644 |
| |
| 10.21 | | Form of Assignment of Leases and Rents for ING Loan, incorporated by reference to Exhibit 10.5 to the Company’s Form 8-K, filed on June 14, 2011, Commission File No. 000-53644 |
| |
| 10.22 | | Form of Guaranty of Affiliate Loans for ING Loan, incorporated by reference to Exhibit 10.6 to the Company’s Form 8-K, filed on June 14, 2011, Commission File No. 000-53644 |
| |
| 10.23 | | Form of Limited Guaranty for ING Loan, incorporated by reference to Exhibit 10.7 to the Company’s Form 8-K, filed on June 14, 2011, Commission File No. 000-53644 |
| |
| 10.24 | | Note for the KeyBank Loan, incorporated by reference to Exhibit 10.2 to the Company’s Form 8-K, filed on July 8, 2011, Commission File No. 000-53644 |
| |
| 10.25 | | Deed of Trust, Assignment of Leases and Rents, Security Agreement, and Fixture Filing for the La Cienega-LA Property for the KeyBank Loan, incorporated by reference to Exhibit 10.3 to the Company’s Form 8-K, filed on July 8, 2011, Commission File No. 000-53644 |
| |
| 10.26 | | Collateral Assignment of Leases and Rents for the La Cienega-LA Property for the KeyBank Loan, incorporated by reference to Exhibit 10.4 to the Company’s Form 8-K, filed on July 8, 2011, Commission File No. 000-53644 |
| |
| 10.27 | | Collateral Assignment of Management Contract for the La Cienega-LA Property for the KeyBank Loan, incorporated by reference to Exhibit 10.5 to the Company’s Form 8-K, filed on July 8, 2011, Commission File No. 000-53644 |
| |
| 10.28 | | Collateral Assignment and Security Agreement in Respect of Contracts, Licenses and Permits for the La Cienega-LA Property for the KeyBank Loan, incorporated by reference to Exhibit 10.6 to the Company’s Form 8-K, filed on July 8, 2011, Commission File No. 000-53644 |
| |
| 10.29 | | Pledge and Security Agreement for the KeyBank Loan, incorporated by reference to Exhibit 10.8 to the Company’s Form 8-K, filed on July 8, 2011, Commission File No. 000-53644 |
| |
| 10.30 | | Purchase and Sale Agreement for the Homeland Portfolio, incorporated by reference to Exhibit 10.1 to the Company’s Form 8-K, filed on September 13, 2011, Commission File No. 000-53644 |
| | |
Exhibit No. | | Description |
| |
| 10.31 | | Second Amended and Restated Credit Agreement for the Second Restated KeyBank Loan, incorporated by reference to Exhibit 10.1 to the Company’s Form 8-K, filed on January 3, 2012, Commission File No. 000-53644 |
| |
| 10.32 | | Second Amended and Restated Guaranty for the Second Restated KeyBank Loan, incorporated by reference to Exhibit 10.2 to the Company’s Form 8-K, filed on January 3, 2012, Commission File No. 000-53644 |
| |
| 10.33 | | Amended and Restated Credit Agreement for the KeyBank Bridge Loan, incorporated by reference to Exhibit 10.3 to the Company’s Form 8-K, filed on January 3, 2012, Commission File No. 000-53644 |
| |
| 10.34 | | Amended and Restated Guaranty for the KeyBank Bridge Loan, incorporated by reference to Exhibit 10.4 to the Company’s Form 8-K, filed on January 3, 2012, Commission File No. 000-53644 |
| |
| 10.35 | | Purchase and Sale Agreement Related to the Stockade Portfolio dated June 19, 2012, incorporated by reference to Exhibit 10.1 to the Company’s Form 8-K, filed on June 25, 2012, Commission File No. 000-53644 |
| |
| 10.36 | | First Amendment to Second Amended and Restated Credit Agreement, incorporated by reference to Exhibit 10.1 to the Company’s Form 8-K, filed on August 16, 2012, Commission File No. 000-53644 |
| |
| 10.37 | | Second Amended and Restated Advisory Agreement, incorporated by reference to Exhibit 10.1 to the Company’s Form 8-K filed on October 3, 2012, Commission File No. 000-53644 |
| |
| 10.38 | | Loan Agreement with KeyBank, National Association for the KeyBank CMBS Loan dated as of October 10, 2012, incorporated by reference to Exhibit 10.1 to the Company’s Form 8-K filed on October 15, 2012, Commission File No. 000-53644 |
| |
| 10.39 | | Promissory Note for the KeyBank CMBS Loan dated as of October 10, 2012, incorporated by reference to Exhibit 10.2 to the Company’s Form 8-K filed on October 15, 2012, Commission File No. 000-53644 |
| |
| 10.40 | | Guaranty for the KeyBank CMBS Loan dated as of October 10, 2012, incorporated by reference to Exhibit 10.3 to the Company’s Form 8-K filed on October 15, 2012, Commission File No. 000-53644 |
| |
| 21.1 | | Subsidiaries of Strategic Storage Trust, Inc., incorporated by reference to Exhibit 21.1 to Post-Effective Amendment No. 6 to the Company’s Registration Statement on Form S-11, filed on October 14, 2009, Commission File No. 333-146959 |
| |
| 31.1* | | Certification of Principal Executive Officer, pursuant to Section 302 of the Sarbanes-Oxley Act of 2002 |
| |
| 31.2* | | Certification of Principal Financial Officer, pursuant to Section 302 of the Sarbanes-Oxley Act of 2002 |
| |
| 32.1* | | Certification of Principal Executive Officer, pursuant to 18 U.S.C. Section 1350, as created by Section 906 of the Sarbanes-Oxley Act of 2002 |
| |
| 32.2* | | Certification of Principal Financial Officer, pursuant to 18 U.S.C. Section 1350, as created by Section 906 of the Sarbanes-Oxley Act of 2002 |
| |
| 101** | | The following Strategic Storage Trust, Inc. financial information for the Year Ended December 31, 2012, formatted in XBRL: (i) Consolidated Balance Sheets, (ii) Consolidated Statements of Operations, (iii) Consolidated Statements of Comprehensive Loss (iv) Consolidated Statements of Stockholders’ Equity, (v) Consolidated Statements of Cash Flows and (vi) the Notes to Consolidated Financial Statements |
| ** | Pursuant to Rule 406T of Regulation S-T, these interactive data files are deemed not filed or part of a registration statement or prospectus for purposes of Sections 11 or 12 of the Securities Act of 1933 or Section 18 of the Securities Exchange Act of 1934 and otherwise are not subject to liability under these sections. |