|
Exhibit 99.1 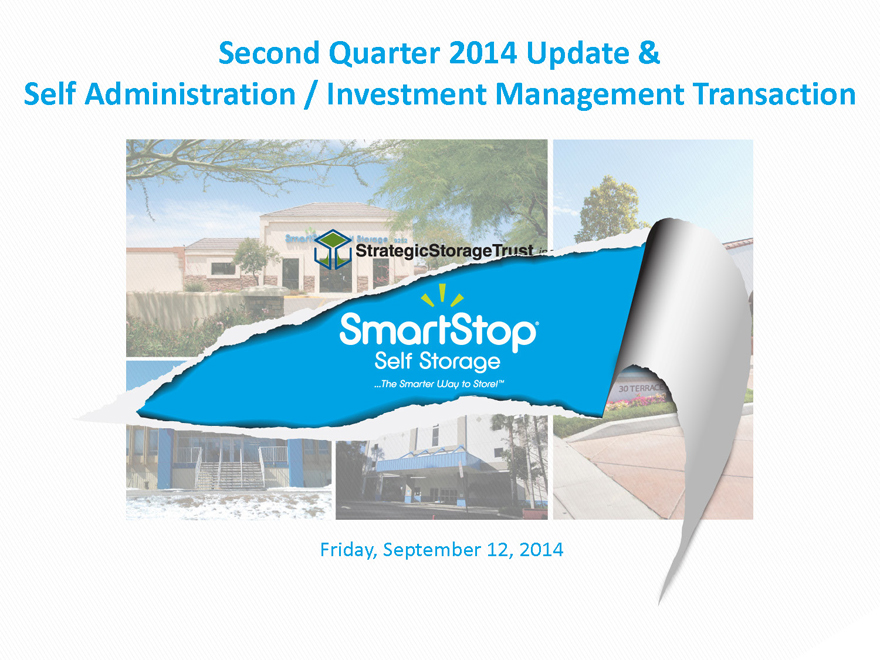
|
Exhibit 99.1
Second Quarter 2014 Update &
Self Administration / Investment Management Transaction
Self Storage
The Smarter Way to Storel
Disclaimer and Risk Factors
Friday, September 12, 2014
Disclaimer and Risk Factors
Disclaimers
CAUTIONARY NOTE REGARDING FORWARD-LOOKING STATEMENTS
Certain statements contained in this material, other than historical facts, may be considered forward?looking statements within the meaning of Section 27A of the Securities Act of 1933, as amended (the “Securities Act”) and Section 21E of the Securities Exchange Act of 1934, as amended (the “Exchange Act”). We intend for all such forward?looking statements to be covered by the applicable safe harbor provisions for forward?looking statements contained in Section 27A of the Securities Act and Section 21E of the Exchange Act, as applicable. Such statements include, in particular, statements about our plans, strategies, and prospects and are subject to certain risks and uncertainties, including known and unknown risks, which could cause actual results to differ materially from those projected or anticipated. Therefore, such statements are not intended to be a guarantee of our performance in future periods. Such forward?looking statements can generally be identified by our use of forward?looking terminology such as “may,”“will,”“expect,”“intend,”“anticipate,”“estimate,”“believe,”“continue,” or other similar words. Readers are cautioned not to place undue reliance on these forward?looking statements, which speak only as of the date this report is filed with the Securities and Exchange Commission. We cannot guarantee the accuracy of any such forward?looking statements contained in this material, and we do not intend to publicly update or revise any forward?looking statements, whether as a result of new information, future events, or otherwise.
Any such forward?looking statements are subject to risks, uncertainties, and other factors and are based on a number of assumptions involving judgments with respect to, among other things, future economic, competitive, and market conditions, all of which are difficult or impossible to predict accurately. To the extent that our assumptions differ from actual results, our ability to meet such forward?looking statements, including our ability to generate positive cash flow from operations and provide distributions to stockholders, and our ability to find suitable investment properties, may be significantly hindered. All forward?looking statements should be read in light of the risks identified in our 2013 Annual Report on Form 10?K.
Disclaimer and Risk Factors
Risk Factors
See our Form 10-K, and recent Form 10-Q for specific risks associated with an investment in SmartStop® Self Storage, Inc. formerly known as Strategic Storage Trust, Inc.
As of June 30, 2014, our accumulated deficit was approximately $69 million and we may have a net loss in 2014.
No public market currently exists for shares of our common stock. It may be difficult to sell your shares. If you sell your shares, it will likely be at a substantial discount.
We have paid distributions from sources other than our cash flows from operations. We are not prohibited from undertaking such activities by our charter, bylaws or investment policies, and we may use an unlimited amount from any source to pay our distributions. We also may be required to sell assets or issue new securities for cash in order to pay distributions. Any such actions could reduce the amount of capital we ultimately invest in assets and negatively impact the amount of income available for future distributions.
As of June 30, 2014 we had no employees and depended on our advisor to select investments and conduct our operations, and there is no guarantee that our advisor devoted adequate time or resources to us.
Our board of directors may change any of our investment objectives, including our focus on self storage facilities.
As of June 30, 2014 we paid substantial fees and expenses to our advisor and its affiliates which reduced cash available for investment and distribution.
As of June 30, 2014 there were substantial conflicts of interest among us and our sponsor, advisor and property manager.
We may fail to remain qualified as a REIT, which could adversely affect our operations and our ability to make distributions.
We may incur substantial debt, which could hinder our ability to pay distributions to our stockholders or could decrease the value of your investment.
Future distribution declarations are at the sole discretion of our board of directors and are not guaranteed. Since our inception, our cumulative distributions have exceeded cumulative GAAP earnings. We cannot assure you that we will achieve any of our investment objectives.
We encourage you to review our SEC filings at www.sec.gov.
3
Agenda
Self Storage Industry Overview
SmartStop® Self Storage, Inc. – Financial Update
(formerly known as Strategic Storage Trust, Inc.)
Estimated Value Per Share
Self Administration and Investment Management Transaction
4
Self Storage Industry Overview
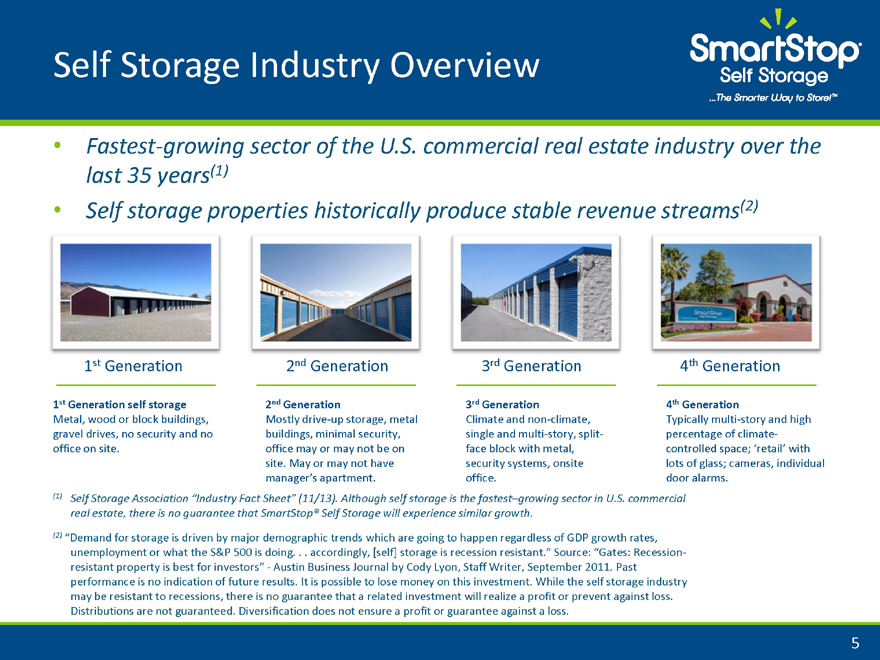
Fastest-growing sector of the U.S. commercial real estate industry over the last 35 years(1)
Self storage properties historically produce stable revenue streams(2)
1 st Generation 2nd Generation 3rd Generation 4th Generation
1st Generation self storage 2nd Generation 3rd Generation 4th Generation
Metal, wood or block buildings, Mostly drive-up storage, metal Climate and non-climate, Typically multi story and high
gravel drives, no security and no buildings, minimal security, single and multi story, split percentage of climate
office on site. office may or may not be on face block with metal, controlled space; ‘retail’ with
site. May or may not have security systems, onsite lots of glass; cameras, individual
manager’s apartment. office. door alarms.
(1) Self Storage Association “Industry Fact Sheet” (11/13). Although self storage is the fastest–growing sector in U.S. commercial real estate, there is no guarantee that SmartStop® Self Storage will experience similar growth.
(2) “Demand for storage is driven by major demographic trends which are going to happen regardless of GDP growth rates, unemployment or what the S&P 500 is doing. . . accordingly, [self] storage is recession resistant.” Source: “Gates: Recession resistant property is best for investors Austin Business Journal by Cody Lyon, Staff Writer, September 2011. Past performance is no indication of future results. It is possible to lose money on this investment. While the self storage industry may be resistant to recessions, there is no guarantee that a related investment will realize a profit or prevent against loss.
Distributions are not guaranteed. Diversification does not ensure a profit or guarantee against a loss.
5
Self Storage Industry Overview
Driven by People in Transition
Change in marital status
Birth
Inheritance
Military enlistment
Baby boomers
Job relocation
Business expansion or contraction
Micro business
Nearly 10% of U.S. households, currently rent a self storage unit, up from 1 in 17 in 1995.*
* Self Storage Association “Industry Fact Sheet”(11/13)
6
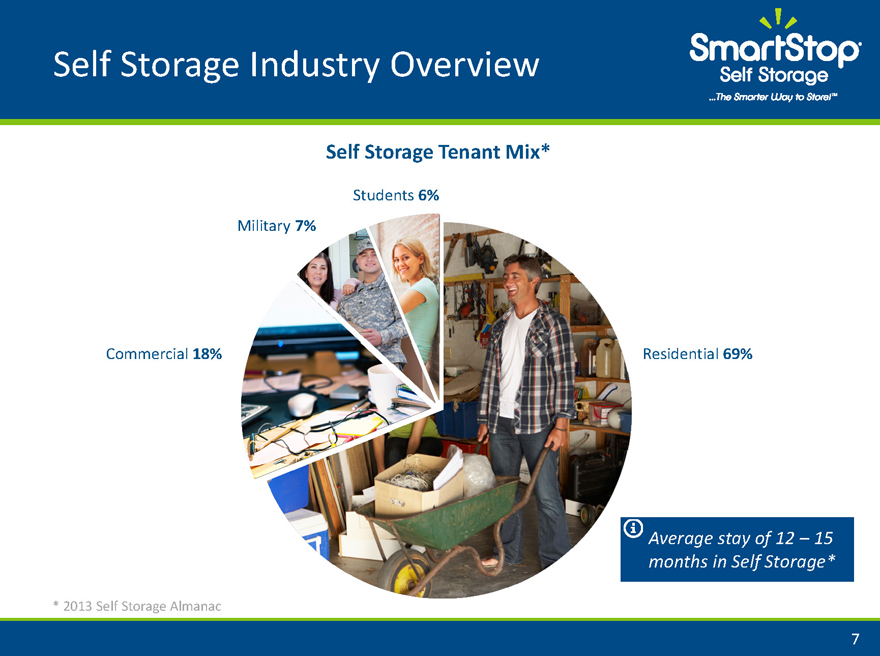
Self Storage Industry Overview
Self Storage Tenant Mix*
Students 6%
Military 7%
Commercial 18% Residential 69%
Average stay of 12 – 15 months in Self Storage*
* 2013 Self Storage Almanac
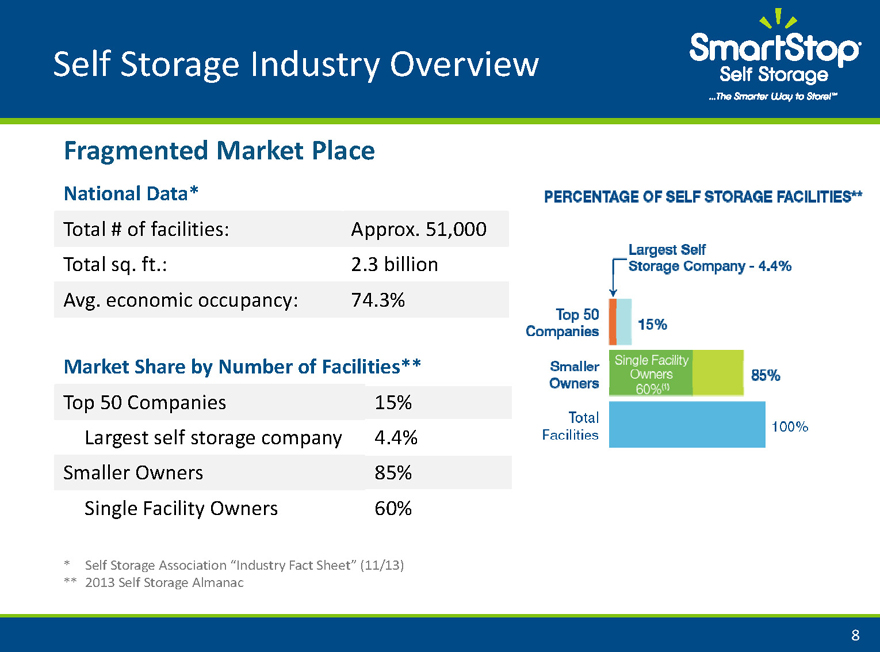
Self Storage Industry Overview
Fragmented Market Place
National Data*
Total # of facilities: Approx. 51,000
Total sq. ft.: 2.3 billion
Avg. economic occupancy: 74.3%
Market Share by Number of Facilities**
Top 50 Companies 15%
Largest self storage company 4.4%
Smaller Owners 85%
Single Facility Owners 60%
* | | Self Storage Association “Industry Fact Sheet” (11/13) |
** 2013 Self Storage Almanac
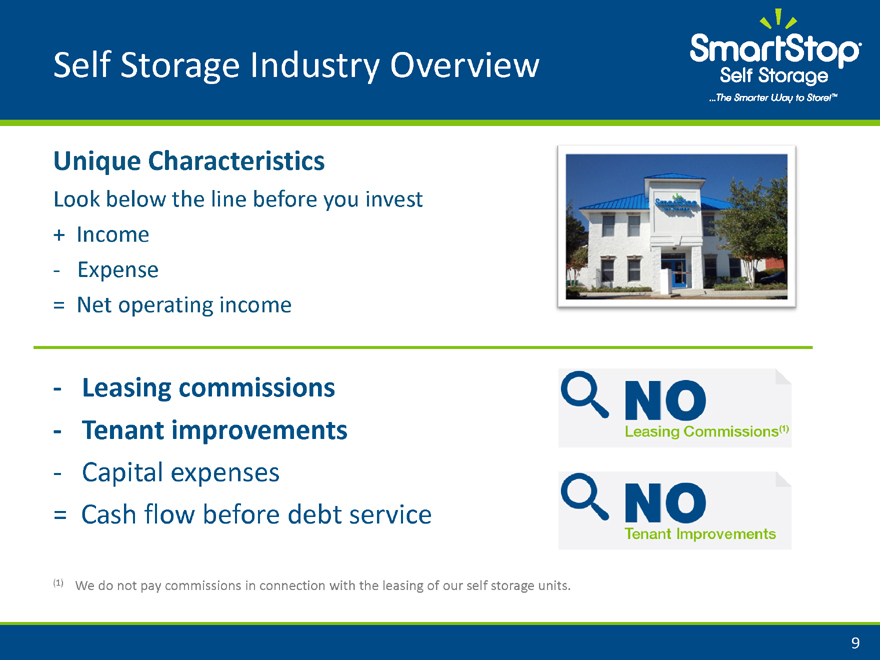
Self Storage Industry Overview
Unique Characteristics
Look below the line before you invest
+ Income
? Expense
= Net operating income
Leasing commissions
Tenant improvements
Capital expenses
= Cash flow before debt service
(1) | | We do not pay commissions in connection with the leasing of our self storage units. |
No Leasing commissions(1)
No Tenant Improvements
9
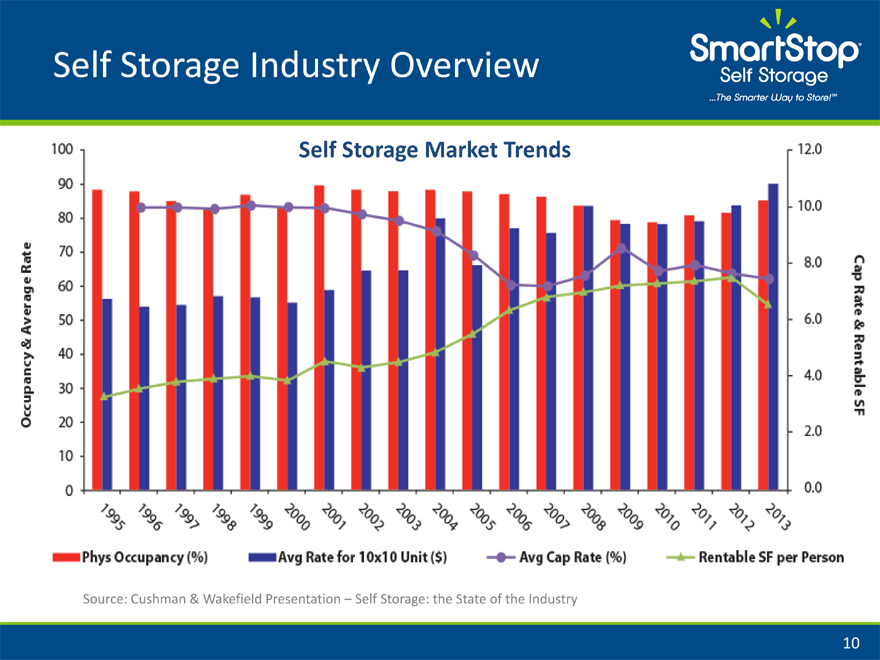
Self Storage Industry Overview
Self Storage Market Trends
Source: Cushman & Wakefield Presentation – Self Storage: the State of the Industry
0 10 20 30 40 50 60 70 80 90 100
Occupancy & Average Rate
1995 1996 1997 1998 1999 2000 2001 2002 2003 2004 2005 2006 2007 2008 2009 2010 2011 2012 2013
2.0 4.0 6.0 8.0 10.0 12.0
Phys Occupancy (%) Avg Rate for 10x10 Unit($) Avg Cap Rate (%) Rentable SF per Person
10
Self Storage Industry Overview
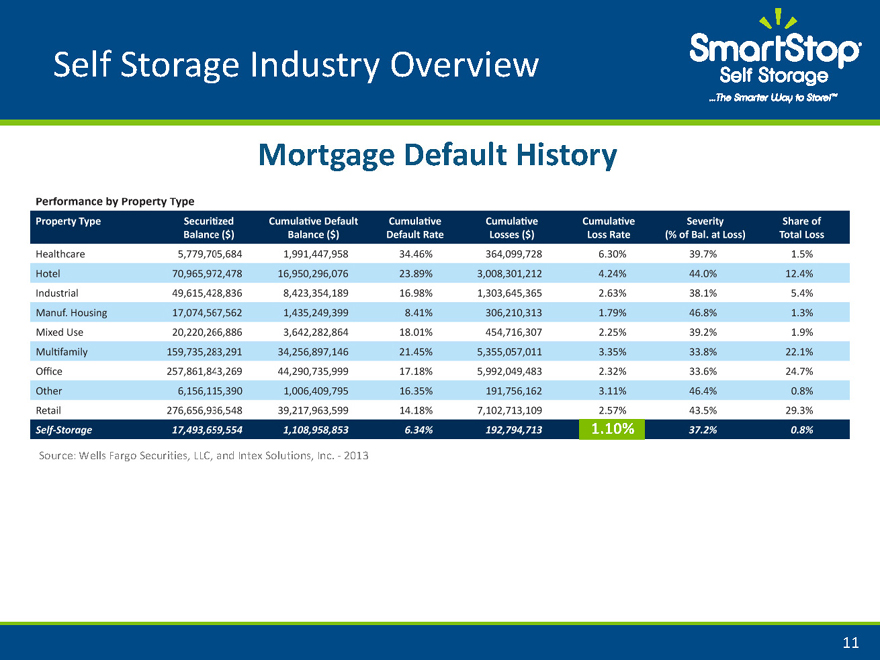
Mortgage Default History
Property Type Securitized Balance($) Cumulative Default Balance ($) Cumulative Default Rate Cumulative Losses ($) Cumulative Loss Rate Severity (% of Bal. at Loss) Share of Total Loss
Healthcare 5,779,705,684 1,991,447,958 34.46% 364,099,728 6.30% 39.7% 1.5%
Hotel 70,965,972,478 16,950,296,076 23.89% 3,008,301,212 4.24% 44.0% 12.4%
Industrial 49,615,428,836 8,426,354,189 16.98% 1,303,645,365 2.63% 38.1% 5.4%
Manuf. Housing 17,074,567,562 1,435,249,399 8.41% 306,210,313 1.79% 46.8% 1.3%
Mixed Use 20,220,266,886 3,642,282,864 18.01% 454,716,307 2.25% 39.2% 1.9%
Multifamily 159,735,283,291 34,256,897,146 21.45% 5,355,057,011 3.35% 33.8% 22.1%
Office 257,861,843,269 44,290,735,999 17.18% 5,992,049,483 2.32% 33.6% 24.7%
Other 6,156,115,390 1,006,409,795 16.35% 191,756,162 3.11% 46.4% 0.8%
Retail 276,656,936,548 39,217,963,599 14.18% 7,102,713,109 2.57% 43.5% 29.3%
Self-Storage 17,493,659,554 1,108,958,853 6.34% 192,794,713 1.10% 37.2% 0.8%
Performance by Property Type
1.10%
Source: Wells Fargo Securities, LLC, and Intex Solutions, Inc. ?2013
11
Agenda
Self Storage Industry Overview
SmartStop® Self Storage, Inc. – Financial Update
(formerly known as Strategic Storage Trust, Inc.)
Estimated Value Per Share
Self Administration and Investment Management Transaction
12
SmartStop® Self Storage, Inc.
– Financial Update
0 10 20 30 40 50 60 70 80 90 100 110 120 115 120 125
Q4 2008 Q1 2009 Q2 2009 Q3 2009 Q4 2009
Q1 Q2 Q3 Q4
2010 2011 2012 2013 2014
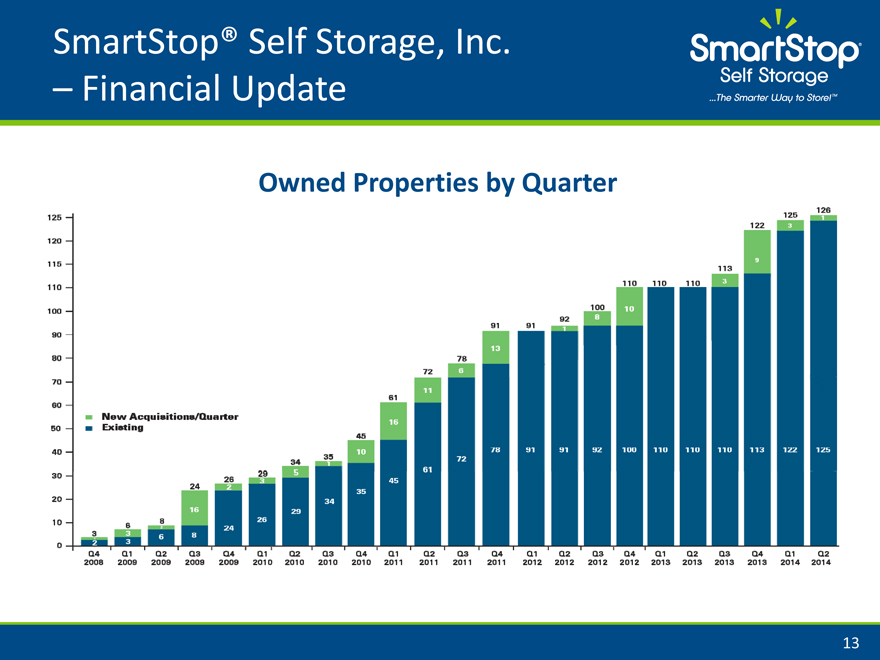
Owned Properties by Quarter
2 | | 3 6 24 26 29 34 35 45 61 72 78 91 92 100 110 113 122 125 |
3 | | 6 8 16 2 3 5 1 10 16 11 6 13 1 8 10 3 9 3 1 3 6 8 24 26 29 34 35 45 61 72 78 91 91 92 100 110 113 122 125 126 |
13
New Acquistitions/Quarter
Existing
SmartStop® Self Storage, Inc.
– Financial Update
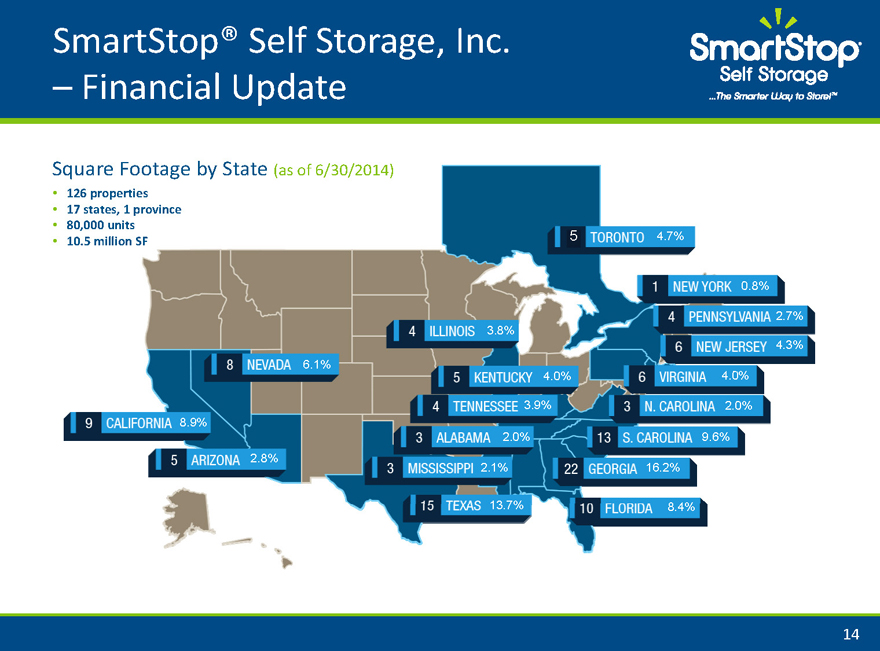
Square Footage by State (as of 6/30/2014)
126 properties
17 states, 1 province
80,000 units 4.7%
10.5 million SF 5
0.8%
2.7%
3.8%
4.3%
6.1% 4.0% 4.0%
3.9% 2.0%
8.9%
2.0% 9.6%
2.8%
2.1% 16.2%
13.7% 8.4%
TORONTO
NEVADA
CALIFORNIA
ARIZONA
ILLINIOS
NEW YORK
KENTUCKY TENNESSEE ALABAMA MISSISSIPPI TEXAS PENNSYLVANIA NEW JERSEY VIRGINIA N. CAROLINA CAROLINA GEORGIA FLORIDA
14
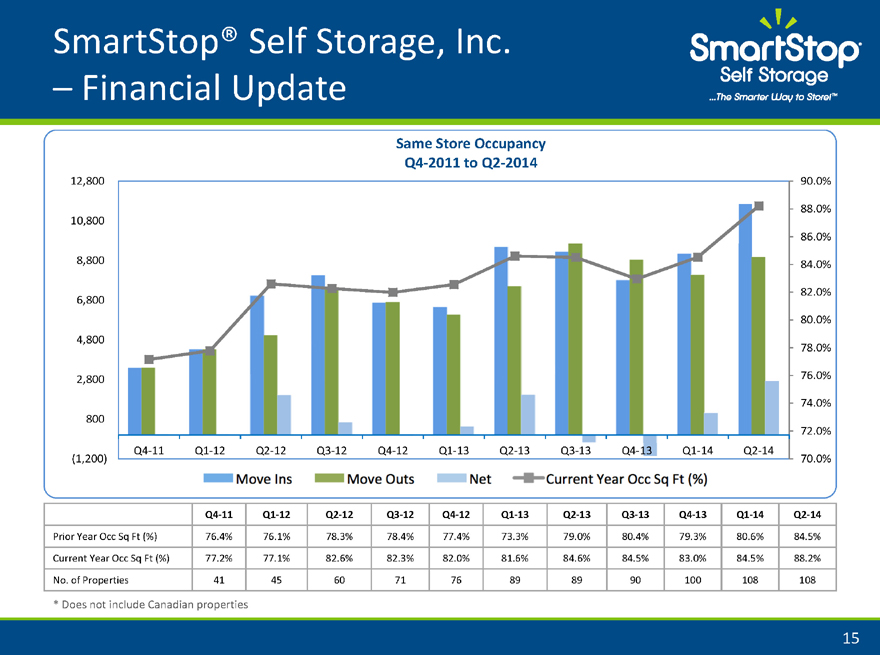
Same Store Occupancy Q4 2011 to Q2 2014
12,800 90.0%
88.0% 10,800
86.0% 8,800 84.0%
82.0% 6,800
80.0% 4,800
78.0%
2,800 76.0%
74.0% 800
72.0% Q4 11 Q1 12 Q2 12 Q3 12 Q4 12 Q1 13 Q2 13 Q3 13 Q4 13 Q1 14 Q2 14 (1,200) 70.0%
Q4 11 Q1 12 Q2 12 Q3 12 Q4 12 Q1 13 Q2 13 Q3 13 Q4 13 Q1 14 Q2 14
Prior Year Occ Sq Ft (%) 76.4% 76.1% 78.3% 78.4% 77.4% 73.3% 79.0% 80.4% 79.3% 80.6% 84.5%
Current Year Occ Sq Ft (%) 77.2% 77.1% 82.6% 82.3% 82.0% 81.6% 84.6% 84.5% 83.0% 84.5% 88.2%
No. of Properties 41 45 60 71 76 89 89 90 100 108 108
* Does not include Canadian properties
Move Ins Move Outs Net Current Year Occ Sq Ft (%)
SmartStop® Self Storage, Inc.
– Financial Update
15
SmartStop® Self Storage, Inc. – Financial Update
Second Quarter 2014
Cash Flow from Operations
$5.3 Million for Three Months Ended 6/30/2013
$8.4 Million for Three Months Ended 6/30/2014
58%
$9.3 Million for Six Months Ended 6/30/2013
$14.7 Million for Six Months Ended 6/30/2014
57%
IPA Modified Funds from Operations
$4.5 Million for Three Months Ended 6/30/2013
$7.9 Million for Three Months Ended 6/30/2014
76%
$9.1 Million for Six Months Ended 6/30/2013
$14.1 Million for Six Months Ended 6/30/2014
55%
SmartStop® Self Storage, Inc.
– Financial Update
16
SmartStop® Self Storage, Inc.
– Financial Update
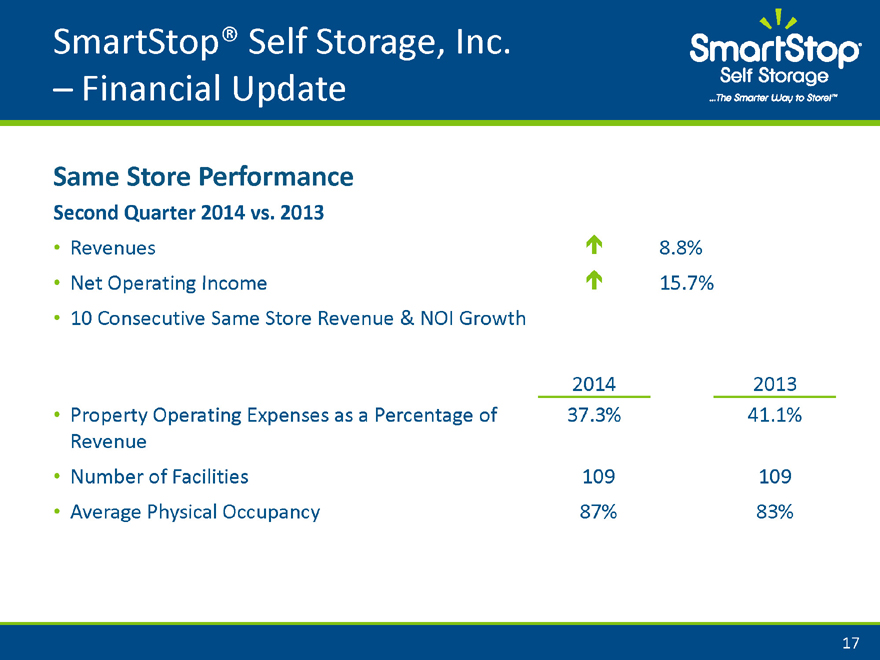
Same Store Performance
Second Quarter 2014 vs. 2013
Revenues Ï 8.8%
Net Operating Income Ï 15.7%
10 Consecutive Same Store Revenue & NOI Growth
2014 2013
Property Operating Expenses as a Percentage of 37.3% 41.1% Revenue
Number of Facilities 109 109
Average Physical Occupancy 87% 83%
17
SmartStop® Self Storage, Inc.
– Financial Update
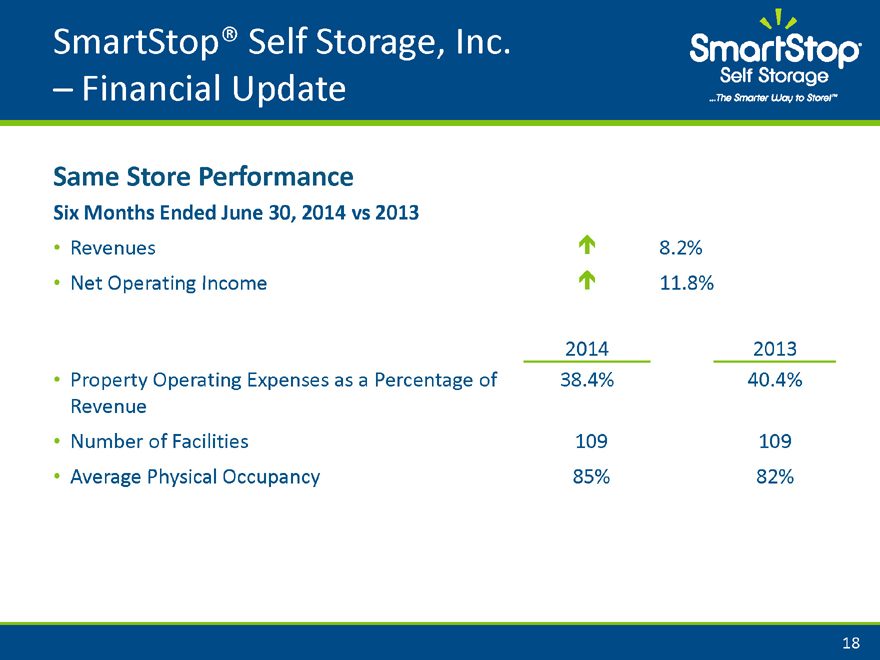
Same Store Performance
Six Months Ended June 30, 2014 vs 2013
Revenues Ï 8.2%
Net Operating Income Ï 11.8%
2014 2013
Property Operating Expenses as a Percentage of 38.4% 40.4%
Revenue
• Number of Facilities 109 109
Average Physical Occupancy 85% 82%
18
Agenda
Self Storage Industry Overview
SmartStop® Self Storage, Inc. – Financial Update
(formerly known as Strategic Storage Trust, Inc.)
Estimated Value Per Share
Self Administration and Investment Management Transaction
19
Estimated Value Per Share
Methodology IPA Guidelines
– Investment Program Association
Independent Valuation of Real Estate
– Cushman & Wakefield Western, Inc.
Estimated Value Per Share
20
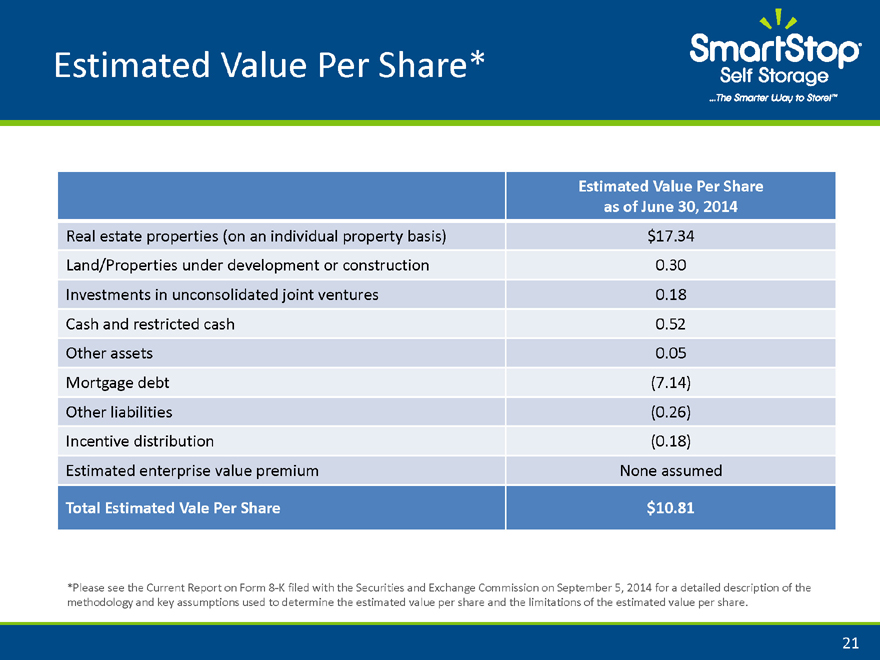
Estimated Value Per Share*
Estimated Value Per Share
as of June 30, 2014
Real estate properties (on an individual property basis) $17.34
Land/Properties under development or construction 0.30
Investments in unconsolidated joint ventures 0.18
Cash and restricted cash 0.52
Other assets 0.05
Mortgage debt(7.14)
Other liabilities(0.26)
Incentive distribution(0.18)
Estimated enterprise value premium None assumed
Total Estimated Vale Per Share $10.81
*Please see the Current Report on Form 8 K filed with the Securities and Exchange Commission on September 5, 2014 for a detailed description of the methodology and key assumptions used to determine the estimated value per share and the limitations of the estimated value per share.
21
Agenda
Self Storage Industry Overview
SmartStop® Self Storage, Inc. – Financial Update
(formerly known as Strategic Storage Trust, Inc.)
Estimated Value Per Share
Self Administration and Investment Management Transaction
22
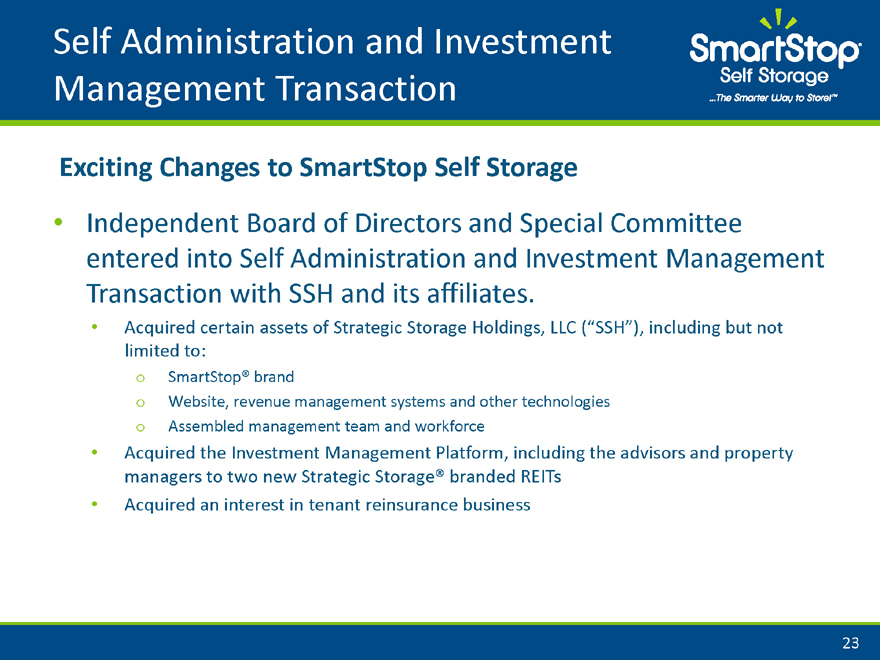
Self Administration and Investment Management Transaction
Exciting Changes to SmartStop Self Storage
Independent Board of Directors and Special Committee entered into Self Administration and Investment Management Transaction with SSH and its affiliates.
Acquired certain assets of Strategic Storage Holdings, LLC (“SSH”), including but not limited to:
o SmartStop® brand o Website, revenue management systems and other technologies o Assembled management team and workforce
Acquired the Investment Management Platform, including the advisors and property managers to two new Strategic Storage® branded REITs
Acquired an interest in tenant reinsurance business
23
Self Administration and Investment Management Transaction
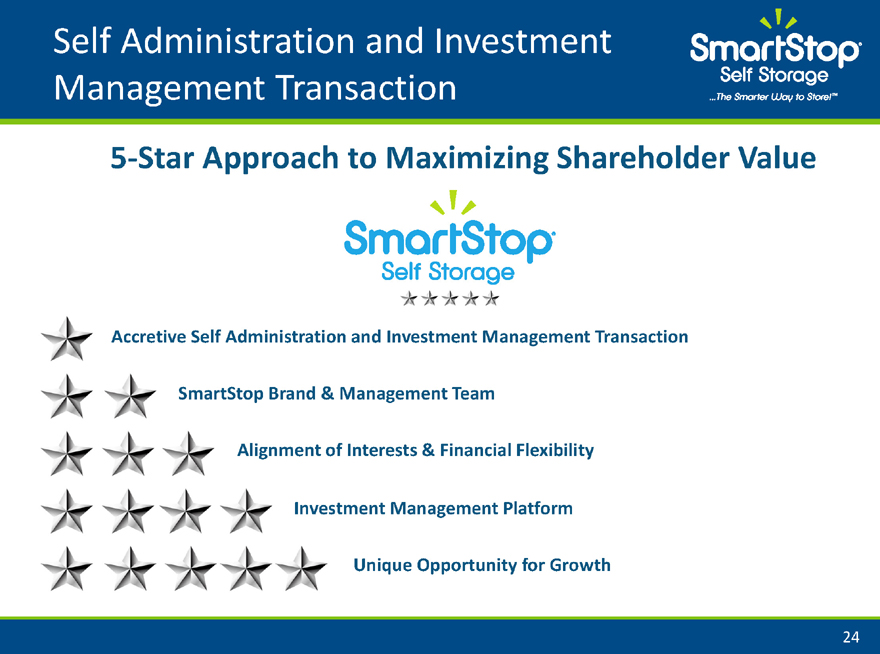
5 Star Approach to Maximizing Shareholder Value
Accretive Self Administration and Investment Management Transaction SmartStop Brand & Management Team Alignment of Interests & Financial Flexibility Investment Management Platform Unique Opportunity for Growth
24
Self Administration and Investment Management Transaction
Self Administration is Accretive to SmartStop Shareholders
Self administration eliminates various fees paid to the Property Manager and Advisor
– In Q2, SmartStop paid the following fees & reimbursements:
Property Management Fees: approximately $1.4M, or $5.7M annualized
Asset Management Fees: approximately $1.5M, or $6.0M annualized
Acquisition Fees: approximately $600k in Q1 & Q2
Operating Expense Reimbursements: approximately $250k, or $1.0M annualized
By eliminating the fees and hiring the management team, SmartStop recognizes the accretion of transaction in Year 1
As revenues continue to increase, the transaction becomes more accretive
25
Self Administration and Investment Management Transaction
SmartStop Has Acquired Intellectual Rights to SmartStop® Brand and Processes
Self Administration results in SmartStop owning the rights to the SmartStop® brand name as well as all other associated intellectual property, including www.SmartStop.com, as well as over 200 other web domains.
In addition to the brand, SmartStop now owns the right to the technology and software related to the SmartStop website, a critical component to the company’s continued growth.
– Also included is the ownership of SmartStop’s proprietary revenue optimization system, which continues to drive same store revenue growth.
The acquisition of the SmartStop® brand and workforce allows the company to pursue 3rd party property management of other self storage properties.
26
Self Administration and Investment Management Transaction
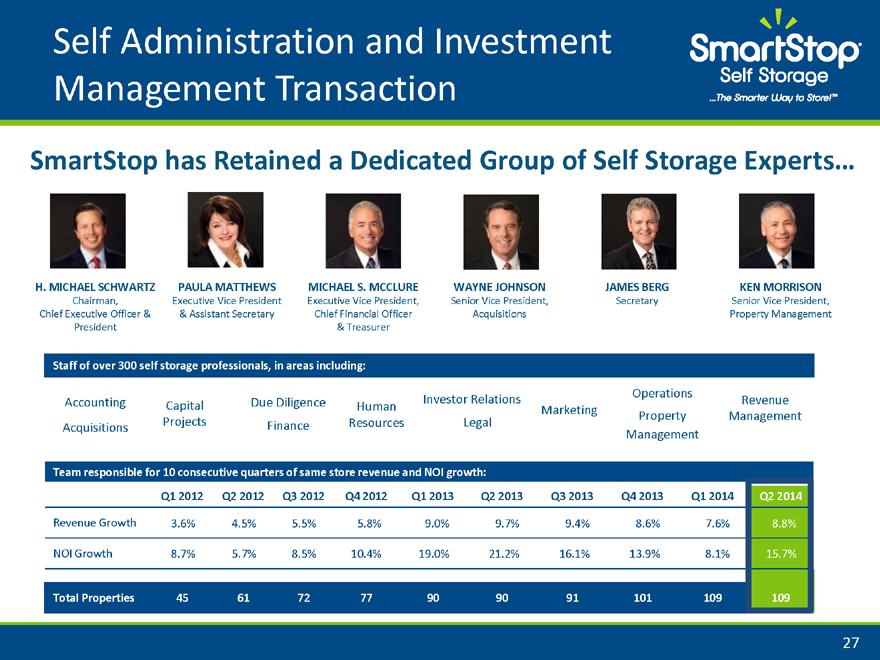
SmartStop has Retained a Dedicated Group of Self Storage Experts…
H. MICHAEL SCHWARTZ PAULA MATTHEWS MICHAEL S. MCCLURE WAYNE JOHNSON JAMES BERG KEN MORRISON
Chairman, Executive Vice President Executive Vice President, Senior Vice President, Secretary Senior Vice President,
Chief Executive Officer & & Assistant Secretary Chief Financial Officer Acquisitions Property Management
President & Treasurer
Staff of over 300 self storage professionals, in areas including:
Accounting Acquisitions Capital Projects Due Diligence Finance Human Resources Investor Relations Legal Marketing Operations Property Management Revenue Management
Team responsible for 10 consecutive quarters of same store revenue and NOI growth:
Q1 2012 Q2 2012 Q3 2012 Q4 2012 Q1 2013 Q2 2013 Q3 2013 Q4 2013 Q1 2014 Q2 2014
Revenue Growth 3.6% 4.5% 5.5% 5.8% 9.0% 9.7% 9.4% 8.6% 7.6% 8.8%
NOI Growth 8.7% 5.7% 8.5% 10.4% 19.0% 21.2% 16.1% 13.9% 8.1% 15.7%
Total Properties 45 61 72 77 90 90 91 101 109 109
27
Self Administration and Investment Management Transaction
Self Administration Allows SmartStop to be More Financially Flexible
Self administration aligns the interest of management with shareholders
Self administration allows for more financial flexibility to accomplish any of the following:
– Listing on national exchange
– Institutional investor funding
– Portfolio acquisitions
– Lower cost of capital
– Other liquidity events
28
Self Administration and Investment Management Transaction
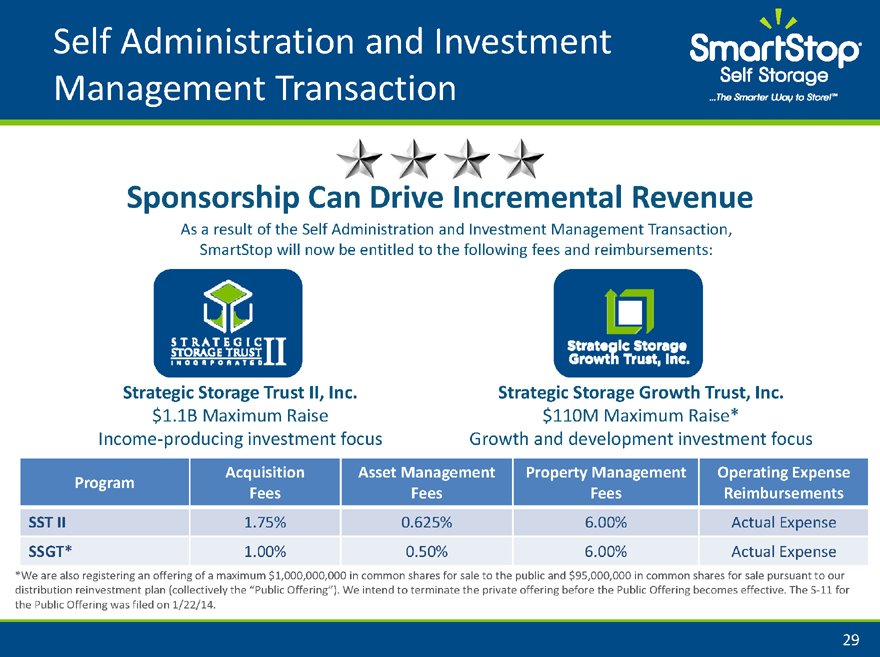
Sponsorship Can Drive Incremental Revenue
As a result of the Self Administration and Investment Management Transaction, SmartStop will now be entitled to the following fees and reimbursements:
Strategic Storage Trust II, Inc. Strategic Storage Growth Trust, Inc.
$1.1B Maximum Raise $110M Maximum Raise*
Income producing investment focus Growth and development investment focus
Program Acquisition Fees Asset Management Fees Property Management Fees Operating Expense Reimbursements
SST II 1.75% 0.625% 6.00% Actual Expense
SSGT* 1.00% 0.50% 6.00% Actual Expense
*We are also registering an offering of a maximum $1,000,000,000 in common shares for sale to the public and $95,000,000 in common shares for sale pursuant to our distribution reinvestment plan (collectively the “Public Offering”). We intend to terminate the private offering before the Public Offering becomes effective. The S 11 for the Public Offering was filed on 1/22/14.
29
Self Administration and Investment Management Transaction
SmartStop’s Unique Opportunity for Growth
SmartStop shareholders participate in more of the future growth of the company, with the elimination of fees
SmartStop shareholders own the SmartStop® brand, which can be expanded through additional acquisitions or 3rd party property management
With self administration, SmartStop is set up to access institutional capital for continued growth
SmartStop shareholders recognize fee revenues from the sponsorship of SST II and SSGT
SmartStop is now the most dynamic self storage platform in America!
30
Self Administration and Investment Management Transaction
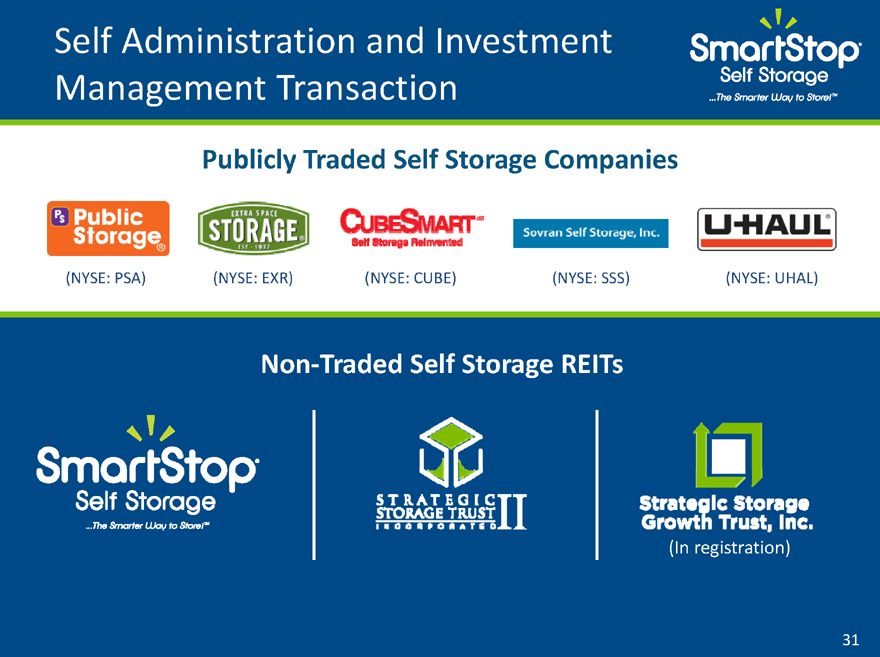
Publicly Traded Self Storage Companies
(NYSE: PSA) (NYSE: EXR) (NYSE: CUBE) (NYSE: SSS) (NYSE: UHAL)
Non Traded Self Storage REITs
(In registration)
31
NOI and MFFO Definition
Net Operating Income (“NOI”)
NOI is a non GAAP measure that we define as net income (loss), computed in accordance with GAAP, generated from properties before corporate general and administrative expenses, asset management fees, interest expense, depreciation, amortization, acquisition expenses and other non property related expenses. We believe that net operating income is useful for investors as it provides a measure of the operating performance of our operating assets because net operating income excludes certain items that are not associated with the operation of the properties. Additionally, we believe that NOI is a widely accepted measure of comparative operating performance in the real estate community. However, our use of the term NOI may not be comparable to that of other real estate companies as they may have different methodologies for computing this amount.
Funds from Operations (“FFO”) and Modified Funds from Operations (“MFFO”)
Due to certain unique operating characteristics of real estate companies, the National Association of Real Estate Investment Trusts, or NAREIT, an industry trade group, has promulgated a measure known as funds from operations, or FFO, which we believe to be an appropriate supplemental measure to reflect the operating performance of a REIT. The use of FFO is recommended by the REIT industry as a supplemental performance measure. FFO is not equivalent to our net income (loss) as determined under GAAP.
We define FFO, a non GAAP measure, consistent with the standards established by the White Paper on FFO approved by the Board of Governors of NAREIT, as revised in February 2004, or the White Paper. The White Paper defines FFO as net income (loss) computed in accordance with GAAP, excluding gains or losses from sales of property and asset impairment writedowns, plus depreciation and amortization, and after adjustments for unconsolidated partnerships and joint ventures. Adjustments for unconsolidated partnerships and joint ventures are calculated to reflect FFO on the same basis. Our FFO calculation complies with NAREIT’s policy described above.
32
NOI and MFFO Definition – Con’t
The historical accounting convention used for real estate assets requires straight line depreciation of buildings and improvements, which implies that the value of real estate assets diminishes predictably over time. Diminution in value may occur if such assets are not adequately maintained or repaired and renovated as required by relevant circumstances or other measures necessary to maintain the assets are not undertaken. However, we believe that, since real estate values historically rise and fall with market conditions, including inflation, interest rates, the business cycle, unemployment and consumer spending, presentations of operating results for a REIT using historical accounting for depreciation may be less informative. In addition, in the determination of FFO, we believe it is appropriate to disregard impairment charges, as this is a fair value adjustment that is largely based on market fluctuations and assessments regarding general market conditions which can change over time. An asset will only be evaluated for impairment if certain impairment indications exist and if the carrying value, or book value, exceeds the total estimated undiscounted future cash flows (including net rental revenues, net proceeds on the sale of the property, and any other ancillary cash flows at a property or group level under GAAP) from such asset. Testing for impairment is a continuous process and is analyzed on a quarterly basis. Investors should note, however, that determinations of whether impairment charges have been incurred are based partly on anticipated operating performance, because estimated undiscounted future cash flows from a property, including estimated future net rental revenues, net proceeds on the sale of the property, and certain other ancillary cash flows, are taken into account in determining whether an impairment charge has been incurred. While impairment charges are excluded from the calculation of FFO as described above, investors are cautioned that due to the fact that impairments are based on estimated future undiscounted cash flows and that we intend to have a relatively limited term of our operations, it could be difficult to recover any impairment charges through the eventual sale of the property. To date, we have not recognized any impairments.
Historical accounting for real estate involves the use of GAAP. Any other method of accounting for real estate such as the fair value method cannot be construed to be any more accurate or relevant than the comparable methodologies of real estate valuation found in GAAP. Nevertheless, we believe that the use of FFO, which excludes the impact of real estate related depreciation and amortization and impairments, assists in providing a more complete understanding of our performance to investors and to our management, and when compared year over year, reflects the impact on our operations from trends in occupancy rates, rental rates, operating costs, general and administrative expenses, and interest costs, which may not be immediately apparent from net income (loss).
33
NOI and MFFO Definition – Con’t
However, FFO or Modified FFO (“MFFO”), discussed below, should not be construed to be more relevant or accurate than the current GAAP methodology in calculating net income (loss) or in its applicability in evaluating our operating performance. The method utilized to evaluate the value and performance of real estate under GAAP should be considered a more relevant measure of operational performance and is, therefore, given more prominence than the non GAAP FFO and MFFO measures and the adjustments to GAAP in calculating FFO and MFFO.
Changes in the accounting and reporting rules under GAAP that were put into effect and other changes to GAAP accounting for real estate subsequent to the establishment of NAREIT’s definition of FFO have prompted an increase in cash settled expenses, specifically acquisition fees and expenses, as items that are expensed as operating expenses under GAAP. We believe these fees and expenses do not affect our overall long term operating performance. Publicly registered, non traded REITs typically have a significant amount of acquisition activity and are substantially more dynamic during their initial years of investment and operation. The purchase of properties, and the corresponding expenses associated with that process, is a key feature of our business plan in order to generate operational income and cash flow in order to make distributions to investors. While other start up entities may also experience significant acquisition activity during their initial years, we believe that publicly registered, non traded REITs are unique in that they typically have a limited life with targeted exit strategies within a relatively limited time frame after the acquisition activity ceases. Our board of directors is in the process of determining which liquidity event, if any, is in the best interests of us and our stockholders (i.e., listing of our shares of common stock on a national securities exchange, a merger or sale, the sale of all or substantially all of our assets, or another similar transaction). We expect to achieve a liquidity event within three years, which is generally comparable to other publicly registered, non traded REITs. Thus, we do not intend to continuously purchase assets and intend to have a limited life. The decision whether to engage in any liquidity event is in the sole discretion of our board of directors. Due to the above factors and other unique features of publicly registered, non traded REITs, the Investment Program Association, or the IPA, an industry trade group, has standardized a measure known as modified funds from operations, or MFFO, which the IPA has recommended as a supplemental measure for publicly registered, non traded REITs and which we believe to be another appropriate supplemental measure to reflect the operating performance of a publicly registered, non traded REIT
34
NOI and MFFO Definition – Con’t
having the characteristics described above. MFFO is not equivalent to our net income (loss) as determined under GAAP, and MFFO may not be a useful measure of the impact of long term operating performance on value if we do not ultimately engage in a liquidity event. We believe that, because MFFO excludes acquisition fees and expenses that affect our operations only in periods in which properties are acquired and that we consider more reflective of investing activities, as well as other non operating items included in FFO, MFFO can provide, on a going forward basis, an indication of the sustainability (that is, the capacity to continue to be maintained) of our operating performance after the period in which we are acquiring our properties and once our portfolio is in place. By providing MFFO, we believe we are presenting useful information that assists investors and analysts to better assess the sustainability of our operating performance now that our offering has been completed. We also believe that MFFO is a recognized measure of sustainable operating performance by the publicly registered, non traded REIT industry. Further, we believe MFFO is useful in comparing the sustainability of our operating performance now that our offering has been completed and we expect our acquisition activity over the near term to be less vigorous, with the sustainability of the operating performance of other real estate companies that are not as involved in acquisition activities. Investors are cautioned that MFFO should only be used to assess the sustainability of our operating performance now that our offering has been completed and we expect our acquisition activity over the near term to be less vigorous, as it excludes acquisition fees and expenses that have a negative effect on our operating performance during the periods in which properties are acquired.
We define MFFO, a non GAAP measure, consistent with the IPA’s Guideline 2010 01, Supplemental Performance Measure for Publicly Registered, Non Listed REITs: Modified Funds from Operations (the “Practice Guideline”) issued by the IPA in November 2010. The Practice Guideline defines MFFO as FFO further adjusted for the following items included in the determination of GAAP net income (loss): acquisition fees and expenses; amounts relating to straight line rents and amortization of above or below intangible lease assets and liabilities; accretion of discounts and amortization of premiums on debt investments; non recurring impairments of real estate related investments; mark to market adjustments included in net income; non recurring gains or losses included in net income from the extinguishment or sale of debt, hedges
35
NOI and MFFO Definition – Con’t
foreign exchange, derivatives or securities holdings where trading of such holdings is not a fundamental attribute of the business plan, unrealized gains or losses resulting from consolidation from, or deconsolidation to, equity accounting, and after adjustments for consolidated and unconsolidated partnerships and joint ventures, with such adjustments calculated to reflect MFFO on the same basis. The accretion of discounts and amortization of premiums on debt investments, unrealized gains and losses on hedges, foreign exchange, derivatives or securities holdings, unrealized gains and losses resulting from consolidations, as well as other listed cash flow adjustments are adjustments made to net income (loss) in calculating cash flows from operations and, in some cases, reflect gains or losses which are unrealized and may not ultimately be realized.
Our MFFO calculation complies with the IPA’s Practice Guideline described above. In calculating MFFO, we exclude acquisition related expenses, the amortization of fair value adjustments related to debt, realized and unrealized gains and losses on foreign exchange holdings and the adjustments of such items related to noncontrolling interests. The other adjustments included in the IPA’s Practice Guideline are not applicable to us for the periods presented. Acquisition fees and expenses are paid in cash by us, and we have not set aside or put into escrow any specific amount of proceeds from our offering to be used to fund acquisition fees and expenses. Acquisition fees and expenses include payments to our Advisor and third parties. Acquisition related expenses under GAAP are considered operating expenses and as expenses included in the determination of net income (loss) and income (loss) from continuing operations, both of which are performance measures under GAAP. All paid and accrued acquisition fees and expenses will have negative effects on returns to investors, the potential for future distributions, and cash flows generated by us, unless earnings from operations or net sales proceeds from the disposition of other properties are generated to cover the purchase price of the property, these fees and expenses and other costs related to such property. In the future, if we are not able to raise additional proceeds from our distribution reinvestment plan offering or other potential offerings, this could result in us paying acquisition fees or reimbursing acquisition expenses due to our Advisor, or a portion thereof, with net proceeds from borrowed funds, operational earnings or cash flows, net proceeds from the sale of properties, or ancillary cash flows. As a result, the amount of proceeds available for investment and operations would be reduced, or we may incur additional interest expense as a result of borrowed funds
36
NOI and MFFO Definition – Con’t
Further, under GAAP, certain contemplated non cash fair value and other non cash adjustments are considered operating non cash adjustments to net income (loss) in determining cash flows from operations. In addition, we view fair value adjustments of derivatives and the amortization of fair value adjustments related to debt as items which are unrealized and may not ultimately be realized or as items which are not reflective of on going operations and are therefore typically adjusted for when assessing operating performance.
We use MFFO and the adjustments used to calculate it in order to evaluate our performance against other publicly registered, non traded REITs which intend to have limited lives with short and defined acquisition periods and targeted exit strategies shortly thereafter. As noted above, MFFO may not be a useful measure of the impact of long term operating performance if we do not continue to operate in this manner. We believe that our use of MFFO and the adjustments used to calculate it allow us to present our performance in a manner that reflects certain characteristics that are unique to publicly registered, non traded REITs, such as their limited life, limited and defined acquisition period and targeted exit strategy, and hence that the use of such measures may be useful to investors. For example, acquisition fees and expenses were intended to be funded from the proceeds of our offering and other financing sources and not from operations. By excluding expensed acquisition fees and expenses, the use of MFFO provides information consistent with management’s analysis of the operating performance of the properties. Additionally, fair value adjustments, which are based on the impact of current market fluctuations and underlying assessments of general market conditions, but can also result from operational factors such as rental and occupancy rates, may not be directly related or attributable to our current operating performance. By excluding such charges that may reflect anticipated and unrealized gains or losses, we believe MFFO provides useful supplemental information.
37
NOI and MFFO Definition – Con’t
Presentation of this information is intended to provide useful information to investors as they compare the operating performance of different REITs, although it should be noted that not all REITs calculate FFO and MFFO the same way, so comparisons with other REITs may not be meaningful. Furthermore, FFO and MFFO are not necessarily indicative of cash flow available to fund cash needs and should not be considered as an alternative to net income (loss) or income (loss) from continuing operations as an indication of our performance, as an alternative to cash flows from operations, which is an indication of our liquidity, or indicative of funds available to fund our cash needs including our ability to make distributions to our stockholders. FFO and MFFO should be reviewed in conjunction with other measurements as an indication of our performance. MFFO may be useful in assisting management and investors in assessing the sustainability of operating performance in future operating periods, and in particular, after the offering and acquisition stages are complete and net asset value is disclosed. FFO and MFFO are not useful measures in evaluating net asset value because impairments are taken into account in determining net asset value but not in determining FFO and MFFO.
38
Questions?