 Institutional Investor Meetings May 2011 Exhibit 99.1 |
 May 2011 2 Cautionary Statement Concerning Forward-Looking Statements Certain statements in this presentation are forward-looking statements within the meaning of the safe harbor provisions of the Private Securities Litigation Reform Act of 1995. These forward-looking statements are predictions based on our current expectations and assumptions regarding future events and may relate to, among other things, our future financial performance, including return on equity performance, our growth and portfolio optimization strategies, our projected capital expenditures and related funding requirements, our ability to repay debt, our ability to finance current operations and growth initiatives, the impact of legal proceedings and potential fines and penalties, business process and technology improvement initiatives, trends in our industry, regulatory or legal developments or rate adjustments. Actual results could differ materially because of factors decisions of governmental and regulatory bodies, including decisions to raise or lower rates; the timeliness of regulatory commissions’ actions concerning rates; changes in laws, governmental regulations and policies, including environmental, health and water quality and public utility regulations and policies; weather conditions, patterns or events, including drought or abnormally high rainfall; changes in customer demand for, and patterns of use of, water, such as may result from conservation efforts; significant changes to our business processes and corresponding technology; our ability to appropriately maintain current infrastructure; our ability to obtain permits and other approvals for projects; changes in our capital requirements; our ability to control operating expenses and to achieve efficiencies in our operations; our ability to obtain adequate and cost-effective supplies of chemicals, electricity, fuel, water and other raw materials that are needed for our operations; our ability to successfully acquire and integrate water and wastewater systems that are complementary to our operations and the growth of our business or dispose of assets or lines of business that are not complementary to our operations and the growth of our business; cost overruns relating to improvements or the expansion of our operations; changes in general economic, business and financial market conditions; access to sufficient capital on satisfactory terms; fluctuations in interest rates; restrictive covenants in or changes to the credit ratings on our current or future debt that could increase our financing costs or affect our ability to borrow, make payments on debt or pay dividends; fluctuations in the value of benefit plan assets and liabilities that could increase our cost and funding requirements; our ability to utilize our U.S. and state net operating loss carryforwards; migration of customers into or out of our service territories; difficulty in obtaining insurance at acceptable rates and on acceptable terms and conditions; the incurrence of impairment charges ability to retain and attract qualified employees; and civil disturbance, or terrorist threats or acts or public apprehension about future disturbances or terrorist threats or acts. Any forward-looking statements we make, speak only as of the date of this presentation. Except as required by law, we do not have any obligation, and we specifically disclaim any undertaking or intention, to publicly update or revise any forward-looking statements, whether as a result of new information, future events, changed circumstances or otherwise. |
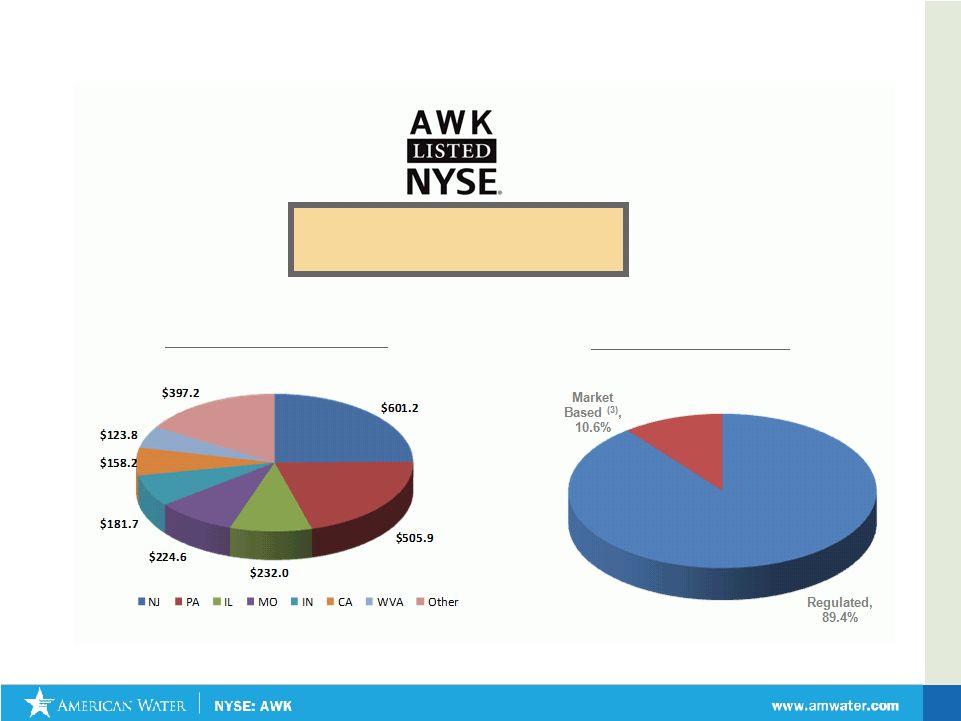 May 2011 American Water: The Premier Water Services Provider in North America Geographic Diversity (1) Business Diversity (1) Market Cap: $5.2 Billion Enterprise Value: $10.8 Billion Average Volume Traded: 1.1 Million shares (1) 2010 Revenues (2) Market data as of 4/29/11 (3) Market-Based includes Other 3 |
 The US Water Industry |
 May 2011 The U.S. Water Industry 5 Aging Infrastructure Fragmented Industry Increasing Environmental Requirements Capital Availability Technology Key Water Sector Themes |
 May 2011 6 Water Industry Has a Favorable Utility Profile Water Utility Characteristics Implications • Capital projects focused on maintaining public health & safety standards • Regulators supportive of prudent projects • Water bills low portion of household budget • Essential product – no substitutes • Demand is more price inelastic than electric or gas • Raw input costs (i.e. water and chemicals) less volatile than other utility commodity costs (i.e. coal and natural gas) • More stable rates for customers • Cost forecasting and regulatory lag is more manageable • M&A primarily small tuck-ins enabling targets to meet health & safety standards • Regulators generally support the strengthening of water systems via M&A • Water storage more feasible and cheaper than electricity or gas storage • Water utilities can be more cost efficient and responsive to demand fluctuations • Large water utilities diversified across multiple geographies • Mitigates impact of localized severe weather conditions / regulatory outcomes |
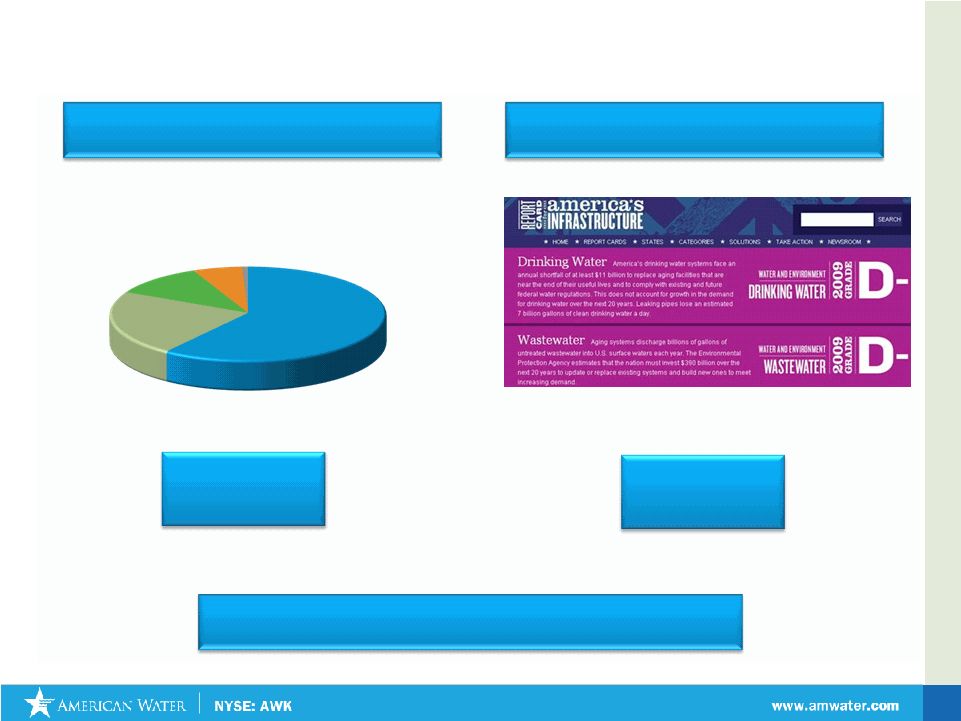 May 2011 Aging US Infrastructure Investment Remains Critical *Source: U.S. Environmental Protection Agency’s 2007 Drinking Water Infrastructure Needs Survey and Assessment. In billions, adjusted to January 2007 dollars. US EPA Estimated 20 Year Total Needs of US Public Water Systems* American Society of Civil Engineers (ASCE) grades US infrastructure • 2009: $335 billion • 2005: $277 billion • 2002: $154 billion • 2009 Grade: D- • 2005 Grade: D- • 2001 Grade: D Transmission & Distribution: $200.8 Treatment: $75.1 Storage: $36.9 Source: $19.8 Other: $2.3 Total: $334.8 Billion US EPA estimates upwards to $1 trillion needed for public water and wastewater systems** 7 **Source: 2002 U.S. Environmental Protection Agency Clean Water and Drinking Water Gap analysis |
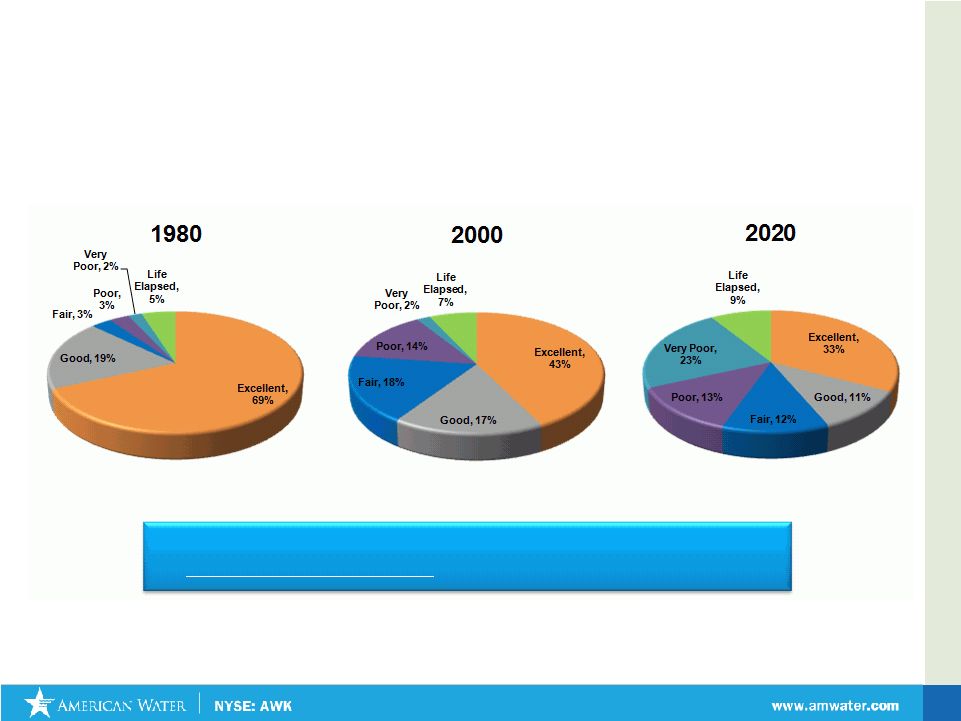 Without renewal or replacement of existing systems, pipe classified as poor, very poor or life elapsed will increase from 10% to 44% by 2020 Aging Pipe Infrastructure Network Propels Need for Capital Expenditures Percentage of Pipes by Classification Source: American Water Works Association, Dawn of the Replacement Era: Reinvesting in Drinking Water Infrastructure, May 2001 8 May 2011 |
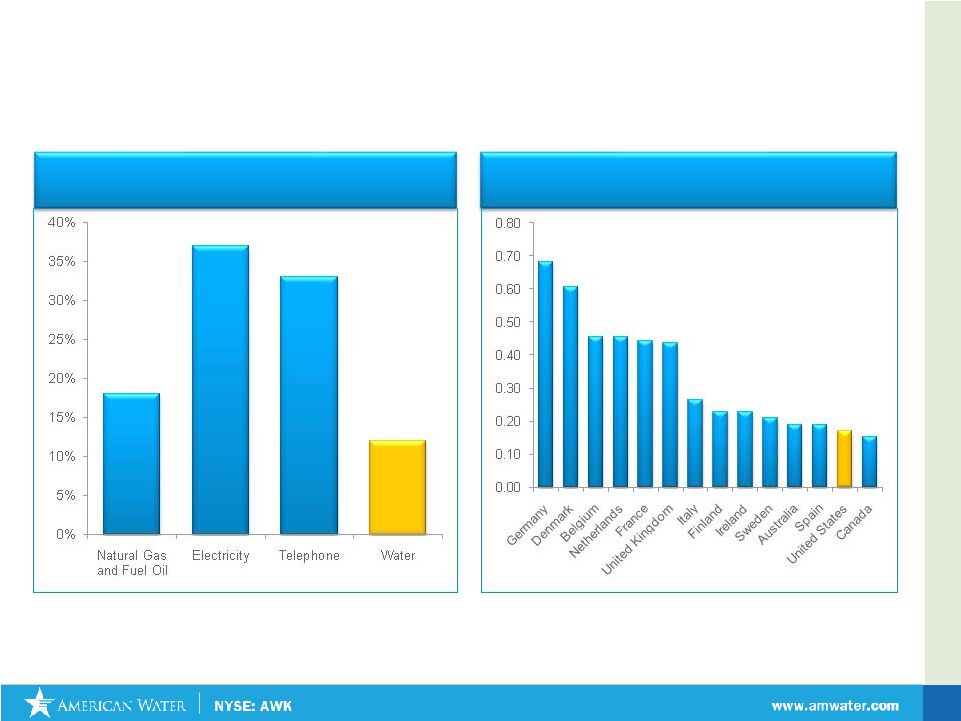 May 2011 9 Water and wastewater rates in U.S. vs. other countries (cents per gallon) (1) Source: 2008-2009 Bureau of Labor Statistics; Assumes four person household. (2) Canadian government data, using standard business conversions Domestically: % of Annual Household Budget (1) Internationally: Cost comparison vs other countries (cents per gallon (2) ) |
 American Water |
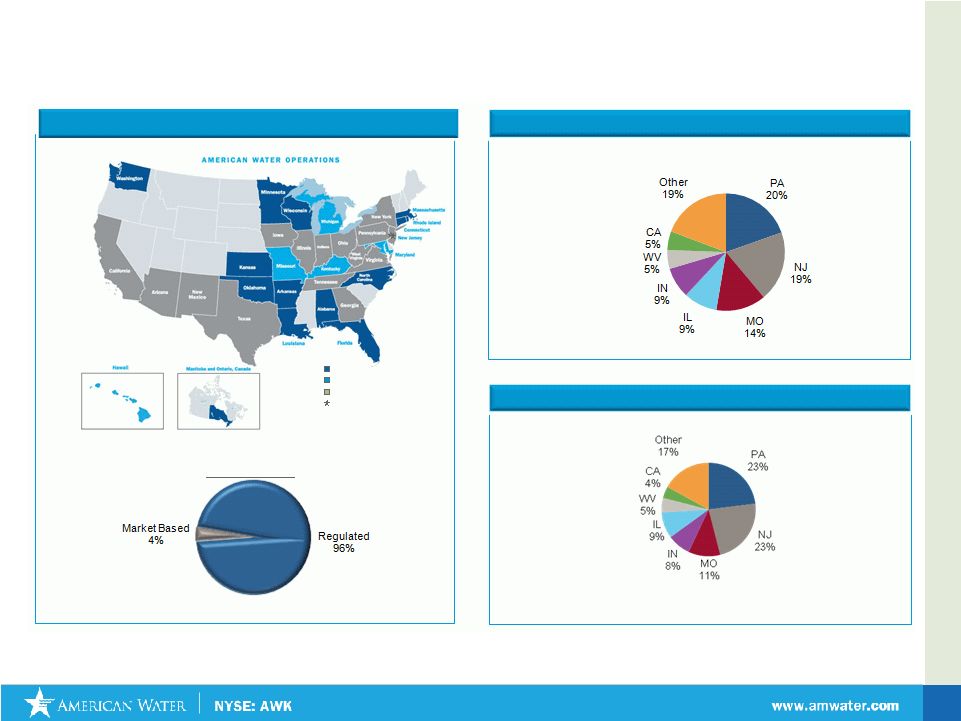 May 2011 11 Total = 3,335,518 Regulated Market Based Both Corporate headquarters 2010 EBIT Total = $748 million Total = $11.1 billion American Water’s Regulated Portfolio Net Utility Plant Regulated Customers American Water’s Geographic Presence Regulated operations in AZ, NM and TX are subject to agreement of sale. |
 May 2011 12 American Water: Providing Value to Customers, Employees and Shareholders Operational Excellence Employer of Choice Sustainability Customer Focus Regulatory & Public Policy Targeted Growth American Water provides value-added products and services that address customers’ needs Investor Driven Customer Driven Value Price Cost |
 May 2011 • Earn appropriate return on investments • Promote constructive regulatory frameworks • Grow Regulated Businesses through focused acquisitions • Pursue “regulated-like” opportunities • Focus on Operations Efficiencies Goals Actions Regulated Operations & Support • Invest in states where we can add value to customers and generate an appropriate return • Move from “Rate Case Catchup” to “Regulatory Strategy” • Drive Operational Excellence Market Based Operations • Regulated-Like • Value-Added Services Future Pursuits • Disciplined pursuit of growth through acquisitions and applying technological expertise Strategy Specifics 13 |
 May 2011 American Water’s Portfolio Optimization Initiatives Continue to Lower Costs Focus on Value Drivers Optimizing Long-term Value Through Proactive Management Redeploy Value Into Core Growth Markets • Balanced Portfolio Analysis • Focus Achieving Authorized Rates of Return • Monetize Non-Producing Assets • Focused Capital Resources • Selective Acquisition Opportunities • Leverage Internal Growth Explore Opportunities for Long-Term Success Drive Profitability and Returns 14 |
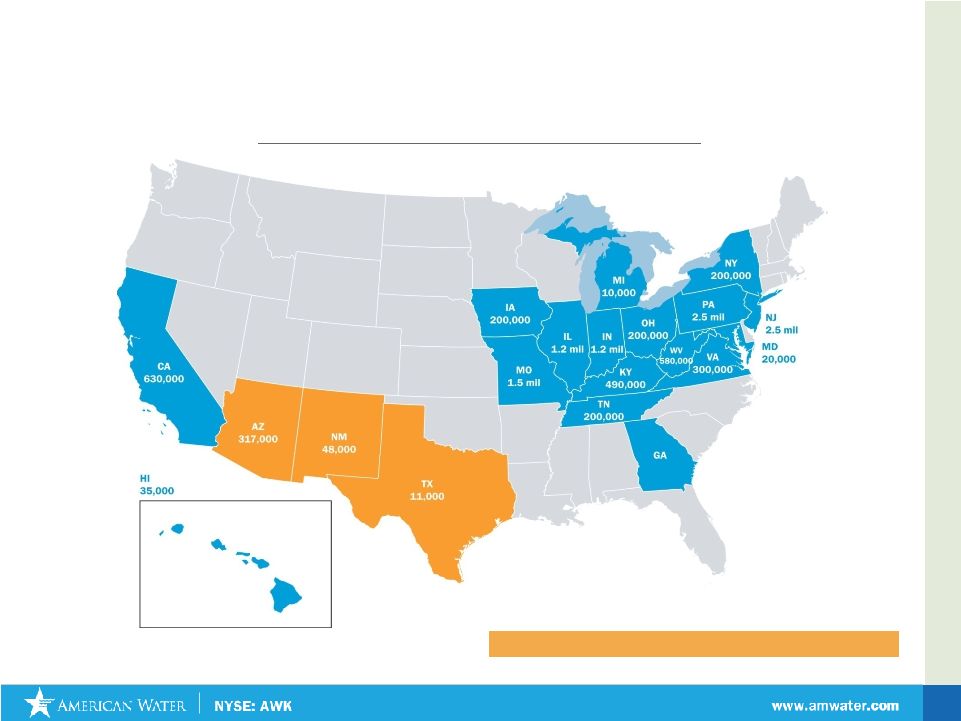 May 2011 May 2011 15 Strategy Specifics: Regulated Operations - Invest in states where we can add value American Water Regulated Operations: Population Served States we are in process of exiting thru Portfolio Optimization 32,000 * 2009 Data |
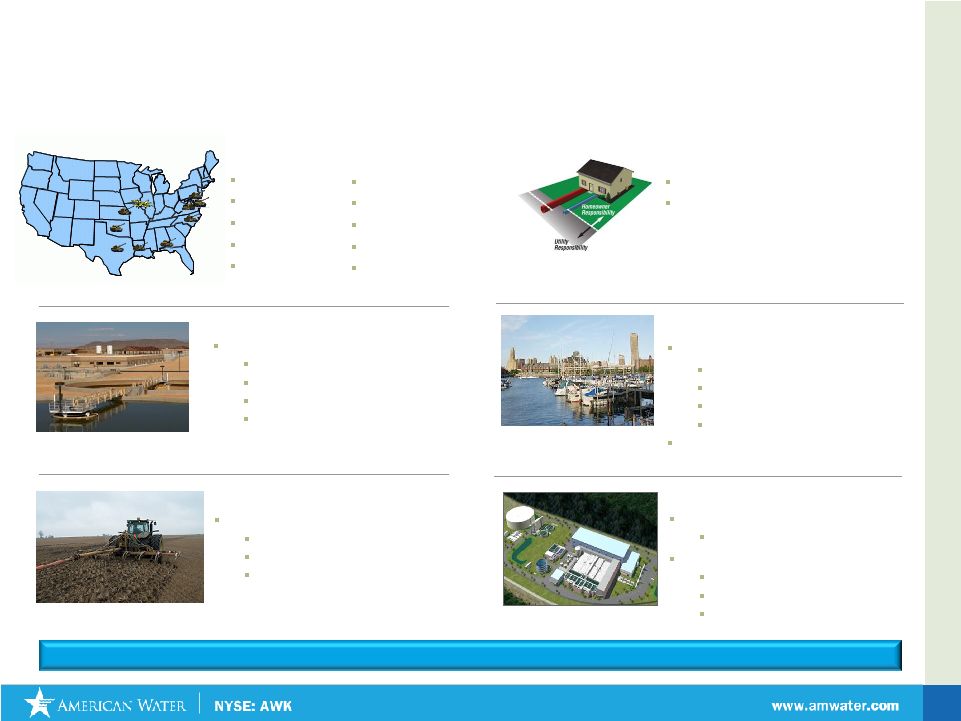 May 2011 16 Our Market-Based Operations: A Portfolio of Water Resource Services For 2010, American Water reported $311.8 million of Market-Based Operations revenues Contract Operations Over 200 contracts** Serving 3.1m people Clarksville, IN Seattle, WA Warren Township, NJ 25 industrial contracts Design, Build and Operate 20 current projects* Lake Pleasant Plant, AZ Fillmore, CA Carnegie Abbey, RI Seattle, WA *Includes 16 AWM projects **Includes 137 AWM and 48 EMC projects Military Bases Privatization Fort Bragg, NC Fort Sill, OK Fort Rucker, AL Fort AP Hill, VA Scott AFB, IL Fort Polk, LA Fort Hood, TX Fort Belvoir, VA Fort Meade, MD Fort Leavenworth, KS Biosolids Management Canada Halton, ON Niagara, ON Hamilton, ON Emerging Water Technologies Desalination plant Tampa Bay Seawater, FL Water Reuse; 22 Projects; 7 States Gillette Stadium, MA Battery Park, NY Butterball Turkey, NC Homeowner Services Over 870,000 contracts 17 States |
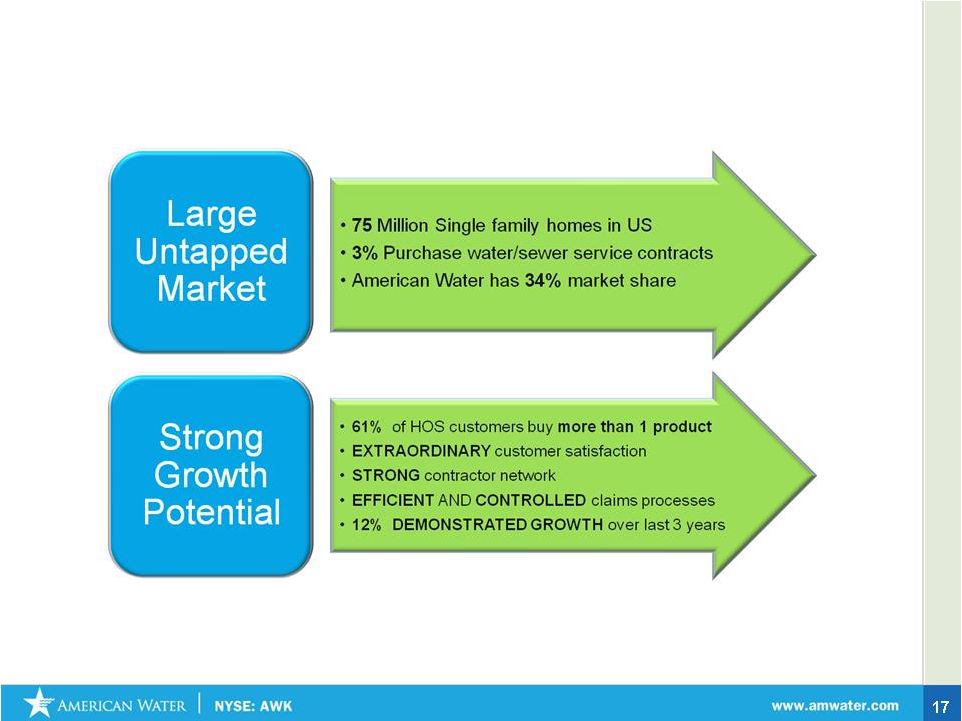 May 2011 May 2011 17 Strategy Specifics: Homeowner Services Growth |
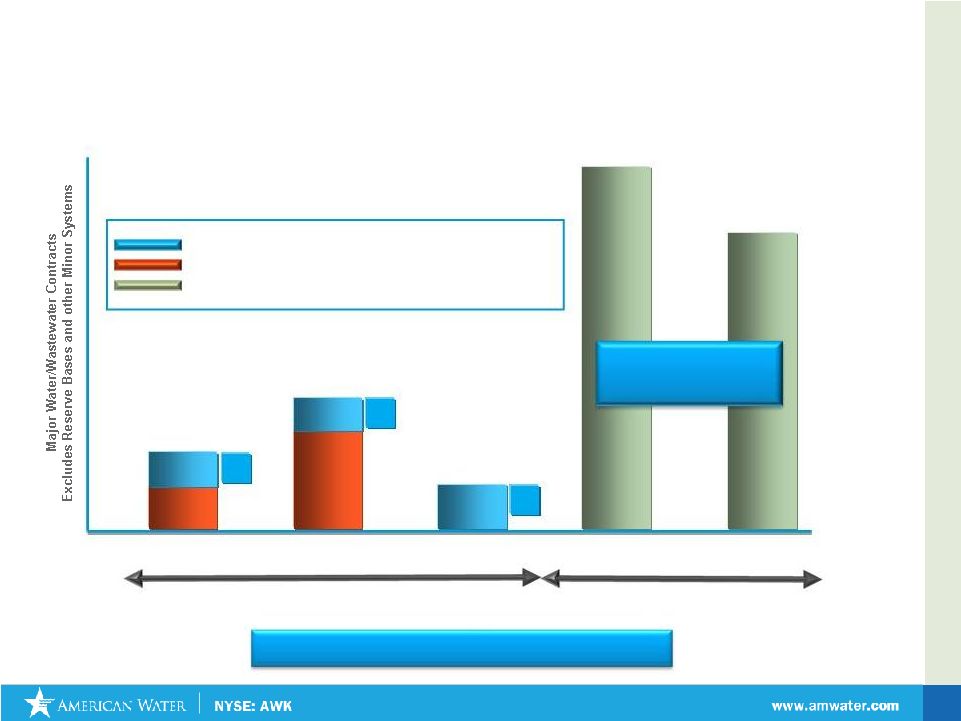 May 2011 May 2011 18 Strategy Specifics: Market Size of Military Utility Privatizations 2011-13 2014-16 Major Water/Wastewater Contracts to be Awarded Contracts Awarded to American Water Contracts Awarded to Competitors Contracts Programmed by Dept. of Defense for Award 2002 2005-07 2008-10 Major Water/Wastewater Awards to Date 7 12 4 Over $2 Billion in Revenues Backlog Market Opportunity represents approximately $11Bn in Total Revenues 3 3 4 |
 May 2011 May 2011 19 • Shorter Term Contracts • Heavy Competition • High Risk • Low Margin • Resource Intensive • Minimal Scalability Strategy Specifics – Municipal Contract Operations The Current Model • Longer Term Contracts • Form of Public Private Partnership • Shared Risk • Performance Metrics • Price Redetermination • Priority of Payment Our Value Model |
 Financial Update |
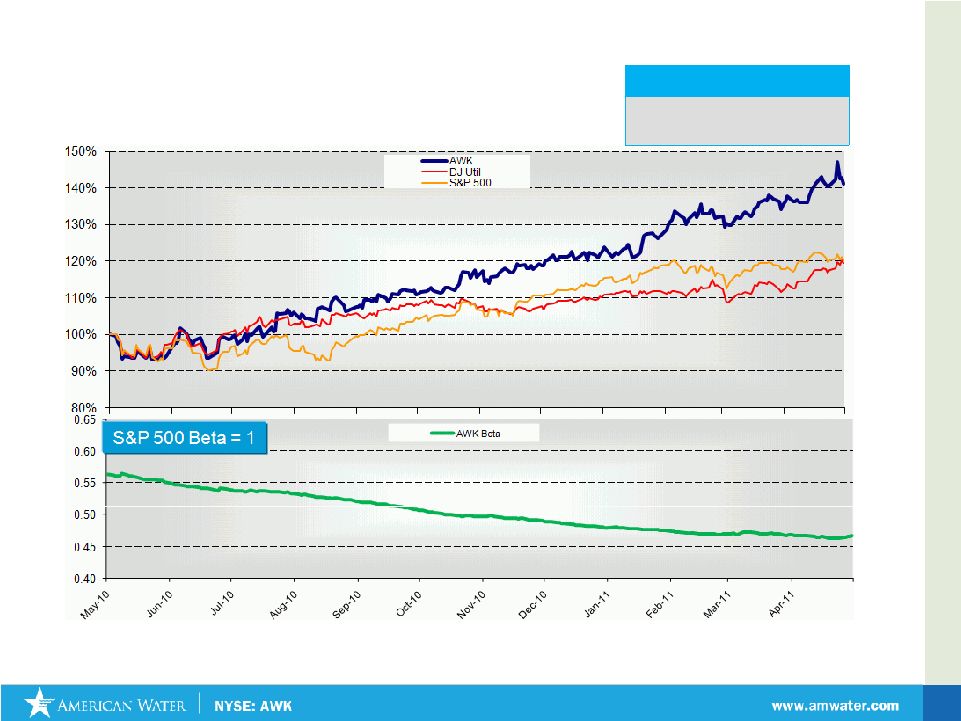 May 2011 Price as a percent of base (May14, 2010 = 100%) Source: Thomson Reuters Total Shareholder Return : American Water vs. Indices (May 14, 2010 – May 13, 2011) 21 Shareholder Return YTD American Water S&P 500 Dow Jones Utilities +41.1% +20.2% +19.5% |
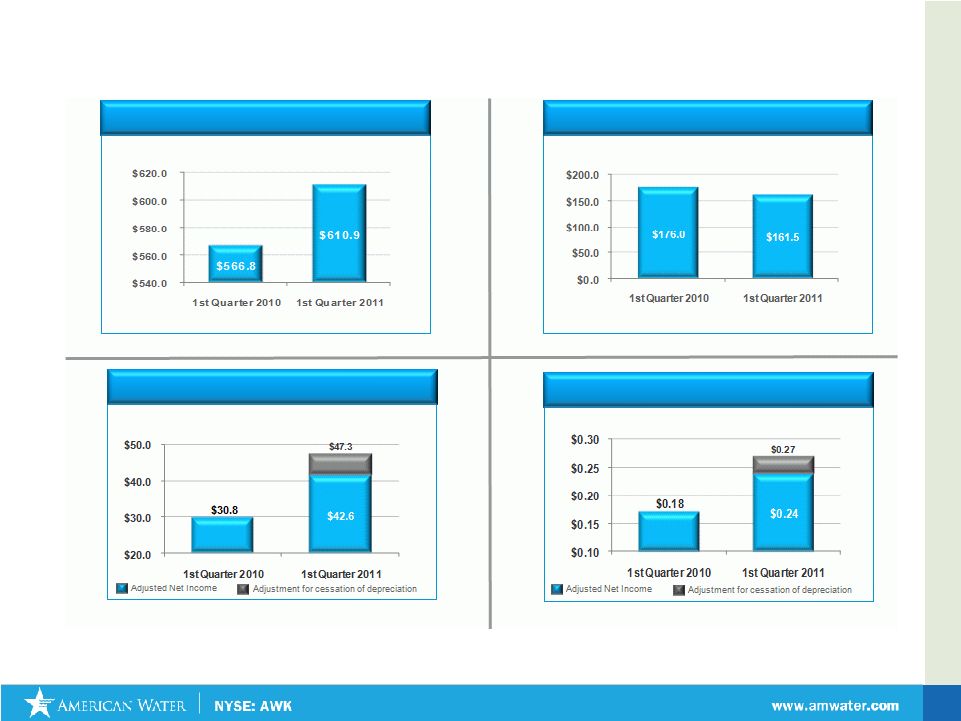 May 2011 American Water: A Solid First Quarter *Adjusted Net Income includes the cessation of depreciation would have been $4.7 million after tax, or $0.3 per share on assets under agreement for sale - Non-GAAP measure. See table in Appendix. 22 Cash Flow From Operations (in millions) Net Income* (in millions) Operating Revenues (in millions) Earnings Per Share* |
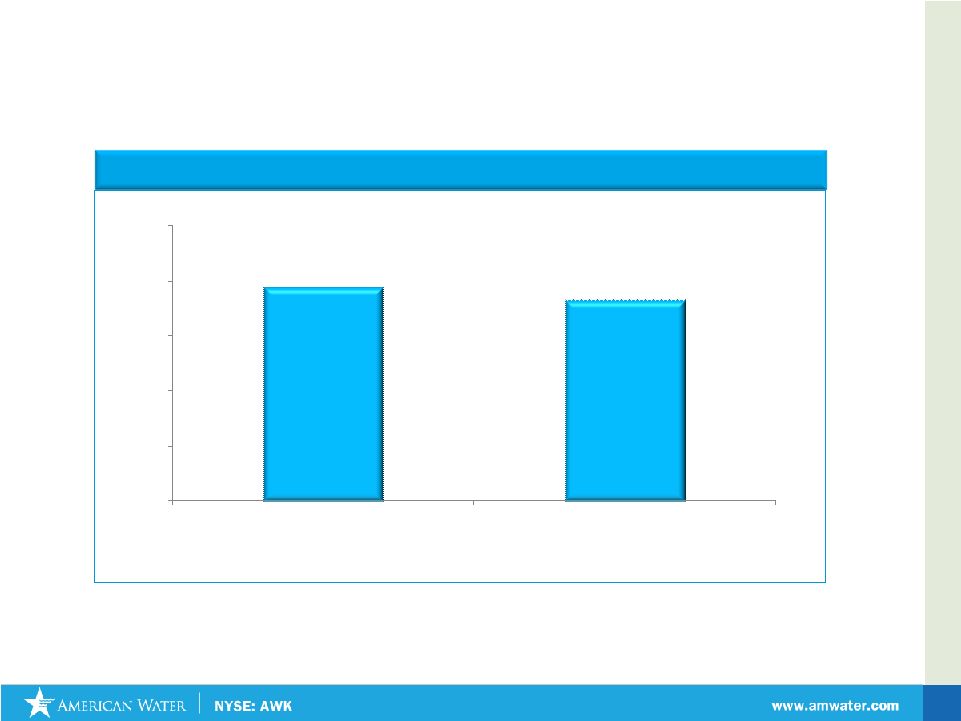 May 2011 23 Adjusted O & M Efficiency Ratio 49.4% 48.2% 30% 35% 40% 45% 50% 55% 3/31/2010 3/31/2011 Regulated O&M Efficiency Ratio Continues to Improve O&M Efficiency Ratio (A Non-GAAP, unaudited measure) = operating and maintenance expenses / revenues, adjusted for purchased water . March 31, 2011 quarterly data reflects the effect of discontinued operations. (See table in Appendix). |
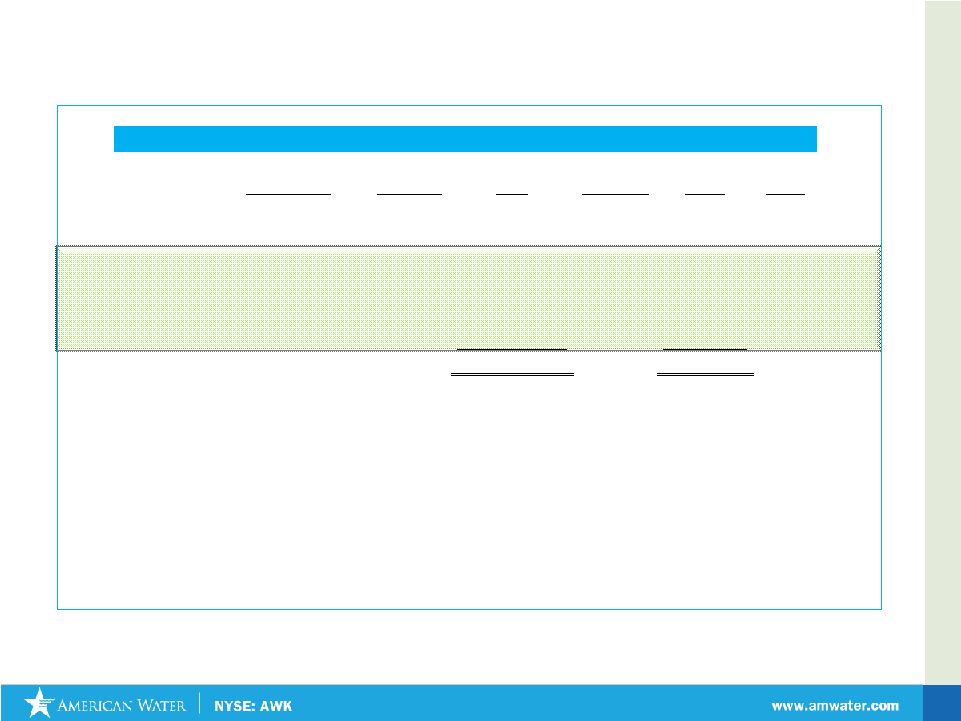
  May 2011 24 Rate Cases Awarded That Will Have an Impact on 2011 Results (As of May 24) Annualized ($ in millions) Effective Date ROE Increase to for new rates Granted Revenue General Rate Cases: Illinois 4/23/2010 10.38% $41.4 New Mexico (Edgewood) 5/10/2010 10.00% 0.5 Indiana 5/3/2010 10.00% 31.5 Virginia (Eastern) 5/8/2010 10.50% 0.6 Ohio 5/19/2010 9.34% 2.6 Missouri 7/1/2010 10.00% 28.0 California (Sac, LA, Lark) 7/1/2010 10.20% 14.6 Michigan 7/1/2010 10.50% 0.2 Kentucky 10/1/2010 9.70% 18.8 New Jersey 1/1/2011 10.30% 39.9 Pennsylvania Wastewater 1/1/2011 10.60% 8.4 Arizona (Anthem, etc.) 1/1/2011 9.50% 14.7 Tennessee 4/5/2011 10.00% 5.6 West Virginia 4/19/2011 9.75% 5.1 Subtotal - General Rate Cases $211.9 Infrastructure Charges: Pennsylvania 16.2 Indiana 5.4 Illinois 1.7 Missouri 3.6 Other 0.5 Subtotal - Infrastructure Charges $27.4 Total $239.3 |
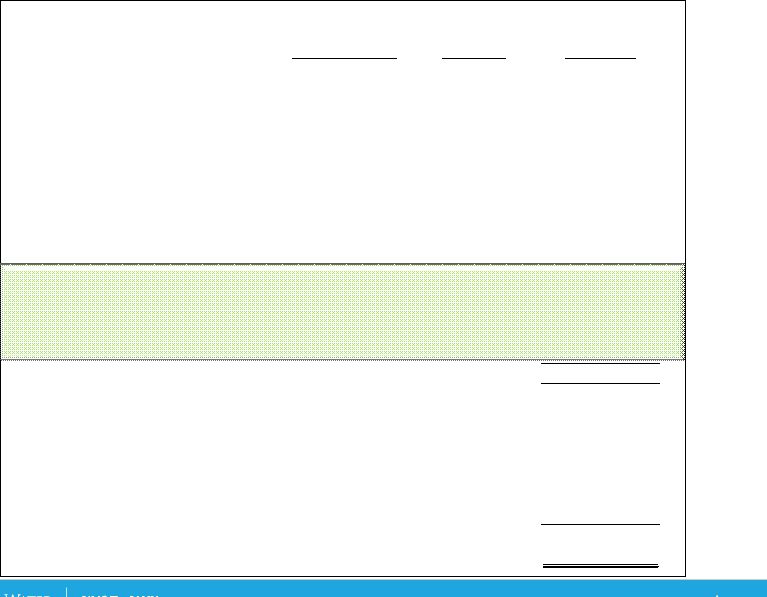
 May 2011 General Rate Cases Awaiting Final Order as of May 18, 2011 Docket / Revenue Increase ROE Rate Base Filing Case Number Date Filed Filed Requested (Filed) Status Virginia* Case No. PUE 2010-00001 03/08/10 6.9 $ 11.50% 99.1 $ 5 California Case No. A 10-07-007 07/01/10 37.3 10.20% 409.6 3 Arizona W-01303A-10-0448 11/03/10 20.8 11.50% 148.9 2 Hawaii Case No. 2010-0313 02/22/11 1.8 11.85% 25.2 1 Pennsylvania Case No. R-2011-2232243 04/29/11 70.7 11.50% 2,096.2 1 New York Case No. 11-W-0200 04/29/11 9.6 11.50% 126.9 1 Iowa Case No. RPU-2011-0001 04/29/11 5.1 11.35% 88.9 1 Indiana Case No. 44022 05/02/11 20.4 11.50% 733.4 2 New Mexico Case No. 11-00196-UT 05/18/11 2.6 11.75% 33.6 1 Total 175.2 $ 3,761.8 $ * Final Order not yet issued. Interim rates are in effect Note: Above excludes rate case file in 2007 for Hawaii for which interim rates have been in effect since October 2008 Index of Rate Case Status 1 - Case Filed 2 - Discovery (Data Requests, Investigation) 3 - Negotiations / Evidentiary Hearings / Briefings 4 - Recommended order issued / settlement reached, without interim rates 5 - Interim rates in effect, awaiting final order 6 - Final order issued Rate Cases Awaiting Final Order 25 |
 May 2011 May 2011 Capital Expenditure Plan, by Asset Type: 2011-2013 * includes Business Transformation capital spend • $800 - $1 Billion in Capex to be spent each year for the foreseeable future • 20% of Capital Expenditures qualify for an Infrastructure Surcharge mechanism 26 |
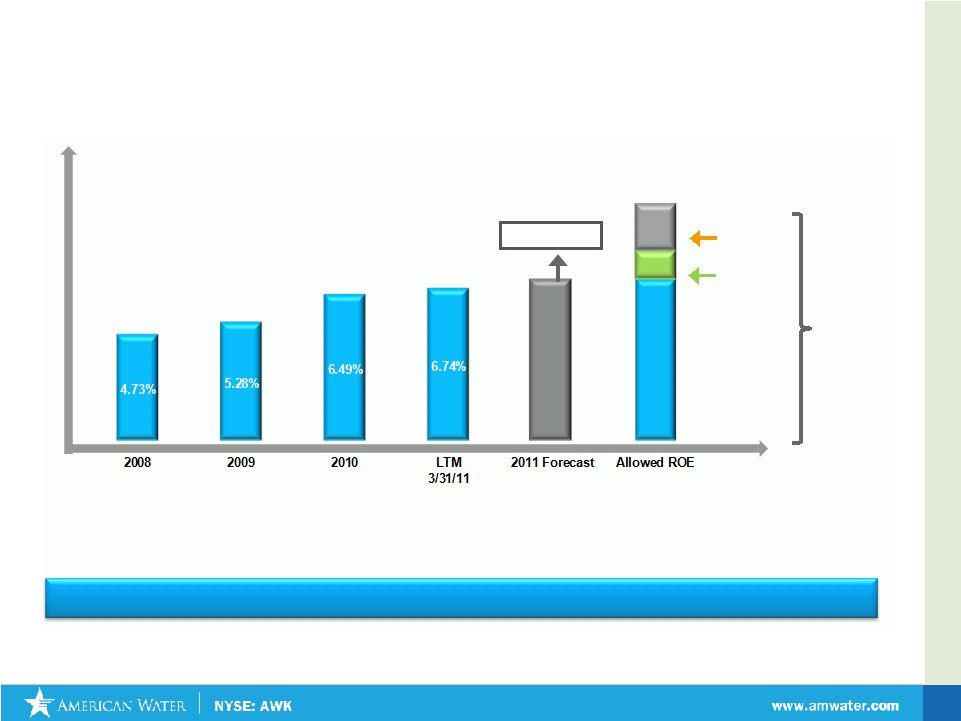 May 2011 May 2011 27 On May 24, 2011 American Water Affirms Earnings Per Share Guidance Expectations 10 % - 10.5 % ROE (3) 6.8% - 7.2% 1.1% Parent Co. Debt Opportunity American Water continues to close ROE Gap (2) 1. ROE calculation excludes impairment , SOX, divestiture and other 2. Adjusted for cessation of depreciation associated with assets of discontinued operations 3. Range of allowed ROE 4. 2011 forecast ROE corresponds to current 2011 earnings per share guidance 5. Parent company debt as of March 31, 2011 Note: Changes in events, or circumstances beyond the Company’s control or that it cannot anticipate could materially impact the EPS guidance and could result in actual results being significantly above or below this outlook. Investors are advised to review the risk factors in the Company’s 10-K and other filed financial documents when making investment decisions |
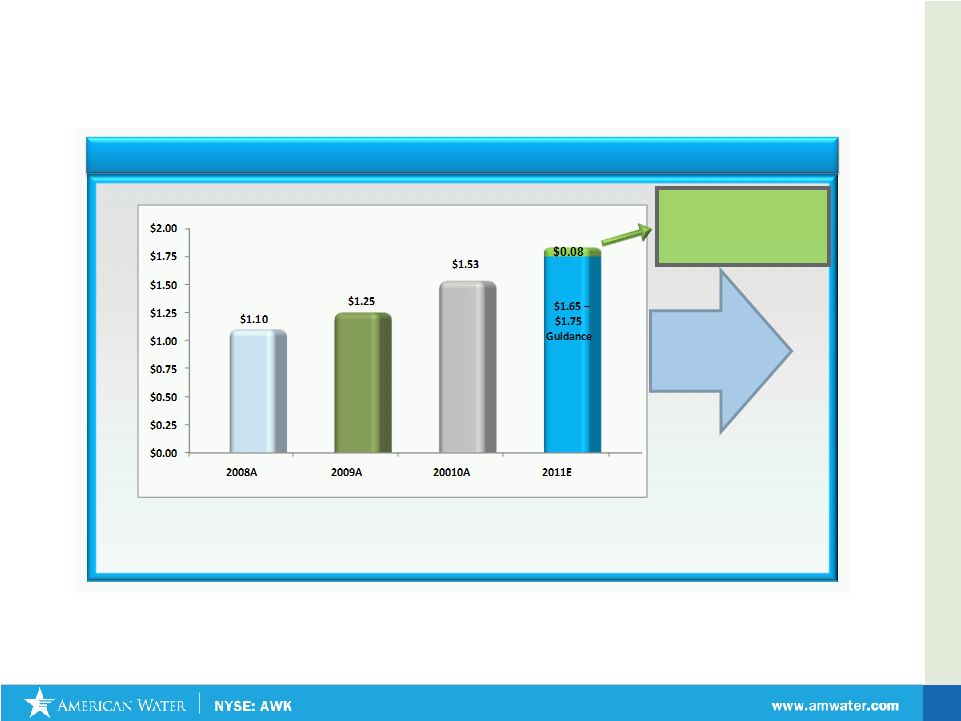 May 2011 Earnings Per Share *2008 and 2009 EPS have been adjusted for goodwill impairment charge, Non-GAAP numbers. See reconciliation table in the Appendix. On May 24, 2011 American Water Reaffirms 2011 Annual EPS Guidance Guidance (Represented in Blue) Excludes Estimated $0.08 Benefit Related to the Cessation of Depreciation for Discontinued Operations 28 Note: Changes in events, or circumstances beyond the Company’s control or that it cannot anticipate could materially impact the EPS guidance and could result in actual results being significantly above or below this outlook. Investors are advised to review the risk factors in the Company’s 10-K and other filed financial documents when making investment decisions 7% - 10% Long –Term EPS Growth Target |
 May 2011 May 2011 125 years Investing in Water Infrastructure and paying Dividends to Shareholders Dividend paid to private holders American Water Listed on NYSE – Dividend paid to common shareholders RWE takes AWK private. Dividend paid to shareholder AWK IPO Lists on NYSE. Pays dividends to common shareholders Watermain work in Pennsylvania. in the early 1900’s Infrastructure improvement in New Jersey in 2009 29 1886 1947 2003 2008 |
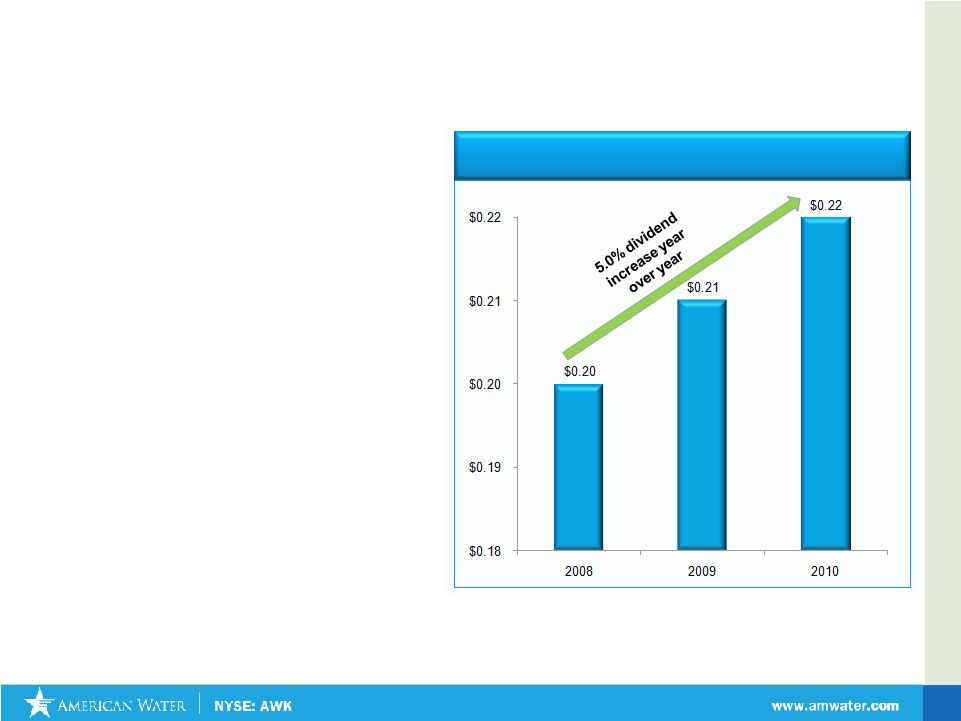 May 2011 May 2011 Recent Dividend History • Key component of American Water’s total shareholder return proposition • Dividend Growth – Board of Directors increased dividend 5% to $0.22 or $0.88 annualized • Dividend Yield – 3.0% at 5/13/11 • Growth in Dividend reflects growth in Net Income 30 Quarterly Dividend Rate as of Year-end |
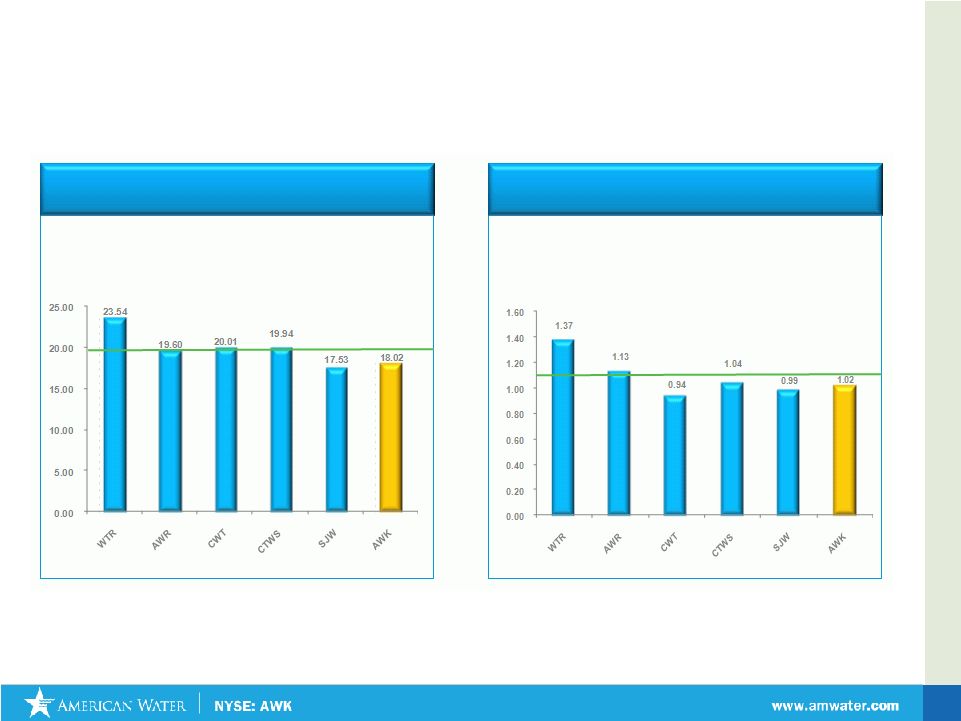 May 2011 May 2011 *Data from Bloomberg Data Systems . Close price 5/13/11 unless otherwise indicated; trailing twelve months diluted GAAP EPS as of 3/31/2011 American Water – A Compelling Value 31 AW Stock Price at Average PE: $32.23 AW Stock Price at Highest PE: $38.36 AW Stock Price at Average EV/Net PP&E: $33.15 AW Stock Price at Highest EV/Net PP&E: $50.66 Average Average P/E Ratio Enterprise Value* / Net PP&E* |
 May 2011 What to Expect from American Water - 2011 Accomplishments Start execution of Portfolio Optimization Initiative Resolve Rate Cases worth $93 MM of filed Annualized Revenues by December 31, 2011 Initiate state specific efforts to address declining usage Continue reduction in Operating Efficiency Ratio Increase Earned return on equity Expand Market Based businesses with focus on Homeowner Services & Military Contract Operations Optimize Municipal Contract Operations Business Model 32 Missouri acquisition closed May 17, Texas sale expected to close by June-July 2011 Filed for regulatory approvals for transactions in NM and AZ Finalized Tennessee and West Virginia Rate Cases Addressed in rate cases filed in Iowa, Long Island, Pennsylvania, and Indiana Operating Efficiency Ratio improved 120 bps in the first quarter 2011 vs. first quarter 2010, an improvement of 2.5% ROE increased 39 bps or 6% over comparable last twelve months ending March 31, 2011 Homeowner Services entered into the Commercial Market |
 May 2011 American Water – A Compelling Value Value Proposition Market Leader Strong Visible Growth Proven Management Trades at Discount to Peers Sound Regulatory Framework 33 |
 May 2011 Investor Relations Contacts: Ed Vallejo Vice President – Investor Relations Edward.vallejo@amwater.com Muriel Lange Manager – Investor Relations Muriel.lange@amwater.com Tel: 856-566-4005 Fax: 856-782-2782 34 |
 Appendix |
 May 2011 Our Values • Honesty and Integrity • Communication •Teamwork • Excellence • Engagement Our Mission Our Vision To be the trusted steward of your precious resource – water What We Stand For 36 • Providing safe, reliable water services to our customers and communities • Driving Operational Excellence • Enabling employees to innovate • Ensuring long-term stewardship of all resources • Engaging customers, regulators and other constituencies in solving critical water issues • Earning a fair return for our shareholders |
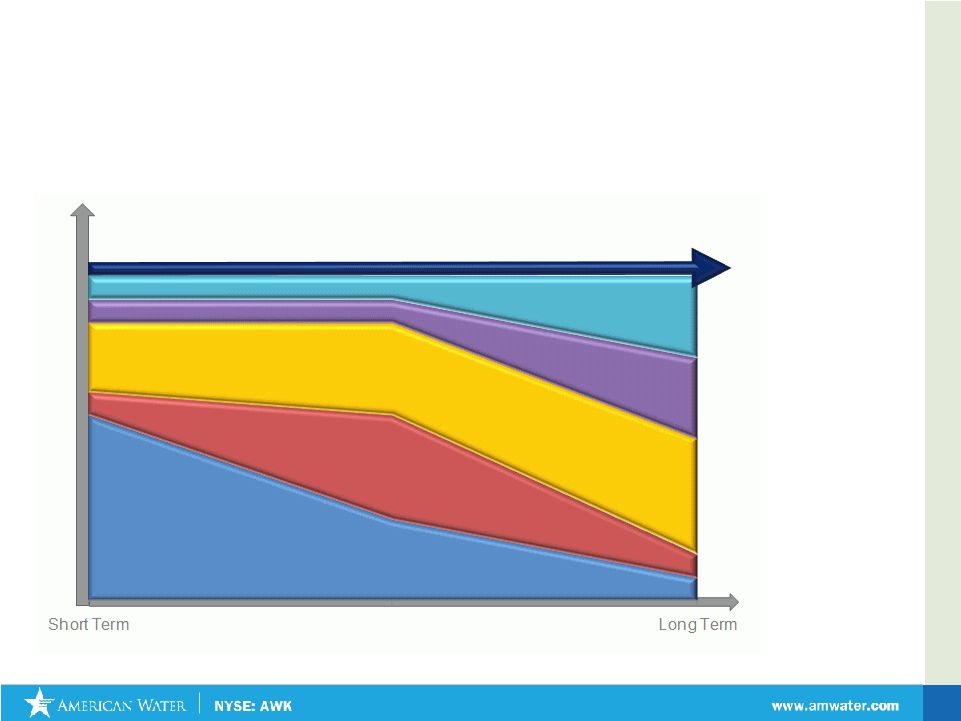 May 2011 37 Investment Thesis: Sustained 7-10% EPS Growth Future Growth New Services Regulated Investments Acquisitions Operational Excellence/ Efficiencies ROE improvement Long Term Growth Conceptual Representation |
 May 2011 Issue Name Issue Type Call Feature Borrower Type Underwriter Coupon Maturity Issue Date $25.0M Tax-Exempt Unsecured Bonds Tax-exempt (Non AMT) Callable 10 Year AWCC/IL New Stifel Nicolaus & Blaylock Robert Van 5.25% 30 Years 27-May $26.0M Tax-Exempt Unsecured Bonds Tax-exempt (Non AMT) Callable 10 Year AWCC/KY New Goldman Sachs 5.375% 30 years 24-Jun $15.3M Tax-Exempt Secured Bonds Tax-exempt (Non AMT) Callable 10 Year NJ-AM *Refinance Morgan Stanley & Sturdivant 4.45% 13 Years 9-Jul $110.0M Tax-Exempt Secured Bonds Tax-exempt (AMT) Callable 10 Year NJ-AM *Refinance Morgan Stanley & Sturdivant 5.60% 24 Years 9-Jul $24.7M Tax-Exempt Secured Bonds Tax-exempt (AMT) Callable 10 Year NJ-AM *Refinance Morgan Stanley & Sturdivant 5.10% 13 Years 9-Jul $10.6M Tax-Exempt Unsecured Bonds Tax-exempt (AMT) Callable 5 Year AWCC/AZ Refinance to Fixed Edward Jones 5.250% 18 Years 27-Jul $35.0M Tax-Exempt Unsecured Bonds Tax-exempt (Non AMT) Callable 10 Year AWCC/CA New Goldman Sachs & SL Hare 5.250% 30 Years 18-Aug $25.0M Tax-Exempt Unsecured Bonds Tax-exempt (Non AMT) Callable 5 Year AWCC/IN New Edward Jones 4.85% 30 Years 16-Sep $35.0M Tax-Exempt Secured Bonds Tax-exempt (AMT) Callable 10 Year NJ-AM *Refinance Morgan Stanley & Sturdivant 4.875% 19 Years 1-Nov $40.0M Tax-Exempt Secured Bonds Tax-exempt (AMT) Callable 10 Year NJ-AM *Refinance Morgan Stanley & Sturdivant 4.700% 15 Years 1-Nov $30.0M Unsecured Bonds Taxable Callable 5 Year AWCC New Edward Jones 6.000% 30 Years 15-Dec 38 Completed Debt Financings During 2010 * Refinance of existing NJ bonds |
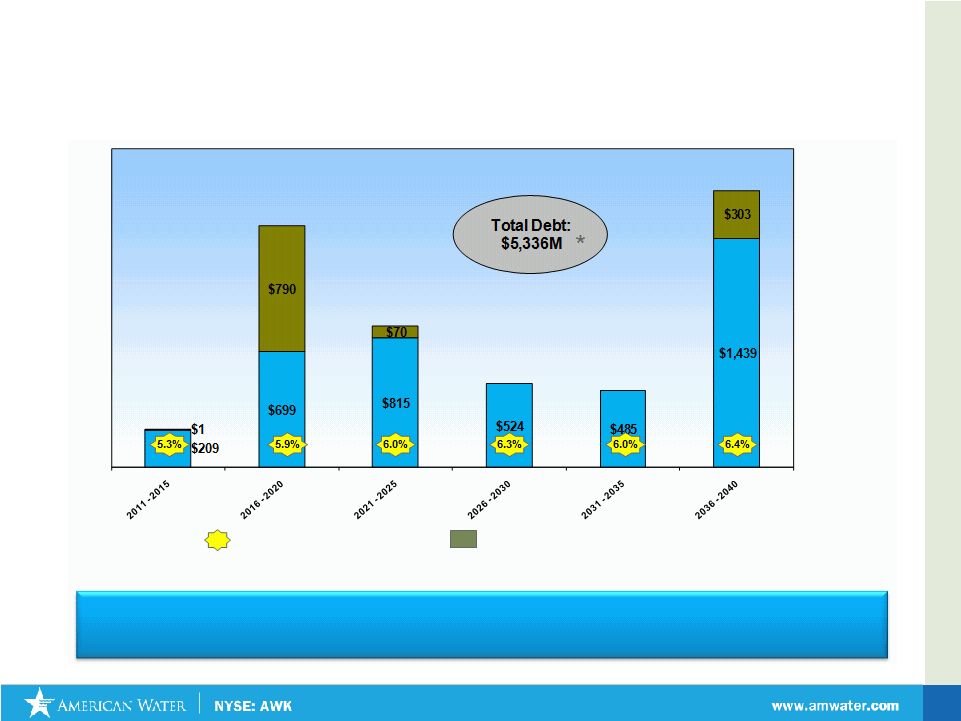 May 2011 Weighted Average Interest Rates Debt Maturities at March 31, 2011 (in millions) Parent Company Debt $100 million of Parent Company debt swapped from 6.085% to 6 month LIBOR + 3.422%, to mature with fixed-rate debt in 2017 * Amount excludes Preferred Stock with Mandatory Redemptions 39 |
 May 2011 Comparison of Water Sales Volumes Water sales volumes for the three months ended March 31, 2011 decreased over the same period in the prior year due to continuing, 10-year trend of lower usage and conservation Customer Class Water Sales Volumes (In Millions of Gallons) March 31 - Year to Date 2011 2010 Change Percentage Residential 39,642 39,898 (256) (0.6) % Commercial 17,540 17,833 (293) (1.6) % Industrial 9,419 9,214 205 2.2 % Public & Other 12,066 12,374 (308) (2.5) % Total 78,667 79,319 (652) (0.8) % 40 |
 May 2011 41 Adjusted EBIT (A Non-GAAP Unaudited Number) ($ in thousands, except per share data) 2008 2009 2010 Adjusted EBIT $558,081 $612,870 $748,196 Add: Allowance for other funds used during construction 14,497 11,486 10,003 Allowance for borrowed funds used during construction 8,171 7,224 6,284 Less: Interest, net (224,426) (228,853) (247,469) Amortization of debt expense (5,346) (6,089 (4,001) Segment income before income taxes 350,977 396,638 513,013 Impairment charge (750,000) (450,000) 0 Interest, net (60,729) (67,692) (67,574) Other 9,158 9,389 3,997 Income (loss) before income taxes $(450,594) $(111,665) $449,436 Reconciliation Tables Net Income (Loss) – Earnings per Share Excluding Impairment Charge (A Non-GAAP Unaudited Number) Historical ($ in thousands, except per share data) 2008 2009 2010 LTM 3/31/11 Net income (loss) ($562,42) ($233,083) $267,827 $284,351 Add: Impairment 750,000 450,000 0 0 Net income excluding impairment charge before associated tax benefit 187,579 216,917 267,827 284,351 Less: Income tax benefit relating to impairment charge 11,525 6,976 0 0 Net income excluding impairment charge $176,054 $209,941 $267,827 $284,351 Net Income (loss) per common share: Basic ($3.52) ($1.39) $1.53 Diluted ($3.52) ($1.39) $1.53 Net income per common share excluding impairment charge: Basic $1.10 $1.25 $1.53 Diluted $1.10 $1.25 $1.53 |
 May 2011 Adjusted Return on Equity (A Non-GAAP Unaudited Number) Historical ($ in thousands ) 2008 2009 2010 LTM 3/31/11 Net income (Loss) ($562,421) ($233,083) $267,827 $284,351 Adjustments Impairment charges 738,475 443,024 0 0 SOX Implementation Costs 8,678 0 0 0 Divestiture/Sale Expenses 5,200 1,126 0 0 Other (Condemnation/Regulatory Approvals) 4,116 0 0 0 Cessation of depreciation associated with assets of discontinued operations 0 0 0 (4,729) Adjusted Net Income $194,048 $211,067 $267,827 $279,622 Year End Stockholders’ Equity $4,102,001 $4,000,859 $4,127,725 $4,146,107 ROE Percentage 4.73% 5.28% 6.49% 6.74% Rate Base as of March 31, 2011 (1) ($ in Thousands) Net Utility Plant $10,421,125 Less Advances for Construction 408,701 CIAC – Contributions in Aid of Construction 932,355 Deferred income taxes 1,136,432 Deferred investment tax credits 30,588 Sub Total $2,508,076 Rate Base TOTAL $7,913,049 (1) An approximation of rate base, which includes Net Utility Plant not yet included in rate base pending rate case filings/outcomes 42 Reconciliation Tables |
  May 2011 First Quarter 2011 Reconciliation Tables In thousands 2011 2010 Total Regulated Operation and Maintenance Expenses 270,157 $ 256,312 $ Less: Regulated Purchased Water Expenses 21,100 20,633 Adjusted Regulated Operation and Maintenance Expenses (a) 249,057 $ 235,679 $ Total Regulated Operating Revenues 537,395 $ 498,197 $ Less: Regulated Purchased Water Revenues 21,100 20,633 Adjusted Regulated Operating Revenues (b) 516,295 $ 477,564 $ Regulated Operations and Maintenance Efficiency Ratio (a)/(b) 48.2% 49.4% In thousands except per share data Three Months Ended March 31, 2011 Net income 47,332 $ Less: Cessation of depreciation, net of tax 4,729 Adjusted net income, exclusive of the cessation of depreciation associated with assets of discontinued operations 42,603 $ Basic earnings per common share: Adjusted net income 0.24 $ Diluted earnings per common share: Adjusted net income 0.24 $ with assets of discontinued operations (a Non-GAAP, unaudited number) Three Months Ended March 31, Regulated Operations and Maintenance Efficiency Ratio (A Non-GAAP, unaudited measure) Adjusted net income and earnings per share, exclusive of the cessation of depreciation associated 43 |
 May 2011 Income Statement 44 ($ in Thousands, except per share data) Three Months Ended March 31, 2011 2010 Operating revenues $ 610,936 $ 566,762 Operating expenses Operation and maintenance 320,571 305,642 Depreciation and amortization 88,019 82,056 General taxes 57,205 54,486 Loss (gain) on sale of assets 268 (71) Total operating expenses, net 466,063 442,113 Operating income 144,873 124,649 Other income (expenses) Interest, net (76,482) (78,696) Allowance for other funds used during construction 2,916 2,146 Allowance for borrowed funds used during construction 1,242 1,382 Amortization of debt expense (1,295) (1,201) Other, net (1,141) 69 Total other income (expenses) (74,760) (76,300) Income from continuing operations before income taxes 70,113 48,349 Provision for income taxes 28,649 18,669 Income from continuing operations 41,464 29,680 Income from discontinued operations, net of tax 5,868 1,128 Net income $ 47,332 $ 30,808 Basic and diluted earnings per common share: Income from continuing operations $ 0.24 $ 0.17 Income from discontinued operations, net of tax $ 0.03 $ 0.01 Net income $ 0.27 $ 0.18 Average common shares outstanding during the period: Basic 175,259 174,720 Diluted 176,048 174,796 Dividends per common share $ 0.22 $ 0.21 |
 |