 Institutional Presentation Bank of America Merrill Lynch Power and Gas Leaders Conference September 20, 2011 Exhibit 99.2 |
 2 Certain statements in this presentation are forward-looking statements within the meaning of the safe harbor provisions of the Private Securities Litigation Reform Act of 1995. These forward-looking statements are predictions based on our current expectations and assumptions regarding future events and may relate to, among other things, our future financial performance, including return on equity performance, our growth and portfolio optimization strategies, our projected capital expenditures and related funding requirements, our ability to repay debt, our ability to finance current operations and growth initiatives, the impact of legal proceedings and potential fines and penalties, business process and technology improvement initiatives, trends in our industry, regulatory or legal developments or rate adjustments. Actual results could differ materially because of factors such as decisions of governmental and regulatory bodies, including decisions to raise or lower rates; the timeliness of regulatory commissions’ actions concerning rates; changes in laws, governmental regulations and policies, including environmental, health and water quality and public utility regulations and policies; weather conditions, patterns or events, including drought or abnormally high rainfall; changes in customer demand for, and patterns of use of, water, such as may result from conservation efforts; significant changes to our business processes and corresponding technology; our ability to appropriately maintain current infrastructure; our ability to obtain permits and other approvals for projects; changes in our capital requirements; our ability to control operating expenses and to achieve efficiencies in our operations; our ability to obtain adequate and cost-effective supplies of chemicals, electricity, fuel, water and other raw materials that are needed for our operations; our ability to successfully acquire and integrate water and wastewater systems that are complementary to our operations and the growth of our business or dispose of assets or lines of business that are not complementary to our operations and the growth of our business; cost overruns relating to improvements or the expansion of our operations; changes in general economic, business and financial market conditions; access to sufficient capital on satisfactory terms; fluctuations in interest rates; restrictive covenants in or changes to the credit ratings on our current or future debt that could increase our financing costs or affect our ability to borrow, make payments on debt or pay dividends; fluctuations in the value of benefit plan assets and liabilities that could increase our cost and funding requirements; our ability to utilize our U.S. and state net operating loss carryforwards; migration of customers into or out of our service territories; difficulty in obtaining insurance at acceptable rates and on acceptable terms and conditions; the incurrence of impairment charges ability to retain and attract qualified employees; and civil disturbance, or terrorist threats or acts or public apprehension about future disturbances or terrorist threats or acts. Any forward-looking statements we make, speak only as of the date of this presentation. Except as required by law, we specifically disclaim any undertaking or intention to publicly update or revise any forward-looking statements, whether as a result of new information, future events, changed circumstances or otherwise. Cautionary Statement Concerning Forward-Looking Statements September 2011 |
 September 2011 3 Regulated Businesses provide earnings stability Solid track record of Shareholder Value creation Continued growth opportunities driven by industry needs Stable Dividend Growth American Water NYSE: AWK American Water’s Value Proposition |
 American Water: The Premier Water Services Provider in North America Largely residential customer base promotes consistent operating results Geographic presence hedges both weather and regulatory risk Scale enables multiple growth opportunities across service areas 4 September 2011 |
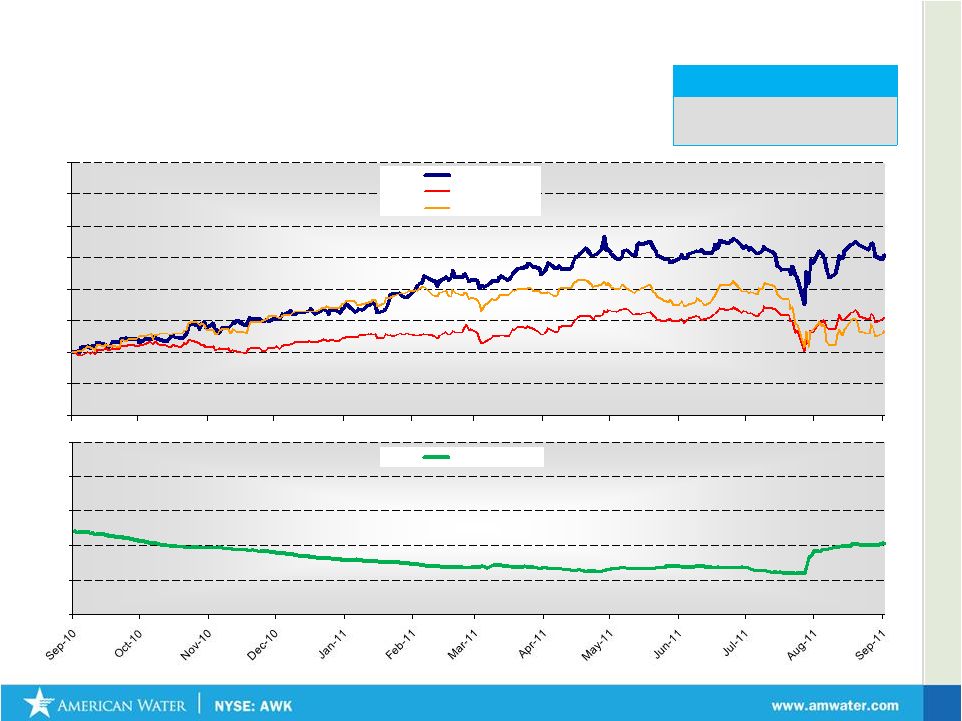 September 2011 0.40 0.45 0.50 0.55 0.60 0.65 AWK Beta Total Shareholder Return : American Water vs. Indices (September 13, 2010 – September 13, 2011) 5 Shareholder Return LTM American Water S&P 500 Dow Jones Utilities +30.9% +6.7% +10.9% 80% 90% 100% 110% 120% 130% 140% 150% 160% AWK DJ Util S&P 500 Source: Thomson Reuters |
 The US Water Industry |
 The U.S. Water Industry 7 Key Water Sector Themes Aging Infrastructure Fragmented Industry Increasing Environmental Requirements Capital Availability Technology September 2011 |
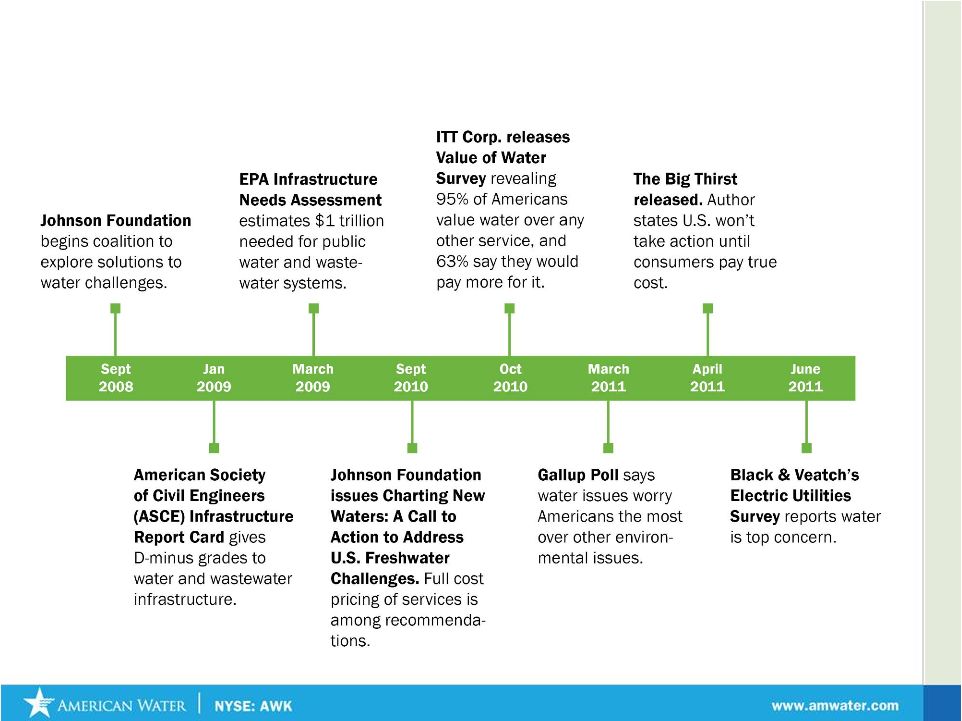 September 2011 There is Increasing Public Awareness of Water and Wastewater Issues 8 |
 American Water |
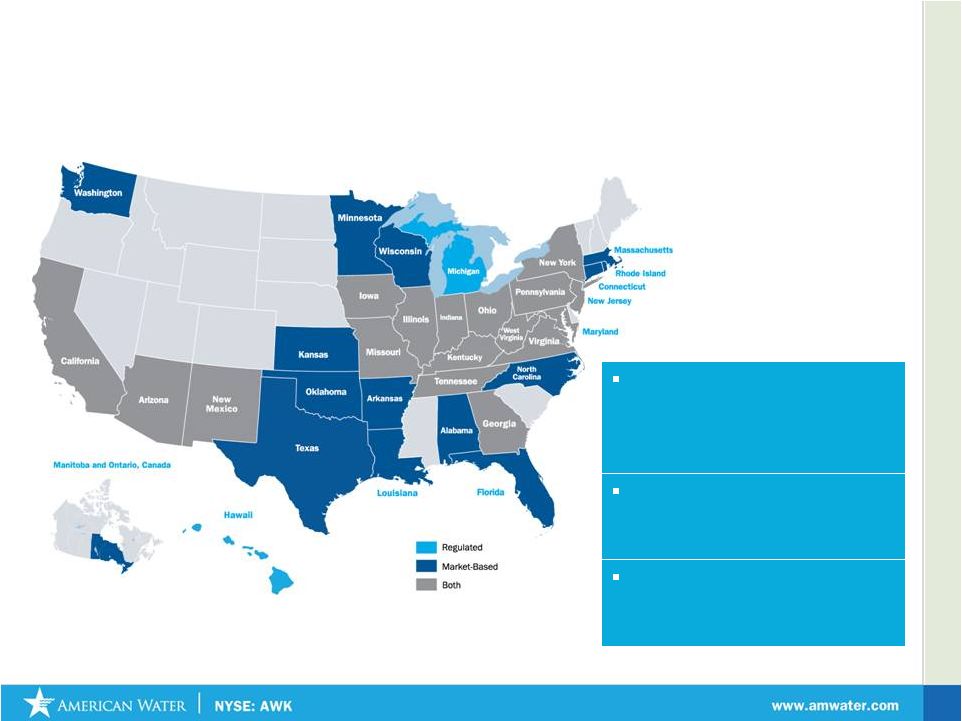
 September 2011 American Water’s Regulated Presence 10 States where we recently expanded our Regulated Operations States we are in process of exiting Regulated Operations |
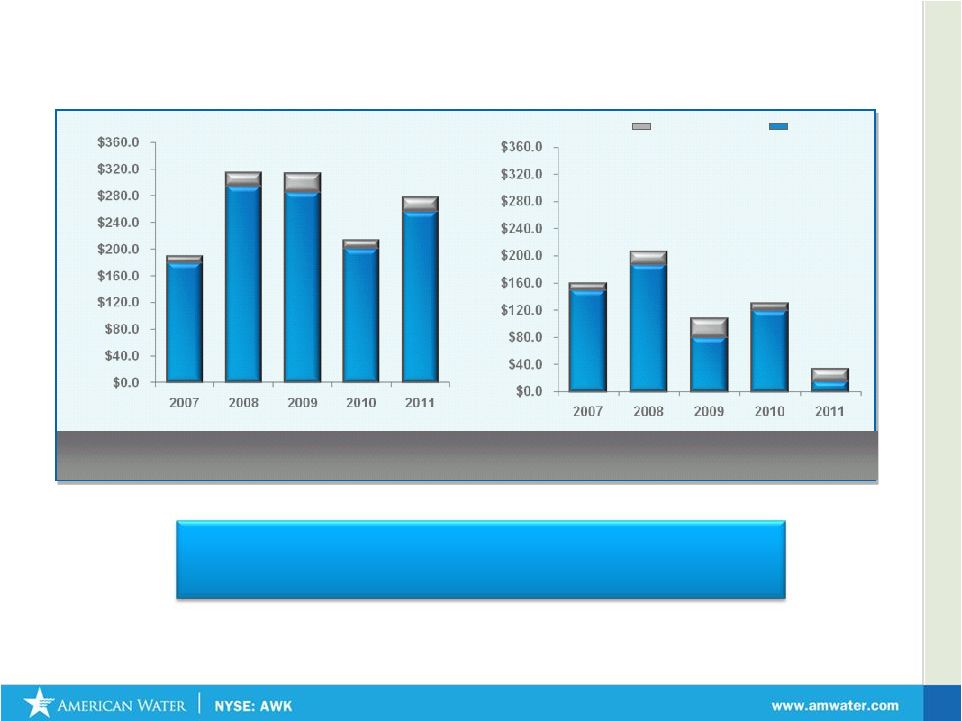 September 2011 11 Recovery Received* Rate Cases Filed Infrastructure Charges Rate Cases $180.1 $313.9 $158.9 $206.2 (in millions of dollars) (in millions of dollars) $107.5 $312.7 $33.1 $222.9 Continuing Effort to Earn an Appropriate Rate of Return on Prudent Investments • 2010 Recovery Received includes $1.5 million of additional annualized revenues in California associated with its Motion for reconsideration and rate base addition for cases finalized in 2009 • Recovery Received reflects final orders issued, and does not include Interim rate increases. $277.2 $129.3 • As of August 26, 2011: $314.6 million in annualized revenue requests from 9 outstanding rate cases • In 2011 American Water received average ROE of 10.1% |
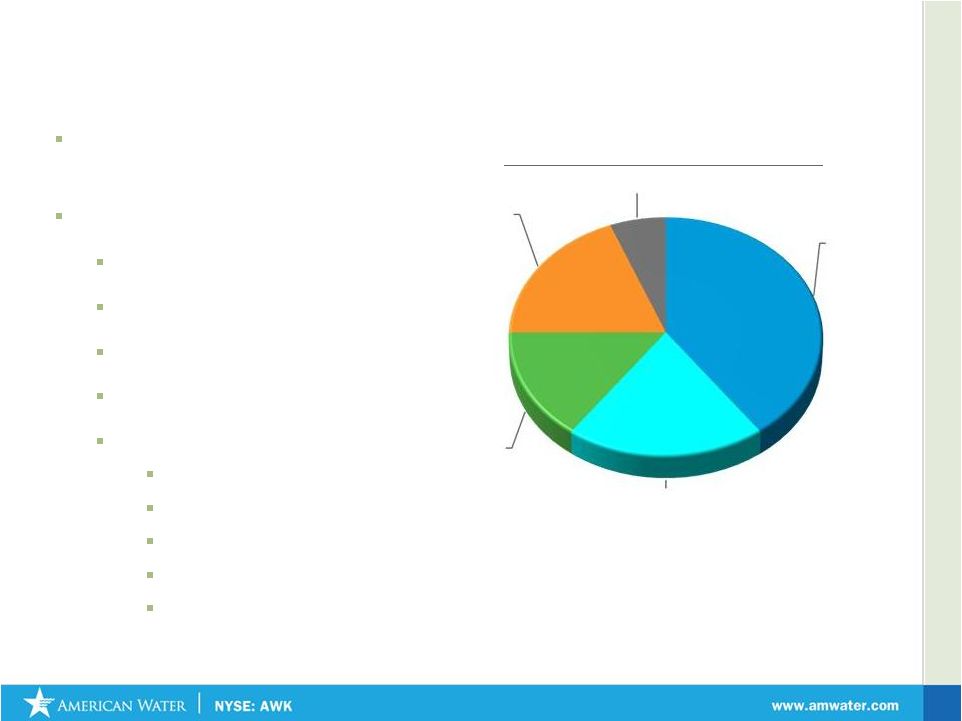 September 2011 Regulated Operations Growth: Investing in Needed Infrastructure (1) Net capex defined as gross capex less advances and contributions in aid of construction. Capital Expenditure Framework Net Capex (1) by category Ongoing Capital Expenditure program of $800 million to $1 billion per year Capital program focused on Infrastructure replacement Capacity projects Source of supply needs Acquisitions Major projects Pittsburgh, PA Short Hills, NJ Warsaw, IN Hopewell, VA Peoria, IL 12 Quality of Service, 19% Other, 6% Asset Renewal, 40% Capacity Expansion, 20% Regulatory Compliance, 15% |
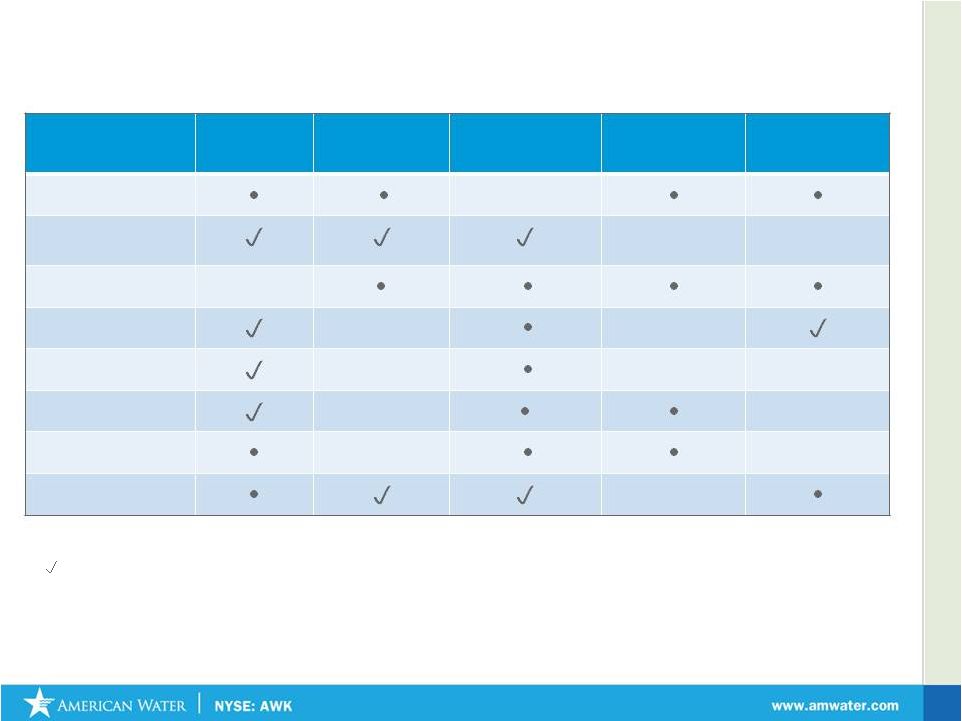 13 American Water is Actively Addressing Regulatory Lag that Impact Returns on Investments = Recognition of regulatory lag in rate cases requested, but not yet obtained • = Recognition of regulatory lag in rate cases that exist today Note: Each of these tools is designed and applied differently in each state and subject to regulatory change Pending Rate Cases Declining Usage Decoupling Distribution Surcharges Balancing/ Trackers Adjustment Clauses California Iowa New York Pennsylvania Indiana Missouri Ohio New Jersey September 2011 |
 American Water’s Portfolio Optimization Initiatives • Balanced Portfolio Analysis • Focus Achieving Authorized Rates of Return • Monetize Non-Producing Assets • Focused Capital Resources • Selective Acquisition Opportunities • Leverage Internal Growth 14 Focus on Value Drivers Drive Profitability and Returns Explore Opportunities for Long-Term Success Optimizing Long-term Value Through Proactive Management Redeploy Value Into Core Growth Markets Continue to Lower Costs September 2011 |
 AZ $265M (2) (1)An approximation of rate base as of December 30, 2010 , which includes Net Utility Plant not yet included in rate base pending rate case filings/outcomes (2)Rate base approved in rate cases by respective commissions (3)Most recent transactions (AZ, NM, OH and NY) subject to closing risk and regulatory approval 15 TX $5.5M (2) NM $34M (2) NY $42M (3) MO $3M (2) OH $70M (3) Rate Base (1) = $8.3 Bn Portfolio Optimization: Rate Base Inflows and Outflows Proceeds of $470 mm from New Mexico and Arizona transactions will be used to lower debt or finance Capital Expenditures September 2011 |
 16 American Water’s Market-Based Operations Continue to Generate Opportunities for Growth (1) Includes 137 AWM and 48 EMC projects (2) Includes 16 AWM projects Contract Operations Military Bases Privatization • Over $2 Billion in Revenues Backlog Contract Operations • Over 200 contracts (1) • Serving 3.1 Million people • 25 industrial contracts Design, Build,Operate • 20 current projects (2) Homeowner Services Over 870,000 contracts 17 States Emerging Technologies Desalination plant • Tampa Bay Seawater, FL Water Reuse; 22 Projects; 7 States • Gillette Stadium, MA • Battery Park, NY • Butterball Turkey, NC Regulated-Like Complementary Value-Added Services For 2010, American Water reported $311.8 million of Market-Based Operations revenues September 2011 |
 September 2011 17 2011 Guidance: Solid Growth Powers Increased Earnings Guidance, as Adjusted, to $1.75 - $1.82 Note: Changes in events, or circumstances beyond the Company’s control or that it cannot anticipate could materially impact the EPS guidance and could result in actual results being significantly above or below this outlook. In addition to the cautionary statements herein, Investors are advised to review the risk factors in the Company’s 10-K and other filed financial documents when making investment decisions Previous Guidance $1.65 - $1.75 Key Drivers New Guidance $1.75 - $1.82 • Cost efficiencies • Continued low interest rate environment • Favorable early summer weather in Northeast • Favorable summer weather in Midwest states The 2011 EPS Guidance, as adjusted, does not recognize the benefit to net income and earnings per share of the cessation of depreciation for discontinued operations in Arizona, New Mexico, Texas and Ohio, which is estimated to be approximately $0.09 for 2011 |
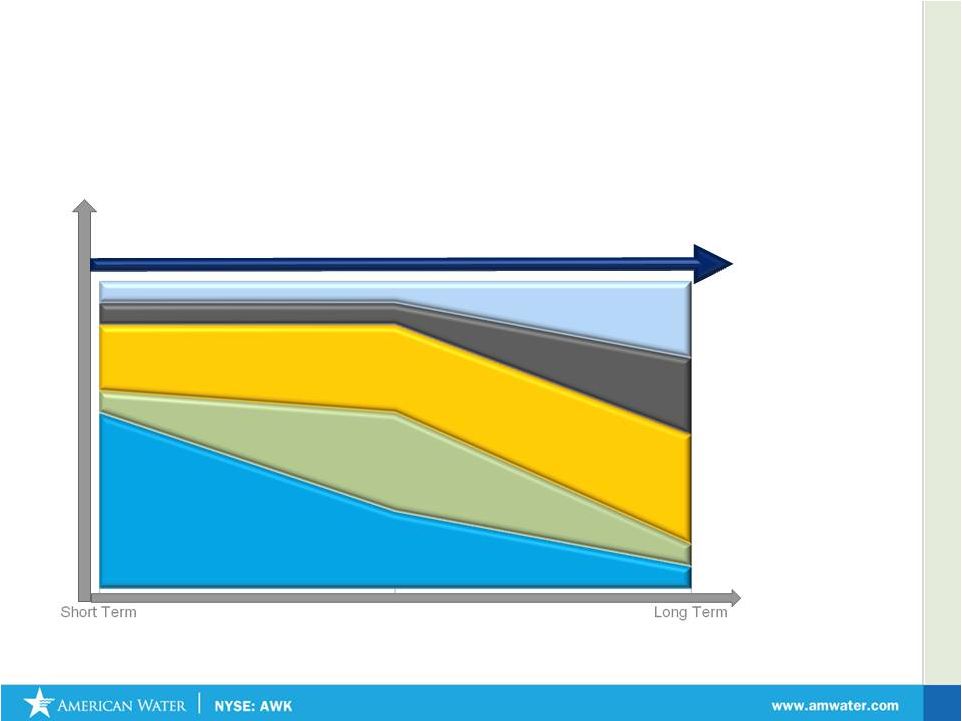 September 2011 Investment Thesis: Sustained 7-10% EPS Growth Future Growth New Services Regulated Investments Acquisitions Operational Excellence/ Efficiencies ROE improvement Long Term Growth Conceptual Representation 18 September 2011 |
 Financial Update |
 September 2011 American Water: Solid 2011 Results Cash Flow From Operations (in millions) Net Income* (in millions) Operating Revenues (in millions) $634.9 $1,192.9 $674.2 $1,276.1 $0.0 $500.0 $1,000.0 $1,500.0 2nd Quarter YTD 2010 2011 $100.9 $262.4 $121.5 $297.9 $0.0 $200.0 $400.0 2nd Quarter YTD Earnings Per Share* $72.8 $103.6 $84.6 $131.9 $0.0 $50.0 $100.0 $150.0 2nd Quarter YTD 2010 2011 $0.42 $0.59 $0.48 $0.75 $0.00 $0.20 $0.40 $0.60 $0.80 2nd Quarter YTD 2010 2011 *Net Income and EPS include the cessation of depreciation that favorably affected net income by $3.2 million after tax, or $0.02 per share and $7.9 million after tax and $0.04 per share for the three and six months ended June 30, 2011, respectively, on assets under agreement for sale . 2010 2011 20 Regulated O&M Efficiency Ratio improved 220 bps for the six months ended June 30, 2011* |
 September 2011 21 American Water Continues to Improve Return on Equity (1) to Shareholders 10 % - 10.5 % ROE (5) 1. ROE calculation excludes impairment , SOX, divestiture and other 2. 2008, 2009 and 2010 reflect net income as there was no discontinued operations in these periods 3. 2011 is adjusted for cessation of depreciation associated with assets of discontinued operations 4. Parent company debt as of June 30, 2011 5. Range of allowed ROE 1.1% Parent Co. Debt (4) Opportunity (2) (2) (2) (3) 4.73% 5.28% 6.49% 6.95% 2008 2009 2010 LTM 6/30/11 Allowed ROE American Water continues to close ROE Gap |
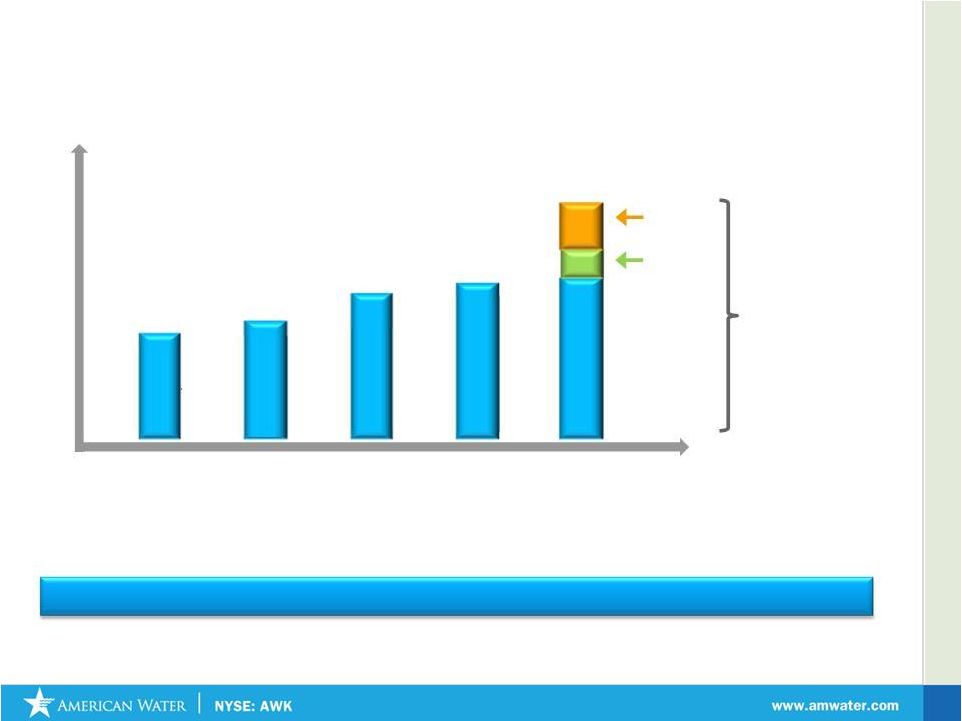
 September 2011 1) Water Companies Include: AWR, CTWS, CWT, MSEX, SJW, WTR, YORW. 2) Gas Companies include ATO, LG, GAS, NWN, PNY, SJI, SWX, WGL. 3) Regulated Electric Companies include HE, NU, TE, LNT, XEL, SO, CNP, PCG, SCG, POR, DUK, UIL, PGN, AEP. 4) Average monthly dividend yield for 2008 – 2010 period. 5) Non GAAP: American Water EPS adjusted to exclude impairment charges. American Water’s Past Performance and Future Growth Expectations Compare Very Favorably vs Water, Electric and Gas Peers Source: Thomson Reuters * For AWK represents 7-10% Long Term EPS CAGR market guidance . All other data from First Call Consensus Estimates ** as of 9/13/11 Note: Consensus Estimates are calculated by First Call based on the earnings projections made by the analysts who cover companies noted (other than AWK). Please note that any opinions, estimates or forecasts regarding performance made by these analysts (and therefore the Consensus estimate numbers) are theirs alone and do not represent opinions, forecasts or predictions of American Water or its management. 2008 – 2010 EPS CAGR + Average Dividend Yield (4) Total Shareholder Return (Long Term Expected EPS Growth* and Dividend Yield**) 22 |
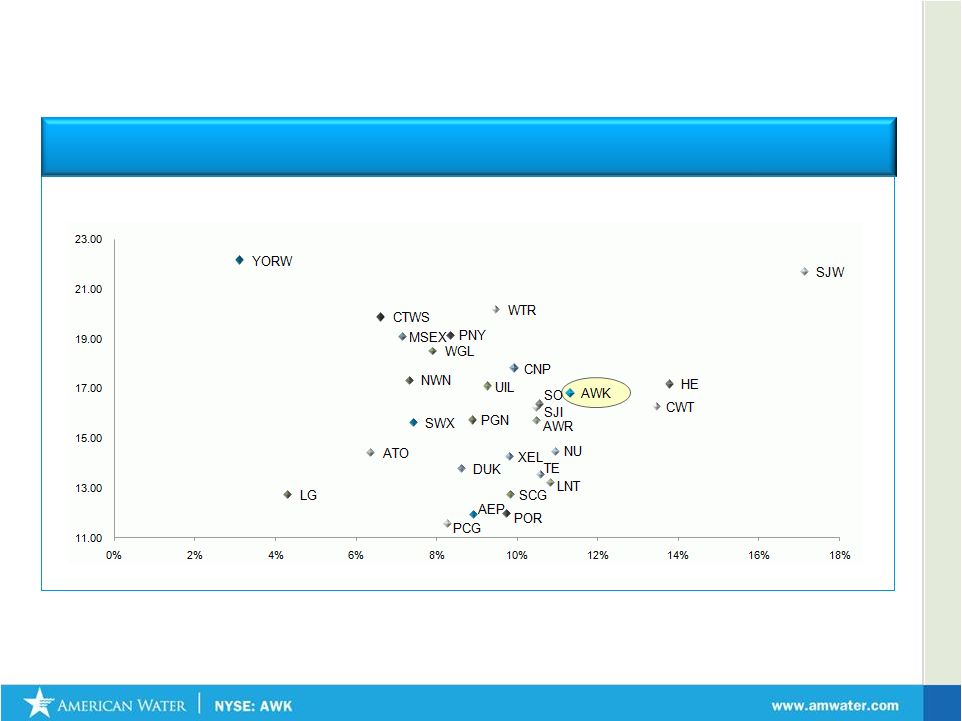 September 2011 P/E Compared with Total Return Source: Thomson Reuters * PE data as of September 2011 American Water’s Higher Growth Expectations are not Fully Reflected in its PE Multiple Forward P/E Expected Total Return 23 |
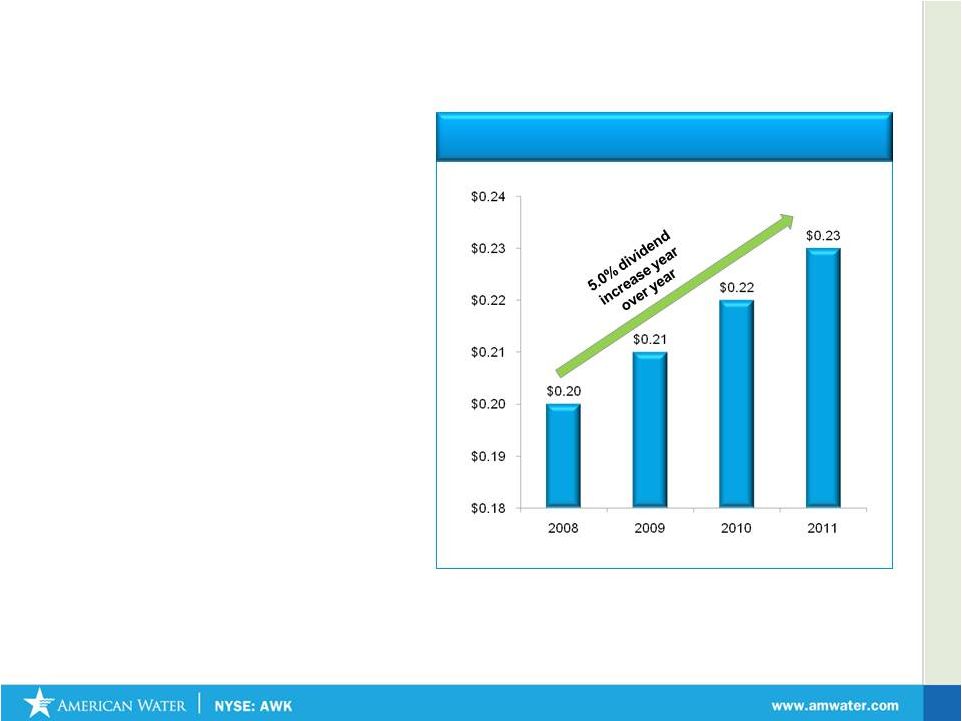 September 2011 Recent Dividend History • Key component of American Water’s total shareholder return proposition • Dividend Growth – Board of Directors increased dividend 5% to $0.23 or $0.92 annualized • Dividend Yield – 3.19% at 9/13/11 • Growth in Dividend reflects growth in Net Income 24 Quarterly Dividend Rate Increases |
 25 Regulated Businesses provide earnings stability Solid track record of Shareholder Value creation Continued growth opportunities driven by industry needs Stable Dividend Growth American Water’s Value Proposition American Water NYSE: AWK September 2011 |
 September 2011 Investor Relations Contacts: Ed Vallejo Vice President – Investor Relations Edward.vallejo@amwater.com Muriel Lange Manager – Investor Relations Muriel.lange@amwater.com Tel: 856-566-4005 Fax: 856-782-2782 26 |
 Appendix |
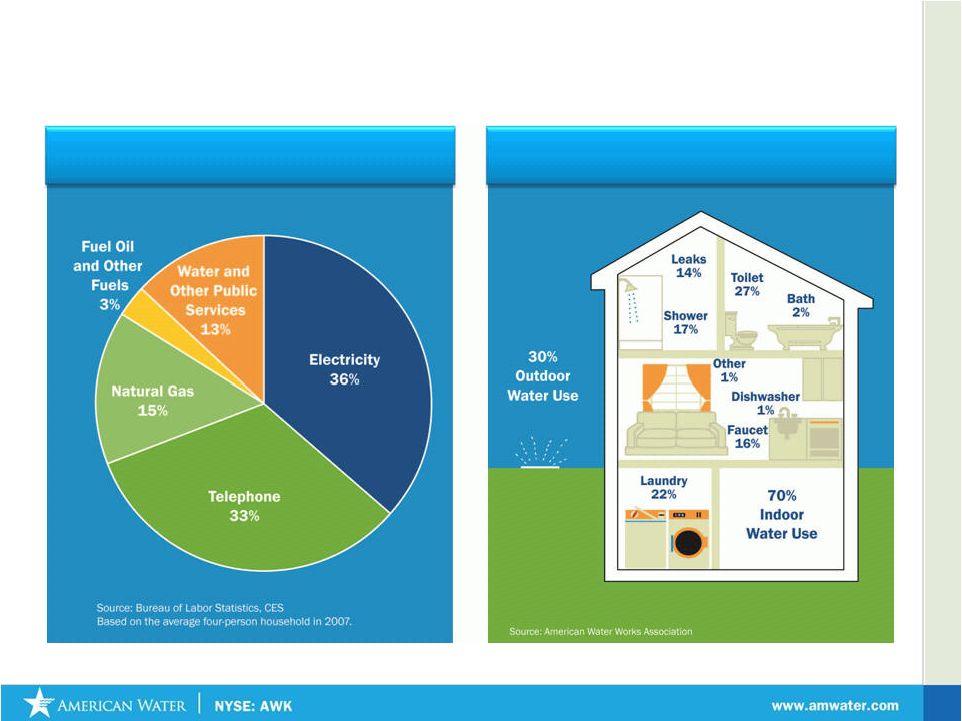 September 2011 Water Utility Expenditures 28 Water vs Other Utility Expenditures Water Use in the Home |
 September 2011 Rate of Return Regulation in the United States Prudent Investment Drives Need for Rate Cases Operating Expenses Taxes, Depr & Amortization WACC Establish Rate Base Allowed Return Allowed Return Revenue Requirement Step 2 Step 1 + + x = = 29 American Water has experience in securing appropriate rates of return and promoting constructive regulatory frameworks |
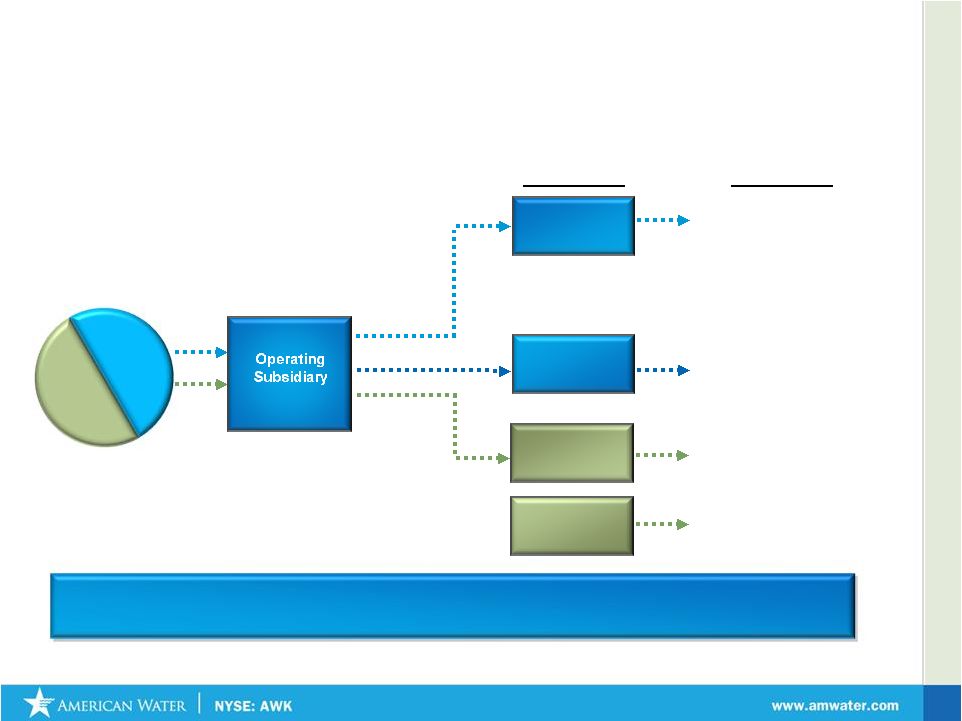 September 2011 AW Parent Company Equity Debt Equity (Capex) Operating Expenses Debt Regulatory Treatment Net Income Impact • Neutral, if interest costs are deemed prudent and fair to the consumer by regulator How is Net Income Generated in Rate of Return Regulation? Pass Through 1:1 Pass Through 1:1 Return of (Depreciation) Return on Equity (ROE) Debt Equity • Neutral, if all operating expenses are deemed prudent and fair to the consumer by regulator • Depreciation is neutral if all depreciable assets are in rate base • Rate Base x Earned ROE + Gross Up for Taxes is Added Revenue * Assuming no regulatory lag between rate cases 30 If all assets are included in the Company’s Rate Base and all operating expenses are deemed prudent and recoverable by regulator, Company earns allowed ROE* |
 September 2011 31 Rate Cases Awaiting Final Order Docket / Annualized Revenue ROE Rate Base Filing Case Number Date Filed Increase Filed Requested (Filed) Status California A 10-07-007 07/01/10 37.3 10.20% 409.6 3 Arizona W-01303A-10-0448 11/03/10 20.4 11.50% 149.2 2 Hawaii 2010-0313 02/22/11 1.8 11.85% 25.2 3 Pennsylvania R-2011-2232243 04/29/11 70.7 11.50% 2,096.2 2 New York 11-W-0200 04/29/11 9.6 11.50% 126.9 2 Iowa RPU-2011-0001 04/29/11 5.1 11.35% 88.9 5 Indiana 44022 05/02/11 20.4 11.50% 733.4 2 New Mexico 11-00196-UT 05/18/11 2.6 11.75% 33.6 2 Missouri WR-2011-0037 06/30/11 42.9 11.50% 849.1 2 Ohio 11-4161-WS-AIR 07/01/11 8.3 11.50% 92.3 1 New Jersey WR11070460 07/29/11 95.5 11.50% 2,059.7 1 Total 314.6 $ 6,664.1 $ Note: Above excludes rate case file in 2007 for Hawaii for which interim rates have been in effect since October 2008 Index of Rate Case Status 1 - Case Filed 2 - Discovery (Data Requests, Investigation) 3 - Negotiations / Evidentiary Hearings / Briefings 4 - Recommended order issued / settlement reached, without interim rates 5 - Interim rates in effect, awaiting final order General Rate Cases Awaiting Final Order (as of September 2011) |
 September 2011 Rate Cases and Infrastructure Charges Awarded That Will Have an Impact on 2011 Results (As of September 2011) 32 Annualized ($ in millions) Effective Date ROE Increase to for new rates Granted Revenue General Rate Cases: Illinois 4/23/2010 10.38% 41.4 $ New Mexico (Edgewood) ** 5/10/2010 10.00% 0.5 Indiana 5/3/2010 10.00% 31.5 Virginia (Eastern) 5/8/2010 10.50% 0.6 Ohio ** 5/19/2010 9.34% 2.6 Missouri 7/1/2010 10.00% 28.0 California (Sac, LA, Lark) 7/1/2010 10.20% 14.6 Michigan 7/1/2010 10.50% 0.2 Kentucky 10/1/2010 9.70% 18.8 New Jersey 1/1/2011 10.30% 39.9 Pennsylvania Wastewater 1/1/2011 10.60% 8.4 Arizona ** 1/1/2011 9.50% 14.7 Tennessee 4/5/2011 10.00% 5.6 West Virginia 4/19/2011 9.75% 5.1 Virginia 4/6/2011* 10.20% 4.8 * Subtotal - General Rate Cases 216.7 $ Infrastructure Charges: Pennsylvania 19.3 Indiana 5.4 Missouri 6.3 Illinois 1.7 Other 1.6 Subtotal - Infrastructure Charges 34.3 $ Total 251.0 $ * Includes non-jurisdictional components of approximately $0.5 million. The effective dates the specific customers and were either August 2010 or January 1, 2011. ** In process of being sold |
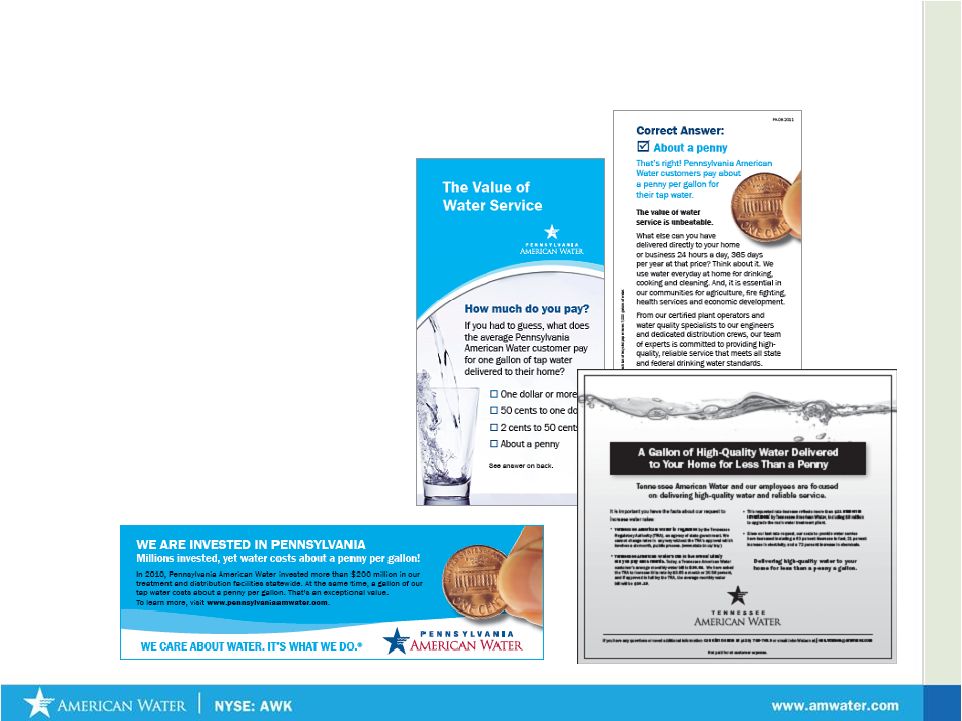 September 2011 American Water Continues to Educate Consumers about Needed Infrastructure Investments • Open houses/tours • Speaking forums • News releases/op-eds • Media pitching • Bill inserts • Flyers • Advertising • Community events • Public official meetings • White papers 33 |
 Infrastructure Surcharges: A Viable Mechanism to Address Regulatory Lag • Infrastructure Surcharges allow companies to recover infrastructure replacement costs without necessity of filing full rate proceeding • States that currently allow use of infrastructure surcharges Pennsylvania Indiana Illinois Ohio • Surcharges are typically reset to zero when new base rates become effective and incorporate the costs of the previous surcharge investments Delaware New York Missouri (St Louis County) California - Trial basis 34 September 2011 |
 September 2011 Case in Point: Increased Investment in Pennsylvania’s Infrastructure 35 |
 September 2011 36 Marcellus Shale: Possible Opportunities for Growth • Marcellus Shale formation covers 2/3 of Pennsylvania • 363 trillion cubic feet of natural gas is estimated to be captured in Pennsylvania’s shale formation • Many of the 390 communities that we serve are in areas where drilling is taking place • PAW is currently selling water to gas drillers at 29 distribution points in Pennsylvania, primarily in Western PA and some in Northeast PA • PAW sold 115.3 million gallons of water to gas drillers from January through June of 2011, producing $702,000 in revenues • 3,792 Marcellus Shale wells drilled from 2008 to July 2011 Pennsylvania American Water Service Areas with DEP Bureau oil and gas Marcellus Shale wells drilled between 2008-2011 Realizing additional revenues from water sales to drilling companies while remaining vigilant in protecting our water sources |
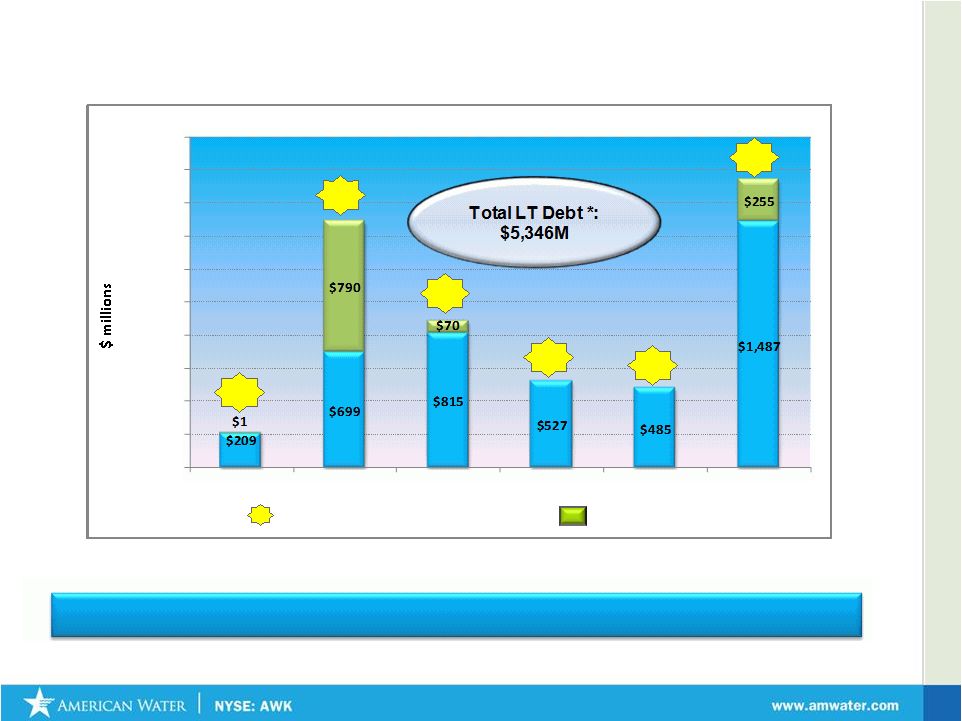 September 2011 Debt Maturities (as of 6/30/2011) 37 $0 $200 $400 $600 $800 $1,000 $1,200 $1,400 $1,600 $1,800 $2,000 2011 - 2015 2016 - 2020 2021 - 2025 2026 - 2030 2031 - 2035 2036 - 2040 * Excludes Preferred Stock with Mandatory Redemptions and Capital Leases Weighted Average Interest Rates Parent Company Debt 5.3% 5.9% 5.9% 6.4% 6.3% 6.0% $100 million of Parent Company debt swapped from 6.085% to 6 month LIBOR + 3.422% |
 September 2011 Financial Tables: GAAP and Non-GAAP Measures, Rate Base Rate Base as of June 30, 2011 (1) ($ in Thousands) Net Utility Plant $10,463,211 Less Advances for Construction 396,440 CIAC – Contributions in Aid of Construction 940,819 Deferred income taxes 1,163,854 Deferred investment tax credits 30,198 Sub Total $2,531,311 Rate Base TOTAL $7,931,900 (1) An approximation of rate base, which includes Net Utility Plant not yet included in rate base pending rate case filings/outcomes 38 Net Income (Loss) – Earnings per Share Excluding Impairment Charge (A Non-GAAP Unaudited Number)* Historical For the Year Ended December 31, ($ in thousands, except per share data) 2008 2009 2010 Net income (Loss) ($562,421) ($233,083) $267,827 Add: Impairment 750,000 450,000 0 Net income excluding impairment charge before associated tax benefit 187,579 216,917 267,827 Less: Income tax benefit relating to impairment charge 11,525 6,976 0 Net income excluding impairment charge $176,054 $209,941 $267,827 Basic earnings per common share excluding impairment charge: Net income excluding impairment charge $1.10 $1.25 $1.53 Diluted earnings per common share excluding impairment charge: Net income excluding impairment charge $1.10 $1.25 $1.53 *A Non-GAAP number, excluding net impairment charges for 2009 and 2008 of $(443,024) and $(738,475), respectively. |
 Income Statement Three Months Ended June 30, Six Months Ended June 30, 2011 2010 2011 2010 Operating revenues $ 674,248 $ 634,910 $ 1,276,070 $ 1,192,930 Operating expenses Operation and maintenance 332,310 314,016 647,677 614,599 Depreciation and amortization 87,654 81,695 174,603 162,754 General taxes 53,096 50,889 108,815 103,743 Loss (gain) on sale of assets 28 26 296 (45) Total operating expenses, net 473,088 446,626 931,391 881,051 Operating income 201,160 188,284 344,679 311,879 Other income (expenses) Interest, net (78,504) (78,444) (154,724) (156,888) Allowance for other funds used during construction 2,535 2,305 5,363 4,414 Allowance for borrowed funds used during construction 1,198 1,194 2,402 2,547 Amortization of debt expense (1,255) (735) (2,547) (1,927) Other, net 679 1,987 (475) 2,059 Total other income (expenses) (75,347) (73,693) (149,981) (149,795) Income from continuing operations before income taxes 125,813 114,591 194,698 162,084 Provision for income taxes 51,160 46,570 79,315 64,880 Income from continuing operations 74,653 68,021 115,383 97,204 Income from discontinued operations, net of tax 9,913 4,730 16,515 6,355 Net income $ 84,566 $ 72,751 $ 131,898 $ 103,559 Basic earnings per common share: (a) Income from continuing operations $ 0.43 $ 0. 39 $ 0.66 $ 0.56 Income from discontinued operations, net of tax $ 0.06 0.03 $ 0.09 0.04 Net income $ 0.48 $ 0.42 $ 0.75 $ 0.59 Diluted earnings per common share: (a) Income from continuing operations $ 0.42 $ 0. 39 $ 0.65 $ 0.56 Income from discontinued operations, net of tax $ 0.06 $ 0.03 $ 0.09 $ 0.04 Net income $ 0.48 $ 0.42 $ 0.75 $ 0.59 Average common shares outstanding during the period: Basic 175,469 174,774 175,364 174,747 Diluted 176,436 174,850 176,273 174,820 Dividends per common share $ 0.45 $ 0.21 $ 0.67 $ 0.42 (a) Amounts may not sum due to rounding 39 September 2011 |
 September 2011 Reconciliation Tables In thousands 2011 2010 2011 2010 Total Regulated Operation and Maintenance Expenses 271,383 $ 261,711 $ 536,336 $ 512,964 $ Less: Regulated Purchased Water Expenses 25,565 26,063 46,380 46,421 Adjusted Regulated Operation and Maintenance Expenses (a) 245,818 $ 235,648 $ 489,956 $ 466,543 $ Total Regulated Operating Revenues 594,441 $ 566,002 $ 1,122,722 $ 1,055,457 $ Less: Regulated Purchased Water Revenues* 25,565 26,063 46,380 46,421 Adjusted Regulated Operating Revenues (b) 568,876 $ 539,939 $ 1,076,342 $ 1,009,036 $ Regulated Operations and Maintenance Efficiency Ratio = (a)/(b) 43.2% 43.6% 45.5% 46.2% *As revenues not tracked in this manner, calculation assumes that purchased water revenues approximate purchased water expenses Six Months Ended June 30, Regulated Operations and Maintenance Efficiency Ratio (A Non-GAAP, unaudited measure)* Three Months Ended June 30, 40 * O&M Efficiency Ratio (A Non-GAAP, unaudited measure) = operating and maintenance expenses / revenues, adjusted to eliminate revenues and expenses related to purchased water . * Quarterly data reflects the effect of discontinued operations. |
 September 2011 Reconciliation Tables 41 * Net Income and EPS include the cessation of depreciation worth $3.2 million after tax, or $0.02 per share and $7.9 million after tax and $0.04 per share for the three and six months ended June 30, 2011, respectively, on assets under agreement for sale . In thousands Three Months Ended Six Months Ended June 30, June 30, 2011 2011 Net income 84,566 $ 131,898 $ Less: Cessation of depreciation, net of tax 3,159 7,888 Net income, exclusive of the cessation of depreciation associated with assets of discontinued operations 81,407 $ 124,010 $ Basic earnings per common share: GAAP net income $0.48 $0.75 Diluted earnings per common share: GAAP net income $0.48 $0.75 Basic earnings per common share: Adjusted net income $0.46 $0.71 Diluted earnings per common share: Adjusted net income $0.46 $0.70 Net income, exclusive of the cessation of depreciation associated with assets of discontinued operations (a Non-GAAP, unaudited measure)* |
 September 2011 Balance Sheet Reconciliation for ROE Return on Equity* In thousands LTM Ended 6/30/11 Total LTM Net income $ 296,166 Less: Cessation of depreciation, net of tax 7,888 LTM net income, exclusive of the cessation of depreciation associated with assets of discontinued operations (a) $ 288,278 Common Stockholders equity $ 4,157,920 Cessation adjustment 7,888 Common Stockholders equity, adjusted (b) $ 4,150,032 LTM Adjusted ROE % = (a)/(b) 6.95% * 2011 net income is adjusted for cessation of depreciation associated with assets of discontinued operations; there were no discontinued operations in prior periods. 42 |