Exhibit 99.2
NYSE: AWK
2013 Investor Day
December 17, 2013
NYSE: AWK
The American Water
Analyst Day Presentation
will start in:
Minutes
Please review the corresponding video link “Customer Service Video” on the American Water website
December 2013
NYSE: AWK www.amwater.com 3
NYSE: AWK
2013 Investor Day
Jeff Sterba President and CEO
December 17, 2013
Cautionary Statement Concerning Forward-Looking Statements
Certain statements in this presentation are forward-looking statements within the meaning of the safe harbor provisions of the Private Securities Litigation Reform Act of 1995. These forward-looking statements are predictions based on our current expectations and assumptions regarding future events and may relate to, among other things, our future financial performance, our growth and portfolio optimization strategies, our projected capital expenditures and related funding requirements, our ability to repay debt, our ability to finance current operations and growth initiatives, the impact of legal proceedings and potential fines and penalties, business process and technology improvement initiatives, trends in our industry, regulatory or legal developments or rate adjustments. Actual results could differ materially because of factors such as the completion of the independent audit of our financial statements; decisions of governmental and regulatory bodies, including decisions to raise or lower rates; the timeliness of regulatory commissions’ actions concerning rates; changes in laws, governmental regulations and policies, including environmental, health and water quality and public utility regulations and policies; weather conditions, patterns or events, including drought or abnormally high rainfall; changes in customer demand for, and patterns of use of, water, such as may result from conservation efforts; significant changes to our business processes and corresponding technology; our ability to appropriately maintain current infrastructure; our ability to obtain permits and other approvals for projects; changes in our capital requirements; our ability to control operating expenses and to achieve efficiencies in our operations; our ability to obtain adequate and cost-effective supplies of chemicals, electricity, fuel, water and other raw materials that are needed for our operations; our ability to successfully acquire and integrate water and wastewater systems that are complementary to our operations and the growth of our business or dispose of assets or lines of business that are not complementary to our operations and the growth of our business; cost overruns relating to improvements or the expansion of our operations; changes in general economic, business and financial market conditions; access to sufficient capital on satisfactory terms; fluctuations in interest rates; restrictive covenants in or changes to the credit ratings on our current or future debt that could increase our financing costs or affect our ability to borrow, make payments on debt or pay dividends; fluctuations in the value of benefit plan assets and liabilities that could increase our cost and funding requirements; our ability to utilize our U.S. and state net operating loss carryforwards; migration of customers into or out of our service territories; difficulty in obtaining insurance at acceptable rates and on acceptable terms and conditions; the incurrence of impairment charges ability to retain and attract qualified employees; and civil disturbance, or terrorist threats or acts or public apprehension about future disturbances or terrorist threats or acts.
Any forward-looking statements we make, speak only as of the date of this presentation. Except as required by law, we do not have any obligation, and we specifically disclaim any undertaking or intention, to publicly update or revise any forward-looking statements, whether as a result of new information, future events, changed circumstances or otherwise.
December 2013
NYSE: AWK www.amwater.com 5
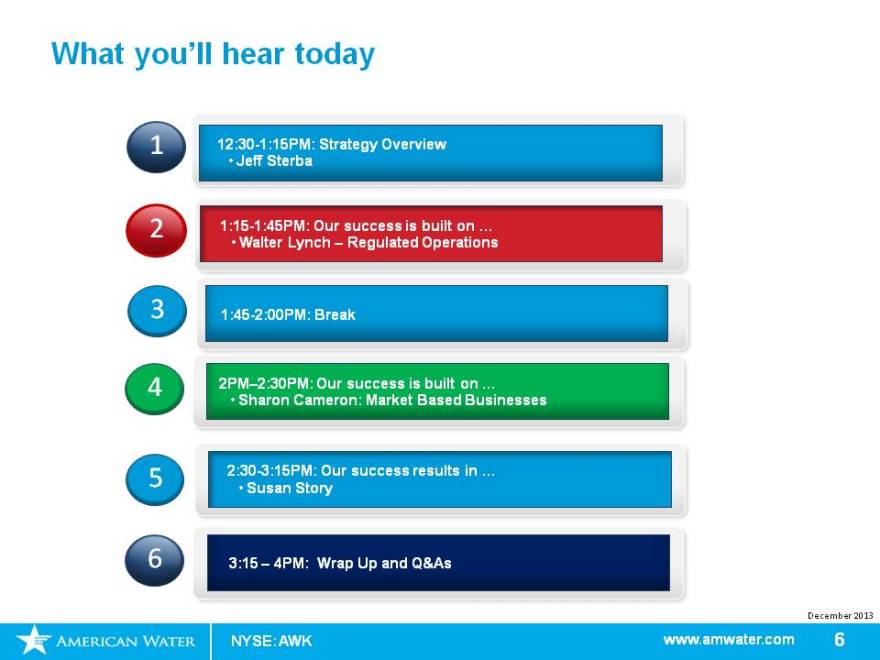
What you’ll hear today
1 12:30-1:15PM: Strategy Overview
• Jeff Sterba
2 1:15-1:45PM: Our success is built on …
• Walter Lynch – Regulated Operations
3 1:45-2:00PM: Break
4 2PM–2:30PM: Our success is built on …
• Sharon Cameron: Market Based Businesses
5 2:30-3:15PM: Our success results in …
• Susan Story
6 3:15 – 4PM: Wrap Up and Q&As
December 2013
NYSE: AWK www.amwater.com 6
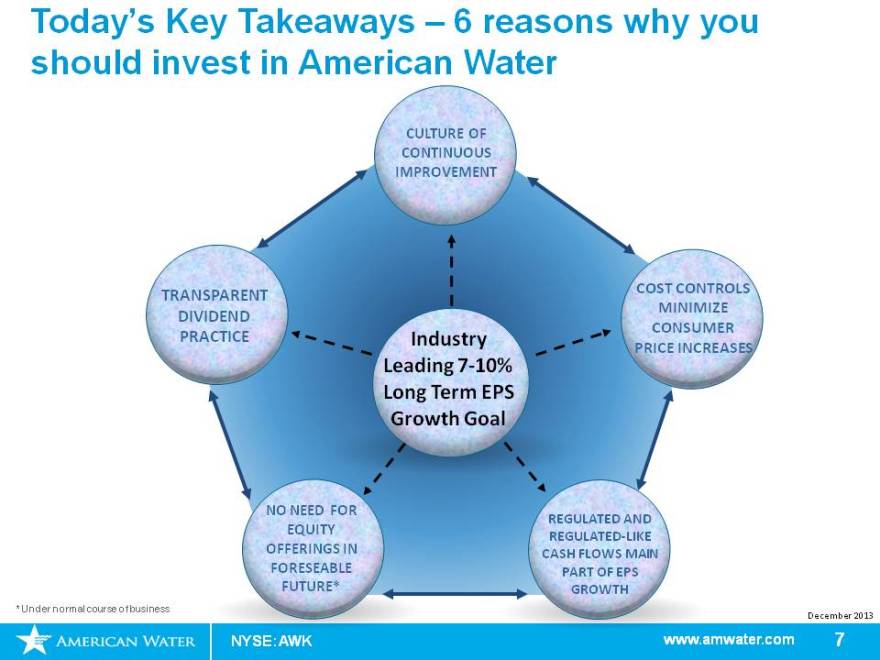
Today’s Key Takeaways – 6 reasons why you should invest in American Water
CULTURE OF
CONTINUOUS
IMPROVEMENT
TRANSPARENT COST CONTROLS
DIVIDEND MINIMIZE
CONSUMER
PRACTICE Industry PRICE INCREASES
Leading 7-10%
Long Term EPS
Growth Goal
NO NEED FOR REGULATED AND
EQUITY REGULATED-LIKE
OFFERINGS IN CASH FLOWS MAIN
FORESEABLE PART OF EPS
FUTURE* GROWTH
* Under normal course of business
December 2013
NYSE: AWK www.amwater.com 7
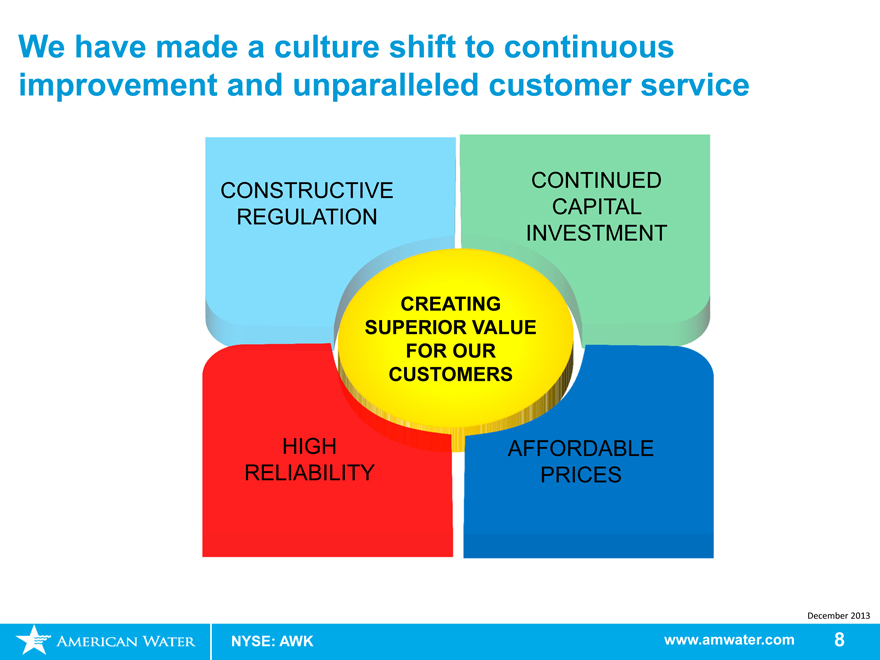
We have made a culture shift to continuous improvement and unparalleled customer service
CONSTRUCTIVE
CONTINUED
REGULATION
CAPITAL
INVESTMENT
CREATING
SUPERIOR VALUE
FOR OUR
CUSTOMERS
HIGH
AFFORDABLE
RELIABILITY
PRICES
December 2013
NYSE: AWK www.amwater.com 8
High customer satisfaction ultimately leads to creating superior value for all constituents
Inputs
Results in
Which leads to
Outstanding customer service
Effective Cost Management
Innovation & Technology
Strong regulatory relationships
Community Involvement
High customer satisfaction
Clean, safe, reliable and affordable water
Smart Growth
Strong Financial Growth
Constructive regulatory relationships
December 2013
NYSE: AWK www.amwater.com 9
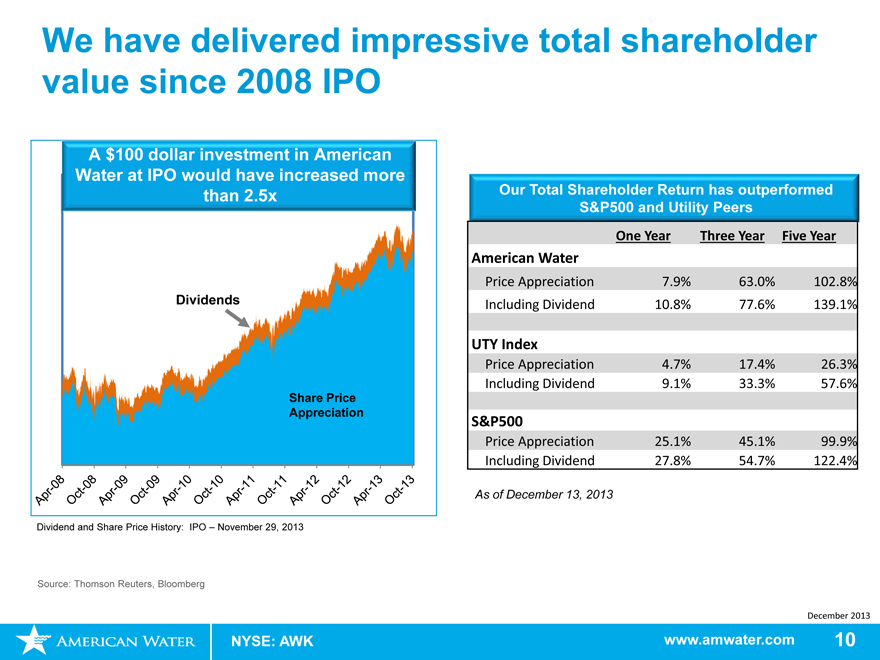
We have delivered impressive total shareholder value since 2008 IPO
A $100 dollar investment in American
Water at IPO would have increased more
than 2.5x
Dividends
Share Price
Appreciation
Dividend and Share Price History: IPO – November 29, 2013
Our Total Shareholder Return has outperformed
S&P500 and Utility Peers
One Year
Three Year
Five Year
American Water
Price Appreciation
79%.
63.0%
102.8%
Including Dividend
10.8%
77.6%
139.1%
UTY Index
Price Appreciation
4.7%
17.4%
26.3%
Including Dividend
9.1%
33.3%
57.6%
S&P500
Price Appreciation
25.1%
45.1%
99.9%
Including Dividend
27.8%
54.7%
122.4%
As of December 13, 2013
Source: Thomson Reuters, Bloomberg
December 2013
NYSE: AWK www.amwater.com 10
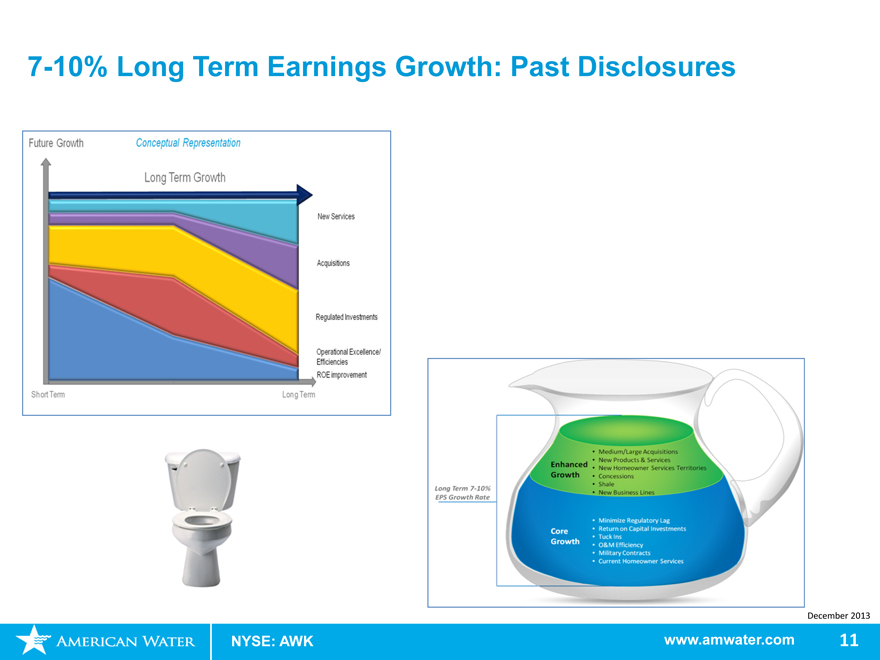
7-10% Long Term Earnings Growth: Past Disclosures
Future Growth
Conceptual Representation
Long Term Growth
New Services
Acquisitions
Regulated Investments
Operational Excellence/Efficiencies
ROE improvement
Short Term
Long Term
Long Term 7-10%
EPS Growth Rate
Enhanced Growth
Medium/Large Acquisitions
New Products & Services
New Homeowner Services Territories
Concessions
Shale
New Business Lines
Core Growth
Minimize Regulatory Lag
Return on Capital Investments
Tuck Ins
O&M Efficiency
Military Contracts
Current Homeowner Services
December 2013
NYSE: AWK www.amwater.com 11
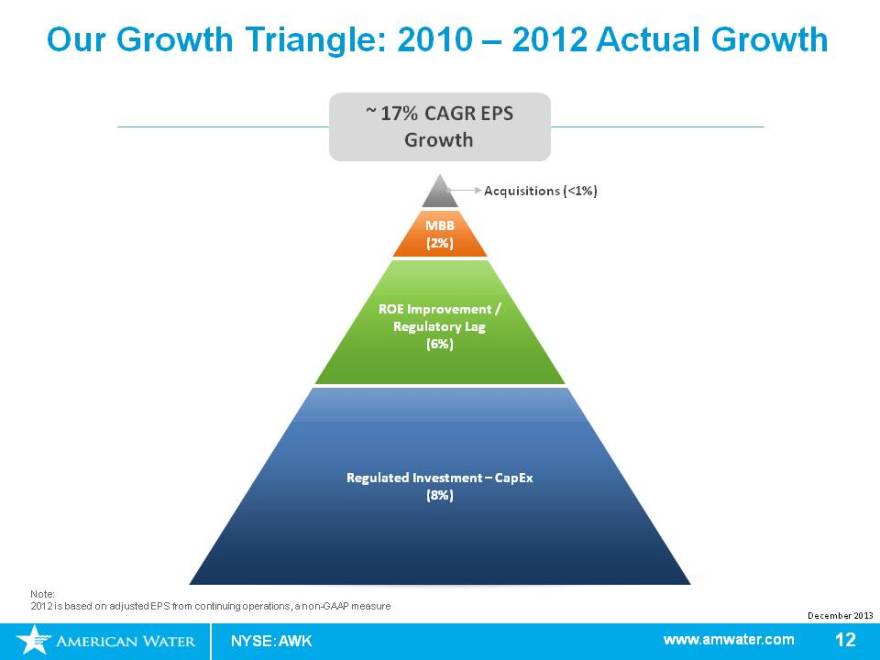
Our Growth Triangle: 2010 – 2012 Actual Growth
~ 17% CAGR EPS
Growth
Acquisitions (<1%)
MBB
(2%)
ROE Improvement /
Regulatory Lag
(6%)
Regulated Investment – CapEx
(8%)
Note:
2012 is based on adjusted EPS from continuing operations, a non-GAAP measure
December 2013
NYSE: AWK www.amwater.com 12
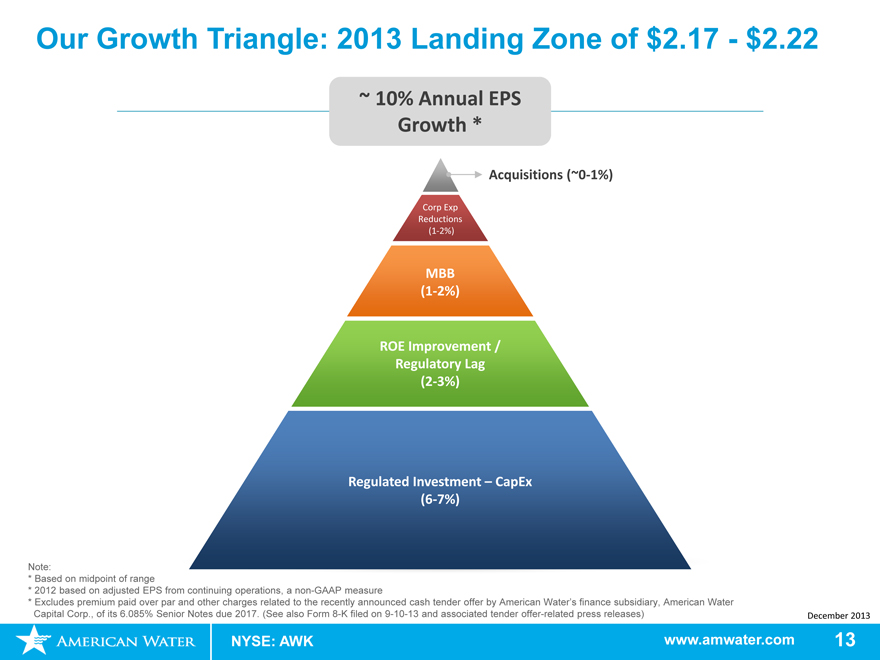
Our Growth Triangle: 2013 Landing Zone of $2.17—$2.22
~ 10% Annual EPS
Growth *
Acquisitions (~0-1%)
Corp Exp
Reductions
(1-2%)
MBB
(1-2%)
ROE Improvement /
Regulatory Lag
(2-3%)
Regulated Investment – CapEx
(6-7%)
Note:
* Based on midpoint of range
* 2012 based on adjusted EPS from continuing operations, a non-GAAP measure
* Excludes premium paid over par and other charges related to the recently announced cash tender offer by American Water’s finance subsidiary, American Water
Capital Corp., of its 6.085% Senior Notes due 2017. (See also Form 8-K filed on 9-10-13 and associated tender offer-related press releases)
December 2013
NYSE: AWK www.amwater.com 13
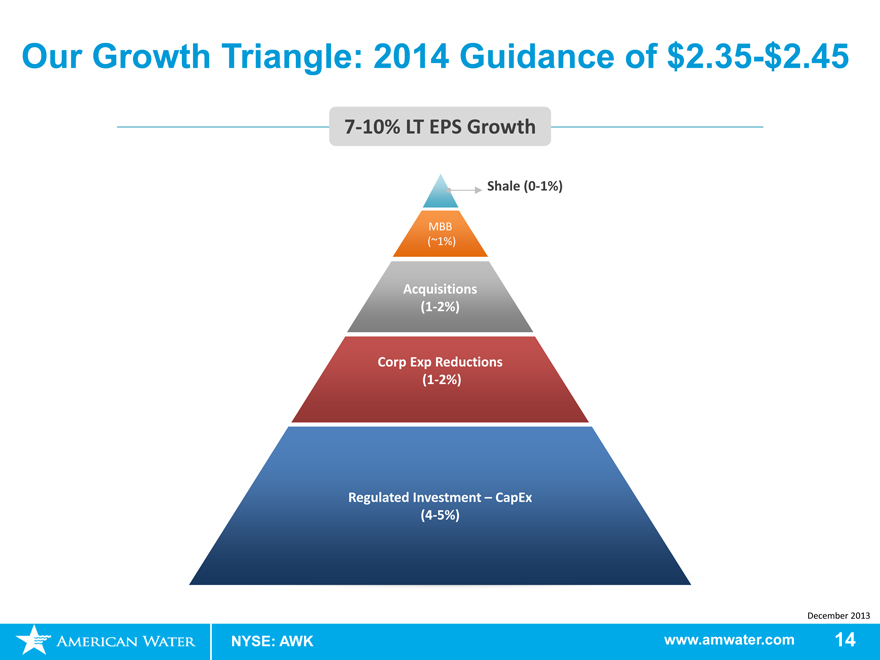
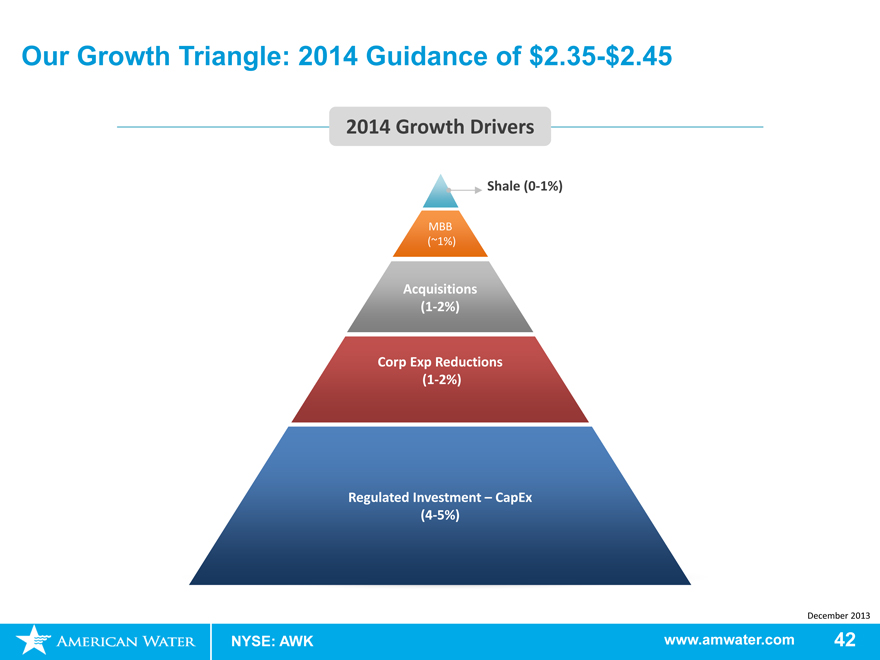
Our Growth Triangle: 2014 Guidance of $2.35-$2.45
7-10% LT EPS Growth
Shale (0-1%)
MBB
(~1%)
Acquisitions
(1-2%)
Corp Exp Reductions
(1-2%)
Regulated Investment – CapEx
(4-5%)
December 2013
NYSE: AWK www.amwater.com 14
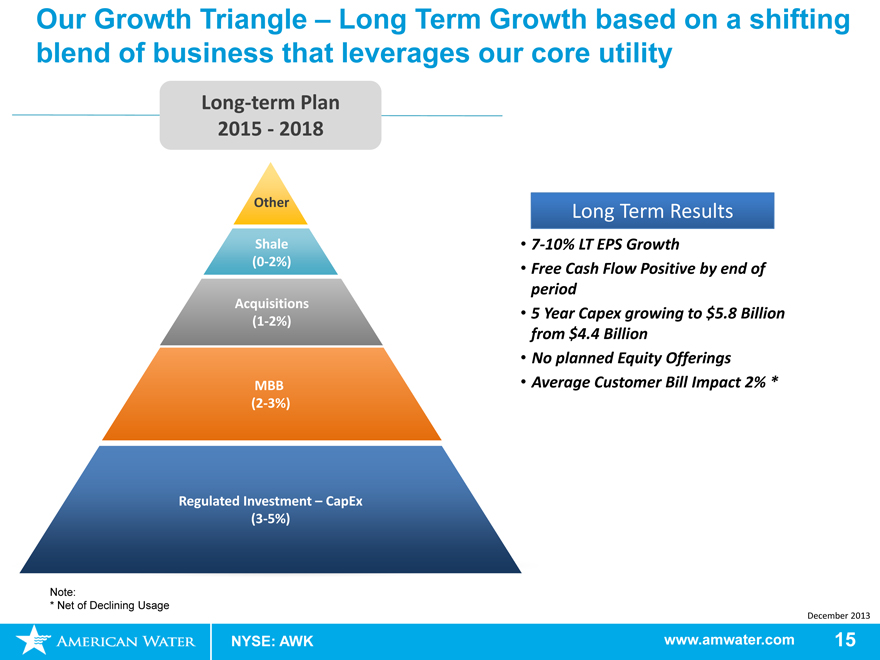
Our Growth Triangle – Long Term Growth based on a shifting blend of business that leverages our core utility
Long-term Plan
2015—2018
Other
Shale
(0-2%)
(<1%)
Acquisitions
(1-2%)
MBB
(2-3%)
Regulated Investment – CapEx
(3-5%)
Long Term Results
7-10% LT EPS Growth
Free Cash Flow Positive by end of period
5 Year Capex growing to $5.8 Billion from $4.4 Billion
No planned Equity Offerings
Average Customer Bill Impact 2% *
Note:
* Net of Declining Usage
December 2013
NYSE: AWK www.amwater.com 15
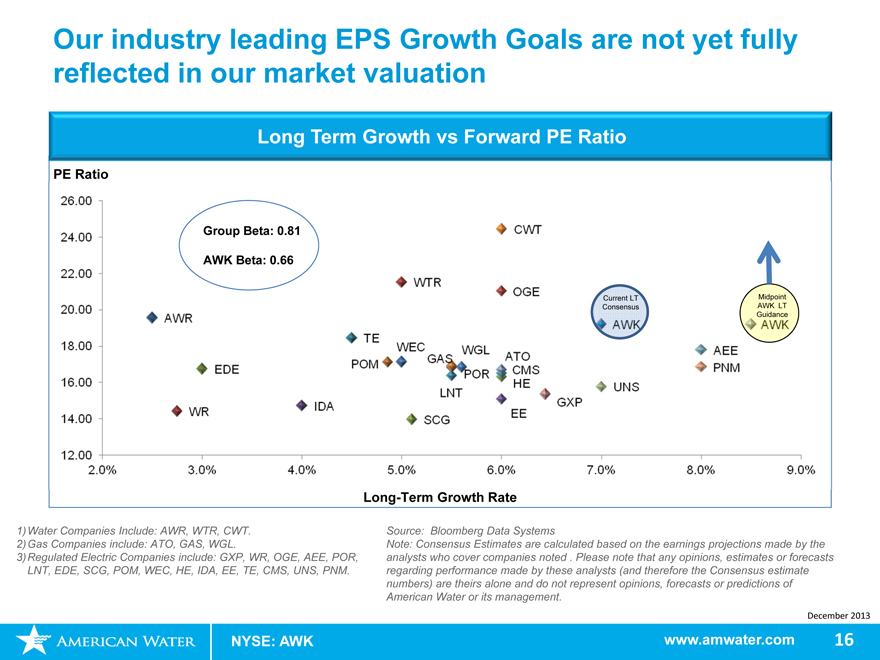
Our industry leading EPS Growth Goals are not yet fully reflected in our market valuation
Long Term Growth vs Forward PE Ratio
PE Ratio
Group Beta: 0.81
AWK Beta: 0.66
Current LT Midpoint
Consensus AWK LT
Guidance
Long-Term Growth Rate
1)Water Companies Include: AWR, WTR, CWT. 2)Gas Companies include: ATO, GAS, WGL.
3)Regulated Electric Companies include: GXP, WR, OGE, AEE, POR, LNT, EDE, SCG, POM, WEC, HE, IDA, EE, TE, CMS, UNS, PNM.
Source: Bloomberg Data Systems
Note: Consensus Estimates are calculated based on the earnings projections made by the analysts who cover companies noted . Please note that any opinions, estimates or forecasts regarding performance made by these analysts (and therefore the Consensus estimate numbers) are theirs alone and do not represent opinions, forecasts or predictions of American Water or its management.
December 2013
NYSE: AWK www.amwater.com 16
NYSE: AWK
Our success is built on …
Regulated Operations Overview Walter Lynch
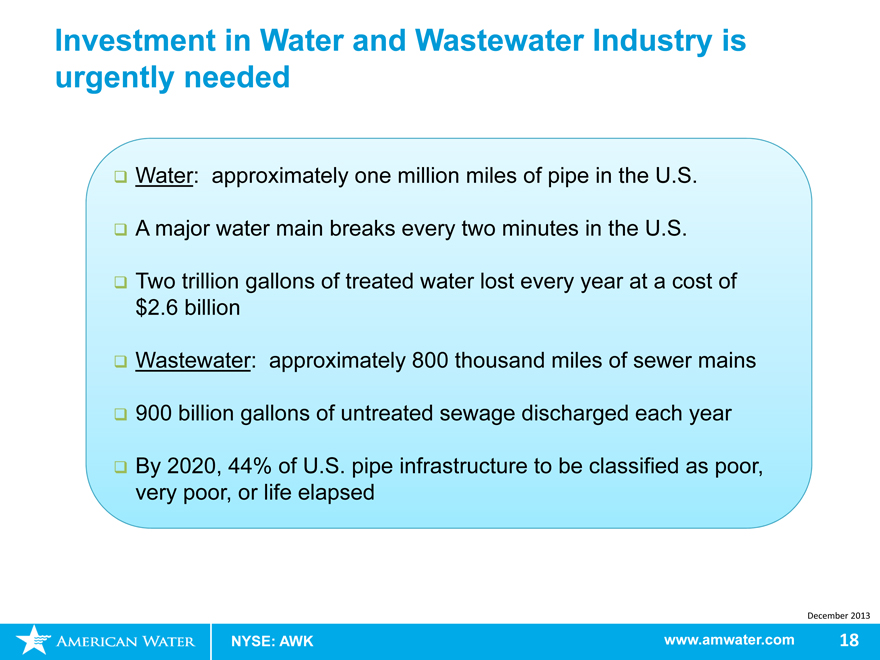
Investment in Water and Wastewater Industry is urgently needed
Water: approximately one million miles of pipe in the U.S.
A major water main breaks every two minutes in the U.S.
Two trillion gallons of treated water lost every year at a cost of $2.6 billion
Wastewater: approximately 800 thousand miles of sewer mains
900 billion gallons of untreated sewage discharged each year
By 2020, 44% of U.S. pipe infrastructure to be classified as poor, very poor, or life elapsed
December 2013
NYSE: AWK www.amwater.com 18
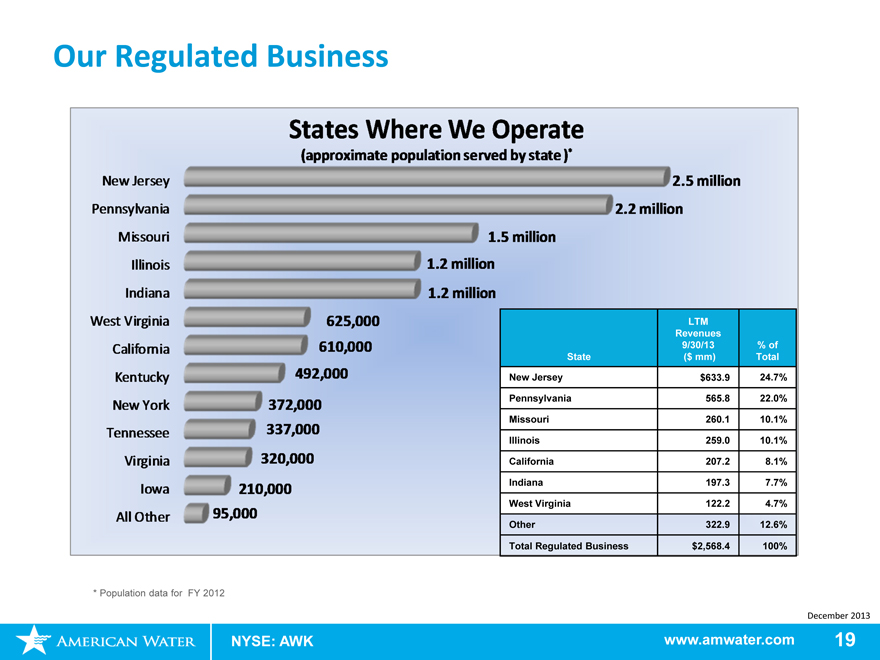
Our Regulated Business
States Where We Operate
(approximate population served by state )*
New Jersey 2.5 million
Pennsylvania 2.2 million
Missouri 1.5 million
Illinois 1.2 million
Indiana 1.2 million
West Virginia 625,000 LTM
Revenues
California 610,000 9/30/13% of
State($ mm) Total
Kentucky 492,000 New Jersey $633.9 24.7%
New York 372,000 Pennsylvania 565.8 22.0%
Missouri 260.1 10.1%
Tennessee 337,000 Illinois 259.0 10.1%
Virginia 320,000 California 207.2 8.1%
Iowa 210,000 Indiana 197.3 7.7%
West Virginia 122.2 4.7%
All Other 95,000 Other 322.9 12.6%
Total Regulated Business $2,568.4 100%
* Population data for FY 2012
December 2013
NYSE: AWK www.amwater.com 19
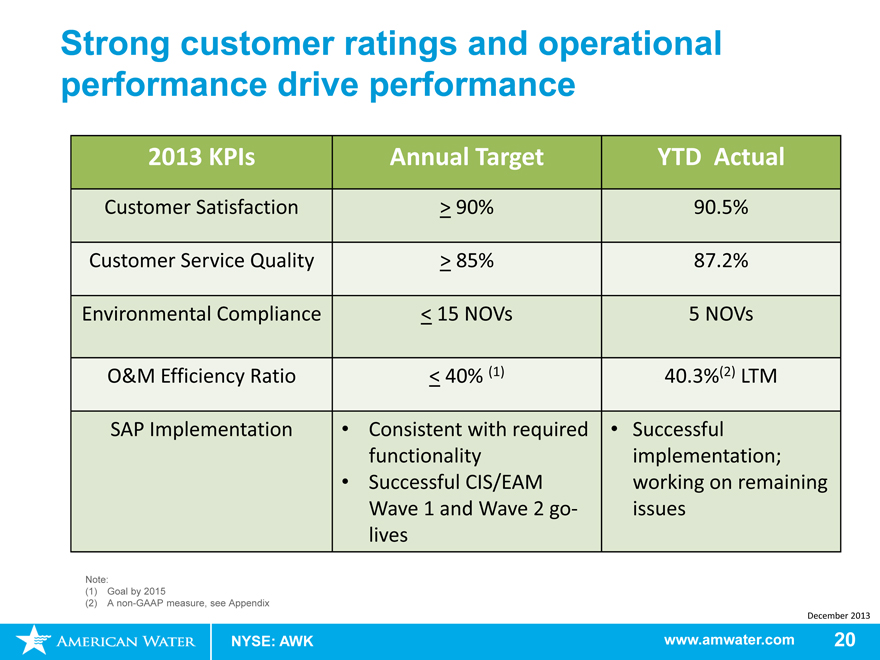
Strong customer ratings and operational performance drive performance
2013 KPIs Annual Target YTD Actual
Customer Satisfaction > 90% 90.5%
Customer Service Quality > 85% 87.2%
Environmental Compliance < 15 NOVs 5 NOVs
O&M Efficiency Ratio < 40% (1) 40.3%(2) LTM
SAP Implementation • Consistent with required • Successful
functionality implementation;
• Successful CIS/EAM working on remaining
Wave 1 and Wave 2 go- issues
lives
Note:
(1) Goal by 2015
(2) A non-GAAP measure, see Appendix
December 2013
NYSE: AWK www.amwater.com 20
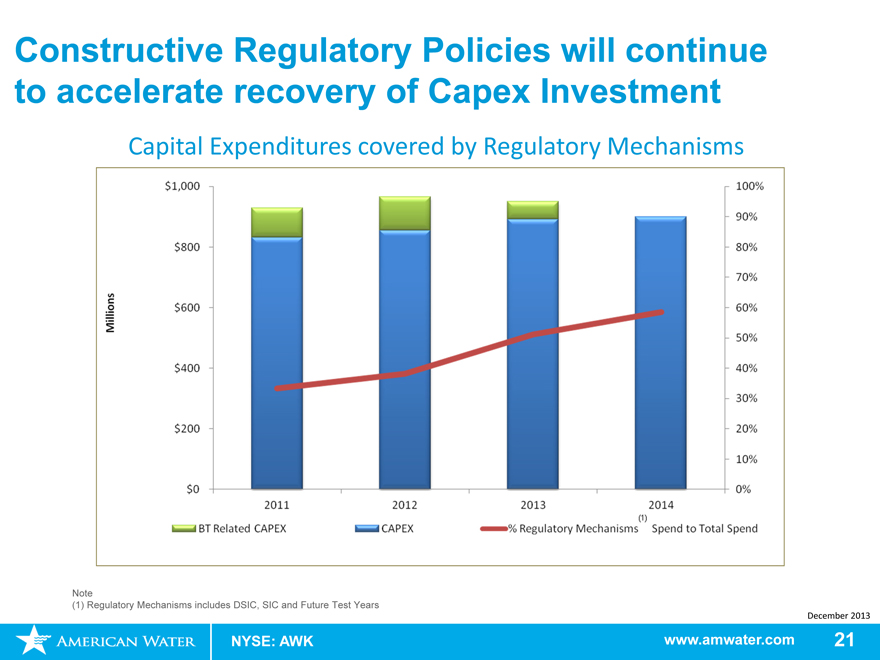
Constructive Regulatory Policies will continue to accelerate recovery of Capex Investment
Capital Expenditures covered by Regulatory Mechanisms
Note
(1) Regulatory Mechanisms includes DSIC, SIC and Future Test Years
December 2013
NYSE: AWK www.amwater.com 21
2014 Financial Plan- Summary
Capital Expenditure
($ in millions)
$1,200
$1,000
$800
$600
$400
$200
$0
2012 Actual 2013 Landing 2014 Plan 2015E 2016E 2017E 2018E
Zone
Regulated & Services Strategic Investment Regulated Acquisitions Market-Based Business
December 2013
NYSE: AWK www.amwater.com 22
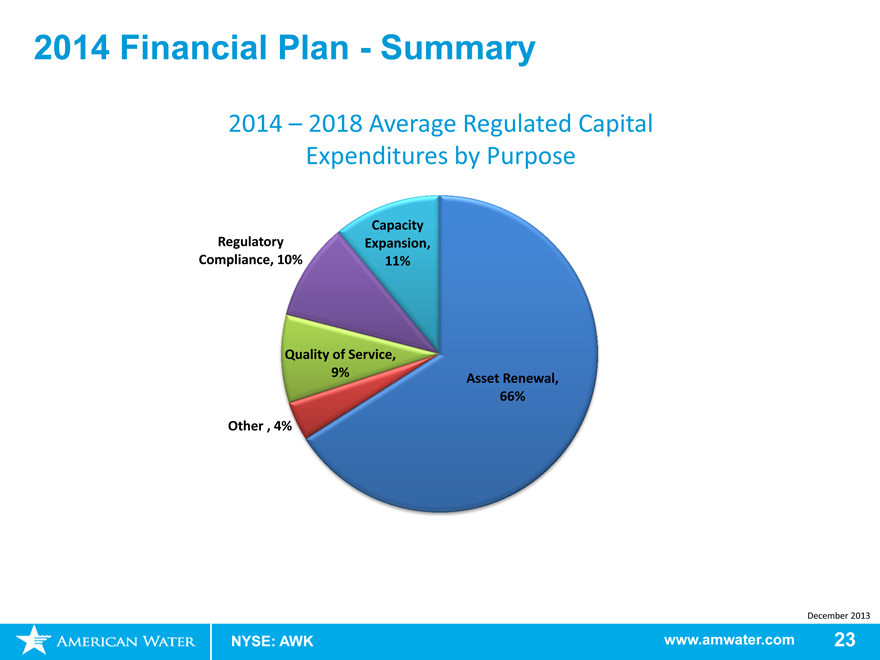
2014 Financial Plan—Summary
2014 – 2018 Average Regulated Capital Expenditures by Purpose
Capacity
Regulatory Expansion,
Compliance, 10% 11%
Quality of Service,
9%
Asset Renewal,
66%
Other , 4%
December 2013
NYSE: AWK www.amwater.com 23
Cost containment and timely return on our investments will drive added Capital Expenditures
O&M Efficiency Ratio
50%
44.2
42.4
40.1 39.5
40%
35.0
30%
20%
10%
0%
2010 2011 2012 2013Landing New 2018
Zone (LZ) Stretch
Target
New O&M stretch target of 35% by 2018
Pipe Replacement Life
(in years)
300
250
200
National
150 average
100
50
0
2010 2011 2012 2013LZ 2014E
Pipe Replacement life is shortening
December 2013
NYSE: AWK www.amwater.com 24
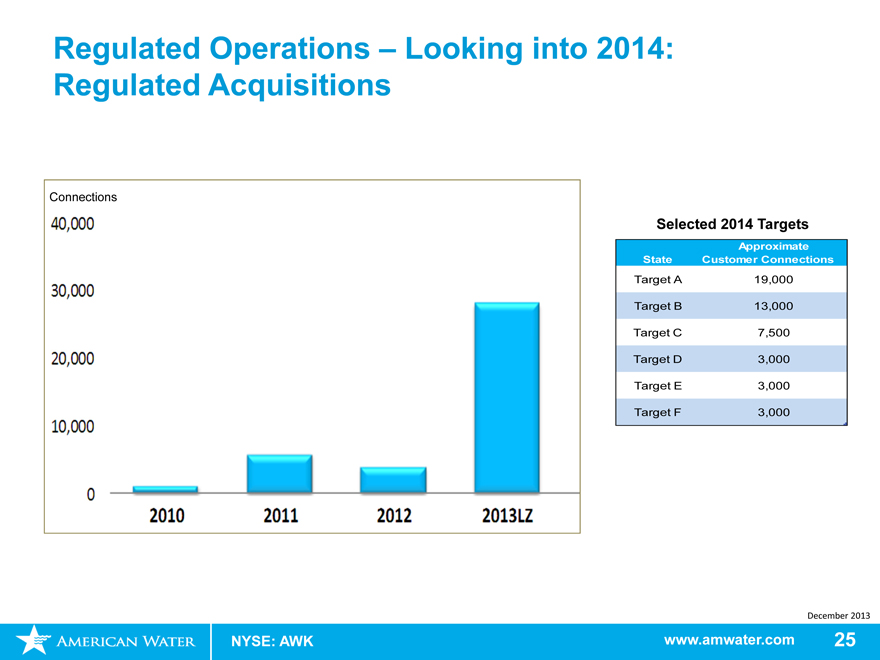
Regulated Operations – Looking into 2014: Regulated Acquisitions
Connections
Selected 2014 Targets
Approximate
State
Customer Connections
Target A
19,000
Target B
13,000
Target C
7,500
Target D
3,000
Target E
3,000
Target F
3,000
December 2013
NYSE: AWK
www.amwater.com
25
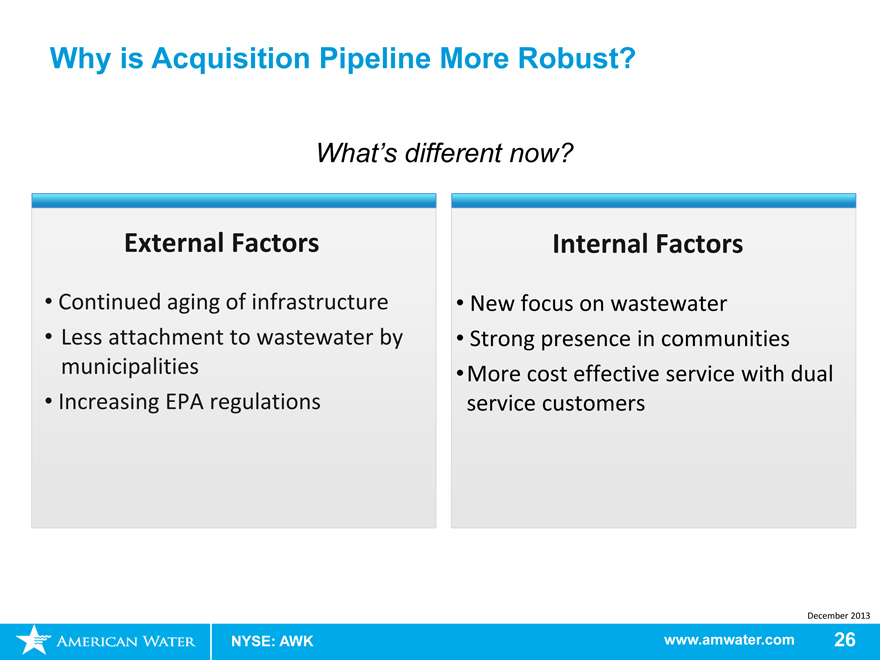
Why is Acquisition Pipeline More Robust?
What’s different now?
External Factors Internal Factors
Continued aging of infrastructure New focus on wastewater
Less attachment to wastewater by Strong presence in communities
municipalities • More cost effective service with dual
Increasing EPA regulations service customers
December 2013
NYSE: AWK www.amwater.com 26
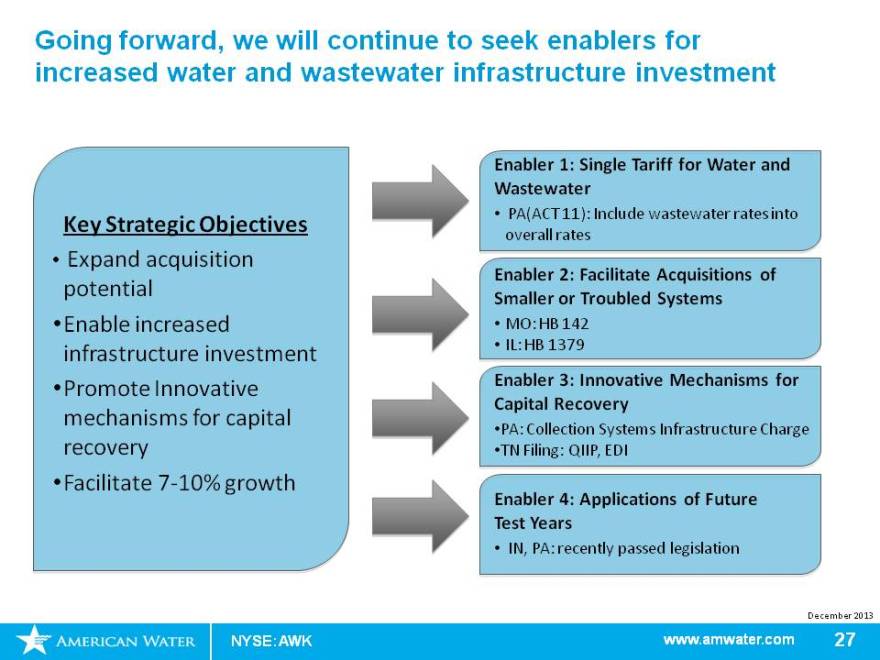
Going forward, we will continue to seek enablers for increased water and wastewater infrastructure investment
Key Strategic Objectives
Expand acquisition potential Enable increased infrastructure investment Promote Innovative mechanisms for capital recovery Facilitate 7-10% growth
Enabler 1: Single Tariff for Water and Wastewater
PA(ACT 11): Include wastewater rates into overall rates
Enabler 2: Facilitate Acquisitions of Smaller or Troubled Systems
MO: HB 142
IL: HB 1379
Enabler 3: Innovative Mechanisms for Capital Recovery
PA: Collection Systems Infrastructure Charge TN Filing: QIIP, EDI
Enabler 4: Applications of Future Test Years
IN, PA: recently passed legislation
December 2013
NYSE: AWK www.amwater.com 27
NYSE: AWK
Our success is built on …
Market Based Operations Overview Sharon Cameron
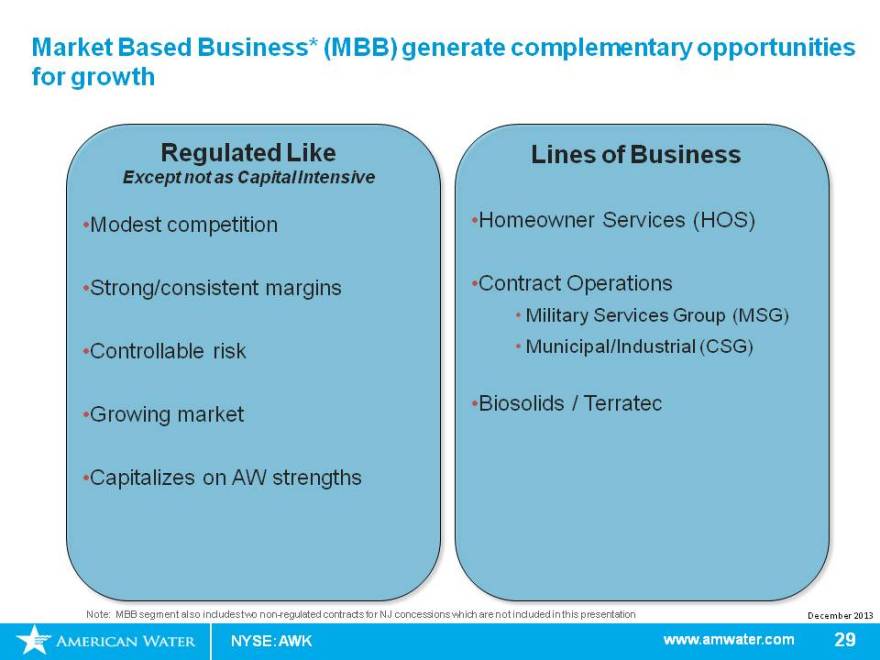
Market Based Business* (MBB) generate complementary opportunities for growth
Regulated Like
Except not as Capital Intensive
Modest competition Strong/consistent margins Controllable risk Growing market Capitalizes on AW strengths
Lines of Business
Homeowner Services (HOS)
Contract Operations
Military Services Group (MSG)
Municipal/Industrial (CSG)
Biosolids / Terratec
Note: MBB segment also includes two non-regulated contracts for NJ concessions which are not included in this presentation
December 2013
NYSE: AWK www.amwater.com 29
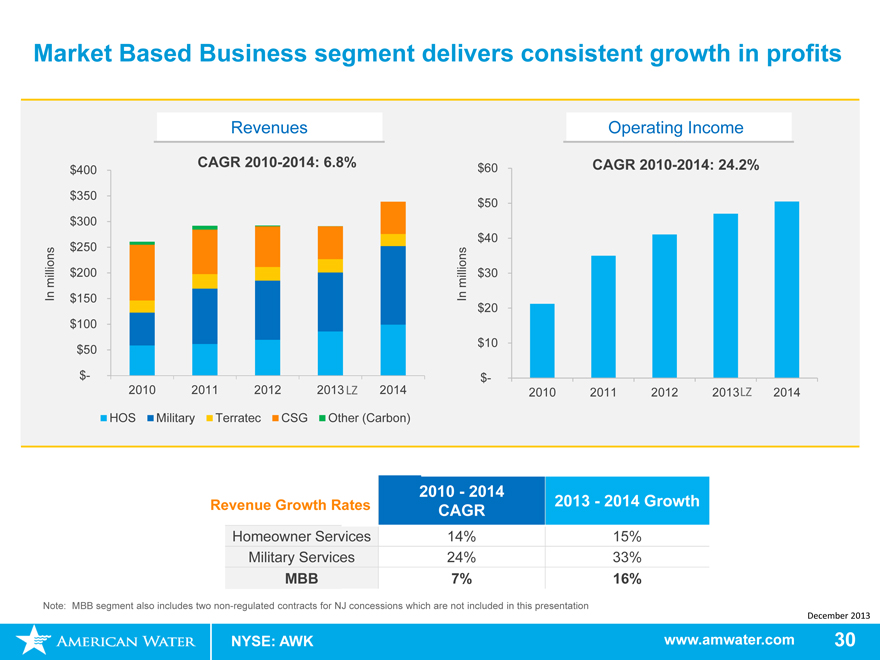
Market Based Business segment delivers consistent growth in profits
Revenues Operating Income
$400 CAGR 2010-2014: 6.8% $60 CAGR 2010-2014: 24.2%
$350 $50
$300
$40
$250
millions $200 millions $30
In $150 In
$20
$100
$50 $10
$- $-
2010 2011 2012 2013 LZ 2014 2010 2011 2012 2013LZ 2014
HOS Military Terratec CSG Other (Carbon)
2010—2014
Revenue Growth Rates CAGR 2013—2014 Growth
Homeowner Services 14% 15%
Military Services 24% 33%
MBB 7% 16%
Note: MBB segment also includes two non-regulated contracts for NJ concessions which are not included in this presentation
December 2013
NYSE: AWK www.amwater.com 30
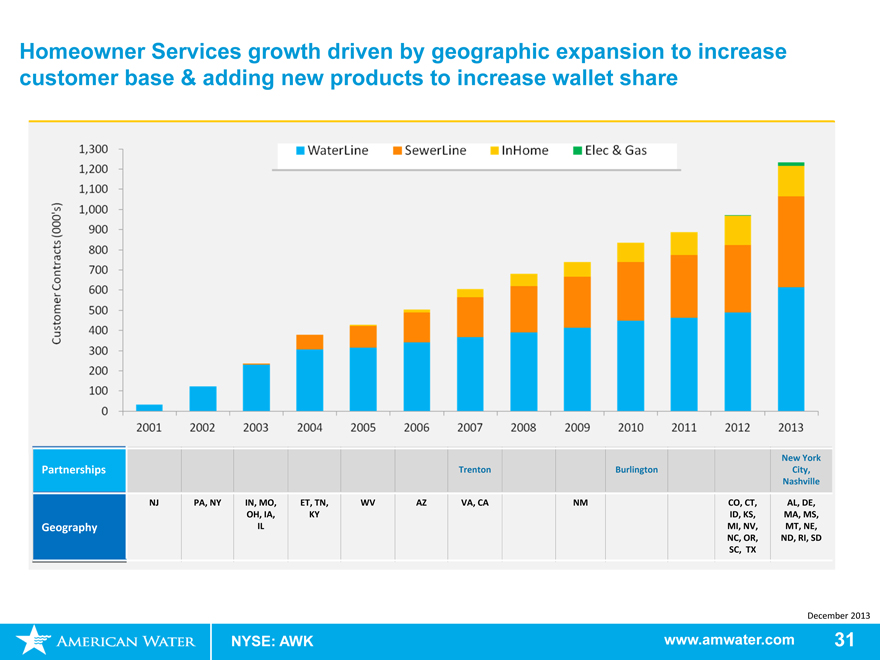
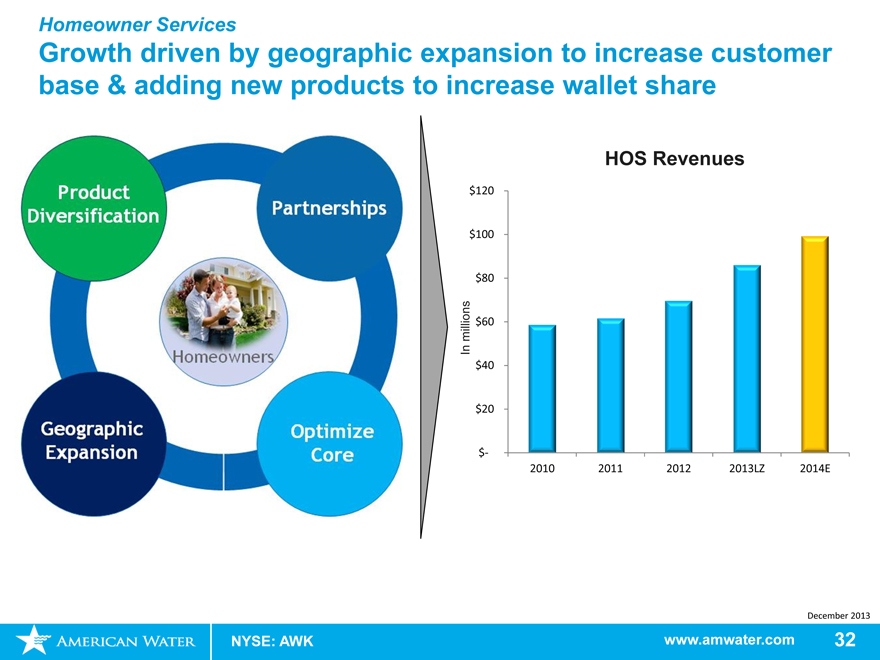
Homeowner Services growth driven by geographic expansion to increase customer base & adding new products to increase wallet share
New York
Partnerships Trenton Burlington City,
Nashville
NJ PA, NY IN, MO, ET, TN, WV AZ VA, CA NM CO, CT, AL, DE,
OH, IA, KY ID, KS, MA, MS,
Geography IL MI, NV, MT, NE,
NC, OR, ND, RI, SD
SC, TX
December 2013
NYSE: AWK www.amwater.com 31
Homeowner Services
Growth driven by geographic expansion to increase customer base & adding new products to increase wallet share
Product Diversification
Partnerships
Homeowners
Geographic Expansion
Optimize Core
HOS Revenues
$120
$100
$80
millions $60
In
$40
$20
$-
2010 2011 2012 2013LZ 2014E
December 2013
NYSE: AWK www.amwater.com 32
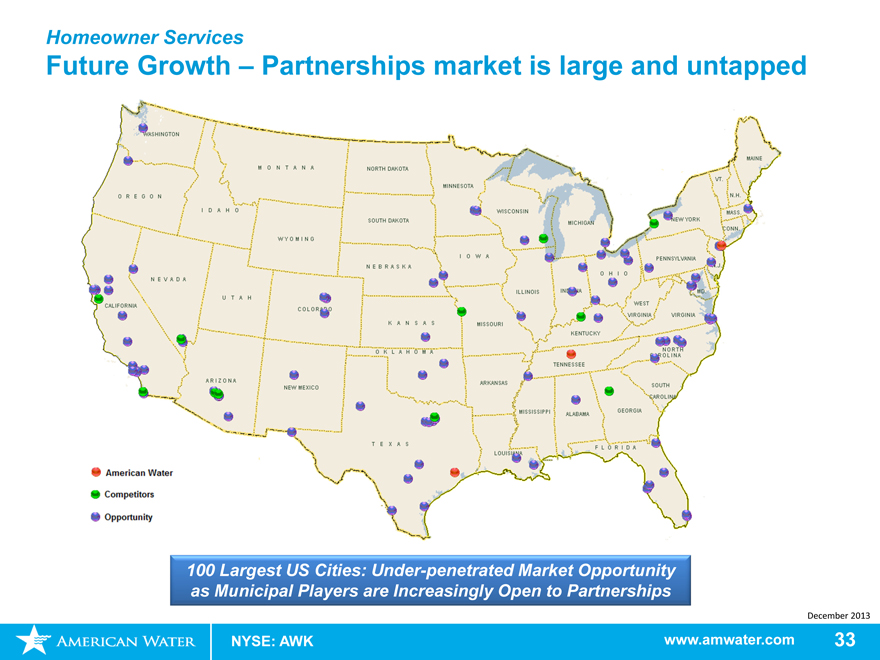
Homeowner Services
Future Growth – Partnerships market is large and untapped
100 Largest US Cities: Under-penetrated Market Opportunity as Municipal Players are Increasingly Open to Partnerships
December 2013
NYSE: AWK www.amwater.com 33
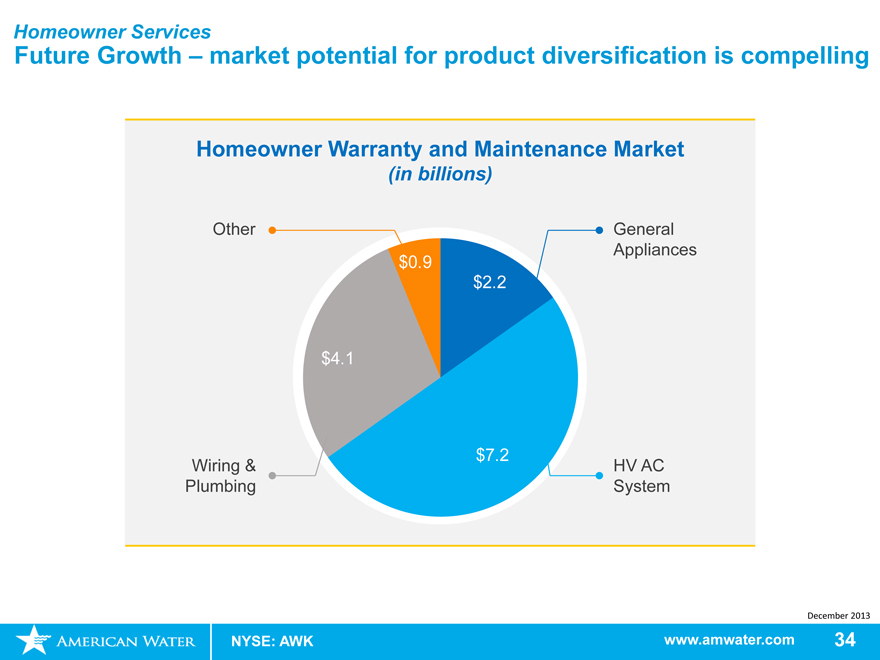
Homeowner Services
Future Growth – market potential for product diversification is compelling
Homeowner Warranty and Maintenance Market
(in billions)
Other General
Appliances
$0.9
$2.2
$4.1
$7.2
Wiring & HV AC
Plumbing System
December 2013
NYSE: AWK www.amwater.com 34
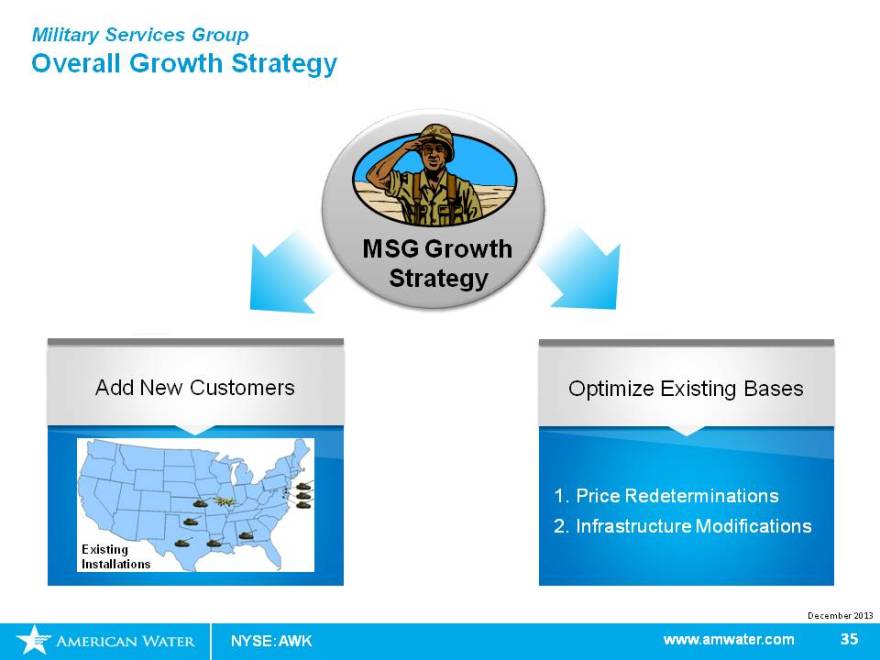
Military Services Group
Overall Growth Strategy
MSG Growth
Strategy
Add New Customers Optimize Existing Bases
1. Price Redeterminations
2. Infrastructure Modifications
Existing
Installations
December 2013
NYSE: AWK www.amwater.com 35
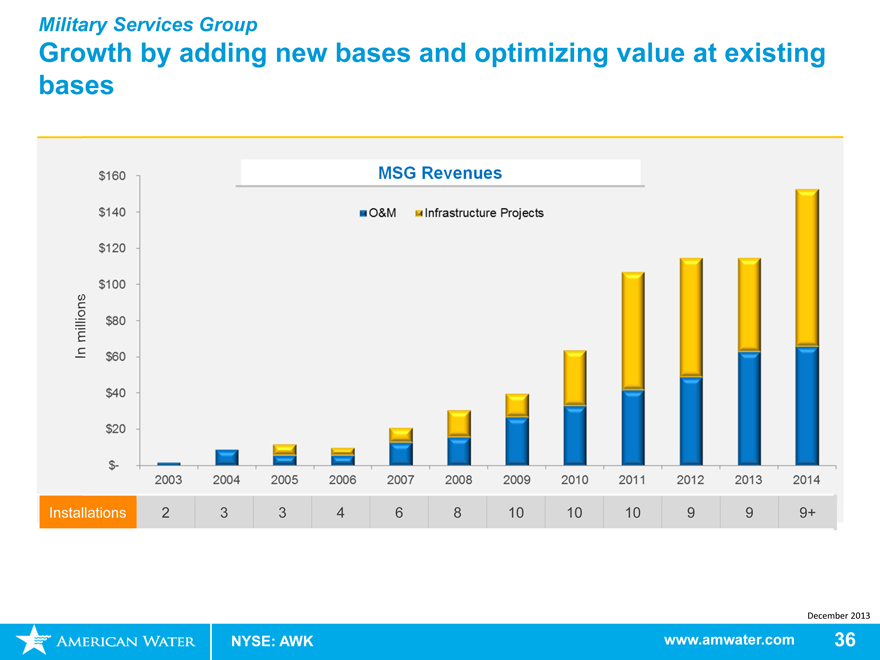
Military Services Group
Growth by adding new bases and optimizing value at existing bases
MSG Revenues
millions
In
Installations 2 3 3 4 6 8 10 10 10 9 9 9+
December 2013
NYSE: AWK www.amwater.com 36
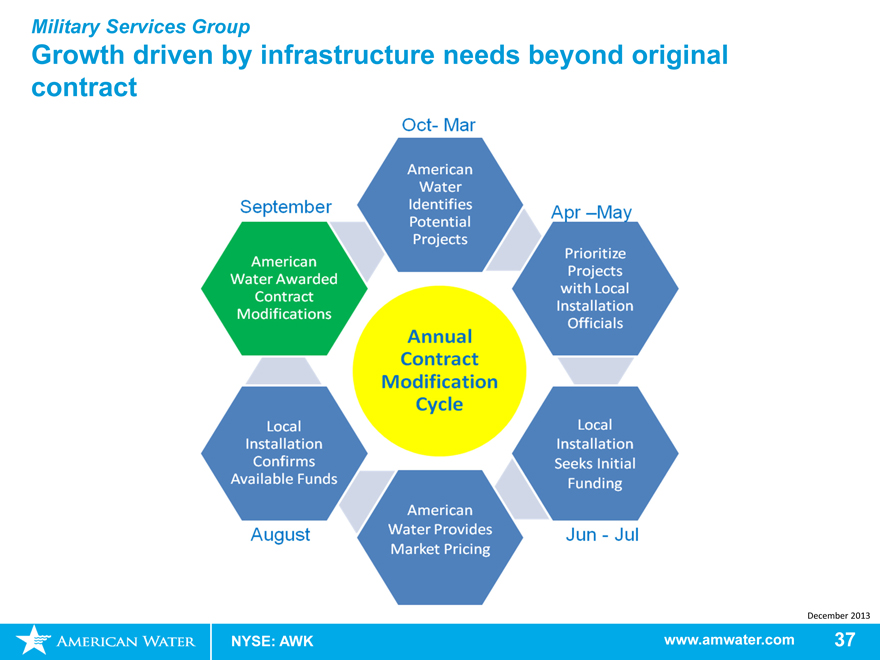
Military Services Group
Growth driven by infrastructure needs beyond original contract
Oct- Mar
American Water Identifies Potential Projects
September
American Water Awarded Contract Modifications
Apr – May
Prioritize Projects with Local Installation Officials
Local Installation Confirms Available Funds
August
American Water Provides Market Pricing
Local Installation Seeks Initial Funding
Jun – Jul
Annual Contract Modification Cycle
December 2013
NYSE: AWK www.amwater.com 37
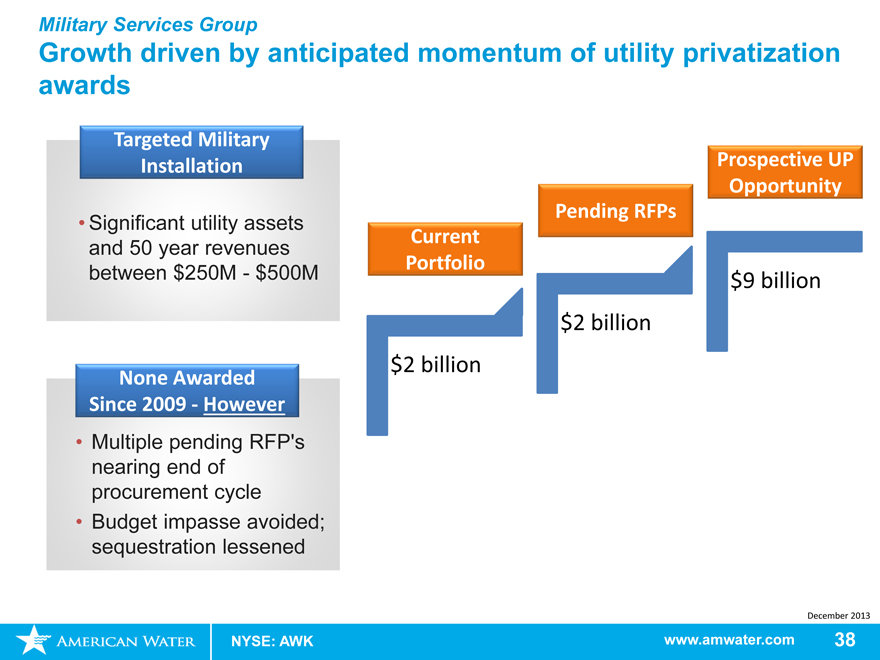
Military Services Group
Growth driven by anticipated momentum of utility privatization awards
Targeted Military
Installation Prospective UP
Opportunity
Significant utility assets Pending RFPs
and 50 year revenues Current
Portfolio
between $250M—$500M $9 billion
$2 billion
$2 billion
None Awarded
Since 2009—However
• Multiple pending RFP’s
nearing end of
procurement cycle
• Budget impasse avoided;
sequestration lessened
December 2013
NYSE: AWK www.amwater.com 38
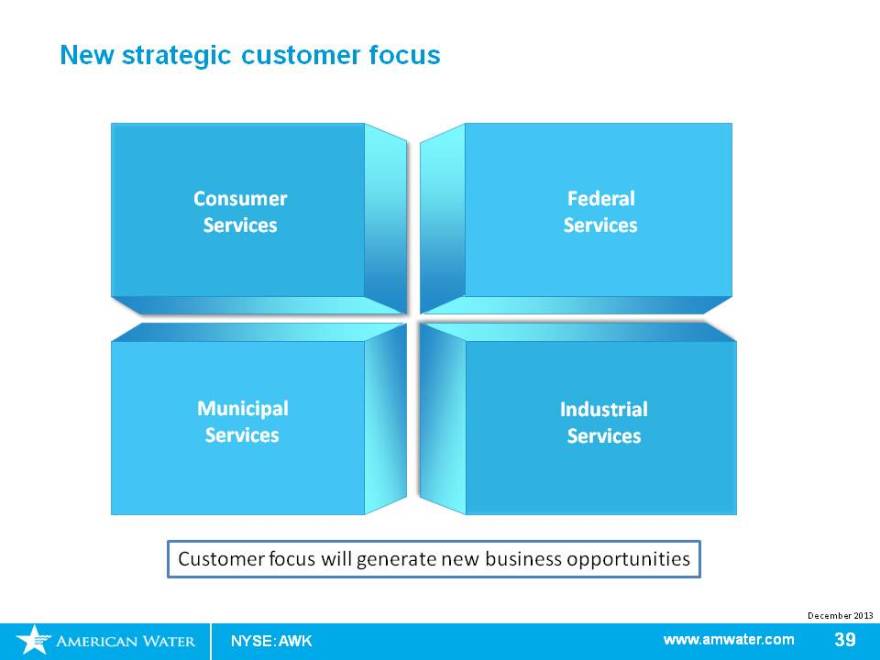
New strategic customer focus
Consumer
Federal
Services
Services
Municipal
Industrial
Services
Services
Customer focus will generate new business opportunities
December 2013
NYSE: AWK www.amwater.com 39
NYSE: AWK
Our Success results in:
Susan Story SVP and CFO
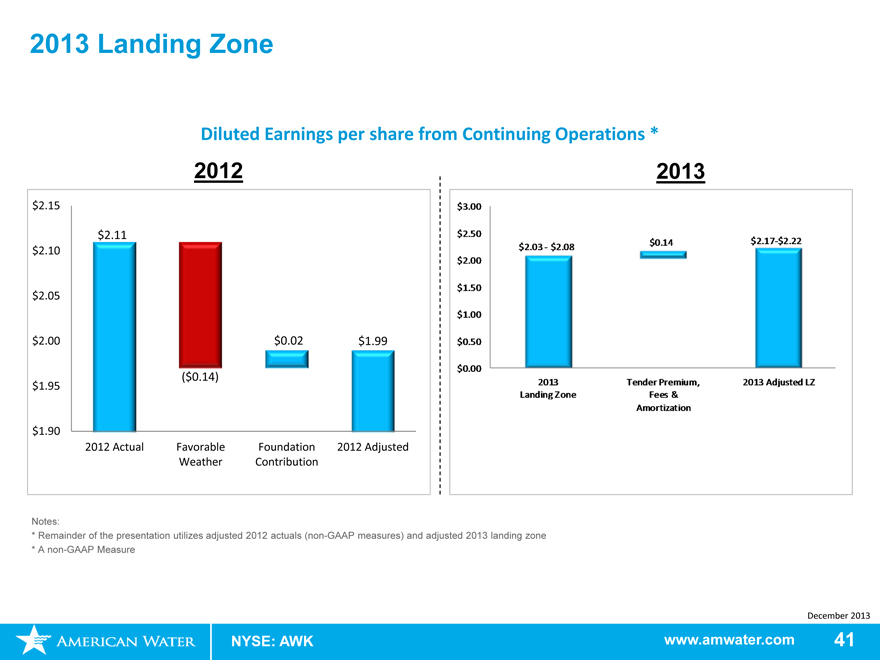
2013 Landing Zone
Diluted Earnings per share from Continuing Operations *
2012 2013
$ 2.15
$ 2.11
$ 2.10
$ 2.05
$ 2.00 $ 0.02 $ 1.99
($ 0.14)
$ 1.95
$ 1.90
2012 Actual Favorable Foundation 2012 Adjusted
Weather Contribution
$ 3.00
$ 2.50
$ 2.03—$ 2.08 $ 0.14 $ 2.17-$ 2.22
$ 2.00
$ 1.50
$ 1.00
$ 0.50
$ 0.00
2013 Tender Premium, 2013 Adjusted LZ
Landing Zone Fees &
Amortization
Notes:
* Remainder of the presentation utilizes adjusted 2012 actuals (non-GAAP measures) and adjusted 2013 landing zone
* A non-GAAP Measure
December 2013
NYSE: AWK www.amwater.com 41
Our Growth Triangle: 2014 Guidance of $2.35-$2.45
2014 Growth Drivers
Shale (0-1%)
MBB (~1%)
Acquisitions
(1-2%)
Corp Exp Reductions
(1-2%)
Regulated Investment – CapEx
(4-5%)
December 2013
NYSE: AWK www.amwater.com 42
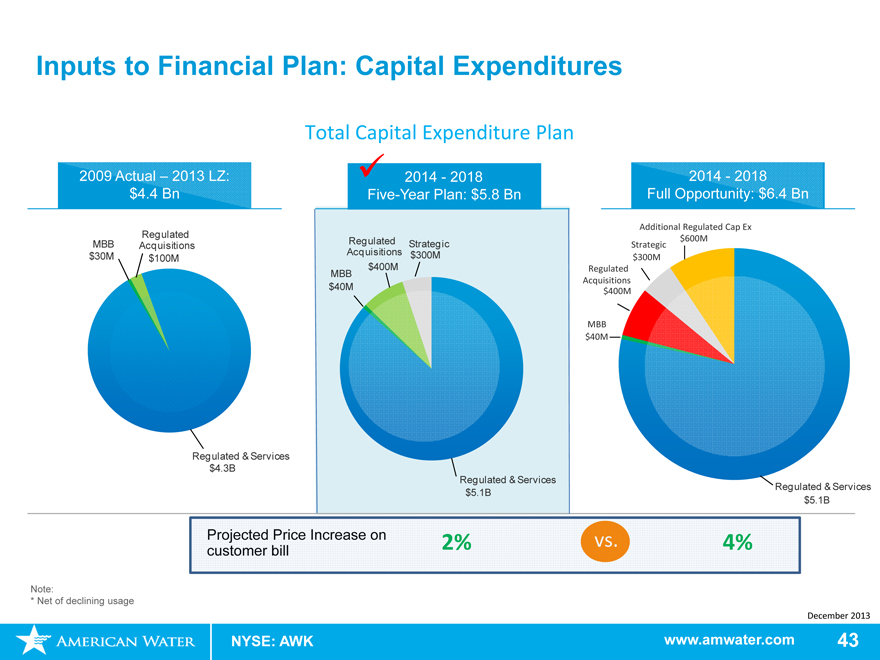
Inputs to Financial Plan: Capital Expenditures
Total Capital Expenditure Plan
2009 Actual – 2013 LZ:
$4.4 Bn
Regulated
MBB Acquisitions
$30M $100M
Regulated & Services
$4.3B
2014—2018
Five-Year Plan: $5.8 Bn
Regulated Strategic
Acquisitions $300M
$400M
MBB
$40M
Regulated & Services
$5.1B
2014—2018
Full Opportunity: $6.4 Bn
Additional Regulated Cap Ex
$600M
Strategic
$300M
Regulated
Acquisitions
$400M
MBB
$40M
Regulated & Services
$5.1B
Projected Price Increase on 2% vs. 4% customer bill
Note:
* Net of declining usage
December 2013
NYSE: AWK www.amwater.com 43
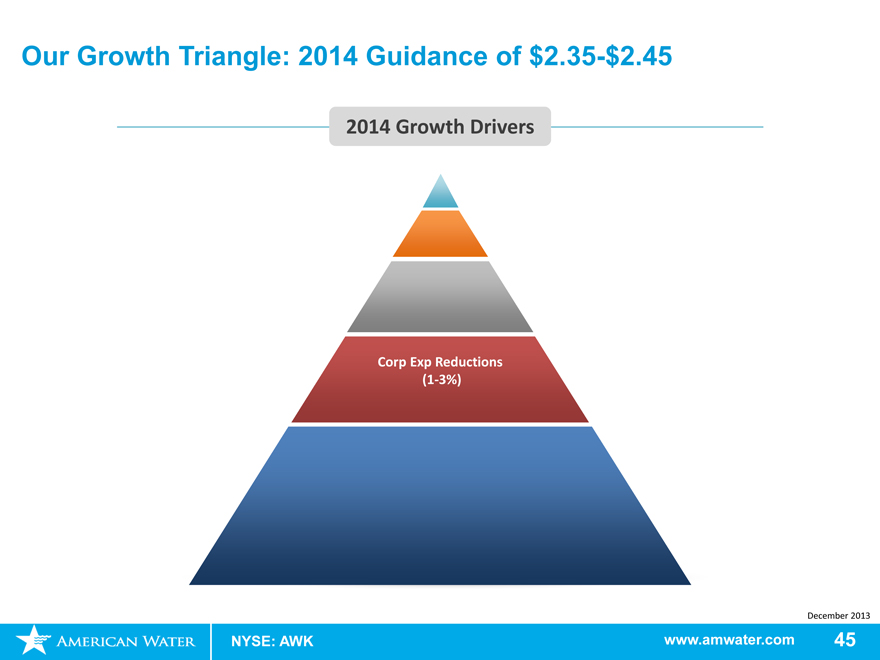
Our Growth Triangle: 2014 Guidance of $2.35-$2.45
2014 Growth Drivers
Shale (0-1%)
MBB (~1%)
December 2013
NYSE: AWK www.amwater.com 44
Our Growth Triangle: 2014 Guidance of $2.35-$2.45
2014 Growth Drivers
Corp Exp Reductions
(1-3%)
December 2013
NYSE: AWK www.amwater.com 45
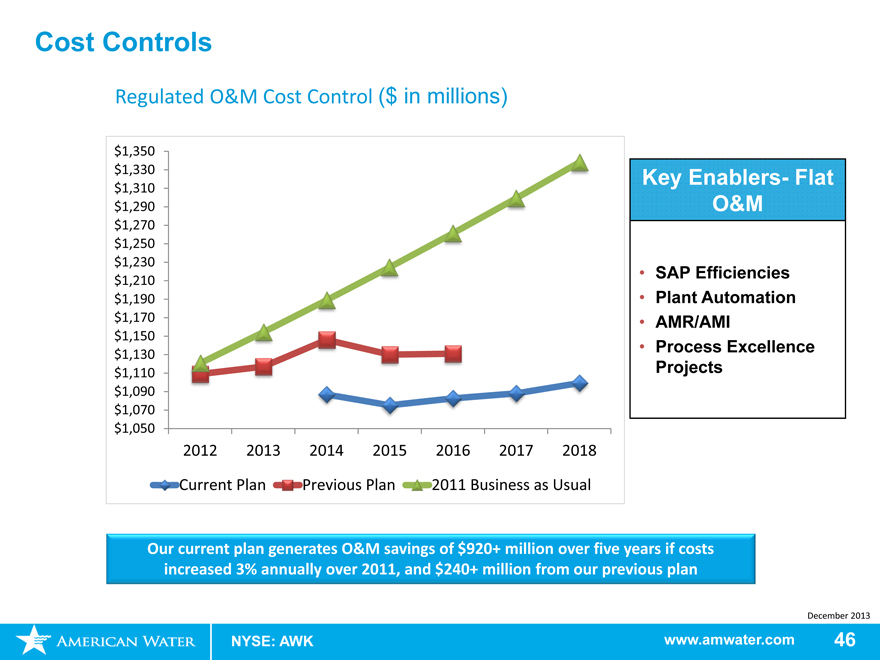
Cost Controls
Regulated O&M Cost Control ($ in millions)
$ 1,350
$ 1,330
$ 1,310
$ 1,290
$ 1,270
$ 1,250
$ 1,230
$ 1,210
$ 1,190
$ 1,170
$ 1,150
$ 1,130
$ 1,110
$ 1,090
$ 1,070
$ 1,050
2012 2013 2014 2015 2016 2017 2018
Current Plan Previous Plan 2011 Business as Usual
Key Enablers- Flat O&M
SAP Efficiencies
Plant Automation
AMR/AMI
Process Excellence Projects
Our current plan generates O&M savings of $920+ million over five years if costs increased 3% annually over 2011, and $240+ million from our previous plan
December 2013
NYSE: AWK www.amwater.com 46
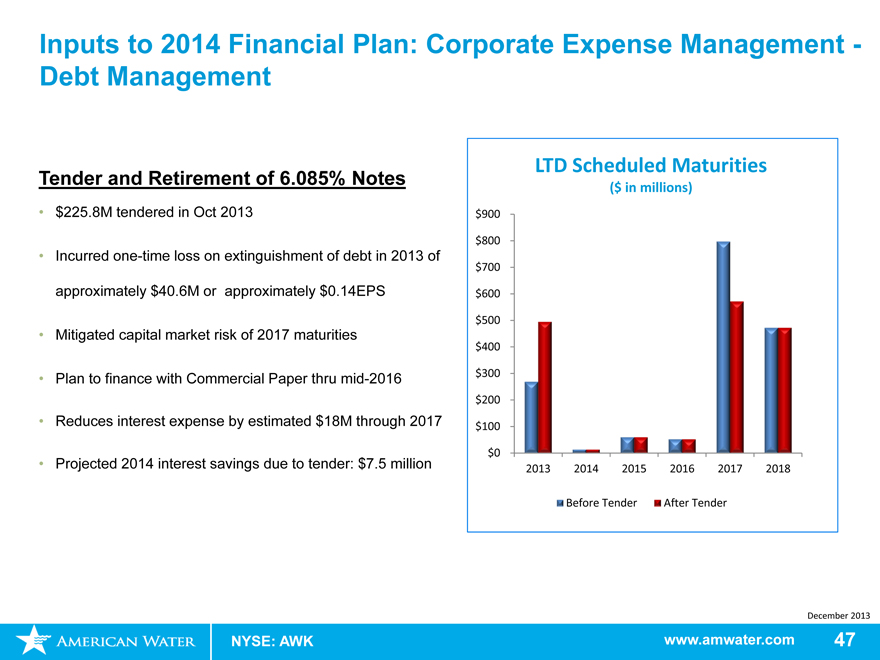
Inputs to 2014 Financial Plan: Corporate Expense Management -Debt Management
Tender and Retirement of 6.085% Notes
$225.8M tendered in Oct 2013
Incurred one-time loss on extinguishment of debt in 2013 of approximately $40.6M or approximately $0.14EPS
Mitigated capital market risk of 2017 maturities
Plan to finance with Commercial Paper thru mid-2016
Reduces interest expense by estimated $18M through 2017
Projected 2014 interest savings due to tender: $7.5 million
LTD Scheduled Maturities
($ in millions)
$900
$800
$700
$600
$500
$400
$300
$200
$100
$0
2013 2014 2015 2016 2017 2018
Before Tender After Tender
December 2013
NYSE: AWK www.amwater.com 47
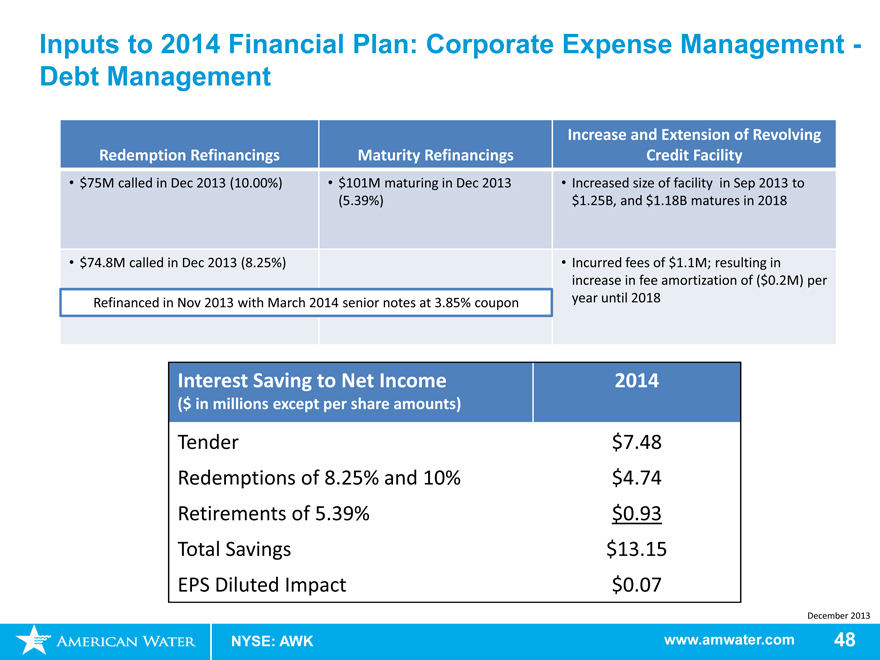
Inputs to 2014 Financial Plan: Corporate Expense Management -Debt Management
Increase and Extension of Revolving
Redemption Refinancings Maturity Refinancings Credit Facility
$ 75M called in Dec 2013 (10.00%) $101M maturing in Dec 2013 Increased size of facility in Sep 2013 to
(5.39%) $1.25B, and $1.18B matures in 2018
$ 74.8M called in Dec 2013 (8.25%) Incurred fees of $1.1M; resulting in
increase in fee amortization of ($0.2M) per
Refinanced in Nov 2013 with March 2014 senior notes at 3.85% coupon year until 2018
Interest Saving to Net Income 2014
($ in millions except per share amounts)
Tender $7.48
Redemptions of 8.25% and 10% $4.74
Retirements of 5.39% $0.93
Total Savings $13.15
EPS Diluted Impact $0.07
December 2013
NYSE: AWK www.amwater.com 48
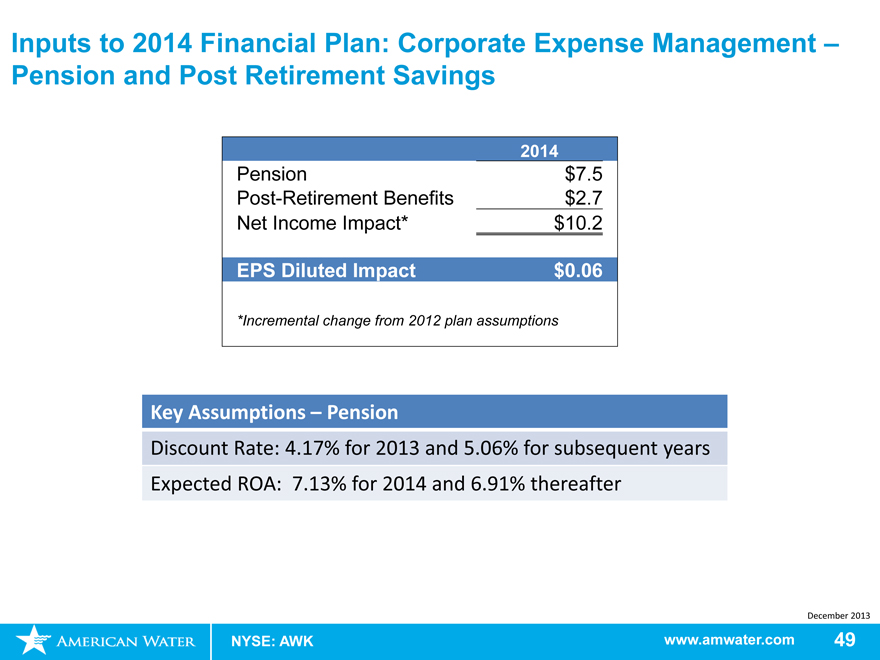
Inputs to 2014 Financial Plan: Corporate Expense Management – Pension and Post Retirement Savings
2014
Pension $7.5
Post-Retirement Benefits $2.7
Net Income Impact* $10.2
EPS Diluted Impact $0.06
*Incremental change from 2012 plan assumptions
Key Assumptions – Pension
Discount Rate: 4.17% for 2013 and 5.06% for subsequent years Expected ROA: 7.13% for 2014 and 6.91% thereafter
December 2013
NYSE: AWK www.amwater.com 49
Our Growth Triangle: 2014 Guidance of $2.35-$2.45
2014 Growth Drivers
Shale (0-1%)
MBB (~1%)
Acquisitions
(1-2%)
Corp Exp Reductions
(1-2%)
Regulated Investment – CapEx
(4-5%)
December 2013
NYSE: AWK www.amwater.com 50
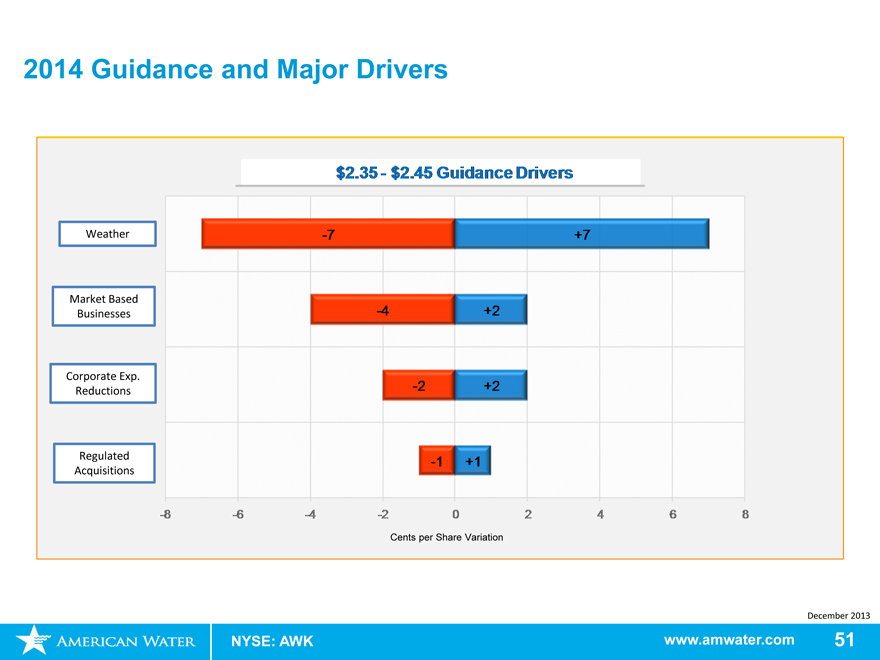
2014 Guidance and Major Drivers
$2.35—$2.45 Guidance Drivers
Weather -7 +7
Market Based
Businesses -4 +2
Corporate Exp.
Reductions -2 +2
Regulated -1 +1
Acquisitions
-8 -6 -4 -2 0 2 4 6 8
Cents per Share Variation
December 2013
NYSE: AWK www.amwater.com 51
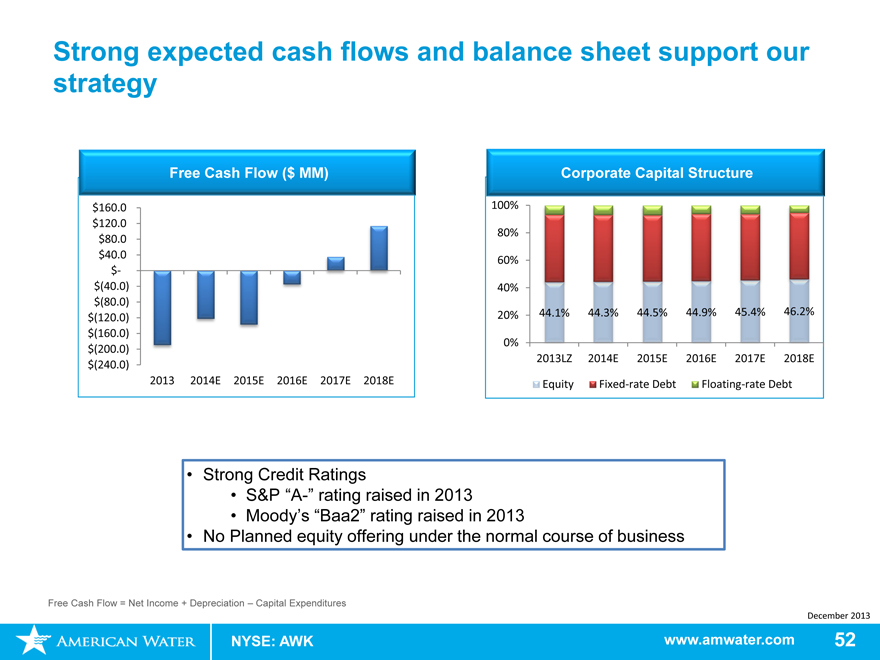
Strong expected cash flows and balance sheet support our strategy
Free Cash Flow ($ MM)
$160.0
$120.0
$80.0
$40.0
$-
$(40.0)
$(80.0)
$(120.0)
$(160.0)
$(200.0)
$(240.0)
2013 2014E 2015E 2016E 2017E 2018E
Corporate Capital Structure
100%
80%
60%
40%
20% 44.1% 44.3% 44.5% 44.9% 45.4% 46.2%
0%
2013LZ 2014E 2015E 2016E 2017E 2018E
Equity Fixed-rate Debt Floating-rate Debt
Strong Credit Ratings
S&P “A-” rating raised in 2013
Moody’s “Baa2” rating raised in 2013
No Planned equity offering under the normal course of business
Free Cash Flow = Net Income + Depreciation – Capital Expenditures
December 2013
NYSE: AWK www.amwater.com 52
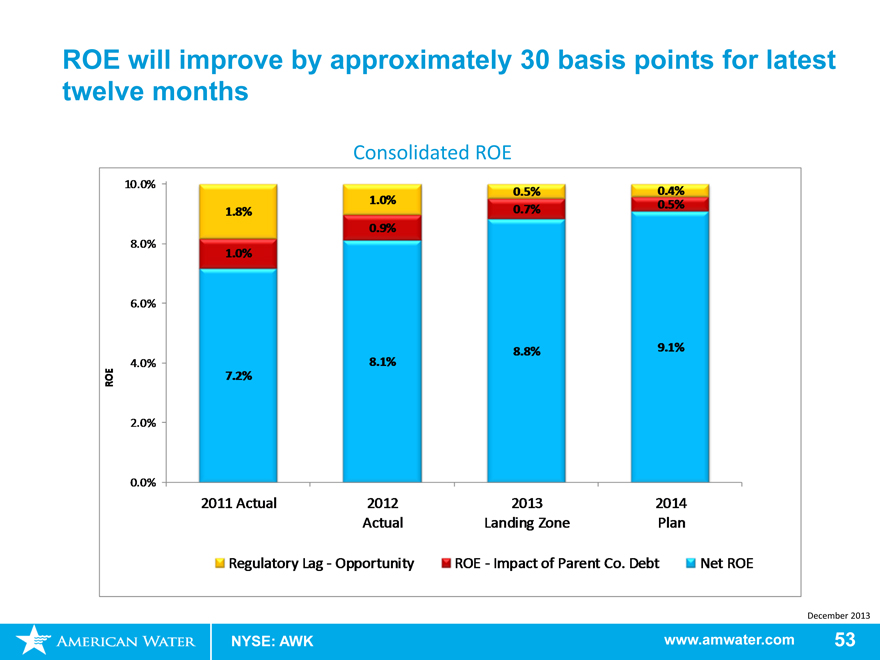
ROE will improve by approximately 30 basis points for latest twelve months
Consolidated ROE
10.0% 0.5% 0.4%
1.0% 0.5%
1.8% 0.7%
0.9%
8.0%
1.0%
6.0%
8.8% 9.1%
4.0% 8.1%
ROE 72%.
2.0%
0.0%
2011 Actual 2012 2013 2014
Actual Landing Zone Plan
Regulatory Lag - Opportunity ROE - Impact of Parent Co. Debt Net ROE
December 2013
NYSE: AWK www.amwater.com 53
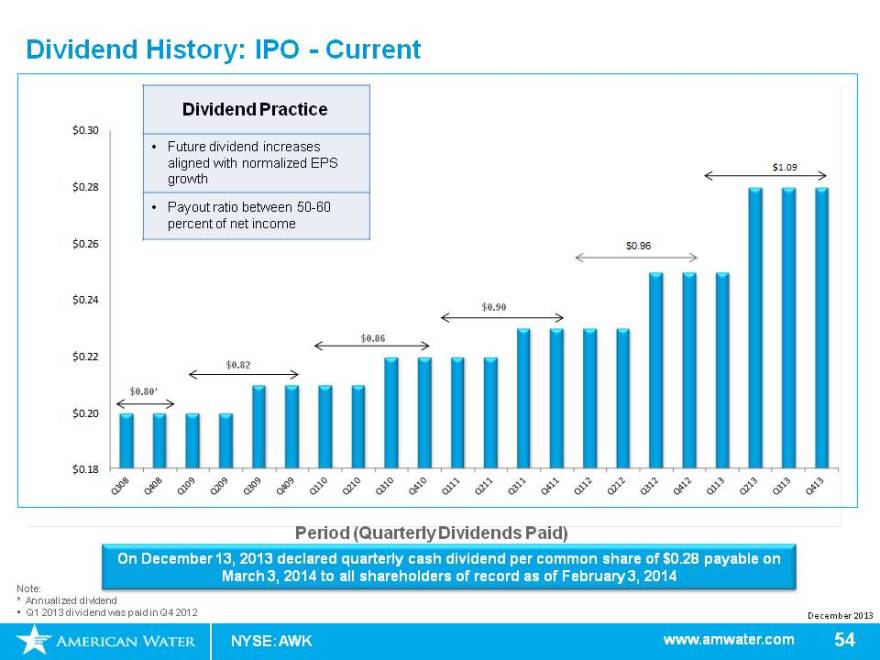
Dividend History: IPO—Current
Dividend Practice
$0.30
Future dividend increases
aligned with normalized EPS $1.09
growth
$0.28
Payout ratio between 50-60
percent of net income
$0.26 $0.96
$0.24
$0.90
$0.86
$0.22
$0.82
$ 0.80*
$0.20
$0.18
Q308 Q408 Q109 Q209 Q309 Q409 Q110 Q210 Q310 Q410 Q111 Q211 Q311 Q411
Q112 Q212 Q312 Q412 Q113 Q213 Q313 Q413
Period (Quarterly Dividends Paid)
On December 13, 2013 declared quarterly cash dividend per common share of $0.28 payable on March 3, 2014 to all shareholders of record as of February 3, 2014
Note:
* Annualized dividend
Q1 2013 dividend was paid in Q4 2012
December 2013
NYSE: AWK www.amwater.com 54
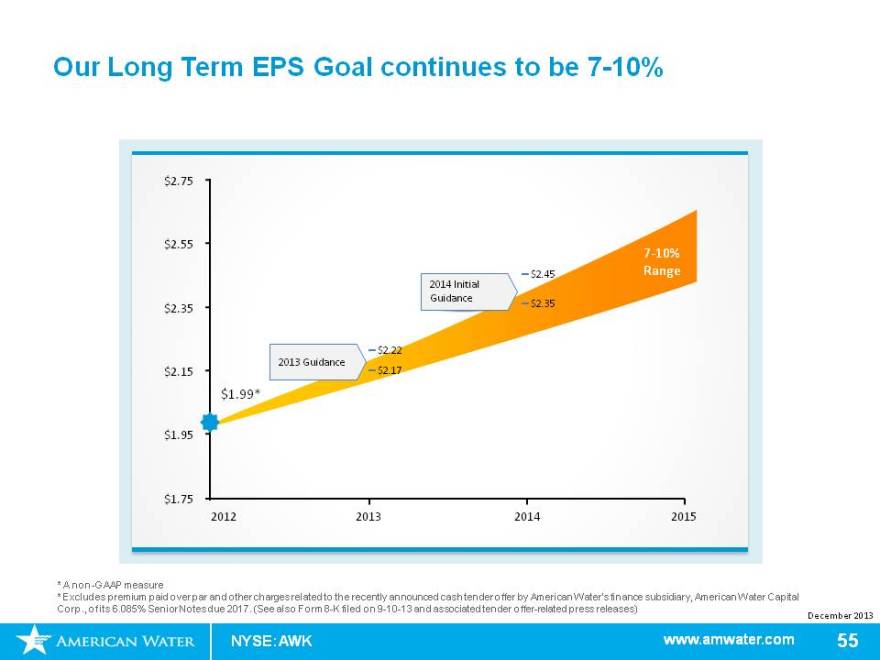
Our Long Term EPS Goal continues to be 7-10%
$ 2.75
$ 2.55
2014 Initial
Guidance
$ 2.35 $ 2.35
$2.22
$ 2.15 -$2.17
$ 1.99*
$ 1.95
$ 1.75
2012 2013 2014 2015
* A non-GAAP measure
* Excludes premium paid over par and other charges related to the recently announced cash tender offer by American Water’s finance subsidiary, American Water Capital Corp., of its 6.085% Senior Notes due 2017. (See also Form 8-K filed on 9-10-13 and associated tender offer-related press releases)
7-10%
Range
-$2.45
2013 Guideline
December 2013
NYSE: AWK www.amwater.com 55
NYSE: AWK
In Summary
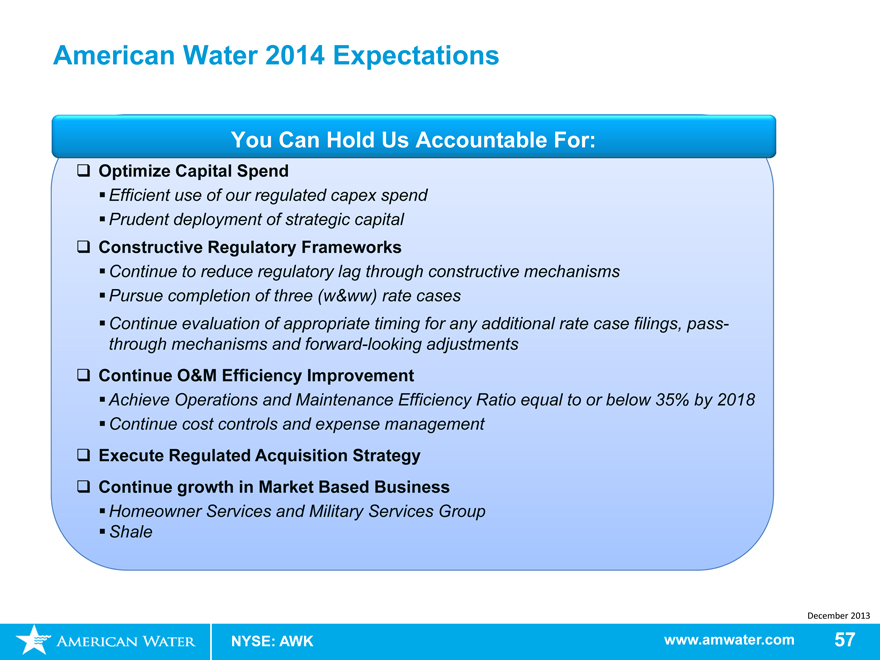
American Water 2014 Expectations
You Can Hold Us Accountable For:
Optimize Capital Spend
Efficient use of our regulated capex spend
Prudent deployment of strategic capital
Constructive Regulatory Frameworks
Continue to reduce regulatory lag through constructive mechanisms
Pursue completion of three (w&ww) rate cases
Continue evaluation of appropriate timing for any additional rate case filings, pass-through mechanisms and forward-looking adjustments
Continue O&M Efficiency Improvement
Achieve Operations and Maintenance Efficiency Ratio equal to or below 35% by 2018
Continue cost controls and expense management
Execute Regulated Acquisition Strategy
Continue growth in Market Based Business
Homeowner Services and Military Services Group
Shale
December 2013
NYSE: AWK www.amwater.com 57
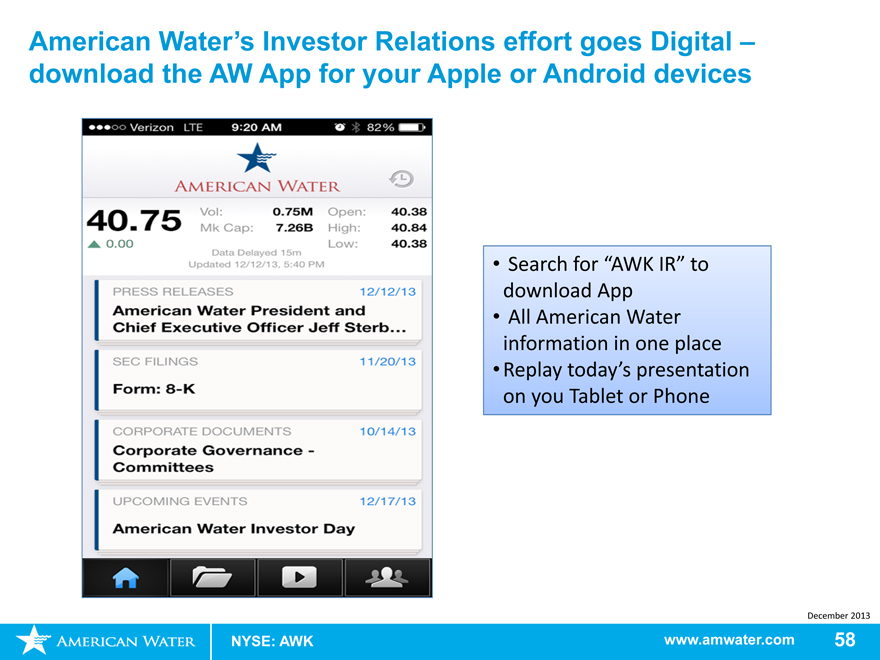
American Water’s Investor Relations effort goes Digital –download the AW App for your Apple or Android devices
Verzion LTE 9.20AM 82%
American Water
40.75
0.00
Vol: 0.75M
Mk Cap: 7.26B
Open: 40.38
High: 40.84
Low: 40.38
Data Delayed 15m Updated 12/12/13, 5:40 PM
Press Releases
American Water President and Chief Executive Officer Jeff Sterb…
Sec Filings 11/12/13
Form: 8-K
Corporate documents 10/14/13
Corporate Governance – Committees
Upcoming Events 12/17/13
American Water Investor Day
Search for “AWK IR” to download App
All American Water information in one place Replay today’s presentation on you Tablet or Phone
December 2013
NYSE: AWK www.amwater.com 58
NYSE: AWK
Q&A
NYSE: AWK
Appendix
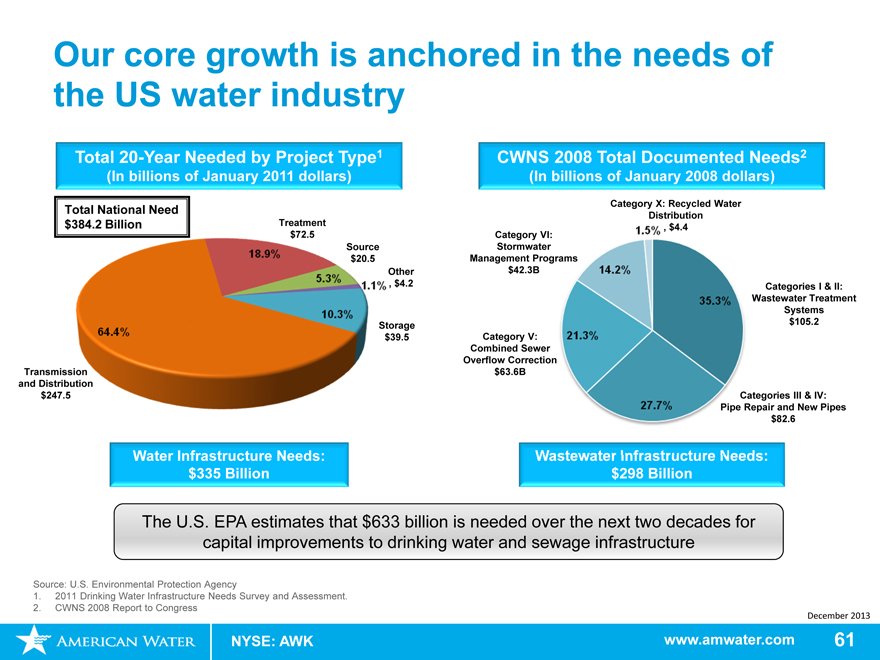
Our core growth is anchored in the needs of the US water industry
Total 20-Year Needed by Project Type1
(In billions of January 2011 dollars)
Total National Need
$384.2 Billion Treatment
$72.5
Source
$20.5
Other
, $4.2
Storage
$39.5
Transmission
and Distribution
$247.5
Water Infrastructure Needs:
$335 Billion
CWNS 2008 Total Documented Needs2
(In billions of January 2008 dollars)
Category X: Recycled Water
Distribution
, $4.4
Category VI:
Stormwater
Management Programs
$42.3B
Categories I & II:
Wastewater Treatment
Systems
$105.2
Category V:
Combined Sewer
Overflow Correction
$63.6B
Categories III & IV:
Pipe Repair and New Pipes
$82.6
Wastewater Infrastructure Needs:
$298 Billion
The U.S. EPA estimates that $633 billion is needed over the next two decades for capital improvements to drinking water and sewage infrastructure
Source: U.S. Environmental Protection Agency
1. 2011 Drinking Water Infrastructure Needs Survey and Assessment.
2. CWNS 2008 Report to Congress
December 2013
64.4% 18.9% 5.3% 10.3% 1.1% 14.2% 21.3% 27.7% 35.3% 1.5%
NYSE: AWK www.amwater.com 61
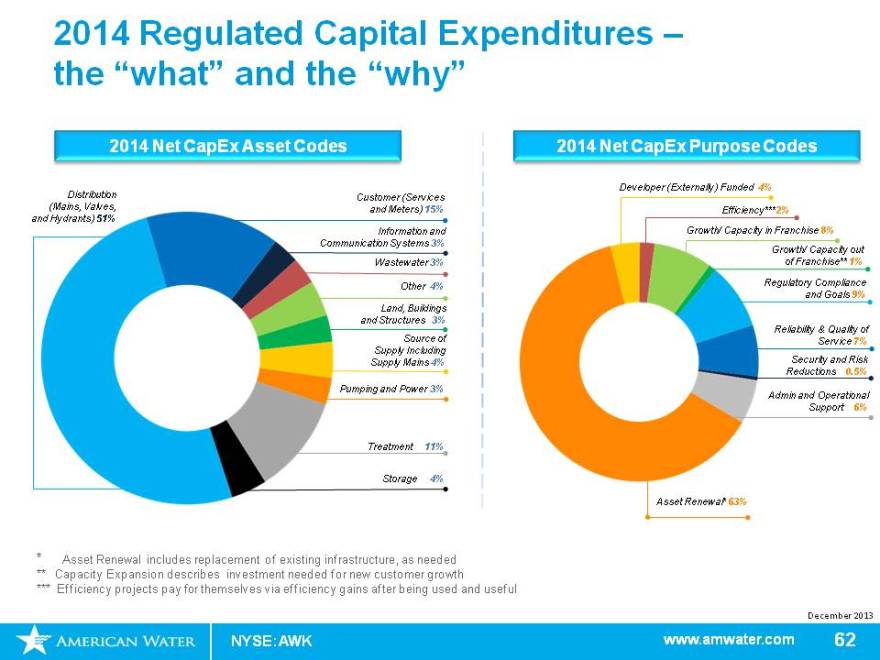
2014 Regulated Capital Expenditures –the “what” and the “why”
2014 Net CapEx Asset Codes
Distribution Customer (Services
(Mains, Valves, and Meters) 15%
and Hydrants) 51%
Information and
Communication Systems 3%
Wastewater 3%
Other 4%
Land, Buildings
and Structures 3%
Source of
Supply Including
Supply Mains 4%
Pumping and Power 3%
Treatment 11%
Storage 4%
2014 Net CapEx Purpose Codes
Developer (Externally) Funded 4%
Efficiency***2%
Growth/ Capacity in Franchise 8%
Growth/ Capacity out
of Franchise** 1%
Regulatory Compliance
and Goals 9%
Reliability & Quality of
Service 7%
Security and Risk
Reductions 0.5%
Admin and Operational
Support 6%
Asset Renewal* 63%
* Asset Renewal includes replacement of existing infrastructure, as needed
** Capacity Expansion describes investment needed for new customer growth
*** Efficiency projects pay for themselves via efficiency gains after being used and useful
December 2013
NYSE: AWK www.amwater.com 62
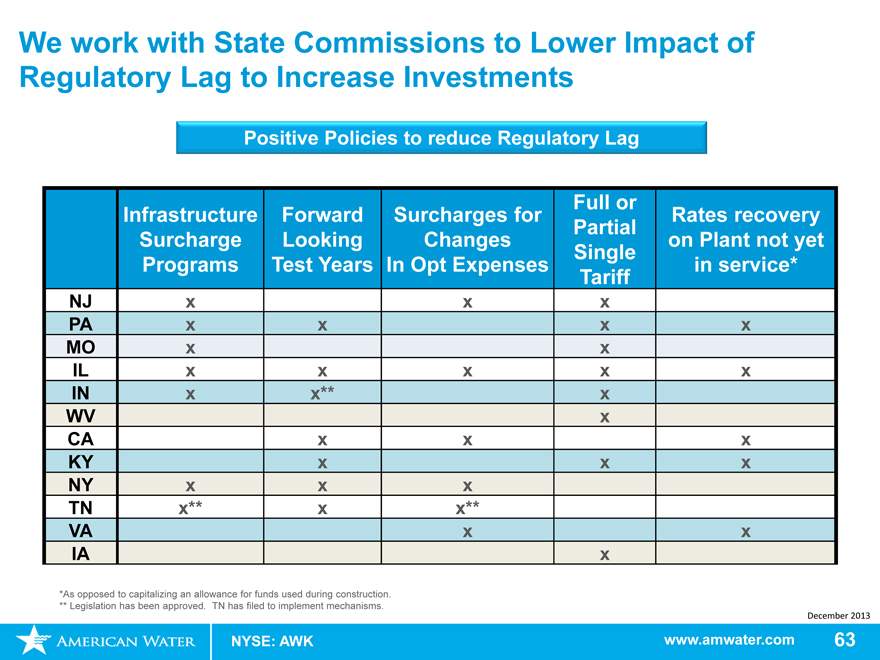
We work with State Commissions to Lower Impact of Regulatory Lag to Increase Investments
Positive Policies to reduce Regulatory Lag
Full or
Infrastructure Forward Surcharges for Rates recovery
Partial
Surcharge Looking Changes on Plant not yet
Single
Programs Test Years In Opt Expenses in service*
Tariff
NJ xx x
PA xx x x
MO xx
IL xx x x x
IN xx** x
WV x
CA xx x
KY xx x
NY xx x
TN x** x x**
VA xx
IA x
*As opposed to capitalizing an allowance for funds used during construction.
** Legislation has been approved. TN has filed to implement mechanisms.
December 2013
NYSE: AWK www.amwater.com 63
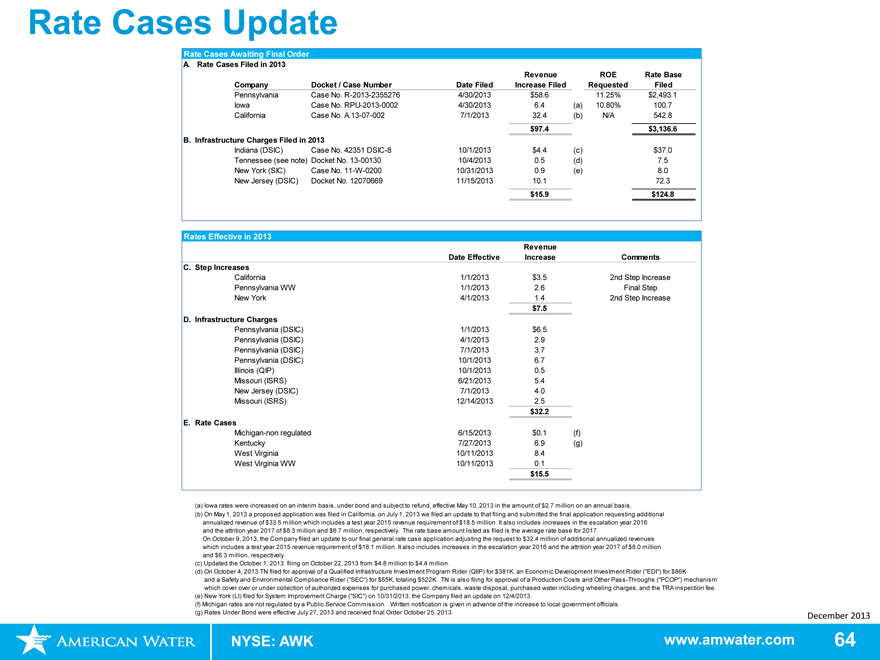
Rate Cases Update
Rate Cases Awaiting Final Order
A. Rate Cases Filed in 2013
Revenue ROE Rate Base
Company Docket / Case Number Date Filed Increase Filed Requested Filed
Pennsylvania Case No. R-2013-2355276 4/30/2013 $58.6 11.25% $2,493.1
Iowa Case No. RPU-2013-0002 4/30/2013 6.4 (a) 10.80% 100.7
California Case No. A.13-07-002 7/1/2013 32.4 (b) N/A 542.8
$97.4 $3,136.6
B. Infrastructure Charges Filed in 2013
Indiana (DSIC) Case No. 42351 DSIC-8 10/1/2013 $4.4 (c) $37.0
Tennessee (see note) Docket No. 13-00130 10/4/2013 0.5 (d) 7.5
New York (SIC) Case No. 11-W-0200 10/31/2013 0.9 (e) 8.0
New Jersey (DSIC) Docket No. 12070669 11/15/2013 10.1 72.3
$15.9 $124.8
Rates Effective in 2013
Revenue
Date Effective Increase Comments
C. Step Increases
California 1/1/2013 $3.5 2nd Step Increase
Pennsylvania WW 1/1/2013 2.6 Final Step
New York 4/1/2013 1.4 2nd Step Increase
$7.5
D. Infrastructure Charges
Pennsylvania (DSIC) 1/1/2013 $6.5
Pennsylvania (DSIC) 4/1/2013 2.9
Pennsylvania (DSIC) 7/1/2013 3.7
Pennsylvania (DSIC) 10/1/2013 6.7
Illinois (QIP) 10/1/2013 0.5
Missouri (ISRS) 6/21/2013 5.4
New Jersey (DSIC) 7/1/2013 4.0
Missouri (ISRS) 12/14/2013 2.5
$32.2
E. Rate Cases
Michigan-non regulated 6/15/2013 $0.1 (f)
Kentucky 7/27/2013 6.9 (g)
West Virginia 10/11/2013 8.4
West Virginia WW 10/11/2013 0.1
$15.5
(a) Iowa rates were increased on an interim basis, under bond and subject to refund, effective May 10, 2013 in the amount of $2.7 million on an annual basis.
(b) On May 1, 2013 a proposed application was filed in California, on July 1, 2013 we filed an update to that filing and submitted the final application requesting additional
annualized revenue of $33.5 million which includes a test year 2015 revenue requirement of $18.5 million. It also includes increases in the escalation year 2016
and the attrition year 2017 of $8.3 million and $6.7 million, respectively. The rate base amount listed as filed is the average rate base for 2017.
On October 9, 2013, the Company filed an update to our final general rate case application adjusting the request to $32.4 million of additional annualized revenues
which includes a test year 2015 revenue requirement of $18.1 million. It also includes increases in the escalation year 2016 and the attrition year 2017 of $8.0 million
and $6.3 million, respectively.
(c) Updated the October 1, 2013 filing on October 22, 2013 from $4.8 million to $4.4 million.
(d) On October 4, 2013 TN filed for approval of a Qualified Infrastructure Investment Program Rider (QIIP) for $381K, an Economic Development Investment Rider (“EDI”) for $86K
and a Safety and Environmental Compliance Rider (“SEC”) for $55K, totaling $522K. TN is also filing for approval of a Production Costs and Other Pass-Throughs (“PCOP”) mechanism
which cover over or under collection of authorized expenses for purchased power, chemicals, waste disposal, purchased water including wheeling charges, and the TRA inspection fee.
(e) New York (LI) filed for System Improvement Charge (“SIC”) on 10/31/2013, the Company filed an update on 12/4/2013.
(f) Michigan rates are not regulated by a Public Service Commission. Written notification is given in advance of the increase to local government officials.
(g) Rates Under Bond were effective July 27, 2013 and received final Order October 25, 2013.
December 2013
NYSE: AWK www.amwater.com 64
Regulated Utilities – Rate Base and Allowed Return on Equity
Last Rate Case Awarded—Largest Regulated Subsidiaries
Authorized Rate Base* $374,404 $706,386 $741,151 (b) $384,729 $831,375 (b)
Authorized ROE 9.99% (a) 9.34% 9.70% 9.70% 10.00%
Authorized Equity 53.00% (a) 48.10% 42.02% 44.70% 50.57% (d)
Effective Date of Rate Case 7/12/2012 (a) 10/1/2012 6/15/2012 10/25/2013 (c) 4/1/2012
Authorized Rate Base* $1,920,300 $128,882 (e) $2,081,818 (b) $119,254 (b) $448,841 (b)
Authorized ROE 10.15% 9.65% (e) 10.25% (f) 9.75% 9.90% (f)
Authorized Equity 52.00% 42.00% (e) 51.12% (d) 42.67% (d) 45.23% (d)
Effective Date of Rate Case 5/1/2012 4/1/2012 (e) 11/11/2011 12/12/2012 (g) 10/11/2013
*Rate Base stated in $000s
Notes:
a) CA has a separate Cost of Capital case, A11-05-003, which sets the rate of return outside of a general rate proceeding.
b) The Rate Base listed is the Company’s view of the Rate Base allowed in the case, the Rate Base was not disclosed in the Order or the applicable settlement agreement.
c) Rates Under Bond were effective July 27, 2013 and received final Order October 25, 2013.
d) The equity ratio listed is the Company’s view of the equity ratio allowed in the case, the actual equity ratio was not disclosed in the Order or the applicable settlement agreement
e) Information pertains only to the former company of Long Island American Water.
f) The ROE listed is the Company’s view of the ROE allowed in the case, the ROE was not disclosed in the Order or the applicable settlement agreement.
g) Rates Under Bond were effective July 12, 2012 and received final Order December 12, 2012.
December 2013
NYSE: AWK www.amwater.com 65
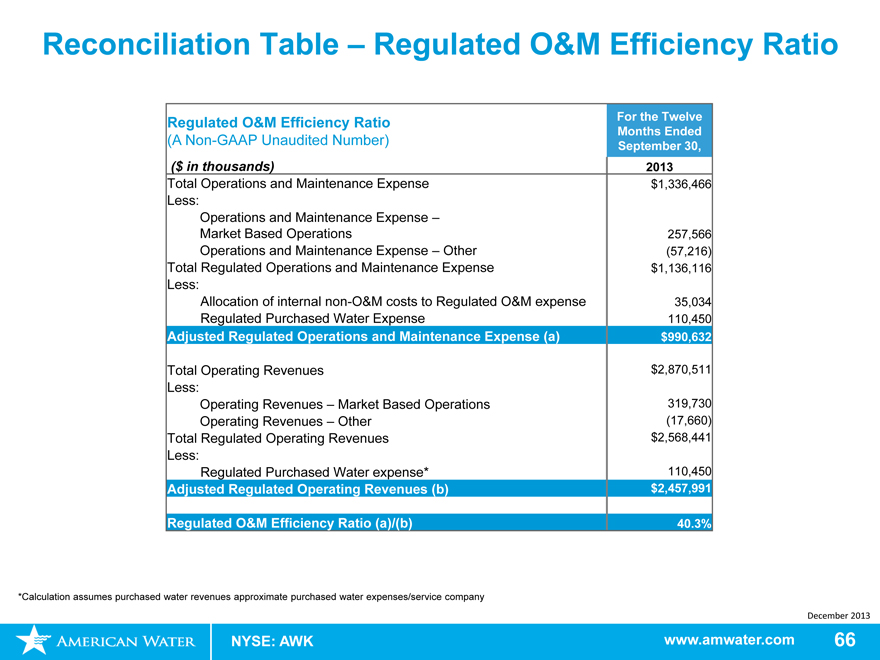
Reconciliation Table – Regulated O&M Efficiency Ratio
Regulated O&M Efficiency Ratio For the Twelve
Months Ended
(A Non-GAAP Unaudited Number) September 30,
($ in thousands) 2013
Total Operations and Maintenance Expense $1,336,466
Less:
Operations and Maintenance Expense –
Market Based Operations 257,566
Operations and Maintenance Expense – Other (57,216)
Total Regulated Operations and Maintenance Expense $1,136,116
Less:
Allocation of internal non-O&M costs to Regulated O&M expense 35,034
Regulated Purchased Water Expense 110,450
Adjusted Regulated Operations and Maintenance Expense (a) $990,632
Total Operating Revenues $2,870,511
Less:
Operating Revenues – Market Based Operations 319,730
Operating Revenues – Other (17,660)
Total Regulated Operating Revenues $2,568,441
Less:
Regulated Purchased Water expense* 110,450
Adjusted Regulated Operating Revenues (b) $2,457,991
Regulated O&M Efficiency Ratio (a)/(b) 40.3%
*Calculation assumes purchased water revenues approximate purchased water expenses/service company
December 2013
NYSE: AWK www.amwater.com 66
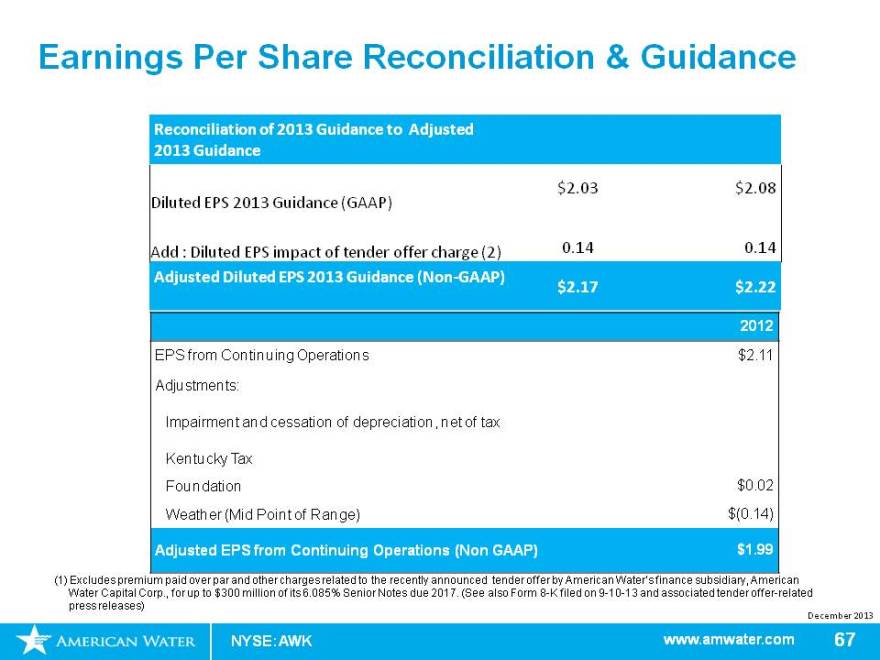
Earnings Per Share Reconciliation & Guidance
Reconciliation of 2013 Guidance to Adjusted
2013 Guidance
$2.03 $2.08
Diluted EPS 2013 Guidance (GAAP)
Add : Diluted EPS impact of tender offer charge (2) 0.14 0.14
Adjusted Diluted EPS 2013 Guidance (Non-GAAP)
$2.17 $2.22
2012
EPS from Continuing Operations $2.11
Adjustments:
Impairment and cessation of depreciation, net of tax
Kentucky Tax
Foundation $0.02
Weather (Mid Point of Range) $(0.14)
Adjusted EPS from Continuing Operations (Non GAAP) $1.99
(1) Excludes premium paid over par and other charges related to the recently announced tender offer by American Water’s finance subsidiary, American Water Capital Corp., for up to $300 million of its 6.085% Senior Notes due 2017. (See also Form 8-K filed on 9-10-13 and associated tender offer-related press releases)
December 2013
NYSE: AWK www.amwater.com 67