 NYSE: AWK 2015 Guidance Call December 15, 2014 Exhibit 99.2 |
 NYSE: AWK Ed Vallejo Vice President of Investor Relations |
NYSE: AWK www.amwater.com 3 December 2014 Cautionary Statement Concerning Forward-Looking Statements Certain statements in this presentation including, without limitation, American Water’s estimate of 2015 earnings per share from continuous operations, continued investments, long term earnings per share growth, are forward-looking statements within the meaning of the safe harbor provisions of the Private Securities Litigation Reform Act of 1995. These forward- looking statements are predictions based on American Water’s current expectations and assumptions regarding future events. Actual results could differ materially because of factors such as the decisions of governmental and regulatory bodies, including decisions to raise or lower rates; the timeliness of regulatory commissions’ actions concerning rates; changes in laws, governmental regulations and policies, including environmental, health and water quality, and public utility regulations and policies; the outcome of litigation and government action related to the Freedom Industries chemical spill in West Virginia; weather conditions, patterns or events, including drought or abnormally high rainfall, strong winds and coastal, intercoastal flooding and cooler than normal temperatures; changes in customer demand for, and patterns of use of, water, such as may result from conservation efforts; American Water’s ability to appropriately maintain current infrastructure and manage the expansion of its business; its ability to obtain permits and other approvals for projects; changes in its capital requirements; its ability to control operating expenses and to achieve efficiencies in its operations; its ability to obtain adequate and cost-effective supplies of chemicals, electricity, fuel, water and other raw materials that are needed for its operations; its ability to successfully acquire and integrate water and wastewater systems that are complementary to its operations; its ability to successfully expand its business, including concession arrangements and agreements for the provision of water services to facilitate hydraulic fracking in shale regions; cost overruns relating to improvements or the expansion of its operations; changes in general economic, business and financial market conditions; access to sufficient capital on satisfactory terms; fluctuations in interest rates; the effect of restrictive covenants or changes to credit ratings on its current or future debt that could increase its financing costs or affect its ability to borrow, make payments on debt or pay dividends; fluctuations in the value of benefit plan assets and liabilities that could increase financing costs and funding requirements; migration of customers into or out of its service territories; difficulty in obtaining insurance at acceptable rate s and on acceptable terms and conditions; its ability to retain and attract qualified employees; labor actions including work stoppages and strikes; the incurrence of impairment charges; and civil disturbance, terrorist threats or acts, or public apprehension about future disturbances or terrorist threats or acts. For further information regarding risks and uncertainties associated with American Water’s business, please refer to American Water’s annual and quarterly SEC filings. American Water does not undertake to update its forward-looking statements. |
 NYSE: AWK www.amwater.com 4 December 2014 Today’s Agenda and Speakers: Strategy Overview: Susan Story Regulated Operations: Walter Lynch Market Based Operations: Sharon Cameron 2015 Earnings Guidance: Linda Sullivan |
 NYSE: AWK Strategy Overview Susan Story President and Chief Executive Officer |
 NYSE: AWK www.amwater.com 6 December 2014 American Water: The Premier Water Services Provider in North America The largest publicly traded water and wastewater service provider in the United States ~ $9.5 Billion Market Capitalization Our Business lines: Regulated Business o ~90% of Total Revenues o Provide water and wastewater services in 16 U.S. states o 3.2 million customer connections, 12 million people served Market Based Business o ~ 10 % of Total Revenues (Reg. like risk profile) o Provide services to 43 states and parts of Canada o 2 million people served |
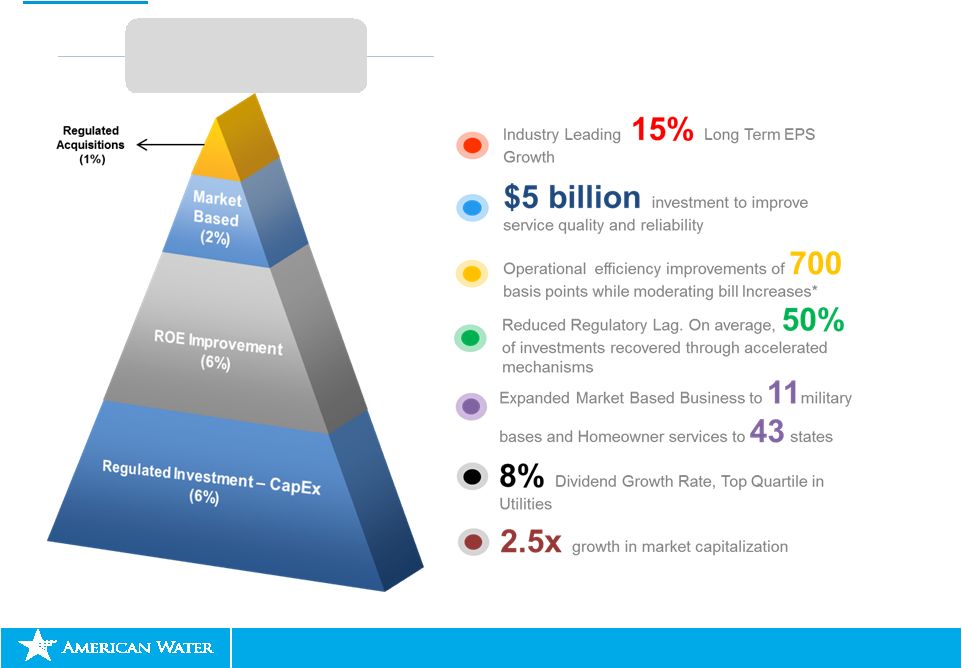 NYSE: AWK www.amwater.com December 2014 7 Our Past: Strong performance over the past 5 years (2010–2014) 2010-2014 ~15% EPS Growth *O&M Efficiency ratio comparison of 2010 vs LTM Sep 2014 **Source: Thomson Reuters, Time Period: 2009 – 2013 Dividend Paid CAGR Peer companies include: AWR, WTR, CWT, ATO, GAS, WGL, GXP, WR, OGE, AEE, POR, LNT, EDE, SCG, POM, HE, IDA, TE, CMS, UNS, PNM. ** |
 NYSE: AWK www.amwater.com December 2014 Our Present: FY 2015 Guidance from continuing operations 8 *Adjusted non-GAAP measure excluding $0.14 EPS impact of debt tender offer in 2013 **Adjusted 2014 guidance excludes Freedom Industries chemical spill EPS impact of $0.04 in West Virginia |
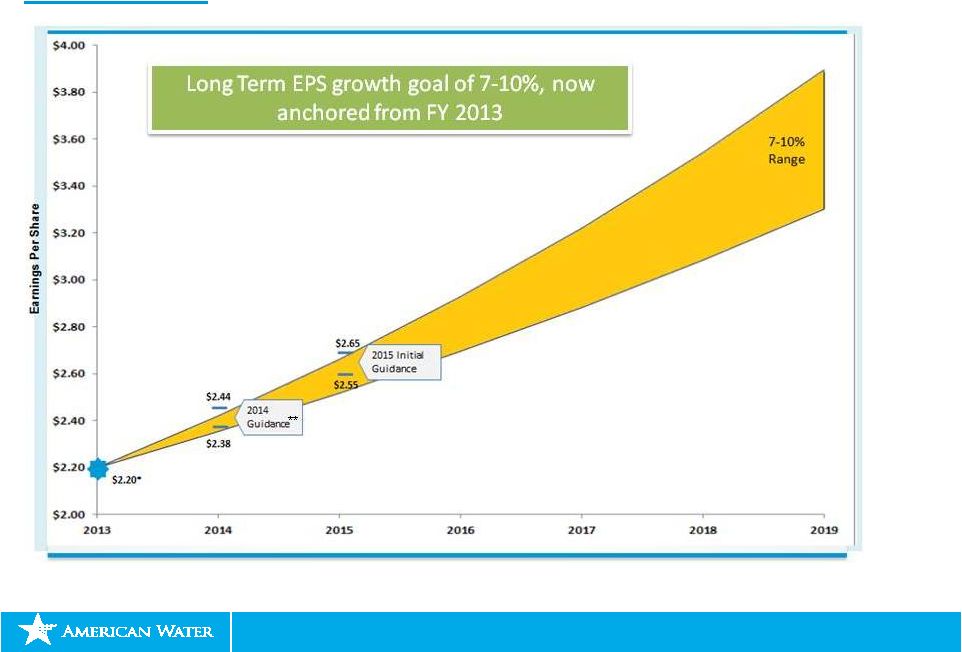
 NYSE: AWK www.amwater.com December 2014 9 *Anchored from FY 2013 Our Future : Our commitment over the next 5 years |
 NYSE: AWK II. Regulated Operations Walter Lynch President and Chief Operating Officer Regulated Operations |
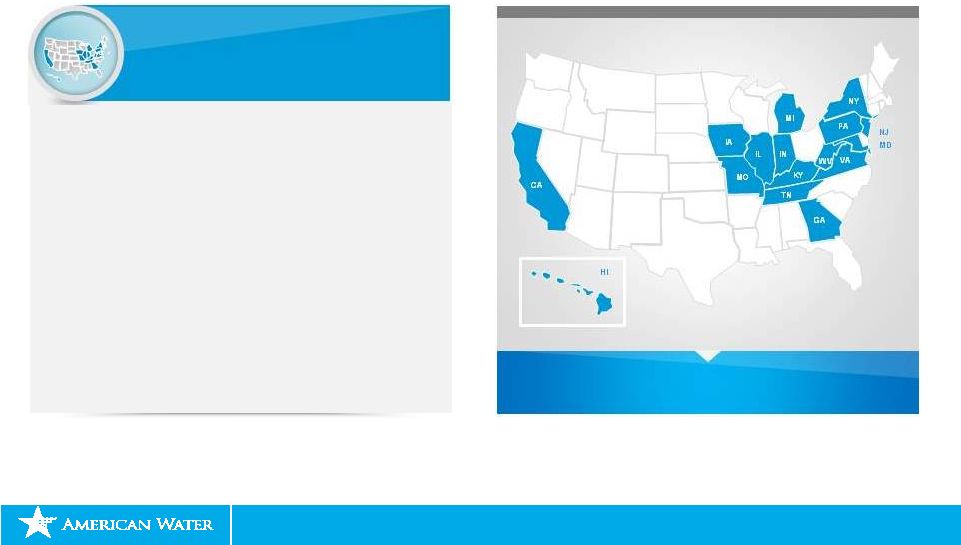 NYSE: AWK www.amwater.com 11 December 2014 American Water’s Regulated Presence Every day we operate and manage: • 47,000 miles of distribution and collection mains • 80 surface water treatment plants • 500 groundwater treatment plants • 1,000 groundwater wells • 100 wastewater treatment facilities • 87 dams * Data as of year end 2013 We manage more than 370 individual water systems across the country* 16 regulated states |
 NYSE: AWK www.amwater.com 12 December 2014 Infrastructure Investment Regulated Business: Focus Areas Efficiency & Water Energy Nexus Growth Constructive Regulatory Frameworks |
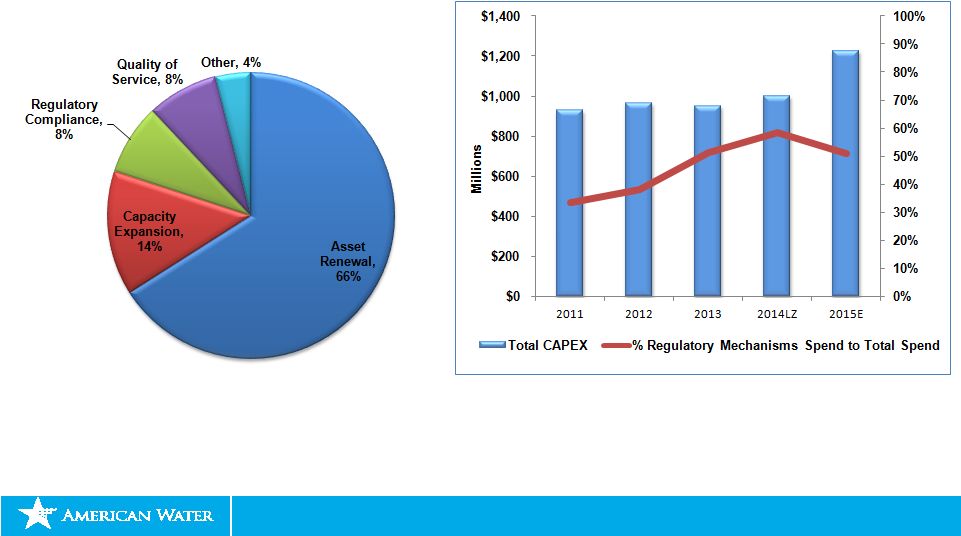 NYSE: AWK www.amwater.com 13 December 2014 Regulatory Capital Investment of $5.2 billion over next five years Note (1) Regulatory Mechanisms include DSIC, SIC and Future Test Years Investments covered by Regulatory Mechanisms 2015 – 2019 Average Capital Expenditures by Purpose |
 NYSE: AWK www.amwater.com December 2014 Cost containment and timely return on our investments will drive added Capital Expenditures 14 Note: O&M Efficiency Ratio - Non GAAP Measure – See appendix for reconciliation Incremental Revenue Requirement* -Increases Attributable to Opex vs. Capex- Note: * Approximation in states where we received black box award ** For general rate cases effective in 2014, the incremental revenue requirement was reduced by 25% due to lower Operating expenditures. O&M Efficiency Ratio Stretch Target of 34% by 2020 ** |
 NYSE: AWK III. Market-Based Operations Sharon Cameron President, American Water Enterprises |
 NYSE: AWK www.amwater.com 16 December 2014 Lines of Business • Homeowner Services (HOS) • Contract Operations • Military Services Group (MSG) • Municipal/Industrial (CSG) “Regulated Like” • Capitalizes on AW strengths • Strong/consistent margins • Controllable risk • Growing markets Market based businesses generate complementary opportunities for growth Note: MBB segment also includes two non-regulated contracts for NJ concessions which are not included in this presentation *2011 and 2012 figures include Terratec |
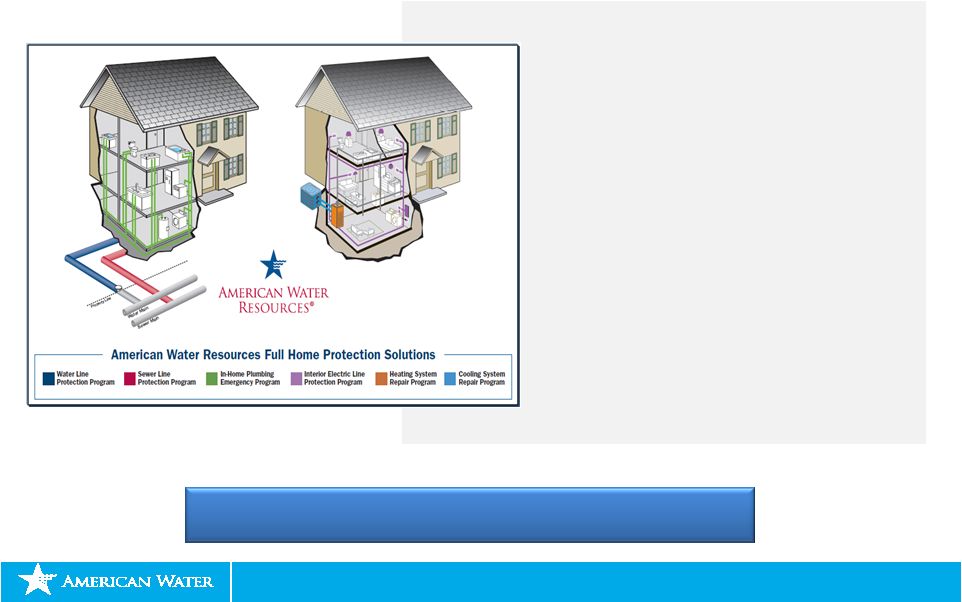 NYSE: AWK www.amwater.com 17 December 2014 Homeowner Services • Protect homeowners from unexpected high repair costs • Manage approximately 700k customers and 1.4m contracts • Municipal partnerships • New York City • Nashville, TN • Burlington, IA • Orlando, FL • Current warranties: • Water Line • Sewer Line • In Home Plumbing • In Home Electric • HVAC (Test) Under-penetrated Market Opportunity as large Municipal Players are Increasingly Open to Partnerships |
 NYSE: AWK www.amwater.com December 2014 18 Military Services: Overall Growth Strategy |
 NYSE: AWK IV. 2015 Earnings Guidance: Summary Linda Sullivan Senior Vice President and Chief Financial Officer |
 NYSE: AWK www.amwater.com 20 December 2014 Note: *Adjusted 2014 guidance excludes $0.04 EPS impact of Freedom industries chemical spill in West Virginia **Regulated investment category includes $0.02 projected EPS impact due to Freedom industries chemical spill in West Virginia Earnings guidance for 2015 is $2.55 - $2.65 per share (Diluted EPS from continuing operations) |
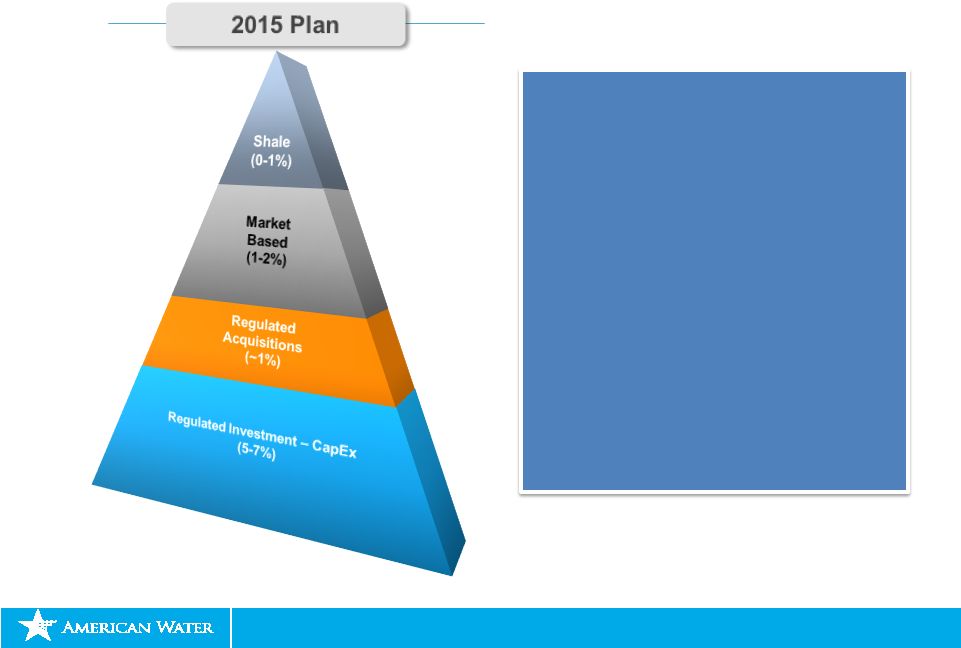 NYSE: AWK www.amwater.com 21 December 2014 2015 growth largely driven by regulated investment • Capital investment of $1. 2 billion in 2015; regulated investment $1.1 billion • Continued growth strategy in 2014; closing of recently announced acquisitions expected mid-2015 • Steady and significant growth continues in Market Based • Shale opportunities developing |
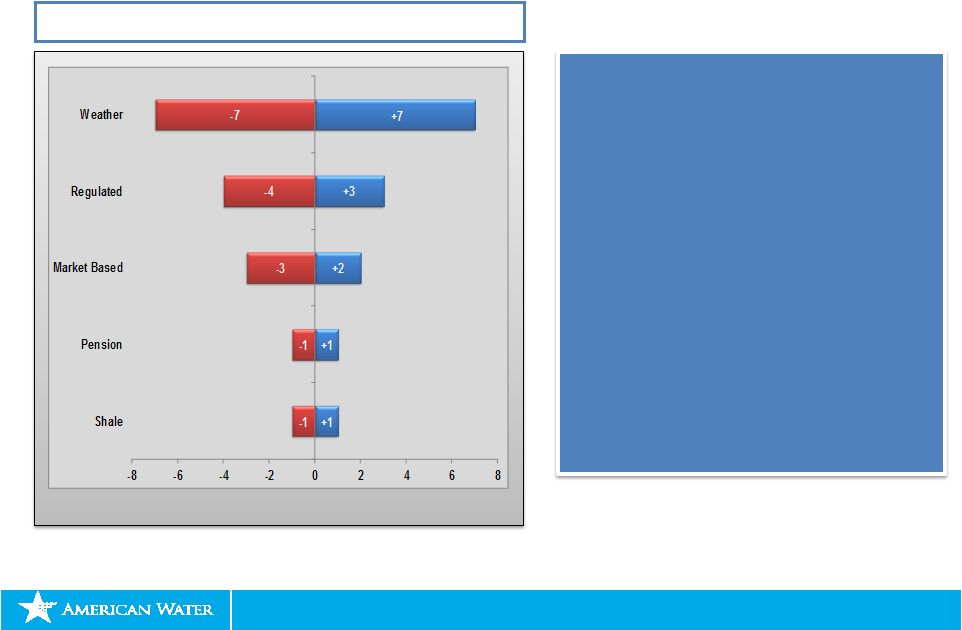 NYSE: AWK www.amwater.com 22 December 2014 FY 2015 Initial Guidance: $2.55 - $2.65 Cents per Share variation 2015 Guidance and Major Variables • Guidance range includes a certain amount of variability, with weather representing the largest variable • Guidance range expected to cover normal weather variability; weather extremes outside of the band are not included • Weather impacts will be quantified and disclosed for transparency • Guidance range includes $5 million for potential legal costs related to the WV event |
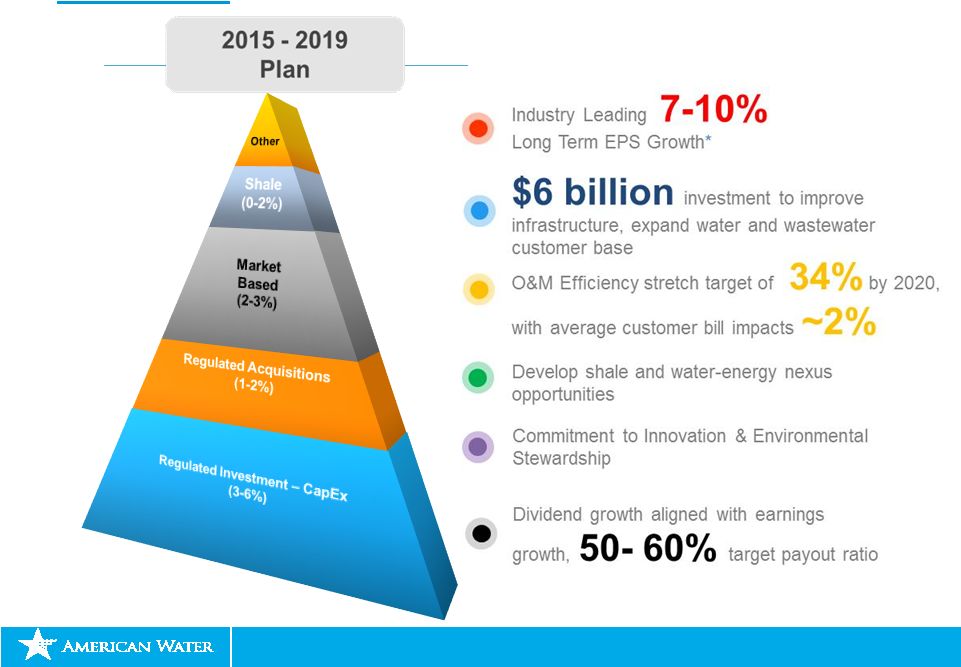
 NYSE: AWK www.amwater.com 23 December 2014 Drivers: • Market demand • Environmental Regulations • Investment Risk Profile Drivers: • Timing of Acquisitions • Legislation • Regulatory Treatment Drivers: • Market Penetration rate: HOS • Military Award Timing • New Regulated Like products and services Drivers: • Capital Investment • Authorized ROE’s • Reduction of Regulatory Lag • O&M efficiency • Consumption Decline Long Term Plan: Consistent growth drivers with additional regulated investment upside as we increase capital investment from $5.8B to $6B *7-10 % Long term EPS growth target anchored from FY 2013 |
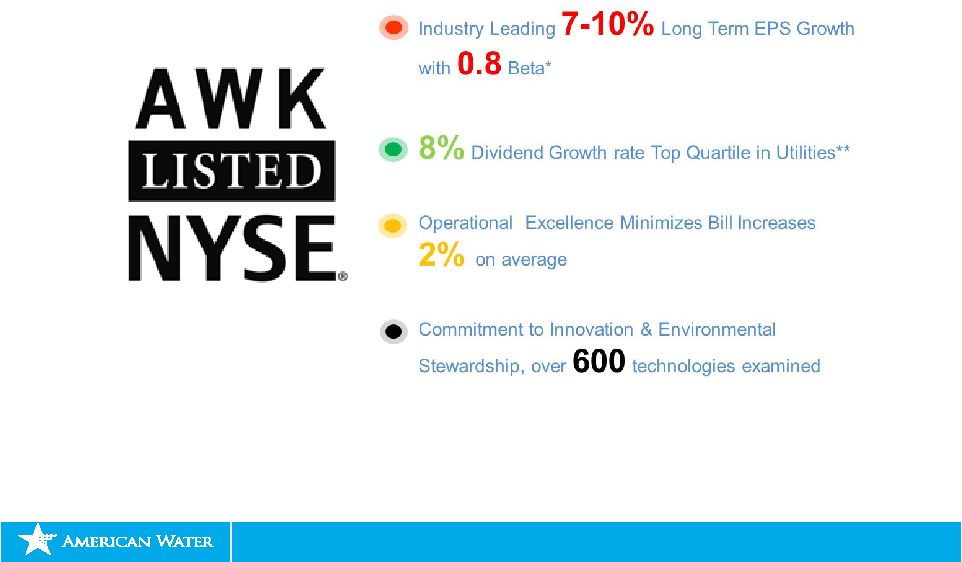 NYSE: AWK www.amwater.com 24 December 2014 Why American Water is the right investment for you *Source : Thomson Reuters **Source: Thomson Reuters, Time Period: 2009 – 2013 Dividend Paid CAGR Peer companies include: AWR, WTR, CWT, ATO, GAS, WGL, GXP, WR, OGE, AEE, POR, LNT, EDE, SCG, POM, HE, IDA, TE, CMS, UNS, PNM. |
 NYSE: AWK In Summary Susan Story President and Chief Executive Officer |
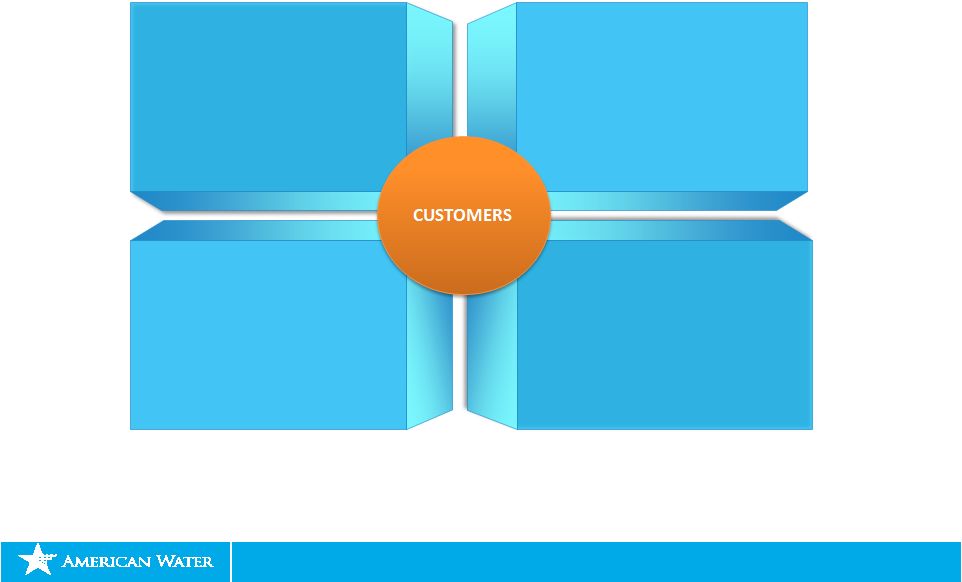
 NYSE: AWK www.amwater.com 26 December 2014 Our future results are anchored on 5 central themes with customers at the center of all we do SAFETY PEOPLE TECHNOLOGY & OPERATIONAL EFFICIENCY GROWTH CUSTOMERS • Very satisfied customers • Know our customers’ needs and deliver value • Proud and engaged people who are always improving • Diverse teams making a difference • Zero accidents and injuries • Live healthy • Grow existing businesses • Buy and build complementary businesses • Long-term environmental leadership • Industry-leading operational efficiency, driven by technology |
 NYSE: AWK www.amwater.com 27 December 2014 Investor Relations Team: Durgesh Chopra Director – Investor Relations Durgesh.chopra@amwater.com Ed Vallejo Vice President – Investor Relations Edward.vallejo@amwater.com Tel: 856-566-4005 Fax: 856-782-2782 |
 NYSE: AWK Appendix |
 NYSE: AWK www.amwater.com 29 December 2014 Reconciliation Table – Regulated O&M Efficiency Ratio Regulated O&M Efficiency Ratio (A Non-GAAP Unaudited Number) FY FY FY FY LTM Ended Sep ($ in thousands) 2010 2011 2012 2013 2014 Total Operations and Maintenance Expense $1,290,941 $1,301,794 $1,350,040 $1,312,724 $1,330,605 Less: Operations and Maintenance Expense – Market Based Operations 256,633 278,375 276,809 264,253 272,386 Operations and Maintenance Expense – Other (61,138) (69,192) (56,755) (56,973) (53,606) Total Regulated Operations and Maintenance Expense $1,095,446 $1,092,611 $1,129,986 $1,105,444 $1,111,825 Less: Allocation of internal non-O&M costs to Regulated O&M expense 29,414 30,590 35,067 34,635 37,975 Regulated Purchased Water Expense 99,834 99,008 110,173 111,119 119,692 Impact of West Virginia Freedom Industries Chemical Spill 10,302 Estimated impact of weather (mid-point of range) 4,289 (1,514) (1,762) Adjusted Regulated Operations and Maintenance Expense (a) $966,198 $963,013 $980,457 $961,204 $ 945,618 Total Operating Revenues $2,555,035 $2,666,236 $2,876,889 $2,901,858 $2,986,192 Less: Operating Revenues – Market Based Operations 294,723 327,815 330,329 325,463 334,647 Operating Revenues – Other (25,344) (30,470) (17,874) (17,523) (17,594) Total Regulated Operating Revenues $2,285,656 $2,368,891 $2,564,434 $2,593,918 $2,669,139 Less: Regulated Purchased Water expense* 99,834 99,008 110,173 111,119 119,692 Plus: Impact of West Virginia Freedom Industries Chemical Spill 1,012 Estimated impact of weather (mid-point of range) (42,885) 15,137 16,785 Adjusted Regulated operating revenues (b) $2,185,822 $2,269,883 $2,411,376 $2,497,936 $2,567,244 Regulated O&M Efficiency Ratio (a)/(b) 44.2% 42.4% 40.7% 38.5% 36.8% *Calculation assumes purchased water revenues approximate purchased water expenses |