|
Exhibit 99.2 
|
Exhibit 99.2 2016 Investor Conference December 15, 2016
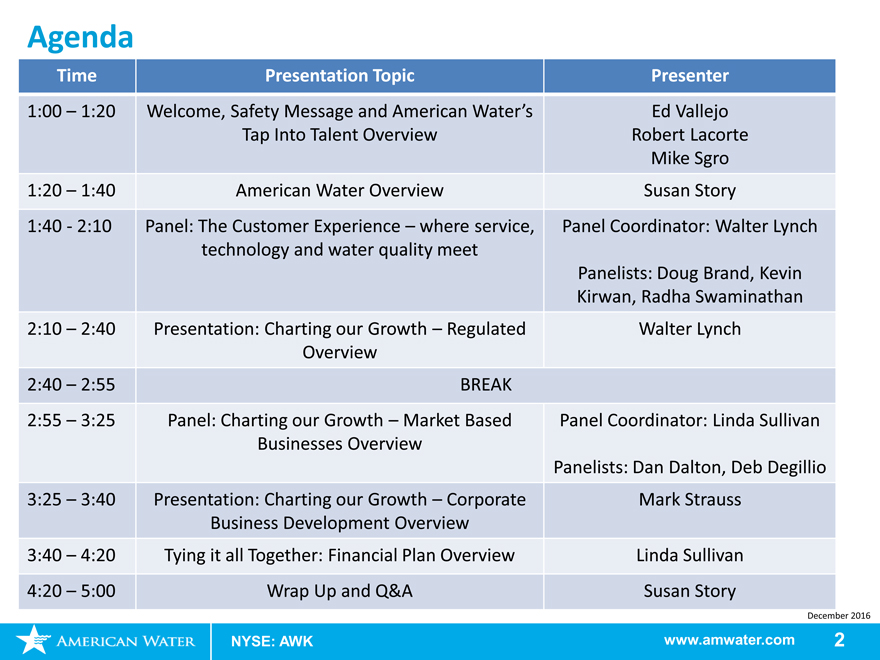
Agenda
Time Presentation Topic Presenter
1:00 – 1:20Welcome, Safety Message and American Water’sEd Vallejo
Tap Into Talent OverviewRobert Lacorte
Mike Sgro
1:20 – 1:40American Water OverviewSusan Story
1:40 - 2:10 Panel: The Customer Experience – where service,Panel Coordinator: Walter Lynch
technology and water quality meet
Panelists: Doug Brand, Kevin
Kirwan, Radha Swaminathan
2:10 – 2:40Presentation: Charting our Growth – RegulatedWalter Lynch
Overview
2:40 – 2:55BREAK
2:55 – 3:25Panel: Charting our Growth – Market BasedPanel Coordinator: Linda Sullivan
Businesses Overview
Panelists: Dan Dalton, Deb Degillio
3:25 – 3:40Presentation: Charting our Growth – CorporateMark Strauss
Business Development Overview
3:40 – 4:20Tying it all Together: Financial Plan OverviewLinda Sullivan
4:20 – 5:00Wrap Up and Q&ASusan Story
December 2016
NYSE: AWKwww.amwater.com2
Forward-Looking Statements
Ed Vallejo
Vice President Financial Planning and Investor Relations
December 2016
NYSE: AWK www.amwater.com 3
Forward-Looking Statements and Other Information
Certain statements in this presentation, including, without limitation, earnings guidance, the outcome of pending or future acquisition activity, American Water’s growth
strategy, the amount and allocation of future capital investments, and estimated revenues from rate cases and other governmental agency authorizations, are forward-
looking statements within the meaning of the safe harbor provisions of the Private Securities Litigation Reform Act of 1995 and the Federal securities laws. These forward-
looking statements are predictions based on American Water’s current expectations and assumptions regarding future events. They are not guarantees or assurances of any
outcomes, financial results of levels of activity, performance or achievements, and readers are cautioned not to place undue reliance upon them. The forward-looking
statements are subject to a number of estimates and assumptions, and known and unknown risks, uncertainties and other factors. Actual results may differ materially from
those discussed in the forward-looking statements included in this press release as a result of the factors discussed in American Water’s Annual Report on Form10-K for the
year ended December 31, 2015, and in subsequent filings with the Securities and Exchange Commission (SEC), and because of factors such as: the timing and decisions of
governmental and regulatory bodies, including decisions to raise or lower rates; changes in laws, governmental regulations and policies, including environmental, health
and safety, water quality, and public utility regulations and policies, and impacts resulting from the November 2016 U.S., state and local elections; potential costs and
liabilities of American Water for environmental and similar matters resulting from, among other things, the provision of water services to customers in the natural gas
exploration and production market; the outcome of litigation and government action related to the Freedom Industries chemical spill in West Virginia, including matters
pertaining to the binding agreement in principle to settle claims arising from this chemical spill; weather conditions, patterns or events or natural disasters, including
drought or abnormally high rainfall, strong winds, coastal and intercoastal flooding, earthquakes, landslides, hurricanes and tornadoes, and cooler than normal
temperatures; changes in customer demand for, and patterns of use of, water, such as may result from conservation efforts; its ability to appropriately maintain or upgrade
current infrastructure, including technology systems, and manage the expansion of its business; its ability to obtain permits and other approvals for projects; changes in its
capital requirements; its ability to control operating expenses and to achieve efficiencies in its operations; the intentional or unintentional acts of a third party, including
contamination of its water supplies or water supplied to its customers and attacks on, or infiltration of, its computer systems or other critical infrastructure; its ability to
obtain adequate and cost-effective supplies of chemicals, electricity, fuel, water and other raw materials that are needed for its operations; its ability to successfully meet
growth projections and capitalize on growth opportunities, including its ability to, among other things, acquire and integrate water and wastewater systems into its
regulated operations and enter into contracts and other agreements with, or otherwise obtain, new customers in its Market-based Businesses; cost overruns relating to
improvements in or the expansion of its operations; its ability to maintain safe work sites; changes in general economic, political, business and financial market conditions;
access to sufficient capital on satisfactory terms and when and as needed to support operations and capital expenditures; fluctuations in interest rates; restrictive covenants
in or changes to the credit ratings on its current or future debt that could increase its financing costs or affect its ability to borrow, make payments on debt or pay dividends;
fluctuations in the value of benefit plan assets and liabilities that could increase its financing costs and funding requirements; changes in Federal or state income tax laws,
including tax reform, the availability of tax credits and tax abatement programs, and the ability to utilize its U.S. and state net operating loss carryforwards; migration of
customers into or out of its service territories; the use by municipalities of the power of eminent domain or other authority to condemn its systems; difficulty in obtaining,
or the inability to obtain, insurance at acceptable rates and on acceptable terms and conditions; its ability to retain and attract qualified employees; labor actions, including
work stoppages and strikes; the incurrence of impairment charges related to American Water’s goodwill or other assets; and civil disturbances, terrorist threats or acts, or
public apprehension about future disturbances or terrorist threats or acts. These forward-looking statements are qualified by, and should be read together with, the risks
and uncertainties set forth above and the risk factors and other statements included in American Water’s 2015 Form10-K and in subsequent filings with the SEC, and
readers should refer to such risks, uncertainties and risk factors in evaluating such forward-looking statements. Any forward-looking statements speak only as of the date
this presentation is first given. American Water does not have or undertake any obligation or intention to update or revise any forward-looking statement, whether as a
result of new information, future events, changed circumstances or otherwise, except as otherwise required by the Federal securities laws. Furthermore, it may not be
possible to assess the impact of the foregoing factors on American Water’s businesses, either viewed independently or together, or the extent to which any factor, or
combination of factors, may cause results to differ materially from those contained in any forward-looking statement. The foregoing factors should not be construed as
exhaustive.
In this presentation, all statements related to earnings per share, or EPS, refer to diluted EPS from continuing operations.
December 2016
NYSE: AWK www.amwater.com 4
Safety Message
Robert Lacorte Financial Analyst
Author: Don’t Die in a Car
December 2016
NYSE: AWK www.amwater.com 5
Tap Into Talent
Mike Sgro
Executive Vice President, General Counsel & Corporate Secretary
December 2016
NYSE: AWK www.amwater.com 6
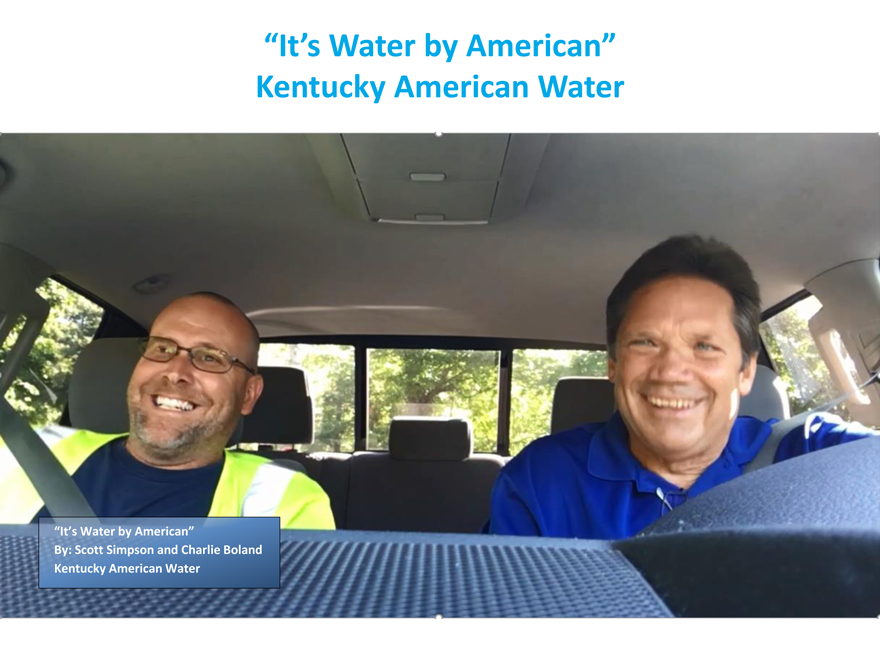
“It’s Water by American”
Kentucky American Water
“It’s Water by American”
By: Scott Simpson and Charlie Boland Kentucky American Water
Overview
Susan Story President and Chief Executive Officer
December 2016
NYSE: AWK www.amwater.com 8
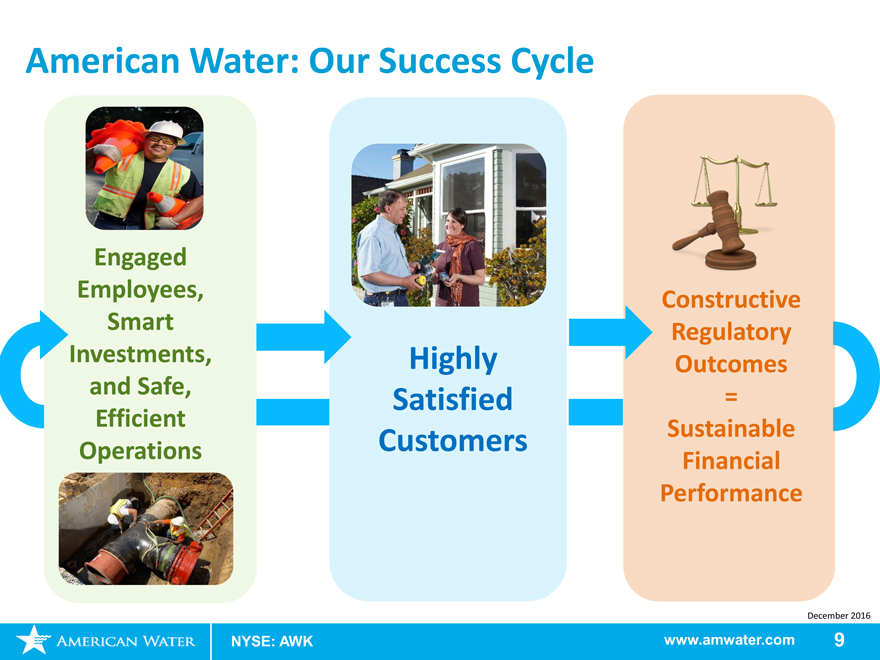
American Water: Our Success Cycle
Engaged
Employees, Constructive
Smart Regulatory
Investments, HighlyOutcomes
and Safe, Satisfied=
Efficient
Operations CustomersSustainable
Financial
Performance
December 2016
NYSE: AWK www.amwater.com9
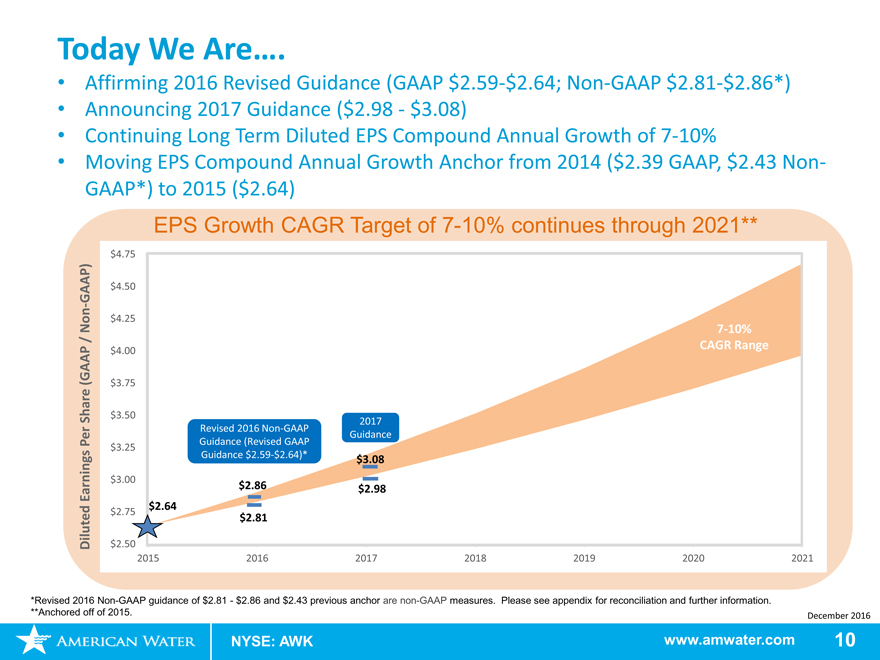
Today We Are….
Affirming 2016 Revised Guidance (GAAP$2.59-$2.64;Non-GAAP$2.81-$2.86*)
Announcing 2017 Guidance ($2.98—$3.08)
Continuing Long Term Diluted EPS Compound Annual Growth of7-10%
Moving EPS Compound Annual Growth Anchor from 2014 ($2.39 GAAP, $2.43Non- GAAP*) to 2015 ($2.64)
EPS Growth CAGR Target of7-10% continues through 2021**
$4.75
GAAP) $4.50
-
$4.25
Non7-10%
/ CAGR Range
(GAAP $4.00
$3.75
Share $3.50
2017
Revised 2016Non-GAAP
Guidance
Per Guidance (Revised GAAP
$3.25 Guidance$2.59-$2.64)*
$3.08
$3.00
Earnings $2.86 $2.98
$2.64
$2.75
$2.81
Diluted $2.50
2015 2016 2017 2018 2019 2020 2021
*Revised 2016Non-GAAP guidance of $2.81—$2.86 and $2.43 previous anchor arenon-GAAP measures. Please see appendix for reconciliation and further information.
**Anchored off of 2015. December 2016
NYSE: AWK www.amwater.com 10
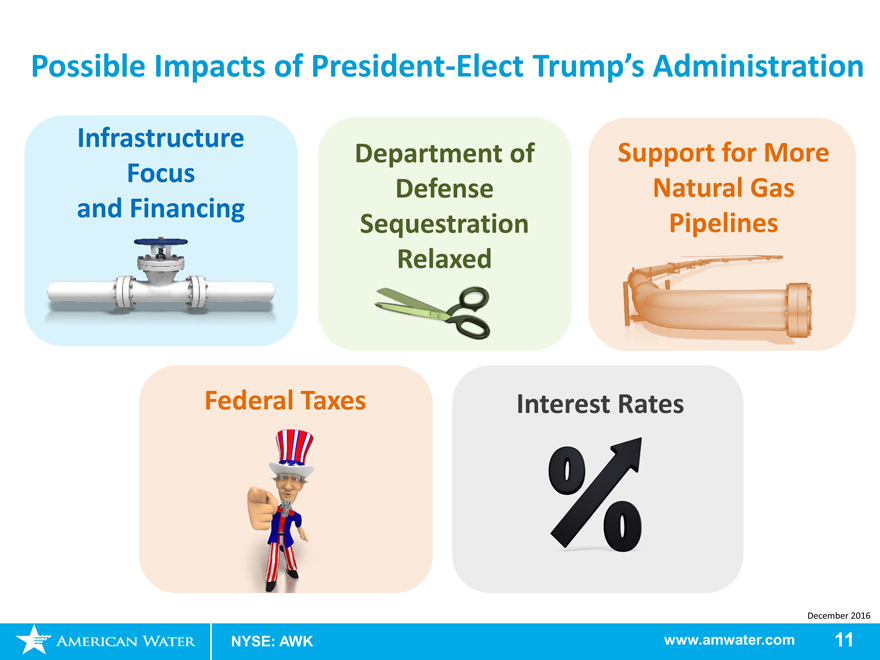
Possible Impacts of President-Elect Trump’s Administration
Infrastructure Department of Support for More
Focus Defense Natural Gas
and Financing Sequestration Pipelines
Federal Taxes Interest Rates
December 2016
NYSE: AWK www.amwater.com 11
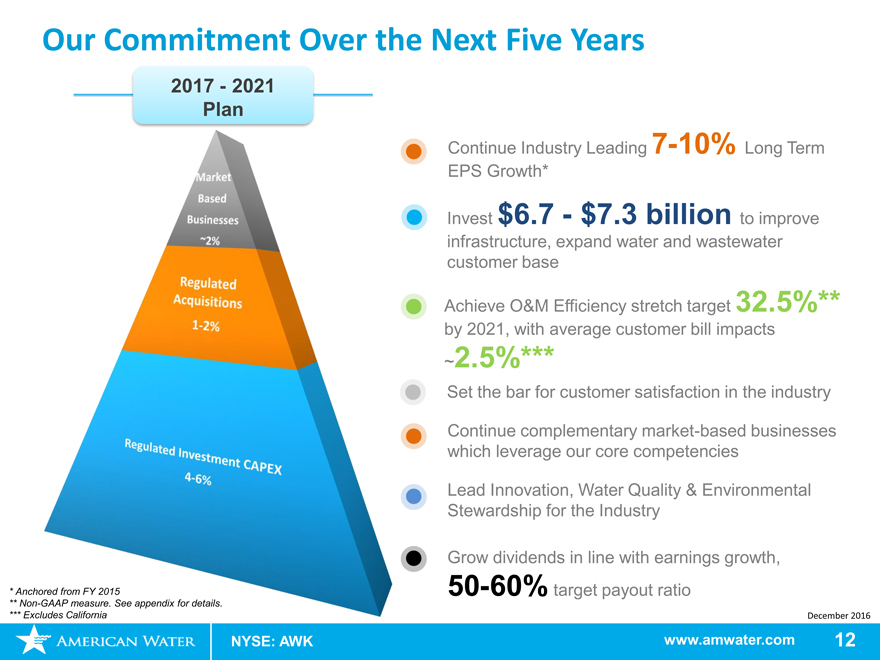
Our Commitment Over the Next Five Years
2017—2021 Plan
NYSE: AWK
Continue Industry Leading7-10% Long Term EPS Growth*
Invest $6.7—$7.3 billion to improve
infrastructure, expand water and wastewater customer base Achieve O&M Efficiency stretch target 32.5%** by 2021, with average customer bill impacts
~2.5%***
Set the bar for customer satisfaction in the industry
Continue complementary market-based businesses which leverage our core competencies
Lead Innovation, Water Quality & Environmental Stewardship for the Industry
Grow dividends in line with earnings growth,
50-60% target payout ratio
December 2016
www.amwater.com 12
Ancho
**Non-*** Exc
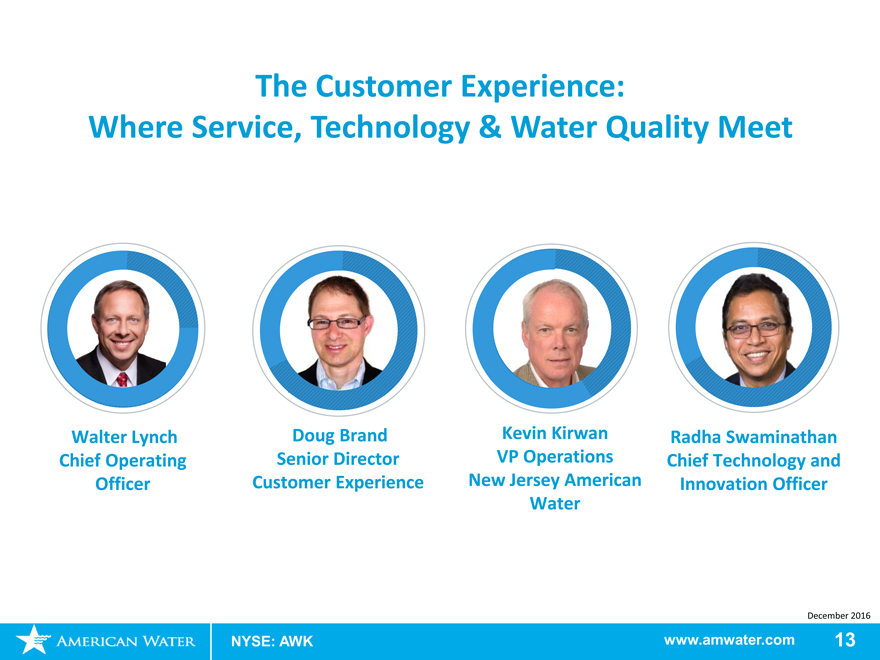
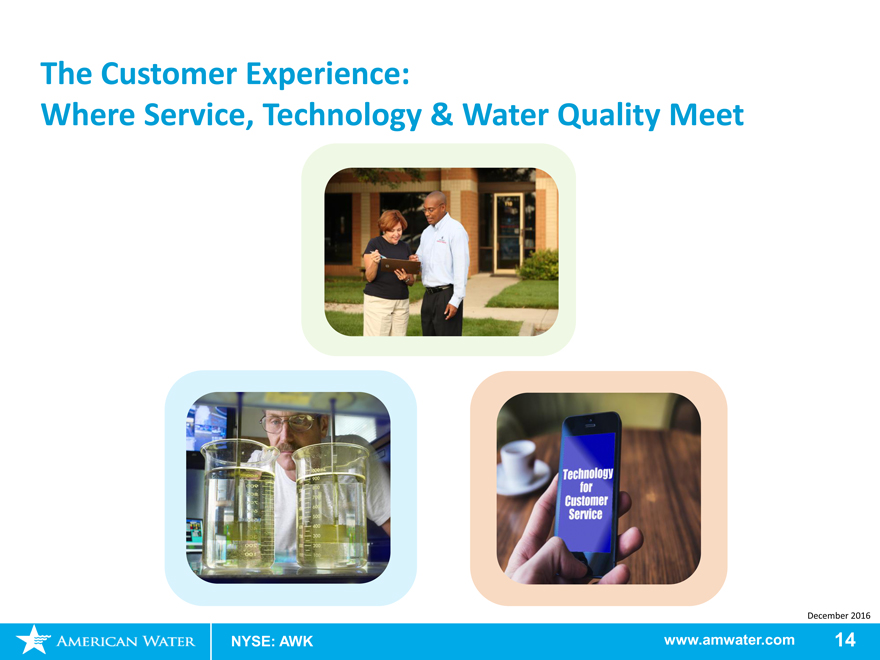
The Customer Experience:
Where Service, Technology & Water Quality Meet
Walter Lynch Doug Brand Kevin KirwanRadha Swaminathan
Chief Operating Senior Director VP OperationsChief Technology and
Officer Customer Experience New Jersey AmericanInnovation Officer
Water
December 2016
NYSE: AWK www.amwater.com 13
The Customer Experience:
Where Service, Technology & Water Quality Meet
December 2016
NYSE: AWK www.amwater.com 14
Charting Our Growth: Regulated Overview
Walter Lynch
Chief Operating Officer
December 2016
NYSE: AWK www.amwater.com15
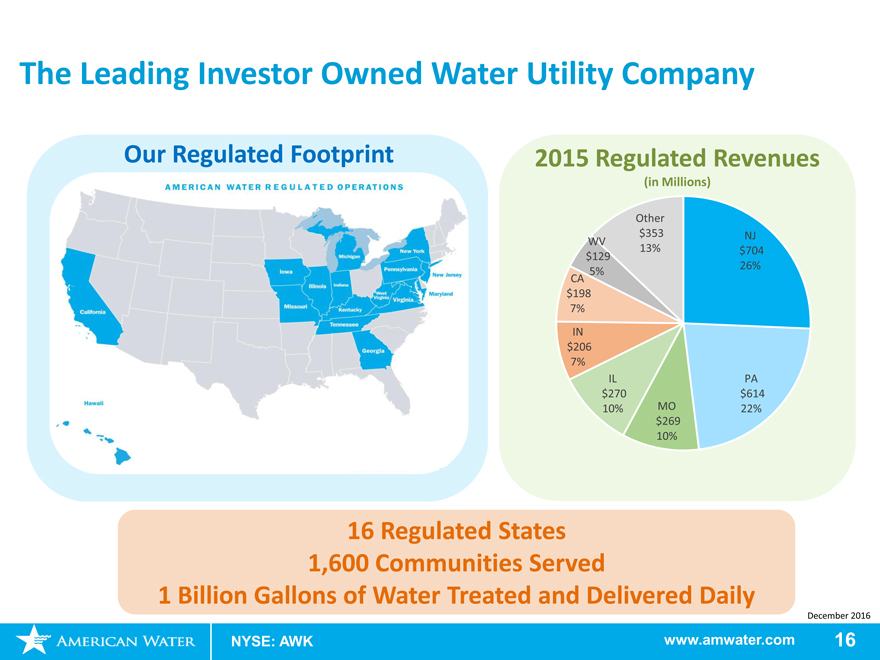
The Leading Investor Owned Water Utility Company
Our Regulated Footprint 2015 Regulated Revenues
(in Millions)
Other
WV $353NJ
$129 13%$704
5% 26%
CA
$198
7%
IN
$206
7%
IL PA
$270 $614
10% MO22%
$269
10%
16 Regulated States 1,600 Communities Served
1 Billion Gallons of Water Treated and Delivered Daily
December 2016
NYSE: AWK www.amwater.com 16
Regulated Infrastructure Investment—the Foundation of our Growth
Total Regulated:5%-8%
Regulated
4% – 6% Investment
December 2016
NYSE: AWK www.amwater.com 17
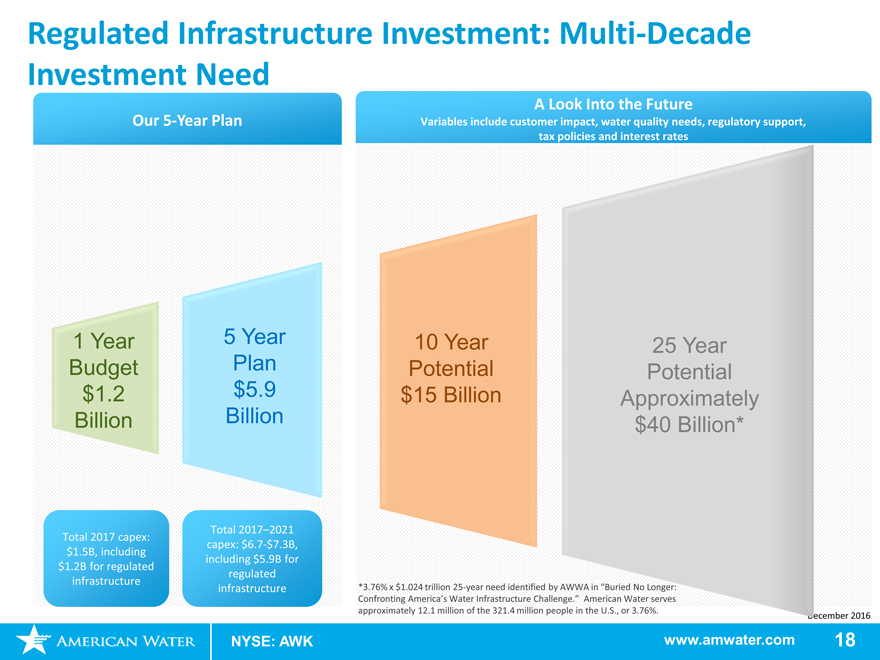
Regulated Infrastructure Investment: Multi-Decade
Investment Need
A Look Into the Future
Our5-Year Plan Variables include customer impact, water quality needs, regulatory support,
tax policies and interest rates
1 Year 5 Year 10 Year25 Year
Budget Plan PotentialPotential
$1.2 $5.9 $15 BillionApproximately
Billion Billion $40 Billion*
Total 2017–2021
Total 2017 capex:
capex:$6.7-$7.3B,
$1.5B, including
including $5.9B for
$1.2B for regulated
regulated
infrastructure
infrastructure *3.76% x $1.024 trillion25-year need identified by AWWA in “Buried No Longer:
Confronting America’s Water Infrastructure Challenge.” American Water serves
approximately 12.1 million of the 321.4 million people in the U.S., or 3.76%.ecember 2016
NYSE: AWK www.amwater.com18
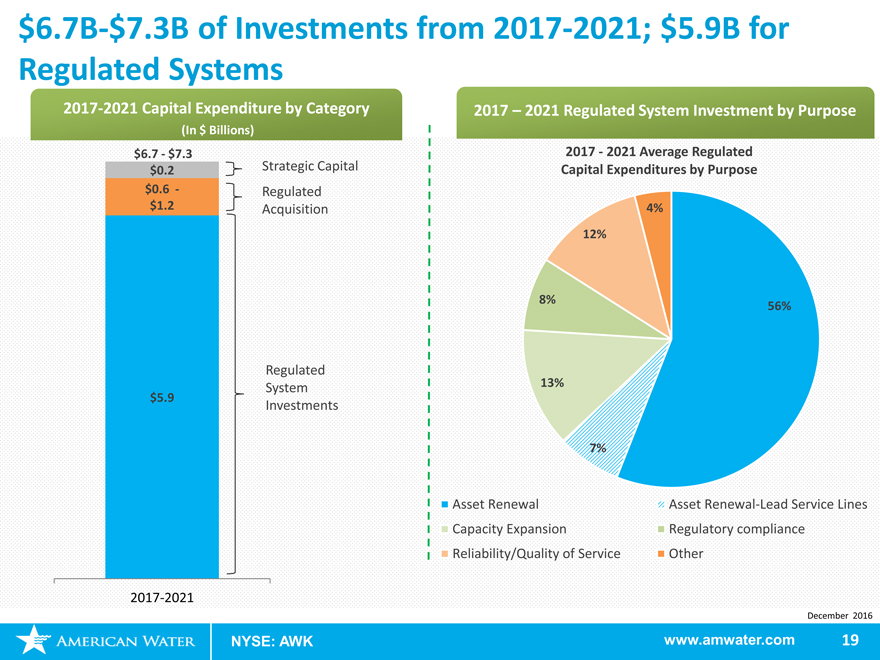
$6.7B-$7.3B of Investments from 2017-2021; $5.9B for Regulated Systems
2017-2021 Capital Expenditure by Category 2017 – 2021 Regulated System Investment by Purpose
(In $ Billions)
$6.7—$7.3 2017—2021 Average Regulated
$0.2 Strategic Capital Capital Expenditures by Purpose
$0.6 —Regulated
$1.2 Acquisition 4%
12%
8%
56%
Regulated
System 13%
$5.9
Investments
7%
Asset Renewal Asset Renewal-Lead Service Lines
Capacity Expansion Regulatory compliance
Reliability/Quality of Service Other
2017-2021
December 2016
NYSE: AWK www.amwater.com 19
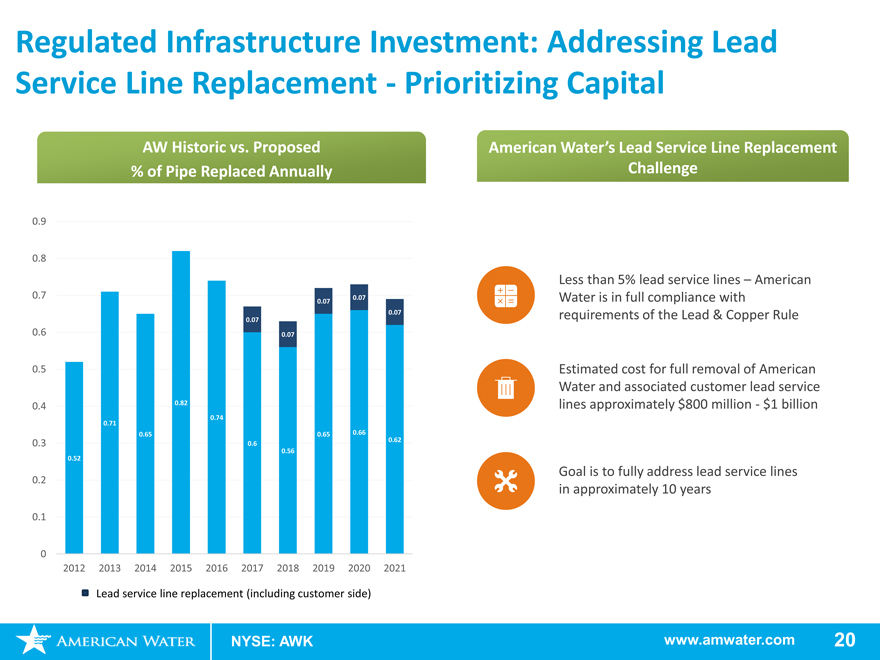
Regulated Infrastructure Investment: Addressing Lead Service Line Replacement—Prioritizing Capital
AW Historic vs. Proposed % of Pipe Replaced Annually
0.9
0.8
0.7 0.07 0.07
0.07 0.07 0.6 0.07
0.5
0.4 0.82
0.71 0.74
0.65 0.65 0.66
0.62
0.3 0.6
0.56 0.52
0.2
0.1
0
2012 2013 2014 2015 2016 2017 2018 2019 2020 2021
Lead service line replacement (including customer side)
NYSE: AWK
American Water’s Lead Service Line Replacement
Challenge
Less than 5% lead service lines – American Water is in full compliance with requirements of the Lead & Copper Rule
Estimated cost for full removal of American Water and associated customer lead service lines approximately $800 million—$1 billion
Goal is to fully address lead service lines in approximately 10 years
www.amwater.com 20
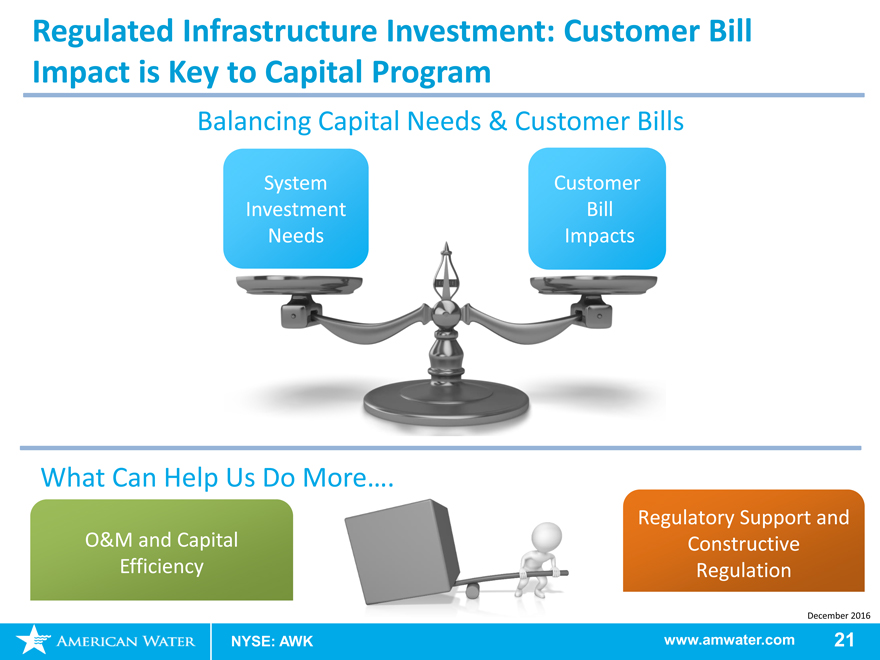
Regulated Infrastructure Investment: Customer Bill Impact is Key to Capital Program
Balancing Capital Needs & Customer Bills
System Customer
Investment Bill
Needs Impacts
What Can Help Us Do More….
Regulatory Support and
O&M and Capital Constructive
Efficiency Regulation
December 2016
NYSE: AWK www.amwater.com 21
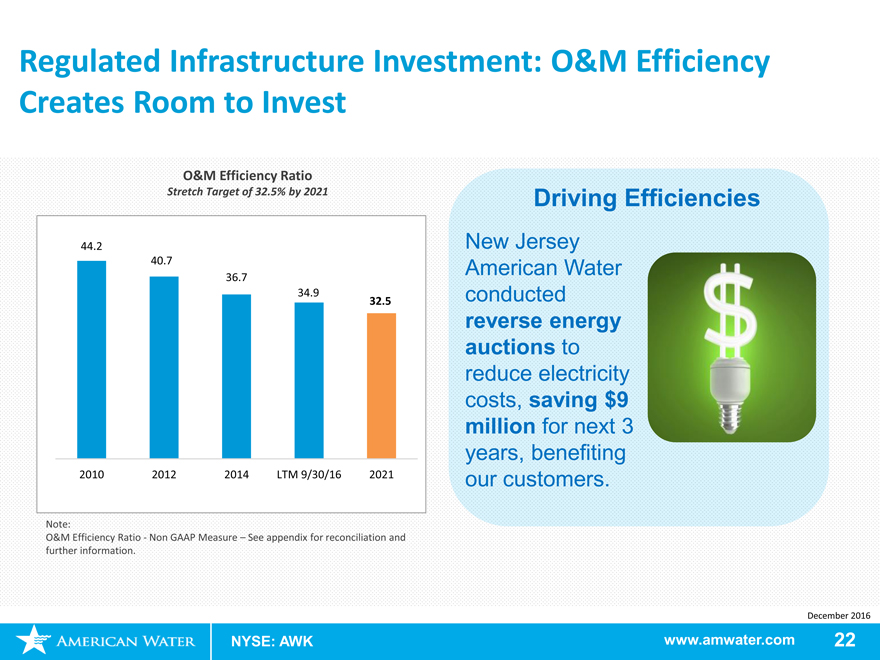
Regulated Infrastructure Investment: O&M Efficiency Creates Room to Invest
O&M Efficiency Ratio
Stretch Target of 32.5% by 2021
44.2
40.7
36.7
34.9
32.5
2010 2012 2014 LTM 9/30/16 2021
Note:
O&M Efficiency Ratio—Non GAAP Measure – See appendix for reconciliation and
further information.
NYSE: AWK
Driving Efficiencies
New Jersey
American Water
conducted
reverse energy
auctions to
reduce electricity
costs, saving $9
million for next 3
years, benefiting
our customers.
December 2016
www.amwater.com 22
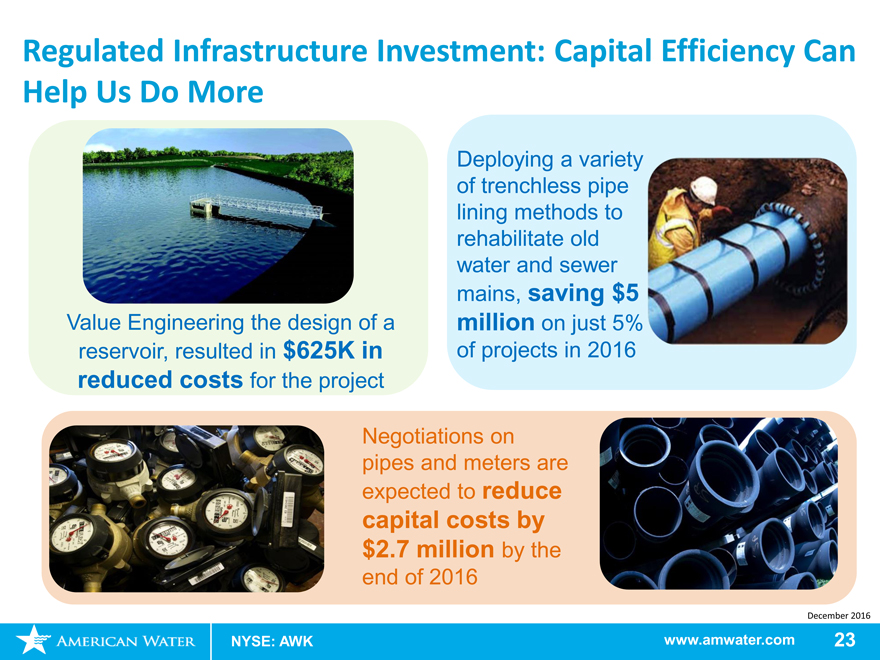
Regulated Infrastructure Investment: Capital Efficiency Can
Help Us Do More
Deploying a variety of trenchless pipe lining methods to rehabilitate old water and sewer
mains, saving $5
Value Engineering the design of a million on just 5% reservoir, resulted in $625K in of projects in 2016 reduced costs for the project
Negotiations on pipes and meters are expected to reduce
capital costs by
$2.7 million by the
end of 2016
December 2016
NYSE: AWK www.amwater.com 23
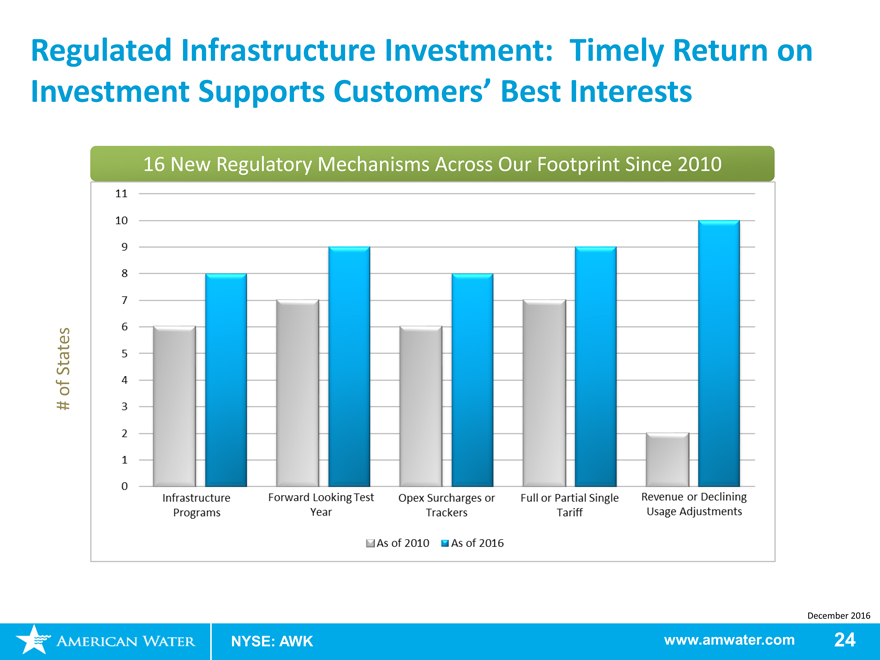
Regulated Infrastructure Investment: Timely Return on
Investment Supports Customers’ Best Interests
16 New Regulatory Mechanisms Across Our Footprint Since 2010
States
of
#
December 2016
NYSE: AWK www.amwater.com 24
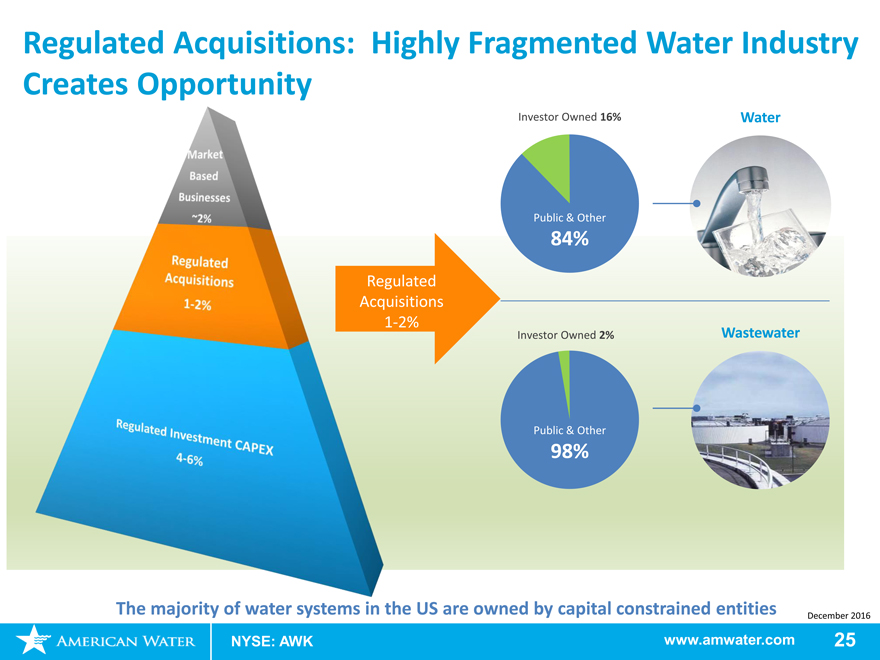
Regulated Acquisitions: Highly Fragmented Water Industry
Creates Opportunity
Investor Owned 16% Water
Public & Other
84%
lated
tions
2%
Investor Owned 2% Wastewater
Public & Other
98%
The majority of water systems in the US are owned by capital constrained entities
NYSE: AWK www.amwater.com 25
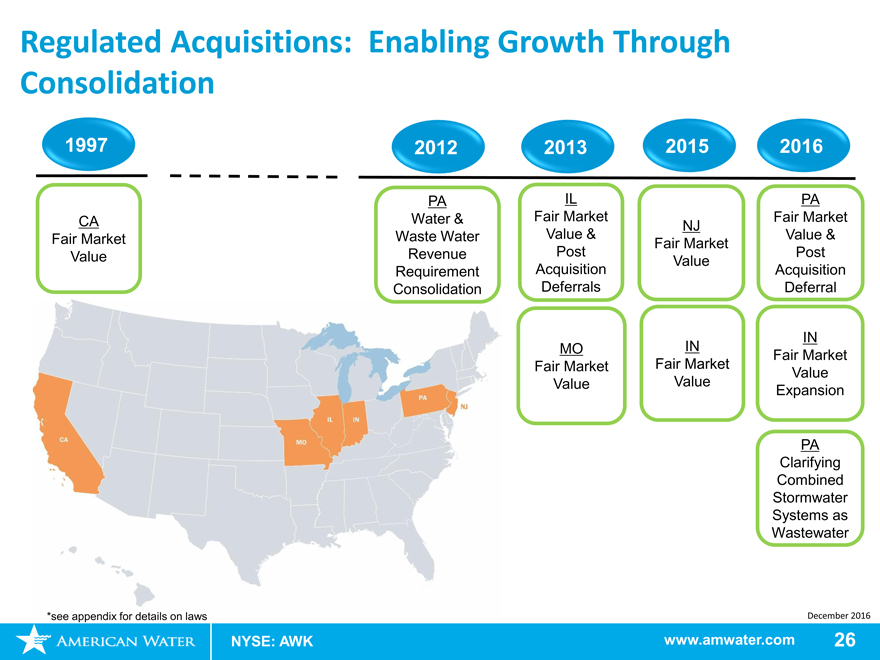
Regulated Acquisitions: Enabling Growth Through
Consolidation
1997 2012 2013 2015 2016
PA IL PA
CA Water & Fair Market Fair Market
NJ
Fair Market Waste Water Value & Value &
Fair Market
Value Revenue Post Post
Value
Requirement Acquisition Acquisition
Consolidation Deferrals Deferral
IN
MO IN
Fair Market
Fair Market Fair Market
Value
Value Value
Expansion
PA
Clarifying
Combined
Stormwater
Systems as
Wastewater
*see appendix for details on laws December 2016
NYSE: AWK www.amwater.com 26
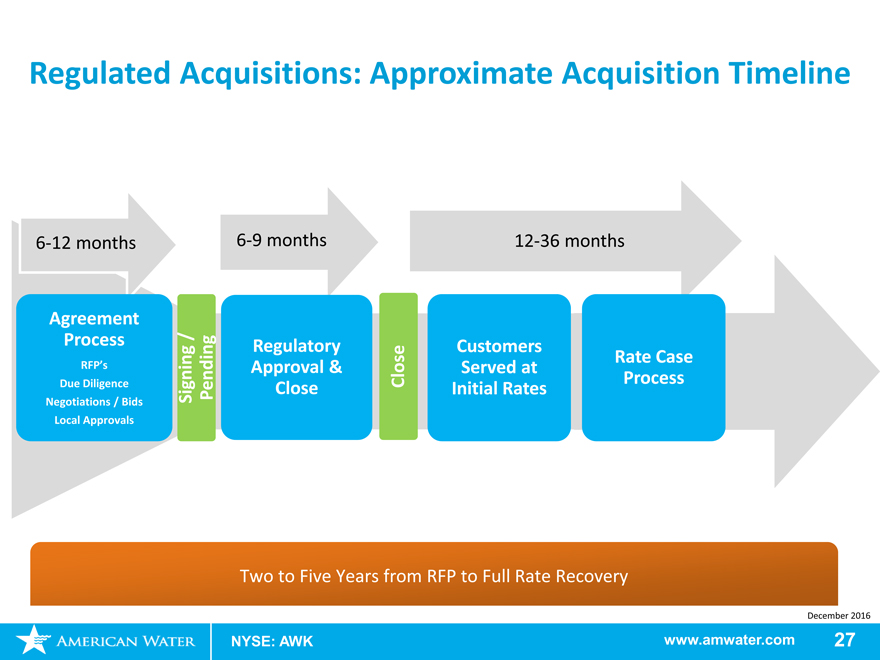
Regulated Acquisitions: Approximate Acquisition Timeline
6-12 months 6-9months12-36 months
Agreement
Process / RegulatoryCustomers
Rate Case
Due RFP’s Diligence Approval &CloseServed atProcess
Signing Pending CloseInitial Rates
Negotiations / Bids
Local Approvals
Two to Five Years from RFP to Full Rate Recovery
December 2016
NYSE: AWKwww.amwater.com27
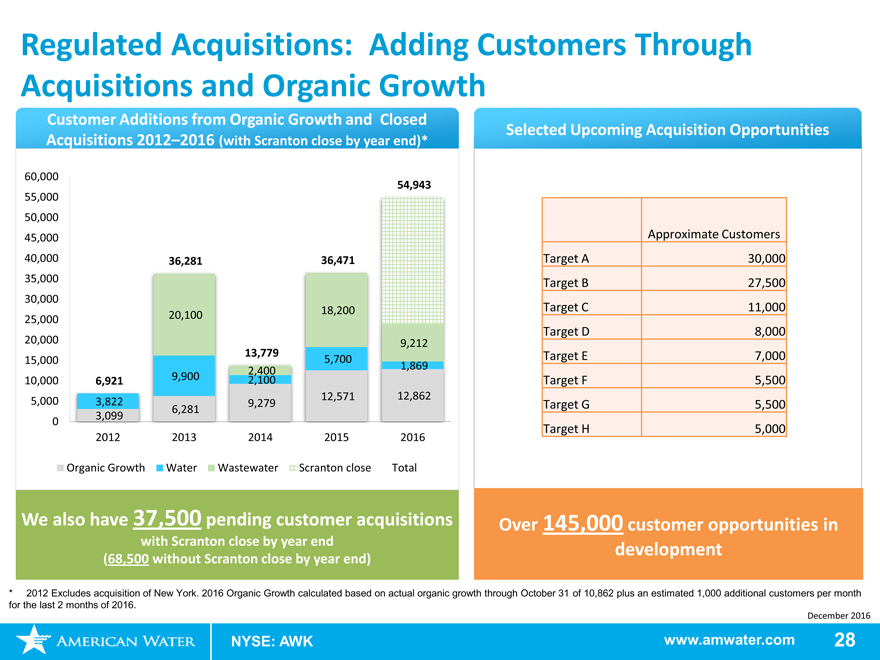
Regulated Acquisitions: Adding Customers Through Acquisitions and Organic Growth
Customer Additions from Organic Growth and Closed
Selected Upcoming Acquisition Opportunities
Acquisitions 2012–2016 (with Scranton close by year end)*
60,000
54,943
55,000
50,000
45,000 Approximate Customers
40,000 36,28136,471Target A30,000
35,000 Target B27,500
30,000
18,200Target C11,000
25,000 20,100
Target D8,000
20,000 9,212
15,000 13,7795,700Target E7,000
2,4001,869
10,000 6,921 9,9002,100Target F5,500
12,57112,862
5,000 3,822 6,2819,279Target G5,500
0 3,099
Target H5,000
2012 2013201420152016
Organic Growth WaterWastewaterScranton closeTotal
We also have 37,500 pending customer acquisitions Over 145,000 customer opportunities in
with Scranton close by year end development
(68,500 without Scranton close by year end)
* 2012 Excludes acquisition of New York. 2016 Organic Growth calculated based on actual organic growth through October 31 of 10,862 plus an estimated 1,000 additional customers per month
for the last 2 months of 2016.
December 2016
NYSE: AWK www.amwater.com 28
Regulated Operations Summary: Reliable, Steady Execution
2017—2021
Committed to:
Invest $5.9B over 5 years in our assets, while keeping bill increases to ~ 2.5% on average*
Invest$0.6-$1.2B over 5 years in regulated acquisitions to grow our customer base
Pursue constructive regulatory mechanisms for timely return on investment
Pursue legislative policies to enable growth
Leverage technology to enhance customer experience and become more efficient in O&M
and capital spend
*Excluding CA
December 2016
NYSE: AWK www.amwater.com 29
“H2O Serenade”
Missouri American Water
“H2O Serenade”
By: Terrance Green Missouri American Water
Charting Our Growth:
Market Based Business Overview
Linda Sullivan Deb Degillio Dan Dalton
Chief Financial President President and CEO
Officer American Water Keystone Clearwater
Enterprises Solutions
December 2016
NYSE: AWK www.amwater.com 31
Why We Pursue Market-Based Businesses
Market Based Why Market-based
Businesses
~2% Businesses?
Build Relationships
Capitalize
on Our Core
Competencies
Additional,
Capital-Light Attract
Growth Talent
December 2016
NYSE: AWK www.amwater.com 32
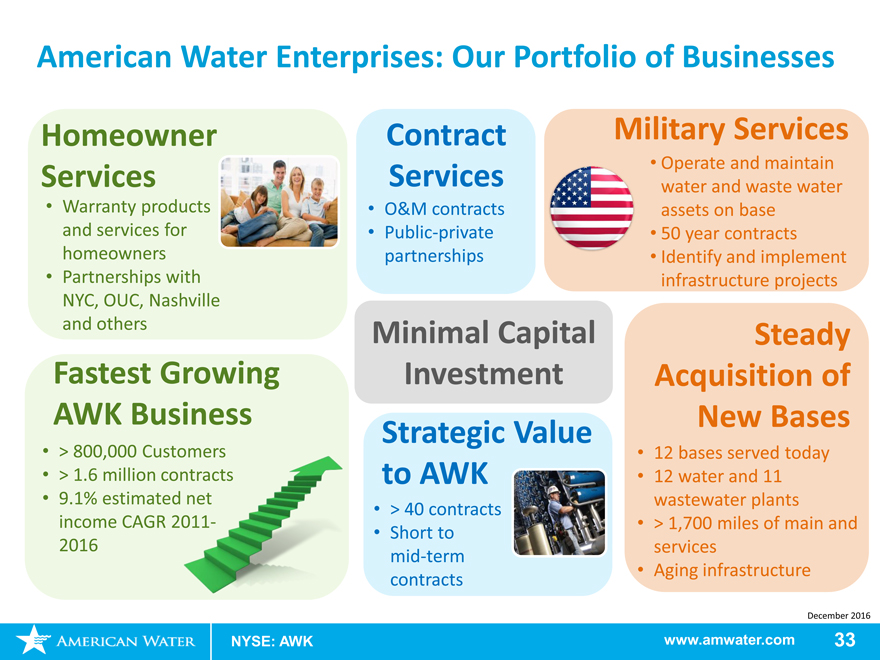
American Water Enterprises: Our Portfolio of Businesses
Homeowner Services
Warranty products and services for homeowners
Partnerships with NYC, OUC, Nashville and others
Fastest Growing AWK Business
> 800,000 Customers
> 1.6 million con
9.1% estimated income CAGR 2 2016
Contract
Services
O&M contracts
Public-private partnerships
Minimal Capital Investment
Strategic Value to AWK
> 40 contracts
Short tomid-term contracts
Military Services
Operate and maintain water and waste water assets on base
50 year contracts
Identify and implement infrastructure projects
Steady
Acquisition of
New Bases
12 bases served today
12 water and 11 wastewater plants
> 1,700 miles of main and services
Aging infrastructure
December 2016
www.amwater.com 33
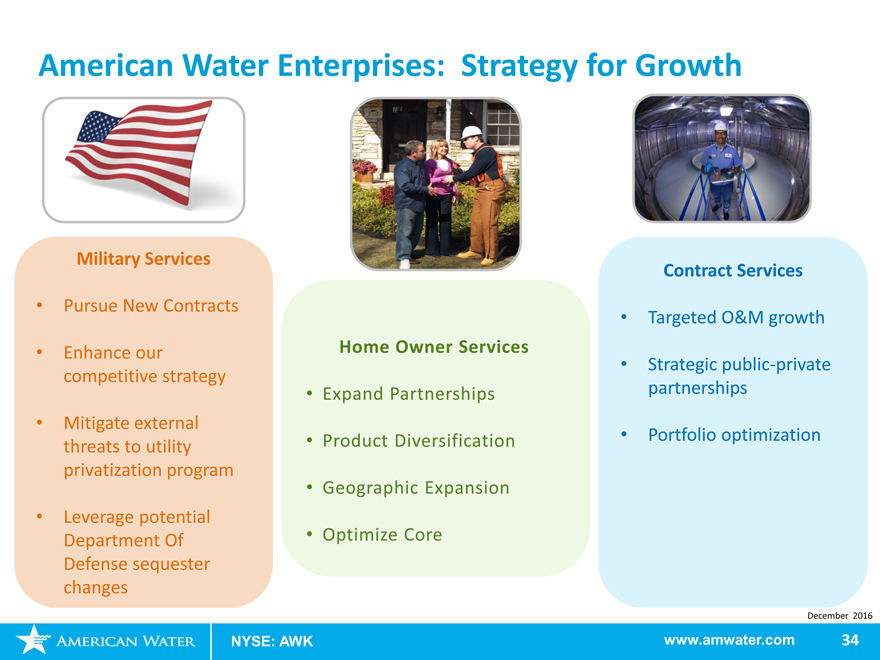
American Water Enterprises: Strategy for Growth
Military Services
Pursue New Contracts
Enhance our competitive strategy
Mitigate external threats to utility privatization program
Leverage potential Department Of Defense sequester changes
Home Owner Services
Expand Partnerships
Product Diversification
Geographic Expansion
Optimize Core
Contract Services
Targeted O&M growth
Strategic public-private partnerships
Portfolio optimization
NYSE: AWK
December 2016
www.amwater.com 34
Keystone Business Update—Current Market Overview
Key Business Drivers
Increased Market Share
Natural Gas Price
Rig Count
Well Completions
Current Market Conditions
• $3.00+/MMBtu Natural Gas
• 50+ Rigs in Appalachia
• Increased Well Completions Projected
in 2017 Appalachian Basin
Largest % of Natural Gas
December 2016
NYSE: AWK www.amwater.com 35
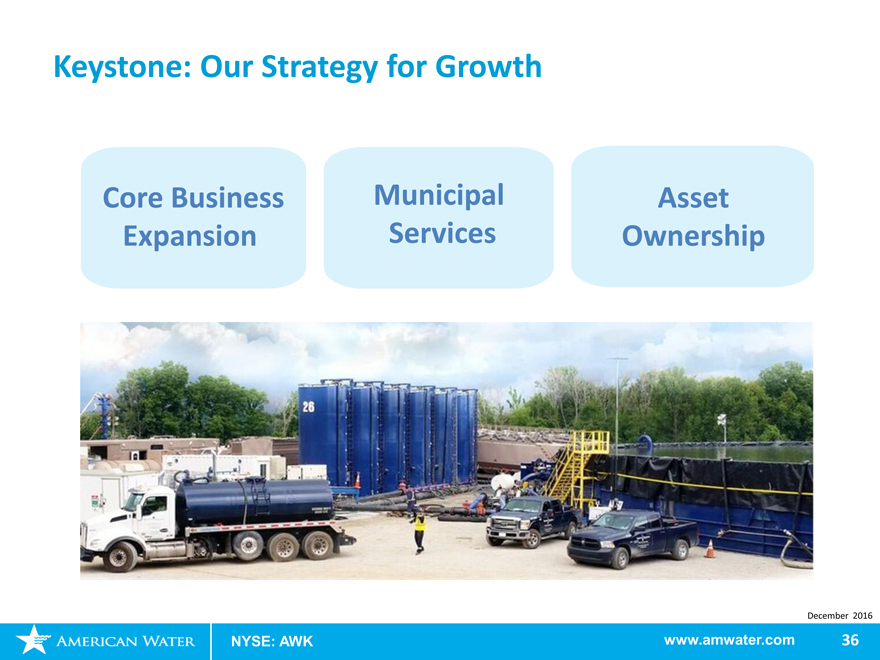
Keystone: Our Strategy for Growth
Core Business Municipal Asset
Expansion Services Ownership
December 2016
NYSE: AWK www.amwater.com 36
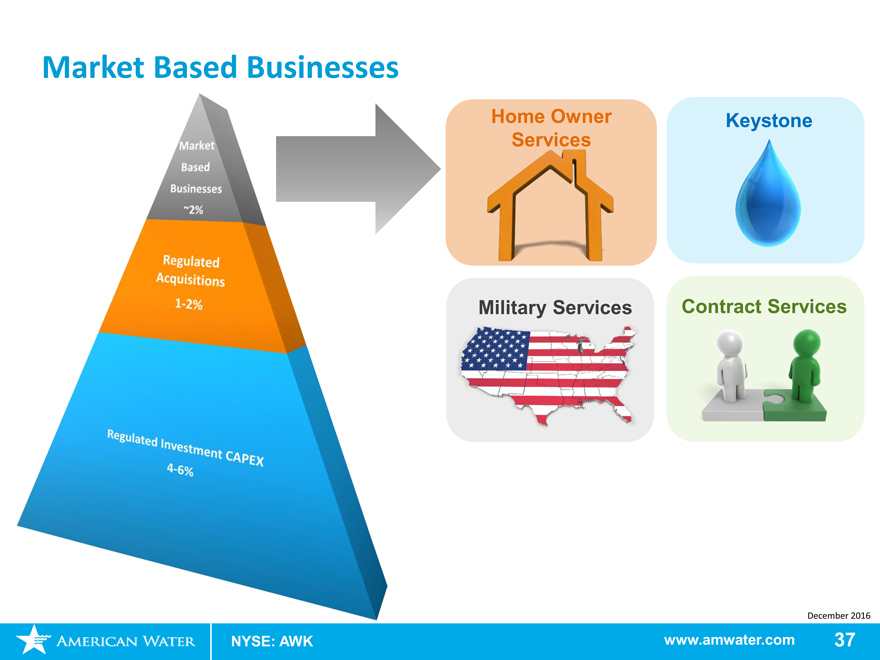
Market Based Businesses
Home Owner Keystone Services
Military Services Contract Services
December 2016
NYSE: AWK www.amwater.com 37
Charting Our Growth:
Corporate Business Development Overview
Mark Strauss
Senior Vice President—Corporate Strategy and Business
Development
December 2016
NYSE: AWK www.amwater.com 38
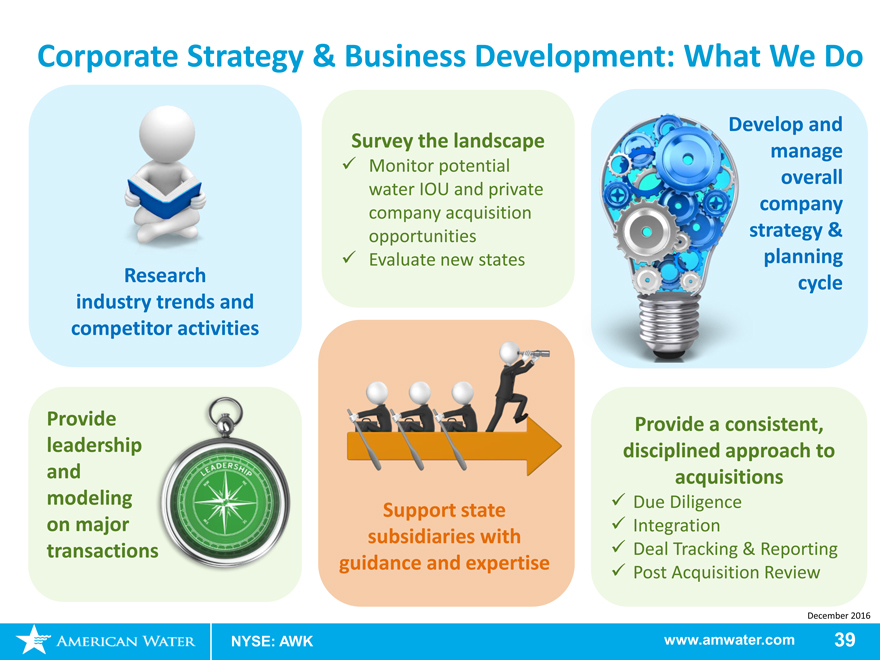
Corporate Strategy & Business Development: What We Do
Research industry trends and competitor activities
Survey the landscape
Monitor potential
water IOU and private
company acquisition
opportunities
Evaluate new states
Provide
leadership
and
modeling Support state
on major subsidiaries with
transactions guidance and expertise
velop and
manage
overall
company
strategy &
planning
cycle
Provide a consistent, disciplined approach to acquisitions
Due Diligence
Integration
Deal Tracking & Reporting
Post Acquisition Review
December 2016
www.amwater.com 39
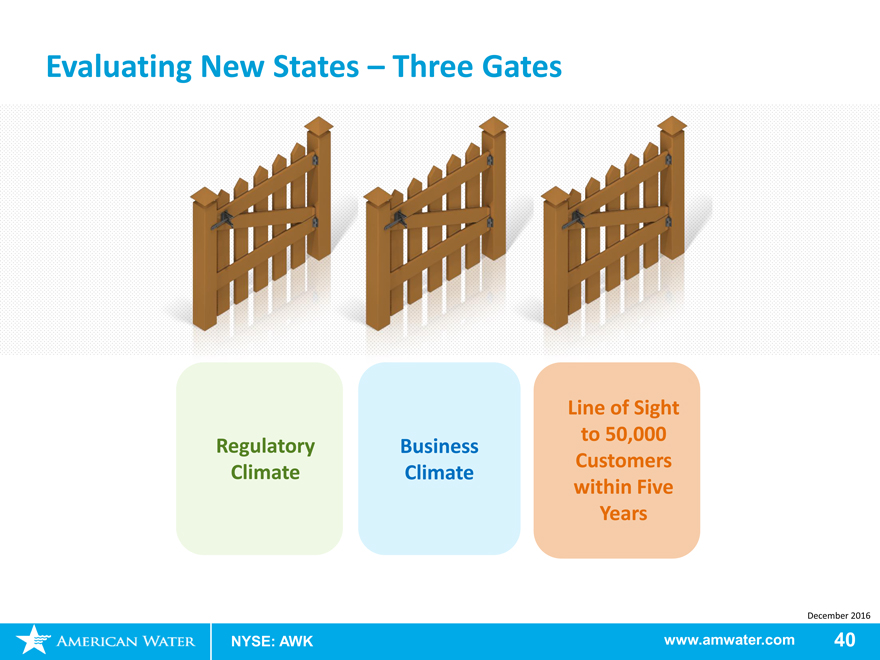
Evaluating New States – Three Gates
Line of Sight to 50,000 Regulatory Business Customers Climate Climate within Five Years
December 2016
NYSE: AWK www.amwater.com 40
Bringing It All Together: Our Financial Plan
Linda Sullivan
Chief Financial Officer
December 2016
NYSE: AWK www.amwater.com 41
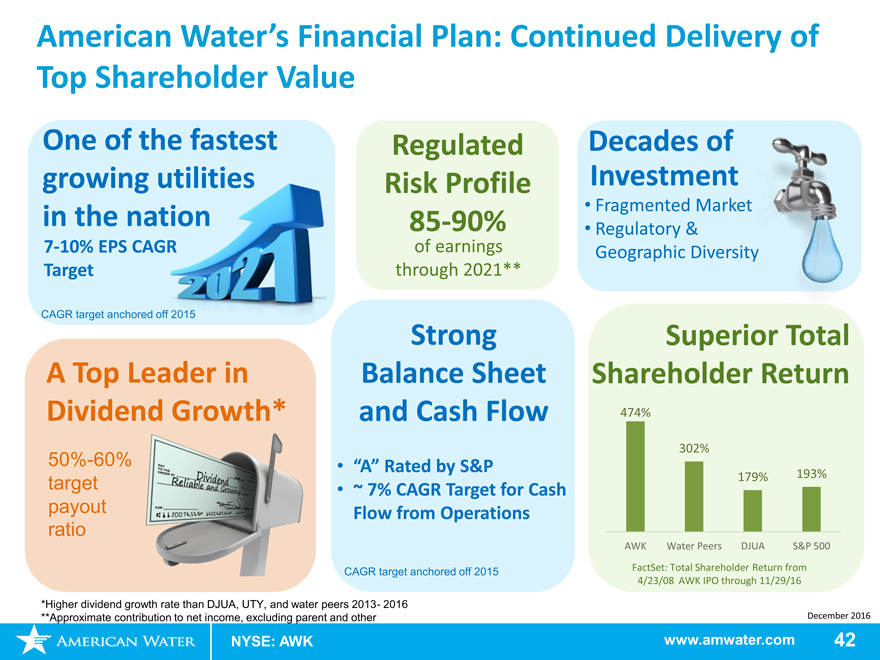
American Water’s Financial Plan: Continued Delivery of
Top Shareholder Value
One of the fastest
growing u
in the na
7-10% EPS CAGR
Target
CAGR target anchored off 2015
A Top Leader in
Dividend Growth*
50%-60%
target
payout
ratio
Regulated Risk Profile
85-90%
of earnings through 2021**
Strong Balance Sheet and Cash Flow
“A” Rated by S&P
~ 7% CAGR Target for Cash Flow from Operations
CAGR target anchored off 2015
*Higher dividend growth rate than DJUA, UTY, and water peers 2013- 2016 **Approximate contribution to net income, excluding parent and other
Decades of Investment
• Fragmented Market
• Regulatory & Geographic Diversity
Superior Total
Shareholder Return
474%
302%
179%
193%
AWK Water Peers
DJUA
S&P 500
FactSet: Total Shareholder Return from 4/23/08 AWK IPO through 11/29/16
December 2016
www.amwater.com 42
One of the Fastest Growing Utilities in the Nation
2016 Guidance EPS Growth CAGR Target of7-10% Original through 2021**
Revised
$4.75
$2.59-$2.64
GAAP GAAP) $4.50
$2.75-$2.85—$4.25$2.81-$2.86 Non
7-10%
/ $4.00
Non-GAAP* AAP CAGR Range
$3.75
(G
2017 Guidance $3.50 Revised 2016 Non-
2017 Share GAAP Guidance Guidance (Revised GAAP $3.25$2.98-$3.08 Per Guidance$2.59- $2.64)* $3.08 $3.00 $2.86 $2.98
Earnings $2.75
• 8% growth over midpoint of $2.81
$2.64
original 2016 guidance $2.50
Diluted 2015 2016 2017 2018 2019 2020 2021
• 7% growth over midpoint of
2016 revisednon-GAAP Anchor moved from 2014 ($2.39 GAAP, $2.43Non-GAAP*) guidance to 2015 ($2.64)
*Revised 2016Non-GAAP guidance of $2.81—$2.86 and $2.43 previous anchor arenon-GAAP measures. Please see appendix for reconciliation and further information.
**Anchored from 2015 December 2016
NYSE: AWK www.amwater.com 43
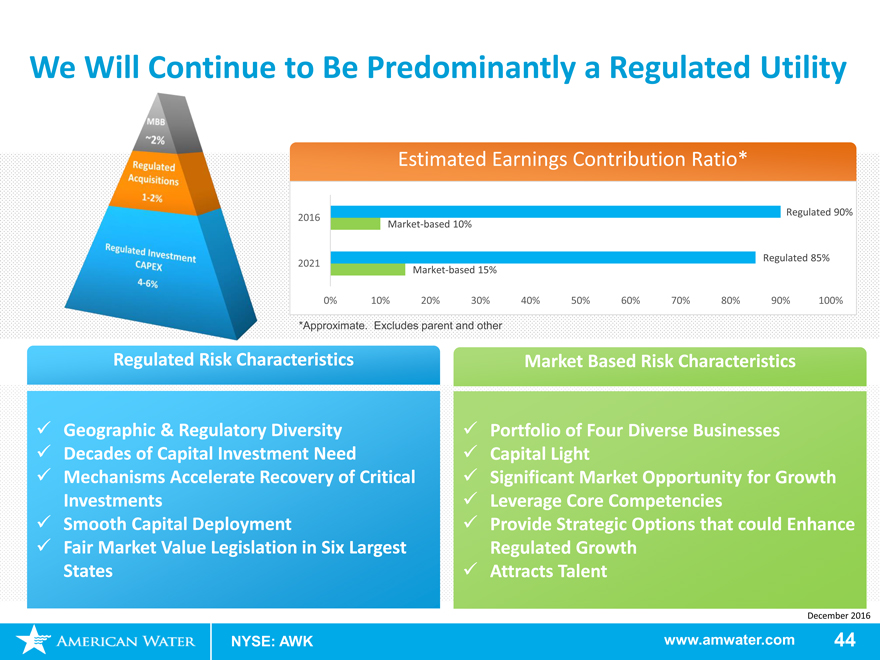
We Will Continue to Be Predominantly a Regulated Utility
Estimated Earnings Contribution Ratio*
Regulated 90% 2016 Market-based 10%
Regulated 85% 2021 Market-based 15%
0% 10% 20% 30% 40% 50% 60% 70% 80% 90% 100%
*Approximate. Excludes parent and other
Regulated Risk Characteristics
Geographic & Regulatory Diversity
Decades of Capital Investment Need
Mechanisms Accelerate Recovery of Critical Investments
Smooth Capital Deployment
Fair Market Value Legislation in Six Largest States
Market Based Risk Characteristics
Portfolio of Four Diverse Businesses
Capital Light
Significant Market Opportunity for Growth
Leverage Core Competencies
Provide Strategic Options that could Enhance Regulated Growth
Attracts Talent
December 2016
NYSE: AWK
www.amwater.com 44
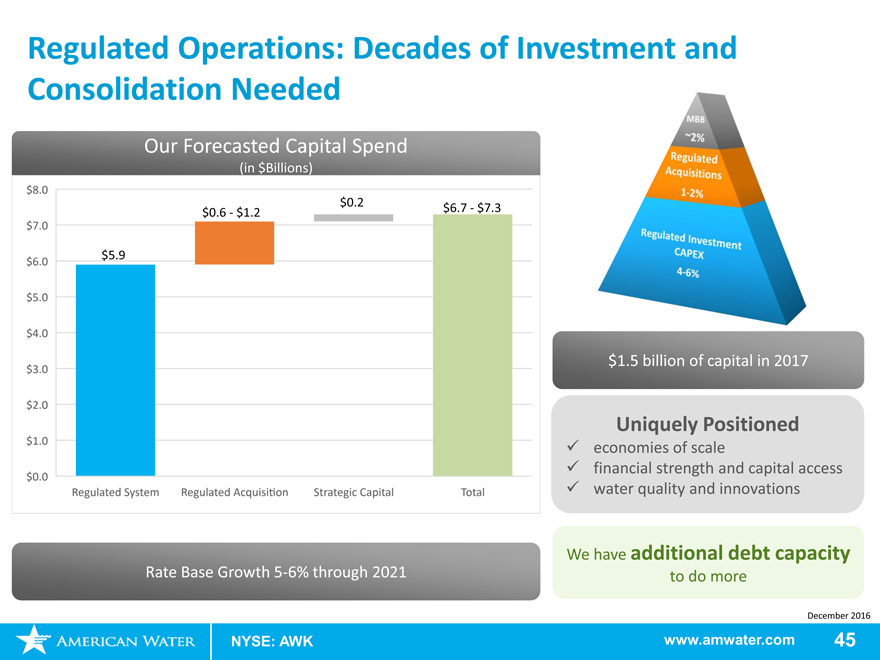
Regulated Operations: Decades of Investment and
Consolidation Needed
Our Forecasted Capital Spend
(in $Billions)
$0.2
$0.6—$1.2 $6.7—$7.3
$5.9
$1.5 billion of capital in 2017
Uniquely Positioned
economies of scale
financial strength and capital access
water quality and innovations
We have additional debt capacity
Rate Base Growth5-6% through 2021 to do more
December 2016
NYSE: AWK www.amwater.com 45
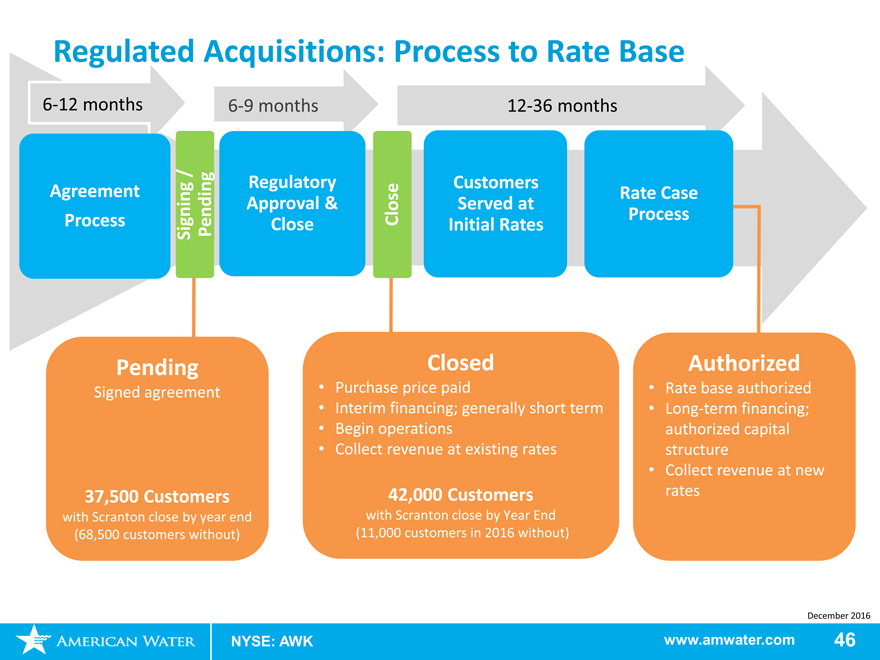
Regulated Acquisitions: Process to Rate Base
6-12 months6-9 months12-36 months
/
Agreement RegulatoryCustomers
Approval &Served at
Process Signing Pending CloseCloseInitial Rates
Pending Closed
Signed agreement • Purchase price paid
Interim financing; generally short term
Begin operations
Collect revenue at existing rates
37,500 Customers 42,000 Customers
with Scranton close by year end with Scranton close by Year End
(68,500 customers without) (11,000 customers in 2016 without)
Rate Case
Process
Authorized
Rate base authorized
Long-term financing; authorized capital structure
Collect revenue at new rates
December 2016
NYSE: AWK
www.amwater.com 46
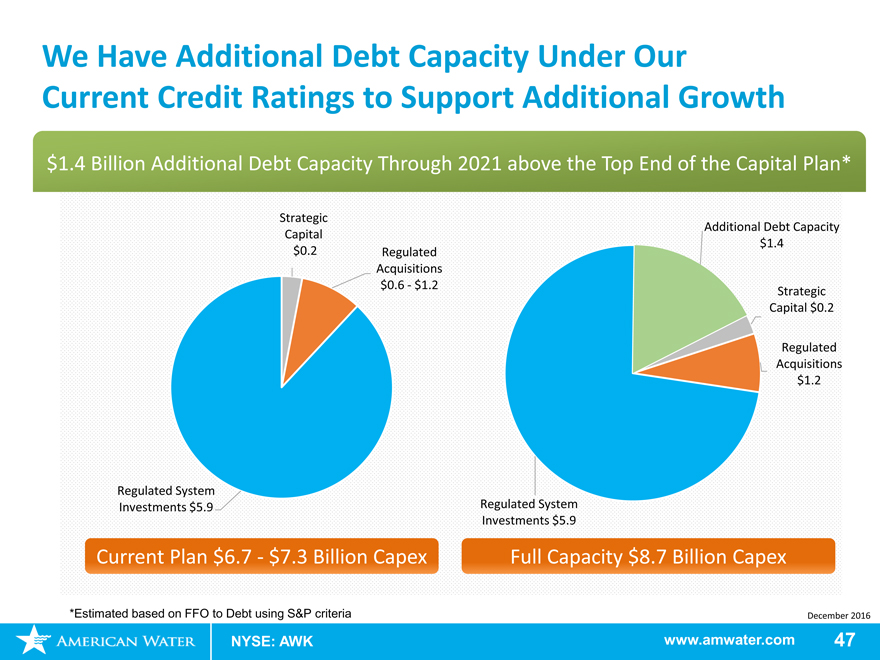
We Have Additional Debt Capacity Under Our Current Credit Ratings to Support Additional Growth
$1.4 Billion Additional Debt Capacity Through 2021 above the Top End of the Capital Plan*
Strategic
Additional Debt Capacity Capital $1.4 $0.2 Regulated Acquisitions $0.6—$1.2 Strategic Capital $0.2
Regulated Acquisitions $1.2
Regulated System
Investments $5.9 Regulated System Investments $5.9
Current Plan $6.7—$7.3 Billion Capex Full Capacity $8.7 Billion Capex
*Estimated based on FFO to Debt using S&P criteria December 2016
NYSE: AWK www.amwater.com 47
II. 2015 Financial Plan: Regulated
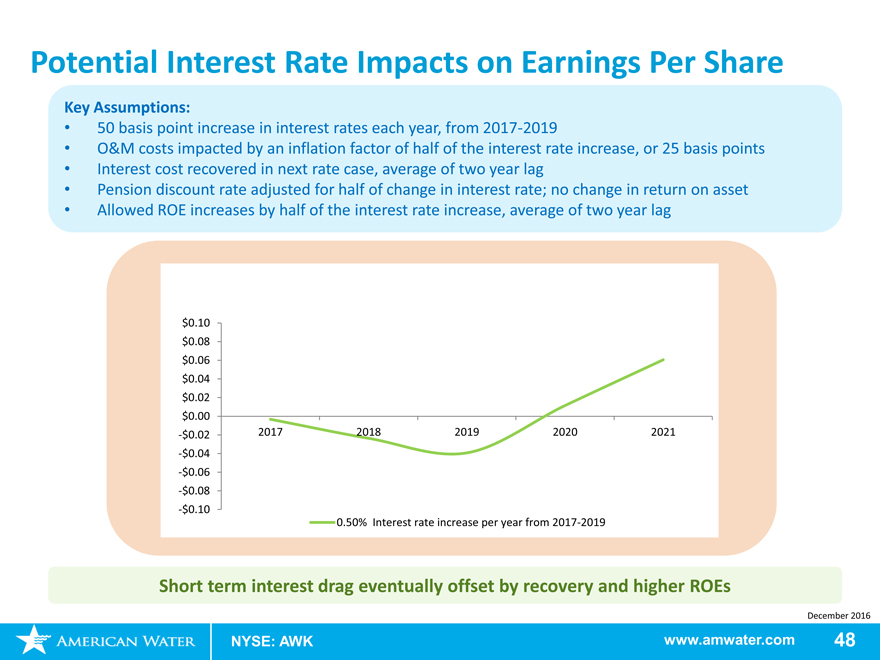
Potential Interest Rate Impacts on Earnings Per Share
Key Assumptions:
50 basis point increase in interest rates each year, from 2017-2019
O&M costs impacted by an inflation factor of half of the interest rate increase, or 25 basis points
Interest cost recovered in next rate case, average of two year lag
Pension discount rate adjusted for half of change in interest rate; no change in return on asset
Allowed ROE increases by half of the interest rate increase, average of two year lag
$ 0.10
$ 0.08
$ 0.06
$ 0.04
$ 0.02
$ 0.00
-$ 0.02 20172018201920202021
-$ 0.04
-$ 0.06
-$ 0.08
-$ 0.10
0.50% Interest rate increase per year from 2017-2019
Short term interest drag eventually offset by recovery and higher ROEs
December 2016
NYSE: AWK www.amwater.com 48
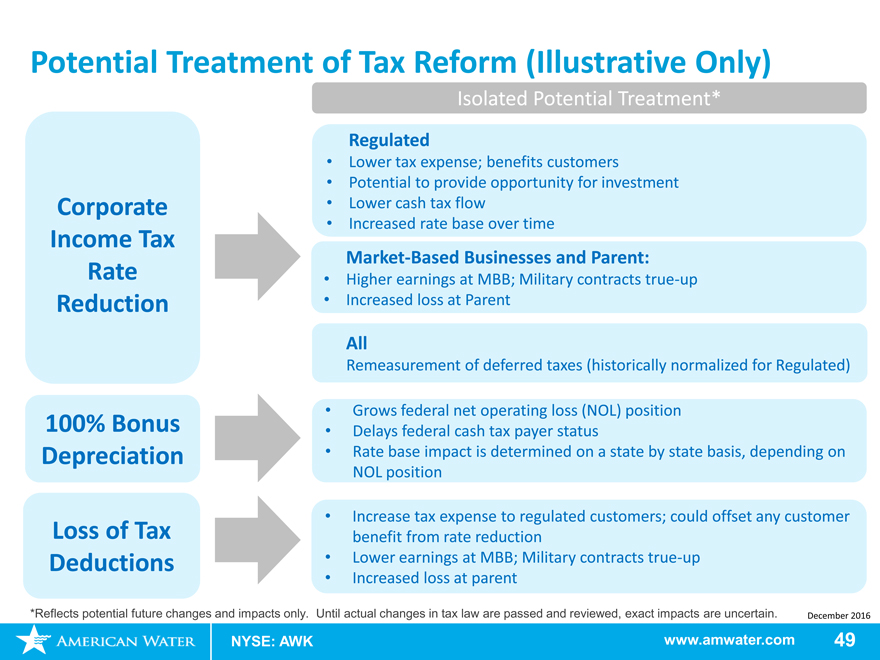
Potential Treatment of Tax Reform (Illustrative Only)
Corporate Income Tax Rate Reduction
100% Bonus Depreciation
Loss of Tax Deductions
*Reflects potential future changes and impacts only.
NYSE: AWK
Isolated Potential Treatment*
Regulated
Lower tax expense; benefits customers
Potential to provide opportunity for investment
Lower cash tax flow
Increased rate base over time
Market-Based Businesses and Parent:
Higher earnings at MBB; Military contractstrue-up
Increased loss at Parent
All
Remeasurement of deferred taxes (historically normalized for Regulated)
Grows federal net operating loss (NOL) position
Delays federal cash tax payer status
Rate base impact is determined on a state by state basis, depending on NOL position
Increase tax expense to regulated customers; could offset any customer benefit from rate reduction
Lower earnings at MBB; Military contractstrue-up
Increased loss at parent
Until actual changes in tax law are passed and reviewed, exact impacts are uncertain. December 2016
www.amwater.com 49
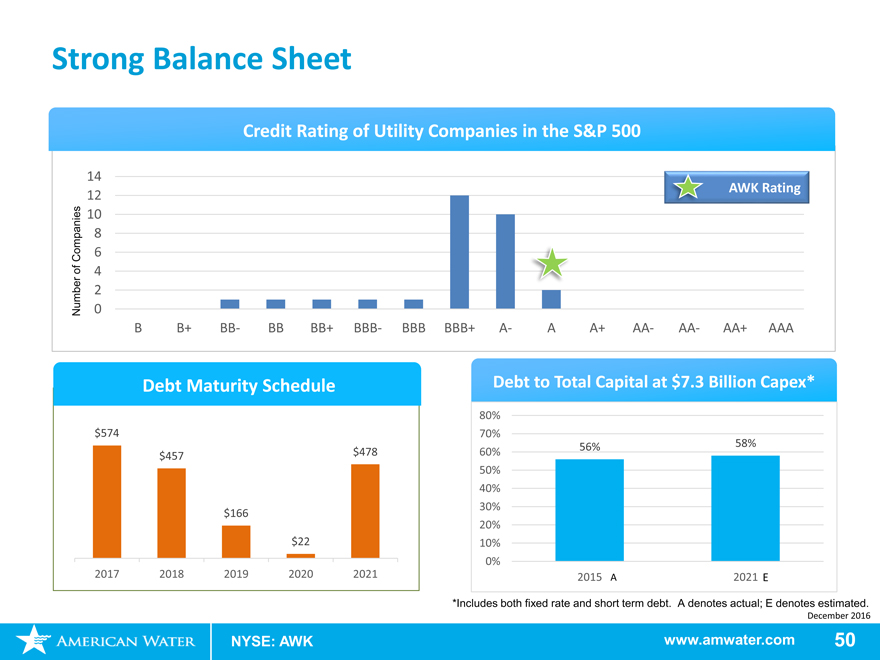
Strong Balance Sheet
Credit Rating of Utility Companies in the S&P 500
14 AWK Rating
12
10
8
Companies 6
of 4
2
Number 0
B B+BB- BB BB+BBB- BBB BBB+A- A A+AA-AA- AA+ AAA
Debt Maturity Schedule Debt to Total Capital at $7.3 Billion Capex*
80%
$574 70%
$478 60% 56% 58%
$457
50%
40%
30%
$166
20%
$22 10%
0%
2017 2018 2019 2020 2021 2015 A 2021 E
*Includes both fixed rate and short term debt. A denotes actual; E denotes estimated.
December 2016
NYSE: AWK www.amwater.com 50
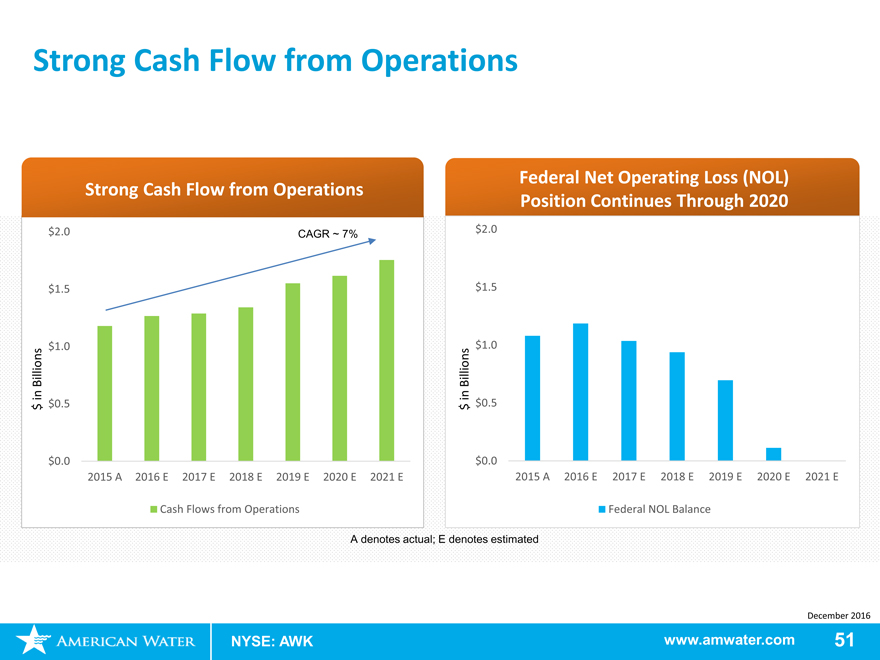
Strong Cash Flow from Operations
Strong Cash Flow from Operations
Federal Net Operating Loss (NOL) Strong Cash Flow from Operations Position Continues Through 2020
$2.0 CAGR ~ 7% $2.0
$1.5 $1.5
Billions $1.0 Billions $1.0 in in $ $0.5 $ $0.5
$0.0 $0.0
2015 A 2016 E 2017 E 2018 E 2019 E 2020 E 2021 E2015 A2016 E2017 E 2018 E 2019 E2020 E2021 E
Cash Flows from Operations Federal NOL Balance
A denotes actual; E denotes estimated
December 2016
NYSE: AWK www.amwater.com 51
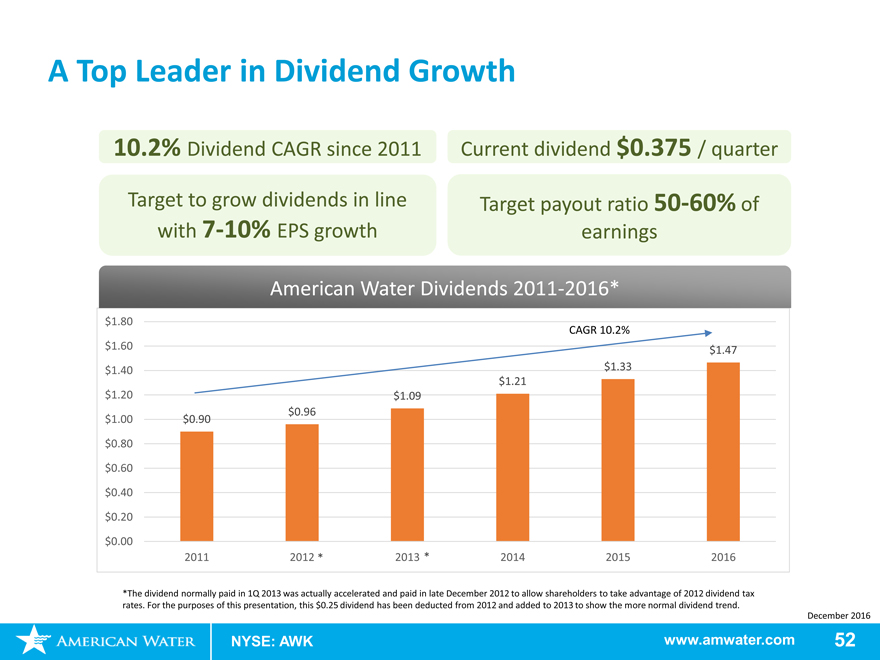
A Top Leader in Dividend Growth
10.2% Dividend CAGR since 2011
Target to grow dividends in line
with7-10% EPS growth
Current dividend $0.375 / quarter
Target payout ratio50-60% of
earnings
American Water Dividends 2011-2016*
$1.80 CAGR 10.2% $1.60 $1.47 $1.40 $1.33 $1.21 $1.20 $1.09 $0.96 $1.00 $0.90
$0.80 $0.60 $0.40 $0.20
$0.00
2011 2012 * 2013 * 2014 2015 2016
*The dividend normally paid in 1Q 2013 was actually accelerated and paid in late December 2012 to allow shareholders to take advantage of 2012 dividend tax rates. For the purposes of this presentation, this $0.25 dividend has been deducted from 2012 and added to 2013 to show the more normal dividend trend.
December 2016
NYSE: AWK www.amwater.com 52
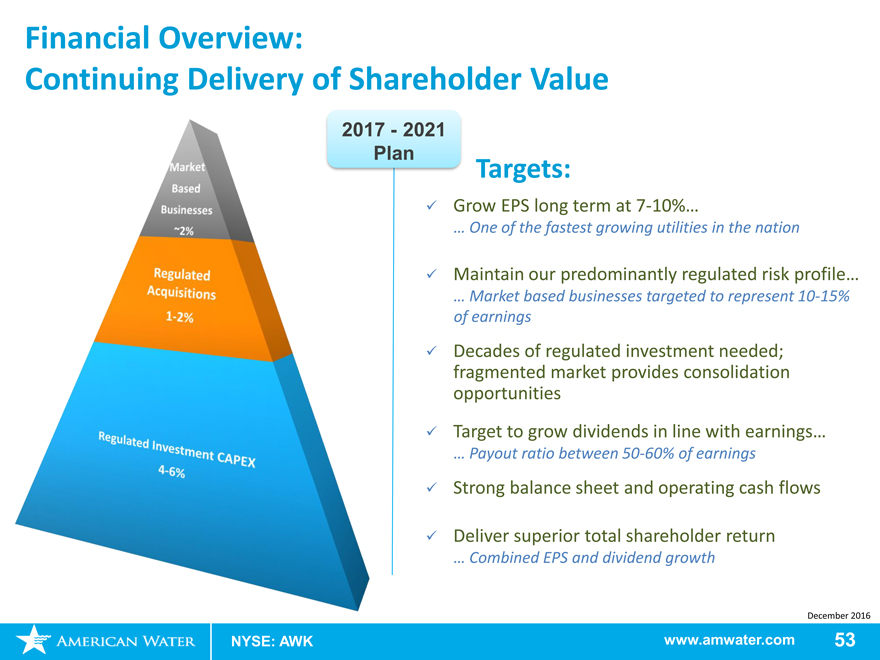
Financial Overview:
Continuing Delivery of Shareholder Value
- 2021
Plan
Targets:
Grow EPS long term at7-10%…
One of the fastest growing utilities in the nation
Maintain our predominantly regulated risk profile…
Market based businesses targeted to represent10-15%
of earnings
Decades of regulated investment needed; fragmented market provides consolidation opportunities
Target to grow dividends in line with earnings…
Payout ratio between50-60% of earnings
Strong balance sheet and operating cash flows
Deliver superior total shareholder return
Combined EPS and dividend growth
December 2016
NYSE: AWK www.amwater.com 53
Wrap Up
Susan Story President and Chief Executive Officer
December 2016
NYSE: AWK www.amwater.com 54
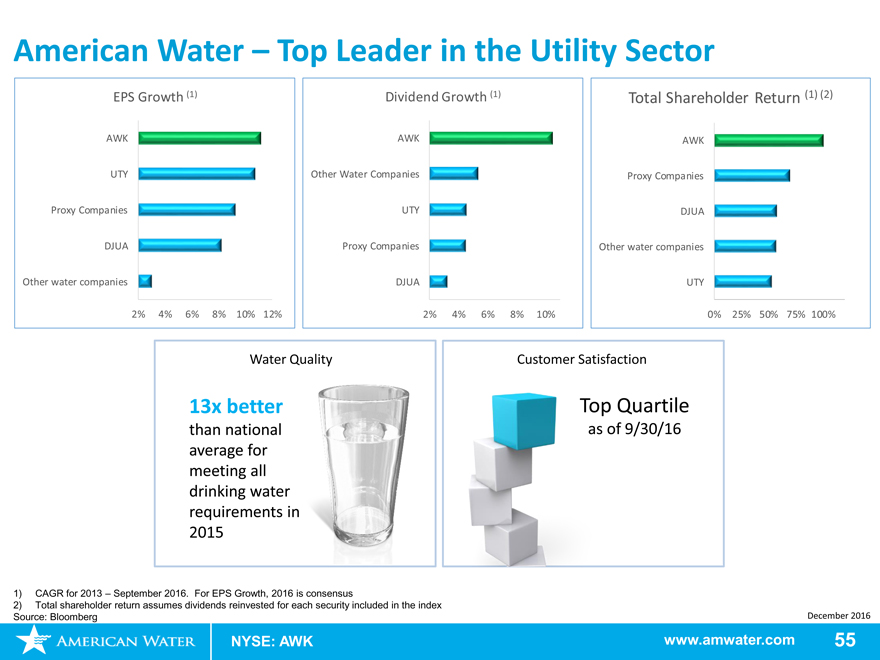
American Water – Top Leader in the Utility Sector
EPS Growth (1) Dividend Growth (1)Total ShareholderReturn (1) (2)
AWK AWKAWK
UTY Other Water CompaniesProxy Companies
Proxy Companies UTYDJUA
DJUA Proxy CompaniesOther water companies
Other water companies DJUAUTY
2% 4% 6% 8% 10%12%2% 4% 6%8%10%0% 25%50% 75% 100%
Water Quality Customer Satisfaction
13x better Quartile
than national of 9/30/16 average for meeting all drinking water requirements in 2015
1) CAGR for 2013 – Se owth, 2016 is consensus
2) Total shareholder re invested for each security included in the index
Source: Bloomberg
NYSE: AWK
December 2016
www.amwater.com 55
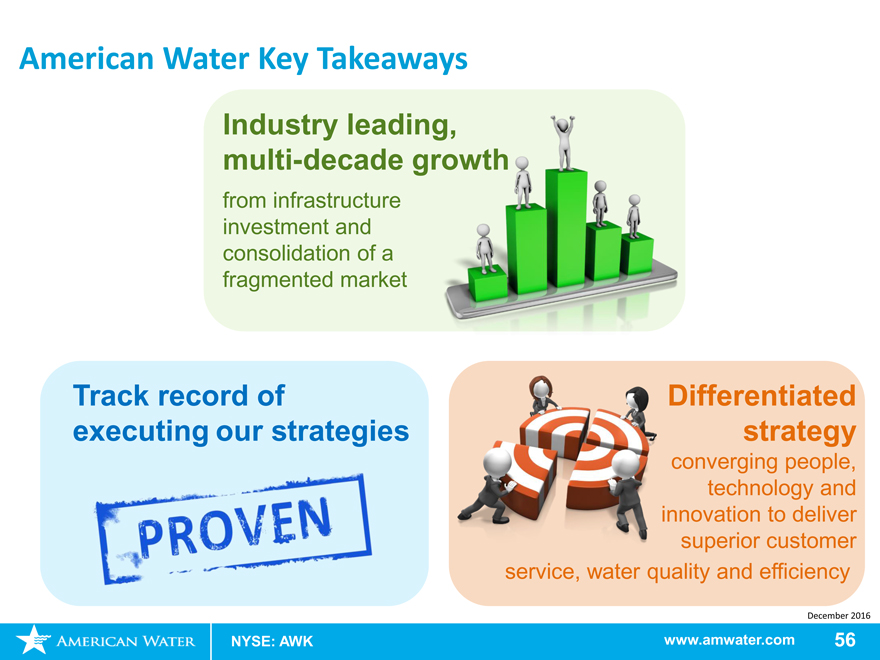
American Water Key Takeaways
Industry leading, multi-decade growth
from infrastructure investment and consolidation of a fragmented market
Track record of Differentiated
executing our strategies strategy
converging people,
technology and
novation to deliver
superior customer
service, waterquality and efficiency
December 2016
NYSE: AWK www.amwater.com56
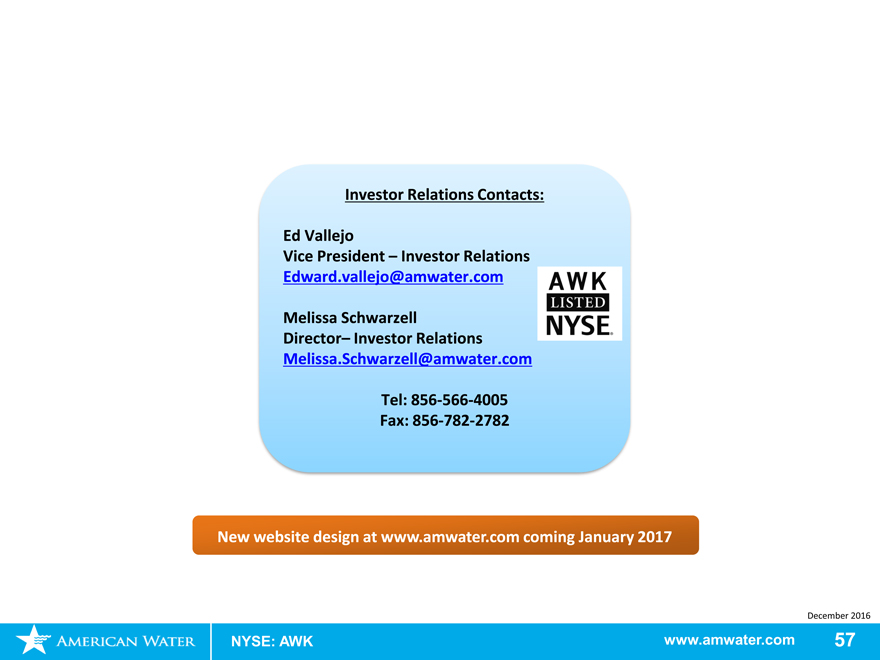
Investor Relations Contacts:
Ed Vallejo
Vice President – Investor Relations Edward.vallejo@amwater.com
Melissa Schwarzell
Director– Investor Relations Melissa.Schwarzell@amwater.com
Tel:856-566-4005 Fax:856-782-2782
New website design at www.amwater.com coming January 2017
December 2016
NYSE: AWK www.amwater.com 57
Appendix
Non-GAAP Financial Information
This presentation includes adjusted earnings per share (“Adjusted EPS”) both as 2016non-GAAP earnings guidance and as the 2014 EPS compound annual growth anchor, both of which constitute“non-GAAP financial measures” under SEC rules. Thesenon-GAAP financial measures are derived from American Water’s consolidated financial information but are not presented in its financial statements prepared in accordance with GAAP. Adjusted EPS as 2016non-GAAP earnings guidance is defined as 2016 GAAP EPS, excluding the impact in the third quarter of 2016 of the binding global agreement in principle related to the Freedom Industries chemical spill (the “Settlement”). Adjusted EPS as the 2014 EPS compound annual growth anchor is defined as 2014 GAAP EPS, excluding the impact of costs incurred in 2014 related to the Freedom Industries chemical spill. Adjusted EPS should not be considered an alternative to the GAAP measure.
Management believes that the presentation of Adjusted EPS as described above is useful to American Water’s investors because it provides an indication of American Water’s forecasted baseline performance excluding items that are not considered to be reflective of ongoing results. Management does not intend for Adjusted EPS to represent results as defined by GAAP, and the reader should not consider it as an indicator of
American Water’s forecasted performance. American Water’s definition of Adjusted EPS may not be comparable to the same or similar measures used by other companies, and, accordingly, it may have significant limitations on its use.
This presentation also includes regulated segment O&M efficiency ratios, both historical and forward-looking, which excludes from their calculation for each period presented one or more items, including estimated purchased water revenues and purchased water expenses, the impact of the Freedom Industries chemical spill, the impact of the Settlement, the estimated impact of weather, and the allocable portion ofnon-O&M support services costs, mainly depreciation and general taxes. These O&M efficiency ratios constitute“non-GAAP financial measures” under SEC rules. These ratios are derived from American Water’s consolidated financial information but are not presented in its financial statements prepared in accordance with GAAP. Thesenon-GAAP financial measures supplement and should be read in conjunction with American Water’s GAAP disclosures and should not be considered an alternative to GAAP measures.
Management believes that the presentation of O&M efficiency ratios is useful to investors because it provides a means of evaluating American
Water’s operating performance without giving effect to items that are not reflective of management’s ability to increase efficiency of American Water’s regulated operations. In preparing operating plans, budgets and forecasts, and in assessing historical and future performance, management relies, in part, on trends in American Water’s historical results and predictions of future results, exclusive of these items. American Water’s definition of these ratios may not be comparable to the same or similar measures used by other companies, and, accordingly, thesenon-GAAP financial measures may have significant limitations on their use. American Water is unable to present a reconciliation of adjustments to the components of its forward-looking O&M efficiency ratio without unreasonable effort because management cannot reliably predict the nature, amount or probable significance of all the adjustments for future periods; however, these adjustments may, individually or in the aggregate, cause thenon-GAAP financial measure component of the forward-looking ratio to differ significantly from its most directly comparable GAAP financial measure.
Set forth in this appendix are tables that reconcile Adjusted EPS as 2016non-GAAP earnings guidance and as the 2014 EPS compound annual growth anchor, each to GAAP EPS, and each of the components of its historical O&M efficiency ratios to its most directly comparable GAAP financial measure.
December 2016
NYSE: AWK www.amwater.com 59
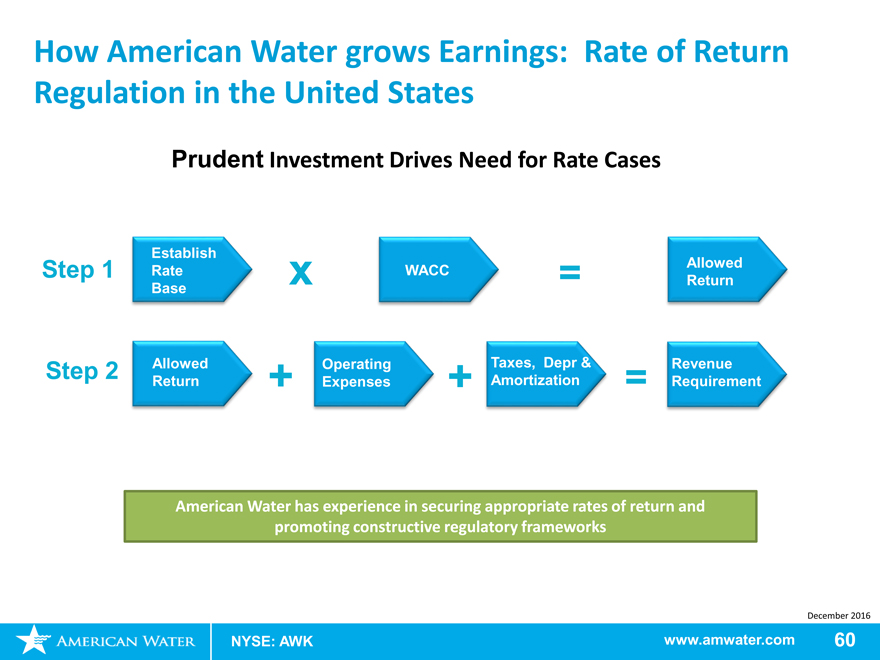
How American Water grows Earnings: Rate of Return Regulation in the United States
Prudent Investment Drives Need for Rate Cases
Establish
Allowed
Step 1 RatexWACC=Return
Base
AllowedOperatingTaxes, Depr &Revenue
Step 2 Return+Expenses+Amortization=Requirement
American Water has experience in securing appropriate rates of return and
promoting constructive regulatory frameworks
December 2016
NYSE: AWK www.amwater.com 60
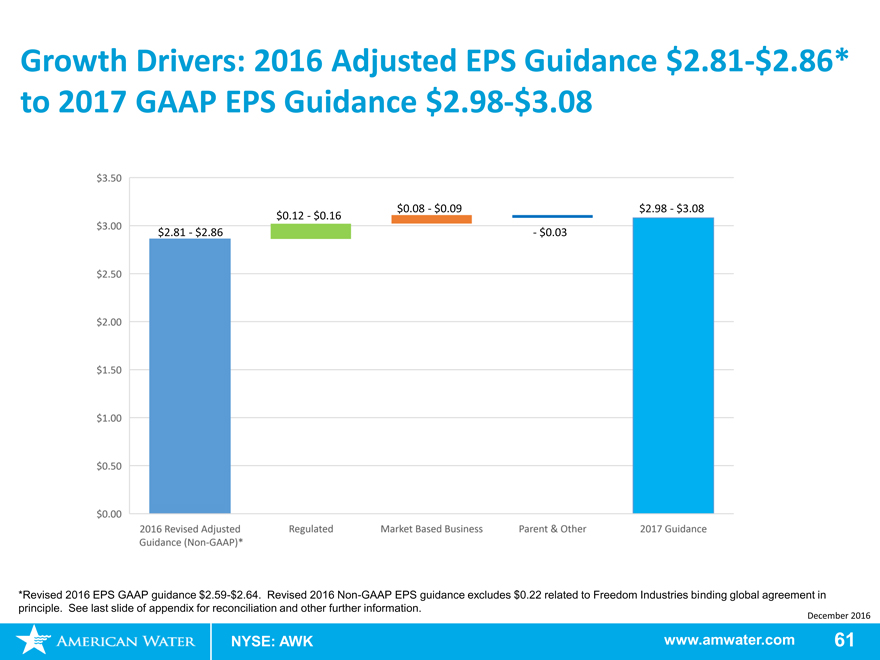
Growth Drivers: 2016 Adjusted EPS Guidance$2.81-$2.86* to 2017 GAAP EPS Guidance$2.98-$3.08
$0.08—$0.09 $2.98—$3.08 $0.12—$0.16 $2.81—$2.86—$0.03
*Revised 2016 EPS GAAP guidance$2.59-$2.64. Revised 2016Non-GAAP EPS guidance excludes $0.22 related to Freedom Industries binding global agreement in principle. See last slide of appendix for reconciliation and other further information. December 2016
NYSE: AWK
www.amwater.com 61
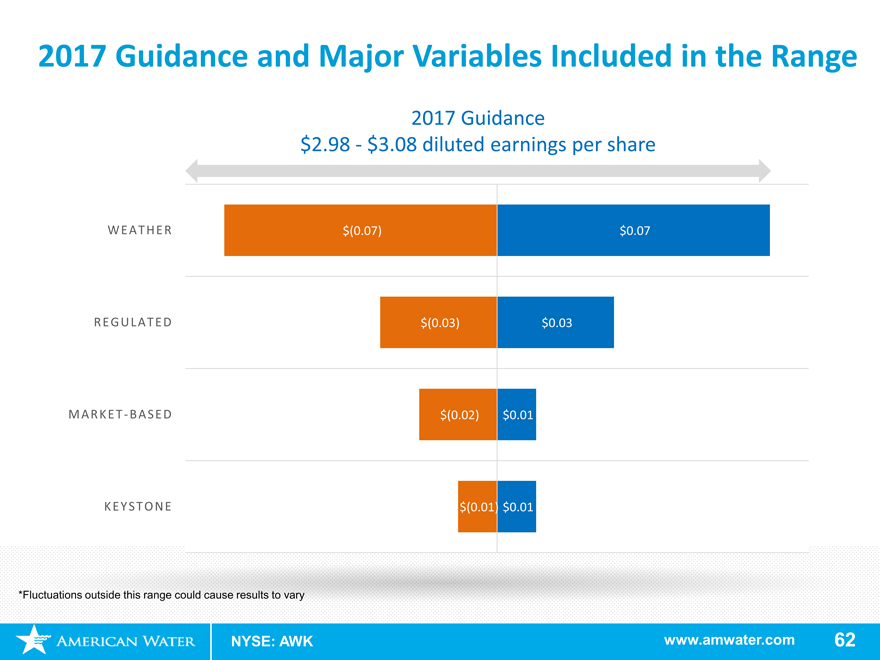
2017 Guidance and Major Variables Included in the Range
2017 Guidance
$2.98—$3.08 diluted earnings per share
WEATHER $(0.07) $0.07 REGULATED $(0.03) $0.03 MARKET-BASED $(0.02) $0.01 KEYSTONE $(0.01) $0.01
*Fluctuations outside this range could cause results to vary
NYSE: AWK www.amwater.com 62
Decades of Investment Needed in U.S. Water and
Wastewater Infrastructure
Rate Base Growth~5-6% through 2021
Based on Capital Plan of $6.7—$7.3 Billion
CAGR ~5-6%
$10.5
$10.0 $9.4
Billions $ In
2014 A 2015 A 2016 Q3 A 2017 E 2018 E 2019 E 202 E 2021 E
Rate Base
A denotes actual; E denotes estimated
December 2016
NYSE: AWK www.amwater.com 63
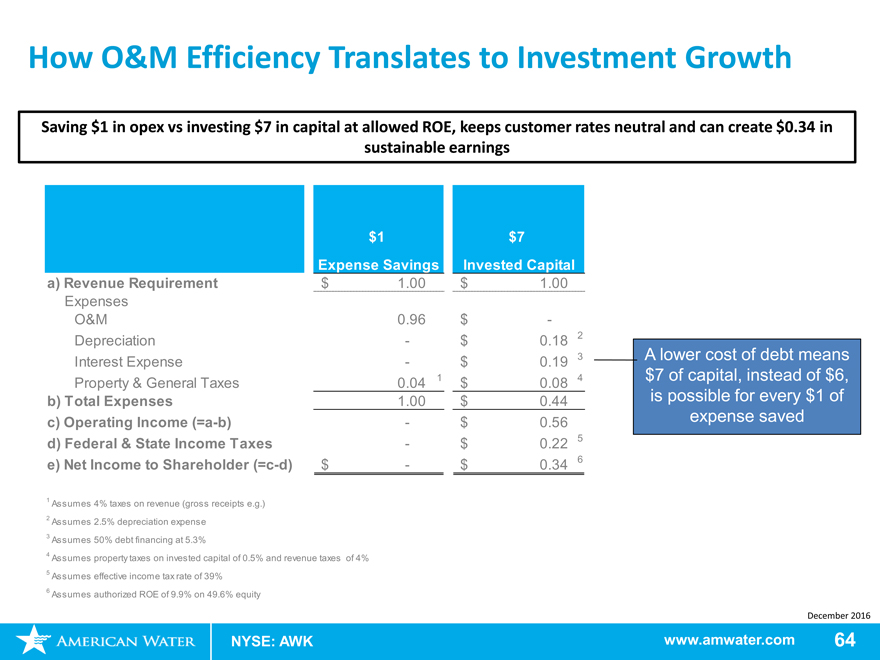
How O&M Efficiency Translates to Investment Growth
Saving $1 in opex vs investing $7 in capital at allowed ROE, keeps customer rates neutral and can create $0.34 in sustainable earnings
$1$7
Expense Savings Invested Capital
a) Revenue Requirement $1.00$1.00
Expenses
O&M 0.96$-
Depreciation -$0.182
Interest Expense -$0.193 A lower cost of debt means
14 $7 of capital, instead of $6,
Property & General Taxes 0.04$0.08
b) Total Expenses 1.00$0.44is possible for every $1 of
c) Operating Income(=a-b) -$0.56expense saved
d) Federal & State Income Taxes -$0.225
e) Net Income to Shareholder(=c-d) $-$0.346
1 Assumes 4% taxes on revenue (gross receipts e.g.)
2 Assumes 2.5% depreciation expense
3 Assumes 50% debt financing at 5.3%
4 Assumes property taxes on invested capital of 0.5% and revenue taxes of 4%
5 Assumes effective income tax rate of 39%
6 Assumes authorized ROE of 9.9% on 49.6% equity
December 2016
NYSE: AWK www.amwater.com64
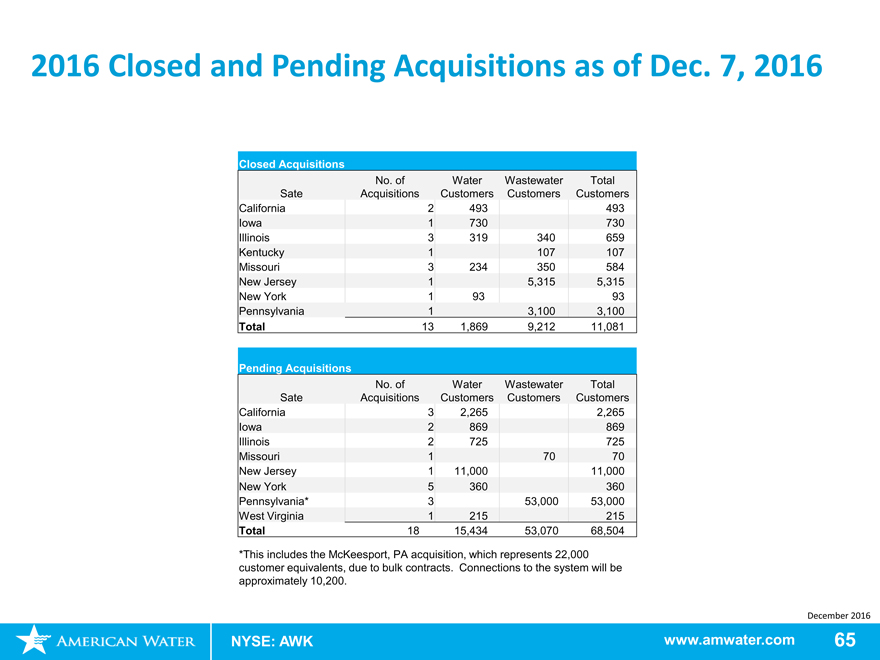
2016 Closed and Pending Acquisitions as of Dec. 7, 2016
Closed Acquisitions
No. of WaterWastewaterTotal
Sate Acquisitions CustomersCustomersCustomers
California 2493493
Iowa 1730730
Illinois 3319340659
Kentucky 1107107
Missouri 3234350584
New Jersey 15,3155,315
New York 19393
Pennsylvania 13,1003,100
Total 131,8699,21211,081
Pending Acquisitions
No. of WaterWastewaterTotal
Sate Acquisitions CustomersCustomersCustomers
California 32,2652,265
Iowa 2869869
Illinois 2725725
Missouri 17070
New Jersey 111,00011,000
New York 5360360
Pennsylvania* 353,00053,000
West Virginia 1215215
Total 18 15,43453,07068,504
*This includes the McKeesport, PA acquisition, which represents 22,000
customer equivalents, due to bulk contracts. Connections to the system will be
approximately 10,200.
December 2016
NYSE: AWK www.amwater.com 65
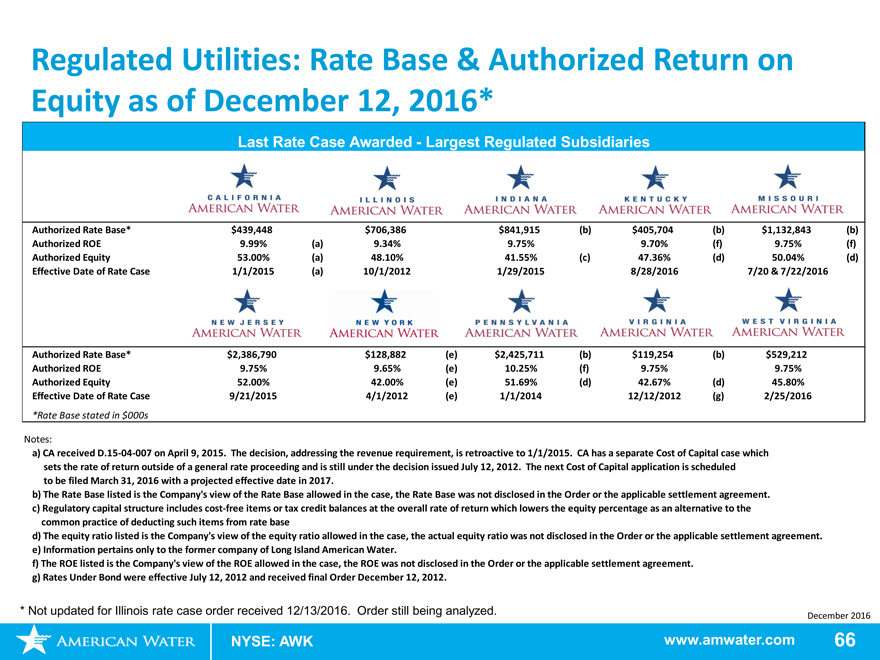
Regulated Utilities: Rate Base & Authorized return on
Equity as of December 12, 2016*
Last Rate Case Awarded—Largest Regulated Subsidiaries
Authorized Rate Base* $439,448 4
Authorized ROE 9.99%
Authorized Equity 53.00% %
Effective Date of Rate Case 1/1/2015 (a)10/1/20121/29/20158/28/20167/20 & 7/22/2016
Authorized Rate Base* $2,386,790 $128,882(e)$2,425,711(b)$119,254(b)$529,212
Authorized ROE 9.75% 9.65%(e)10.25%(f)9.75%9.75%
Authorized Equity 52.00% 42.00%(e)51.69%(d)42.67%(d)45.80%
Effective Date of Rate Case 9/21/2015 4/1/2012(e)1/1/201412/12/2012(g)2/25/2016
*Rate Base stated in $000s
Notes:
CA receivedD.15-04-007 on April 9, 2015. The decision, addressing the revenue requirement, is retroactive to 1/1/2015. CA has a separate Cost of Capital case which sets the rate of return outside of a general rate proceeding and is still under the decision issued July 12, 2012. The next Cost of Capital application is scheduled to be filed March 31, 2016 with a projected effective date in 2017.
The Rate Base listed is the Company’s view of the Rate Base allowed in the case, the Rate Base was not disclosed in the Order or the applicable settlement agreement.
Regulatory capital structure includes cost-free items or tax credit balances at the overall rate of return which lowers the equity percentage as an alternative to the common practice of deducting such items from rate base
The equity ratio listed is the Company’s view of the equity ratio allowed in the case, the actual equity ratio was not disclosed in the Order or the applicable settlement agreement.
Information pertains only to the former company of Long Island American Water.
The ROE listed is the Company’s view of the ROE allowed in the case, the ROE was not disclosed in the Order or the applicable settlement agreement.
Rates Under Bond were effective July 12, 2012 and received final Order December 12, 2012.
* Not updated for Illinois rate case order received 12/13/2016. Order still being analyzed.
December 2016
NYSE: AWK www.amwater.com 66
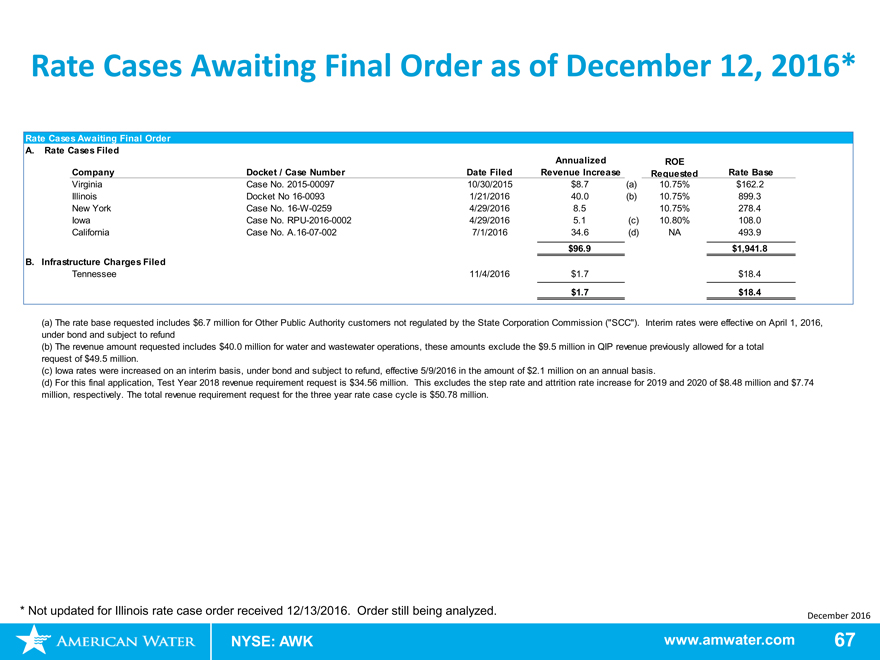
Rate Cases Awaiting Final Order as of December 12, 2016*
Rate Cases Awaiting Final Order
A. Rate Cases Filed
AnnualizedROE
Company Docket / Case NumberDate FiledRevenue IncreaseRequestedRate Base
Virginia Case No.2015-0009710/30/2015$8.7(a)10.75%$162.2
Illinois Docket No16-00931/21/201640.0(b)10.75%899.3
New York CaseNo.16-W-02594/29/20168.510.75%278.4
Iowa CaseNo.RPU-2016-00024/29/20165.1(c)10.80%108.0
California Case No.A.16-07-0027/1/201634.6(d)NA493.9
$96.9$1,941.8
B. Infrastructure Charges Filed
Tennessee 11/4/2016$1.7$18.4
$1.7$18.4
(a) The rate base requested includes $6.7 million for Other Public Authority customers not regulated by the State Corporation Commission (“SCC”). Interim rates were effective on April 1, 2016, under bond and subject to refund (b) The revenue amount requested includes $40.0 million for water and wastewater operations, these amounts exclude the $9.5 million in QIP revenue previously allowed for a total request of $49.5 million.
Iowa rates were increased on an interim basis, under bond and subject to refund, effective 5/9/2016 in the amount of $2.1 million on an annual basis.
For this final application, Test Year 2018 revenue requirement request is $34.56 million. This excludes the step rate and attrition rate increase for 2019 and 2020 of $8.48 million and $7.74
million, respectively. The total revenue requirement request for the three year rate case cycle is $50.78 million.
* Not updated for Illinois rate case order received 12/13/2016. Order still being analyzed.
December 2016
NYSE: AWK www.amwater.com 67
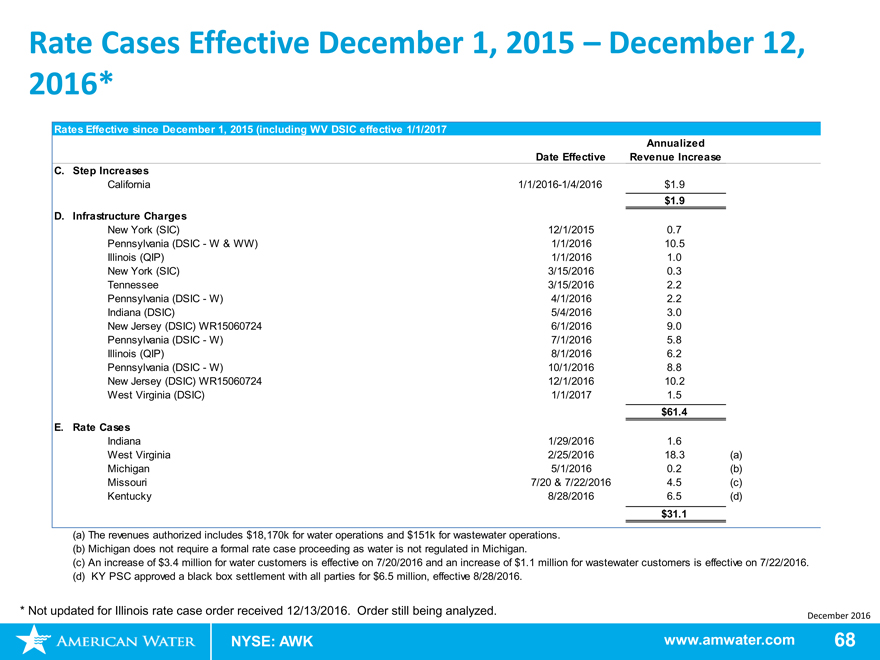
Rate Cases Effective December 1, 2015 – December 12,
2016*
Rates Effective since December 1, 2015 (including WV DSIC effective 1/1/2017
Annualized
Date EffectiveRevenue Increase
C. Step Increases
California 1/1/2016-1/4/2016$1.9
$1.9
D. Infrastructure Charges
New York (SIC) 12/1/20150.7
Pennsylvania (DSIC—W & WW) 1/1/201610.5
Illinois (QIP) 1/1/20161.0
New York (SIC) 3/15/20160.3
Tennessee 3/15/20162.2
Pennsylvania (DSIC—W) 4/1/20162.2
Indiana (DSIC) 5/4/20163.0
New Jersey (DSIC) WR15060724 6/1/20169.0
Pennsylvania (DSIC—W) 7/1/20165.8
Illinois (QIP) 8/1/20166.2
Pennsylvania (DSIC—W) 10/1/20168.8
New Jersey (DSIC) WR15060724 12/1/201610.2
West Virginia (DSIC) 1/1/20171.5
$61.4
E. Rate Cases
Indiana 1/29/20161.6
West Virginia 2/25/201618.3(a)
Michigan 5/1/20160.2(b)
Missouri 7/20 & 7/22/20164.5(c)
Kentucky 8/28/20166.5(d)
$31.1
The revenues authorized includes $18,170k for water operations and $151k for wastewater operations.
Michigan does not require a formal rate case proceeding as water is not regulated in Michigan.
An increase of $3.4 million for water customers is effective on 7/20/2016 and an increase of $1.1 million for wastewater customers is effective on 7/22/2016.
KY PSC approved a black box settlement with all parties for $6.5 million, effective 8/28/2016.
* Not updated for Illinois rate case order received 12/13/2016. Order still being analyzed.
December 2016
NYSE: AWK www.amwater.com 68
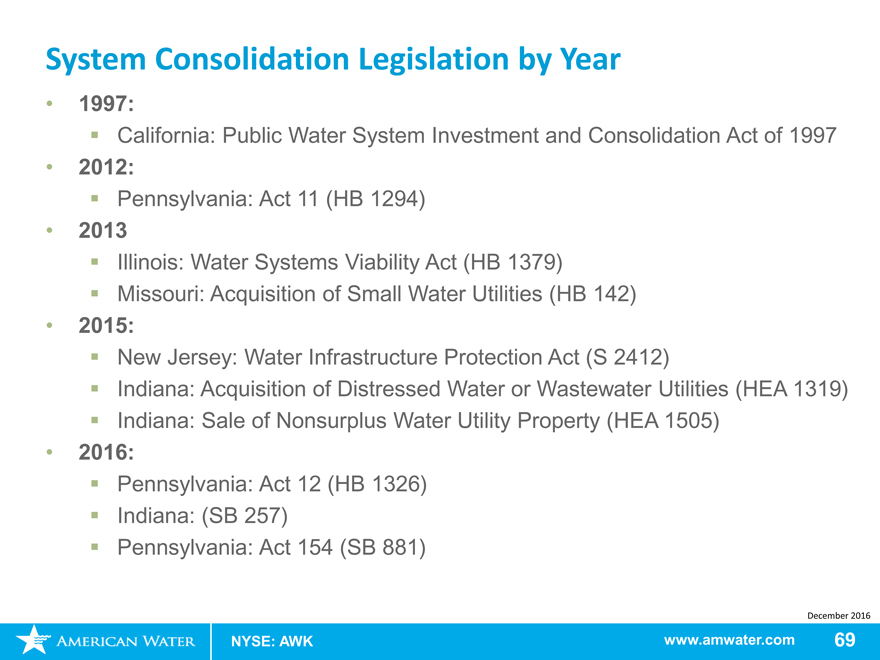
System Consolidation Legislation by Year
1997:
California: Public Water System Investment and Consolidation Act of 1997
2012:
Pennsylvania: Act 11 (HB 1294)
2013
Illinois: Water Systems Viability Act (HB 1379)
Missouri: Acquisition of Small Water Utilities (HB 142)
2015:
New Jersey: Water Infrastructure Protection Act (S 2412)
Indiana: Acquisition of Distressed Water or Wastewater Utilities (HEA 1319)
Indiana: Sale of Nonsurplus Water Utility Property (HEA 1505)
2016:
Pennsylvania: Act 12 (HB 1326)
Indiana: (SB 257)
Pennsylvania: Act 154 (SB 881)
December 2016
NYSE: AWK www.amwater.com 69
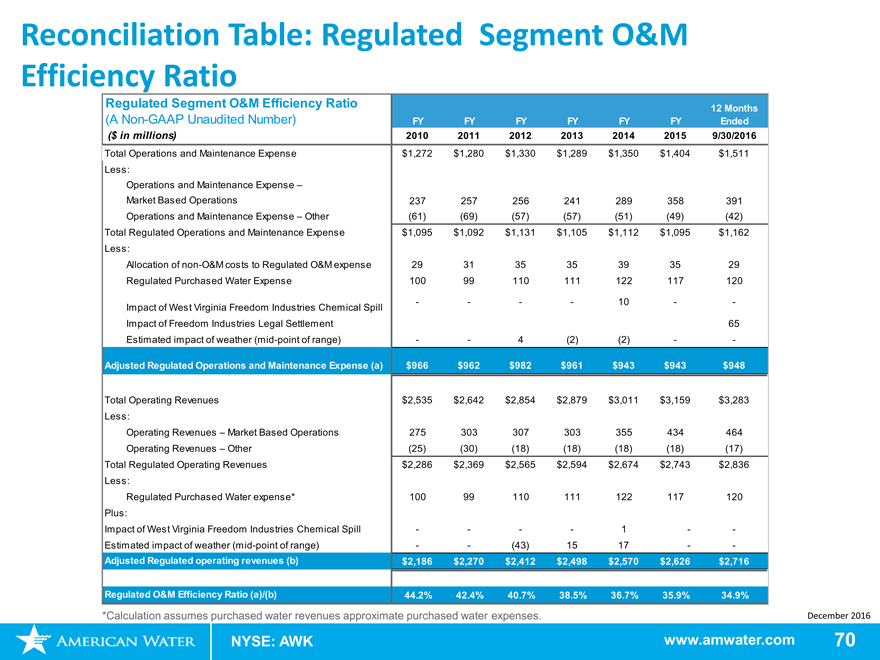
Reconciliation Table: Regulated Segment O&M
Efficiency Ratio
Regulated Segment O&M Efficiency Ratio 12 Months
(ANon-GAAP Unaudited Number) FY FYFYFYFYFYEnded
($ in millions) 2010 201120122013201420159/30/2016
Total Operations and Maintenance Expense $1,272 $1,280$1,330$1,289$1,350$1,404$1,511
Less:
Operations and Maintenance Expense –
Market Based Operations 237 257256241289358391
Operations and Maintenance Expense – Other (61) (69)(57)(57)(51)(49)(42)
Total Regulated Operations and Maintenance Expense $1,095 $1,092$1,131$1,105$1,112$1,095$1,162
Less:
Allocation ofnon-O&M costs to Regulated O&M expense 29 313535393529
Regulated Purchased Water Expense 100 99110111122117120
Impact of West Virginia Freedom Industries Chemical Spill - ---10--
Impact of Freedom Industries Legal Settlement 65
Estimated impact of weather(mid-point of range) - -4(2)(2)--
Adjusted Regulated Operations and Maintenance Expense (a) $966 $962$982$961$943$943$948
Total Operating Revenues $2,535 $2,642$2,854$2,879$3,011$3,159$3,283
Less:
Operating Revenues – Market Based Operations 275 303307303355434464
Operating Revenues – Other (25) (30)(18)(18)(18)(18)(17)
Total Regulated Operating Revenues $2,286 $2,369$2,565$2,594$2,674$2,743$2,836
Less:
Regulated Purchased Water expense* 100 99110111122117120
Plus:
Impact of West Virginia Freedom Industries Chemical Spill - ---1--
Estimated impact of weather(mid-point of range) - -(43)1517--
Adjusted Regulated operating revenues (b) $2,186 $2,270$2,412$2,498$2,570$2,626$2,716
Regulated O&M Efficiency Ratio (a)/(b) 44.2% 42.4%40.7%38.5%36.7%35.9%34.9%
*Calculation assumes purchased water revenues approximate purchased water expenses. December 2016
NYSE: AWK www.amwater.com70
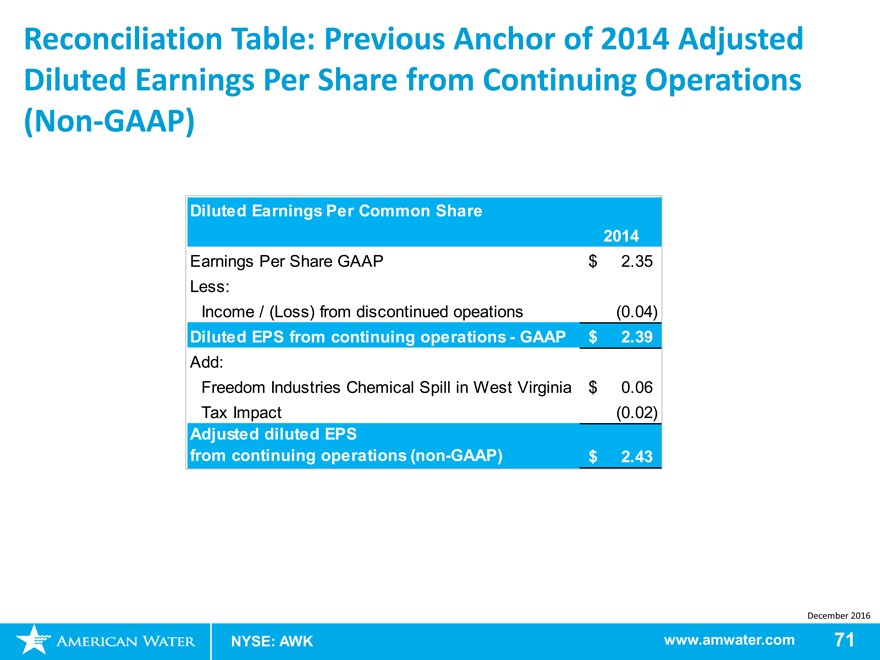
Reconciliation Table: Previous Anchor of 2014 Adjusted Diluted Earnings Per Share from Continuing Operations
(Non-GAAP)
Diluted Earnings Per Common Share
2014
Earnings Per Share GAAP $2.35
Less:
Income / (Loss) from discontinued operations (0.04)
Diluted EPS from continuing operations—GAAP $2.39
Add:
Freedom Industries Chemical Spill in West Virginia $0.06
Tax Impact (0.02)
Adjusted diluted EPS
from continuing operations(non-GAAP) $2.43
December 2016
NYSE: AWK www.amwater.com 71
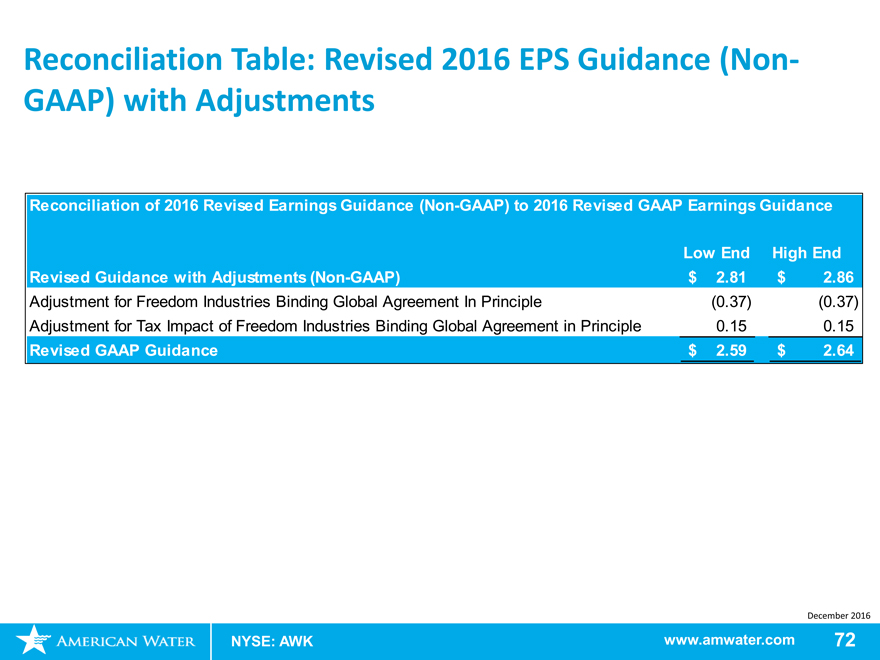
Reconciliation Table: Revised 2016 EPS Guidance (Non-
GAAP) with Adjustments
Reconciliation of 2016 Revised Earnings Guidance(Non-GAAP) to 2016 Revised GAAP Earnings Guidance
Low End High End
Revised Guidance with Adjustments(Non-GAAP) $2.81$2.86
Adjustment for Freedom Industries Binding Global Agreement In Principle (0.37)(0.37)
Adjustment for Tax Impact of Freedom Industries Binding Global Agreement in Principle 0.150.15
Revised GAAP Guidance $2.59$2.64
December 2016
NYSE: AWK www.amwater.com 72