
Exhibit 99.2 2018 Fourth Quarter and Year-End Earnings Conference Call ® We keep life flowingExhibit 99.2 2018 Fourth Quarter and Year-End Earnings Conference Call ® We keep life flowing
Forward-Looking Statements Ed Vallejo Vice President, Investor Relations ® We keep life flowing 2Forward-Looking Statements Ed Vallejo Vice President, Investor Relations ® We keep life flowing 2
Forward-Looking Statements Safe Harbor This presentation includes forward-looking statements within the meaning of the safe harbor provisions of the Private Securities Litigation Reform Act of 1995 and the Federal securities laws. They are not guarantees or assurances of any outcomes, financial results of levels of activity, performance or achievements, and readers are cautioned not to place undue reliance upon them. The forward-looking statements are subject to a number of estimates and assumptions, and known and unknown risks, uncertainties and other factors. Actual results may differ materially from those discussed in the forward-looking statements included in this presentation. The factors that could cause actual results to differ are discussed in the Appendix to this presentation, in our Annual Report on Form 10-K for the year ended December 31, 2018, as filed with the SEC on February 19, 2019. Non-GAAP Financial Information This presentation includes non-GAAP financial measures. Further information regarding these non-GAAP financial measures, including a reconciliation of each of these measures to the most directly comparable GAAP measure, is included in the Appendix to this presentation. 3Forward-Looking Statements Safe Harbor This presentation includes forward-looking statements within the meaning of the safe harbor provisions of the Private Securities Litigation Reform Act of 1995 and the Federal securities laws. They are not guarantees or assurances of any outcomes, financial results of levels of activity, performance or achievements, and readers are cautioned not to place undue reliance upon them. The forward-looking statements are subject to a number of estimates and assumptions, and known and unknown risks, uncertainties and other factors. Actual results may differ materially from those discussed in the forward-looking statements included in this presentation. The factors that could cause actual results to differ are discussed in the Appendix to this presentation, in our Annual Report on Form 10-K for the year ended December 31, 2018, as filed with the SEC on February 19, 2019. Non-GAAP Financial Information This presentation includes non-GAAP financial measures. Further information regarding these non-GAAP financial measures, including a reconciliation of each of these measures to the most directly comparable GAAP measure, is included in the Appendix to this presentation. 3
Strategy Overview Susan Story President and Chief Executive Officer ® We keep life flowing 4Strategy Overview Susan Story President and Chief Executive Officer ® We keep life flowing 4

Strong Full Year Adjusted Results Affirming 2019 and Long Term Guidance 2019 – 2023 Long Term EPS CAGR Guidance** Adjusted Earnings Per Share* $3.30 8.9% 2019 EPS 7-10%** Guidance $3.03 CAGR Top Half $0.69 2018 Adjusted Of Range EPS (GAAP EPS $0.69 $3.15)* 2017 Adjusted EPS (GAAP EPS $2.38)* $3.54 - $3.64 $2.61 $2.34 $3.30 $3.03 2017 2018 2019 2023 2017 2018 * Adjusted EPS is a non-GAAP Measure. Please see appendix for reconciliation and further information. ** Long Term EPS reflects 2019 – 2023 EPS CAGR goal in the top half of 7-10%, anchored off of 2017 Nine Months Ended Sep. 30 Q4 Adjusted EPS (a non-GAAP measure). 5Strong Full Year Adjusted Results Affirming 2019 and Long Term Guidance 2019 – 2023 Long Term EPS CAGR Guidance** Adjusted Earnings Per Share* $3.30 8.9% 2019 EPS 7-10%** Guidance $3.03 CAGR Top Half $0.69 2018 Adjusted Of Range EPS (GAAP EPS $0.69 $3.15)* 2017 Adjusted EPS (GAAP EPS $2.38)* $3.54 - $3.64 $2.61 $2.34 $3.30 $3.03 2017 2018 2019 2023 2017 2018 * Adjusted EPS is a non-GAAP Measure. Please see appendix for reconciliation and further information. ** Long Term EPS reflects 2019 – 2023 EPS CAGR goal in the top half of 7-10%, anchored off of 2017 Nine Months Ended Sep. 30 Q4 Adjusted EPS (a non-GAAP measure). 5
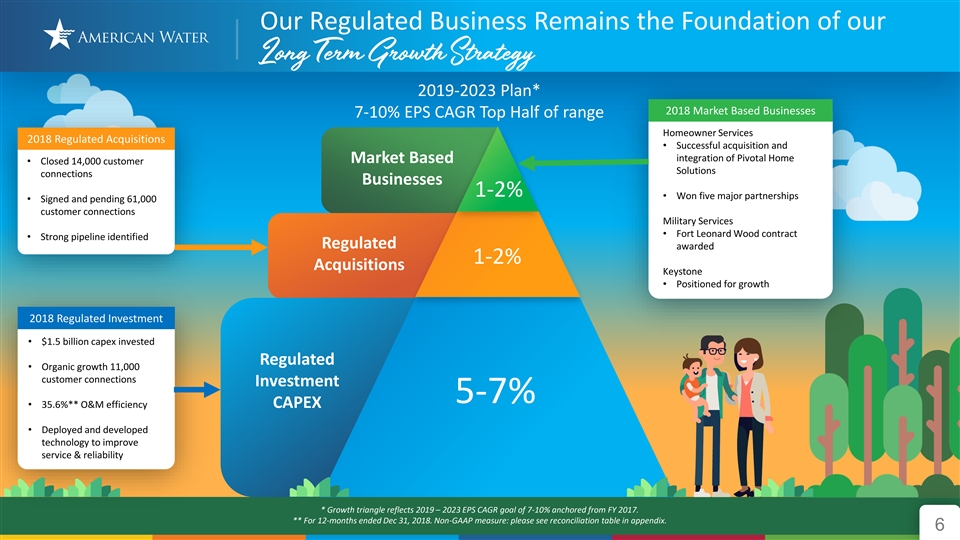
Our Regulated Business Remains the Foundation of our Long Term Growth Strategy 2019-2023 Plan* 2018 Market Based Businesses 7-10% EPS CAGR Top Half of range Homeowner Services 2018 Regulated Acquisitions • Successful acquisition and integration of Pivotal Home Market Based • Closed 14,000 customer Solutions connections Businesses 1-2% • Won five major partnerships • Signed and pending 61,000 customer connections Military Services • Fort Leonard Wood contract • Strong pipeline identified Regulated awarded 1-2% Acquisitions Keystone • Positioned for growth 2018 Regulated Investment • $1.5 billion capex invested Regulated • Organic growth 11,000 customer connections Investment 5-7% • 35.6%** O&M efficiency CAPEX • Deployed and developed technology to improve service & reliability * Growth triangle reflects 2019 – 2023 EPS CAGR goal of 7-10% anchored from FY 2017. ** For 12-months ended Dec 31, 2018. Non-GAAP measure: please see reconciliation table in appendix. 6Our Regulated Business Remains the Foundation of our Long Term Growth Strategy 2019-2023 Plan* 2018 Market Based Businesses 7-10% EPS CAGR Top Half of range Homeowner Services 2018 Regulated Acquisitions • Successful acquisition and integration of Pivotal Home Market Based • Closed 14,000 customer Solutions connections Businesses 1-2% • Won five major partnerships • Signed and pending 61,000 customer connections Military Services • Fort Leonard Wood contract • Strong pipeline identified Regulated awarded 1-2% Acquisitions Keystone • Positioned for growth 2018 Regulated Investment • $1.5 billion capex invested Regulated • Organic growth 11,000 customer connections Investment 5-7% • 35.6%** O&M efficiency CAPEX • Deployed and developed technology to improve service & reliability * Growth triangle reflects 2019 – 2023 EPS CAGR goal of 7-10% anchored from FY 2017. ** For 12-months ended Dec 31, 2018. Non-GAAP measure: please see reconciliation table in appendix. 6
The Regulated Businesses Walter Lynch Chief Operating Officer ® We keep life flowing 7The Regulated Businesses Walter Lynch Chief Operating Officer ® We keep life flowing 7
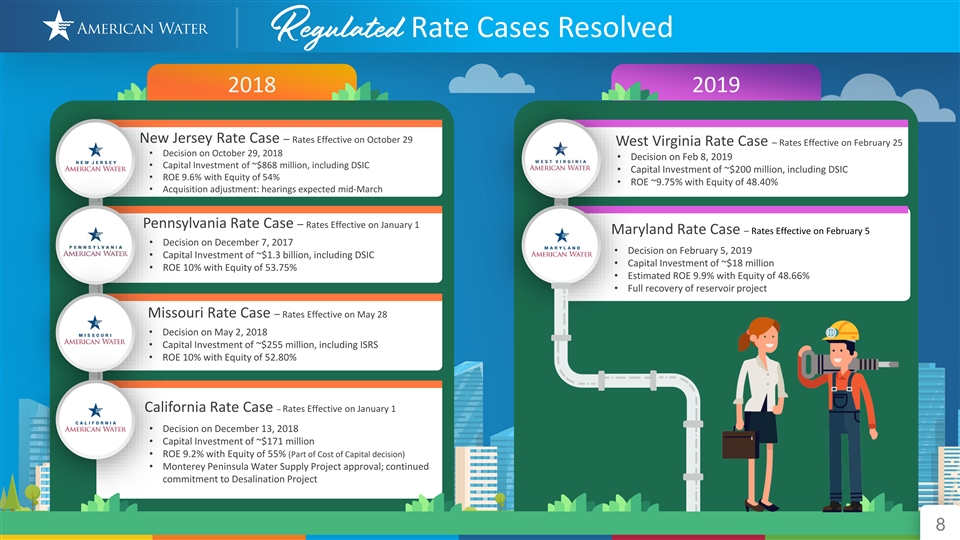
Regulated Rate Cases Resolved 2018 2019 New Jersey Rate Case – Rates Effective on October 29 West Virginia Rate Case – Rates Effective on February 25 • Decision on October 29, 2018 • Decision on Feb 8, 2019 • Capital Investment of ~$868 million, including DSIC • Capital Investment of ~$200 million, including DSIC • ROE 9.6% with Equity of 54% • ROE ~9.75% with Equity of 48.40% • Acquisition adjustment: hearings expected mid-March Pennsylvania Rate Case – Rates Effective on January 1 Maryland Rate Case – Rates Effective on February 5 • Decision on December 7, 2017 • Decision on February 5, 2019 • Capital Investment of ~$1.3 billion, including DSIC • Capital Investment of ~$18 million • ROE 10% with Equity of 53.75% • Estimated ROE 9.9% with Equity of 48.66% • Full recovery of reservoir project Missouri Rate Case – Rates Effective on May 28 • Decision on May 2, 2018 • Capital Investment of ~$255 million, including ISRS • ROE 10% with Equity of 52.80% California Rate Case – Rates Effective on January 1 • Decision on December 13, 2018 • Capital Investment of ~$171 million • ROE 9.2% with Equity of 55% (Part of Cost of Capital decision) • Monterey Peninsula Water Supply Project approval; continued commitment to Desalination Project 8Regulated Rate Cases Resolved 2018 2019 New Jersey Rate Case – Rates Effective on October 29 West Virginia Rate Case – Rates Effective on February 25 • Decision on October 29, 2018 • Decision on Feb 8, 2019 • Capital Investment of ~$868 million, including DSIC • Capital Investment of ~$200 million, including DSIC • ROE 9.6% with Equity of 54% • ROE ~9.75% with Equity of 48.40% • Acquisition adjustment: hearings expected mid-March Pennsylvania Rate Case – Rates Effective on January 1 Maryland Rate Case – Rates Effective on February 5 • Decision on December 7, 2017 • Decision on February 5, 2019 • Capital Investment of ~$1.3 billion, including DSIC • Capital Investment of ~$18 million • ROE 10% with Equity of 53.75% • Estimated ROE 9.9% with Equity of 48.66% • Full recovery of reservoir project Missouri Rate Case – Rates Effective on May 28 • Decision on May 2, 2018 • Capital Investment of ~$255 million, including ISRS • ROE 10% with Equity of 52.80% California Rate Case – Rates Effective on January 1 • Decision on December 13, 2018 • Capital Investment of ~$171 million • ROE 9.2% with Equity of 55% (Part of Cost of Capital decision) • Monterey Peninsula Water Supply Project approval; continued commitment to Desalination Project 8
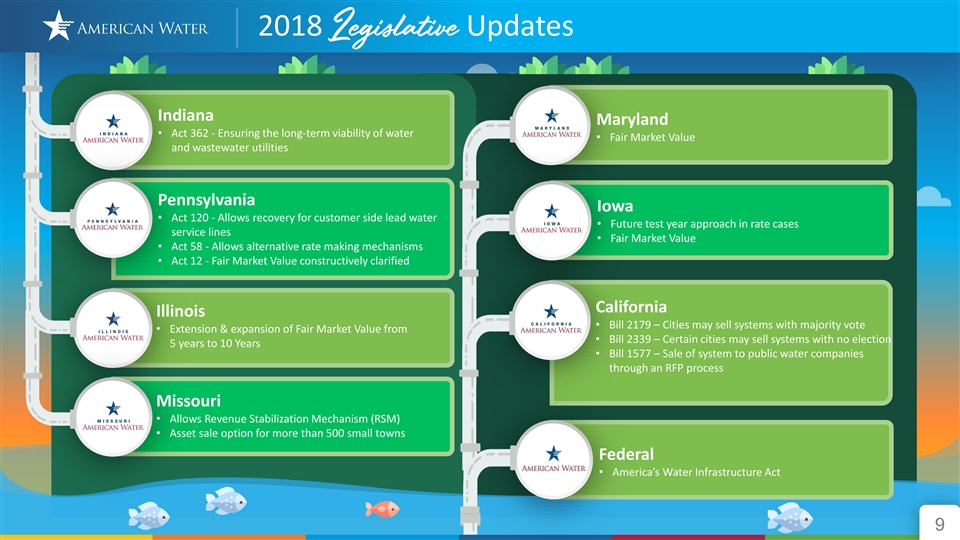
2018 Legislative Updates Indiana Maryland • Act 362 - Ensuring the long-term viability of water • Fair Market Value and wastewater utilities Pennsylvania Iowa • Act 120 - Allows recovery for customer side lead water • Future test year approach in rate cases service lines • Fair Market Value • Act 58 - Allows alternative rate making mechanisms • Act 12 - Fair Market Value constructively clarified California Illinois • Bill 2179 – Cities may sell systems with majority vote • Extension & expansion of Fair Market Value from • Bill 2339 – Certain cities may sell systems with no election 5 years to 10 Years • Bill 1577 – Sale of system to public water companies through an RFP process Missouri • Allows Revenue Stabilization Mechanism (RSM) • Asset sale option for more than 500 small towns Federal • America’s Water Infrastructure Act 92018 Legislative Updates Indiana Maryland • Act 362 - Ensuring the long-term viability of water • Fair Market Value and wastewater utilities Pennsylvania Iowa • Act 120 - Allows recovery for customer side lead water • Future test year approach in rate cases service lines • Fair Market Value • Act 58 - Allows alternative rate making mechanisms • Act 12 - Fair Market Value constructively clarified California Illinois • Bill 2179 – Cities may sell systems with majority vote • Extension & expansion of Fair Market Value from • Bill 2339 – Certain cities may sell systems with no election 5 years to 10 Years • Bill 1577 – Sale of system to public water companies through an RFP process Missouri • Allows Revenue Stabilization Mechanism (RSM) • Asset sale option for more than 500 small towns Federal • America’s Water Infrastructure Act 9
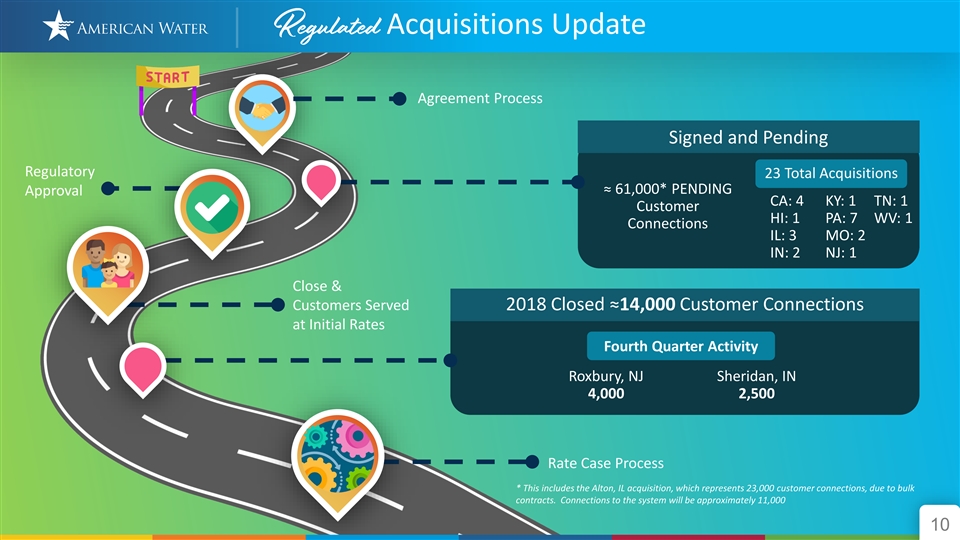
Regulated Acquisitions Update Agreement Process Signed and Pending Regulatory 23 Total Acquisitions ≈ 61,000* PENDING Approval CA: 4 KY: 1 TN: 1 Customer HI: 1 PA: 7 WV: 1 Connections IL: 3 MO: 2 IN: 2 NJ: 1 Close & Customers Served 2018 Closed ≈14,000 Customer Connections at Initial Rates Fourth Quarter Activity Roxbury, NJ Sheridan, IN 4,000 2,500 Rate Case Process * This includes the Alton, IL acquisition, which represents 23,000 customer connections, due to bulk contracts. Connections to the system will be approximately 11,000 10Regulated Acquisitions Update Agreement Process Signed and Pending Regulatory 23 Total Acquisitions ≈ 61,000* PENDING Approval CA: 4 KY: 1 TN: 1 Customer HI: 1 PA: 7 WV: 1 Connections IL: 3 MO: 2 IN: 2 NJ: 1 Close & Customers Served 2018 Closed ≈14,000 Customer Connections at Initial Rates Fourth Quarter Activity Roxbury, NJ Sheridan, IN 4,000 2,500 Rate Case Process * This includes the Alton, IL acquisition, which represents 23,000 customer connections, due to bulk contracts. Connections to the system will be approximately 11,000 10

Technology Efficiency through 46.1% Regulated O&M Efficiency Ratio* 1.9% 41.0% Regulated O&M Efficiency Ratio Tax Reform Adjustment 0.3% 39.1% 2.4% 36.6%** 35.6% 44.2% 1.6% *** 31.5% 40.7% 36.7% 34.9% 2023 Target 2012 2014 2016 2018 2010 Adjusted Operation and Maintenance Expense* ($ in millions) 2012-2018 2012 2014 2016 2018 $980 $943 $948 $1,015 0.6% CAGR * Non-GAAP Measure – See appendix for reconciliation. O&M Efficiency Ratio = Adjusted Regulated O&M Expenses (O&M Expenses is most comparable GAAP measure) / Adjusted Regulated Operating Revenues (Operating Revenues is most comparable GAAP measure). This calculation assumes purchased water revenues approximate purchased water expenses ** Amounts may not sum due to rounding 11 *** A reconciliation to a most comparable forward-looking GAAP measure is not available without unreasonable effortTechnology Efficiency through 46.1% Regulated O&M Efficiency Ratio* 1.9% 41.0% Regulated O&M Efficiency Ratio Tax Reform Adjustment 0.3% 39.1% 2.4% 36.6%** 35.6% 44.2% 1.6% *** 31.5% 40.7% 36.7% 34.9% 2023 Target 2012 2014 2016 2018 2010 Adjusted Operation and Maintenance Expense* ($ in millions) 2012-2018 2012 2014 2016 2018 $980 $943 $948 $1,015 0.6% CAGR * Non-GAAP Measure – See appendix for reconciliation. O&M Efficiency Ratio = Adjusted Regulated O&M Expenses (O&M Expenses is most comparable GAAP measure) / Adjusted Regulated Operating Revenues (Operating Revenues is most comparable GAAP measure). This calculation assumes purchased water revenues approximate purchased water expenses ** Amounts may not sum due to rounding 11 *** A reconciliation to a most comparable forward-looking GAAP measure is not available without unreasonable effort

Fourth Quarter Highlights 12Fourth Quarter Highlights 12
2018 Financial Results & Long Term Outlook Linda Sullivan Chief Financial Officer ® We keep life flowing 132018 Financial Results & Long Term Outlook Linda Sullivan Chief Financial Officer ® We keep life flowing 13

Continued Execution of Company Strategy Contribution by Business 2018 2017 Change % Change Regulated $0.71 $0.66 $0.05 7.6% Market Based (12.5%) $0.07 $0.08 ($0.01) 4Q Parent & Other ($0.09) ($0.05) ($0.04) 80.0% Total Adjusted EPS* $0.69 $0.69 $0.00 0.0% 2018 Re-measurement from Tax Reform ($0.07) ($0.70) $0.63 Total GAAP EPS $0.62 ($0.01) $0.63 Contribution by Business 2018 2017 Change %Change Regulated $3.32 $3.09 $0.23 7.4% Market Based $0.33 $0.24 $0.09 37.5% Full Parent & Other ($0.35) ($0.30) ($0.05) 16.9% Total Adjusted EPS* $3.30 $3.03 $0.27 8.9% Year Re-measurement from Tax Reform ($0.07) ($0.70) $0.63 Contract Services Gain on Sale $0.06 $0.06 Keystone Impairment ($0.22) ($0.22) 2018 Freedom Industries Insurance Settlement $0.08 $0.07 $0.01 Early Debt Extinguishment at Parent Total ($0.02) $0.02 Total GAAP EPS $3.15 $2.38 $0.77 * Adjusted EPS is a non-GAAP Measure. Please see appendix for reconciliation and further information. 14Continued Execution of Company Strategy Contribution by Business 2018 2017 Change % Change Regulated $0.71 $0.66 $0.05 7.6% Market Based (12.5%) $0.07 $0.08 ($0.01) 4Q Parent & Other ($0.09) ($0.05) ($0.04) 80.0% Total Adjusted EPS* $0.69 $0.69 $0.00 0.0% 2018 Re-measurement from Tax Reform ($0.07) ($0.70) $0.63 Total GAAP EPS $0.62 ($0.01) $0.63 Contribution by Business 2018 2017 Change %Change Regulated $3.32 $3.09 $0.23 7.4% Market Based $0.33 $0.24 $0.09 37.5% Full Parent & Other ($0.35) ($0.30) ($0.05) 16.9% Total Adjusted EPS* $3.30 $3.03 $0.27 8.9% Year Re-measurement from Tax Reform ($0.07) ($0.70) $0.63 Contract Services Gain on Sale $0.06 $0.06 Keystone Impairment ($0.22) ($0.22) 2018 Freedom Industries Insurance Settlement $0.08 $0.07 $0.01 Early Debt Extinguishment at Parent Total ($0.02) $0.02 Total GAAP EPS $3.15 $2.38 $0.77 * Adjusted EPS is a non-GAAP Measure. Please see appendix for reconciliation and further information. 14
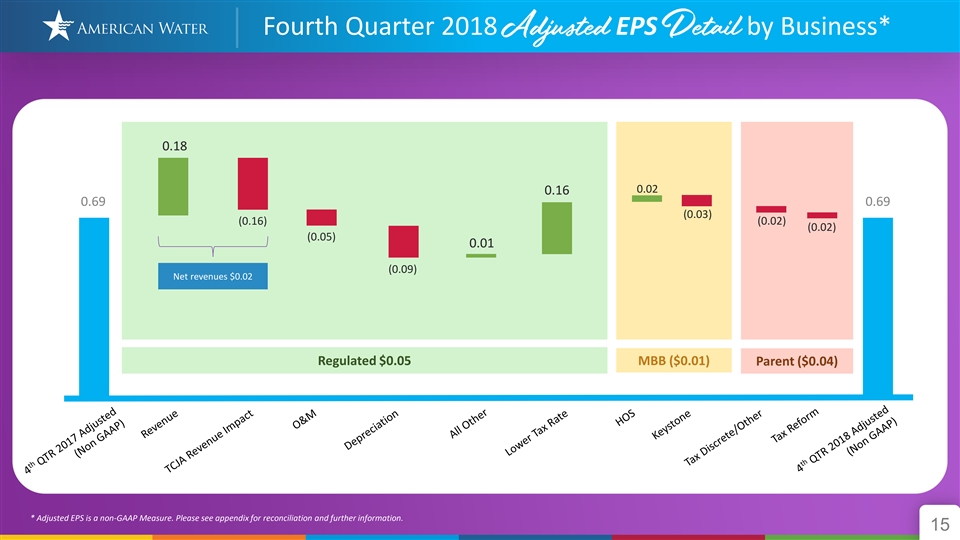
Fourth Quarter 2018 AdjustedEPS Detail by Business* 0.18 0.02 0.16 0.69 0.69 (0.03) (0.16) (0.02) (0.02) (0.05) 0.01 (0.09) Net revenues $0.02 z Regulated $0.05 MBB ($0.01) Parent ($0.04) * Adjusted EPS is a non-GAAP Measure. Please see appendix for reconciliation and further information. 15Fourth Quarter 2018 AdjustedEPS Detail by Business* 0.18 0.02 0.16 0.69 0.69 (0.03) (0.16) (0.02) (0.02) (0.05) 0.01 (0.09) Net revenues $0.02 z Regulated $0.05 MBB ($0.01) Parent ($0.04) * Adjusted EPS is a non-GAAP Measure. Please see appendix for reconciliation and further information. 15
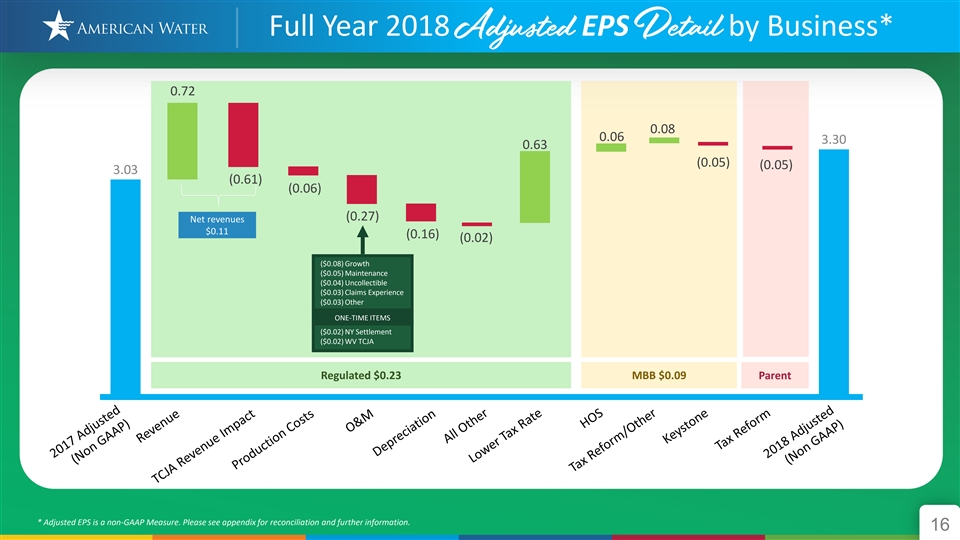
Full Year 2018 AdjustedEPS Detail by Business* 0.72 0.08 0.06 3.30 0.63 (0.05) (0.05) 3.03 (0.61) (0.06) (0.27) Net revenues $0.11 (0.16) (0.02) ($0.08) Growth ($0.05) Maintenance z ($0.04) Uncollectible ($0.03) Claims Experience ($0.03) Other ONE-TIME ITEMS ($0.02) NY Settlement ($0.02) WV TCJA Regulated $0.23 MBB $0.09 Parent * Adjusted EPS is a non-GAAP Measure. Please see appendix for reconciliation and further information. 16Full Year 2018 AdjustedEPS Detail by Business* 0.72 0.08 0.06 3.30 0.63 (0.05) (0.05) 3.03 (0.61) (0.06) (0.27) Net revenues $0.11 (0.16) (0.02) ($0.08) Growth ($0.05) Maintenance z ($0.04) Uncollectible ($0.03) Claims Experience ($0.03) Other ONE-TIME ITEMS ($0.02) NY Settlement ($0.02) WV TCJA Regulated $0.23 MBB $0.09 Parent * Adjusted EPS is a non-GAAP Measure. Please see appendix for reconciliation and further information. 16
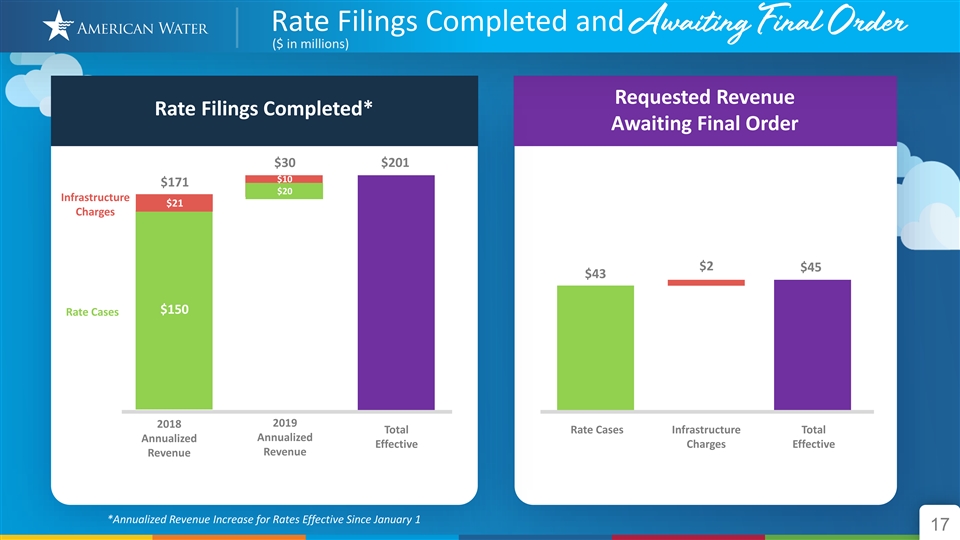
Rate Filings Completed and Awaiting Final Order ($ in millions) Requested Revenue Rate Filings Completed* Awaiting Final Order $30 $201 $10 $171 $20 Infrastructure $21 Charges $2 $45 $43 $150 Rate Cases 2019 2018 Total Rate Cases Infrastructure Total Annualized Annualized Effective Charges Effective Revenue Revenue *Annualized Revenue Increase for Rates Effective Since January 1 17Rate Filings Completed and Awaiting Final Order ($ in millions) Requested Revenue Rate Filings Completed* Awaiting Final Order $30 $201 $10 $171 $20 Infrastructure $21 Charges $2 $45 $43 $150 Rate Cases 2019 2018 Total Rate Cases Infrastructure Total Annualized Annualized Effective Charges Effective Revenue Revenue *Annualized Revenue Increase for Rates Effective Since January 1 17

Creating Customer and Shareholder Value Capital Investment Cash Flow from Operations AWK Shareholder Value (a) (in billions) (in billions) Adjusted Return on Equity 10.1% $2.0 9.9% $1.7 $1.4 $1.4 Other Pivotal Reg Acquisition $1.5 $1.4 Reg Investment 2017 2018 2017 2018 2017 2018 (b) 2019 Expected Dividend Growth at the High End of Target long term Long term EPS CAGR dividend growth CAGR at 6 consecutive years of ≈10% dividend growth High End (d) of 7-10% long term (c) $1.78 $1.62 adjusted EPS growth $1.47 $1.33 $1.21 2014 2015 2016 2017 2018 2019 2023 (a) Adjusted return on equity (includes both Regulated and Market-based Businesses) is a non-GAAP measure. Please see reconciliation table in appendix. (b) (c) (d) Future dividends are subject to approval of the American Water Board of Directors. Anchored off of 2013 dividends paid. Anchored off of 2017 Adjusted EPS (a non-GAAP measure). 18Creating Customer and Shareholder Value Capital Investment Cash Flow from Operations AWK Shareholder Value (a) (in billions) (in billions) Adjusted Return on Equity 10.1% $2.0 9.9% $1.7 $1.4 $1.4 Other Pivotal Reg Acquisition $1.5 $1.4 Reg Investment 2017 2018 2017 2018 2017 2018 (b) 2019 Expected Dividend Growth at the High End of Target long term Long term EPS CAGR dividend growth CAGR at 6 consecutive years of ≈10% dividend growth High End (d) of 7-10% long term (c) $1.78 $1.62 adjusted EPS growth $1.47 $1.33 $1.21 2014 2015 2016 2017 2018 2019 2023 (a) Adjusted return on equity (includes both Regulated and Market-based Businesses) is a non-GAAP measure. Please see reconciliation table in appendix. (b) (c) (d) Future dividends are subject to approval of the American Water Board of Directors. Anchored off of 2013 dividends paid. Anchored off of 2017 Adjusted EPS (a non-GAAP measure). 18

Affirming 2019 EPS Range Long Term Guidance in the Top Half of Range 2019 – 2023 Long Term EPS CAGR Guidance** 2019 EPS Affirm 2019 EPS Guidance 7-10%** Guidance CAGR Top Half 2018 Adjusted $3.54 - $3.64 EPS Of Range (GAAP EPS $3.15)* 2017 Adjusted EPS (GAAP EPS 2019 Guidance – Major Variables $2.38)*z $3.54 - $3.64 Weather ($0.06) $0.06 $3.30 Regulated ($0.03) $0.03 $3.03 Market-Based ($0.02) $0.02 2017 2018 2019 2023 * Adjusted EPS is a non-GAAP Measure. Please see appendix for reconciliation and further information. ** Long Term EPS reflects 2019 – 2023 EPS CAGR goal in the top half of 7-10%, anchored off of 2017 Adjusted EPS (a non-GAAP measure). 19Affirming 2019 EPS Range Long Term Guidance in the Top Half of Range 2019 – 2023 Long Term EPS CAGR Guidance** 2019 EPS Affirm 2019 EPS Guidance 7-10%** Guidance CAGR Top Half 2018 Adjusted $3.54 - $3.64 EPS Of Range (GAAP EPS $3.15)* 2017 Adjusted EPS (GAAP EPS 2019 Guidance – Major Variables $2.38)*z $3.54 - $3.64 Weather ($0.06) $0.06 $3.30 Regulated ($0.03) $0.03 $3.03 Market-Based ($0.02) $0.02 2017 2018 2019 2023 * Adjusted EPS is a non-GAAP Measure. Please see appendix for reconciliation and further information. ** Long Term EPS reflects 2019 – 2023 EPS CAGR goal in the top half of 7-10%, anchored off of 2017 Adjusted EPS (a non-GAAP measure). 19
Concluding Remarks Susan Story President and Chief Executive Officer ® We keep life flowing 20Concluding Remarks Susan Story President and Chief Executive Officer ® We keep life flowing 20
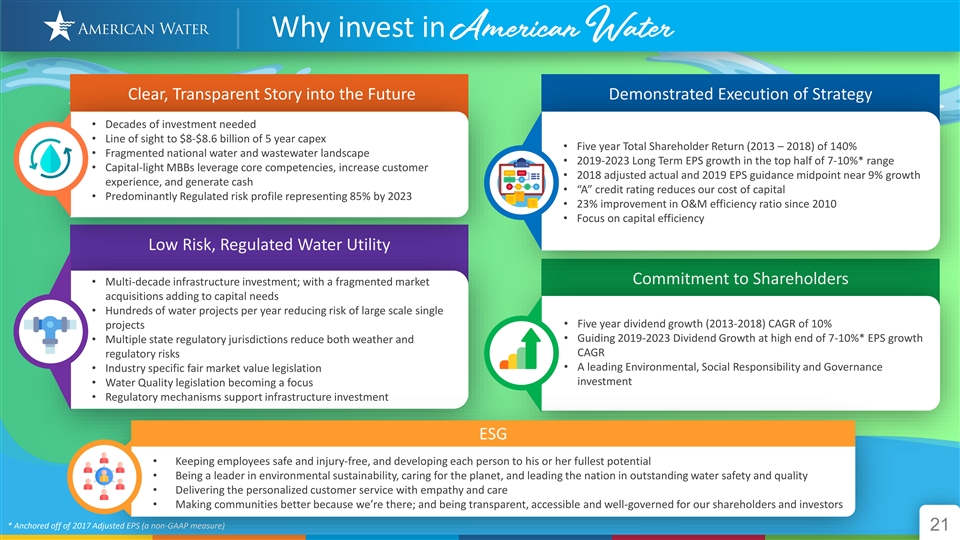
Why invest in American Water Clear, Transparent Story into the Future Demonstrated Execution of Strategy • Decades of investment needed • Line of sight to $8-$8.6 billion of 5 year capex • Five year Total Shareholder Return (2013 – 2018) of 140% • Fragmented national water and wastewater landscape • 2019-2023 Long Term EPS growth in the top half of 7-10%* range • Capital-light MBBs leverage core competencies, increase customer • 2018 adjusted actual and 2019 EPS guidance midpoint near 9% growth experience, and generate cash • “A” credit rating reduces our cost of capital • Predominantly Regulated risk profile representing 85% by 2023 • 23% improvement in O&M efficiency ratio since 2010 • Focus on capital efficiency Low Risk, Regulated Water Utility Commitment to Shareholders • Multi-decade infrastructure investment; with a fragmented market acquisitions adding to capital needs • Hundreds of water projects per year reducing risk of large scale single • Five year dividend growth (2013-2018) CAGR of 10% projects • Guiding 2019-2023 Dividend Growth at high end of 7-10%* EPS growth • Multiple state regulatory jurisdictions reduce both weather and CAGR regulatory risks • A leading Environmental, Social Responsibility and Governance • Industry specific fair market value legislation investment • Water Quality legislation becoming a focus • Regulatory mechanisms support infrastructure investment ESG • Keeping employees safe and injury-free, and developing each person to his or her fullest potential • Being a leader in environmental sustainability, caring for the planet, and leading the nation in outstanding water safety and quality • Delivering the personalized customer service with empathy and care • Making communities better because we’re there; and being transparent, accessible and well-governed for our shareholders and investors * Anchored off of 2017 Adjusted EPS (a non-GAAP measure) 21Why invest in American Water Clear, Transparent Story into the Future Demonstrated Execution of Strategy • Decades of investment needed • Line of sight to $8-$8.6 billion of 5 year capex • Five year Total Shareholder Return (2013 – 2018) of 140% • Fragmented national water and wastewater landscape • 2019-2023 Long Term EPS growth in the top half of 7-10%* range • Capital-light MBBs leverage core competencies, increase customer • 2018 adjusted actual and 2019 EPS guidance midpoint near 9% growth experience, and generate cash • “A” credit rating reduces our cost of capital • Predominantly Regulated risk profile representing 85% by 2023 • 23% improvement in O&M efficiency ratio since 2010 • Focus on capital efficiency Low Risk, Regulated Water Utility Commitment to Shareholders • Multi-decade infrastructure investment; with a fragmented market acquisitions adding to capital needs • Hundreds of water projects per year reducing risk of large scale single • Five year dividend growth (2013-2018) CAGR of 10% projects • Guiding 2019-2023 Dividend Growth at high end of 7-10%* EPS growth • Multiple state regulatory jurisdictions reduce both weather and CAGR regulatory risks • A leading Environmental, Social Responsibility and Governance • Industry specific fair market value legislation investment • Water Quality legislation becoming a focus • Regulatory mechanisms support infrastructure investment ESG • Keeping employees safe and injury-free, and developing each person to his or her fullest potential • Being a leader in environmental sustainability, caring for the planet, and leading the nation in outstanding water safety and quality • Delivering the personalized customer service with empathy and care • Making communities better because we’re there; and being transparent, accessible and well-governed for our shareholders and investors * Anchored off of 2017 Adjusted EPS (a non-GAAP measure) 21
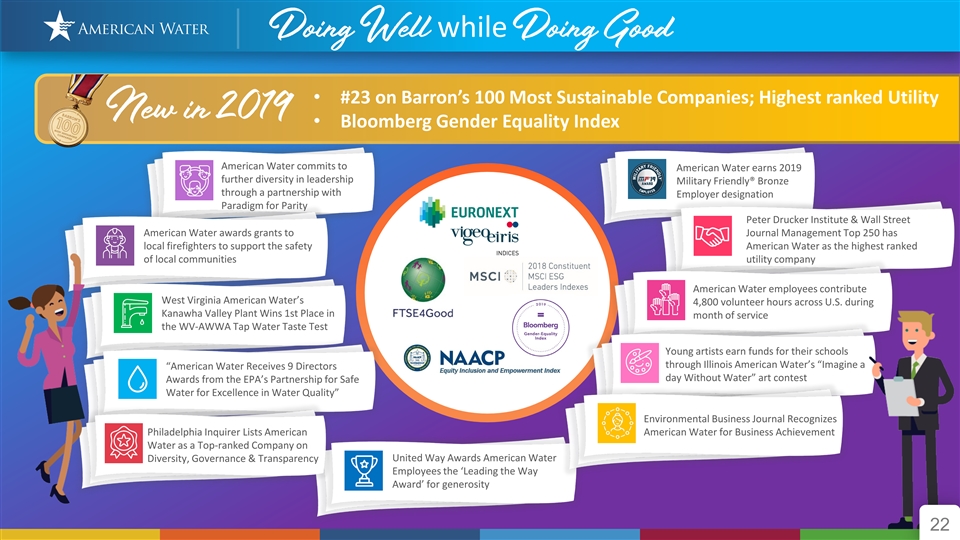
Doing Well while Doing Good • #23 on Barron’s 100 Most Sustainable Companies; Highest ranked Utility New in 2019 • Bloomberg Gender Equality Index American Water commits to American Water earns 2019 further diversity in leadership Military Friendly® Bronze through a partnership with Employer designation Paradigm for Parity Peter Drucker Institute & Wall Street American Water awards grants to Journal Management Top 250 has local firefighters to support the safety American Water as the highest ranked of local communities utility company American Water employees contribute West Virginia American Water’s 4,800 volunteer hours across U.S. during Kanawha Valley Plant Wins 1st Place in month of service the WV-AWWA Tap Water Taste Test Young artists earn funds for their schools through Illinois American Water’s “Imagine a “American Water Receives 9 Directors day Without Water” art contest Awards from the EPA’s Partnership for Safe Water for Excellence in Water Quality” Environmental Business Journal Recognizes Philadelphia Inquirer Lists American American Water for Business Achievement Water as a Top-ranked Company on United Way Awards American Water Diversity, Governance & Transparency Employees the ‘Leading the Way Award’ for generosity 22Doing Well while Doing Good • #23 on Barron’s 100 Most Sustainable Companies; Highest ranked Utility New in 2019 • Bloomberg Gender Equality Index American Water commits to American Water earns 2019 further diversity in leadership Military Friendly® Bronze through a partnership with Employer designation Paradigm for Parity Peter Drucker Institute & Wall Street American Water awards grants to Journal Management Top 250 has local firefighters to support the safety American Water as the highest ranked of local communities utility company American Water employees contribute West Virginia American Water’s 4,800 volunteer hours across U.S. during Kanawha Valley Plant Wins 1st Place in month of service the WV-AWWA Tap Water Taste Test Young artists earn funds for their schools through Illinois American Water’s “Imagine a “American Water Receives 9 Directors day Without Water” art contest Awards from the EPA’s Partnership for Safe Water for Excellence in Water Quality” Environmental Business Journal Recognizes Philadelphia Inquirer Lists American American Water for Business Achievement Water as a Top-ranked Company on United Way Awards American Water Diversity, Governance & Transparency Employees the ‘Leading the Way Award’ for generosity 22

Your Calm in the Middle of the Storms Your Calm in the Middle of the StormsYour Calm in the Middle of the Storms Your Calm in the Middle of the Storms

Q&A Session 24 24Q&A Session 24 24
Investor Relations Contacts Ed Vallejo Ralph Jedlicka Vice President, Investor Relations Director, Investor Relations edward.vallejo@amwater.com ralph.jedlicka@amwater.com ® We keep life flowing 25Investor Relations Contacts Ed Vallejo Ralph Jedlicka Vice President, Investor Relations Director, Investor Relations edward.vallejo@amwater.com ralph.jedlicka@amwater.com ® We keep life flowing 25

Appendix 26Appendix 26

Forward-Looking Statements Certain statements in this presentation including, without limitation, with respect to dividend growth guidance; the outcome of pending or future acquisition activity; the amount and allocation of future capital investments and expenditures; estimated revenues and regulatory recovery from rate cases and other governmental agency authorizations; estimates regarding our projected rate base, growth, results of operations and financial condition; our projected regulated operation and maintenance efficiency ratio; macro trends; our ability to execute our business and operational strategy; and projected impacts of the Tax Cuts and Jobs Act (the “TCJA”), are forward-looking statements within the meaning of the safe harbor provisions of the Private Securities Litigation Reform Act of 1995 and the Federal securities laws. In some cases, these forward-looking statements can be identified by words with prospective meanings such as “intend,” “plan,” “estimate,” “believe,” “anticipate,” “expect,” “predict,” “project,” “propose,” “assume,” “forecast,” “outlook,” “future,” “pending,” “goal,” “objective,” “potential,” “continue,” “seek to,” “may,” “can,” “will,” “should” and “could” and or the negative of such terms or other variations or similar expressions. These forward-looking statements are predictions based on our current expectations and assumptions regarding future events. They are not guarantees or assurances of any outcomes, financial results of levels of activity, performance or achievements, and readers are cautioned not to place undue reliance upon them. The forward-looking statements are subject to a number of estimates and assumptions, and known and unknown risks, uncertainties and other factors. Actual results may differ materially from those discussed in the forward-looking statements included in this presentation as a result of the factors discussed in our Annual Report on Form 10-K for the year ended December 31, 2018, as filed with the SEC on February 19, 2019, and subsequent filings with the SEC, and because of factors including, without limitation: the decisions of governmental and regulatory bodies, including decisions to raise or lower customer rates; the timeliness and outcome of regulatory commissions’ actions concerning rates, capital structure, authorized return on equity, capital investment, system acquisitions, taxes, permitting and other decisions; limitations on the availability of our water supplies or sources of water, or restrictions on our use thereof; changes in laws, governmental regulations and policies, including with respect to environmental, health and safety, water quality and emerging contaminants, public utility and tax regulations and policies, and impacts resulting from U.S., state and local elections; weather conditions and events, climate variability patterns, and natural disasters, including drought or abnormally high rainfall, prolonged and abnormal ice or freezing conditions, strong winds, coastal and intercoastal flooding, earthquakes, landslides, hurricanes, tornadoes, wildfires, electrical storms and solar flares; the outcome of litigation and similar governmental proceedings, investigations or actions; exposure or infiltration of our critical infrastructure and technology systems through physical or cyber attacks or other means; our ability to control operating expenses and to achieve efficiencies in our operations; the intentional or unintentional actions of a third party, including contamination of our water supplies or water provided to our customers; our ability to successfully meet growth projections for our businesses and capitalize on growth opportunities, including our ability to, among other things, acquire, close and successfully integrate regulated operations and market-based businesses, enter into contracts and other agreements with, or otherwise obtain, new customers in our market-based businesses, and realize anticipated benefits and synergies from new acquisitions; future results and growth from Keystone Clearwater Solutions’ narrowed business focus; access to sufficient capital on satisfactory terms and when and as needed to support operations and capital expenditures; changes in federal or state general, income and other tax laws, including any further rules, regulations, interpretations and guidance by the U.S. Department of the Treasury and state or local taxing authorities related to the enactment of the TCJA, the availability of tax credits and tax abatement programs, and our ability to utilize our U.S. federal and state income tax net operating loss carryforwards; and other factors as may be set forth in our SEC filings. These and other forward-looking statements are qualified by, and should be read together with, the risks and uncertainties set forth above and the risk factors and cautionary statements included in our annual and quarterly SEC filings, and readers should refer to such risks, uncertainties, risk factors and statements in evaluating such forward-looking statements. Any forward-looking statements speak only as of the date of this presentation. We do not have or undertake any obligation or intention to update or revise any forward-looking statement, whether as a result of new information, future events, changed circumstances or otherwise, except as otherwise required by the Federal securities laws. Furthermore, it may not be possible to assess the impact of any such factor on our businesses, either viewed independently or together, or the extent to which any factor, or combination of factors, may cause results to differ materially from those contained in any forward-looking statement. The foregoing factors should not be construed as exhaustive. 27Forward-Looking Statements Certain statements in this presentation including, without limitation, with respect to dividend growth guidance; the outcome of pending or future acquisition activity; the amount and allocation of future capital investments and expenditures; estimated revenues and regulatory recovery from rate cases and other governmental agency authorizations; estimates regarding our projected rate base, growth, results of operations and financial condition; our projected regulated operation and maintenance efficiency ratio; macro trends; our ability to execute our business and operational strategy; and projected impacts of the Tax Cuts and Jobs Act (the “TCJA”), are forward-looking statements within the meaning of the safe harbor provisions of the Private Securities Litigation Reform Act of 1995 and the Federal securities laws. In some cases, these forward-looking statements can be identified by words with prospective meanings such as “intend,” “plan,” “estimate,” “believe,” “anticipate,” “expect,” “predict,” “project,” “propose,” “assume,” “forecast,” “outlook,” “future,” “pending,” “goal,” “objective,” “potential,” “continue,” “seek to,” “may,” “can,” “will,” “should” and “could” and or the negative of such terms or other variations or similar expressions. These forward-looking statements are predictions based on our current expectations and assumptions regarding future events. They are not guarantees or assurances of any outcomes, financial results of levels of activity, performance or achievements, and readers are cautioned not to place undue reliance upon them. The forward-looking statements are subject to a number of estimates and assumptions, and known and unknown risks, uncertainties and other factors. Actual results may differ materially from those discussed in the forward-looking statements included in this presentation as a result of the factors discussed in our Annual Report on Form 10-K for the year ended December 31, 2018, as filed with the SEC on February 19, 2019, and subsequent filings with the SEC, and because of factors including, without limitation: the decisions of governmental and regulatory bodies, including decisions to raise or lower customer rates; the timeliness and outcome of regulatory commissions’ actions concerning rates, capital structure, authorized return on equity, capital investment, system acquisitions, taxes, permitting and other decisions; limitations on the availability of our water supplies or sources of water, or restrictions on our use thereof; changes in laws, governmental regulations and policies, including with respect to environmental, health and safety, water quality and emerging contaminants, public utility and tax regulations and policies, and impacts resulting from U.S., state and local elections; weather conditions and events, climate variability patterns, and natural disasters, including drought or abnormally high rainfall, prolonged and abnormal ice or freezing conditions, strong winds, coastal and intercoastal flooding, earthquakes, landslides, hurricanes, tornadoes, wildfires, electrical storms and solar flares; the outcome of litigation and similar governmental proceedings, investigations or actions; exposure or infiltration of our critical infrastructure and technology systems through physical or cyber attacks or other means; our ability to control operating expenses and to achieve efficiencies in our operations; the intentional or unintentional actions of a third party, including contamination of our water supplies or water provided to our customers; our ability to successfully meet growth projections for our businesses and capitalize on growth opportunities, including our ability to, among other things, acquire, close and successfully integrate regulated operations and market-based businesses, enter into contracts and other agreements with, or otherwise obtain, new customers in our market-based businesses, and realize anticipated benefits and synergies from new acquisitions; future results and growth from Keystone Clearwater Solutions’ narrowed business focus; access to sufficient capital on satisfactory terms and when and as needed to support operations and capital expenditures; changes in federal or state general, income and other tax laws, including any further rules, regulations, interpretations and guidance by the U.S. Department of the Treasury and state or local taxing authorities related to the enactment of the TCJA, the availability of tax credits and tax abatement programs, and our ability to utilize our U.S. federal and state income tax net operating loss carryforwards; and other factors as may be set forth in our SEC filings. These and other forward-looking statements are qualified by, and should be read together with, the risks and uncertainties set forth above and the risk factors and cautionary statements included in our annual and quarterly SEC filings, and readers should refer to such risks, uncertainties, risk factors and statements in evaluating such forward-looking statements. Any forward-looking statements speak only as of the date of this presentation. We do not have or undertake any obligation or intention to update or revise any forward-looking statement, whether as a result of new information, future events, changed circumstances or otherwise, except as otherwise required by the Federal securities laws. Furthermore, it may not be possible to assess the impact of any such factor on our businesses, either viewed independently or together, or the extent to which any factor, or combination of factors, may cause results to differ materially from those contained in any forward-looking statement. The foregoing factors should not be construed as exhaustive. 27
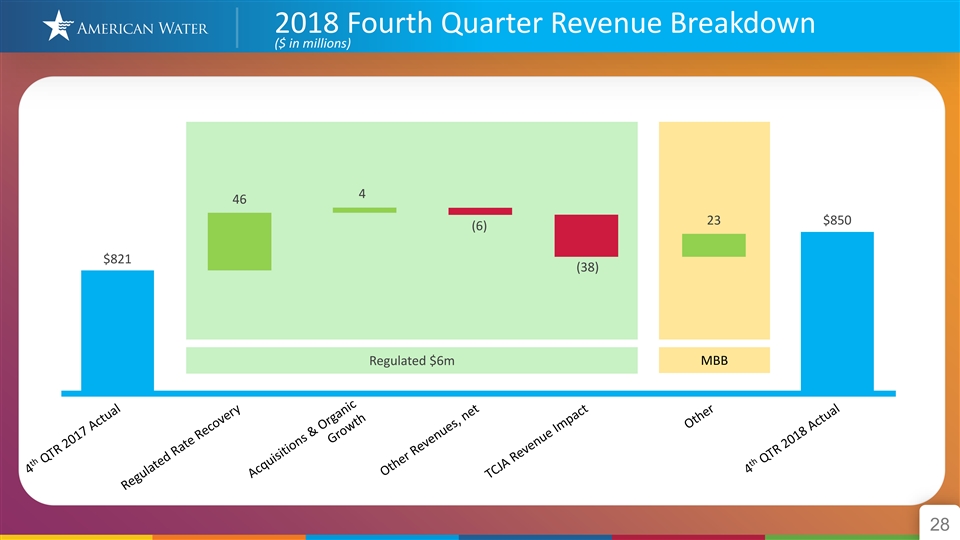
2018 Fourth Quarter Revenue Breakdown ($ in millions) 4 46 23 $850 (6) $821 (38) z Regulated $6m MBB 282018 Fourth Quarter Revenue Breakdown ($ in millions) 4 46 23 $850 (6) $821 (38) z Regulated $6m MBB 28

2018 Fourth Quarter O&M Expense Breakdown ($ in millions) 16 $394 1 3 4 7 3 1 $366 1 z MBB Parent Regulated $15m 292018 Fourth Quarter O&M Expense Breakdown ($ in millions) 16 $394 1 3 4 7 3 1 $366 1 z MBB Parent Regulated $15m 29
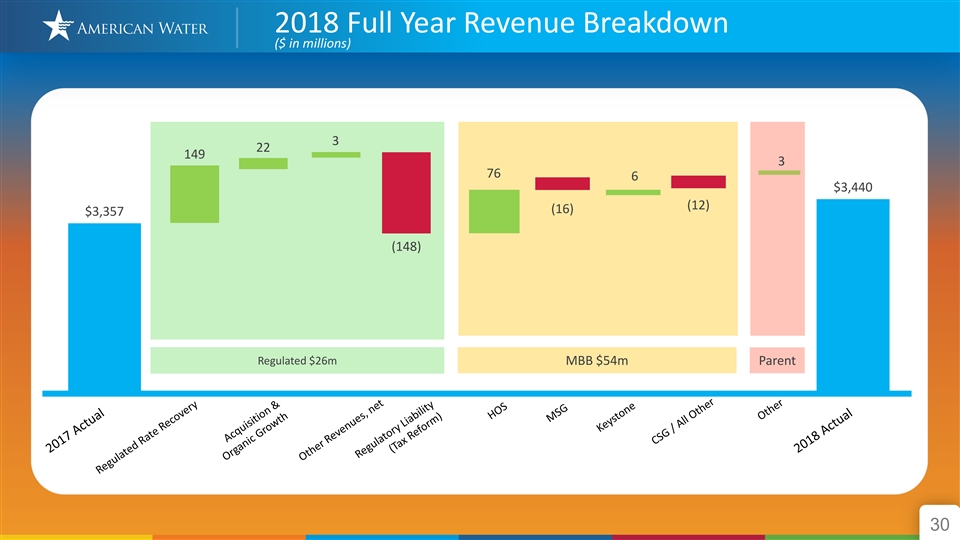
2018 Full Year Revenue Breakdown ($ in millions) 3 22 149 3 76 6 $3,440 (12) (16) $3,357 (148) z Regulated $26m MBB $54m Parent 302018 Full Year Revenue Breakdown ($ in millions) 3 22 149 3 76 6 $3,440 (12) (16) $3,357 (148) z Regulated $26m MBB $54m Parent 30
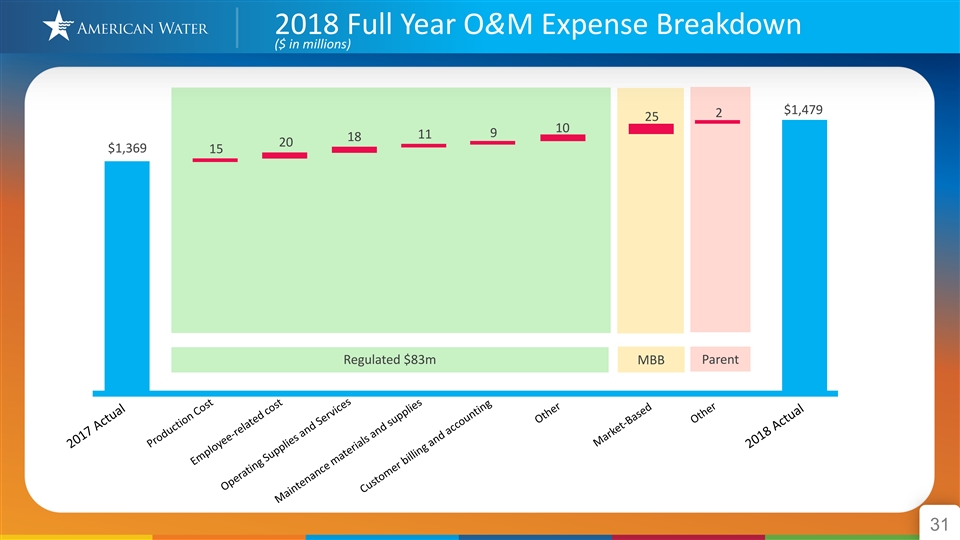
2018 Full Year O&M Expense Breakdown ($ in millions) $1,479 2 25 10 9 11 18 20 $1,369 15 z Regulated $83m MBB Parent 312018 Full Year O&M Expense Breakdown ($ in millions) $1,479 2 25 10 9 11 18 20 $1,369 15 z Regulated $83m MBB Parent 31

Rate Base Calculation* ($ in millions) Estimated Rate Base* As of $12,647 12/31/2018 Net Utility Plant $17,073 $11,637 Less $10,694 Advances for Construction 252 CIAC – Contributions in Aid of Construction 1,322 $9,987 $9,398 Net Deferred income taxes*** 2,830 Deferred investment tax credits 22 $4,426 Total Estimated Rate Base $12,647 ** ≈7-8% As of As of As of As of As of 12/31/2015 12/31/2016 12/31/2017 12/31/2018 12/31/2014 Expected Rate base CAGR through 2023 *An approximation of rate base, which includes Net Utility Plant not yet included in rate base pending rate case filings/outcomes **Anchored off of 2017 rate base *** Includes the regulatory liability established to normalize the impact of tax rate changes under the Tax Cuts and Jobs Act 32Rate Base Calculation* ($ in millions) Estimated Rate Base* As of $12,647 12/31/2018 Net Utility Plant $17,073 $11,637 Less $10,694 Advances for Construction 252 CIAC – Contributions in Aid of Construction 1,322 $9,987 $9,398 Net Deferred income taxes*** 2,830 Deferred investment tax credits 22 $4,426 Total Estimated Rate Base $12,647 ** ≈7-8% As of As of As of As of As of 12/31/2015 12/31/2016 12/31/2017 12/31/2018 12/31/2014 Expected Rate base CAGR through 2023 *An approximation of rate base, which includes Net Utility Plant not yet included in rate base pending rate case filings/outcomes **Anchored off of 2017 rate base *** Includes the regulatory liability established to normalize the impact of tax rate changes under the Tax Cuts and Jobs Act 32

Rates Effective since January 1, 2018 Annualized Annualized Revenue Increases Revenue Increases Effective Since Date Effective Effective in 2018 January 1, 2019 Infrastructure Charges West Virginia (DSIC) 1/1/2018 $3 Illinois (QIP) 1/1/2018 3 Virginia (WWISC) 3/1/2018 1 Indiana (DSIC) 3/14/2018 7 Tennessee (QIIP, EDI, SEC) 4/10/2018 1 Missouri (ISRS) 12/15/2018 6 Illinois (QIP) 1/1/2019 $8 West Virginia (DSIC) 1/1/2019 2 $21 $10 Rate Cases & Step Increases Pennsylvania 1/1/2018 $62 (a) New York 4/1/2018 5 (b) Missouri 5/28/2018 33 (c) New Jersey 10/29/2018 40 (d) California 1/1/2018 10 (e) Maryland 2/5/2019 1 (f) West Virginia 2/25/2019 19 (g) $150 $20 Total $171 $30 (a) The revenue increase from the PA GRC of $62 million does not include $42 million DSIC revenues that were effective in 2017. (b) Total Rate award for this rate case was $21 million with increases of $3.6, $4.8, $4.6 and $7.9 million effective 6/1/2017, 4/1/2018, 4/1/2019 and 4/1/2020, respectively. (c) The revenue increase from the MO GRC of $33 million does not include $5 million ISRS revenues that were effective in 2017. (d) As part of the resolution of the general rate case, customers will receive refunds of that portion of the provisional rates paid since June 15, 2018 that exceed the final rate increase. (e) On December 13, 2018, the California Public Utilities Commission issued an Order authorizing an increase of $10.3 million excluding $4.7 million in previously approved purchase water increases in 2018. (f) On February 5, 2019, the Maryland Public Service Commission issued an Order authorizing an increase of $1.45 million effective February 5, 2019. (g) On February 8, 2019, the West Virgina Public Service Commission issued an Order authorizing an increase of $19 million effective February 25, 2019, this excludes $4 million in DSIC revenues. 33Rates Effective since January 1, 2018 Annualized Annualized Revenue Increases Revenue Increases Effective Since Date Effective Effective in 2018 January 1, 2019 Infrastructure Charges West Virginia (DSIC) 1/1/2018 $3 Illinois (QIP) 1/1/2018 3 Virginia (WWISC) 3/1/2018 1 Indiana (DSIC) 3/14/2018 7 Tennessee (QIIP, EDI, SEC) 4/10/2018 1 Missouri (ISRS) 12/15/2018 6 Illinois (QIP) 1/1/2019 $8 West Virginia (DSIC) 1/1/2019 2 $21 $10 Rate Cases & Step Increases Pennsylvania 1/1/2018 $62 (a) New York 4/1/2018 5 (b) Missouri 5/28/2018 33 (c) New Jersey 10/29/2018 40 (d) California 1/1/2018 10 (e) Maryland 2/5/2019 1 (f) West Virginia 2/25/2019 19 (g) $150 $20 Total $171 $30 (a) The revenue increase from the PA GRC of $62 million does not include $42 million DSIC revenues that were effective in 2017. (b) Total Rate award for this rate case was $21 million with increases of $3.6, $4.8, $4.6 and $7.9 million effective 6/1/2017, 4/1/2018, 4/1/2019 and 4/1/2020, respectively. (c) The revenue increase from the MO GRC of $33 million does not include $5 million ISRS revenues that were effective in 2017. (d) As part of the resolution of the general rate case, customers will receive refunds of that portion of the provisional rates paid since June 15, 2018 that exceed the final rate increase. (e) On December 13, 2018, the California Public Utilities Commission issued an Order authorizing an increase of $10.3 million excluding $4.7 million in previously approved purchase water increases in 2018. (f) On February 5, 2019, the Maryland Public Service Commission issued an Order authorizing an increase of $1.45 million effective February 5, 2019. (g) On February 8, 2019, the West Virgina Public Service Commission issued an Order authorizing an increase of $19 million effective February 25, 2019, this excludes $4 million in DSIC revenues. 33

Rate Filings Awaiting Final Order Rate Cases Filed Revenue Increase Company Docket / Case Number Date Filed Adj for TCJA ROE Requested Rate Base (a) Indiana Case No. 45142 9/14/2018 $18 10.80% $1,065 (b) Virginia Case No. PUR-2018-00175 11/2/2018 $5 10.80% $196 Kentucky Case No. 2018-00358 11/28/2018 $20 10.80% $441 $43 $1,702 Infrastructure Charges Filed (c) Tennessee (QIIP, EDI, SEC) 11/16/2018 $2 $19 $2 $19 Total Awaiting Final Order: $45 (a) The requested increase for Step 1 is $18.3 million with a rate base of $1,065 million, the requested amount excludes $18.6 million in revenues from DSIC cases. The Step 2 increase is $20.6 million with a rate base of $1,222 million. The Step 1 increase is estimated to be effective in the second quarter of 2019 and Step 2 increase is estimated to be effective in the second quarter of 2020. (b) The requested increase filed for was $5.6 million, which includes $.9 million from infrastructure filings. (c) The $2 million revenue increase requested is proposed to be offset with savings from the Tax Cuts and Jobs Act savings. 34Rate Filings Awaiting Final Order Rate Cases Filed Revenue Increase Company Docket / Case Number Date Filed Adj for TCJA ROE Requested Rate Base (a) Indiana Case No. 45142 9/14/2018 $18 10.80% $1,065 (b) Virginia Case No. PUR-2018-00175 11/2/2018 $5 10.80% $196 Kentucky Case No. 2018-00358 11/28/2018 $20 10.80% $441 $43 $1,702 Infrastructure Charges Filed (c) Tennessee (QIIP, EDI, SEC) 11/16/2018 $2 $19 $2 $19 Total Awaiting Final Order: $45 (a) The requested increase for Step 1 is $18.3 million with a rate base of $1,065 million, the requested amount excludes $18.6 million in revenues from DSIC cases. The Step 2 increase is $20.6 million with a rate base of $1,222 million. The Step 1 increase is estimated to be effective in the second quarter of 2019 and Step 2 increase is estimated to be effective in the second quarter of 2020. (b) The requested increase filed for was $5.6 million, which includes $.9 million from infrastructure filings. (c) The $2 million revenue increase requested is proposed to be offset with savings from the Tax Cuts and Jobs Act savings. 34

Regulated Utilities: Rate Base & Authorized Return on Equity Last Rate Case Awarded - Largest Regulated Subsidiaries (b) (b) (b) Authorized Rate Base* $498,135 $883,386 $841,915 $405,704 $1,249,293 (a) (e) (e) Authorized ROE 9.20% 9.79% 9.75% 9.70% 10.00% (d) (a) (c) (d) Authorized Equity 55.39% 49.80% 41.55% 47.36% 52.80% (a) Effective Date of Rate Case 1/1/2018 1/1/2017 1/29/2015 8/28/2016 5/28/2018 (h) (b) Authorized Rate Base* $2,950,471 $275,463 $3,162,597 $155,747 $652,900 (e) Authorized ROE 9.60% 9.10% 10.00% 9.25% 9.75% (h) (d) Authorized Equity 54.00% 46.00% 53.75% 46.09% 48.40% (g) (f) Effective Date of Rate Case 10/29/2018 6/1/2017 1/1/2018 5/24/2017 2/25/2019 *Rate Base stated in $000s Notes: a) On March 22, 2018, Decision 18-03-035 set the authorized cost of capital for 2018 through 2020. CA has a separate Cost of Capital case which sets the rate of return outside of a general rate proceeding. b) The Rate Base listed is the Company's view of the Rate Base allowed in the case, the Rate Base was not disclosed in the Order or the applicable settlement agreement. c) Regulatory capital structure includes cost-free items or tax credit balances at the overall rate of return which lowers the equity percentage as an alternative to the common practice of deducting such items from rate base d) The equity ratio listed is the Company's view of the equity ratio allowed in the case, the actual equity ratio was not disclosed in the Order or the applicable settlement agreement. e) The ROE listed is the Company's view of the ROE allowed in the case, the ROE was not disclosed in the Order or the applicable settlement agreement. f) Interim rates were effective April 1, 2016 and received final Order May 24, 2017. g) Interim rates were effective June 15, 2018 and final rates effective October 29, 2018. h) The Rate Base and equity ratio listed is the Company's view of what was allowed in the case, there were multiple versions disclosed by the parties in the applicable settlement agreement. 35Regulated Utilities: Rate Base & Authorized Return on Equity Last Rate Case Awarded - Largest Regulated Subsidiaries (b) (b) (b) Authorized Rate Base* $498,135 $883,386 $841,915 $405,704 $1,249,293 (a) (e) (e) Authorized ROE 9.20% 9.79% 9.75% 9.70% 10.00% (d) (a) (c) (d) Authorized Equity 55.39% 49.80% 41.55% 47.36% 52.80% (a) Effective Date of Rate Case 1/1/2018 1/1/2017 1/29/2015 8/28/2016 5/28/2018 (h) (b) Authorized Rate Base* $2,950,471 $275,463 $3,162,597 $155,747 $652,900 (e) Authorized ROE 9.60% 9.10% 10.00% 9.25% 9.75% (h) (d) Authorized Equity 54.00% 46.00% 53.75% 46.09% 48.40% (g) (f) Effective Date of Rate Case 10/29/2018 6/1/2017 1/1/2018 5/24/2017 2/25/2019 *Rate Base stated in $000s Notes: a) On March 22, 2018, Decision 18-03-035 set the authorized cost of capital for 2018 through 2020. CA has a separate Cost of Capital case which sets the rate of return outside of a general rate proceeding. b) The Rate Base listed is the Company's view of the Rate Base allowed in the case, the Rate Base was not disclosed in the Order or the applicable settlement agreement. c) Regulatory capital structure includes cost-free items or tax credit balances at the overall rate of return which lowers the equity percentage as an alternative to the common practice of deducting such items from rate base d) The equity ratio listed is the Company's view of the equity ratio allowed in the case, the actual equity ratio was not disclosed in the Order or the applicable settlement agreement. e) The ROE listed is the Company's view of the ROE allowed in the case, the ROE was not disclosed in the Order or the applicable settlement agreement. f) Interim rates were effective April 1, 2016 and received final Order May 24, 2017. g) Interim rates were effective June 15, 2018 and final rates effective October 29, 2018. h) The Rate Base and equity ratio listed is the Company's view of what was allowed in the case, there were multiple versions disclosed by the parties in the applicable settlement agreement. 35

Closed and Pending Acquisitions as of January 31, 2019 2018 Closed Acquisitions* No. of Water Wastewater Total State Acquisitions Customers Customers Customers California 1 50 50 100 Indiana 2 1,250 1,250 2,500 Illinois 4 2,400 2,400 4,800 Kentucky 1 600 - 600 Missouri 3 1,050 1,050 2,100 New Jersey 1 3,900 - 3,900 Total 12 9,250 4,750 14,000 Acquisitions Under Agreement* No. of Water Wastewater Total State Acquisitions Customers Customers Customers California 4 8,600 - 8,600 Hawaii 1 - 200 200 ** Illinois 3 500 29,700 30,200 Indiana 2 6,100 - 6,100 Kentucky 1 400 200 600 New Jersey 1 - 1,700 1,700 Pennsylvania 7 2,700 10,200 12,900 Missouri 2 50 50 100 Tennessee 1 100 - 100 West Virginia 1 500 - 500 Total 23 18,950 42,050 61,000 * Customer connections are rounded ** This includes the Alton, IL acquisition, which represents 23,000 customer connections, due to bulk contracts. Connections to the system will be approximately 11,000 36Closed and Pending Acquisitions as of January 31, 2019 2018 Closed Acquisitions* No. of Water Wastewater Total State Acquisitions Customers Customers Customers California 1 50 50 100 Indiana 2 1,250 1,250 2,500 Illinois 4 2,400 2,400 4,800 Kentucky 1 600 - 600 Missouri 3 1,050 1,050 2,100 New Jersey 1 3,900 - 3,900 Total 12 9,250 4,750 14,000 Acquisitions Under Agreement* No. of Water Wastewater Total State Acquisitions Customers Customers Customers California 4 8,600 - 8,600 Hawaii 1 - 200 200 ** Illinois 3 500 29,700 30,200 Indiana 2 6,100 - 6,100 Kentucky 1 400 200 600 New Jersey 1 - 1,700 1,700 Pennsylvania 7 2,700 10,200 12,900 Missouri 2 50 50 100 Tennessee 1 100 - 100 West Virginia 1 500 - 500 Total 23 18,950 42,050 61,000 * Customer connections are rounded ** This includes the Alton, IL acquisition, which represents 23,000 customer connections, due to bulk contracts. Connections to the system will be approximately 11,000 36

Reconciliation Table: Consolidated Adjusted Earnings Per Share* For the Three Months For the Twelve Months Ended December 31, Ended December 31, Consolidated Adjusted EPS 2018 2017 2018 vs. 2017 Percentage 2018 2017 2018 vs. 2017 Percentage Diluted earnings per share (GAAP): Net income attributable to common stockholders $ 0.62 $ (0.01) $ 0.63 $ 3.15 $ 2.38 $ 0.77 Non-GAAP adjustments: Contract Services Gain on Sale - - - (0.08) - (0.08) Income tax impact - - - 0.02 - 0.02 Net non-GAAP adjustment - - - (0.06) - (0.06) Keystone Impairment - - - 0.31 - 0.31 Income tax impact - - - (0.08) - (0.08) Net loss attributable to noncontrolling interest - - - (0.01) - (0.01) Net non-GAAP adjustment - - - 0.22 - 0.22 Freedom Industries Insurance Settlement - - - (0.11) (0.12) 0.01 Income tax impact - - - 0.03 0.05 (0.02) Net non-GAAP adjustment - - - (0.08) (0.07) (0.01) Early Debt Extinguishment at Parent - - - - 0.03 (0.03) Income tax impact - - - - (0.01) 0.01 Net non-GAAP adjustment - - - - 0.02 (0.02) Re-measurement from Tax Reform 0.07 0.70 (0.63) 0.07 0.70 (0.63) Total net non-GAAP adjustments 0.07 0.70 (0.63) 0.15 0.65 (0.50) Adjusted diluted earnings per share (non-GAAP) $ 0.69 $ 0.69 $ - 0.0% $ 3.30 $ 3.03 $ 0.27 8.9% *Amounts may not sum due to rounding 37Reconciliation Table: Consolidated Adjusted Earnings Per Share* For the Three Months For the Twelve Months Ended December 31, Ended December 31, Consolidated Adjusted EPS 2018 2017 2018 vs. 2017 Percentage 2018 2017 2018 vs. 2017 Percentage Diluted earnings per share (GAAP): Net income attributable to common stockholders $ 0.62 $ (0.01) $ 0.63 $ 3.15 $ 2.38 $ 0.77 Non-GAAP adjustments: Contract Services Gain on Sale - - - (0.08) - (0.08) Income tax impact - - - 0.02 - 0.02 Net non-GAAP adjustment - - - (0.06) - (0.06) Keystone Impairment - - - 0.31 - 0.31 Income tax impact - - - (0.08) - (0.08) Net loss attributable to noncontrolling interest - - - (0.01) - (0.01) Net non-GAAP adjustment - - - 0.22 - 0.22 Freedom Industries Insurance Settlement - - - (0.11) (0.12) 0.01 Income tax impact - - - 0.03 0.05 (0.02) Net non-GAAP adjustment - - - (0.08) (0.07) (0.01) Early Debt Extinguishment at Parent - - - - 0.03 (0.03) Income tax impact - - - - (0.01) 0.01 Net non-GAAP adjustment - - - - 0.02 (0.02) Re-measurement from Tax Reform 0.07 0.70 (0.63) 0.07 0.70 (0.63) Total net non-GAAP adjustments 0.07 0.70 (0.63) 0.15 0.65 (0.50) Adjusted diluted earnings per share (non-GAAP) $ 0.69 $ 0.69 $ - 0.0% $ 3.30 $ 3.03 $ 0.27 8.9% *Amounts may not sum due to rounding 37

Reconciliation Tables: Segment Adjusted Earnings Per Share* For the Three Months For the Twelve Months Ended December 31, Ended December 31, Regulated Businesses Adjusted EPS 2018 2017 2018 vs. 2017 Percentage 2018 2017 2018 vs. 2017 Percentage Diluted earnings per share (GAAP): Net income attributable to common stockholders $ 0.66 $ 0.63 $ 0.03 $ 3.35 $ 3.12 $ 0.23 Non-GAAP adjustments: Freedom Industries Insurance Settlement - - - (0.11) (0.12) 0.01 Income tax impact - - - 0.03 0.05 (0.02) Net non-GAAP adjustment - - - (0.08) (0.07) (0.01) Re-measurement from Tax Reform 0.05 0.03 0.02 0.05 0.03 0.02 Total net non-GAAP adjustments 0.05 0.03 0.02 (0.03) (0.04) 0.01 Adjusted diluted earnings per share (non-GAAP) $ 0.71 $ 0.66 $ 0.05 7.6% $ 3.32 $ 3.09 $ 0.24 7.4% For the Three Months For the Twelve Months For the Three Months For the Twelve Months Market-Based Businesses Adjusted EPS Ended December 31, Ended December 31, Parent Company Adjusted EPS Ended December 31, Ended December 31, 2018 2017 2018 vs. 2017 Percentage 2018 2017 2018 vs. 2017 Percentage Diluted earnings per share (GAAP): 2018 2017 2018 vs. 2017 Percentage 2018 2017 2018 vs. 2017 Percentage Net income attributable to common stockholders $ 0.07 $ 0.05 $ 0.02 $ 0.17 $ 0.21 $ (0.04) Diluted earnings per share (GAAP): Non-GAAP adjustments: Net income attributable to common stockholders $ (0.11) $ (0.69) $ 0.58 $ (0.37) $ (0.95) $ 0.58 Contract Services Gain on Sale - - - (0.08) - (0.08) Income tax impact - - - 0.02 - 0.02 Non-GAAP adjustments: Net non-GAAP adjustment - - - (0.06) - (0.06) Early Debt Extinguishment at Parent - - - - 0.03 (0.03) Income tax impact - - - - (0.01) 0.01 Keystone Impairment - - - 0.31 - 0.31 Income tax impact - - - (0.08) - (0.08) Net non-GAAP adjustment - - - - 0.02 (0.02) Net loss attributable to noncontrolling interest - - - (0.01) - (0.01) Net non-GAAP adjustment - - - 0.22 - 0.22 Re-measurement from Tax Reform 0.02 0.64 (0.62) 0.02 0.64 (0.62) Re-measurement from Tax Reform - 0.03 (0.03) - 0.03 (0.03) Total net non-GAAP adjustments 0.02 0.64 (0.62) 0.02 0.66 (0.64) Total net non-GAAP adjustments - 0.03 (0.03) 0.16 0.03 0.13 Adjusted diluted earnings per share (non-GAAP) $ 0.07 $ 0.08 $ (0.01) -12.5% $ 0.33 $ 0.24 $ 0.09 37.5% Adjusted diluted earnings per share (non-GAAP) $ (0.09) $ (0.05) $ (0.04) -80.0% $ (0.35) $ (0.30) $ (0.05) -16.9% *Amounts may not sum due to rounding 38Reconciliation Tables: Segment Adjusted Earnings Per Share* For the Three Months For the Twelve Months Ended December 31, Ended December 31, Regulated Businesses Adjusted EPS 2018 2017 2018 vs. 2017 Percentage 2018 2017 2018 vs. 2017 Percentage Diluted earnings per share (GAAP): Net income attributable to common stockholders $ 0.66 $ 0.63 $ 0.03 $ 3.35 $ 3.12 $ 0.23 Non-GAAP adjustments: Freedom Industries Insurance Settlement - - - (0.11) (0.12) 0.01 Income tax impact - - - 0.03 0.05 (0.02) Net non-GAAP adjustment - - - (0.08) (0.07) (0.01) Re-measurement from Tax Reform 0.05 0.03 0.02 0.05 0.03 0.02 Total net non-GAAP adjustments 0.05 0.03 0.02 (0.03) (0.04) 0.01 Adjusted diluted earnings per share (non-GAAP) $ 0.71 $ 0.66 $ 0.05 7.6% $ 3.32 $ 3.09 $ 0.24 7.4% For the Three Months For the Twelve Months For the Three Months For the Twelve Months Market-Based Businesses Adjusted EPS Ended December 31, Ended December 31, Parent Company Adjusted EPS Ended December 31, Ended December 31, 2018 2017 2018 vs. 2017 Percentage 2018 2017 2018 vs. 2017 Percentage Diluted earnings per share (GAAP): 2018 2017 2018 vs. 2017 Percentage 2018 2017 2018 vs. 2017 Percentage Net income attributable to common stockholders $ 0.07 $ 0.05 $ 0.02 $ 0.17 $ 0.21 $ (0.04) Diluted earnings per share (GAAP): Non-GAAP adjustments: Net income attributable to common stockholders $ (0.11) $ (0.69) $ 0.58 $ (0.37) $ (0.95) $ 0.58 Contract Services Gain on Sale - - - (0.08) - (0.08) Income tax impact - - - 0.02 - 0.02 Non-GAAP adjustments: Net non-GAAP adjustment - - - (0.06) - (0.06) Early Debt Extinguishment at Parent - - - - 0.03 (0.03) Income tax impact - - - - (0.01) 0.01 Keystone Impairment - - - 0.31 - 0.31 Income tax impact - - - (0.08) - (0.08) Net non-GAAP adjustment - - - - 0.02 (0.02) Net loss attributable to noncontrolling interest - - - (0.01) - (0.01) Net non-GAAP adjustment - - - 0.22 - 0.22 Re-measurement from Tax Reform 0.02 0.64 (0.62) 0.02 0.64 (0.62) Re-measurement from Tax Reform - 0.03 (0.03) - 0.03 (0.03) Total net non-GAAP adjustments 0.02 0.64 (0.62) 0.02 0.66 (0.64) Total net non-GAAP adjustments - 0.03 (0.03) 0.16 0.03 0.13 Adjusted diluted earnings per share (non-GAAP) $ 0.07 $ 0.08 $ (0.01) -12.5% $ 0.33 $ 0.24 $ 0.09 37.5% Adjusted diluted earnings per share (non-GAAP) $ (0.09) $ (0.05) $ (0.04) -80.0% $ (0.35) $ (0.30) $ (0.05) -16.9% *Amounts may not sum due to rounding 38
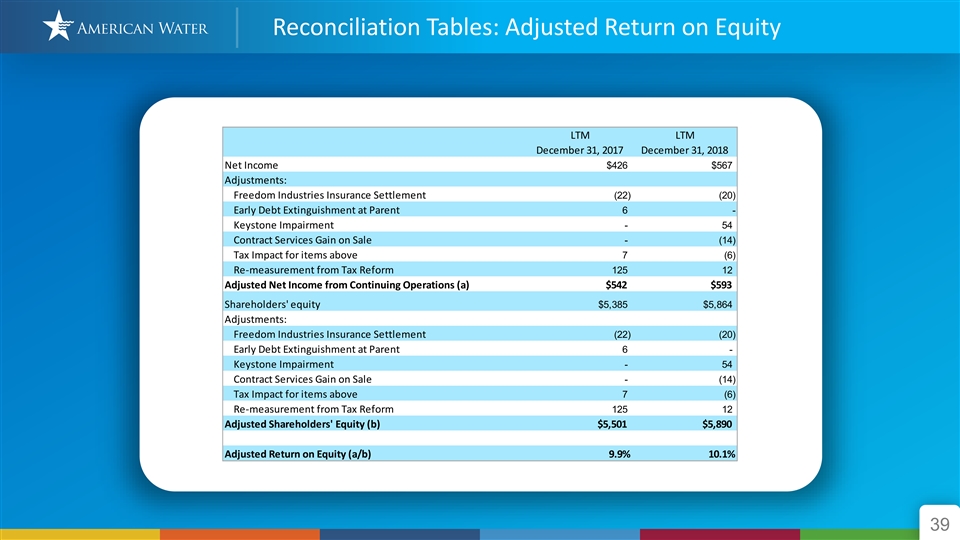
Reconciliation Tables: Adjusted Return on Equity LTM LTM December 31, 2017 December 31, 2018 Net Income $426 $567 Adjustments: Freedom Industries Insurance Settlement (22) (20) Early Debt Extinguishment at Parent 6 - Keystone Impairment - 54 Contract Services Gain on Sale - (14) Tax Impact for items above 7 (6) Re-measurement from Tax Reform 125 12 Adjusted Net Income from Continuing Operations (a) $542 $593 Shareholders' equity $5,385 $5,864 Adjustments: Freedom Industries Insurance Settlement (22) (20) Early Debt Extinguishment at Parent 6 - Keystone Impairment - 54 Contract Services Gain on Sale - (14) Tax Impact for items above 7 (6) Re-measurement from Tax Reform 125 12 Adjusted Shareholders' Equity (b) $5,501 $5,890 Adjusted Return on Equity (a/b) 9.9% 10.1% 39Reconciliation Tables: Adjusted Return on Equity LTM LTM December 31, 2017 December 31, 2018 Net Income $426 $567 Adjustments: Freedom Industries Insurance Settlement (22) (20) Early Debt Extinguishment at Parent 6 - Keystone Impairment - 54 Contract Services Gain on Sale - (14) Tax Impact for items above 7 (6) Re-measurement from Tax Reform 125 12 Adjusted Net Income from Continuing Operations (a) $542 $593 Shareholders' equity $5,385 $5,864 Adjustments: Freedom Industries Insurance Settlement (22) (20) Early Debt Extinguishment at Parent 6 - Keystone Impairment - 54 Contract Services Gain on Sale - (14) Tax Impact for items above 7 (6) Re-measurement from Tax Reform 125 12 Adjusted Shareholders' Equity (b) $5,501 $5,890 Adjusted Return on Equity (a/b) 9.9% 10.1% 39
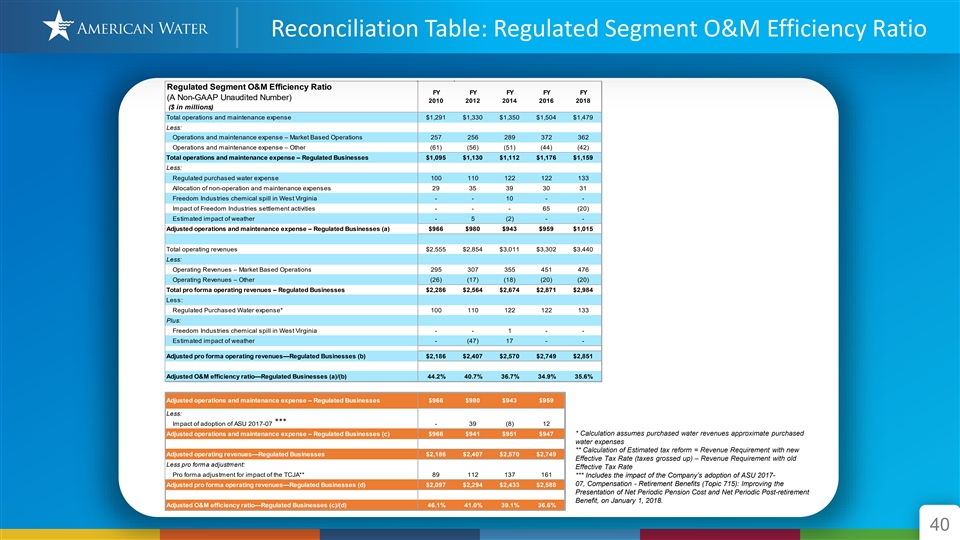
Reconciliation Table: Regulated Segment O&M Efficiency Ratio Regulated Segment O&M Efficiency Ratio FY FY FY FY FY (A Non-GAAP Unaudited Number) 2010 2012 2014 2016 2018 ($ in millions) Total operations and maintenance expense $1,291 $1,330 $1,350 $1,504 $1,479 Less: Operations and maintenance expense – Market Based Operations 257 256 289 372 362 Operations and maintenance expense – Other (61) (56) (51) (44) (42) Total operations and maintenance expense – Regulated Businesses $1,095 $1,130 $1,112 $1,176 $1,159 Less: Regulated purchased water expense 100 110 122 122 133 Allocation of non-operation and maintenance expenses 29 35 39 30 31 Freedom Industries chemical spill in West Virginia - - 10 - - Impact of Freedom Industries settlement activities - - - 65 (20) Estimated impact of weather - 5 (2) - - Adjusted operations and maintenance expense – Regulated Businesses (a) $966 $980 $943 $959 $1,015 Total operating revenues $2,555 $2,854 $3,011 $3,302 $3,440 Less: Operating Revenues – Market Based Operations 295 307 355 451 476 Operating Revenues – Other (26) (17) (18) (20) (20) Total pro forma operating revenues – Regulated Businesses $2,286 $2,564 $2,674 $2,871 $2,984 Less: Regulated Purchased Water expense* 100 110 122 122 133 Plus: Freedom Industries chemical spill in West Virginia - - 1 - - Estimated impact of weather - (47) 17 - - Adjusted pro forma operating revenues—Regulated Businesses (b) $2,186 $2,407 $2,570 $2,749 $2,851 Adjusted O&M efficiency ratio—Regulated Businesses (a)/(b) 44.2% 40.7% 36.7% 34.9% 35.6% Adjusted operations and maintenance expense – Regulated Businesses $966 $980 $943 $959 Less: *** Impact of adoption of ASU 2017-07 - 39 (8) 12 Adjusted operations and maintenance expense – Regulated Businesses (c) $966 $941 $951 $947 * Calculation assumes purchased water revenues approximate purchased water expenses ** Calculation of Estimated tax reform = Revenue Requirement with new Adjusted operating revenues—Regulated Businesses $2,186 $2,407 $2,570 $2,749 Effective Tax Rate (taxes grossed up) – Revenue Requirement with old Less pro forma adjustment: Effective Tax Rate Pro forma adjustment for impact of the TCJA** 89 112 137 161 *** Includes the impact of the Company’s adoption of ASU 2017- 07, Compensation - Retirement Benefits (Topic 715): Improving the Adjusted pro forma operating revenues—Regulated Businesses (d) $2,097 $2,294 $2,433 $2,588 Presentation of Net Periodic Pension Cost and Net Periodic Post-retirement Benefit, on January 1, 2018. Adjusted O&M efficiency ratio—Regulated Businesses (c)/(d) 46.1% 41.0% 39.1% 36.6% 40Reconciliation Table: Regulated Segment O&M Efficiency Ratio Regulated Segment O&M Efficiency Ratio FY FY FY FY FY (A Non-GAAP Unaudited Number) 2010 2012 2014 2016 2018 ($ in millions) Total operations and maintenance expense $1,291 $1,330 $1,350 $1,504 $1,479 Less: Operations and maintenance expense – Market Based Operations 257 256 289 372 362 Operations and maintenance expense – Other (61) (56) (51) (44) (42) Total operations and maintenance expense – Regulated Businesses $1,095 $1,130 $1,112 $1,176 $1,159 Less: Regulated purchased water expense 100 110 122 122 133 Allocation of non-operation and maintenance expenses 29 35 39 30 31 Freedom Industries chemical spill in West Virginia - - 10 - - Impact of Freedom Industries settlement activities - - - 65 (20) Estimated impact of weather - 5 (2) - - Adjusted operations and maintenance expense – Regulated Businesses (a) $966 $980 $943 $959 $1,015 Total operating revenues $2,555 $2,854 $3,011 $3,302 $3,440 Less: Operating Revenues – Market Based Operations 295 307 355 451 476 Operating Revenues – Other (26) (17) (18) (20) (20) Total pro forma operating revenues – Regulated Businesses $2,286 $2,564 $2,674 $2,871 $2,984 Less: Regulated Purchased Water expense* 100 110 122 122 133 Plus: Freedom Industries chemical spill in West Virginia - - 1 - - Estimated impact of weather - (47) 17 - - Adjusted pro forma operating revenues—Regulated Businesses (b) $2,186 $2,407 $2,570 $2,749 $2,851 Adjusted O&M efficiency ratio—Regulated Businesses (a)/(b) 44.2% 40.7% 36.7% 34.9% 35.6% Adjusted operations and maintenance expense – Regulated Businesses $966 $980 $943 $959 Less: *** Impact of adoption of ASU 2017-07 - 39 (8) 12 Adjusted operations and maintenance expense – Regulated Businesses (c) $966 $941 $951 $947 * Calculation assumes purchased water revenues approximate purchased water expenses ** Calculation of Estimated tax reform = Revenue Requirement with new Adjusted operating revenues—Regulated Businesses $2,186 $2,407 $2,570 $2,749 Effective Tax Rate (taxes grossed up) – Revenue Requirement with old Less pro forma adjustment: Effective Tax Rate Pro forma adjustment for impact of the TCJA** 89 112 137 161 *** Includes the impact of the Company’s adoption of ASU 2017- 07, Compensation - Retirement Benefits (Topic 715): Improving the Adjusted pro forma operating revenues—Regulated Businesses (d) $2,097 $2,294 $2,433 $2,588 Presentation of Net Periodic Pension Cost and Net Periodic Post-retirement Benefit, on January 1, 2018. Adjusted O&M efficiency ratio—Regulated Businesses (c)/(d) 46.1% 41.0% 39.1% 36.6% 40