
Exhibit 99.2 2022 Third Quarter Earnings & 2023 Outlook Conference Call November 1, 2022

Aaron Musgrave Vice President, Investor Relations 2
Forward-Looking Statements Safe Harbor This presentation includes forward-looking statements within the meaning of the safe harbor provisions of the Private Securities Litigation Reform Act of 1995 and the Federal securities laws. They are not guarantees or assurances of any outcomes, financial results, levels of activity, performance or achievements, and readers are cautioned not to place undue reliance upon them. The forward-looking statements are subject to a number of estimates and assumptions, and known and unknown risks, uncertainties and other factors. Actual results may differ materially from those discussed in the forward-looking statements included in this presentation. The factors that could cause actual results to differ are discussed in the Appendix to this presentation, and in our Quarterly Report on Form 10-Q for the quarter ended September 30, 2022, as filed with the SEC on October 31, 2022. Non-GAAP Financial Information This presentation includes non-GAAP financial measures. Further information regarding these non-GAAP financial measures, including a reconciliation of each of these measures to the most directly comparable GAAP measure, is included in the Appendix to this presentation. 3
Susan Hardwick President and Chief Executive Officer 4

2022: Successfully Executing the Plan Earnings Per Share Q3/YTD Highlights $3.70 • Achieved solid EPS growth vs. 2021 driven by higher $3.40 revenue from new rates, mechanisms, and acquisitions • Invested $1.9 billion of capital in regulated infrastructure improvements and acquisitions $1.63 $1.53 • New rates effective in NJ; settlements awaiting Commission approval in PA and VA; Proposed Order received in IL; MO and CA cases progressing as expected • Signed agreement to acquire Butler Area Sewer Authority, $2.07 $1.87 PA wastewater system for $232 million • Continuing to manage inflationary pressures 2021 2022 First Half Q3 5
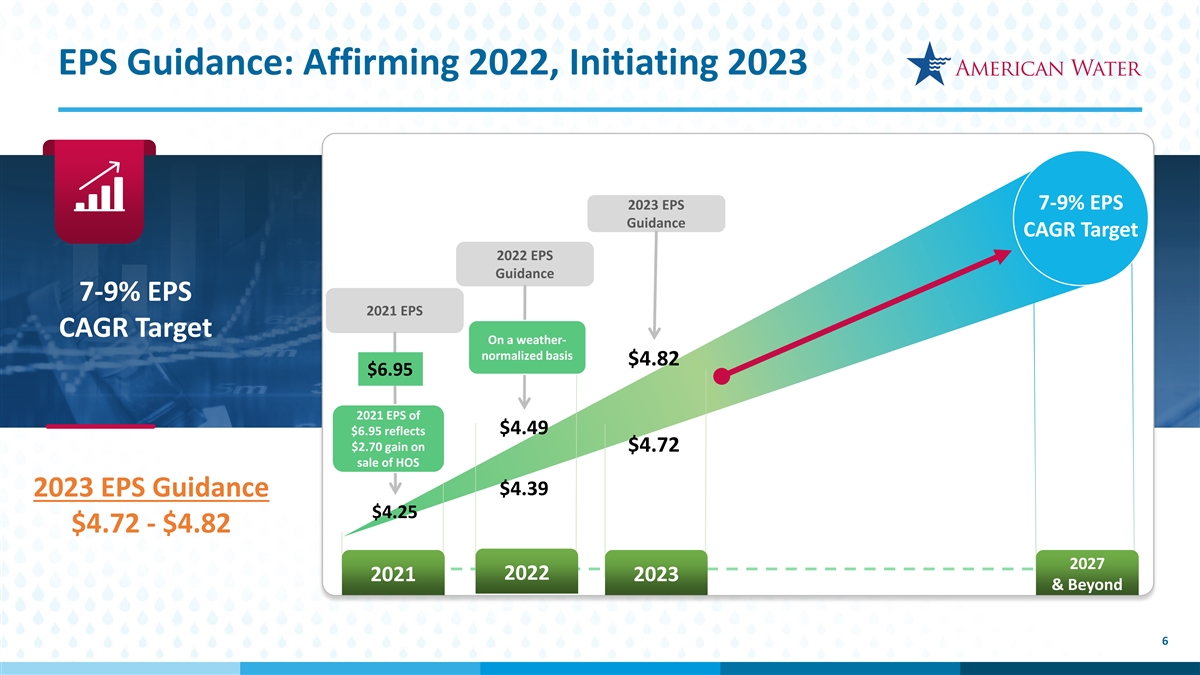
EPS Guidance: Affirming 2022, Initiating 2023 2023 EPS 7-9% EPS Guidance CAGR Target 2022 EPS Guidance 7-9% EPS 2021 EPS CAGR Target On a weather- normalized basis $4.82 $6.95 2021 EPS of $6.95 reflects $4.49 $2.70 gain on $4.72 sale of HOS $4.39 2023 EPS Guidance $4.25 $4.72 - $4.82 2027 2022 2021 2023 & Beyond 6
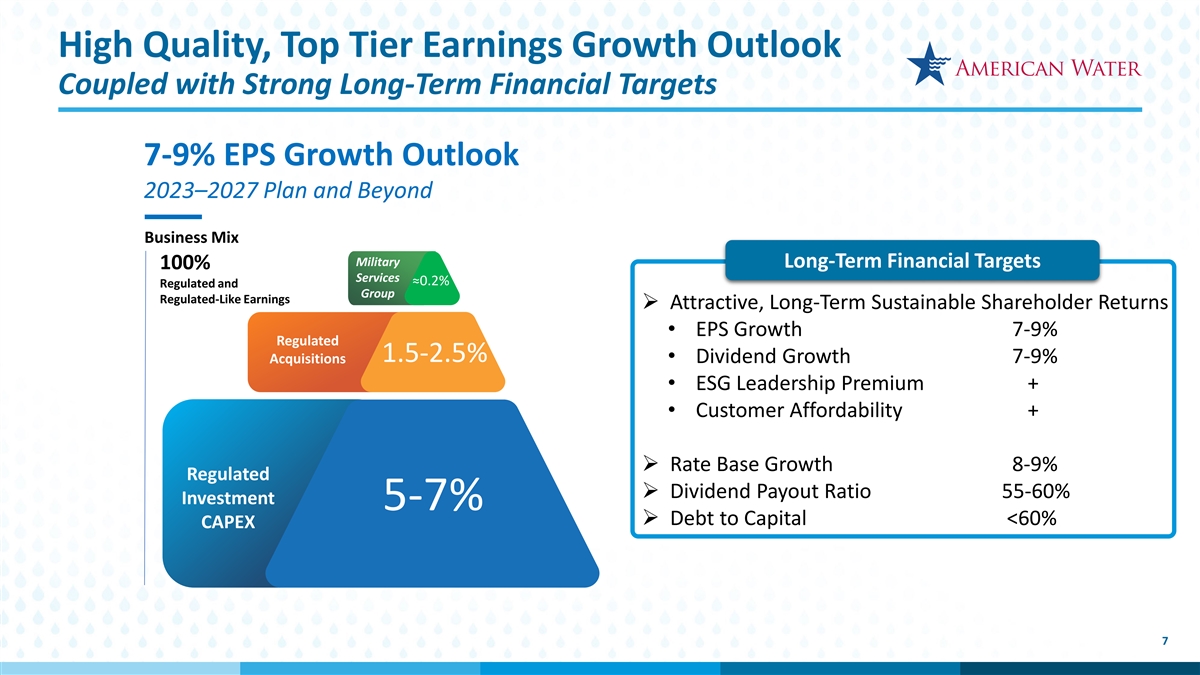
High Quality, Top Tier Earnings Growth Outlook Coupled with Strong Long-Term Financial Targets 7-9% EPS Growth Outlook 2023–2027 Plan and Beyond Business Mix Military Long-Term Financial Targets 100% Services ~0 ~1 ≈0..5 2% % % Regulated and Group Regulated-Like Earnings Ø Attractive, Long-Term Sustainable Shareholder Returns • EPS Growth 7-9% Regulated 2-3% 1.5-2.5% Acquisitions • Dividend Growth 7-9% • ESG Leadership Premium + • Customer Affordability + Regulated Regulated Investment Investment CAPEX Ø Rate Base Growth 8-9% CAPEX Regulated 5-7% Ø Dividend Payout Ratio 55-60% Investment 5-7% Ø Debt to Capital <60% CAPEX 7

John Griffith Executive VP & Chief Financial Officer 8
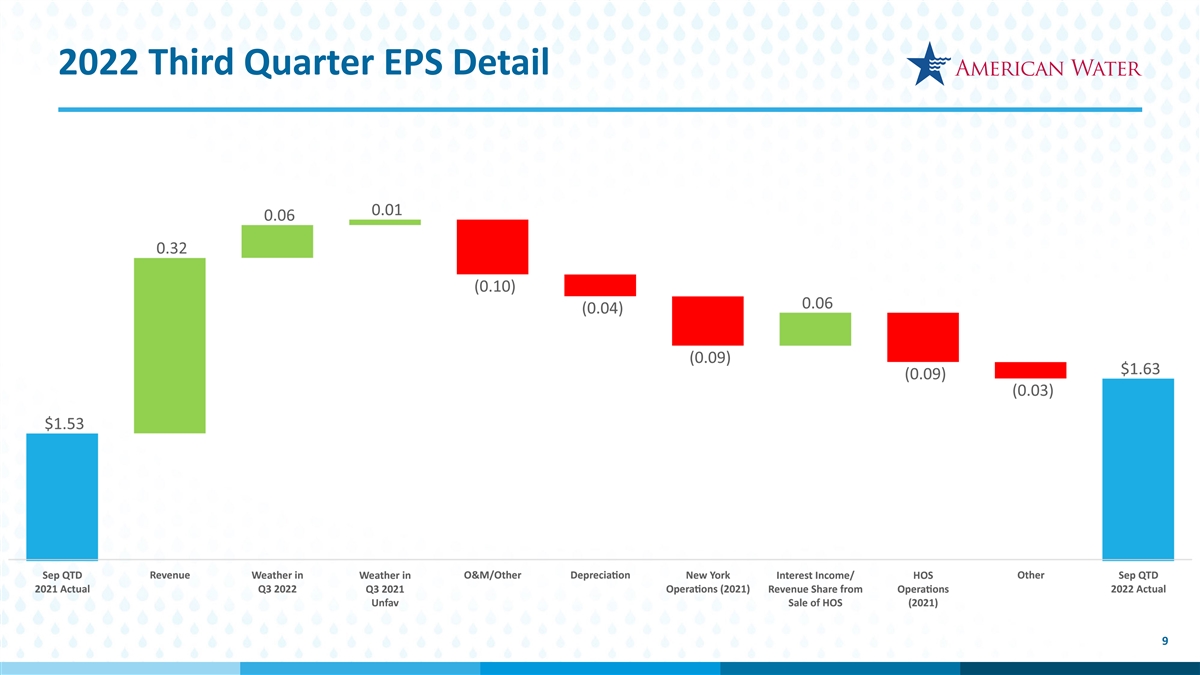
2022 Third Quarter EPS Detail 9
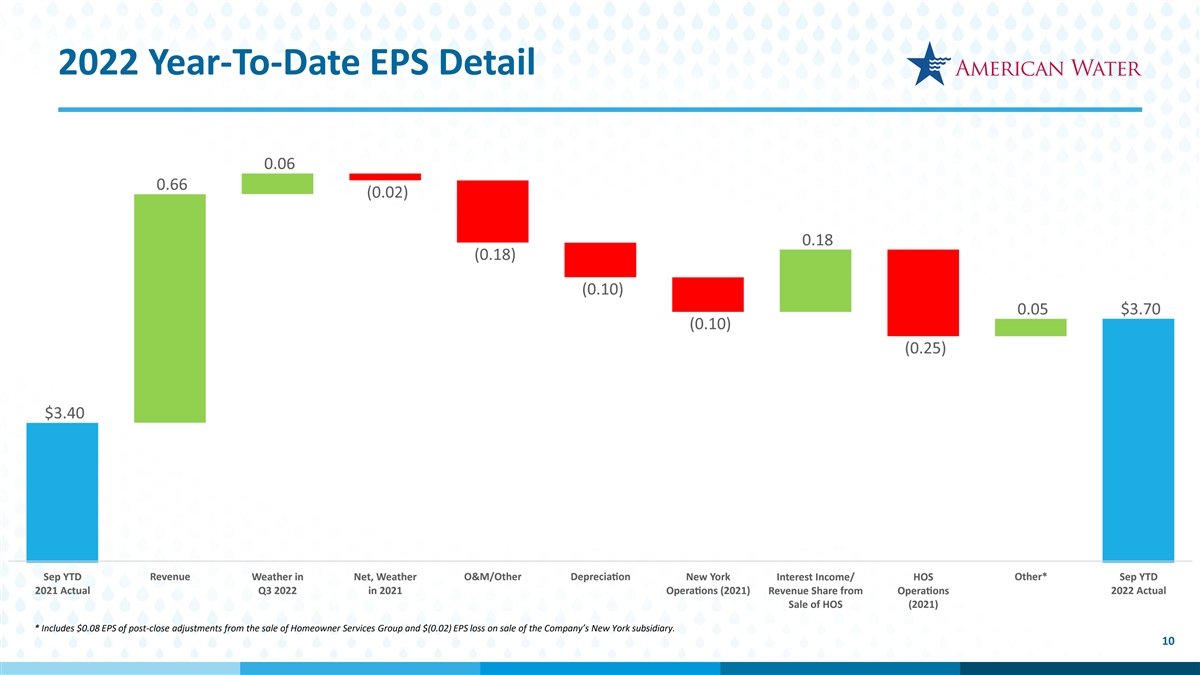
2022 Year-To-Date EPS Detail * Includes $0.08 EPS of post-close adjustments from the sale of Homeowner Services Group and $(0.02) EPS loss on sale of the Company’s New York subsidiary. 10

Rate Case and Legislative Updates Open Rate Cases Completed Rate Cases in 2022 • Rate case filed 11/15/21, Settlement filed 9/26/22 • General Rate Case • Settlement: additional authorized revenues of $12M vs. • Additional authorized revenues of $15 million $15M requested • Effective 2/25/2022 • Final Order expected Q1 2023 (interim rates began 5/1/22) • Rate case filed February 10, 2022; updated June 29, 2022 • General Rate Case • Proposed Order from ALJs received on 10/28/22; additional • Additional authorized revenues of $2 million revenues of $69M vs. $85M requested; ROE of 9.78%; June • Effective 7/1/2022 update included expected higher production/pension costs • January 2023– Statutory Order date • General Rate Case • New rates effective 9/1/2022 • Rate case filed 4/29/22, Settlement filed 10/11/22 • Additional authorized revenues of $61 million; Our • Settlement: additional authorized revenues of $150M vs. request incorporated updated production cost estimates $185M requested; incorporated our request of increased • Pension/OPEB deferral authorization production costs, updated pension cost estimate • Final Order expected by January 2023 • Rates to become effective January 28, 2023 Legislation • Rate case filed July 1, 2022 • Capital Investment of ≈$462 million (2023-2025) • Avg. water customer bill increase of $2-8/mo. (at full ask) California Senate Bill 1469 Signed 9/30/2022 • Rates expected to go into effect January 1, 2024 • Allows water companies to apply for water revenue adjustment mechanisms (WRAM) in General Rate Cases, as was previously allowed • Rate case filed July 1, 2022 • Capital Investment of ≈$700 million • California American Water is grandfathered into the previous WRAM through the • Avg. water customer bill increase of $12-13/mo. (at full ask) end of 2023; in the 2024-26 General Rate Case filed on July 1, 2022, we have • The MoPSC’s review is expected to take 11 months asked for the opportunity make a WRAM proposal 11
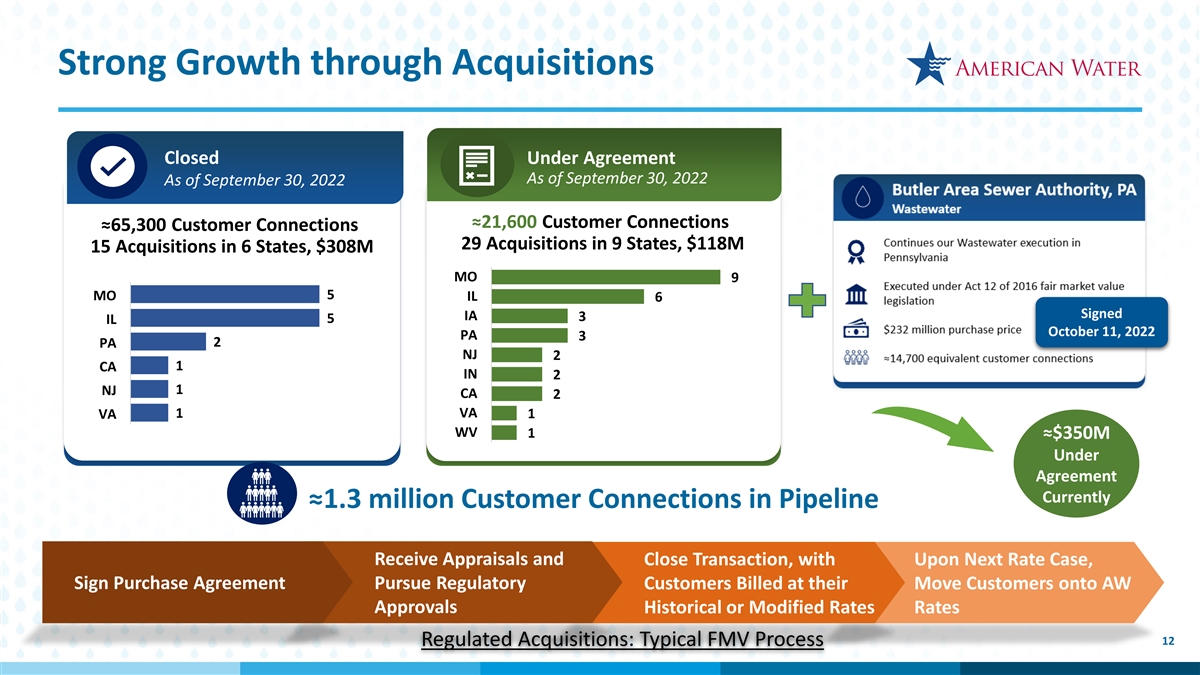
Strong Growth through Acquisitions Growing Opportunity for Closed Under Agreement Customer Connections Over Five- As of September 30, 2022 As of September 30, 2022 Year Outlook ≈21,600 Customer Connections ≈65,300 Customer Connections 29 Acquisitions in 9 States, $118M 15 Acquisitions in 6 States, $308M MO 9 MO 5 IL 6 Signed IA 3 IL 5 October 11, 2022 PA 3 PA 2 NJ 2 1 CA IN 2 1 NJ CA 2 1 VA VA 1 WV 1 ≈$350M Under Agreement Currently ≈1.3 million Customer Connections in Pipeline Receive Appraisals and Close Transaction, with Upon Next Rate Case, Sign Purchase Agreement Pursue Regulatory Customers Billed at their Move Customers onto AW Approvals Historical or Modified Rates Rates 12 Regulated Acquisitions: Typical FMV Process
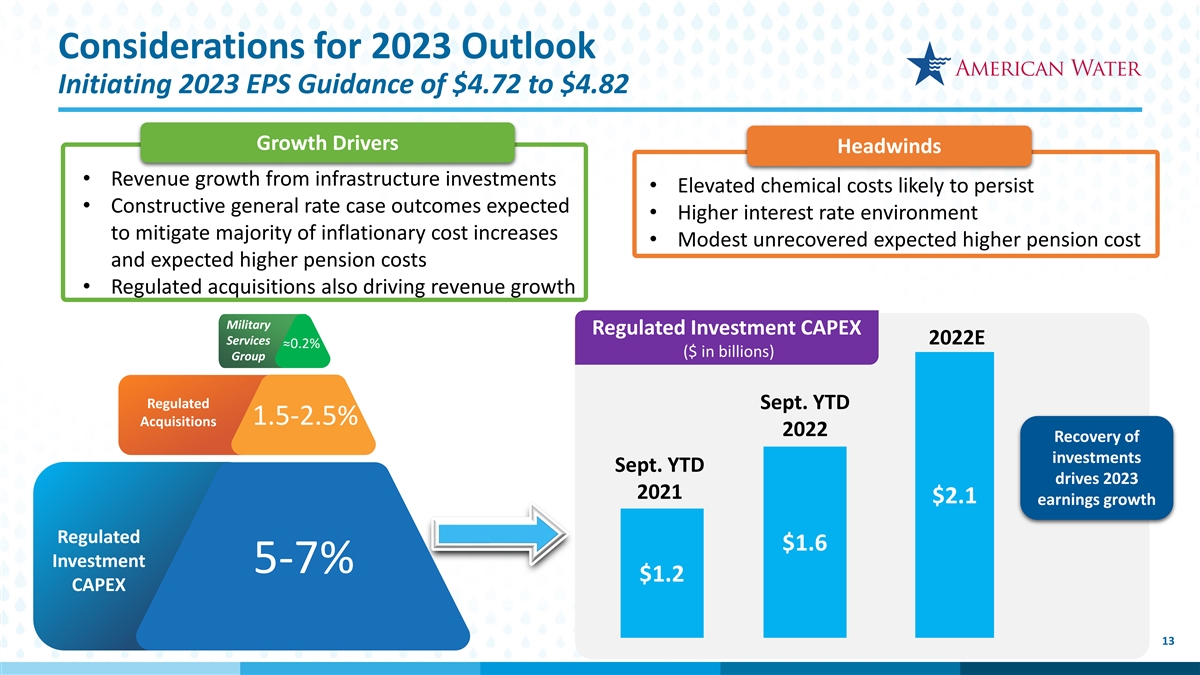
Considerations for 2023 Outlook Initiating 2023 EPS Guidance of $4.72 to $4.82 Growth Drivers Headwinds • Revenue growth from infrastructure investments • Elevated chemical costs likely to persist • Constructive general rate case outcomes expected • Higher interest rate environment to mitigate majority of inflationary cost increases • Modest unrecovered expected higher pension cost and expected higher pension costs • Regulated acquisitions also driving revenue growth Military Regulated Investment CAPEX Services 2022E ~0 ~1 .5 % % ≈0.2% ($ in billions) Group Regulated Sept. YTD 2-3% 1.5-2.5% Acquisitions 2022 Recovery of investments Sept. YTD drives 2023 Regulated Regulated 2021 $2.1 earnings growth Investment Investment CAPEX CAPEX Regulated $1.6 5-7% Investment 5-7% $1.2 CAPEX 13
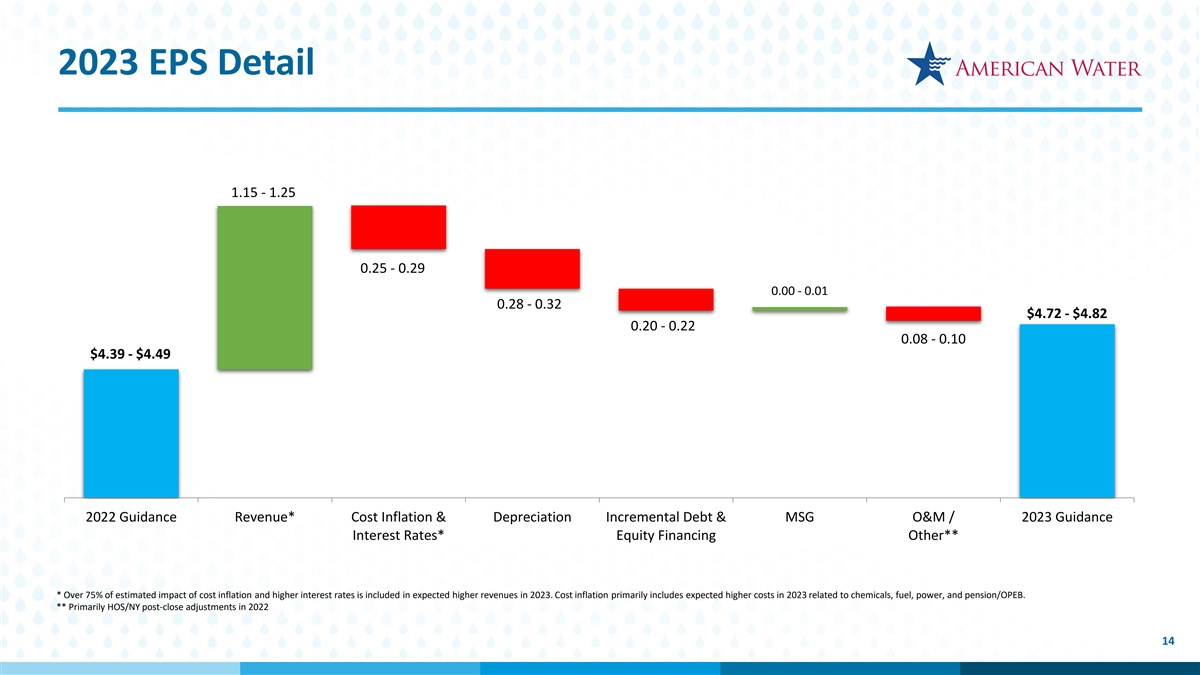
2023 EPS Detail 1.15 - 1.25 0.25 - 0.29 0.00 - 0.01 0.28 - 0.32 $4.72 - $4.82 0.20 - 0.22 0.08 - 0.10 $4.39 - $4.49 2022 Guidance Revenue* Cost Inflation & Depreciation Incremental Debt & MSG O&M / 2023 Guidance Interest Rates* Equity Financing Other** * Over 75% of estimated impact of cost inflation and higher interest rates is included in expected higher revenues in 2023. Cost inflation primarily includes expected higher costs in 2023 related to chemicals, fuel, power, and pension/OPEB. ** Primarily HOS/NY post-close adjustments in 2022 14
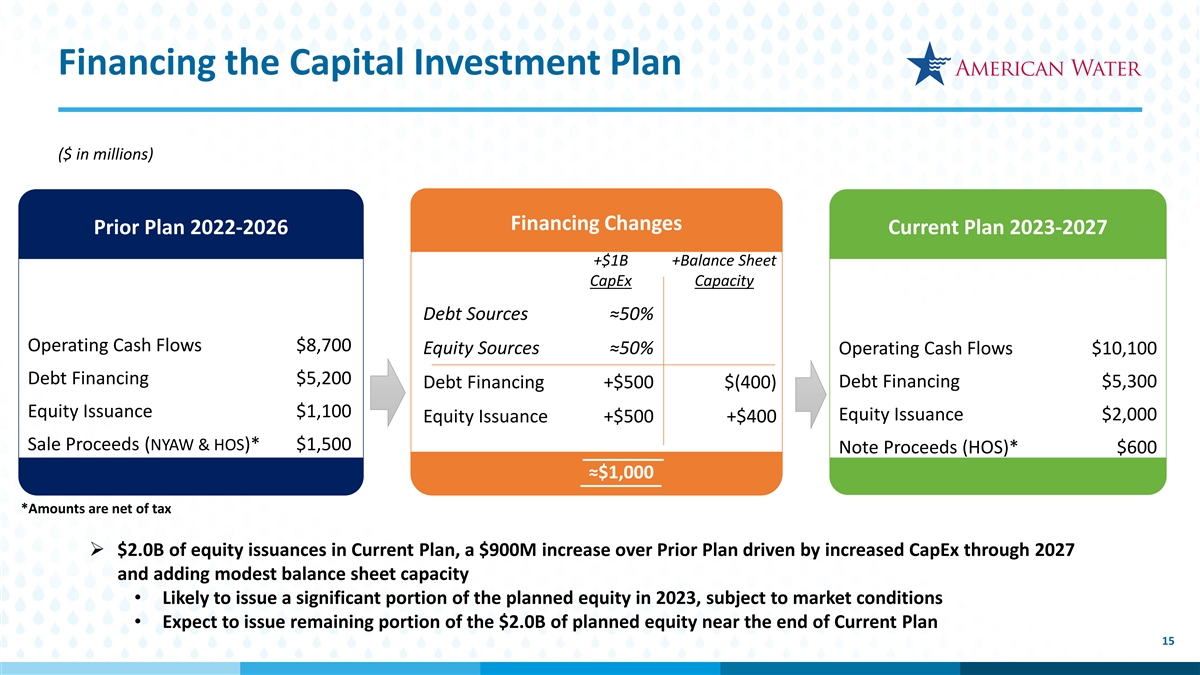
Financing the Capital Investment Plan ($ in millions) Financing Changes Prior Plan 2022-2026 Current Plan 2023-2027 +$1B +Balance Sheet CapEx Capacity Debt Sources ≈50% Operating Cash Flows $8,700 Equity Sources ≈50% Operating Cash Flows $10,100 Debt Financing $5,200 Debt Financing $5,300 Debt Financing +$500 $(400) Equity Issuance $1,100 Equity Issuance $2,000 Equity Issuance +$500 +$400 Sale Proceeds (NYAW & HOS)* $1,500 Note Proceeds (HOS)* $600 ≈$1,000 *Amounts are net of tax Ø $2.0B of equity issuances in Current Plan, a $900M increase over Prior Plan driven by increased CapEx through 2027 and adding modest balance sheet capacity • Likely to issue a significant portion of the planned equity in 2023, subject to market conditions • Expect to issue remaining portion of the $2.0B of planned equity near the end of Current Plan 15
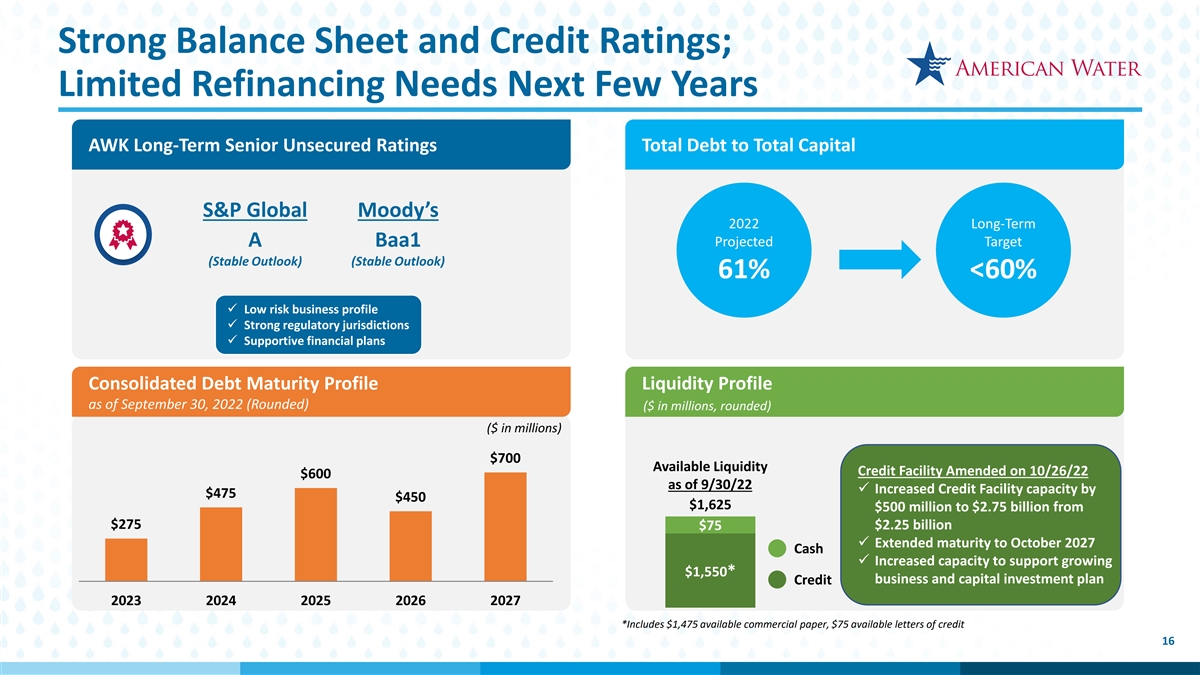
Strong Balance Sheet and Credit Ratings; Limited Refinancing Needs Next Few Years AWK Long-Term Senior Unsecured Ratings Total Debt to Total Capital S&P Global Moody’s 2022 Long-Term Projected Target A Baa1 (Stable Outlook) (Stable Outlook) 61% <60% ü Low risk business profile ü Strong regulatory jurisdictions ü Supportive financial plans Consolidated Debt Maturity Profile Liquidity Profile as of September 30, 2022 (Rounded) ($ in millions, rounded) ($ in millions) $700 Available Liquidity Credit Facility Amended on 10/26/22 $600 as of 9/30/22 ü Increased Credit Facility capacity by $475 $450 $1,625 $500 million to $2.75 billion from $275 $75 $2.25 billion ü Extended maturity to October 2027 Cash ü Increased capacity to support growing $1,550* business and capital investment plan Credit 2023 2024 2025 2026 2027 *Includes $1,475 available commercial paper, $75 available letters of credit 16

Cheryl Norton Executive VP & Chief Operating Officer 17
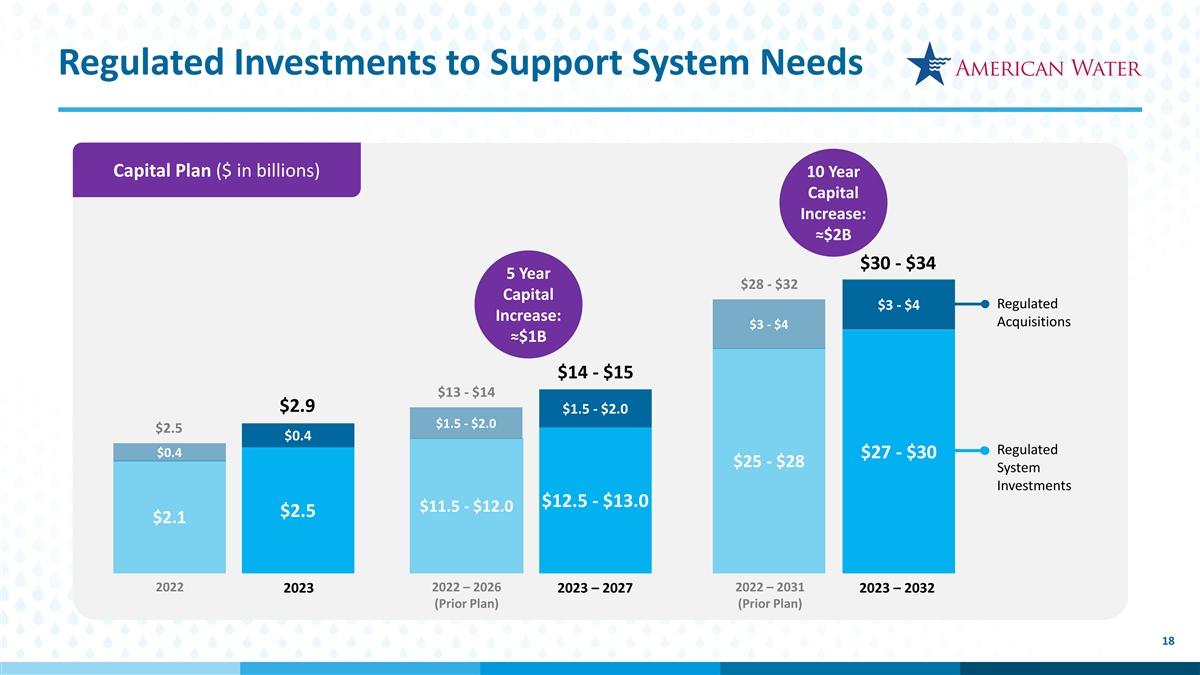
Regulated Investments to Support System Needs Capital Plan ($ in billions) 10 Year Capital Increase: ≈$2B $30 - $34 5 Year $28 - $32 Capital Regulated $3 - $4 Increase: Acquisitions $3 - $4 ≈$1B $14 - $15 $13 - $14 $2.9 $1.5 - $2.0 $1.5 - $2.0 $2.5 $0.4 Regulated $0.4 $27 - $30 $25 - $28 System Investments $12.5 - $13.0 $11.5 - $12.0 $2.5 $2.1 2022 2022 – 2026 2022 – 2031 2023 2023 – 2027 2023 – 2032 (Prior Plan) (Prior Plan) 18
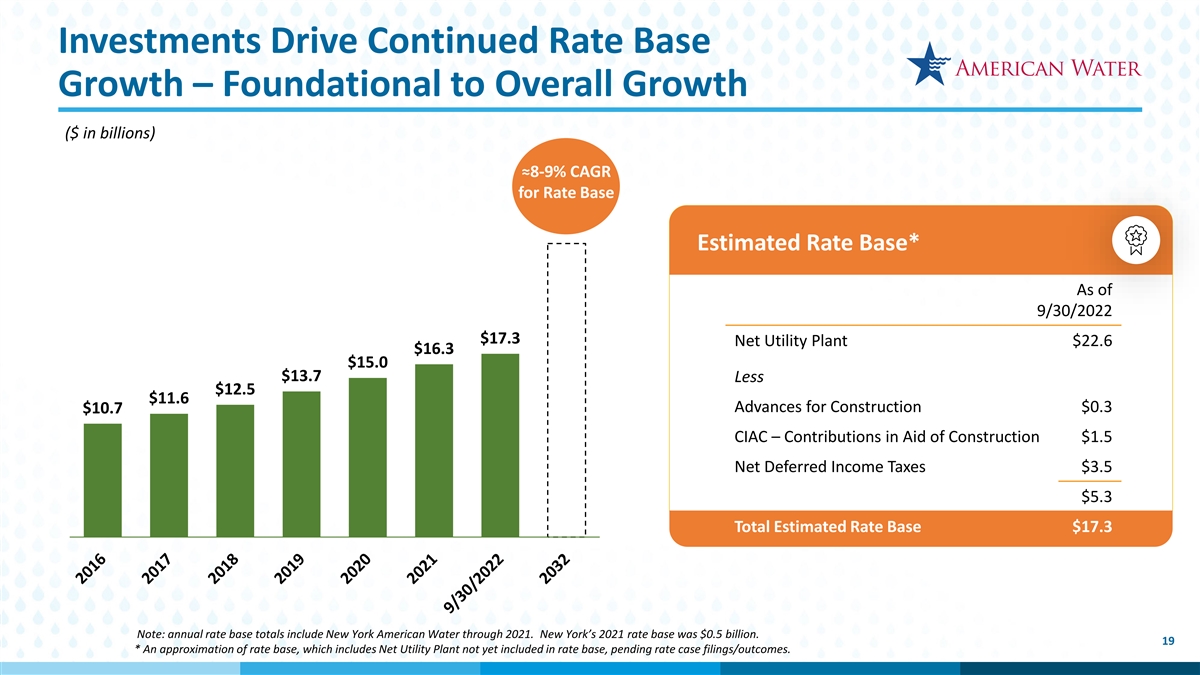
Investments Drive Continued Rate Base Growth – Foundational to Overall Growth ($ in billions) ≈8-9% CAGR for Rate Base Estimated Rate Base* As of 9/30/2022 $17.3 Net Utility Plant $22.6 $16.3 $15.0 $13.7 Less $12.5 $11.6 Advances for Construction $0.3 $10.7 CIAC – Contributions in Aid of Construction $1.5 Net Deferred Income Taxes $3.5 $5.3 Total Estimated Rate Base $17.3 Note: annual rate base totals include New York American Water through 2021. New York’s 2021 rate base was $0.5 billion. 19 * An approximation of rate base, which includes Net Utility Plant not yet included in rate base, pending rate case filings/outcomes.
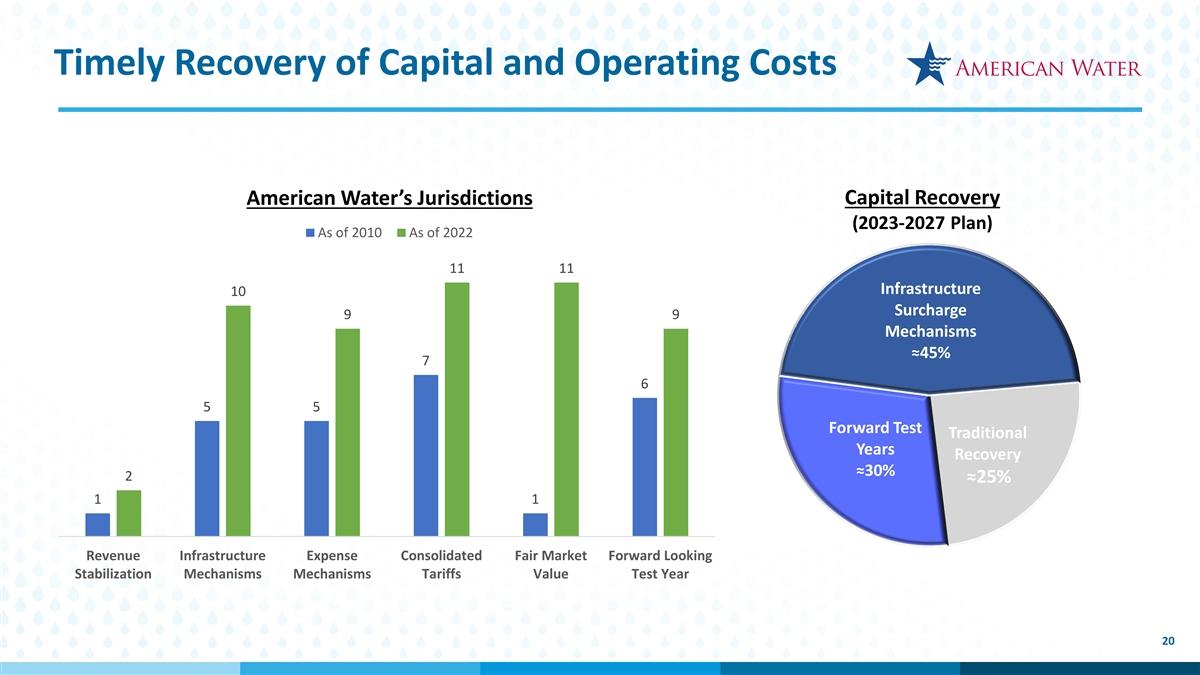
Timely Recovery of Capital and Operating Costs American Water’s Jurisdictions Capital Recovery (2023-2027 Plan) As of 2010 As of 2022 11 11 ≈65% Infrastructure 10 Surcharge 9 9 ≈70% Mechanisms ≈45% 7 6 5 5 Forward Test Traditional ≈30% Years Recovery ≈30% 2 ≈25% 1 1 Revenue Infrastructure Expense Consolidated Fair Market Forward Looking Stabilization Mechanisms Mechanisms Tariffs Value Test Year 20
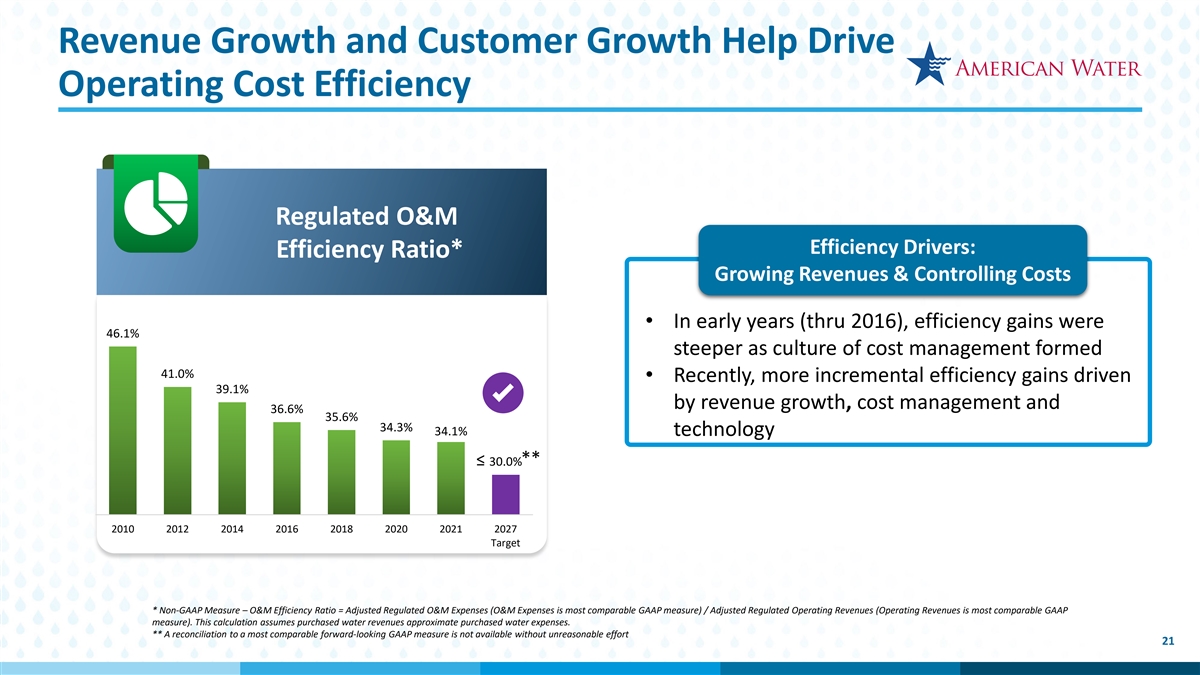
Revenue Growth and Customer Growth Help Drive Operating Cost Efficiency Regulated O&M Efficiency Drivers: Efficiency Ratio* Growing Revenues & Controlling Costs • In early years (thru 2016), efficiency gains were 46.1% steeper as culture of cost management formed 41.0% • Recently, more incremental efficiency gains driven 39.1% by revenue growth, cost management and 36.6% 35.6% 34.3% 34.1% technology ** ≤ 30.0% 2010 2012 2014 2016 2018 2020 2021 2027 Target * Non-GAAP Measure – O&M Efficiency Ratio = Adjusted Regulated O&M Expenses (O&M Expenses is most comparable GAAP measure) / Adjusted Regulated Operating Revenues (Operating Revenues is most comparable GAAP measure). This calculation assumes purchased water revenues approximate purchased water expenses. ** A reconciliation to a most comparable forward-looking GAAP measure is not available without unreasonable effort 21

Laser Focus on Customer Affordability Monthly Customer Bill Values around Affordability as % of Median Household Income* Ø Focused on keeping customer bills affordable compared to income (wallet share) Ø Culture of continuous improvement, diligent cost management, and technology enhancements helps drive affordability Ø Supportive of state legislation on consolidated tariffs that allows customers to benefit from efficiencies of scale Ø Continue to promote low-income assistance programs and tariffs * Figure is estimated based on data from the US Census Bureau American Community Survey based on zip codes served by American Water. American Water does not collect household income 22 data from its customers.
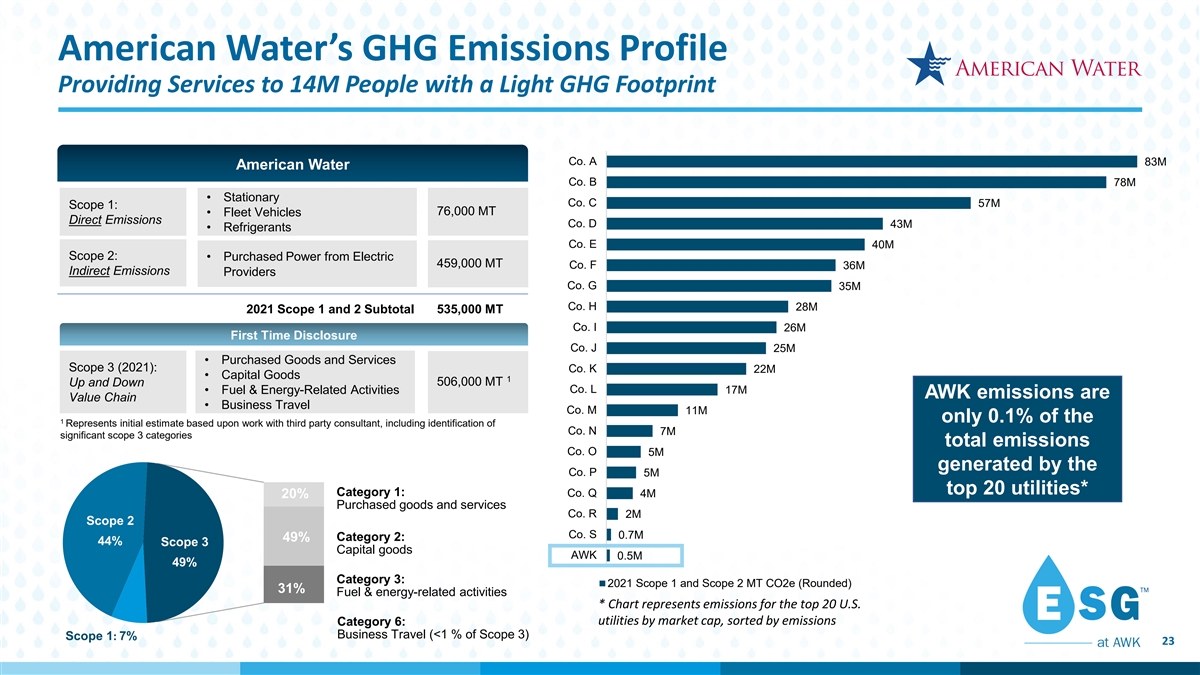
American Water’s GHG Emissions Profile Providing Services to 14M People with a Light GHG Footprint Co. A 83M American Water Co. B 78M • Stationary Co. C 57M Scope 1: 76,000 MT • Fleet Vehicles Direct Emissions Co. D 43M • Refrigerants Co. E 40M Scope 2: • Purchased Power from Electric 459,000 MT Co. F 36M Indirect Emissions Providers Co. G 35M Co. H 28M 2021 Scope 1 and 2 Subtotal 535,000 MT Co. I 26M First Time Disclosure Co. J 25M • Purchased Goods and Services Scope 3 (2021): Co. K 22M • Capital Goods 1 Up and Down 506,000 MT • Fuel & Energy-Related Activities Co. L 17M AWK emissions are Value Chain • Business Travel Co. M 11M only 0.1% of the 1 Represents initial estimate based upon work with third party consultant, including identification of Co. N 7M significant scope 3 categories total emissions Co. O 5M generated by the Co. P 5M top 20 utilities* Category 1: Co. Q 4M 20% 11% Purchased goods and services Co. R 2M Scope 2 Co. S 0.7M 11% 49% Category 2: 44% Scope 3 Capital goods AWK 0.5M 49% Category 3: 2021 Scope 1 and Scope 2 MT CO2e (Rounded) 31% Fuel & energy-related activities * Chart represents emissions for the top 20 U.S. utilities by market cap, sorted by emissions Category 6: Business Travel (<1 % of Scope 3) Scope 1: 7% 23
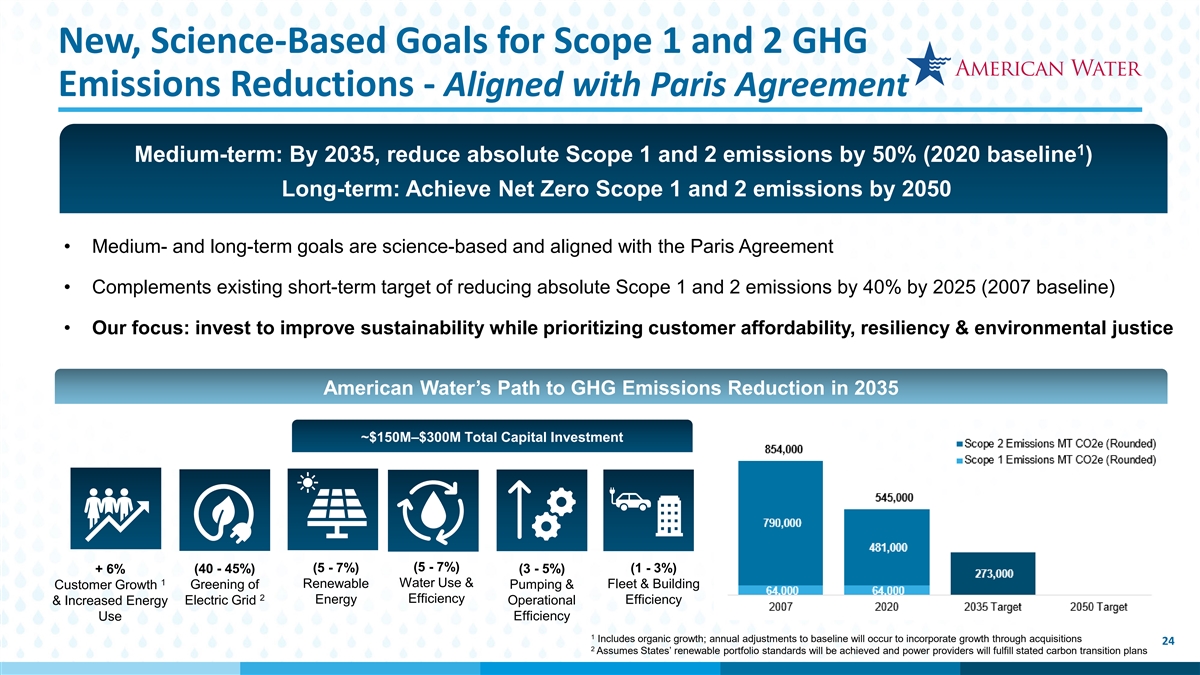
New, Science-Based Goals for Scope 1 and 2 GHG Emissions Reductions - Aligned with Paris Agreement 1 Medium-term: By 2035, reduce absolute Scope 1 and 2 emissions by 50% (2020 baseline ) Long-term: Achieve Net Zero Scope 1 and 2 emissions by 2050 • Medium- and long-term goals are science-based and aligned with the Paris Agreement • Complements existing short-term target of reducing absolute Scope 1 and 2 emissions by 40% by 2025 (2007 baseline) • Our focus: invest to improve sustainability while prioritizing customer affordability, resiliency & environmental justice American Water’s Path to GHG Emissions Reduction in 2035 ~$150M–$300M Total Capital Investment (5 - 7%) (5 - 7%) (1 - 3%) + 6% (40 - 45%) (3 - 5%) 1 Water Use & Greening of Renewable Pumping & Fleet & Building Customer Growth 2 Efficiency Energy Efficiency & Increased Energy Electric Grid Operational Efficiency Use 1 Includes organic growth; annual adjustments to baseline will occur to incorporate growth through acquisitions 24 2 Assumes States’ renewable portfolio standards will be achieved and power providers will fulfill stated carbon transition plans
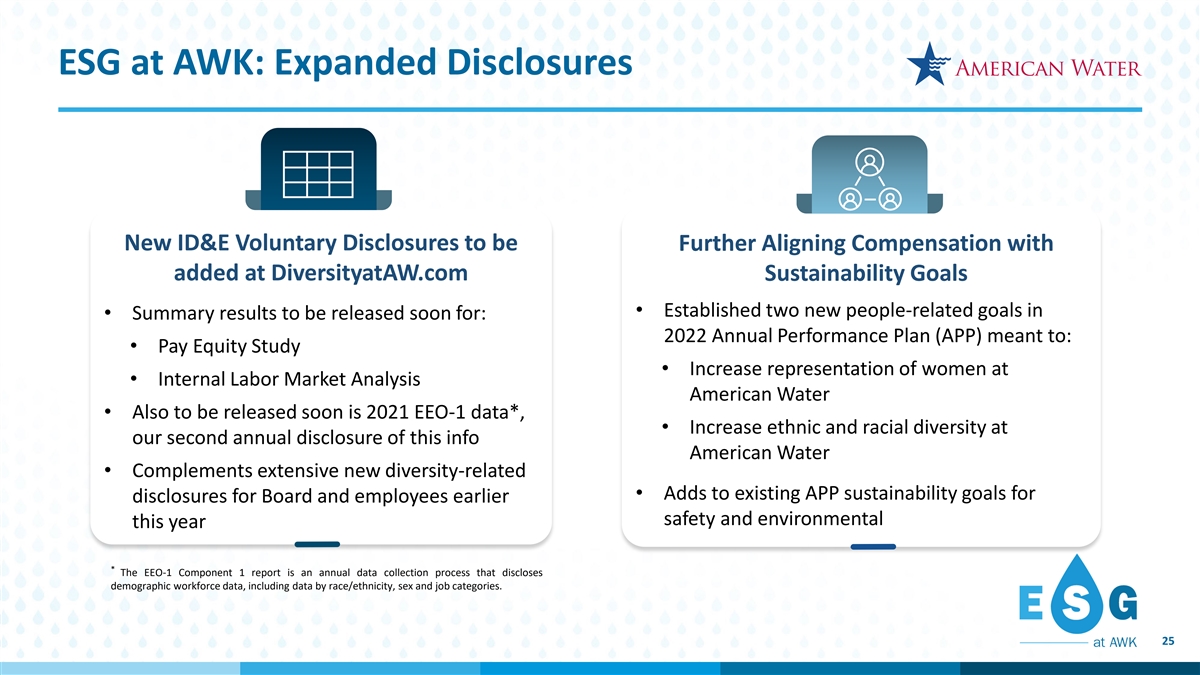
ESG at AWK: Expanded Disclosures New ID&E Voluntary Disclosures to be Further Aligning Compensation with added at DiversityatAW.com Sustainability Goals • Established two new people-related goals in • Summary results to be released soon for: 2022 Annual Performance Plan (APP) meant to: • Pay Equity Study • Increase representation of women at • Internal Labor Market Analysis American Water • Also to be released soon is 2021 EEO-1 data*, • Increase ethnic and racial diversity at our second annual disclosure of this info American Water • Complements extensive new diversity-related • Adds to existing APP sustainability goals for disclosures for Board and employees earlier safety and environmental this year * The EEO-1 Component 1 report is an annual data collection process that discloses demographic workforce data, including data by race/ethnicity, sex and job categories. 25

Q&A Session 26
Investor Relations Contacts Aaron Musgrave, CPA Jack Quinn, CPA Vice President, Investor Relations Senior Manager, Investor Relations aaron.musgrave@amwater.com jack.quinn@amwater.com Janelle McNally Kelley Uyeda Senior Manager, Investor Relations & ESG Analyst, Investor Relations & ESG janelle.mcnally@amwater.com kelley.uyeda@amwater.com Upcoming Event November 13-15, 2022 EEI Financial Conference 27

Appendix 28
Forward-Looking Statements Certain statements made, referred to or relied upon in this presentation including, without limitation, with respect to 2022 and 2023 earnings guidance, the Company’s long-term financial, growth and dividend targets, future capital needs and the timing and amount of the Company’s future public equity issuances, the ability to achieve the Company’s strategies and goals, including with respect to its ESG focus and related to the Company’s receipt of contingent consideration from the sale of HOS, the repayment of the seller note and the redeployment of the net proceeds from its divestitures, the outcome of the Company’s pending acquisition activity, the amount and allocation of projected capital expenditures; and estimated revenues from rate cases and other government agency authorizations, are forward-looking statements within the meaning of the safe harbor provisions of the Private Securities Litigation Reform Act of 1995 and the Federal securities laws. In some cases, these forward-looking statements can be identified by words with prospective meanings such as “intend,” “plan,” “estimate,” “believe,” “anticipate,” “expect,” “predict,” “project,” “propose,” “assume,” “forecast,” “outlook,” “likely,” “uncertain,” “future,” “pending,” “goal,” “objective,” “potential,” “continue,” “seek to,” “may,” “can,” “will,” “should” and “could” and or the negative of such terms or other variations or similar expressions. These forward-looking statements are predictions based on American Water’s current expectations and assumptions regarding future events. They are not guarantees or assurances of any outcomes, financial results, levels of activity, performance or achievements, and readers are cautioned not to place undue reliance upon them. The forward-looking statements are subject to a number of estimates and assumptions, and known and unknown risks, uncertainties and other factors. Actual results may differ materially from those discussed in the forward-looking statements included in this presentation as a result of the factors discussed in the Company’s Annual Report on Form 10-K for the year ended December 31, 2021, and subsequent filings with the SEC, and because of factors such as: the decisions of governmental and regulatory bodies, including decisions to raise or lower customer rates and regulatory responses to the COVID-19 pandemic; the timeliness and outcome of regulatory commissions’ and other authorities’ actions concerning rates, capital structure, authorized return on equity, capital investment, system acquisitions and dispositions, taxes, permitting, water supply and management, and other decisions; changes in customer demand for, and patterns of use of, water, such as may result from conservation efforts, impacts of the COVID-19 pandemic, or otherwise; a loss of one or more large industrial or commercial customers due to adverse economic conditions, the COVID-19 pandemic, or other factors; limitations on the availability of the Company’s water supplies or sources of water, or restrictions on its use thereof, resulting from allocation rights, governmental or regulatory requirements and restrictions, drought, overuse or other factors; changes in laws, governmental regulations and policies, including with respect to the environment, health and safety, water quality and water quality accountability, contaminants of emerging concern, public utility and tax regulations and policies, and impacts resulting from U.S., state and local elections and changes in federal, state and local executive administrations; the Company’s ability to collect, distribute, use, secure and store consumer data in compliance with current or future governmental laws, regulation and policies with respect to data and consumer privacy, security and protection; weather conditions and events, climate variability patterns, and natural disasters, including drought or abnormally high rainfall, prolonged and abnormal ice or freezing conditions, strong winds, coastal and intercoastal flooding, pandemics (including COVID-19) and epidemics, earthquakes, landslides, hurricanes, tornadoes, wildfires, electrical storms, sinkholes and solar flares; the outcome of litigation and similar governmental and regulatory proceedings, investigations or actions; the risks associated with the Company’s aging infrastructure, and its ability to appropriately improve the resiliency of, or maintain and replace, current or future infrastructure and systems, including its technology and other assets, and manage the expansion of its businesses; exposure or infiltration of the Company’s technology and critical infrastructure systems, including the disclosure of sensitive, personal or confidential information contained therein, through physical or cyber attacks or other means; the Company’s ability to obtain permits and other approvals for projects and construction of various water and wastewater facilities; changes in the Company’s capital requirements; the Company’s ability to control operating expenses and to achieve operating efficiencies; the intentional or unintentional actions of a third party, including contamination of the Company’s water supplies or the water provided to its customers; the Company’s ability to obtain adequate and cost-effective supplies of pipe, equipment (including personal protective equipment), chemicals, electricity, fuel, water and other raw materials and to address or mitigate supply chain constraints impacting the Company’s business operations; the Company’s ability to successfully meet its operational growth projections, either individually or in the aggregate, and capitalize on growth opportunities, including, among other things, with respect to acquiring, closing and successfully integrating regulated operations and market-based businesses, the Company’s Military Services Group entering into new contracts, price redeterminations and other agreements and contracts, and realizing anticipated benefits and synergies from new acquisitions; risks and uncertainties following the completion of the sale of HOS and the Company’s New York subsidiary; risks and uncertainties associated with contracting with the U.S. government, including ongoing compliance with applicable government procurement and security regulations; cost overruns relating to improvements in or the expansion of the Company’s operations; the Company’s ability to successfully develop and implement new technologies and to protect related intellectual property; the Company’s ability to maintain safe work sites; the Company’s exposure to liabilities related to environmental laws and similar matters resulting from, among other things, water and wastewater service provided to customers; changes in general economic, political, business and financial market conditions, including without limitation conditions and collateral consequences associated with COVID-19; access to sufficient debt and/or equity capital on satisfactory terms and when and as needed to support operations and capital expenditures; fluctuations in inflation or interest rates and the Company’s ability to address or mitigate the impacts thereof; the ability to comply with affirmative or negative covenants in the current or future indebtedness of the Company or any of its subsidiaries, or the issuance of new or modified credit ratings or outlooks or other communications by credit rating agencies with respect to the Company or any of its subsidiaries (or any current or future indebtedness thereof), which could increase financing costs or funding requirements and affect the Company’s or its subsidiaries’ ability to issue, repay or redeem debt, pay dividends or make distributions; fluctuations in the value of benefit plan assets and liabilities that could increase the Company’s cost and funding requirements; changes in federal or state general, income and other tax laws, including (i) future significant tax legislation; (ii) the availability of, or the Company’s compliance with, the terms of applicable tax credits and tax abatement programs; and (iii) the Company’s ability to utilize its state income tax net operating loss carryforwards; migration of customers into or out of the Company’s service territories; the use by municipalities of the power of eminent domain or other authority to condemn the systems of one or more of the Company’s utility subsidiaries, or the assertion by private landowners of similar rights against such utility subsidiaries; any difficulty or inability to obtain insurance for the Company, its inability to obtain insurance at acceptable rates and on acceptable terms and conditions, or its inability to obtain reimbursement under existing or future insurance programs and coverages for any losses sustained; the incurrence of impairment charges related to the Company’s goodwill or other assets; labor actions, including work stoppages and strikes; the Company’s ability to retain and attract qualified employees; civil disturbances or unrest, or terrorist threats or acts, or public apprehension about future disturbances, unrest, or terrorist threats or acts; and the impact of new, and changes to existing, accounting standards. These forward-looking statements are qualified by, and should be read together with, the risks and uncertainties set forth above and the risk factors included in American Water’s annual, quarterly and other SEC filings, and readers should refer to such risks, uncertainties and risk factors in evaluating such forward-looking statements. Any forward-looking statements American Water makes speak only as of the date of this presentation. American Water does not have or undertake any obligation or intention to update or revise any forward-looking statement, whether as a result of new information, future events, changed circumstances or otherwise, except as otherwise required by the federal securities laws. New factors emerge from time to time, 29 and it is not possible for the Company to predict all such factors. Furthermore, it may not be possible to assess the impact of any such factor on the Company’s businesses, either viewed independently or together, or the extent to which any factor, or combination of factors, may cause results to differ materially from those contained in any forward-looking statement. The foregoing factors should not be construed as exhaustive.
Non-GAAP Financial Information This presentation includes adjusted regulated O&M efficiency ratios, both historical and forward-looking, which exclude from their calculation (i) estimated purchased water and other revenues and purchased water expenses, (ii) the impact of the Freedom Industries chemical spill in 2014 and certain related settlement activities recognized in 2016 and 2018, (iii) the estimated impact in 2012 and 2014 of weather, (iv) as to operating revenues, the amortization of excess accumulated deferred income taxes, and (v) the allocable portion of non-O&M support services costs, mainly depreciation and general taxes. Also, an alternative presentation of these ratios has been provided for each of 2010, 2012, 2014 and 2016, which includes a pro forma adjustment for the impact of the Tax Cuts and Jobs Act of 2017, and includes for 2012, 2014 and 2016 the impact of our implementation of Accounting Standards Update 2017-07, Compensation - Retirement Benefits (Topic 715): Improving the Presentation of Net Periodic Pension Cost and Net Periodic Post-retirement Benefit, on January 1, 2018. These items were excluded from the O&M efficiency ratio calculation as they are not reflective of management’s ability to increase the efficiency of our regulated businesses. For that reason, these adjusted regulated O&M efficiency ratios constitute “non-GAAP financial measures” under SEC rules. We evaluate our operating performance using these ratios and believe that the presentation of them is useful to investors because the ratios directly measure improvement in the operating performance and efficiency of our regulated businesses. These ratios are derived from our consolidated financial information but are not presented in our consolidated financial statements prepared in accordance with GAAP. These non-GAAP financial measures supplement and should be read in conjunction with our GAAP disclosures and should be considered as an addition to, and not a substitute for, any GAAP measure. These ratios (i) are not accounting measures based on GAAP; (ii) are not based on a standard, objective industry definition or method of calculation; (iii) may not be comparable to other companies’ operating measures; and (iv) should not be used in place of the GAAP information provided elsewhere in this presentation. Management is unable to present a reconciliation of adjustments to the components of the forward-looking adjusted regulated O&M efficiency ratio without unreasonable effort because management cannot reliably predict the nature, amount or probable significance of all the adjustments for future periods; however, these adjustments may, individually or in the aggregate, cause each of the non-GAAP financial measure components of the forward-looking ratios to differ significantly from the most directly comparable GAAP financial measure. Set forth in this appendix are tables that reconcile each of the components of our historical adjusted regulated O&M efficiency ratios to its most directly comparable GAAP financial measure. All references throughout this presentation to EPS or earnings per share refer to diluted EPS attributable to common shareholders. 30
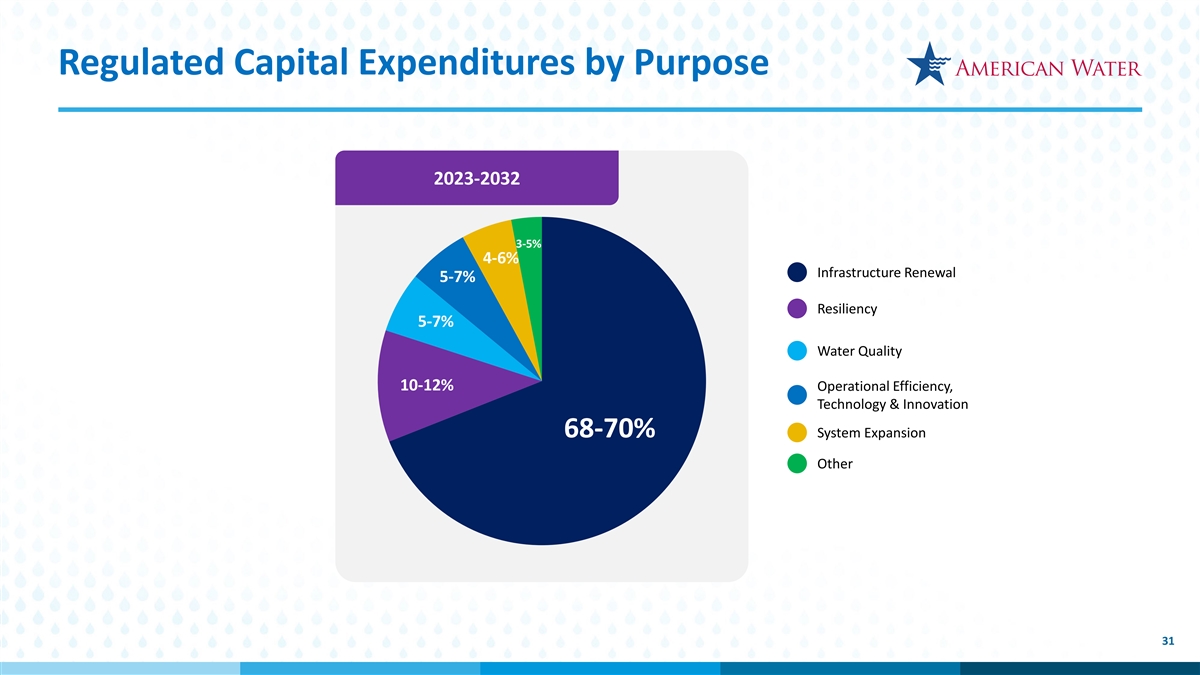
Regulated Capital Expenditures by Purpose 2023-2032 3-5% 4-6% Infrastructure Renewal 5-7% Resiliency 5-7% Water Quality 10-12% Operational Efficiency, Technology & Innovation 68-70% System Expansion Other 31
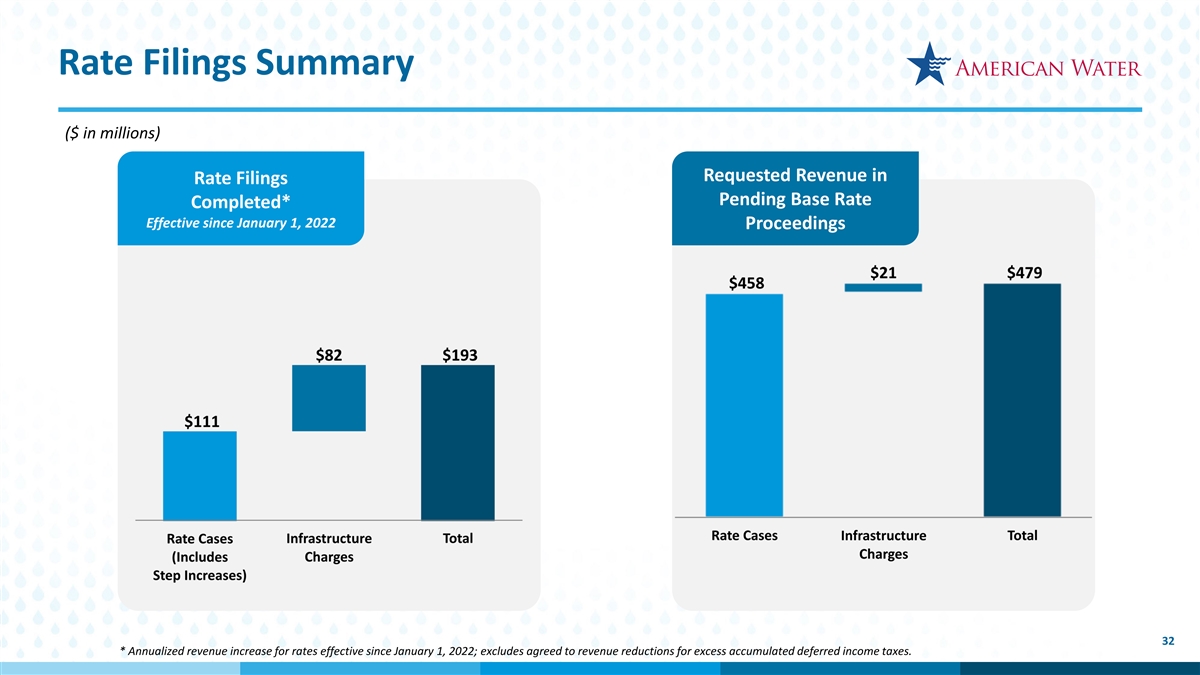
Rate Filings Summary ($ in millions) Requested Revenue in Rate Filings Pending Base Rate Completed* Effective since January 1, 2022 Proceedings 32 * Annualized revenue increase for rates effective since January 1, 2022; excludes agreed to revenue reductions for excess accumulated deferred income taxes.
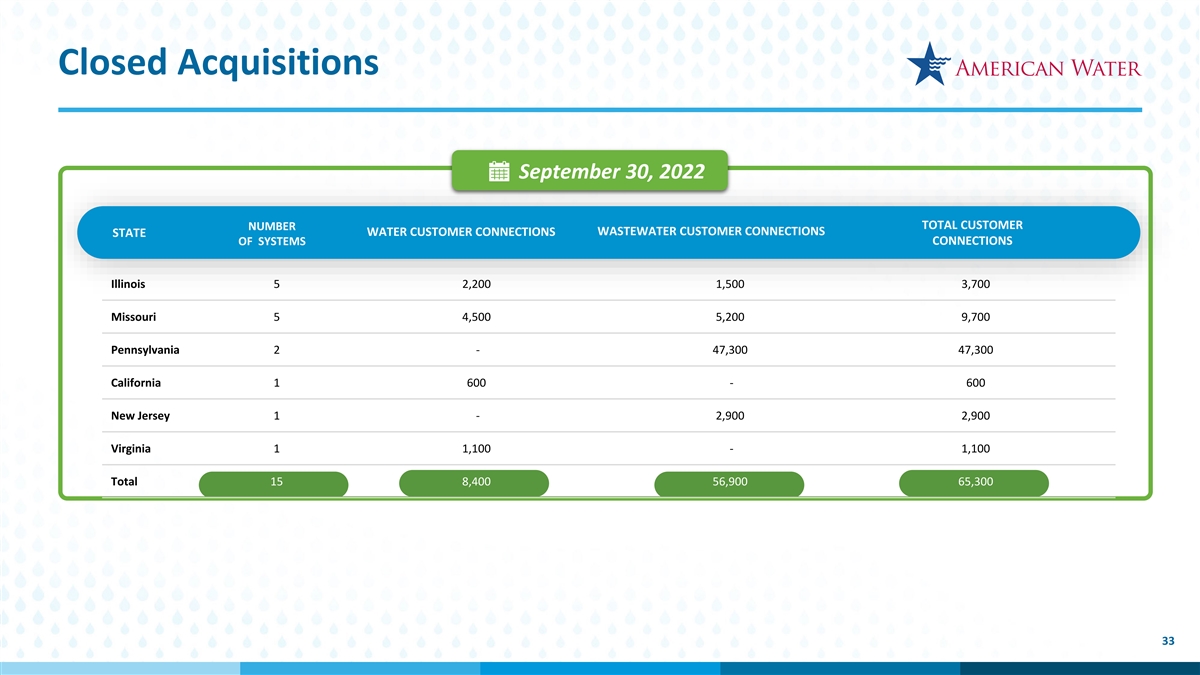
Closed Acquisitions September 30, 2022 TOTAL CUSTOMER NUMBER WASTEWATER CUSTOMER CONNECTIONS WATER CUSTOMER CONNECTIONS STATE OF SYSTEMS CONNECTIONS Illinois 5 2,200 1,500 3,700 Missouri 5 4,500 5,200 9,700 Pennsylvania 2 - 47,300 47,300 California 1 600 - 600 New Jersey 1 - 2,900 2,900 Virginia 1 1,100 - 1,100 Total 15 8,400 56,900 65,300 33
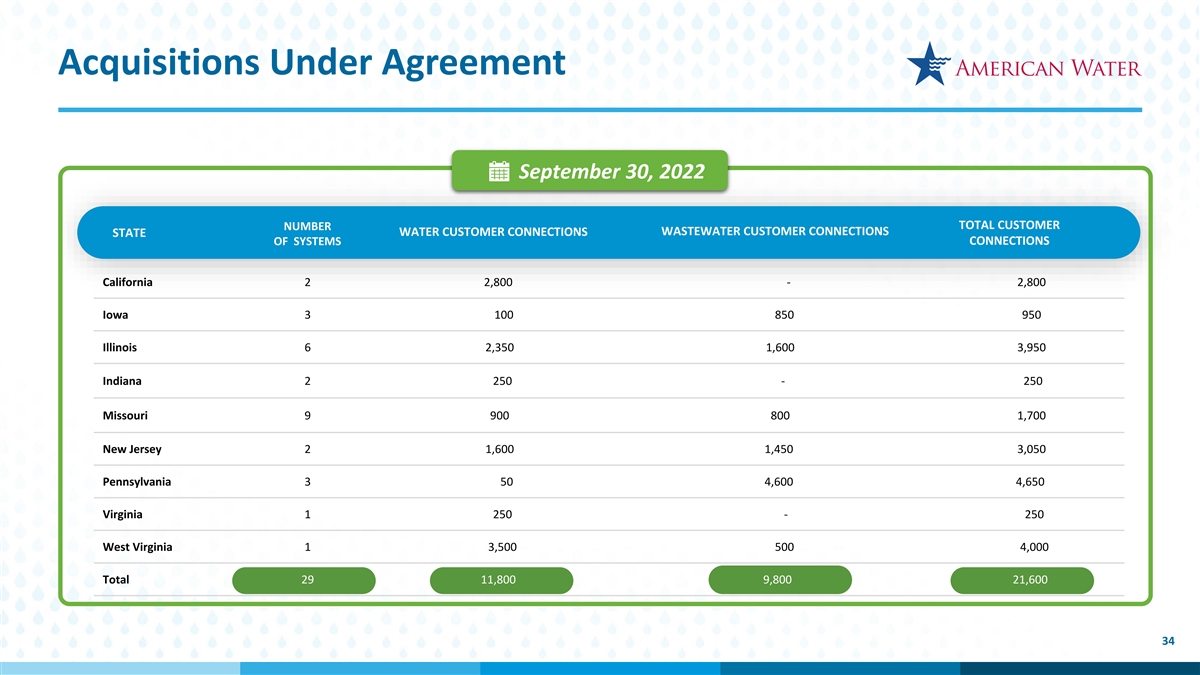
Acquisitions Under Agreement September 30, 2022 TOTAL CUSTOMER NUMBER WASTEWATER CUSTOMER CONNECTIONS WATER CUSTOMER CONNECTIONS STATE OF SYSTEMS CONNECTIONS California 2 2,800 - 2,800 Iowa 3 100 850 950 Illinois 6 2,350 1,600 3,950 Indiana 2 250 - 250 Missouri 9 900 800 1,700 New Jersey 2 1,600 1,450 3,050 Pennsylvania 3 50 4,600 4,650 Virginia 1 250 - 250 West Virginia 1 3,500 500 4,000 Total 29 11,800 9,800 21,600 34
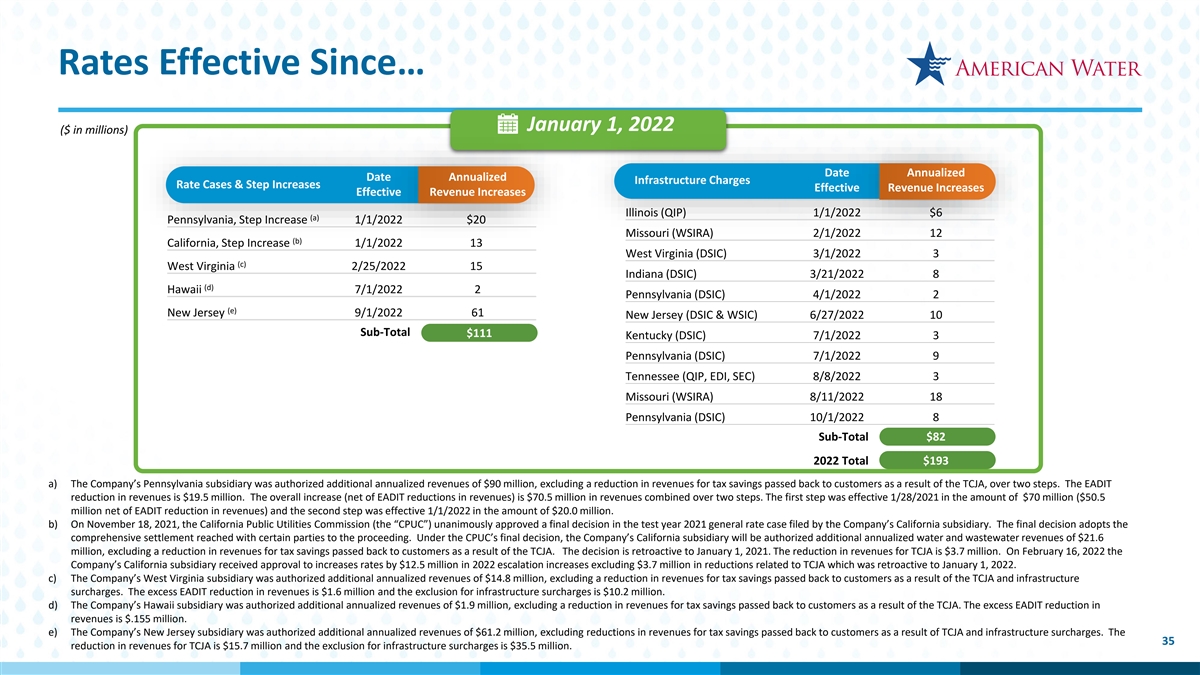
Rates Effective Since… January 1, 2022 ($ in millions) Date Annualized Date Annualized Infrastructure Charges Rate Cases & Step Increases Effective Revenue Increases Effective Revenue Increases Illinois (QIP) 1/1/2022 $6 (a) Pennsylvania, Step Increase 1/1/2022 $20 Missouri (WSIRA) 2/1/2022 12 (b) California, Step Increase 1/1/2022 13 West Virginia (DSIC) 3/1/2022 3 (c) West Virginia 2/25/2022 15 Indiana (DSIC) 3/21/2022 8 (d) Hawaii 7/1/2022 2 Pennsylvania (DSIC) 4/1/2022 2 (e) New Jersey 9/1/2022 61 New Jersey (DSIC & WSIC) 6/27/2022 10 Sub-Total $111 Kentucky (DSIC) 7/1/2022 3 Pennsylvania (DSIC) 7/1/2022 9 Tennessee (QIP, EDI, SEC) 8/8/2022 3 Missouri (WSIRA) 8/11/2022 18 Pennsylvania (DSIC) 10/1/2022 8 Sub-Total $82 2022 Total $193 a) The Company’s Pennsylvania subsidiary was authorized additional annualized revenues of $90 million, excluding a reduction in revenues for tax savings passed back to customers as a result of the TCJA, over two steps. The EADIT reduction in revenues is $19.5 million. The overall increase (net of EADIT reductions in revenues) is $70.5 million in revenues combined over two steps. The first step was effective 1/28/2021 in the amount of $70 million ($50.5 million net of EADIT reduction in revenues) and the second step was effective 1/1/2022 in the amount of $20.0 million. b) On November 18, 2021, the California Public Utilities Commission (the “CPUC”) unanimously approved a final decision in the test year 2021 general rate case filed by the Company’s California subsidiary. The final decision adopts the comprehensive settlement reached with certain parties to the proceeding. Under the CPUC’s final decision, the Company’s California subsidiary will be authorized additional annualized water and wastewater revenues of $21.6 million, excluding a reduction in revenues for tax savings passed back to customers as a result of the TCJA. The decision is retroactive to January 1, 2021. The reduction in revenues for TCJA is $3.7 million. On February 16, 2022 the Company’s California subsidiary received approval to increases rates by $12.5 million in 2022 escalation increases excluding $3.7 million in reductions related to TCJA which was retroactive to January 1, 2022. c) The Company’s West Virginia subsidiary was authorized additional annualized revenues of $14.8 million, excluding a reduction in revenues for tax savings passed back to customers as a result of the TCJA and infrastructure surcharges. The excess EADIT reduction in revenues is $1.6 million and the exclusion for infrastructure surcharges is $10.2 million. d) The Company’s Hawaii subsidiary was authorized additional annualized revenues of $1.9 million, excluding a reduction in revenues for tax savings passed back to customers as a result of the TCJA. The excess EADIT reduction in revenues is $.155 million. e) The Company’s New Jersey subsidiary was authorized additional annualized revenues of $61.2 million, excluding reductions in revenues for tax savings passed back to customers as a result of TCJA and infrastructure surcharges. The 35 reduction in revenues for TCJA is $15.7 million and the exclusion for infrastructure surcharges is $35.5 million.
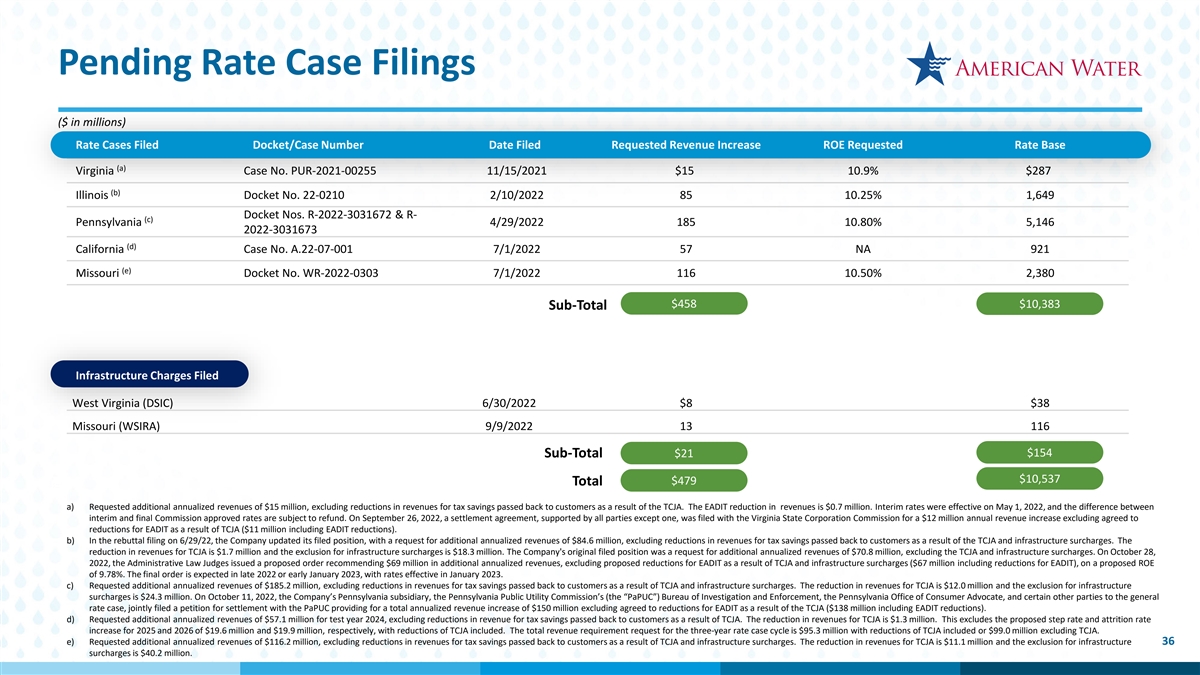
Pending Rate Case Filings ($ in millions) Rate Cases Filed Docket/Case Number Date Filed Requested Revenue Increase ROE Requested Rate Base (a) Virginia Case No. PUR-2021-00255 11/15/2021 $15 10.9% $287 (b) Illinois Docket No. 22-0210 2/10/2022 85 10.25% 1,649 Docket Nos. R-2022-3031672 & R- (c) Pennsylvania 4/29/2022 185 10.80% 5,146 2022-3031673 (d) California Case No. A.22-07-001 7/1/2022 57 NA 921 (e) Missouri Docket No. WR-2022-0303 7/1/2022 116 10.50% 2,380 $458 $10,383 Sub-Total Infrastructure Charges Filed West Virginia (DSIC) 6/30/2022 $8 $38 Missouri (WSIRA) 9/9/2022 13 116 $154 Sub-Total $21 $10,537 $479 Total a) Requested additional annualized revenues of $15 million, excluding reductions in revenues for tax savings passed back to customers as a result of the TCJA. The EADIT reduction in revenues is $0.7 million. Interim rates were effective on May 1, 2022, and the difference between interim and final Commission approved rates are subject to refund. On September 26, 2022, a settlement agreement, supported by all parties except one, was filed with the Virginia State Corporation Commission for a $12 million annual revenue increase excluding agreed to reductions for EADIT as a result of TCJA ($11 million including EADIT reductions). b) In the rebuttal filing on 6/29/22, the Company updated its filed position, with a request for additional annualized revenues of $84.6 million, excluding reductions in revenues for tax savings passed back to customers as a result of the TCJA and infrastructure surcharges. The reduction in revenues for TCJA is $1.7 million and the exclusion for infrastructure surcharges is $18.3 million. The Company's original filed position was a request for additional annualized revenues of $70.8 million, excluding the TCJA and infrastructure surcharges. On October 28, 2022, the Administrative Law Judges issued a proposed order recommending $69 million in additional annualized revenues, excluding proposed reductions for EADIT as a result of TCJA and infrastructure surcharges ($67 million including reductions for EADIT), on a proposed ROE of 9.78%. The final order is expected in late 2022 or early January 2023, with rates effective in January 2023. c) Requested additional annualized revenues of $185.2 million, excluding reductions in revenues for tax savings passed back to customers as a result of TCJA and infrastructure surcharges. The reduction in revenues for TCJA is $12.0 million and the exclusion for infrastructure surcharges is $24.3 million. On October 11, 2022, the Company’s Pennsylvania subsidiary, the Pennsylvania Public Utility Commission’s (the “PaPUC”) Bureau of Investigation and Enforcement, the Pennsylvania Office of Consumer Advocate, and certain other parties to the general rate case, jointly filed a petition for settlement with the PaPUC providing for a total annualized revenue increase of $150 million excluding agreed to reductions for EADIT as a result of the TCJA ($138 million including EADIT reductions). d) Requested additional annualized revenues of $57.1 million for test year 2024, excluding reductions in revenue for tax savings passed back to customers as a result of TCJA. The reduction in revenues for TCJA is $1.3 million. This excludes the proposed step rate and attrition rate increase for 2025 and 2026 of $19.6 million and $19.9 million, respectively, with reductions of TCJA included. The total revenue requirement request for the three-year rate case cycle is $95.3 million with reductions of TCJA included or $99.0 million excluding TCJA. e) Requested additional annualized revenues of $116.2 million, excluding reductions in revenues for tax savings passed back to customers as a result of TCJA and infrastructure surcharges. The reduction in revenues for TCJA is $11.1 million and the exclusion for infrastructure 36 surcharges is $40.2 million.
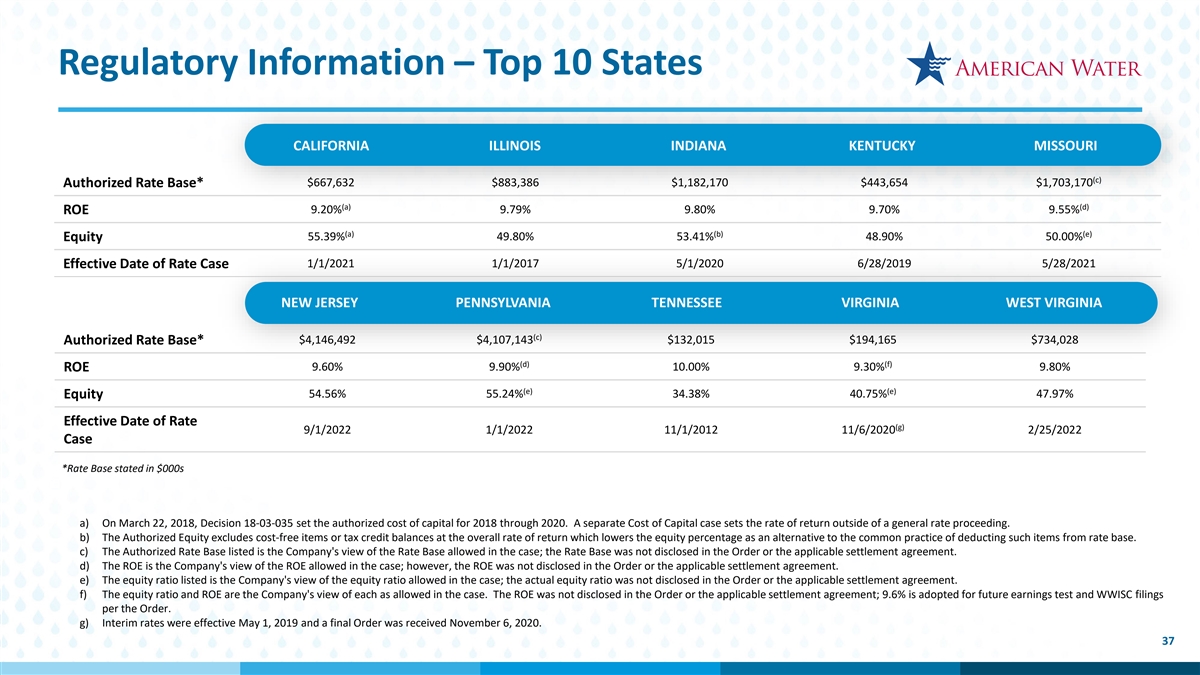
Regulatory Information – Top 10 States CALIFORNIA ILLINOIS INDIANA KENTUCKY MISSOURI (c) $667,632 $883,386 $1,182,170 $443,654 $1,703,170 Authorized Rate Base* (a) (d) 9.20% 9.79% 9.80% 9.70% 9.55% ROE (a) (b) (e) 55.39% 49.80% 53.41% 48.90% 50.00% Equity 1/1/2021 1/1/2017 5/1/2020 6/28/2019 5/28/2021 Effective Date of Rate Case NEW JERSEY PENNSYLVANIA TENNESSEE VIRGINIA WEST VIRGINIA (c) $4,146,492 $4,107,143 $132,015 $194,165 $734,028 Authorized Rate Base* (d) (f) ROE 9.60% 9.90% 10.00% 9.30% 9.80% (e) (e) 54.56% 55.24% 34.38% 40.75% 47.97% Equity Effective Date of Rate (g) 9/1/2022 1/1/2022 11/1/2012 11/6/2020 2/25/2022 Case *Rate Base stated in $000s a) On March 22, 2018, Decision 18-03-035 set the authorized cost of capital for 2018 through 2020. A separate Cost of Capital case sets the rate of return outside of a general rate proceeding. b) The Authorized Equity excludes cost-free items or tax credit balances at the overall rate of return which lowers the equity percentage as an alternative to the common practice of deducting such items from rate base. c) The Authorized Rate Base listed is the Company's view of the Rate Base allowed in the case; the Rate Base was not disclosed in the Order or the applicable settlement agreement. d) The ROE is the Company's view of the ROE allowed in the case; however, the ROE was not disclosed in the Order or the applicable settlement agreement. e) The equity ratio listed is the Company's view of the equity ratio allowed in the case; the actual equity ratio was not disclosed in the Order or the applicable settlement agreement. f) The equity ratio and ROE are the Company's view of each as allowed in the case. The ROE was not disclosed in the Order or the applicable settlement agreement; 9.6% is adopted for future earnings test and WWISC filings per the Order. g) Interim rates were effective May 1, 2019 and a final Order was received November 6, 2020. 37
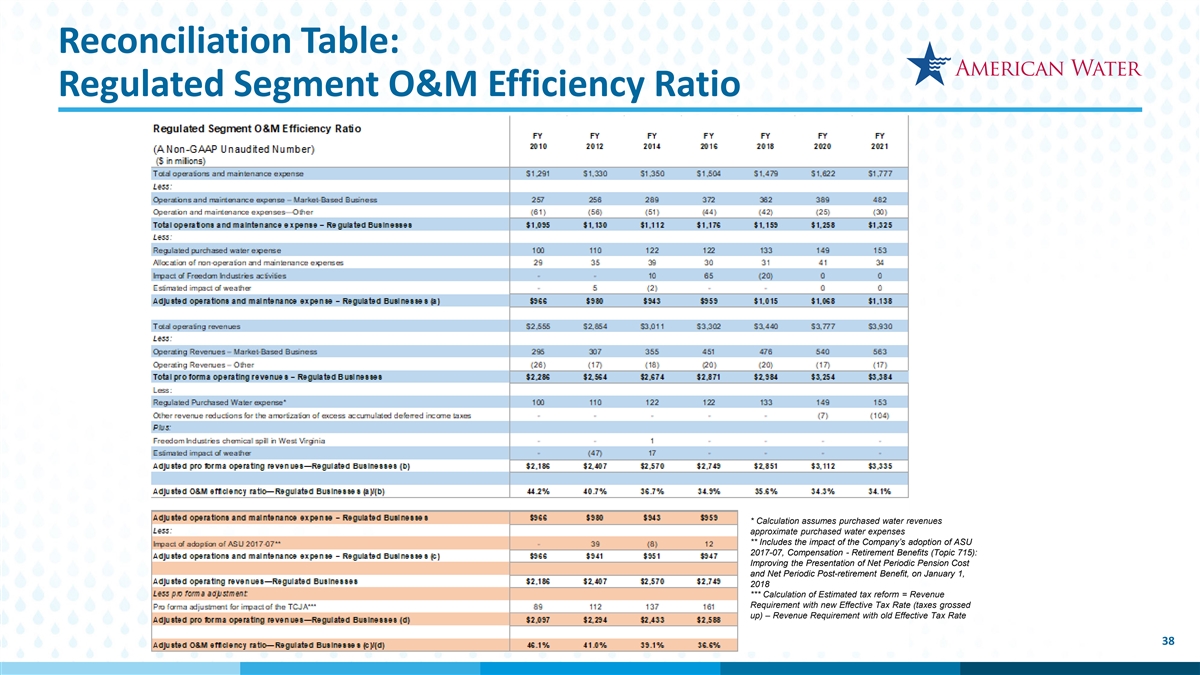
Reconciliation Table: Regulated Segment O&M Efficiency Ratio * Calculation assumes purchased water revenues approximate purchased water expenses ** Includes the impact of the Company’s adoption of ASU 2017-07, Compensation - Retirement Benefits (Topic 715): Improving the Presentation of Net Periodic Pension Cost and Net Periodic Post-retirement Benefit, on January 1, 2018 *** Calculation of Estimated tax reform = Revenue Requirement with new Effective Tax Rate (taxes grossed up) – Revenue Requirement with old Effective Tax Rate 38