EXHIBIT 99.1 Portfolio Update Meeting March 11, 2020 1
The information contained herein should be read in conjunction with, and is qualified by, the information in KBS Real Estate Investment Trust II’s (the “Company” or “KBS REIT II”) Annual Report on Form 10-K for the year ended Important December 31, 2019 (the “Annual Report”), including the “Risk Factors” contained therein. For a full description of the limitations, methodologies and assumptions used to value KBS REIT II’s assets and liabilities in connection with the calculation of KBS REIT II’s November 2019 estimated value per share and the calculation of estimated net proceeds from liquidation, see Current Report on Form 8-K, filed with the SEC on November 15, 2019 (the “Valuation 8-K”). For information regarding the March 2020 updated estimated value per Disclosures share, see the Annual Report. Forward-Looking Statements Certain statements contained herein may be deemed to be forward-looking statements within the meaning of the Federal Private Securities Litigation Reform Act of 1995. The Company intends that such forward-looking statements be subject to the safe harbors created by Section 21E of the Securities Exchange Act of 1934, as amended. These statements include statements regarding the intent, belief or current expectations of the Company and members of its management team, as well as the assumptions on which such statements are based, and generally are identified by the use of words such as “may,” “will,” “seeks,” “anticipates,” “believes,” “estimates,” “expects,” “plans,” “intends,” “should” or similar expressions. Readers are cautioned not to place undue reliance on these forward-looking statements, which speak only as of the date they are made. The Company undertakes no obligation to update or revise forward-looking statements to reflect changed assumptions, the occurrence of unanticipated events or changes to future operating results over time, unless required by law. Such statements are subject to known and unknown risks and uncertainties which could cause actual results to differ materially from those contemplated by such forward-looking statements. The Company makes no representation or warranty (express or implied) about the accuracy of any such forward-looking statements. These statements are based on a number of assumptions involving the judgment of management. On November 13, 2019, in connection with a review of potential strategic alternatives available to KBS REIT II, the Special Committee and board of directors of KBS REIT II unanimously approved the sale of all of KBS REIT II’s assets and its dissolution pursuant to the terms of KBS REIT II’s plan of complete liquidation and dissolution (the “Plan of Liquidation”). The principal purpose of the Plan of Liquidation is to provide liquidity to stockholders by selling KBS REIT II’s assets, paying its debts and distributing the net proceeds from liquidation to stockholders. On March 5, 2020, KBS REIT II’s stockholders approved the Plan of Liquidation. For more information, see the Plan of Liquidation, which is included as an exhibit to the Annual Report. There are many factors that may affect the amount of liquidating distributions ultimately paid to KBS REIT II’s stockholders, including, among other things, the ultimate sale price of each asset, changes in market demand for office properties during the sales process, the amount of taxes, transaction fees and expenses relating to the liquidation and dissolution, and unanticipated or contingent liabilities that could arise. No assurance can be given as to the amount or timing of liquidating distributions KBS REIT II will ultimately pay to its stockholders. If KBS REIT II underestimated its existing obligations and liabilities or if unanticipated or contingent liabilities arise, the amount of liquidating distributions ultimately paid to KBS REIT II’s stockholders could be less than estimated. Actual events may cause the value and returns on the Company’s investments to be less than that used for purposes of the Company’s estimated NAV per share and estimated net proceeds from liquidation. With respect to the estimated NAV per share, the appraisal methodology used for the appraised properties assumes the properties realize the projected net operating income and expected exit cap rates and that investors would be willing to invest in such properties at yields equal to the expected discount rates. Though the appraisals of the appraised properties, with respect to CBRE, and the valuation estimates used in calculating the estimated value per share, with respect to the Company’s advisor and the Company, are the respective party’s best estimates as of September 30, 2019 and November 13, 2019, as applicable, the Company can give no assurance in this regard. Even small changes to these assumptions could result in significant differences in the appraised values of the appraised properties, the estimated value per share and the estimated net proceeds from liquidation. The statements herein also depend on factors such as: future economic, competitive and market conditions; the Company’s ability to maintain and/or improve occupancy levels and rental rates at its real estate properties during the liquidation; the Company’s ability to sell its real estate properties at the times and at the prices it expects; the Company’s ability to successfully negotiate modifications, extensions or any needed refinancing of its debt obligations; the Company’s ability to successfully implement the Plan of Liquidation; and other risks identified in Part I, Item 1A of the Company’s Annual Report. WWW. KBS.COM 2
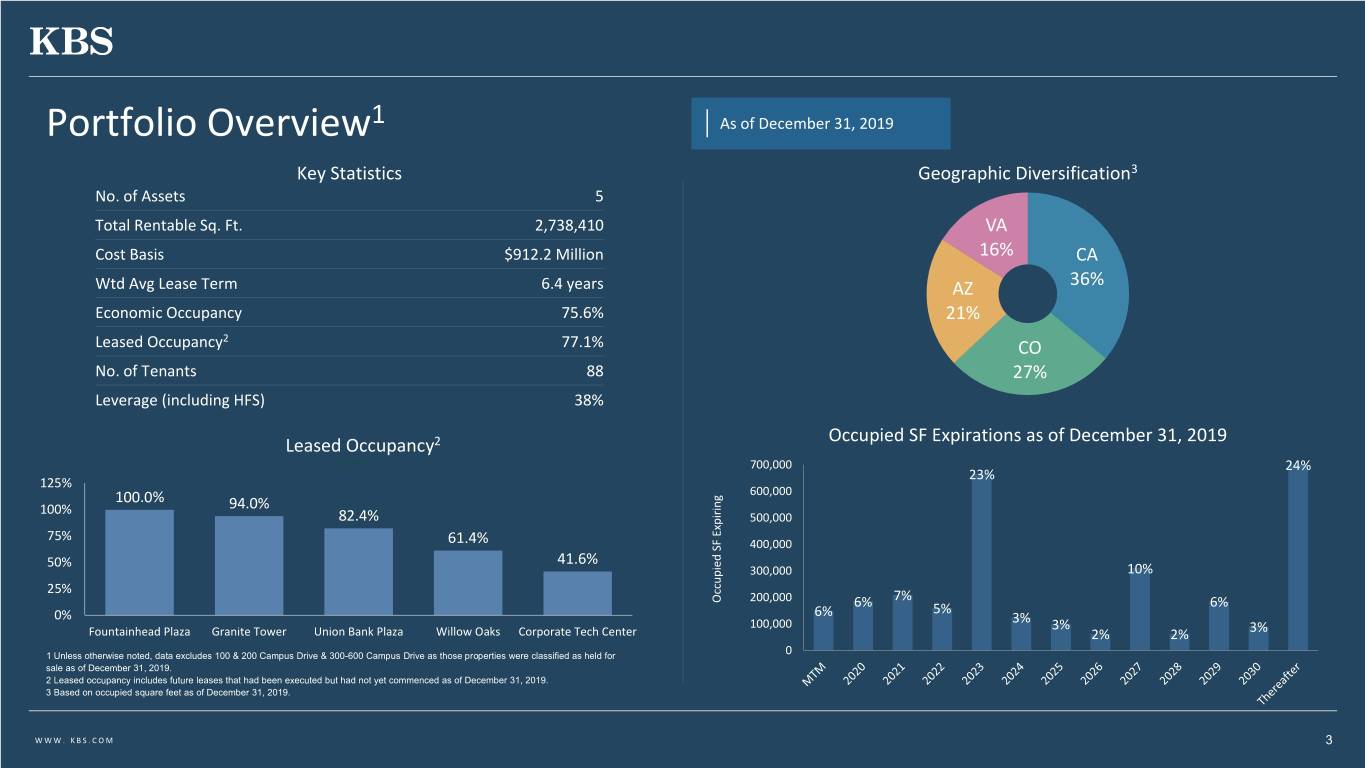
1 Portfolio Overview As of December 31, 2019 Key Statistics Geographic Diversification3 No. of Assets 5 Total Rentable Sq. Ft. 2,738,410 VA Cost Basis $912.2 Million 16% CA Wtd Avg Lease Term 6.4 years AZ 36% Economic Occupancy 75.6% 21% 2 Leased Occupancy 77.1% CO No. of Tenants 88 27% Leverage (including HFS) 38% Occupied SF Expirations as of December 31, 2019 Leased Occupancy2 Region 1 700,000 24% 23% 125% 100.0% 600,000 100% 94.0% 82.4% 500,000 75% 61.4% 400,000 50% 41.6% 300,000 10% 25% Occupied SF SF Expiring Occupied 200,000 6% 7% 6% 0% 6% 5% 100,000 3% 3% Fountainhead Plaza Granite Tower Union Bank Plaza Willow Oaks Corporate Tech Center 2% 2% 3% 1 Unless otherwise noted, data excludes 100 & 200 Campus Drive & 300-600 Campus Drive as those properties were classified as held for 0 sale as of December 31, 2019. 2 Leased occupancy includes future leases that had been executed but had not yet commenced as of December 31, 2019. 3 Based on occupied square feet as of December 31, 2019. WWW. KBS.COM 3

1 Tenancy Overview As of December 31, 2019 3 Leased2 SF Industry Diversification Top 10 Tenants Industry Property % of Portfolio Educational The University of Phoenix Fountainhead Plaza 21.5% Services Mining, Oil & Gas Anadarko Petroleum Corporation Granite Tower 17.4% Extraction Union Bank Finance Union Bank 14.9% Public Fairfax County School Board Willow Oaks 5.9% Administration Computer Systems NXP USA, Inc Corporate Tech Centre 4.7% Design Computer Systems CDK Global, Inc Corporate Tech Centre 3.7% Design Personal Capital Advisors Corp. Finance Granite Tower 1.5% Everwest Real Estate Investors Real Estate Granite Tower 1.1% Robinson, Waters & O’Drisio Legal Services Granite Tower 1.0% Yoka & Smith, LLP Legal Services Union Bank 0.9% TOTAL (based on total occupied square feet) 72.7% Weighted Average Lease Term (Top 10 Tenants) 7.5 years 1 Unless otherwise noted, data excludes 100 & 200 Campus Drive & 300-600 Campus Drive as those properties were classified as held for sale as of December 31, 2019. 2 Leased occupancy includes future leases that had been executed but had not yet commenced as of December 31, 2019. 3 Based on occupied square feet as of December 31, 2019. 4 Includes various other industries that individually represent less than 3%. WWW. KBS.COM 4

Campus Drive Buildings Sale Campus Drive Buildings (100 & 200 Campus Drive and 300-600 Campus Drive) Both Campus Drive buildings were sold on January 22, 2020 for a gross sale price of $311.0 million and net proceeds after debt paydown of approximately $160 million. The sale was completed at a price consistent with the November 2019 valuation of the property. WWW. KBS.COM 5
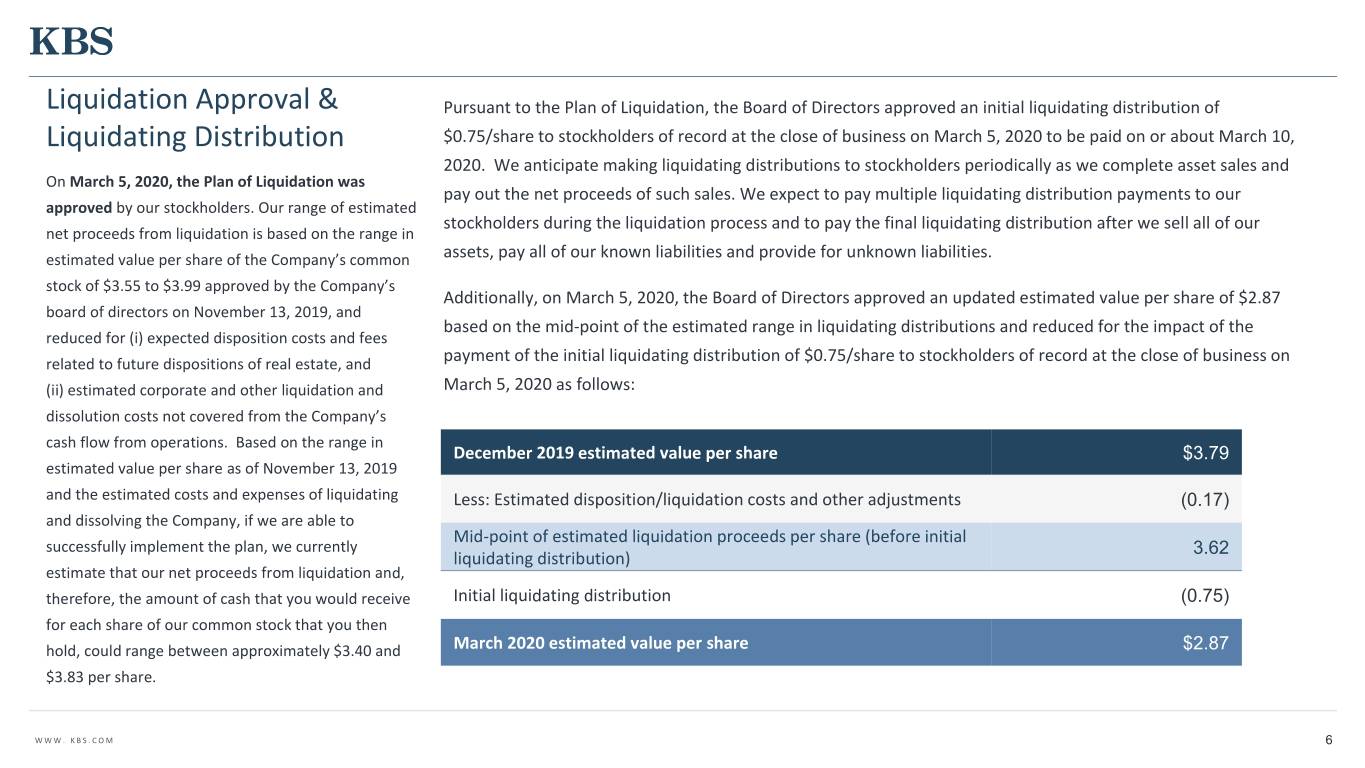
Liquidation Approval & Pursuant to the Plan of Liquidation, the Board of Directors approved an initial liquidating distribution of Liquidating Distribution $0.75/share to stockholders of record at the close of business on March 5, 2020 to be paid on or about March 10, 2020. We anticipate making liquidating distributions to stockholders periodically as we complete asset sales and On March 5, 2020, the Plan of Liquidation was pay out the net proceeds of such sales. We expect to pay multiple liquidating distribution payments to our approved by our stockholders. Our range of estimated stockholders during the liquidation process and to pay the final liquidating distribution after we sell all of our net proceeds from liquidation is based on the range in estimated value per share of the Company’s common assets, pay all of our known liabilities and provide for unknown liabilities. stock of $3.55 to $3.99 approved by the Company’s Additionally, on March 5, 2020, the Board of Directors approved an updated estimated value per share of $2.87 board of directors on November 13, 2019, and based on the mid-point of the estimated range in liquidating distributions and reduced for the impact of the reduced for (i) expected disposition costs and fees related to future dispositions of real estate, and payment of the initial liquidating distribution of $0.75/share to stockholders of record at the close of business on (ii) estimated corporate and other liquidation and March 5, 2020 as follows: dissolution costs not covered from the Company’s cash flow from operations. Based on the range in December 2019 estimated value per share $3.79 estimated value per share as of November 13, 2019 and the estimated costs and expenses of liquidating Less: Estimated disposition/liquidation costs and other adjustments (0.17) and dissolving the Company, if we are able to Mid-point of estimated liquidation proceeds per share (before initial successfully implement the plan, we currently 3.62 liquidating distribution) estimate that our net proceeds from liquidation and, therefore, the amount of cash that you would receive Initial liquidating distribution (0.75) for each share of our common stock that you then hold, could range between approximately $3.40 and March 2020 estimated value per share $2.87 $3.83 per share. WWW. KBS.COM 6
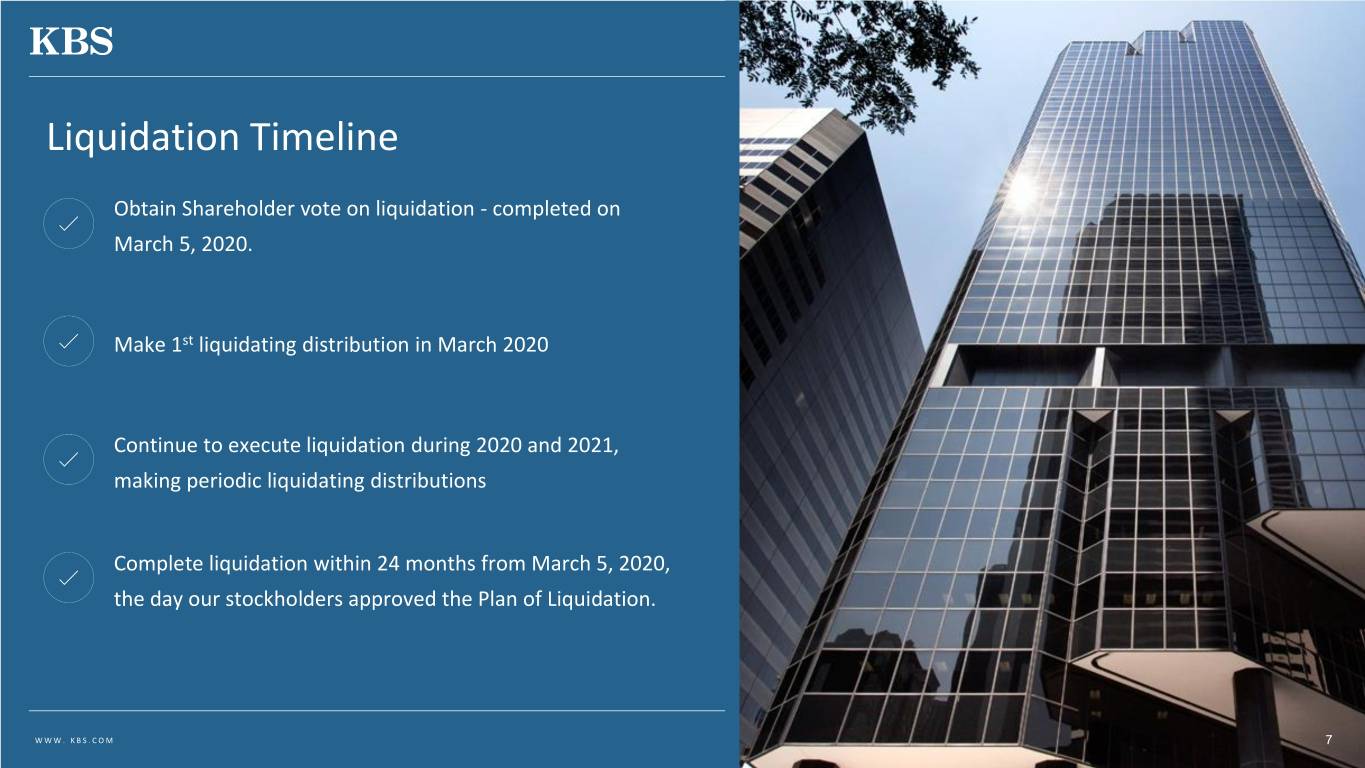
Liquidation Timeline Obtain Shareholder vote on liquidation - completed on March 5, 2020. Make 1st liquidating distribution in March 2020 Continue to execute liquidation during 2020 and 2021, making periodic liquidating distributions Complete liquidation within 24 months from March 5, 2020, the day our stockholders approved the Plan of Liquidation. WWW. KBS.COM 7
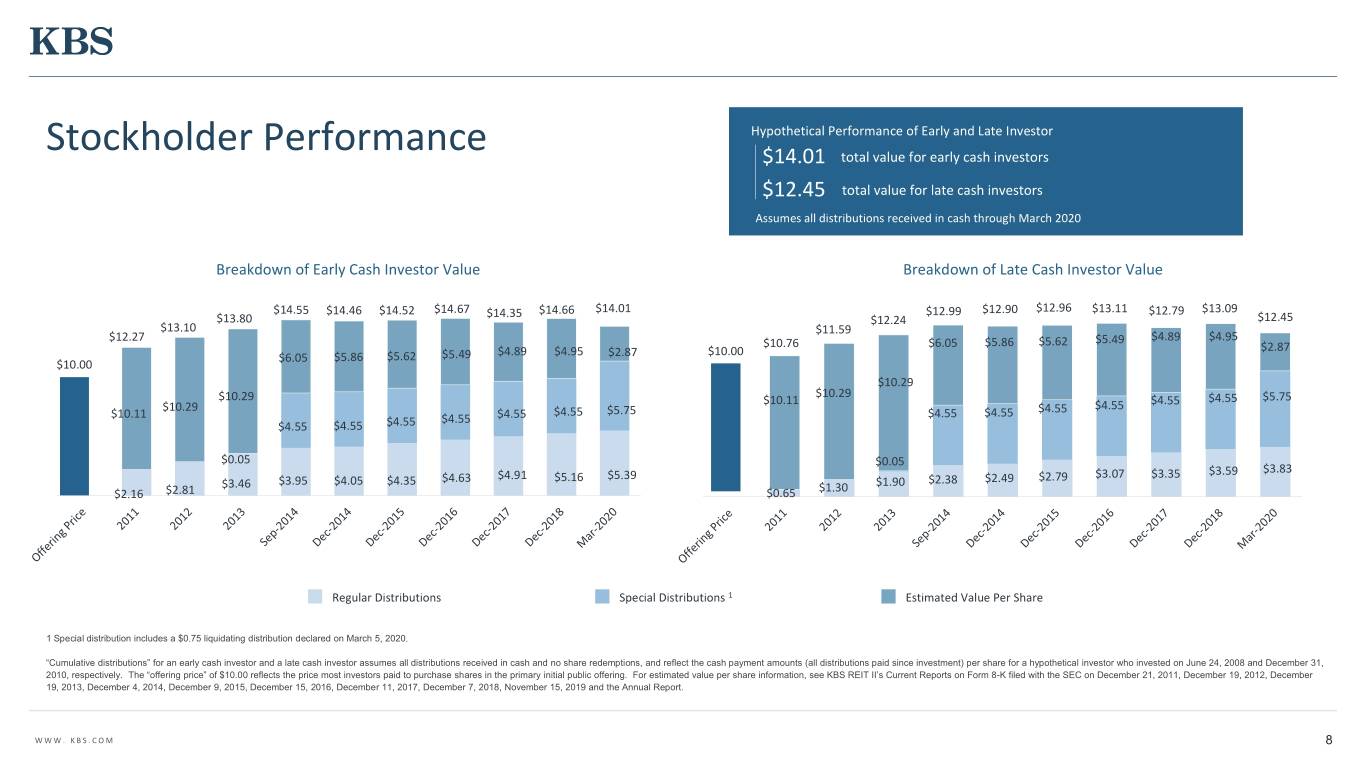
Hypothetical Performance of Early and Late Investor Stockholder Performance $14.01 total value for early cash investors $12.45 total value for late cash investors Assumes all distributions received in cash through March 2020 Breakdown of Early Cash Investor Value Breakdown of Late Cash Investor Value $14.55 $14.46 $14.52 $14.67 $14.35 $14.66 $14.01 $12.99 $12.90 $12.96 $13.11 $12.79 $13.09 $13.80 $12.24 $12.45 $13.10 $11.59 $4.89 $4.95 $12.27 $10.76 $6.05 $5.86 $5.62 $5.49 $10.00 $2.87 $6.05 $5.86 $5.62 $5.49 $4.89 $4.95 $2.87 $10.00 $10.29 $10.29 $10.29 $10.11 $4.55 $4.55 $5.75 $10.29 $4.55 $5.75 $4.55 $4.55 $10.11 $4.55 $4.55 $4.55 $4.55 $4.55 $4.55 $4.55 $0.05 $0.05 $3.07 $3.35 $3.59 $3.83 $3.95 $4.05 $4.35 $4.63 $4.91 $5.16 $5.39 $2.38 $2.49 $2.79 $3.46 $1.30 $1.90 $2.16 $2.81 $0.65 Regular Distributions Special Distributions 1 Estimated Value Per Share 1 Special distribution includes a $0.75 liquidating distribution declared on March 5, 2020. “Cumulative distributions” for an early cash investor and a late cash investor assumes all distributions received in cash and no share redemptions, and reflect the cash payment amounts (all distributions paid since investment) per share for a hypothetical investor who invested on June 24, 2008 and December 31, 2010, respectively. The “offering price” of $10.00 reflects the price most investors paid to purchase shares in the primary initial public offering. For estimated value per share information, see KBS REIT II’s Current Reports on Form 8-K filed with the SEC on December 21, 2011, December 19, 2012, December 19, 2013, December 4, 2014, December 9, 2015, December 15, 2016, December 11, 2017, December 7, 2018, November 15, 2019 and the Annual Report. WWW. KBS.COM 8
Property Updates 9
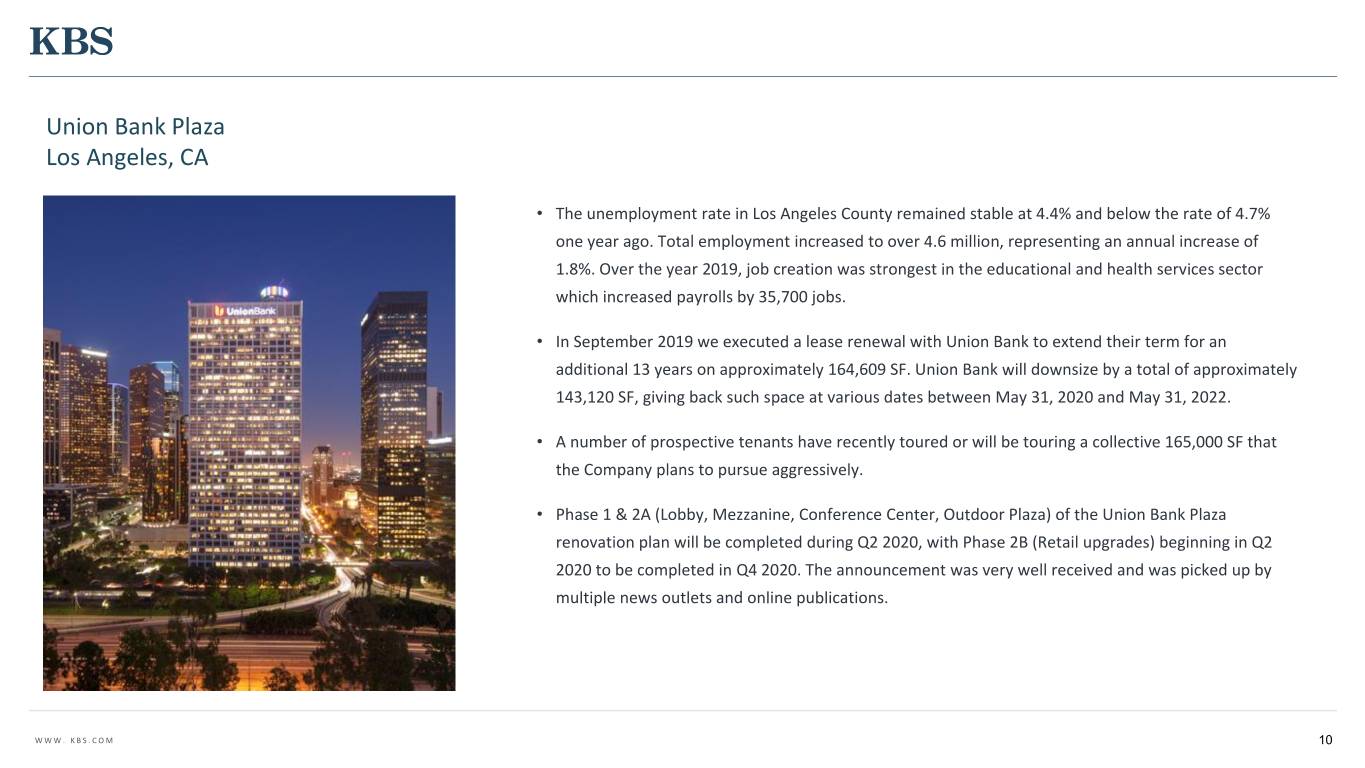
Union Bank Plaza Los Angeles, CA • The unemployment rate in Los Angeles County remained stable at 4.4% and below the rate of 4.7% one year ago. Total employment increased to over 4.6 million, representing an annual increase of 1.8%. Over the year 2019, job creation was strongest in the educational and health services sector which increased payrolls by 35,700 jobs. • In September 2019 we executed a lease renewal with Union Bank to extend their term for an additional 13 years on approximately 164,609 SF. Union Bank will downsize by a total of approximately 143,120 SF, giving back such space at various dates between May 31, 2020 and May 31, 2022. • A number of prospective tenants have recently toured or will be touring a collective 165,000 SF that the Company plans to pursue aggressively. • Phase 1 & 2A (Lobby, Mezzanine, Conference Center, Outdoor Plaza) of the Union Bank Plaza renovation plan will be completed during Q2 2020, with Phase 2B (Retail upgrades) beginning in Q2 2020 to be completed in Q4 2020. The announcement was very well received and was picked up by multiple news outlets and online publications. WWW. KBS.COM 10
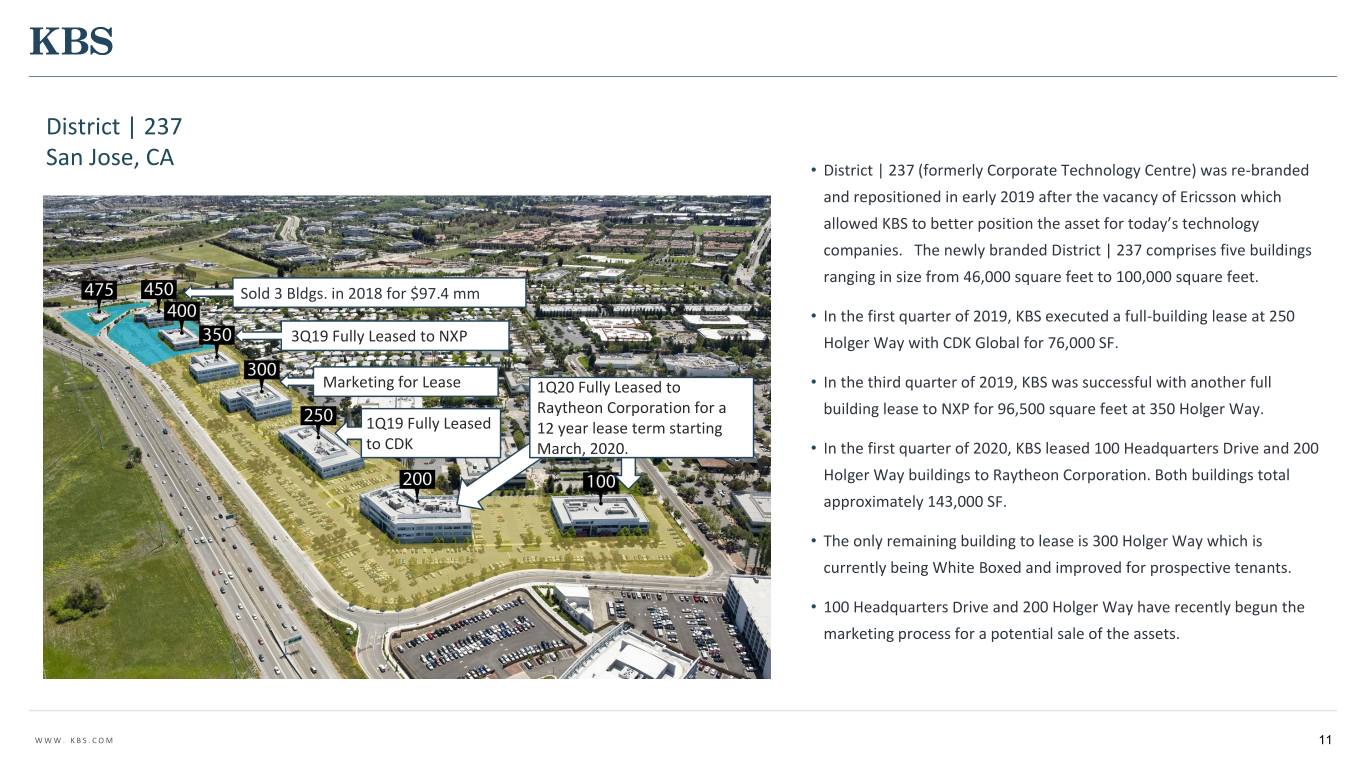
District | 237 San Jose, CA • District | 237 (formerly Corporate Technology Centre) was re-branded and repositioned in early 2019 after the vacancy of Ericsson which allowed KBS to better position the asset for today’s technology companies. The newly branded District | 237 comprises five buildings ranging in size from 46,000 square feet to 100,000 square feet. Sold 3 Bldgs. in 2018 for $97.4 mm • In the first quarter of 2019, KBS executed a full-building lease at 250 3Q19 Fully Leased to NXP Holger Way with CDK Global for 76,000 SF. Marketing for Lease 1Q20 Fully Leased to • In the third quarter of 2019, KBS was successful with another full Raytheon Corporation for a building lease to NXP for 96,500 square feet at 350 Holger Way. 1Q19 Fully Leased 12 year lease term starting to CDK March, 2020. • In the first quarter of 2020, KBS leased 100 Headquarters Drive and 200 Holger Way buildings to Raytheon Corporation. Both buildings total approximately 143,000 SF. • The only remaining building to lease is 300 Holger Way which is currently being White Boxed and improved for prospective tenants. • 100 Headquarters Drive and 200 Holger Way have recently begun the marketing process for a potential sale of the assets. WWW. KBS.COM 11
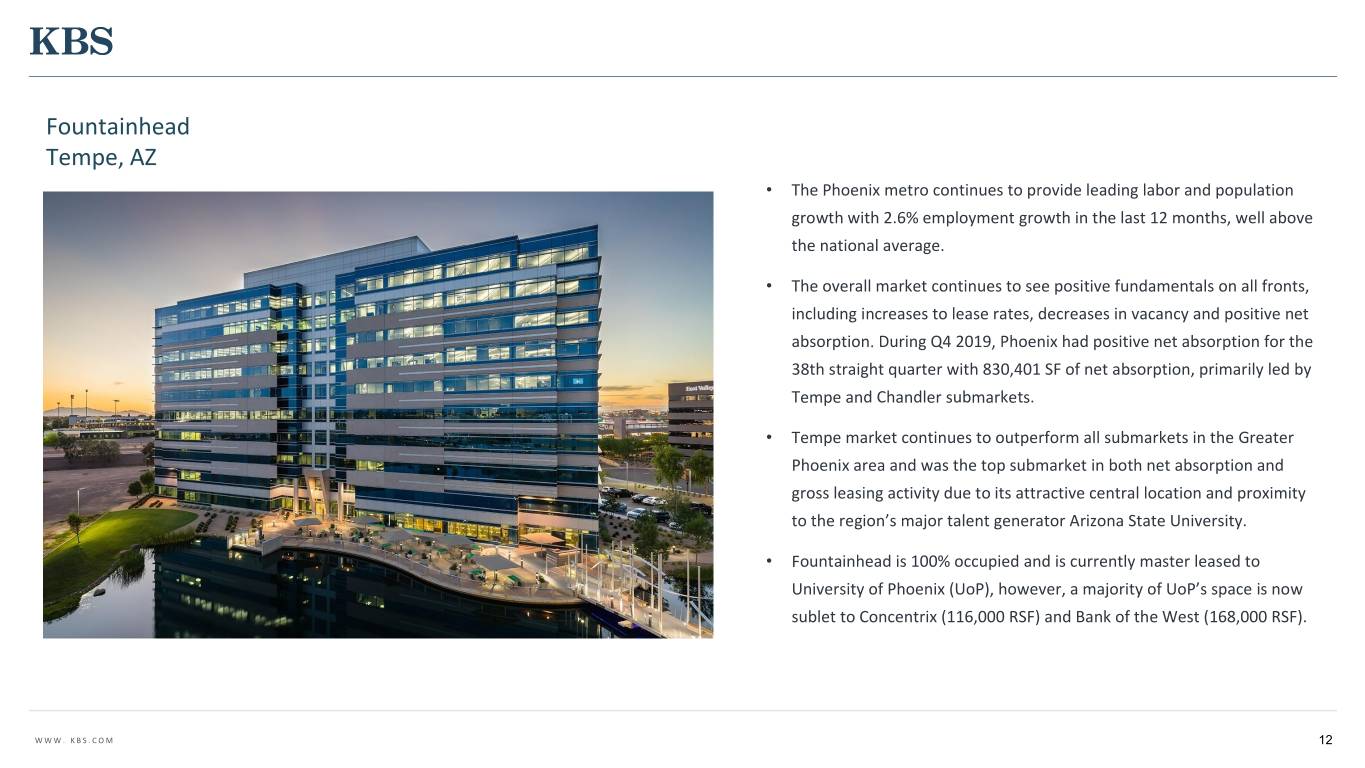
Fountainhead Tempe, AZ • The Phoenix metro continues to provide leading labor and population growth with 2.6% employment growth in the last 12 months, well above the national average. • The overall market continues to see positive fundamentals on all fronts, including increases to lease rates, decreases in vacancy and positive net absorption. During Q4 2019, Phoenix had positive net absorption for the 38th straight quarter with 830,401 SF of net absorption, primarily led by Tempe and Chandler submarkets. • Tempe market continues to outperform all submarkets in the Greater Phoenix area and was the top submarket in both net absorption and gross leasing activity due to its attractive central location and proximity to the region’s major talent generator Arizona State University. • Fountainhead is 100% occupied and is currently master leased to University of Phoenix (UoP), however, a majority of UoP’s space is now sublet to Concentrix (116,000 RSF) and Bank of the West (168,000 RSF). WWW. KBS.COM 12

Granite Tower Denver, CO • Denver office fundamentals remain favorable as job growth in the metro is healthy. Many tech companies are looking for an affordable alternative to Silicon Valley, and they are drawn to Denver’s business-friendly environment and highly skilled, diverse talent pool. • The CBD and Midtown submarkets remain the most popular given the attractiveness of the Downtown amenities for employers and employees, but leasing activity is also strong in the DTC / Southeast submarket. Developers have responded to the high levels of demand in Denver putting a moderate limiting factor on otherwise fantastic fundamentals for rent growth. • KBS is currently underway with significant renovations for Granite Tower including a bright and transparent architectural pavilion that will expand the main lobby and ground floor common area which will support a new food and beverage operation extending to the upgraded outdoor gathering space. Furthermore, a new, 100-bicycle storage facility will be located adjacent to the expanded lobby with easy access to the building elevators. The capstone of the new improvements will be converting the entire third floor into a new amenity floor, which will feature an open lounge and outdoor deck overlooking downtown. Tenants will also be able to host formal meetings accommodating up to 138 people in the new conference facility and enjoy a new gym with group workout classes, Peloton bikes and locker rooms. KBS’s renovations have proven key to attracting and retaining premier tenants to this property. WWW. KBS.COM 13

Granite Tower Denver, CO Before Renovations • We continue to complete our renovation and repositioning strategy at the property. WWW. KBS.COM 14
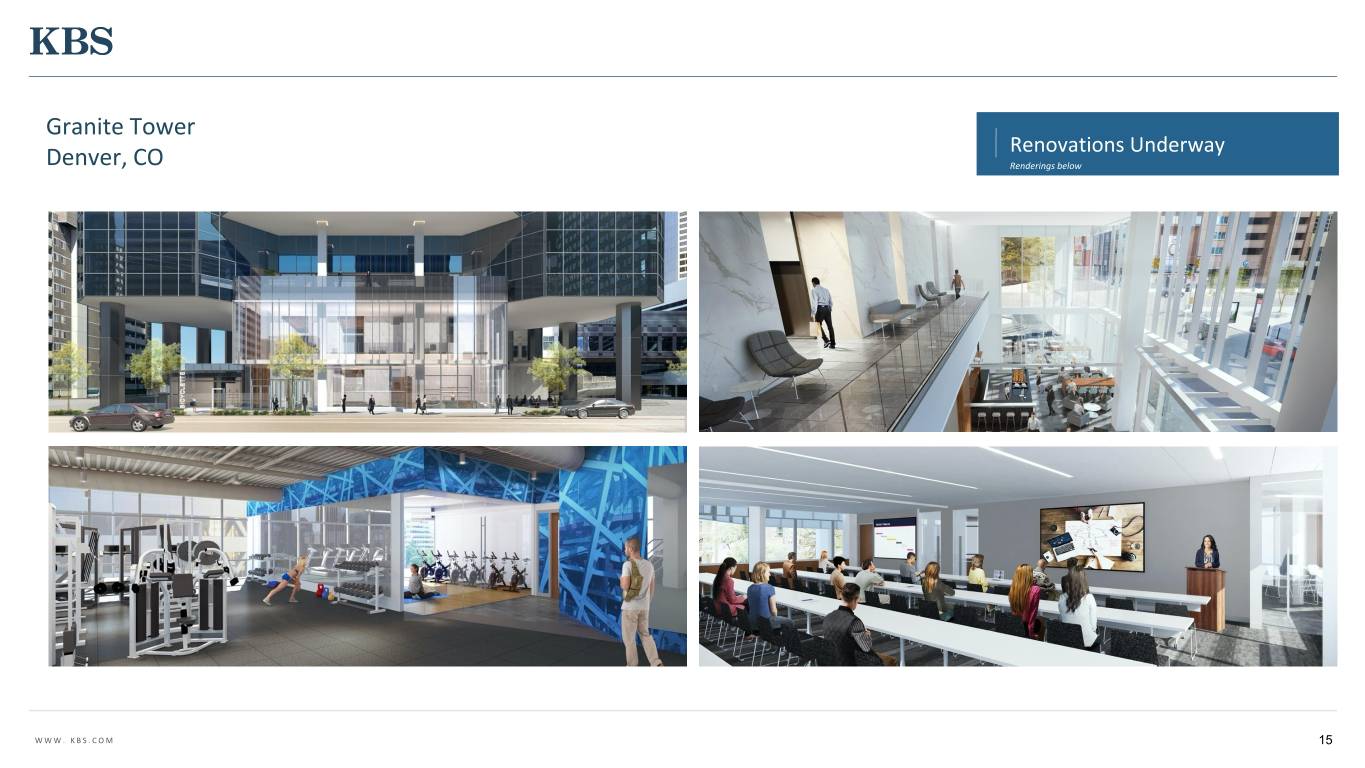
Granite Tower Renovations Underway Denver, CO Renderings below WWW. KBS.COM 15
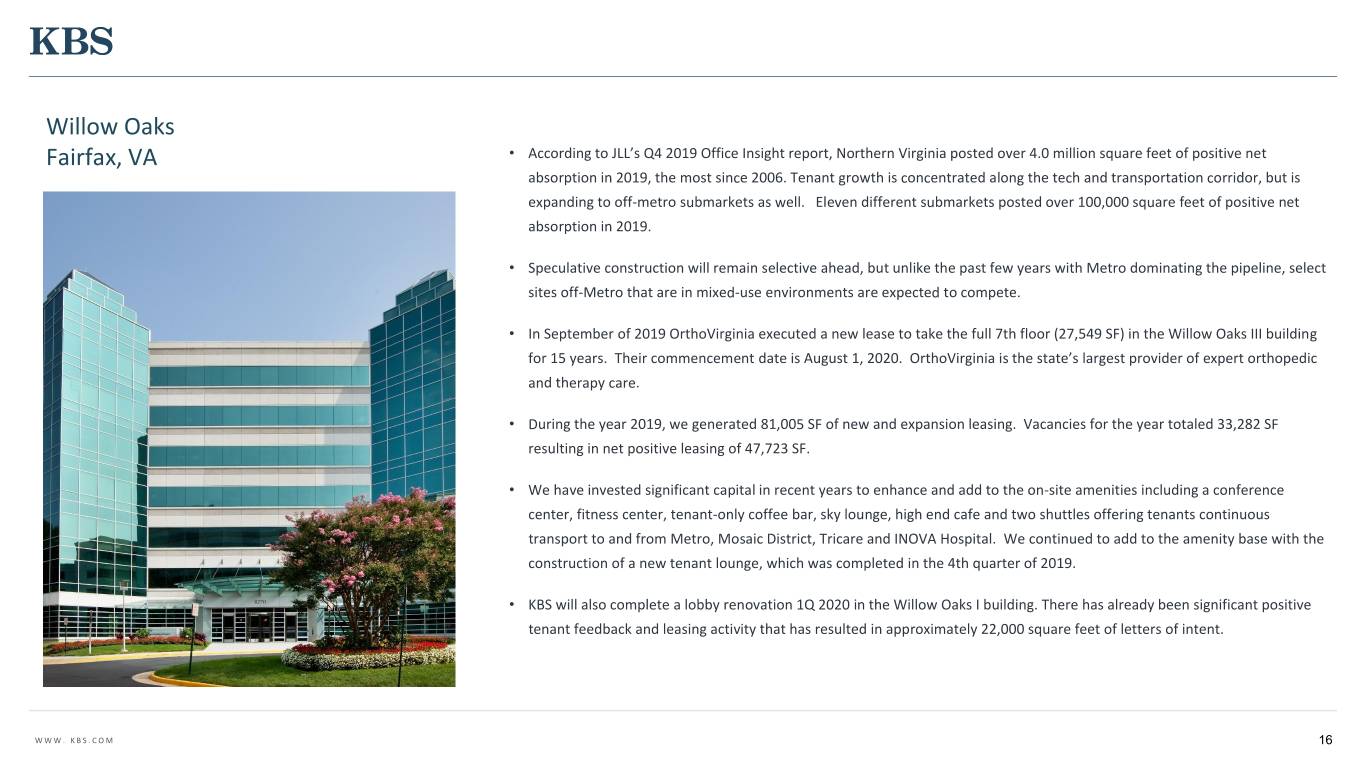
Willow Oaks Fairfax, VA • According to JLL’s Q4 2019 Office Insight report, Northern Virginia posted over 4.0 million square feet of positive net absorption in 2019, the most since 2006. Tenant growth is concentrated along the tech and transportation corridor, but is expanding to off-metro submarkets as well. Eleven different submarkets posted over 100,000 square feet of positive net absorption in 2019. • Speculative construction will remain selective ahead, but unlike the past few years with Metro dominating the pipeline, select sites off-Metro that are in mixed-use environments are expected to compete. • In September of 2019 OrthoVirginia executed a new lease to take the full 7th floor (27,549 SF) in the Willow Oaks III building for 15 years. Their commencement date is August 1, 2020. OrthoVirginia is the state’s largest provider of expert orthopedic and therapy care. • During the year 2019, we generated 81,005 SF of new and expansion leasing. Vacancies for the year totaled 33,282 SF resulting in net positive leasing of 47,723 SF. • We have invested significant capital in recent years to enhance and add to the on-site amenities including a conference center, fitness center, tenant-only coffee bar, sky lounge, high end cafe and two shuttles offering tenants continuous transport to and from Metro, Mosaic District, Tricare and INOVA Hospital. We continued to add to the amenity base with the construction of a new tenant lounge, which was completed in the 4th quarter of 2019. • KBS will also complete a lobby renovation 1Q 2020 in the Willow Oaks I building. There has already been significant positive tenant feedback and leasing activity that has resulted in approximately 22,000 square feet of letters of intent. WWW. KBS.COM 16

Willow Oaks Amenities Coffee Bar Conference Center WWW. KBS.COM 17

REIT II Goals & Objectives Execute Plan of Liquidation Negotiate lease renewals or new leases that facilitate the sales process and enhance property stability for prospective buyers Complete capital projects, such as renovations or amenity enhancements, to attract quality buyers WWW. KBS.COM 18

Q&A For additional questions, contact KBS Capital Markets Group Investor Relations (866) 527-4264 19


