 0 Investor Relations Presentation First Quarter 2012 (Published June 4, 2012) Exhibit 99.1 |
 Safe Harbor Statement 1 The following information contains, or may be deemed to contain, “forward-looking statements” (as defined in the U.S. Private Securities Litigation Reform Act of 1995). Most forward-looking statements contain words that identify them as forward-looking, such as “may”, “plan”, “seek”, “will”, “expect”, “intend”, “estimate”, “anticipate”, “believe”, “project”, “opportunity”, “target”, “goal”, “growing” and “continue” or other words that relate to future events, as opposed to past or current events. By their nature, forward-looking statements are not statements of historical facts and involve risks and uncertainties because they relate to events and depend on circumstances that may or may not occur in the future. These statements give Allison Transmission’s current expectation of future events or its future performance and do not relate directly to historical or current events or Allison Transmission’s historical or future performance. As such, Allison Transmission’s future results may vary from any expectations or goals expressed in, or implied by, the forward-looking statements included in this presentation, possibly to a material degree. Allison Transmission cannot assure you that the assumptions made in preparing any of the forward- looking statements will prove accurate or that any long-term financial goals will be realized. All forward- looking statements included in this presentation speak only as of the date made, and Allison Transmission undertakes no obligation to update or revise publicly any such forward-looking statements, whether as a result of new information, future events, or otherwise. In particular, Allison Transmission cautions you not to place undue weight on certain forward-looking statements pertaining to potential growth opportunities, long-term financial goals or the value we currently ascribe to certain tax attributes set forth herein. Actual results may vary significantly from these statements. Allison Transmission’s business is subject to numerous risks and uncertainties, which may cause future results of operations to vary significantly from those presented herein. |
 Business Overview 2 |
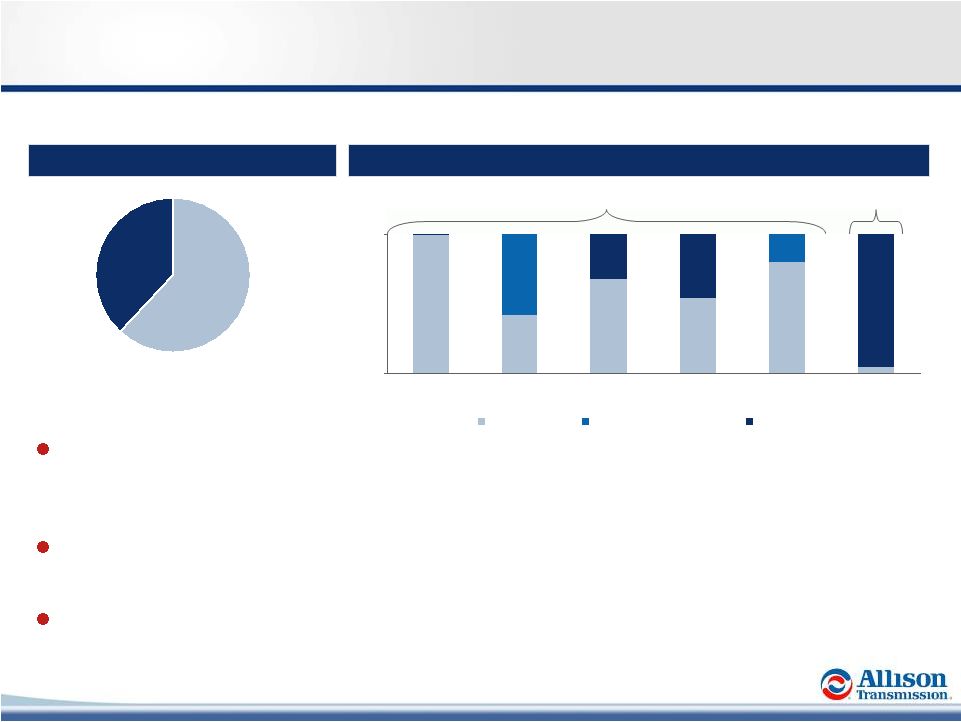
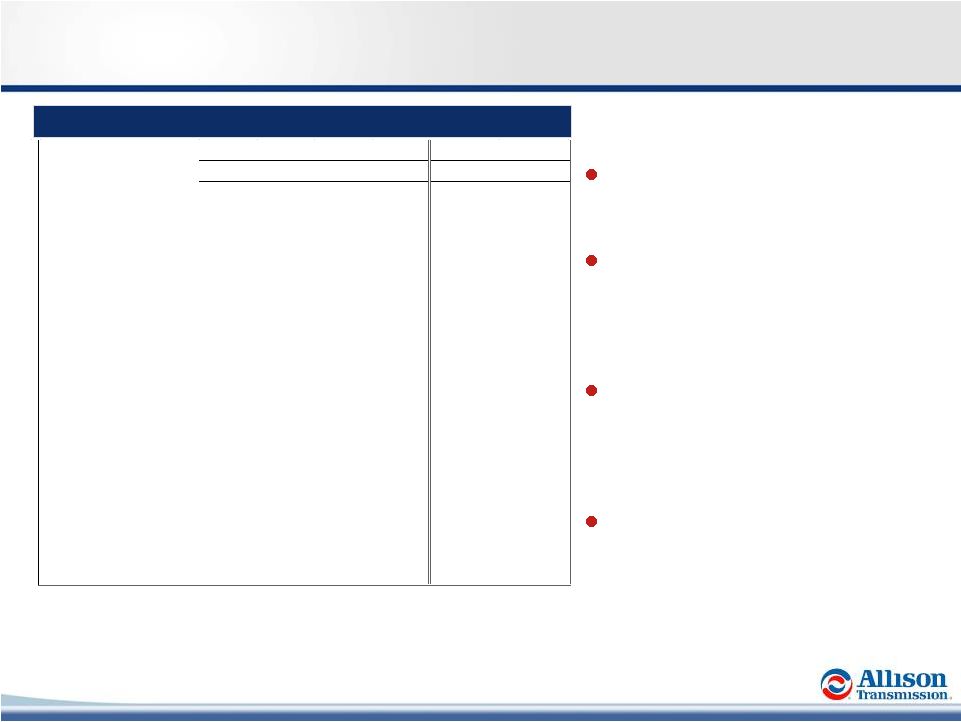
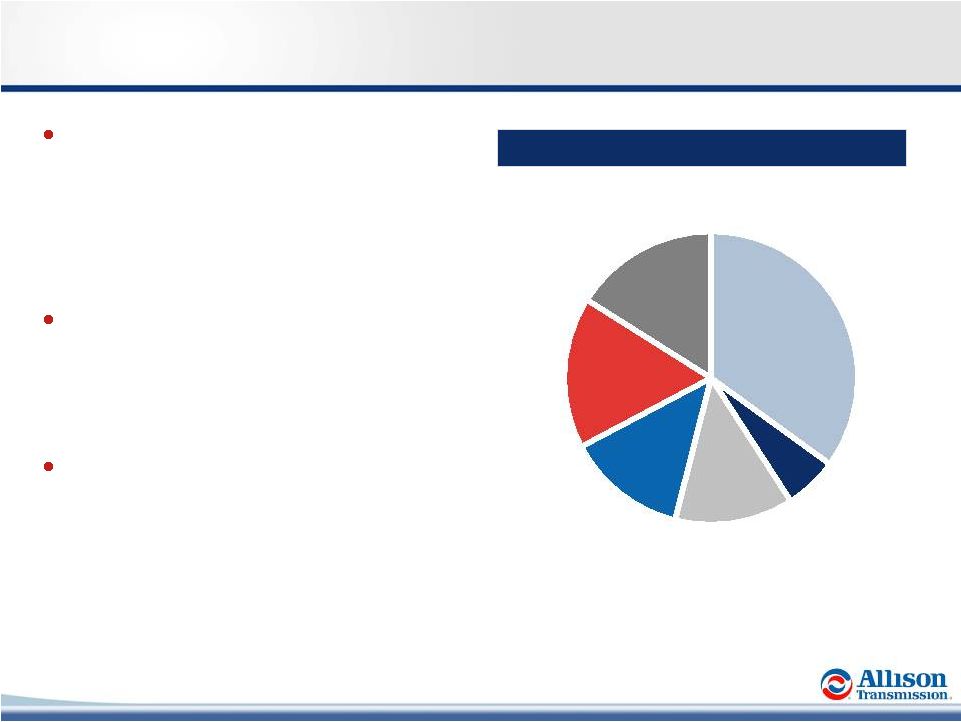 3 Allison Transmission at a Glance North America On-highway 35% North America Off-highway 13% Outside North America 17% Military 13% Parts, Support Equipment and Other 16% Hybrid Transit Bus 6% LTM (1) Net Sales by End Market (1) LTM 3/31/2012. LTM Net Sales: $2.2 billion World’s largest manufacturer of fully- automatic transmissions for medium- and heavy-duty commercial vehicles – 62% global market share of fully-automatic transmissions – Virtually no exposure to Class 8 line-haul tractors Allison is the premier fully-automatic transmission brand – Premium price component frequently specified by end users – Differentiated technology Well positioned for revenue and earnings growth – Continued recovery in North America – Further adoption outside North America – Global off-highway growth opportunities – Expanding addressable market |
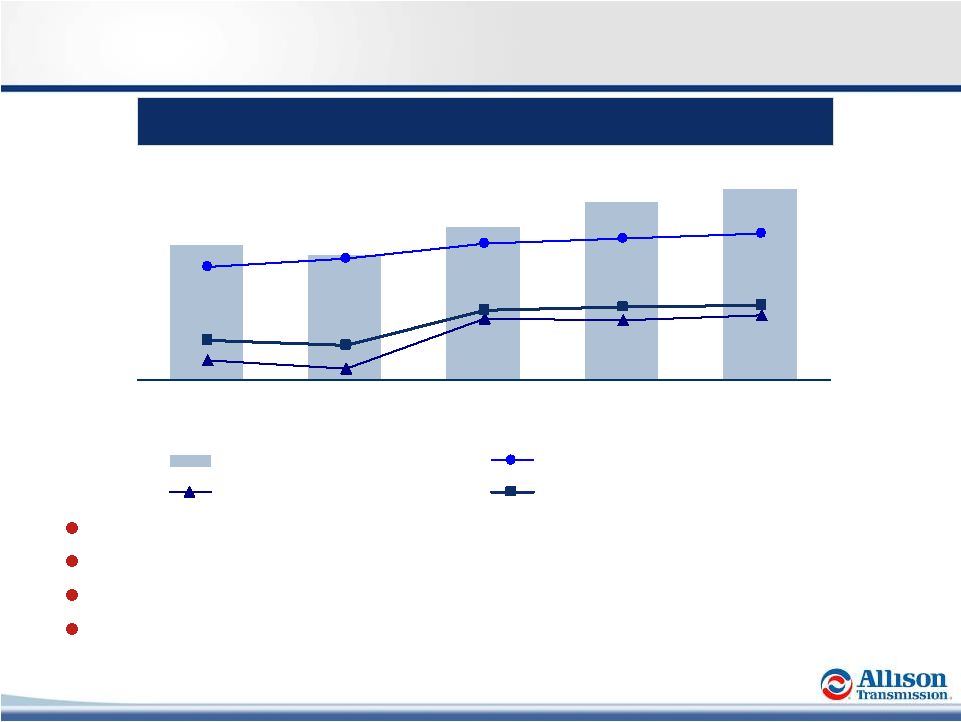 4 Allison Key Financial Highlights (1) LTM 3/31/2012. (2) Note: See appendix for comments regarding the presentation of non-GAAP financial information. Strong Financial Profile (2) $501 $766 $712 $544 $617 34.1% 32.9% 32.0% 28.4% 26.4% 4.5% 2.8% 14.2% 14.1% 15.1% 17.5% 9.4% 8.0% 16.4% 17.2% 2008 2009 2010 2011 LTM Adj. EBITDA Adj. EBITDA Margin Adj. NI Margin Free Cash Flow (% of Net Sales) ($ in millions) (1) Strong, sustainable operating margins Low capital expenditure requirements Minimal cash income taxes / valuable U.S. tax shield ($0.9-1.1bn present value) Positioned for long-term cash earnings growth |
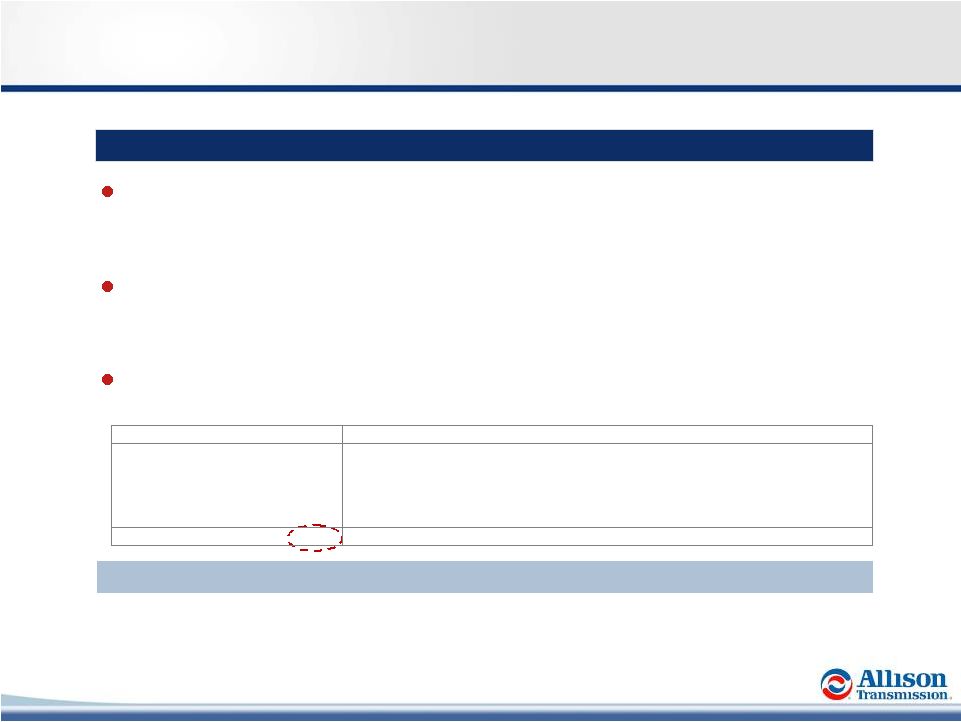
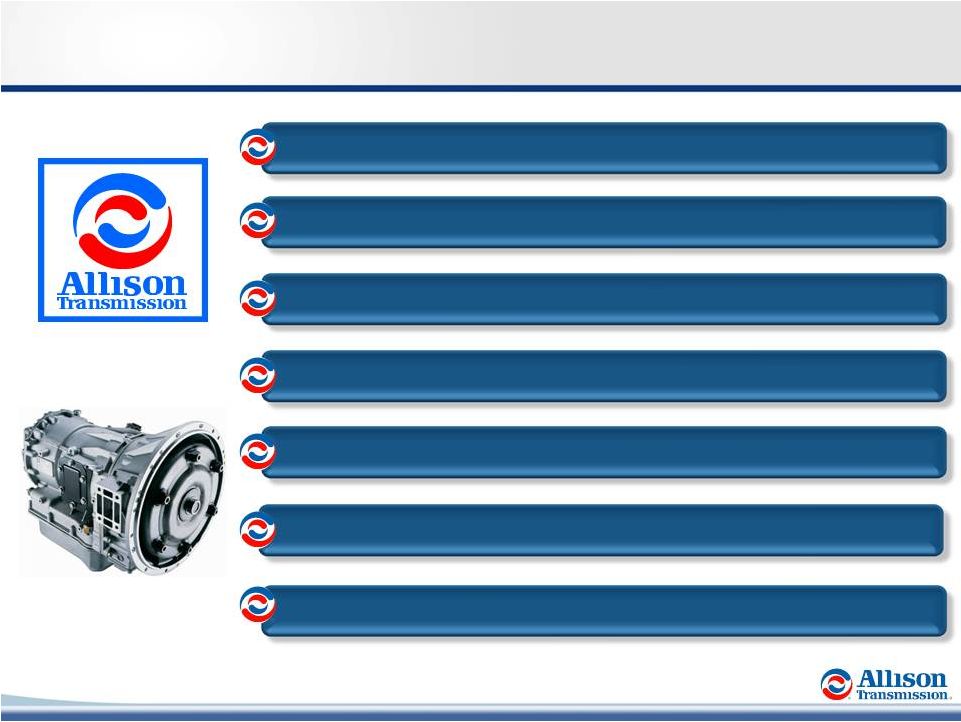 5 Allison Is a Premier Industrial Asset Improved Margins and Low Capex Drive Strong Cash Flow Generation Experienced Management Team Premier Brand and End User Value Proposition Multiple Organic Growth Opportunities Global Market Leader Diverse End Markets with Long-Standing OEM Customer Relationships Technology Leadership - The Allison Advantage |
 6 The “de facto” standard in medium- and heavy-duty applications – Well established as standard in North America Increasing presence in rapidly growing emerging markets (China and India) which today are predominantly manual Virtually no exposure to more cyclical Class 8 line-haul tractors Global On-Highway Fully-Automatic Share (1) North American Market Share (1) Allison ~62% Other (2) ~38% Global Market Leader (1) 2011 Units. Source: Allison management estimates and ACT research. (2) Majority of “Other” volume is in North American Class 4-5 truck and European bus. Substantially All Allison’s Core Addressable Market Expansion Market 42% 54% 80% 4% 46% 96% 68% 20% 58% 32% 100% School Bus Motorhome Class 6-7 Truck Class 8 Straight Truck Hybrid Bus Class 8 Metro Allison Other Automatics AMT, Manual |
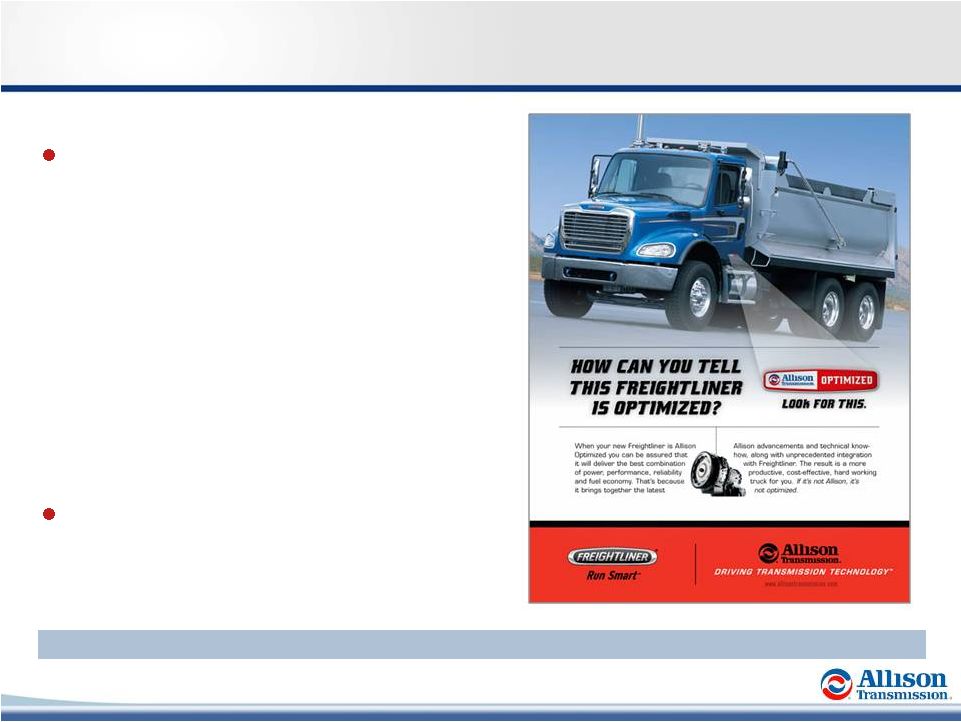 7 Allison Is a Recognized and Respected Brand The Allison brand is associated with: – High Quality – Reliability – Durability – Vocational Value and Expertise – Technological Leadership – Superior Customer Service – Attractive Total Lifecycle Value 90+ year history of providing high- quality innovative products and demonstrated value to end users End Users Frequently Request Allison Transmissions by Name and Pay a Premium for Them |
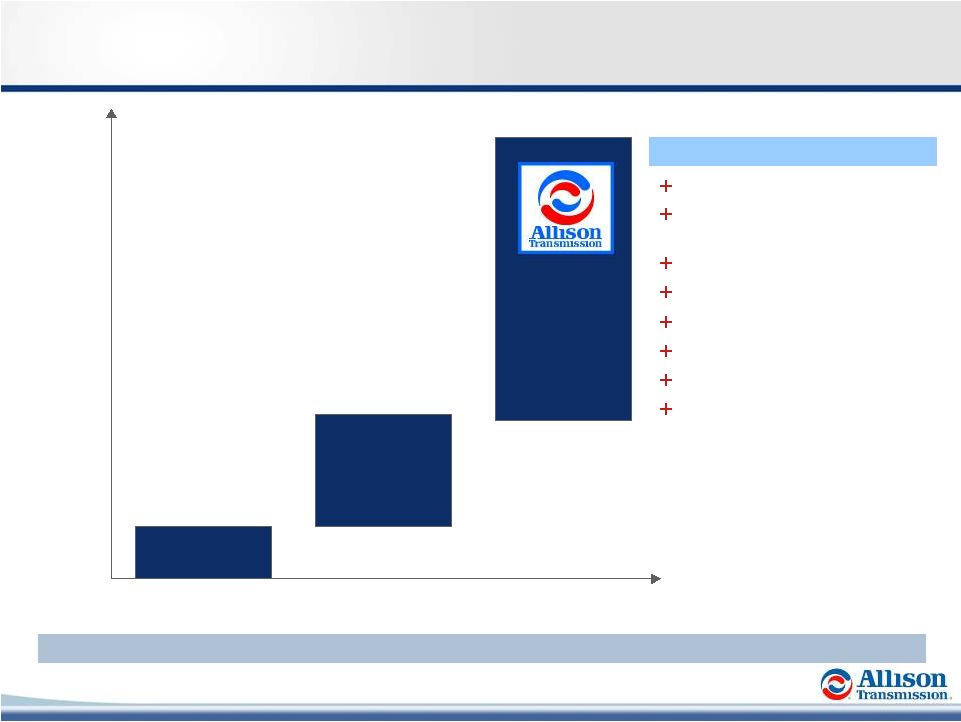 8 End User Value Proposition Productivity (acceleration) Maintenance Savings (life cycle costs) Fuel Efficiency Driver Skillset / Wages Training (time, cost) Shift Quality Safety Residual Value Low High Included in Vehicle Price $3,000 - $7,000 $3,000 - $11,000 Manual Transmission Automated Manual Transmission (AMT) Allison (Fully-Automatic) Relative Customer Value Approximate Option Pricing End Users are Willing to Pay a Premium Price for Allison Allison Advantage |
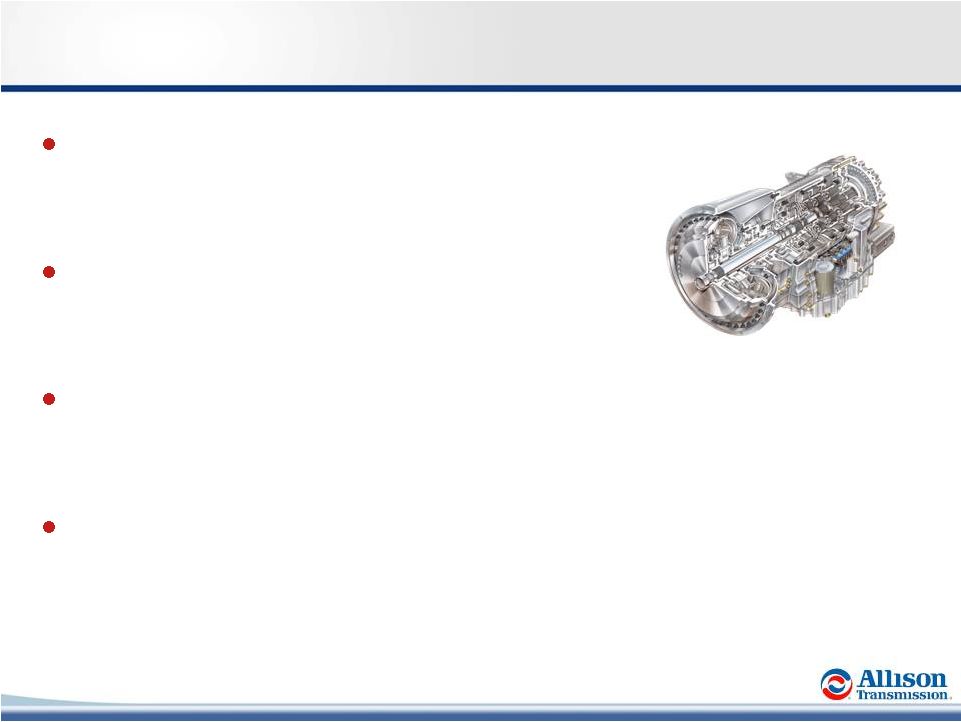
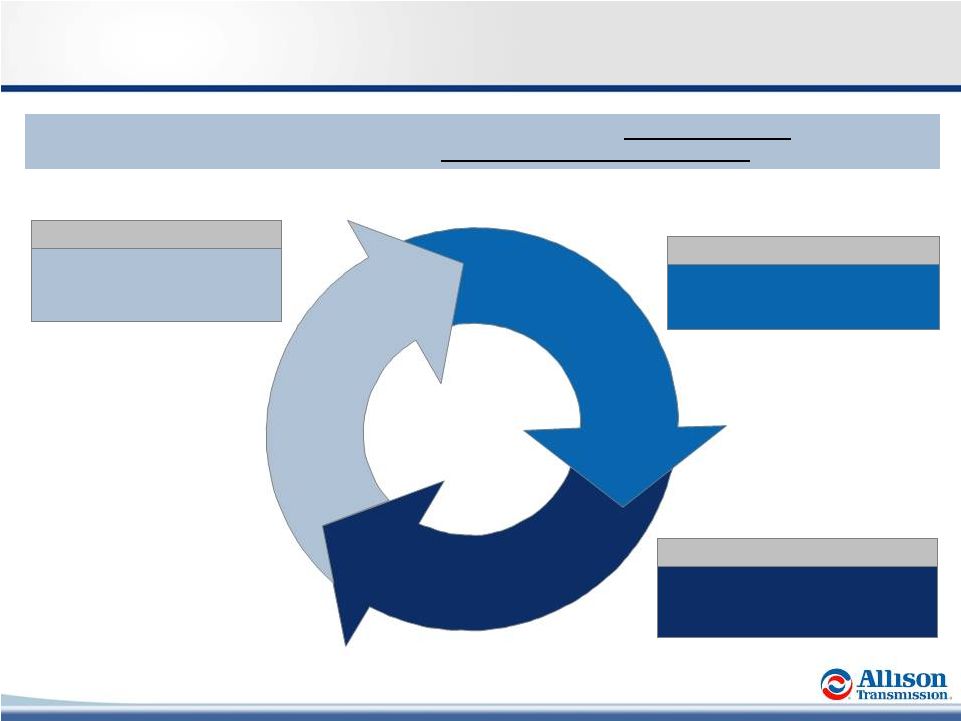 9 Technology Leadership – The Allison Advantage Lower Vehicle Life Cycle Costs Superior Performance Proprietary and patented technology developed over many decades and 5.7 million units Properly Matched to Selected Engine Optimized for Intended Vocation Customer Benefits Superior Technology Engine & Vocation Optimized Generating Pull-Through Demand Allison Advantage Allison Advantage Technology Differentiators Allison transmissions employ complex software algorithms that are individually tailored to maximize end user performance in thousands of vocational duty cycles |
 10 Distribution Emergency Vehicle Motorhome Rugged Duty School Bus / Shuttle Bus Transit Bus End Market & Vocation Overview Global On-Highway Military Sample Vocations Select End Users Select End Users North America Hybrid Transit Bus Select End Users Beijing City Transit New Delhi Transit Global Off-Highway Select End Users Parts, Support Equipment and Other |
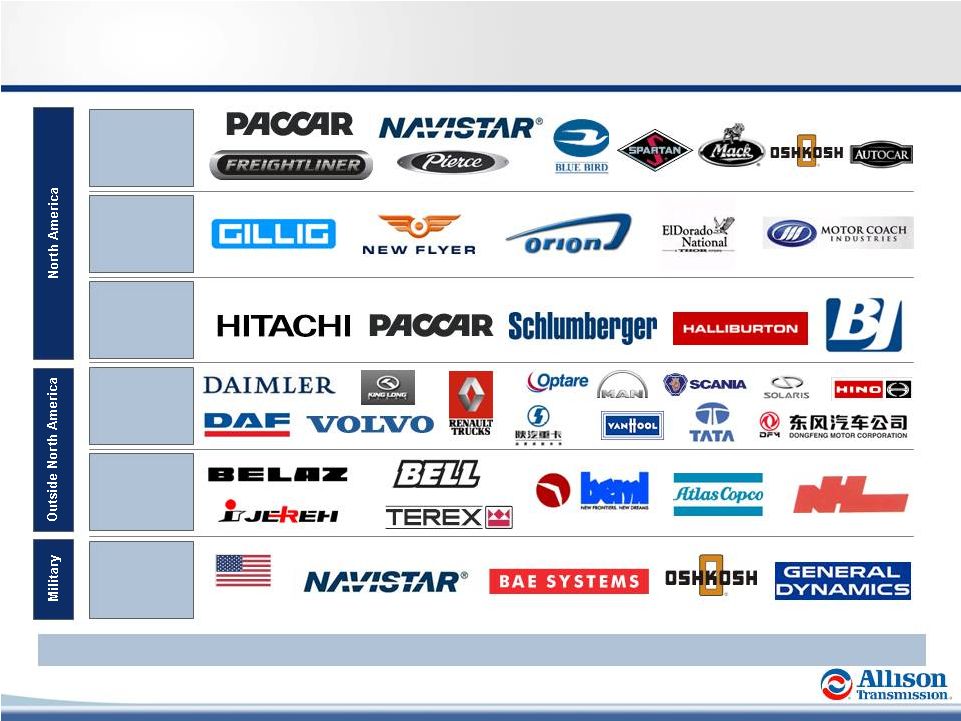 11 OEMs Rely on Allison for Fully-Automatic Transmissions On-Highway Hybrid Transit Bus Off-Highway On-Highway Off-Highway U.S. Government Medium- and Heavy- Tactical Over 45 Year Relationship with Many Industry-Leading OEMs |
 12 2008 Today 2012 (1) Net Sales Adj. EBITDA % Margin Adj. Net Income $2,061mm $544mm 26.4% $93mm $2,248mm $766mm 34.1% $339mm +9.0% +40.8% +770bps +265.2% Despite cyclical low industry volumes, significant improvement in EBITDA margin and Adjusted Net Income Employees UAW Contract UAW Wage Structure 3,300 Part of GM Single-Tier 2,800 Allison Only Multi-Tier (15.2%) 2009 Hourly buyout plan reduced headcount by ~25%, positioning the company to replace Tier I with Tier II workers and realize operating leverage Technology Focus Enhance Existing Products New, More Fuel Efficient Technologies Investing in the development of next generation technologies Note: See appendix for comments regarding the presentation of non-GAAP financial information. (1) LTM 3/31/2012 Premier Industrial Asset Financial Profile Resulting from Experienced Management and Execution (1) Net Debt Reduction of More Than $1.2 Billion Since Acquisition in August 2007 |
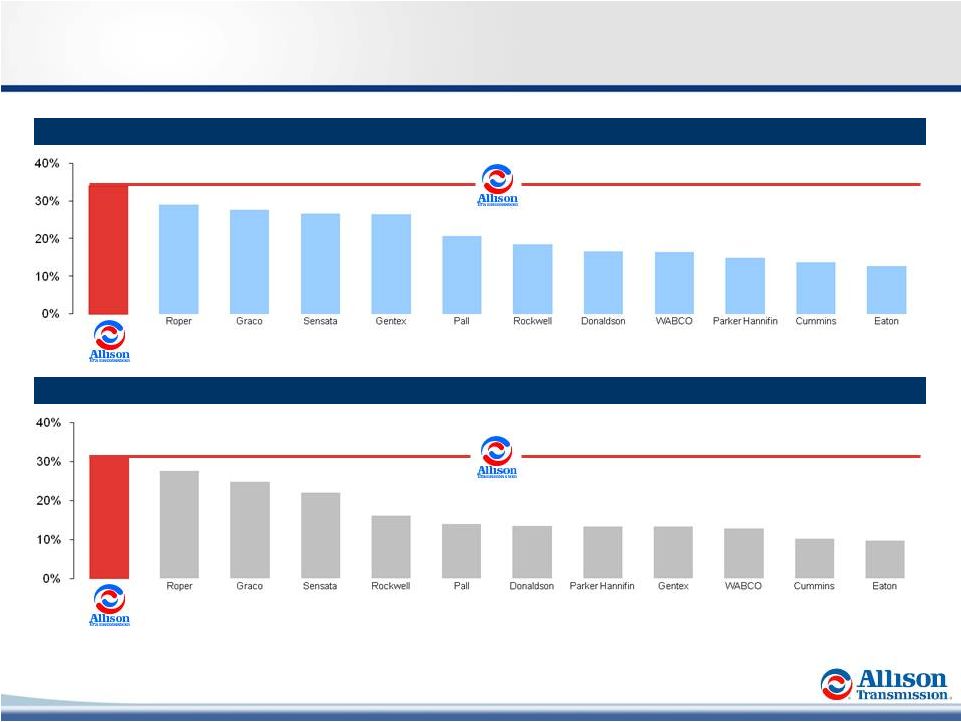 13 Premier Industrial Asset (2) (2) EBITDA Margin (1) EBITDA – CapEx Margin (1) (1) The LTM period and LTM EBITDA, which excludes non-recurring or one-time items as designated by each entity, are based on information available in the entity’s most recent quarterly or annual report as of 4/30/2012. EBITDA included above may not be consistent with such entity’s reported EBITDA or Adjusted EBITDA, if available. (2) Represents Adjusted LTM EBITDA and Adjusted LTM EBITDA less capex (excluding non-recurring capex related to non-North American manufacturing expansion and new product-related capex) as of 3/31/2012. See appendix for comments regarding the presentation of non-GAAP information. |
 14 Multiple Organic Growth Opportunities Benefit from Developed Markets Recovery Increase Penetration of Fully Automatic Transmissions Accelerate Adoption in Emerging Markets Capitalize on Rising Demand for Energy and Commodities Continue New Technology and Product Development Increase Share in Underserved Markets |
 (1) Source: ACT Research, May 2012. Includes Class 4-7 Truck and Bus (Excluding Transit and Coach) and Class 8 Straight Truck. Cyclical Recovery in Developed On-Highway Markets North America Production in Allison’s Core Addressable Market (units in 000s) (1) Growth opportunity driven by continued cyclical recovery in core North American market (~34% of 2011 sales) Production has rebounded from cyclical lows and growth is expected Allison’s growth is supported by pent up demand from deferred purchases Continued demand for fuel efficient vehicles to provide incremental growth Note: Excludes Class 8 line-haul units. 15 1998 – 2008 337 274 427 151 178 234 247 283 303 Avg. Min (2003) Max (2006) 2009 2010 2011 2012e 2013e 2014e |
 16 Increase Penetration of Fully-Automatic Transmissions Global Penetration of Fully-Automatic Transmissions Non-North America (2) North America (1) 2011 Source: Allison Management. (1) Includes Class 4-7 trucks, Class 8 straight trucks, buses (school, conventional transit, shuttle and coach) and motorhomes. (2) Includes medium- and heavy-duty commercial vehicles. Low penetration in markets outside North America presents a significant growth opportunity 2011 Ongoing need for productivity improvements Better acceleration and trip times allow increased miles and revenue Improved fuel efficiency as a function of work performed More vehicle uptime Focus on reducing life-cycle costs Lower maintenance expense Improved fuel efficiency Increased vehicle residual value Micro / demographic trends Easier to operate – increases pool of qualified drivers Less driver training and turnover Safety factors Allison has significantly increased market share in North America |
 17 Increasing Adoption in Emerging Markets – China Case Study Allison’s China Truck Vocational Focus 2004 - 2006 2007 - 2009 2010+ Fire and Emergency Oil Field Crane Carrier Construction / Dump Airport Services Terminal Tractor Refuse Allison’s Cumulative China Truck OEM Releases (1) Allison is the #1 supplier of fully- automatic transmissions in China as a result of targeting specific vocations Substantial installed base of over 35,000 transmissions in China Secular growth due to low penetration Allison’s existing bus presence serves as entry point for incremental penetration Significant growth opportunities by targeting a wide range of vocational applications Government emphasis on equipment modernization for mining, rescue operations, school buses and other applications Construction and oil field sector (1) Source: Allison. 17 22 53 72 2008 2009 2010 2011 |
 Global Off-Highway Growth Opportunities LTM (1) Allison Global Off-Highway Sales Hydraulic Fracturing Activity NA 29% ROW 71% Total Recoverable Shale Gas (4) Current Activity (3) NA 88% (2) Source: Spears & Associates, January 2012. (3) Source: U.S. Energy Information Administration, April 2011. ROW 12% Energy Sectors 14% of total sales (1) Considerable end market cyclicality Multiple opportunities in exploration, fracturing and oil and gas support Mining and Construction 3% of total sales (1) NA, Europe, Middle East, Africa and China Increasing global demand for commodities Increasing urbanization in emerging markets 18 Non-NA Energy 7% Non-NA Hauling 13% NA Hauling 1% NA Energy 59% 2012 LTM Global Off-Highway Sales: $485 million (21% of total sales) Parts, Support Equipment and Other 20% (1) Excluding replacement parts. (2) LTM 3/31/2012. |
 19 New Product Development Hybrid Commercial Vehicle Class 8 Metro Developing a ten-speed fully-automatic transmission targeted at Class 8 tractors serving urban markets – Large, addressable market size of ~60k units – Historically a “manual” market under addressed by Allison’s fully-automatic product portfolio Currently being tested by customers Leading development of first fully-automatic hybrid truck transmission for the Class 6-7 market Awarded $62.8 million U.S. Department of Energy cost-share grant for hybrid development – Fuel economy improvements of ~25%-35% – Target Vocations: Refuse, Pick-Up & Delivery/Distribution, Utility and Shuttle Bus Average Annual Spend over $110 Million in Product-Related Research and Development Since Acquisition |
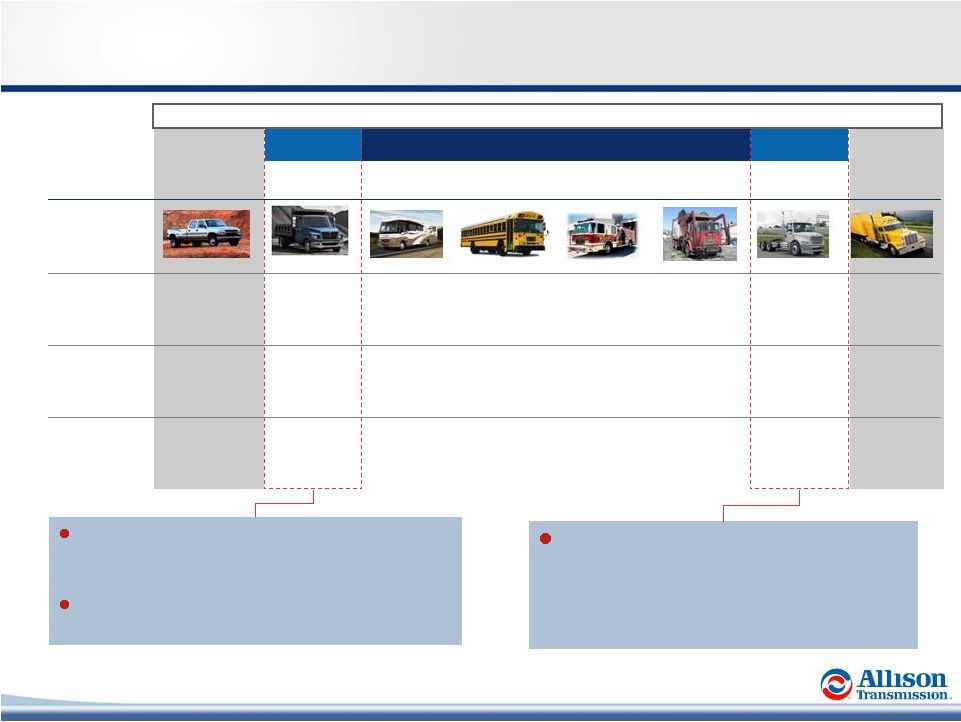 20 Well Positioned to Gain Share in Underserved Markets Core Addressable Market Underserved Note: Analysis excludes Allison’s Transit/Coach Bus and Hybrid Transit Bus Segments. Source: Allison and ACT Research. Underserved “Metro” is a term for tractors that are used primarily in urban environments, which represent ~30% of the Class 8 tractor market between 1998 and 2011; target market for the TC10 transmission Historically, this market has been dominated by Ford and GM who offered their own light- duty/uprated automotive transmissions GM exited Medium-Duty truck market in 2009 North America Class 1-3 Class 4-5 Motor Home School Bus Class 6-7 Class 8 Straight Class 8 Metro Class 8 Linehaul Vehicles Weight (000s of lbs) < 14 lbs 14 – 19 lbs 16 – 33 lbs 16 – 33 lbs 19 – 33 lbs 33 lbs+ 33 lbs+ 33 lbs+ 2011 Industry Units Produced 5,239,866 59,080 12,255 23,230 72,147 61,611 60,806 132,844 2011 Allison Share 0% 13% 42% 99% 68% 54% 4% 0% |
 Financial Overview 21 |
 22 Allison Financial Highlights Note: See appendix for comments regarding the presentation of non-GAAP information. (1) LTM 3/31/2012 (2) 2.6% excluding non-North American manufacturing expansion and new product related. Strong, sustainable operating margins – End markets diversity – Premium vocational pricing model – Cost controls and productivity improvement – Multi-Tier UAW wage and benefits structure Low capital expenditure requirements – Maintenance capital spending ~$55mm/year Minimal cash income taxes / valuable U.S. tax shield ($0.9-1.1bn present value) Positioned for long-term cash earnings growth – Multiple growth opportunities – De-leveraging Strong free cash flow supports $0.06 per share quarterly dividend LTM (1) Financial Metrics 5.4% 34.1% 44.9% 15.1% 0.3% 17.5% Cash Income Taxes (% of sales) Capex (% of sales) Adj Net Income Margin Free Cash Flow (% of Sales) EBITDA Margin Gross Margin (2) |
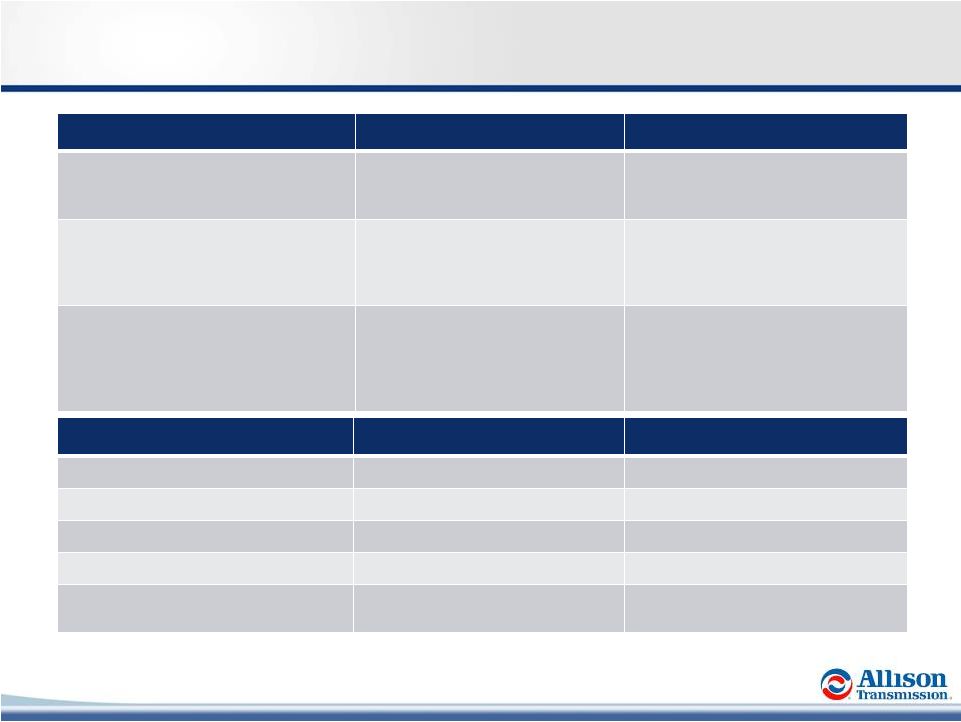
 23 Strong Financial Profile Financial Summary Significant sales growth since the 2009 trough Resiliency through the downturn, evidenced by increasing EBITDA margins and strong free cash flow generation Continued investments in global commercial capabilities, new product development and low-cost country manufacturing Strong free cash flow driven by high margins, low maintenance capex, and de minimis cash income taxes In $ millions Annual Quarterly 2008 2009 2010 2011 1Q 2011 1Q 2012 Net Sales $2,061 $1,767 $1,926 $2,163 $517 $602 % Growth (5.2%) (14.3%) 9.0% 12.3% 9.1% 16.4% Adjusted EBITDA 544 501 617 712 169 223 % Margin 26.4% 28.4% 32.0% 32.9% 32.7% 37.0% Effective Cash Tax Rate (2) NM NM 2.7% 3.9% 2.9% 3.5% Adjusted Net Income 93 50 274 305 111 144 % of Net Sales 4.5% 2.8% 14.2% 14.1% 21.5% 23.9% Total CapEx 75 88 74 97 12 36 % of Net Sales 3.7% 5.0% 3.8% 4.5% 2.1% 5.9% Free cash flow (3,4,5) 193 142 315 372 98 120 % of Net Sales 9.4% 10.4% 16.4% 17.2% 19.0% 19.9% Note: See appendix for comments regarding the presentation of non-GAAP measures. (1) LTM 03/31/2012 (2) Effective cash tax rate defined as cash income taxes divided by income (loss) before taxes. (3) Based on operating cash flow less capex. (4) 2009 free cash flow adjusted for non-recurring activity of: (a) capitalized accrued interest on Senior Toggle Notes ($29) million, (b) cash restructuring charge $51 million, (c) accounts payable early payments $3 million, (d) delayed accounts receivable receipts $19 million and (e) Lehman LIBOR swap settlement $17 million. (5) 2011 free cash flow adjusted for non-recurring activity of: Fee to terminate services agreement with Sponsors $16 |
 Sustainable Margins with Further Enhancement Opportunities 24 International Manufacturing India (~$107mm total investment; ~$7mm remaining (1) ) – New facility constructed to better serve Asia-Pacific – Phase I: In-source component manufacturing (Q3 2010) – Phase II: Assembly of 1000/2000 Series (Q3 2012) Hungary (~$17mm total investment (1) ) – Relocate assembly of 3000/4000 Series (Q2 2011) ~90% of 2011 N.A. On-Highway Unit Volume was covered by long- term customer supply agreements Workforce Optimization (cost/employee) Hours Per Unit continue to decline Source: Allison. (1) As of 3/31/2012. ~30% of total UAW workforce Manufacturing Efficiencies (hours/unit) Long-Term Customer Supply Agreements ~90% Significant savings driven by retirement of Tier I workers; 800 hourly employees are retirement eligible (~53% of workforce) 1000/2000 Series 3000 Series 4000 Series 2005 2011 Tier I Tier II |
 25 Significant Cash Flow Generation $4,204 $3,753 $3,721 $3,419 $3,065 $2,981 6.9x 7.4x 5.5x 4.3x 3.9x At Acquisition 2008 2009 2010 2011 LTM Free Cash Flow Generation (1) Net Debt (2) $378 $81 $61 $16 $315 $142 $193 $372 $394 9.4% 17.2% 17.5% 16.4% 8.0% 2008 2009 2010 2011 LTM Free Cash Flow Certain Non-Recurring Activity % of Sales ($ in millions) ($ in millions) (3,4) Note: See appendix for comments regarding the presentation of non-GAAP measures. Net debt reduction of more than $1.2 bn since acquisition (6) (5) (5) (1) Free cash flow defined as cash flow from operations less capex. (2) Net debt defined as total debt minus cash and cash equivalents. (3) 2009 free cash flow adjusted for certain non-recurring activity of (a) capitalized accrued interest on Senior Toggle Notes ($29) million, (b) cash restructuring charge $51 million, (c) accounts payable early payments $3 million, (d) delayed accounts receivable receipts $19 million and (e) Lehman LIBOR swap settlement $17 million. (4) LTM free cash flow adjusted for certain non-recurring activity: 1Q 2012 Fee to terminate services agreement with sponsors $16 (5) LTM 3/31/2012 (6) Represents debt reduction through 3/31/2012. |
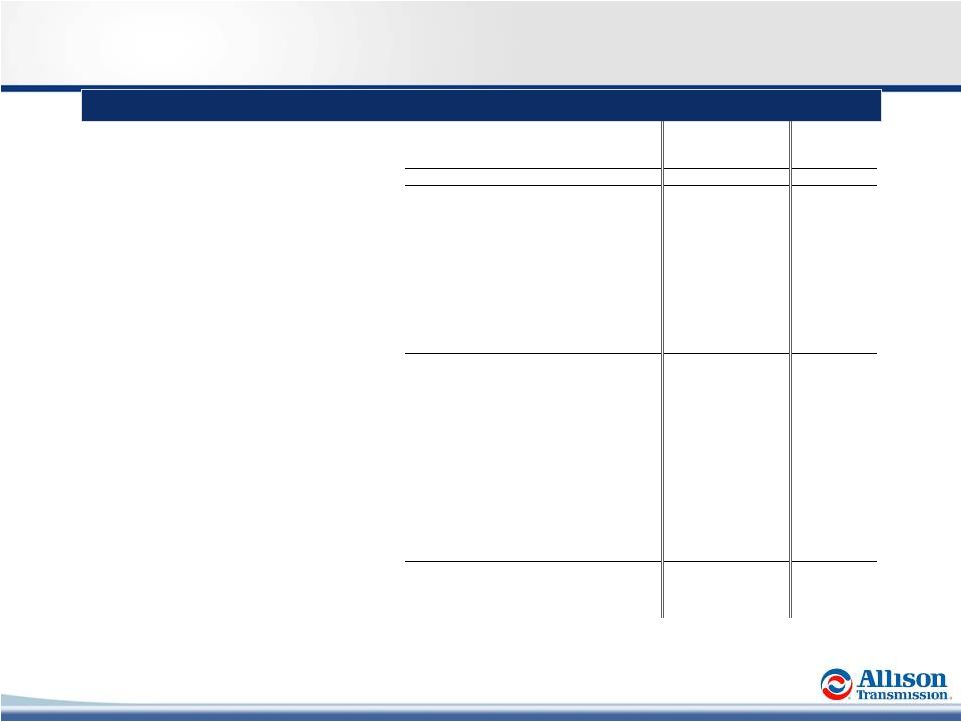
 26 Income Tax Attributes Carlyle and Onex acquired Allison from General Motors in August 2007 – Asset deal structure – Step-up in basis for U.S. federal income tax purposes As of 12/31/2011 Allison had $3.3bn of unamortized intangible assets – Expect annual U.S. federal income tax deductions of $315mm through 2021 and $183mm in 2022 Net operating loss carryforward of $382mm as of 12/31/2011 Income Tax attributes overview (1) Assuming continued profitability and no limitations at an assumed 38.5% federal and state tax rate. (2) Calculated at a 35.0% federal tax rate on the $382mm of federal NOL carryforward balance as of 12/31/2011. (3) Based on annual discount rate of 5-10%; includes both amortization of intangibles and federal NOL’s (contingent on timing of taxable income). Results in present value tax savings of $900-$1,100mm (3) ($ millions) Total 2012 2013 2014 2015 2016 2017 2018 2019 2020 2021 2022 Annual tax amortization $3,333 $315 $315 $315 $315 $315 $315 $315 $315 $315 $315 $183 Cash tax savings 1 1,283 121 121 121 121 121 121 121 121 121 121 70 Cash tax savings of NOLs 2 134 Grand total $1,417 |
 Summary / Guidance / Q&A 27 |
 Strategic Priorities Expand global market leadership – Capitalize on continued market recovery – New vocational offerings Emerging markets penetration – Vocational ladder strategy – Increase number of vehicle releases Continued focus on new technologies and product development – Address markets adjacent to core – Advanced fuel efficient technologies Deliver strong financial results – Earnings growth and cash flow generation – Focus on continued margin enhancement 28 |
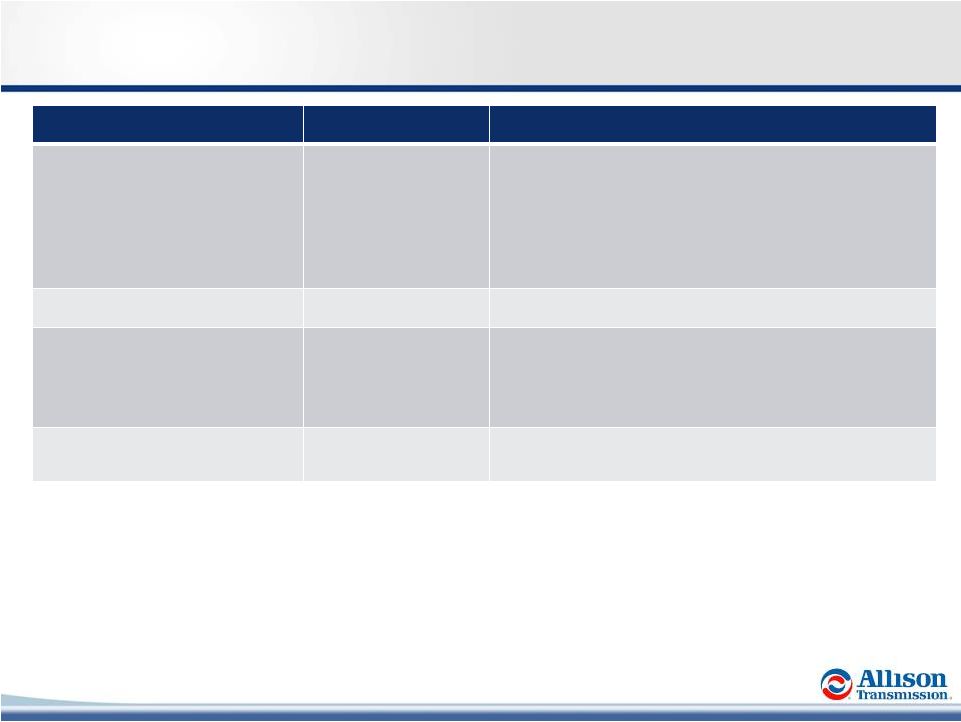 Full Year 2012 Guidance Guidance Commentary on Full Year Net Sales Growth from 2011 5 to 7 percent Assumes year over year growth in global on- highway and Outside North America off-highway end markets partially offset by year over year reductions in North America off-highway, tracked military products and North America hybrid- propulsion systems for transit bus end markets Adjusted EBITDA % (1) 33.5 to 34.5 percent Driven by sales mix and volume timing CapEx ($ in millions) Maintenance New Facilities New Product Programs $55 to $60 $25 to $30 $30 to $40 New facilities and product programs subject to timely completion of development and sourcing milestones Cash Income Taxes ($ in millions) $10 to $15 U.S. income tax shield and net operating loss utilization Note: See appendix for comments regarding the presentation of non-GAAP information. 29 |
 Appendix: Non-GAAP Financial Information 30 |
 Non-GAAP Financial Information We use Adjusted net income, Adjusted EBITDA, Adjusted EBITDA margin, adjusted free cash flow and free cash flow to evaluate our performance relative to that of our peers. In addition, the Senior Secured Credit Facility has certain covenants that incorporate Adjusted EBITDA. However, Adjusted net income, Adjusted EBITDA, Adjusted EBITDA margin, adjusted free cash flow and free cash flow are not measurements of financial performance under GAAP, and these metrics may not be comparable to similarly titled measures of other companies. Adjusted net income is calculated as the sum of net income (loss), interest expense, net, income tax expense, trade name impairment and amortization of intangible assets, less cash interest expense, net and cash income taxes. Adjusted EBITDA is calculated as the sum of Adjusted net income, cash interest expense, net, cash income taxes, depreciation of property, plant and equipment and other adjustments as defined by the Senior Secured Credit Facility and as further described below. Adjusted EBITDA margin is calculated as Adjusted EBITDA divided by net sales. Free cash flow is calculated as net cash provided by operating activities less capital expenditures. Adjusted free cash flow is free cash flow adjusted for non-recurring items. We use Adjusted net income to measure our overall profitability because it better reflects our cash flow generation by capturing the actual cash taxes paid rather than our tax expense as calculated under GAAP and excludes the impact of the non-cash annual amortization of certain intangible assets that were created at the time of the Acquisition Transaction. We use Adjusted EBITDA and Adjusted EBITDA margin to evaluate and control our cash operating costs and to measure our operating profitability. We use adjusted free cash flow and free cash flow to evaluate the amount of cash generated by the business that, after the capital investment needed to maintain and grow our business, can be used for strategic opportunities, including investing in our business and strengthening our balance sheet. We believe the presentation of Adjusted net income, Adjusted EBITDA, Adjusted EBITDA margin, adjusted free cash and free cash flow enhances our investors' overall understanding of the financial performance and cash flow of our business. You should not consider Adjusted net income, Adjusted EBITDA, Adjusted EBITDA margin, adjusted free cash flow and free cash flow as an alternative to net income (loss), determined in accordance with GAAP, as an indicator of operating performance, or as an alternative to net cash provided by operating activities, determined in accordance with GAAP, as an indicator of Allison’s cash flow. 31 |
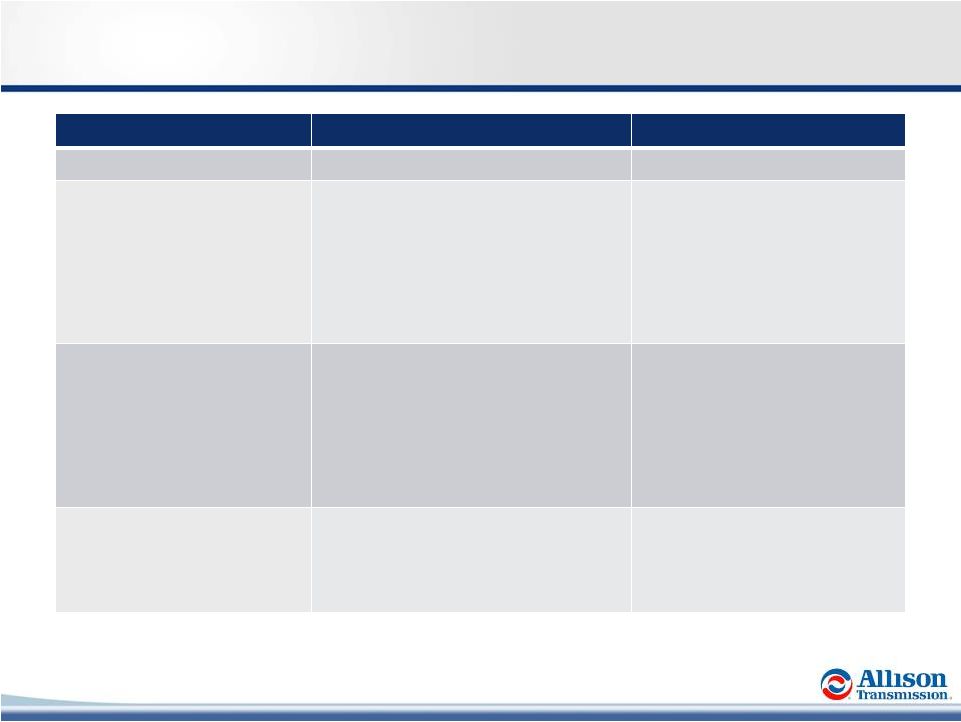
 Non-GAAP Reconciliations (1 of 2) 32 Adjusted Net Income and Adjusted EBITDA Reconciliation (1) Includes charges or income related to legacy employee benefits, shared income with General Motors, benefit plan adjustments, transitional costs to establish Allison as a stand-alone entity, pension curtailment adjustments, employee stock compensation expense, service fees paid to Allison’s Sponsors and an adjustment for the settlement of litigation which originated with the Predecessor but was assumed by the Company as part of the Acquisition Transaction. $ in millions Last twelve months ended March 31, 2008 2009 2010 2011 2011 2012 2012 Net (Loss) Income ($328.1) ($323.9) $29.6 $103.0 $36.9 $58.0 $124.1 plus: Interest expense, net 385.9 234.2 277.5 217.3 49.6 40.7 208.4 Cash interest expense, net (334.2) (242.5) (239.1) (208.6) (29.9) (36.1) (214.8) Income tax expense 37.1 41.4 53.7 47.6 18.0 25.2 54.8 Cash income taxes (4.3) (5.5) (2.2) (5.8) (1.6) (2.9) (7.1) Fee to terminate services agreement with Sponsors — — — — — 16.0 16.0 Initial public offering expenses — — — — — 5.7 5.7 Trade name impairment 179.8 190.0 — — — — — Amortization of intangible assets 156.5 155.9 154.2 151.9 38.0 37.5 151.4 Adjusted Net Income $92.7 $49.6 $273.7 $305.4 $111.0 $144.1 $338.5 Cash interest expense, net 334.2 242.5 239.1 208.6 29.9 36.1 214.8 Cash income taxes 4.3 5.5 2.2 5.8 1.6 2.9 7.1 Depreciation of property, plant and equipment 106.6 105.9 99.6 103.8 25.7 24.6 102.7 Loss on repurchases of long-term debt — — — — — 13.5 13.5 Premiums and expenses on tender offer of long-term debt — — — 56.9 — — 56.9 Dual power inverter module extended coverage 2.2 11.4 (1.9) — — — — (Gain) / loss on repurchases of long-term debt (21.0) (8.9) (3.3) 16.0 — — 16.0 Unrealized (gain) loss on hedge contracts — (5.8) 0.1 6.8 (1.6) (0.7) 7.7 Reduction of supply contract liability — — (3.4) — — — — Restructuring charges 15.7 47.9 — — — — — Other, net (1) 9.3 53.2 10.9 8.6 2.7 2.5 8.4 Adjusted EBITDA $544.0 $501.3 $617.0 $711.9 $169.3 $223.0 $765.6 Net Sales $2,061.4 $1,766.7 $1,926.3 $2,162.8 $517.0 $601.9 $2,247.7 Adjusted EBITDA Margin 26.4% 28.4% 32.0% 32.9% 32.7% 37.0% 34.1% For the year ended December 31, Three months ended March 31, |
 $ in millions Last twelve months ended March 31, 2008 2009 2010 2011 2011 2012 2012 Net Cash Provided by Operating Activities $268.1 $168.7 $388.9 $469.2 $109.9 $139.6 $498.9 (Deductions) or Additions: Long-lived assets (75.3) (88.2) (73.8) (96.9) (11.6) (35.7) (121.0) Fee to terminate services agreement with Sponsors — — — — — 16.0 16.0 Non-Recurring Activity (1) — 61.0 — — — — — Adjusted Free Cash Flow $192.8 $141.5 $315.1 $372.3 $98.3 $119.9 $393.9 Net Sales $2,061.4 $1,766.7 $1,926.3 $2,162.8 $517.0 $601.9 $2,247.7 Adjusted Free Cash Flow (% to Net Sales) 9.4% 8.0% 16.4% 17.2% 19.0% 19.9% 17.5% For the year ended December 31, Three months ended March 31, Non-GAAP Reconciliations (2 of 2) 33 Adjusted Free Cash Flow (1) 2009 adjusted for certain non-recurring activity: (a) capitalized accrued interest on Senior Toggle Notes ($29) million, (b) cash restructuring charge $51 million, (c) accounts payable early payments $3 million, (d) delayed accounts receivable receipts $19 million and (e) Lehman LIBOR swap settlement $17 million. |
 Key Definitions 34 |
 Key Definitions Types of Transmissions Fully-automatic transmission Utilize technology that smoothly shifts gears without power interruption Automated manual transmission Manual transmissions that feature automated operation of the disconnect clutch with power interruption Manual transmission Utilize a disconnect clutch with power interruption Most prevalent transmission type used in North America Class 8 tractors and in medium and heavy- duty commercial vehicles outside North America 35 End Markets North America Outside North America On-Highway On-Highway Off-Highway Off-Highway Hybrid Transit Bus Military Service Parts, Support Equipment and Other Service Parts, Support Equipment and Other |
 End Markets – North America (1 of 2) On-Highway Trucks Classes Vocation Class 4-5 - Medium duty Class 6-7 - Heavy duty Lease and rental Emergency - ambulance, fire, rescue Distribution - logistics, parcel delivery Airport operations Refuse Utilities Class 8 Straight Metro Tractor Tractor Refuse Distribution Emergency - fire Construction Transport cargo (dock spotters) Distribution Line haul Buses Buses School Transit: Conventional (urban) Shuttle (airport) Coach (long distance) Motorhomes Type A - large (gasoline and diesel) 36 Hybrid Transit Bus Buses and shuttle buses Public transit |
 Off-Highway Vehicle Vocation Well-stimulation equipment (stationary and mobile) Pumping equipment, Well servicing rigs Rigid dump trucks Underground trucks Heavy haul tractor trailer trucks Specialty vehicles Airport crash trucks (large fire trucks) Energy Mining Construction / Specialty 37 End Markets – North America (2 of 2) Military Medium- and heavy- tactical wheeled platforms Armored security vehicle (ASV) Family of medium tactical vehicles (FMTV) Heavy expanded mobility tactical truck (HEMTT) Heavy equipment transporter (HET) Logistic vehicle system replacement (LVSR) Mine resistant ambush protected (MRAP) Palletized load system (PLS) M900 family of vehicles Stryker Tracked combat platforms Abrams Tank M113 Service Parts, Support Equipment and Other Service parts, support equipment, remanufactured transmissions, fluids |
 38 End Markets – Outside North America (1 of 2) On-Highway Trucks Classes Vocation 3.5 – 7.5 tonnes 7.5 – 16 tonnes Commercial – lease and rental Emergency – ambulance, fire, rescue Distribution – logistics, parcel delivery Airport operations Refuse Utilities Greater than 16 tonnes Straight Truck Metro Tractor Refuse Distribution Emergency – fire Transport cargo (dock spotters) Specialty vehicles (crane carriers) Construction Distribution Buses Buses School Transit: Conventional (urban) Shuttle (airport) Coach (long distance) |
 Off-Highway Vehicle Vocation Well stimulation equipment (stationary and mobile) Rigid dump trucks Underground trucks Heavy haul tractor trailer trucks Specialty vehicles Airport crash trucks (large fire trucks) Energy Mining Construction / Specialty 39 End Markets – Outside North America (2 of 2) Service Parts, Support Equipment and Other Service parts, support equipment, remanufactured transmissions, fluids |