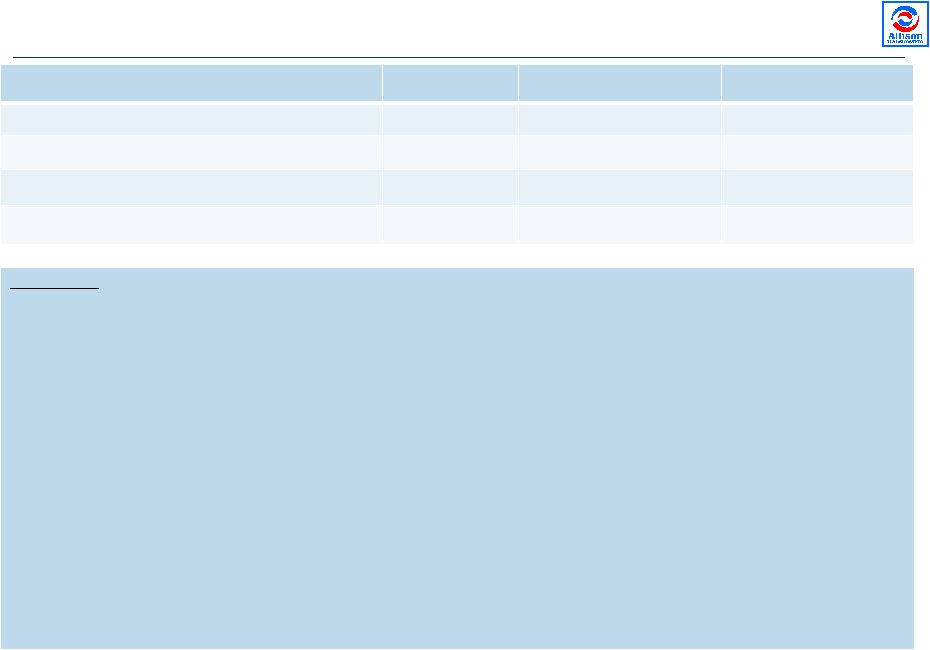
Non-GAAP Reconciliations (1 of 2) Adjusted Net Income and Adjusted EBITDA reconciliation (1) Includes charges or income related to legacy employee benefits, shared income with General Motors, benefit plan adjustments, transitional costs to establish Allison as a stand-alone entity, pension curtailment adjustments, employee stock compensation expense, service fees paid to Allison’s Sponsors and an adjustment for the settlement of litigation which originated with the Predecessor but was assumed by the Company as part of the Acquisition Transaction. 11 $ in millions, Unaudited Last twelve months ended September 30, 2009 2010 2011 2012 2012 2013 2013 Net (loss) income ($323.9) $29.6 $103.0 $514.2 $32.2 $44.5 $133.7 plus: Interest expense, net 234.2 277.5 217.3 151.2 40.8 37.3 140.1 Cash interest expense (242.5) (239.1) (208.6) (167.3) (31.8) (33.3) (159.6) Income tax expense (benefit) 41.4 53.7 47.6 (298.0) 17.0 27.9 86.0 Cash income taxes (5.5) (2.2) (5.8) (10.7) (2.6) (0.5) (5.2) Fee to terminate services agreement with Sponsors — — — 16.0 — — — Technology-related investment expenses — — — 14.4 6.4 — 2.5 Public offering expenses — — — 6.1 — 0.3 0.9 Trade name impairment 190.0 — — — — — — Amortization of intangible assets 155.9 154.2 151.9 150.0 37.5 25.1 117.6 Adjusted net income $49.6 $273.7 $305.4 $375.9 $99.5 $101.3 $316.0 Cash interest expense 242.5 239.1 208.6 167.3 31.8 33.3 159.6 Cash income taxes 5.5 2.2 5.8 10.7 2.6 0.5 5.2 Depreciation of property, plant and equipment 105.9 99.6 103.8 102.5 26.1 24.4 100.6 (Gain)/loss on repurchases of long-term debt (8.9) (3.3) 16.0 22.1 0.5 0.5 1.0 Dual power inverter module extended coverage 11.4 (1.9) — 9.4 — (2.4) (2.4) UAW Local 933 signing bonus — — — 8.8 — — 8.8 Benefit plan re-measurement — — — 2.3 — — — Unrealized (gain) loss on commodity hedge contracts (5.8) 0.3 6.5 (1.0) (2.1) (0.8) 1.0 Unrealized (gain) loss on foreign exchange — (0.2) 0.3 0.1 0.0 1.8 2.6 Premiums and expenses on tender offer for long-term debt — — 56.9 — — — — Restructuring charges 47.9 — — — — — 1.0 Reduction of supply contract liability — (3.4) — — — — — Other, net (1) 53.2 10.9 8.6 7.0 1.1 3.0 12.4 Adjusted EBITDA $501.3 $617.0 $711.9 $705.1 $159.5 $161.6 $605.8 Adjusted EBITDA excluding technology-related license expenses $501.3 $617.0 $711.9 $717.1 $171.5 $161.6 $611.8 Net Sales $1,766.7 $1,926.3 $2,162.8 $2,141.8 $493.5 $466.3 $1,922.8 Adjusted EBITDA margin 28.4% 32.0% 32.9% 32.9% 32.3% 34.7% 31.5% Adjusted EBITDA margin excl technology-related license expenses 28.4% 32.0% 32.9% 33.5% 34.8% 34.7% 31.8% Three months ended September 30, For the year ended December 31, |