![]() Q2 2014 Earnings Release Published July 23, 2014 (Earnings Conference Call July 24, 2014) Lawrence Dewey, Chairman, President & Chief Executive Officer David Graziosi, Executive Vice President & Chief Financial Officer Exhibit 99.2 |
![]() 2 Safe Harbor Statement The following information contains, or may be deemed to contain, “forward-looking statements” (as defined in the U.S. Private Securities Litigation Reform Act of 1995). The words “believe,” “expect,” “anticipate,” “intend,” “estimate” and other expressions that are predictions of or indicate future events and trends and that do not relate to historical matters identify forward-looking statements. You should not place undue reliance on these forward-looking statements. Although forward-looking statements reflect management’s good faith beliefs, reliance should not be placed on forward-looking statements because they involve known and unknown risks, uncertainties and other factors, which may cause the actual results, performance or achievements to differ materially from anticipated future results, performance or achievements expressed or implied by such forward-looking statements. Forward-looking statements speak only as of the date the statements are made. We undertake no obligation to publicly update or revise any forward-looking statement, whether as a result of new information, future events, changed circumstances or otherwise. These forward-looking statements are subject to numerous risks and uncertainties, including, but not limited to: risks related to our substantial indebtedness; our participation in markets that are competitive; the highly cyclical industries in which certain of our end users operate; the failure of markets outside North America to increase adoption of fully-automatic transmissions; the concentration of our net sales in our top five customers and the loss of any one of these; future reductions or changes in government subsidies for hybrid vehicles; U.S. defense spending; general economic and industry conditions; the discovery of defects in our products, resulting in delays in new model launches, recall campaigns and/or increased warranty costs and reduction in future sales or damage to our brand and reputation; our ability to prepare for, respond to and successfully achieve our objectives relating to technological and market developments and changing customer needs; risks associated with our international operations; and labor strikes, work stoppages or similar labor disputes, which could significantly disrupt our operations or those of our principal customers. Allison Transmission cannot assure you that the assumptions made in preparing any of the forward- looking statements will prove accurate or that any long-term financial goals will be realized. All forward-looking statements included in this presentation speak only as of the date made, and Allison Transmission undertakes no obligation to update or revise publicly any such forward-looking statements, whether as a result of new information, future events, or otherwise. In particular, Allison Transmission cautions you not to place undue weight on certain forward-looking statements pertaining to potential growth opportunities, long-term financial goals or the value we currently ascribe to certain tax attributes set forth herein. Actual results may vary significantly from these statements. Allison Transmission’s business is subject to numerous risks and uncertainties, which may cause future results of operations to vary significantly from those presented herein. Important factors that could cause actual results to differ materially are discussed in Allison Transmission’s Annual Report on Form 10-K for the year ended December 31, 2013. |
![]() Non-GAAP Financial Information 3 We use Adjusted net income, Adjusted EBITDA, Adjusted EBITDA excluding technology-related license expenses, Adjusted EBITDA margin, Adjusted EBITDA margin excluding technology-related license expenses, adjusted free cash flow and free cash flow to evaluate our performance relative to that of our peers. In addition, the Senior Secured Credit Facility has certain covenants that incorporate Adjusted EBITDA. However, Adjusted net income, Adjusted EBITDA, Adjusted EBITDA excluding technology-related license expenses, Adjusted EBITDA margin, Adjusted EBITDA margin excluding technology-related license expenses, adjusted free cash flow and free cash flow are not measurements of financial performance under GAAP, and these metrics may not be comparable to similarly titled measures of other companies. Adjusted net income is calculated as the sum of net income (loss), interest expense, net, income tax expense (benefit), trade name impairment and amortization of intangible assets, less cash interest, net and cash income taxes, and adjusted for certain non-recurring items. Adjusted EBITDA is calculated as the sum of Adjusted net income, cash interest, net, cash income taxes, depreciation of property, plant and equipment and other adjustments as defined by the Senior Secured Credit Facility and as further described below. Adjusted EBITDA excluding technology-related license expenses is calculated as Adjusted EBITDA less technology-related license expenses. Adjusted EBITDA margin is calculated as Adjusted EBITDA divided by net sales. Adjusted EBITDA margin excluding technology-related license expenses is calculated as Adjusted EBITDA excluding technology-related license expenses divided by net sales. Free cash flow is calculated as net cash provided by operating activities less capital expenditures. Adjusted free cash flow is free cash flow adjusted for non-recurring items. We use Adjusted net income to measure our overall profitability because it better reflects our cash flow generation by capturing the actual cash interest paid and cash taxes paid rather than our interest expense and tax expense as calculated under GAAP and excludes the impact of the non- cash annual amortization of certain intangible assets that were created at the time of the Acquisition Transaction. We use Adjusted EBITDA, Adjusted EBITDA excluding technology-related license expenses, Adjusted EBITDA margin and Adjusted EBITDA margin excluding technology- related license expenses to evaluate and control our cash operating costs and to measure our operating profitability. We use adjusted free cash flow and free cash flow to evaluate the amount of cash generated by the business that, after the capital investment needed to maintain and grow our business, can be used for strategic opportunities, including investing in our business and strengthening our balance sheet. We believe the presentation of Adjusted net income, Adjusted EBITDA, Adjusted EBITDA excluding technology-related license expenses, Adjusted EBITDA margin, Adjusted EBITDA margin excluding technology-related license expenses and adjusted free cash flow enhances our investors' overall understanding of the financial performance and cash flow of our business. You should not consider Adjusted net income, Adjusted EBITDA, Adjusted EBITDA excluding technology-related license expenses, Adjusted EBITDA margin, Adjusted EBITDA margin excluding technology-related license expenses, adjusted free cash flow and free cash flow as an alternative to net income (loss), determined in accordance with GAAP, as an indicator of operating performance, or as an alternative to net cash provided by operating activities, determined in accordance with GAAP, as an indicator of Allison’s cash flow. |
![]() 4 Call Agenda Q2 2014 Performance Full Year 2014 Guidance Update |
![]() 5 Q2 2014 Performance Summary ($ in millions) Q2 2014 Q2 2013 % Variance Net Sales $536 $512 4.7% Gross Margin % 44.5% 44.2% +30 bps Adjusted Net Income (1) $117 $89 30.4% Adjusted Free Cash Flow (1) $132 $117 13.1% Commentary Net Sales: the increase was principally driven by the continued recovery in the North America On-Highway and Off- Highway end markets, and higher demand in the Service Parts, Support Equipment & Other end market partially offset by lower demand in the Outside North America end markets and previously contemplated reductions in U.S. defense spending. Gross Margin: the increase was principally driven by increased net sales and price increases on certain products partially offset by unfavorable material costs. Adjusted Net Income: the increase was principally driven by increased net sales, price increases on certain products, reduced product initiatives spending and decreased cash interest expense partially offset by unfavorable material costs. Adjusted Free Cash Flow: the increase was principally driven by increased net cash provided by operating activities. (1) See Appendix for a reconciliation of Adjusted Net Income and Adjusted Free Cash Flow. |
![]() 6 Q2 2014 Sales Performance ($ in millions) End Markets Q2 2014 Q2 2013 % Variance Commentary North America On-Hwy $243 $216 13% Increased demand for Rugged Duty Series and Pupil Transport/Shuttle Series models North America Hybrid- Propulsion Systems for Transit Bus $28 $27 4% Increased demand principally driven by intra-year movement in the timing of orders North America Off-Hwy $23 $8 188% Increased demand driven by hydraulic fracturing applications Defense $49 $58 (16%) Continued reductions in U.S. defense spending to longer term averages experienced during periods without active conflicts partially offset by the recognition of previously deferred tracked revenue Outside North America On-Hwy $62 $75 (17%) Weakness in China, Europe and South America Outside North America Off-Hwy $24 $36 (33%) Weaker demand conditions in the energy sector partially offset by higher demand from the mining sector Service Parts, Support Equipment & Other $107 $92 16% Increased demand for North America service parts and North America On-Highway support equipment Total $536 $512 5% |
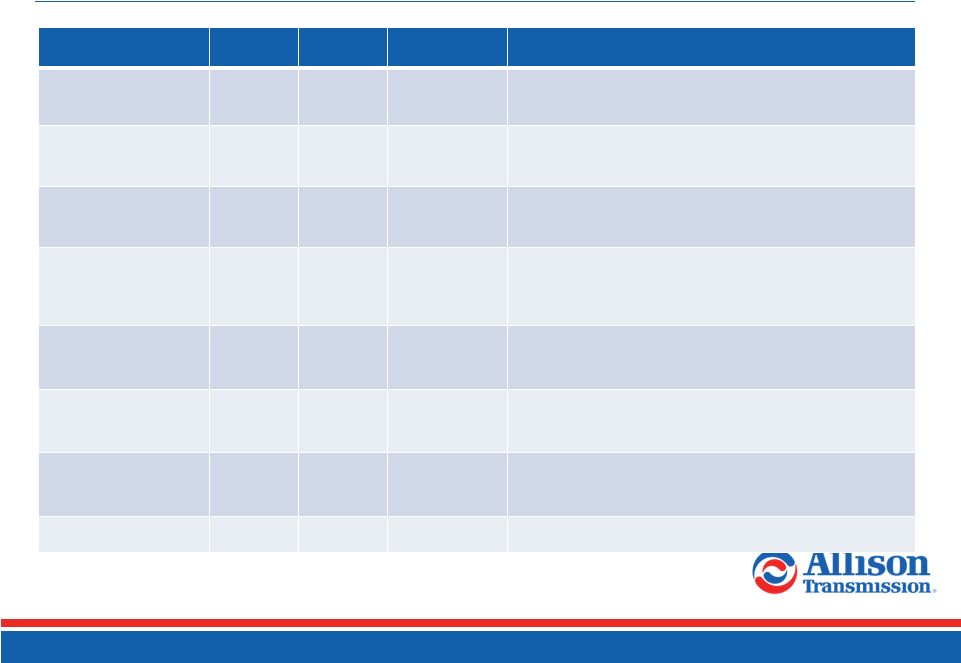
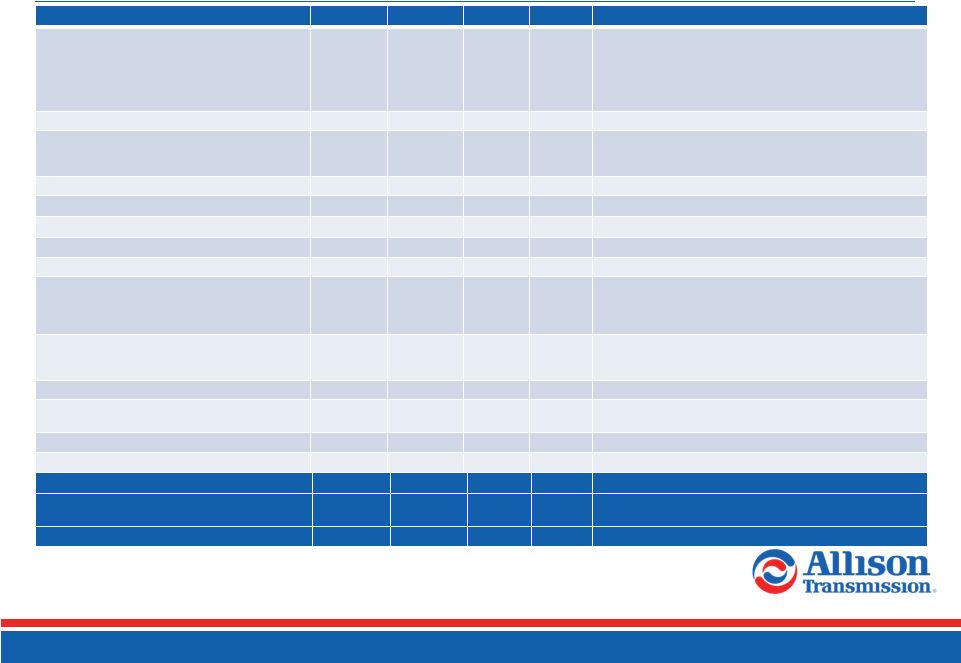
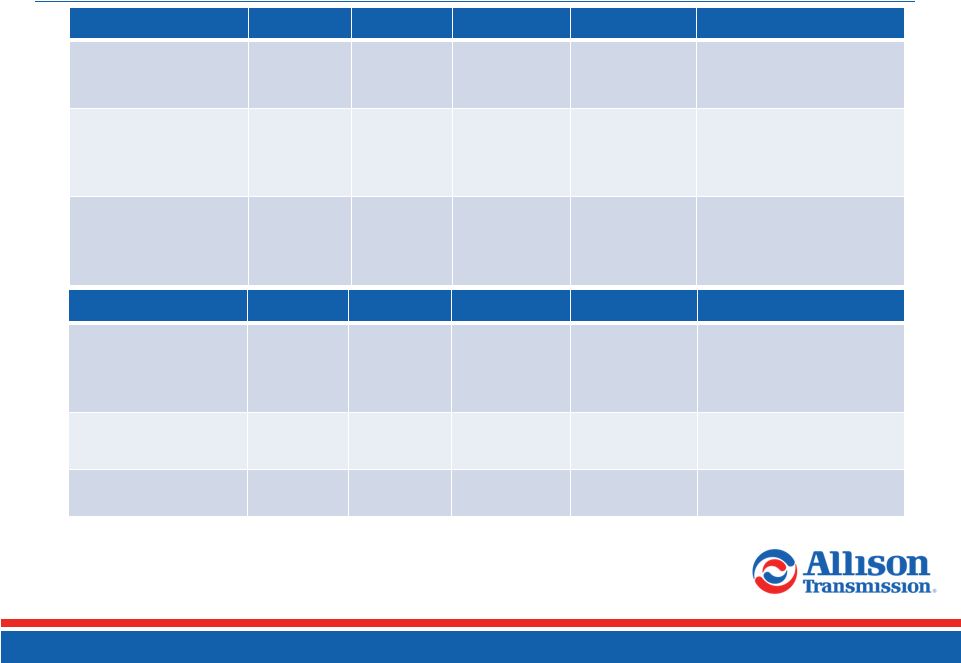
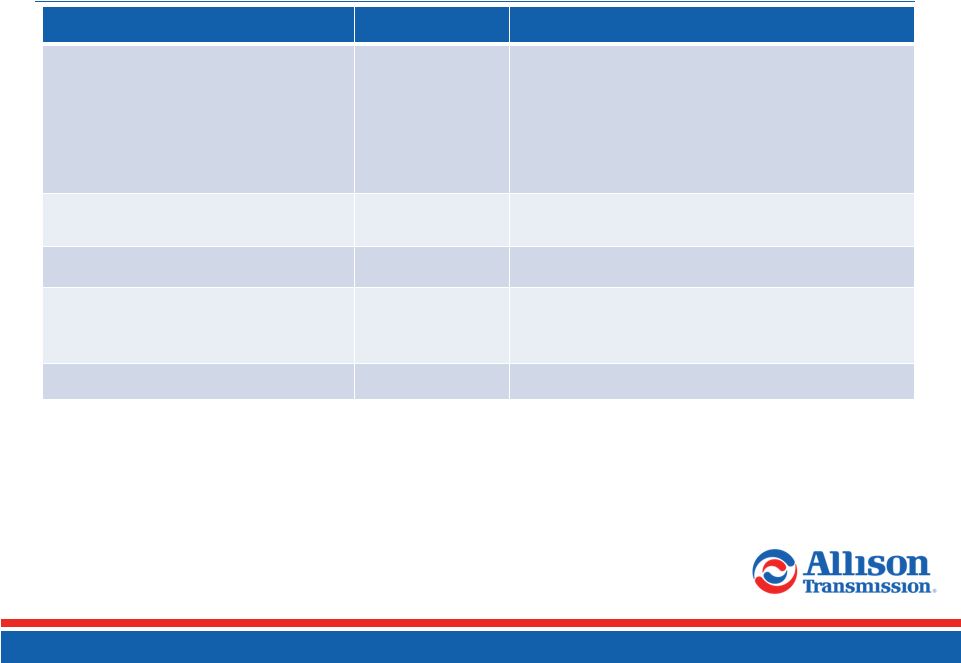
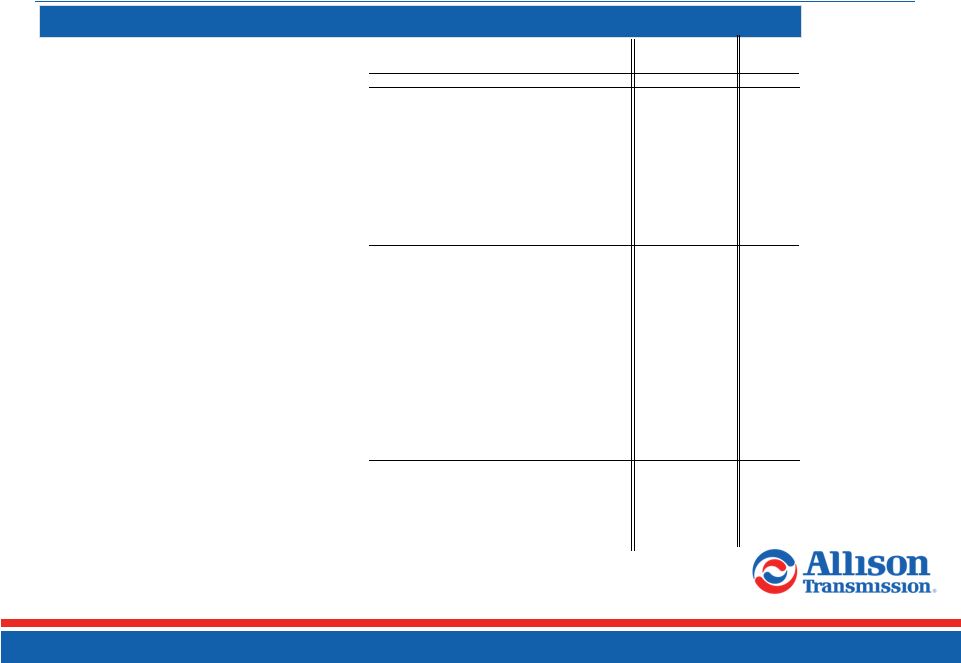
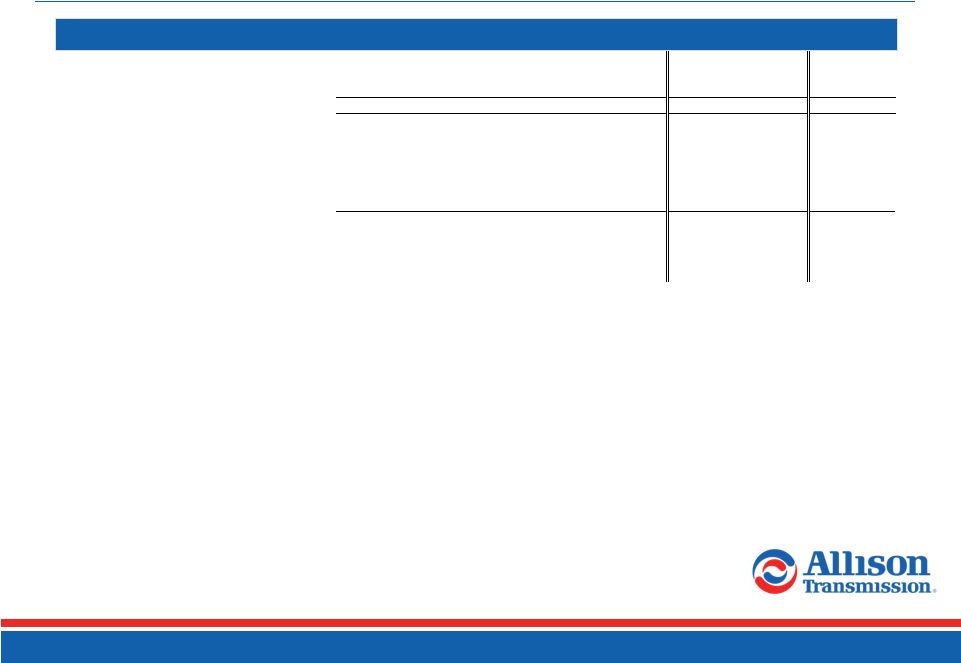
![]() 7 Q2 2014 Financial Performance ($ in millions, except share data) Q2 2014 Q2 2013 $ Var % Var Commentary Net Sales $536.1 $512.1 $24.0 4.7% Increase principally driven by the continued recovery in the North America On-Highway and Off-Highway end markets, and higher demand in the Service Parts, Support Equipment & Other end market partially offset by lower demand in the Outside North America end markets and previously contemplated reductions in U.S. defense spending Cost of Sales $297.6 $286.0 ($11.6) (4.1%) Gross Profit $238.5 $226.1 $12.4 5.5% Increase principally driven by increased net sales and price increases on certain products partially offset by unfavorable material cost Operating Expenses Selling, general and administrative expenses $85.1 $85.6 $0.5 0.6% Engineering – research and development $21.2 $22.8 $1.6 7.0% Decrease principally driven by reduced product initiatives spending Total operating expenses $106.3 $108.4 $2.1 1.9% Operating Income $132.2 $117.7 $14.5 12.3% Interest Expense, net ($36.6) ($33.3) ($3.3) (9.9%) Increase principally driven by less favorable mark-to-market adjustments for interest rate derivatives partially offset by debt repayments and lower LIBOR swap and senior secured credit facility rates Other Expense, net ($0.9) ($2.6) $1.7 65.4% Decrease principally driven by gains on derivative contracts and favorable foreign exchange partially offset by lower grant program income Income Before Income Taxes $94.7 $81.8 $12.9 15.8% Income Tax Expense ($37.5) ($31.3) ($6.2) (19.8%) Change in effective tax rate principally driven by the change in discrete activity Net Income $57.2 $50.5 $6.7 13.3% Diluted Earnings Per Share $0.31 $0.26 $0.05 19.2% Q2 2014: 181.6M shares; Q2 2013: 189.9M shares Adjusted EBITDA (1) $186.1 $171.6 $14.5 8.4% Adjusted EBITDA excluding technology-related license expenses (1) $186.1 $171.6 $14.5 8.4% Adjusted Net Income (1) $116.6 $89.4 $27.2 30.4% (1) See Appendix for a reconciliation from Net Income. |
![]() Q2 2014 Cash Flow Performance ($ in millions) Q2 2014 Q2 2013 $ Variance % Variance Commentary Net Cash Provided by Operating Activities $143 $130 $13 10.6% Principally driven by increased net sales CapEx $12 $13 ($1) (12.1%) Capital spending in line with prior year Adjusted Free Cash Flow (1) $132 $117 $15 13.1% Principally driven by increased cash provided by operating activities ($ in millions) Q2 2014 Q2 2013 $ Variance % Variance Commentary Operating Working Capital (2) Percentage of LTM Sales 11.2% 10.4% N/A 80 bps Principally driven by increased net sales Cash Paid for Interest $39 $50 ($11) (21.0%) Principally driven by debt repayments and refinancing, and timing Cash Paid for Income Taxes $1 $2 ($1) (44.4%) Foreign payments timing (1) See Appendix for a reconciliation of Adjusted Free Cash Flow. (2) Operating Working Capital = A/R + Inventory – A/P. 8 |
![]() 9 Full Year 2014 Guidance Update Guidance Commentary Net Sales Growth from 2013 4 to 6 percent In the second half of 2014 we expect net sales to increase on a year-over-year basis principally driven by improved demand conditions in the North America On-Highway and Off-Highway end markets, weakness in the Outside North America On-Highway end market and previously contemplated reductions in U.S. defense spending Adjusted EBITDA Margin excluding technology-related license expenses 32.5 to 34.0 percent Principally driven by sales mix and volume timing Adjusted Free Cash Flow ($ in millions) $385 to $425 $2.12 to $2.34 per diluted share CapEx ($ in millions) Maintenance New Product Programs $55 to $60 $5 to $10 Subject to timely completion of development and sourcing milestones Cash Income Taxes ($ in millions) $10 to $15 U.S. income tax shield and net operating loss utilization |
![]() APPENDIX Non-GAAP Financial Information * * * * * * * * ***** ***** ***** ***** ***** ***** ***** ***** ***** **** |
![]() ![]() 11 (1) Includes charges or income related to legacy employee benefits, shared income with General Motors, benefit plan adjustments, transitional costs to establish Allison as a stand-alone entity, pension curtailment adjustments, employee stock compensation expense, service fees paid to Allison’s Sponsors and an adjustment for the settlement of litigation which originated with the Predecessor but was assumed by the Company as part of the Acquisition Transaction. $ in millions, Unaudited Last twelve months ended June 30, 2009 2010 2011 2012 2013 2013 2014 2014 Net (loss) income ($323.9) $29.6 $103.0 $514.2 $165.4 $50.5 $57.2 $196.7 plus: Interest expense, net 234.2 277.5 217.3 151.2 132.9 33.3 36.6 137.4 Cash interest expense (242.5) (239.1) (208.6) (167.3) (159.2) (49.6) (39.2) (148.2) Income tax expense (benefit) 41.4 53.7 47.6 (298.0) 100.7 31.3 37.5 117.2 Cash income taxes (5.5) (2.2) (5.8) (10.7) (3.8) (1.8) (1.0) (3.9) Fee to terminate services agreement with Sponsors — — — 16.0 — — — — Technology-related investment expenses — — — 14.4 5.0 — — 2.5 Public offering expenses — — — 6.1 1.6 0.6 0.8 2.1 Trade name impairment 190.0 — — — — — — — Amortization of intangible assets 155.9 154.2 151.9 150.0 105.3 25.1 24.7 99.7 Adjusted net income $49.6 $273.7 $305.4 $375.9 $347.9 $89.4 $116.6 $403.5 Cash interest expense 242.5 239.1 208.6 167.3 159.2 49.6 39.2 148.2 Cash income taxes 5.5 2.2 5.8 10.7 3.8 1.8 1.0 3.9 Depreciation of property, plant and equipment 105.9 99.6 103.8 102.5 98.7 25.0 24.1 96.4 (Gain)/loss on redemptions and repayments of long-term debt (8.9) (3.3) 16.0 22.1 0.8 — — 0.8 Dual power inverter module extended coverage 11.4 (1.9) — 9.4 (2.4) — — (2.4) UAW Local 933 signing bonus — — — 8.8 — — — — Benefit plan re-measurement — — — 2.3 — — — — Unrealized (gain) loss on commodity hedge contracts (5.8) 0.3 6.5 (1.0) 1.5 0.6 (1.2) (1.5) Unrealized (gain) loss on foreign exchange — (0.2) 0.3 0.1 2.3 (0.1) 1.7 3.2 Premiums and expenses on tender offer for long-term debt — — 56.9 — — — — — Restructuring charges 47.9 — — — 1.0 1.0 0.7 0.7 Reduction of supply contract liability — (3.4) — — — — — — Other, net (1) 53.2 10.9 8.6 7.0 13.8 4.3 4.0 13.4 Adjusted EBITDA $501.3 $617.0 $711.9 $705.1 $626.6 $171.6 $186.1 $666.2 Adjusted EBITDA excluding technology-related license expenses $501.3 $617.0 $711.9 $717.1 $632.6 $171.6 $186.1 $669.5 Net Sales $1,766.7 $1,926.3 $2,162.8 $2,141.8 $1,926.8 $512.1 $536.1 $1,987.0 Adjusted EBITDA margin 28.4% 32.0% 32.9% 32.9% 32.5% 33.5% 34.7% 33.5% Adjusted EBITDA margin excl technology-related license expenses 28.4% 32.0% 32.9% 33.5% 32.8% 33.5% 34.7% 33.7% Three months ended June 30, For the year ended December 31, Non-GAAP Reconciliations (1 of 2) Adjusted Net Income and Adjusted EBITDA reconciliation |
![]() 12 $ in millions, Unaudited Last twelve months ended June 30, 2009 2010 2011 2012 2013 2013 2014 2014 Net Cash Provided by Operating Activities $168.7 $388.9 $469.2 $497.5 $453.5 $129.7 $143.4 $511.1 (Deductions) or Additions: Long-lived assets (88.2) (73.8) (96.9) (123.9) (74.4) (13.2) (11.6) (71.3) Fee to terminate services agreement with Sponsors — — — 16.0 — — — — Technology-related license expenses — — — 12.0 6.0 — — 3.3 2009 Non-Recurring Activity 61.0 — — — — — — — Adjusted Free Cash Flow $141.5 $315.1 $372.3 $401.6 $385.1 $116.5 $131.8 $443.1 Net Sales $1,766.7 $1,926.3 $2,162.8 $2,141.8 $1,926.8 $512.1 $536.1 $1,987.0 Adjusted Free Cash Flow (% to Net Sales) 8.0% 16.4% 17.2% 18.8% 20.0% 22.7% 24.6% 22.3% Three months ended June 30, For the year ended December 31, (1) 2009 adjusted for certain non-recurring activity: (a) capitalized accrued interest on Senior Toggle Notes ($29) million, (b) cash restructuring charge $51 million, (c) accounts payable early payments $3 million, (d) delayed accounts receivable receipts $19 million and (e) Lehman LIBOR swap settlement $17 million. Non-GAAP Reconciliations (2 of 2) Adjusted Free Cash Flow reconciliation (1) |