
Q3 2019 Earnings Release Published October 30, 2019 (Earnings Conference Call October 31, 2019) David Graziosi, President & Chief Executive Officer Fred Bohley, Senior Vice President & Chief Financial Officer Exhibit 99.2
Safe Harbor Statement The following information contains, or may be deemed to contain, “forward-looking statements” (as defined in the U.S. Private Securities Litigation Reform Act of 1995). The words “believe,” “expect,” “anticipate,” “intend,” “estimate” and other expressions that are predictions of or indicate future events and trends and that do not relate to historical matters identify forward-looking statements. You should not place undue reliance on these forward-looking statements. Although forward-looking statements reflect management’s good faith beliefs, reliance should not be placed on forward-looking statements because they involve known and unknown risks, uncertainties and other factors, which may cause actual results, performance or achievements to differ materially from anticipated future results, performance or achievements expressed or implied by such forward-looking statements. Forward-looking statements speak only as of the date the statements are made. We undertake no obligation to publicly update or revise any forward-looking statement, whether as a result of new information, future events, changed circumstances or otherwise. These forward-looking statements are subject to numerous risks and uncertainties, including, but not limited to: our participation in markets that are competitive; the highly cyclical industries in which certain of our end users operate; uncertainty in the global regulatory and business environments in which we operate; our ability to prepare for, respond to and successfully achieve our objectives relating to technological and market developments, competitive threats and changing customer needs; the concentration of our net sales in our top five customers and the loss of any one of these; the failure of markets outside North America to increase adoption of fully-automatic transmissions; the success of our research and development efforts, the outcome of which is uncertain; our failure to identify, consummate or effectively integrate acquisitions; U.S. and foreign defense spending; general economic and industry conditions; increases in cost, disruption of supply or shortage of raw materials or components used in our products; the discovery of defects in our products, resulting in delays in new model launches, recall campaigns and/or increased warranty costs and reduction in future sales or damage to our brand and reputation; risks associated with our international operations, including increased trade protectionism; labor strikes, work stoppages or similar labor disputes, which could significantly disrupt our operations or those of our principal customers; risks related to our substantial indebtedness; and our intention to pay dividends and repurchase shares of our common stock. Allison Transmission cannot assure you that the assumptions made in preparing any of the forward- looking statements will prove accurate or that any long-term financial goals will be realized. All forward-looking statements included in this presentation speak only as of the date made, and Allison Transmission undertakes no obligation to update or revise publicly any such forward-looking statements, whether as a result of new information, future events, or otherwise. In particular, Allison Transmission cautions you not to place undue weight on certain forward-looking statements pertaining to potential growth opportunities, long-term financial goals or the value we currently ascribe to certain tax attributes set forth herein. Actual results may vary significantly from these statements. Allison Transmission’s business is subject to numerous risks and uncertainties, which may cause future results of operations to vary significantly from those presented herein. Important factors that could cause actual results to differ materially are discussed in Allison Transmission’s Annual Report on Form 10-K for the year ended December 31, 2018.
Non-GAAP Financial Information We use Adjusted EBITDA and Adjusted EBITDA as a percent of net sales to measure our operating profitability. We believe that Adjusted EBITDA and Adjusted EBITDA as a percent of net sales provide management, investors and creditors with useful measures of the operational results of our business and increase the period-to-period comparability of our operating profitability and comparability with other companies. Adjusted EBITDA as a percent of net sales is also used in the calculation of management’s incentive compensation program. The most directly comparable U.S. generally accepted accounting principles (“GAAP”) measure to Adjusted EBITDA and Adjusted EBITDA as a percent of net sales is Net income and Net income as a percent of net sales, respectively. Adjusted EBITDA is calculated as the earnings before interest expense, income tax expense, amortization of intangible assets, depreciation of property, plant and equipment and other adjustments as defined by Allison Transmission, Inc.’s, the Company’s wholly-owned subsidiary, Second Amended and Restated Credit Agreement. Adjusted EBITDA as a percent of net sales is calculated as Adjusted EBITDA divided by net sales. We use Adjusted Free Cash Flow to evaluate the amount of cash generated by our business that, after the capital investment needed to maintain and grow our business and certain mandatory debt service requirements, can be used for repayment of debt, stockholder distributions and strategic opportunities, including investing in our business. We believe that Adjusted Free Cash Flow enhances the understanding of the cash flows of our business for management, investors and creditors. Adjusted Free Cash Flow is also used in the calculation of management’s incentive compensation program. The most directly comparable GAAP measure to Adjusted Free Cash Flow is Net cash provided by operating activities. Adjusted Free Cash Flow is calculated as Net cash provided by operating activities after additions of long-lived assets.
Call Agenda Q3 2019 Performance 2019 Guidance Update
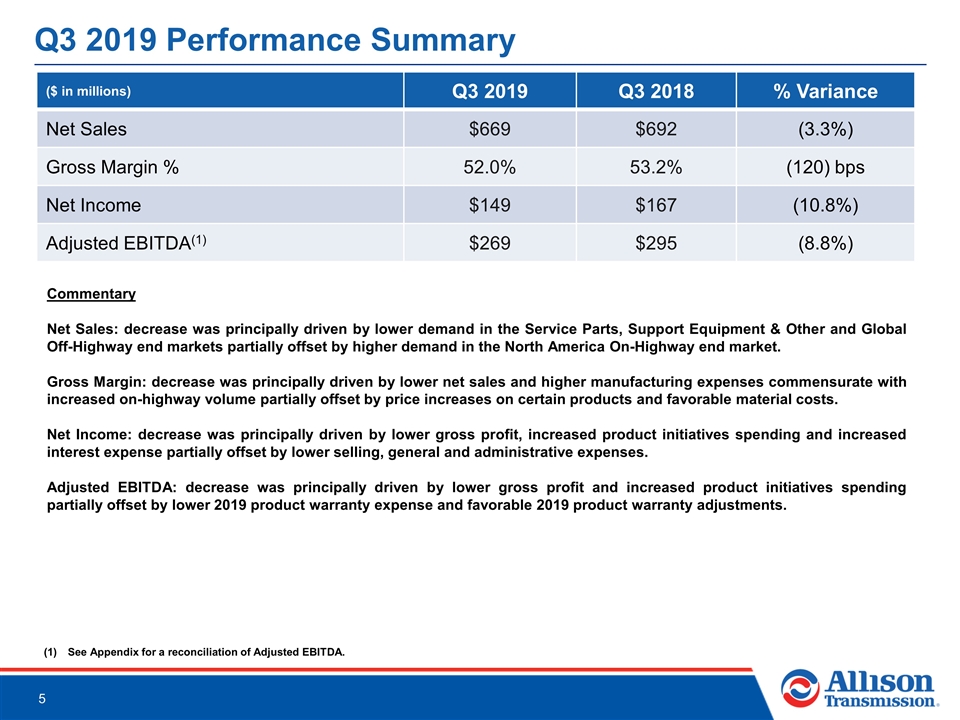
Q3 2019 Performance Summary ($ in millions) Q3 2019 Q3 2018 % Variance Net Sales $669 $692 (3.3%) Gross Margin % 52.0% 53.2% (120) bps Net Income $149 $167 (10.8%) Adjusted EBITDA(1) $269 $295 (8.8%) See Appendix for a reconciliation of Adjusted EBITDA. Commentary Net Sales: decrease was principally driven by lower demand in the Service Parts, Support Equipment & Other and Global Off-Highway end markets partially offset by higher demand in the North America On-Highway end market. Gross Margin: decrease was principally driven by lower net sales and higher manufacturing expenses commensurate with increased on-highway volume partially offset by price increases on certain products and favorable material costs. Net Income: decrease was principally driven by lower gross profit, increased product initiatives spending and increased interest expense partially offset by lower selling, general and administrative expenses. Adjusted EBITDA: decrease was principally driven by lower gross profit and increased product initiatives spending partially offset by lower 2019 product warranty expense and favorable 2019 product warranty adjustments.
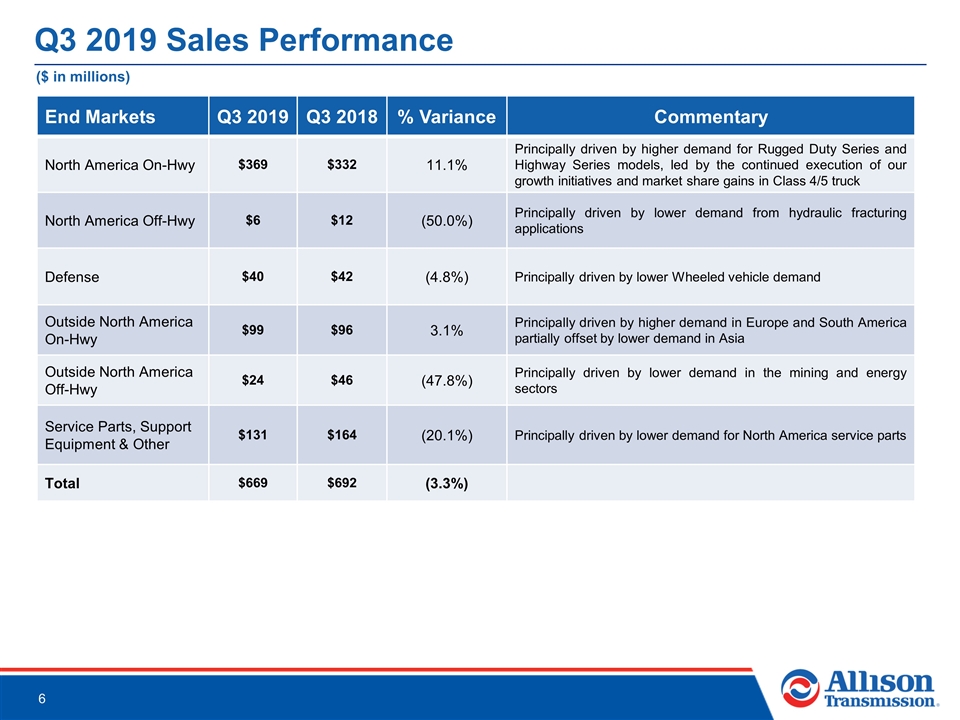
Q3 2019 Sales Performance ($ in millions) End Markets Q3 2019 Q3 2018 % Variance Commentary North America On-Hwy $369 $332 11.1% Principally driven by higher demand for Rugged Duty Series and Highway Series models, led by the continued execution of our growth initiatives and market share gains in Class 4/5 truck North America Off-Hwy $6 $12 (50.0%) Principally driven by lower demand from hydraulic fracturing applications Defense $40 $42 (4.8%) Principally driven by lower Wheeled vehicle demand Outside North America On-Hwy $99 $96 3.1% Principally driven by higher demand in Europe and South America partially offset by lower demand in Asia Outside North America Off-Hwy $24 $46 (47.8%) Principally driven by lower demand in the mining and energy sectors Service Parts, Support Equipment & Other $131 $164 (20.1%) Principally driven by lower demand for North America service parts Total $669 $692 (3.3%)
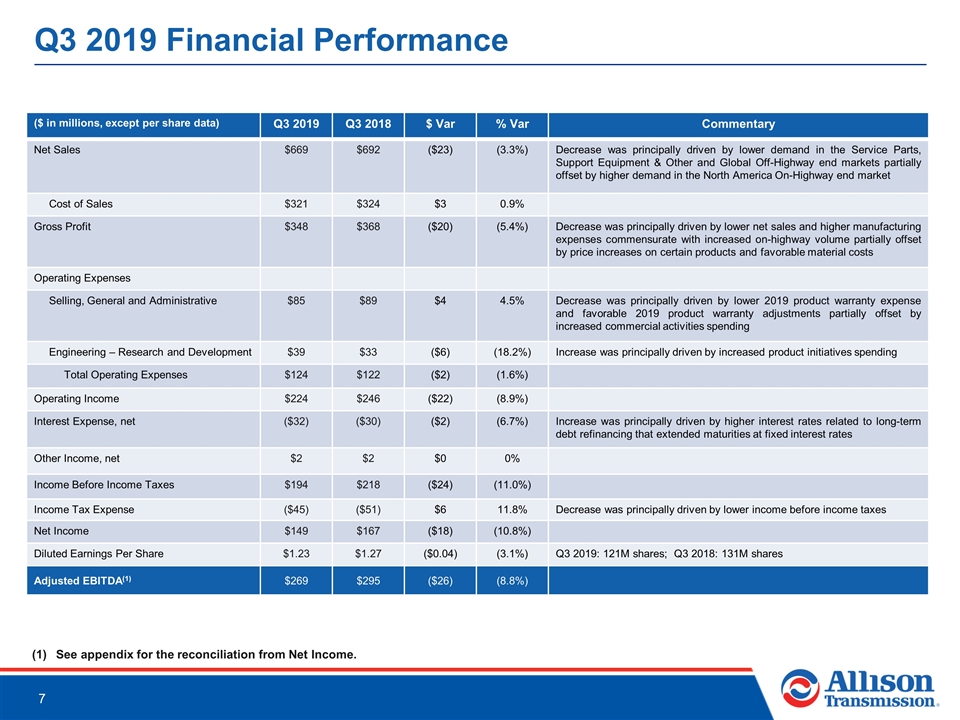
Q3 2019 Financial Performance ($ in millions, except per share data) Q3 2019 Q3 2018 $ Var % Var Commentary Net Sales $669 $692 ($23) (3.3%) Decrease was principally driven by lower demand in the Service Parts, Support Equipment & Other and Global Off-Highway end markets partially offset by higher demand in the North America On-Highway end market Cost of Sales $321 $324 $3 0.9% Gross Profit $348 $368 ($20) (5.4%) Decrease was principally driven by lower net sales and higher manufacturing expenses commensurate with increased on-highway volume partially offset by price increases on certain products and favorable material costs Operating Expenses Selling, General and Administrative $85 $89 $4 4.5% Decrease was principally driven by lower 2019 product warranty expense and favorable 2019 product warranty adjustments partially offset by increased commercial activities spending Engineering – Research and Development $39 $33 ($6) (18.2%) Increase was principally driven by increased product initiatives spending Total Operating Expenses $124 $122 ($2) (1.6%) Operating Income $224 $246 ($22) (8.9%) Interest Expense, net ($32) ($30) ($2) (6.7%) Increase was principally driven by higher interest rates related to long-term debt refinancing that extended maturities at fixed interest rates Other Income, net $2 $2 $0 0% Income Before Income Taxes $194 $218 ($24) (11.0%) Income Tax Expense ($45) ($51) $6 11.8% Decrease was principally driven by lower income before income taxes Net Income $149 $167 ($18) (10.8%) Diluted Earnings Per Share $1.23 $1.27 ($0.04) (3.1%) Q3 2019: 121M shares; Q3 2018: 131M shares Adjusted EBITDA(1) $269 $295 ($26) (8.8%) See appendix for the reconciliation from Net Income.
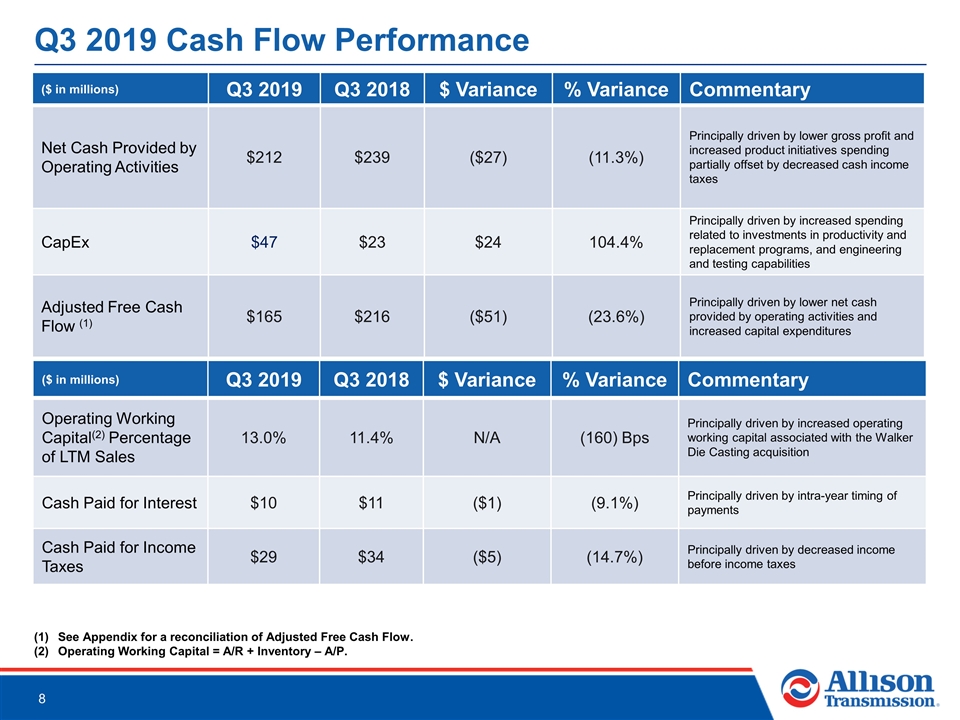
Q3 2019 Cash Flow Performance See Appendix for a reconciliation of Adjusted Free Cash Flow. Operating Working Capital = A/R + Inventory – A/P. ($ in millions) Q3 2019 Q3 2018 $ Variance % Variance Commentary Net Cash Provided by Operating Activities $212 $239 ($27) (11.3%) Principally driven by lower gross profit and increased product initiatives spending partially offset by decreased cash income taxes CapEx $47 $23 $24 104.4% Principally driven by increased spending related to investments in productivity and replacement programs, and engineering and testing capabilities Adjusted Free Cash Flow (1) $165 $216 ($51) (23.6%) Principally driven by lower net cash provided by operating activities and increased capital expenditures ($ in millions) Q3 2019 Q3 2018 $ Variance % Variance Commentary Operating Working Capital(2) Percentage of LTM Sales 13.0% 11.4% N/A (160) Bps Principally driven by increased operating working capital associated with the Walker Die Casting acquisition Cash Paid for Interest $10 $11 ($1) (9.1%) Principally driven by intra-year timing of payments Cash Paid for Income Taxes $29 $34 ($5) (14.7%) Principally driven by decreased income before income taxes
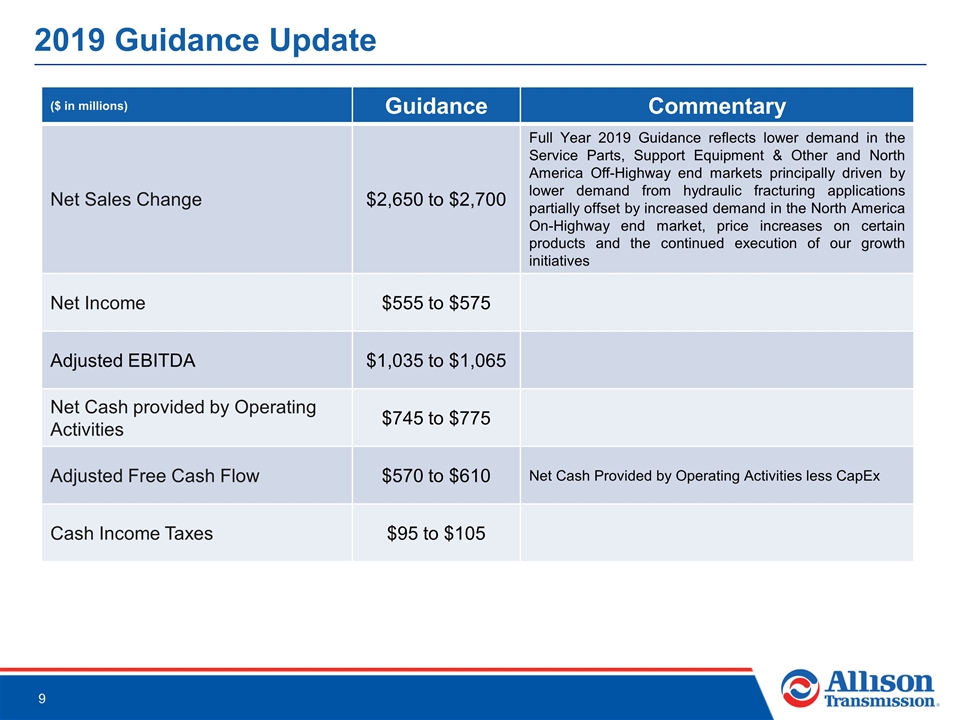
2019 Guidance Update ($ in millions) Guidance Commentary Net Sales Change $2,650 to $2,700 Full Year 2019 Guidance reflects lower demand in the Service Parts, Support Equipment & Other and North America Off-Highway end markets principally driven by lower demand from hydraulic fracturing applications partially offset by increased demand in the North America On-Highway end market, price increases on certain products and the continued execution of our growth initiatives Net Income $555 to $575 Adjusted EBITDA $1,035 to $1,065 Net Cash provided by Operating Activities $745 to $775 Adjusted Free Cash Flow $570 to $610 Net Cash Provided by Operating Activities less CapEx Cash Income Taxes $95 to $105
APPENDIX Non-GAAP Financial Information
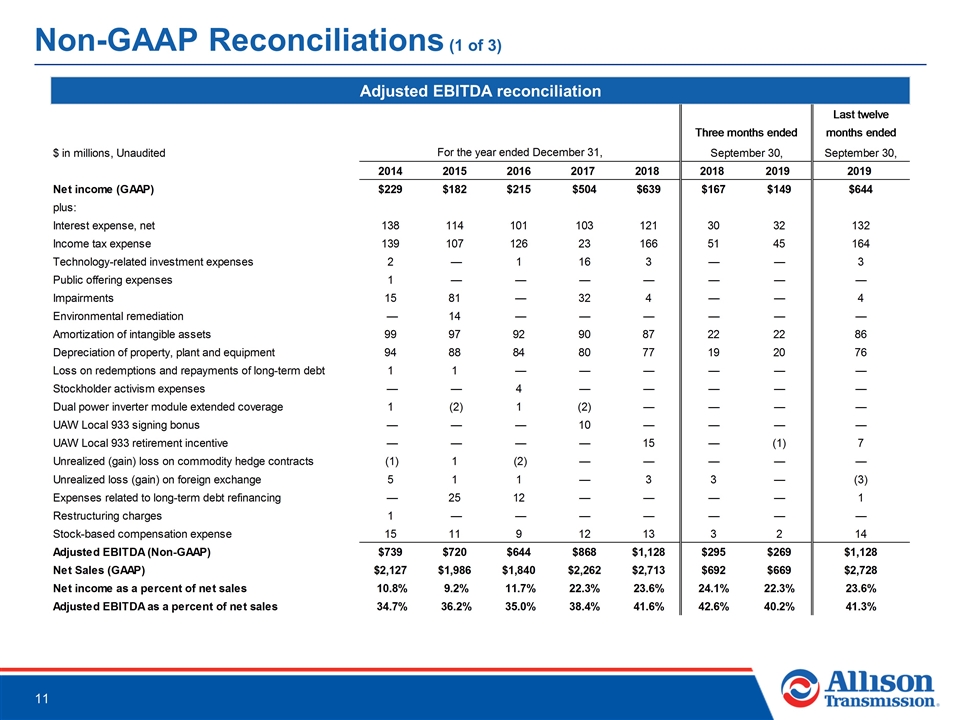
Non-GAAP Reconciliations (1 of 3) Adjusted EBITDA reconciliation
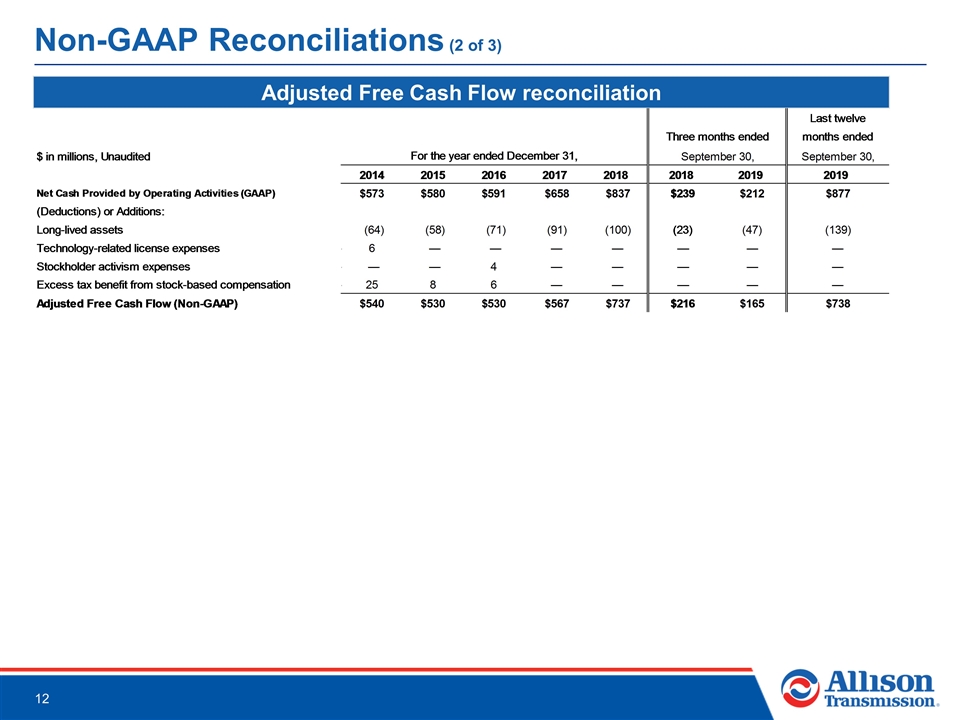
Non-GAAP Reconciliations (2 of 3) Adjusted Free Cash Flow reconciliation
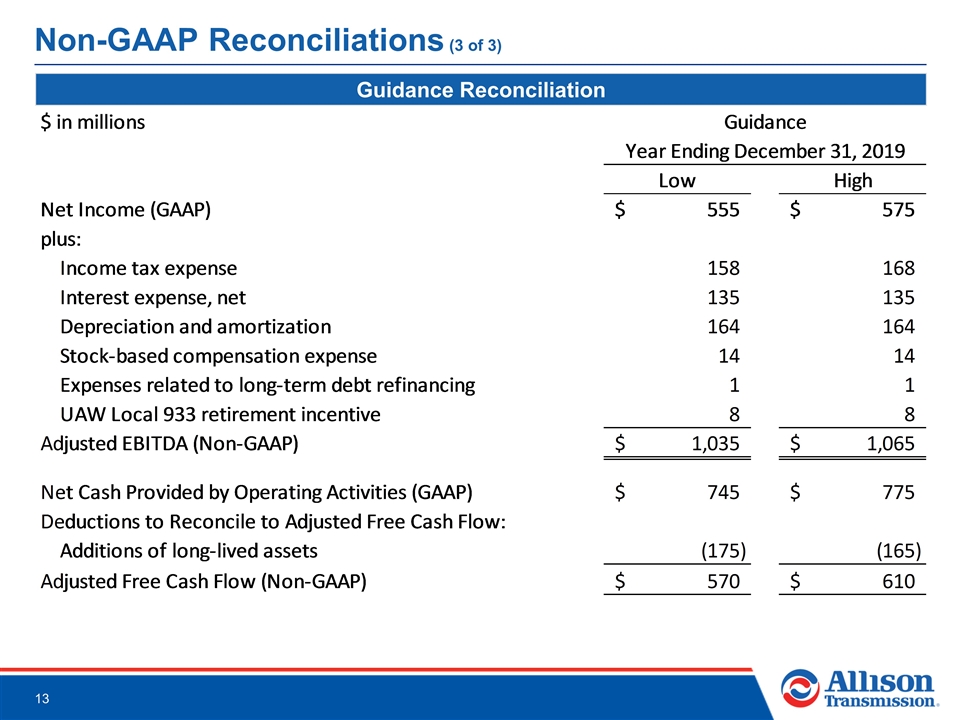
Non-GAAP Reconciliations (3 of 3) Guidance Reconciliation


