Exhibit 99.1
CAPE BANCORP
Market Focused Community Bank Positioned for Growth
Full Conversion and Acquisition Community Meeting
CAPE BANCORP
This presentation is for informational purposes only and does not constitute an offer to sell shares of common stock of Cape Bancorp, Inc.
Please refer to the prospectus dated November 13, 2007
2 |
|
CAPE BANCORP
Forward-Looking Statements
Certain comments in this presentation are forward-looking statements, which can be identified by the use of such words as estimate, project, believe, intend, anticipate, plan, seek, expect and similar expressions. These forward-looking statements include, but are not limited to:
statements of our goals, intentions and expectations;
statements regarding our business plans and prospects and growth and operating strategies; statements regarding the asset quality of our loan and investment portfolios; and estimates of our risks and future costs and benefits.
These forward-looking statements are subject to significant risks, assumptions and uncertainties, including, among other things, the following important factors that could affect the actual outcome of future events: significantly increased competition among depository and other financial institutions; inflation and changes in market interest rates that reduce our net interest margin or reduce the fair value of financial instruments; general economic conditions, either nationally or in our market area, that are worse than expected; adverse changes in the securities markets; legislative or regulatory changes that adversely affect our business; our ability to successfully integrate Boardwalk Bank; our ability to enter new markets successfully and take advantage of growth opportunities, and the possible short-term dilutive effect of potential acquisitions or de novo branches, if any; changes in management’s estimate of the adequacy of the allowance for loan and lease losses; effects of and changes in trade, monetary and fiscal policies and laws, including interest rate policies of the Federal Reserve Board; costs and effects of litigation and unexpected or adverse outcomes in such litigations; changes in consumer spending, borrowing and savings habits; changes in accounting policies and practices, as may be adopted by bank regulatory agencies and the Financial Accounting Standards Board; inability of third-party providers to perform their obligations to us; and changes in our organization, compensation and benefit plans. Because of these and other uncertainties, our actual future results may be materially different from the results indicated by these forward-looking statements.
Cape Bancorp, Inc. has filed a prospectus concerning the conversion with the Securities and Exchange Commission. Prospective purchasers of Cape Savings Bank are urged to read the prospectus because it contains important information. Prospective purchasers are able to obtain all documents filed with the SEC by Cape Bancorp, Inc. free of charge at the SEC’s website, www.sec.gov. In addition, documents filed with the SEC by Cape Bancorp, Inc. are available free of charge from the Corporate Secretary of Cape Bancorp, Inc. at 225 North Main Street, Cape May Court House, New Jersey 08210, telephone (800) 858-BANK. The directors, executive officers, and certain other members of management and the employees of Cape Bancorp, Inc. are participants in the solicitation of proxies in favor of the conversion from the mutual to stock form of ownership. Information about the directors and executive officers of Cape Bancorp, Inc. is included in the prospectus and the proxy statement/prospectus filed with the SEC.
The shares of common stock of Cape Bancorp, Inc. are not savings accounts or savings deposits, may lose value and are not insured by the Federal Deposit Insurance Corporation or any other government agency.
3 |
|
CAPE BANCORP
Offering Summary
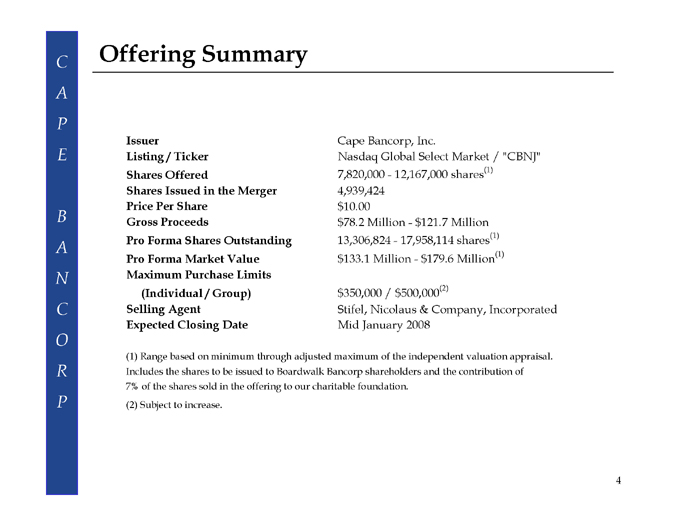
Issuer
Listing / Ticker Shares Offered
Shares Issued in the Merger Price Per Share Gross Proceeds Pro Forma Shares Outstanding Pro Forma Market Value Maximum Purchase Limits (Individual / Group) Selling Agent Expected Closing Date
Cape Bancorp, Inc.
Nasdaq Global Select Market / “CBNJ” 7,820,000—12,167,000 shares(1) 4,939,424 $10.00 $78.2 Million—$121.7 Million 13,306,824—17,958,114 shares(1) $133.1 Million—$179.6 Million(1)
$350,000 / $500,000(2)
Stifel, Nicolaus & Company, Incorporated Mid January 2008
(1) Range based on minimum through adjusted maximum of the independent valuation appraisal. Includes the shares to be issued to Boardwalk Bancorp shareholders and the contribution of 7% of the shares sold in the offering to our charitable foundation.
(2) |
| Subject to increase. |
4 |
|

CAPE BANCORP
Boardwalk Acquisition Overview
Purchase Price per Share: Aggregate Transaction Value: Form of Consideration: Exchange Ratio: Price / Book Value (1): Price / Tangible Book Value (1): Price / LTM EPS (1): Board of Directors:
Structure:
Termination Fee:
$23.00 $101.0 million
50% common stock / 50% cash
Fixed at 2.3 shares of Cape Bancorp common stock 196.1% 196.1% 53.5x Three directors from Boardwalk Bancorp (Michael D. Devlin, Agostino R. Fabietti and Thomas K. Ritter) will join both the Cape Bancorp and Cape Savings Bank Boards of Directors
Boardwalk Bancorp will be merged with and into Cape Bancorp and Cape Savings Bank will acquire Boardwalk Bank by merging Boardwalk Bank with and into Cape Savings Bank
$5.0 million
(1) |
| At or for the 12 months ended June 30, 2007. 5 |
CAPE BANCORP
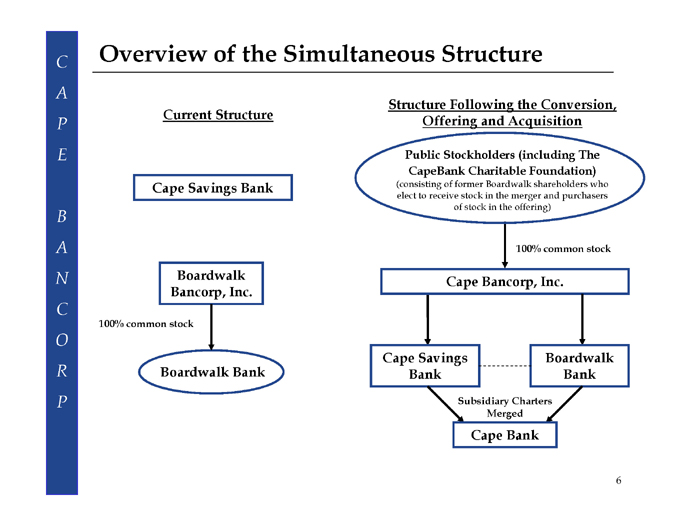
Overview of the Simultaneous Structure
Current Structure
Cape Savings Bank
Boardwalk Bancorp, Inc.
100% common stock
Boardwalk Bank
Structure Following the Conversion, Offering and Acquisition
Public Stockholders (including The CapeBank Charitable Foundation)
(consisting of former Boardwalk shareholders who elect to receive stock in the merger and purchasers of stock in the offering)
100% common stock
Cape Bancorp, Inc.
Cape Savings Bank
Boardwalk Bank
Subsidiary Charters Merged
Cape Bank
6 |
|
CAPE BANCORP
Rationale for the Conversion and Acquisition
Our primary reasons for this offering are to:
Raise capital to provide the stock and funds necessary to acquire Boardwalk Bancorp
Improve our overall competitive position
Provide us the flexibility to support our growth initiatives:
Organic growth initiatives through lending in communities we serve
Enhance our product and service offerings
Pursue limited de novo branching opportunities and future acquisition opportunities
Additional size and scale provides opportunity for enhanced profitability and flexible capital management strategies
To retain and attract qualified personnel by establishing stock benefit plans for management and employees
7 |
|

CAPE BANCORP
Corporate Overviews
Cape Savings Bank
Organized in 1923 as a New Jersey-chartered mutual savings bank
Headquartered in Cape May Court House, New Jersey
Operate from 13-full service locations in Cape May and Atlantic Counties
Customers consist primarily of individuals and small businesses
Financial data as of September 30, 2007:
Assets $620.1 million
Deposits $489.6 million
Net Loans $450.1 million
Equity $72.7 million
Boardwalk Bancorp
Boardwalk Bancorp is the holding company for Boardwalk Bank, a New Jersey-chartered commercial bank chartered in 1999.
Headquartered in Linwood, New Jersey
Operate 7 full-service branch offices in Cape May and Atlantic Counties and an loan production office in Cumberland County
Customers consist primarily of small to medium-sized businesses and individuals
Financial data as of September 30, 2007:
Assets $445.3 million
Deposits $311.2 million
Net Loans $298.1 million
Equity $49.9 million
8 |
|
CAPE BANCORP
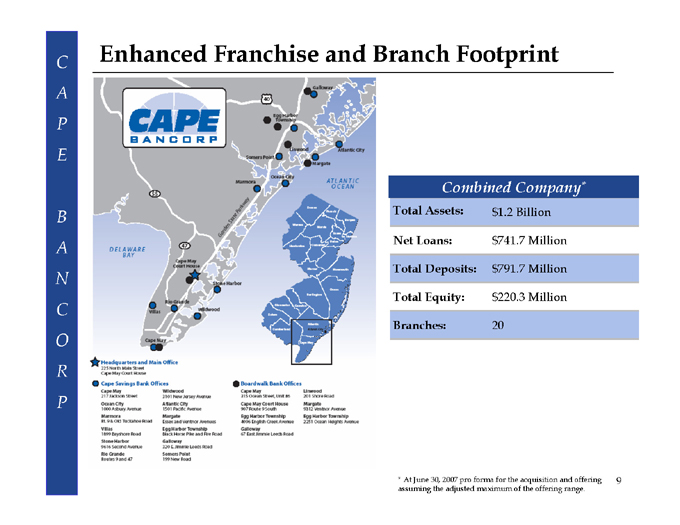
Enhanced Franchise and Branch Footprint
Combined Company*
Total Assets: $1.2 Billion
Net Loans: $741.7 Million
Total Deposits: $791.7 Million
Total Equity: $220.3 Million
Branches: 20
* |
| At June 30, 2007 pro forma for the acquisition and offering 9 assuming the adjusted maximum of the offering range. |
9
CAPE BANCORP
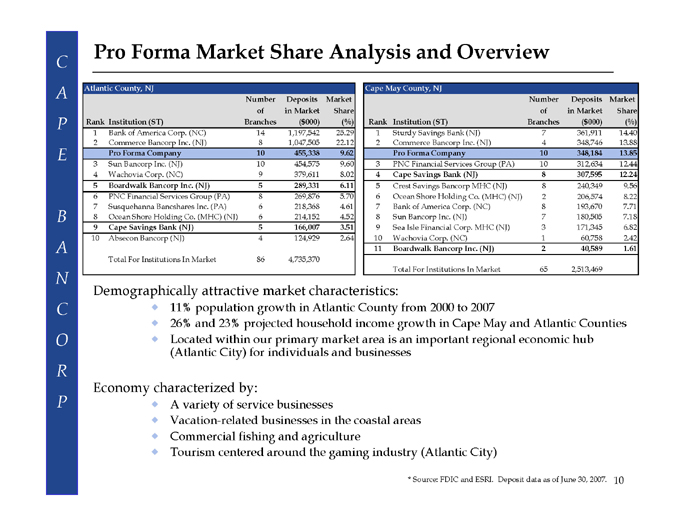
Pro Forma Market Share Analysis and Overview
Atlantic County, NJ
Rank Institution (ST) Number of Branches Deposits in Market ($ 000)
Market Share (%)
1 |
| Bank of America Corp. (NC) 14 1,197,542 25.29 |
2 |
| Commerce Bancorp Inc. (NJ) 8 1,047,505 22.12 |
Pro Forma Company 10 455,338 9.62
3 |
| Sun Bancorp Inc. (NJ) 10 454,575 9.60 |
4 |
| Wachovia Corp. (NC) 9 379,611 8.02 |
5 |
| Boardwalk Bancorp Inc. (NJ) 5 289,331 6.11 |
6 |
| PNC Financial Services Group (PA) 8 269,876 5.70 |
7 |
| Susquehanna Bancshares Inc. (PA) 6 218,368 4.61 |
8 |
| Ocean Shore Holding Co. (MHC) (NJ) 6 214,152 4.52 |
9 Cape Savings Bank (NJ) 5 166,007 3.51
10 Absecon Bancorp (NJ) 4 124,929 2.64
Total For Institutions In Market 86 4,735,370
Cape May County, NJ
Rank Institution (ST) Number of Branches Deposits in Market ($ 000) Market Share (%)
1 |
| Sturdy Savings Bank (NJ) 7 361,911 14.40 |
2 |
| Commerce Bancorp Inc. (NJ) 4 348,746 13.88 |
Pro Forma Company 10 348,184 13.85
3 |
| PNC Financial Services Group (PA) 10 312,634 12.44 |
4 |
| Cape Savings Bank (NJ) 8 307,595 12.24 |
5 |
| Crest Savings Bancorp MHC (NJ) 8 240,349 9.56 |
6 |
| Ocean Shore Holding Co. (MHC) (NJ) 2 206,574 8.22 |
7 |
| Bank of America Corp. (NC) 8 193,670 7.71 |
8 |
| Sun Bancorp Inc. (NJ) 7 180,505 7.18 |
9 Sea Isle Financial Corp. MHC (NJ) 3 171,345 6.82
10 Wachovia Corp. (NC) 1 60,758 2.42
11 Boardwalk Bancorp Inc. (NJ) 2 40,589 1.61
Total For Institutions In Market 65 2,513,469
Demographically attractive market characteristics:
11% population growth in Atlantic County from 2000 to 2007
26% and 23% projected household income growth in Cape May and Atlantic Counties
Located within our primary market area is an important regional economic hub (Atlantic City) for individuals and businesses
Economy characterized by:
A variety of service businesses
Vacation-related businesses in the coastal areas
Commercial fishing and agriculture
Tourism centered around the gaming industry (Atlantic City)
* |
| Source: FDIC and ESRI. Deposit data as of June 30, 2007. 10 |
CAPE BANCORP
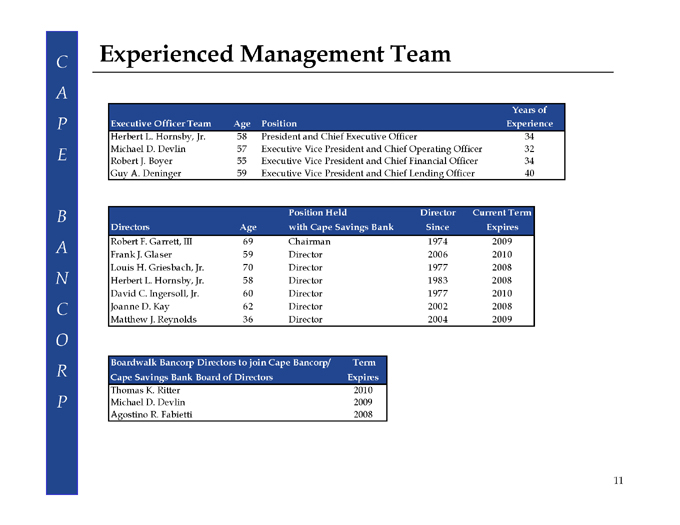
Experienced Management Team
Executive Officer Team Age Position Years of Experience
Herbert L. Hornsby, Jr. 58 President and Chief Executive Officer 34
Michael D. Devlin 57 Executive Vice President and Chief Operating Officer 32
Robert J. Boyer 55 Executive Vice President and Chief Financial Officer 34
Guy A. Deninger 59 Executive Vice President and Chief Lending Officer 40
Directors Age Position Held with Cape Savings Bank Director Since Current Term Expires
Robert F. Garrett, III 69 Chairman 1974 2009
Frank J. Glaser 59 Director 2006 2010
Louis H. Griesbach, Jr. 70 Director 1977 2008
Herbert L. Hornsby, Jr. 58 Director 1983 2008
David C. Ingersoll, Jr. 60 Director 1977 2010
Joanne D. Kay 62 Director 2002 2008
Matthew J. Reynolds 36 Director 2004 2009
Boardwalk Bancorp Directors to join Cape Bancorp/ Term
Cape Savings Bank Board of Directors Expires
Thomas K. Ritter 2010
Michael D. Devlin 2009
Agostino R. Fabietti 2008
11
CAPE BANCORP
Post Conversion and Acquisition—Business Strategy
Our business strategy is to operate and grow a profitable community-oriented financial institution. We plan to achieve this by:
Pursuing new opportunities to increase commercial lending in our primary market area
Maintain the high quality of our loan portfolio
Continuing to originate residential mortgage loans in our primary market area
Providing superior customer service with an emphasis on increasing transaction deposit accounts and deposit balances
Increasing our non-interest income, through a broader range of products and services
Expand our franchise through acquisitions, including our merger with Boardwalk Bancorp, and by opening additional branch offices in our primary market area
12
CAPE BANCORP
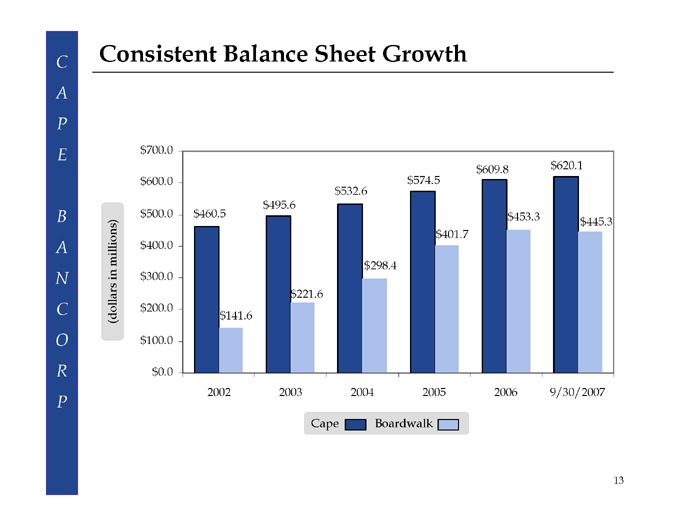
Consistent Balance Sheet Growth
$700.0
$600.0
$500.0
$400.0
$300.0
$200.0
$100.0
$0.0
$460.5
$141.6
$495.6
$221.6
$532.6
$298.4
$574.5
$401.7
$609.8
$453.3
$620.1
$445.3
2002 2003 2004 2005 2006 9/30/2007
Cape
Boardwalk
(dollars in millions)
13
CAPE BANCORP
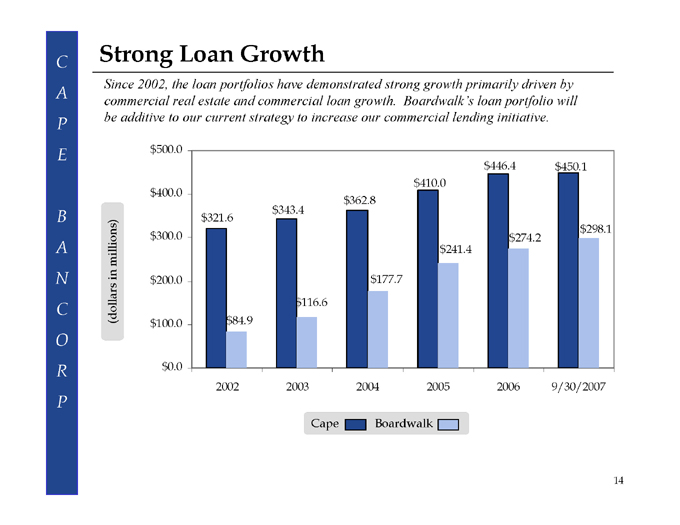
Strong Loan Growth
Since 2002, the loan portfolios have demonstrated strong growth primarily driven by commercial real estate and commercial loan growth. Boardwalk’s loan portfolio will be additive to our current strategy to increase our commercial lending initiative.
$500.0 $400.0 $300.0 $200.0 $100.0 $0.0
$321.6 $84.9 $343.4
$116.6 $362.8 $177.7 $410.0 $241.4 $446.4 $274.2 $450.1 $298.1
2002 2003 2004 2005 2006 9/30/2007
Cape
Boardwalk
(dollars in millions)
14
CAPE BANCORP
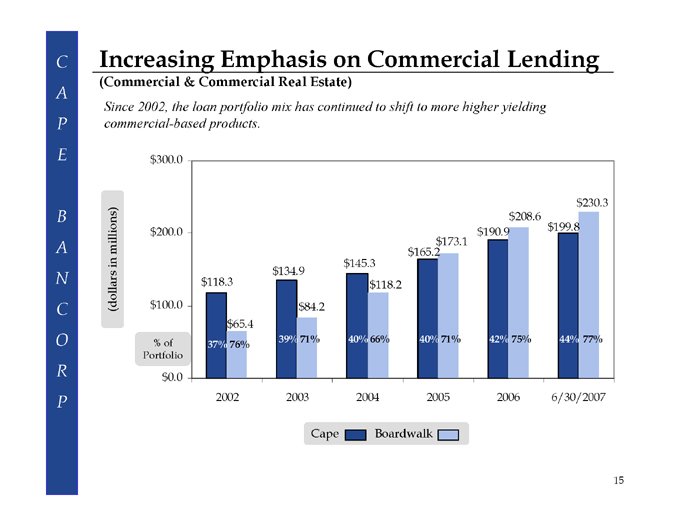
Increasing Emphasis on Commercial Lending
(Commercial & Commercial Real Estate)
Since 2002, the loan portfolio mix has continued to shift to more higher yielding commercial-based products.
$300.0
$200.0
$100.0
% of Portfolio $0.0
$230.3 $208.6 $190.9 $199.8 $173.1 $165.2 $145.3 $134.9 $118.3 $118.2 $84.2 $65.4
39% 71% 40% 66% 40% 71% 42% 75% 44% 77% 37% 76%
2002 2003 2004 2005 2006 6/30/2007
Cape Boardwalk
(dollars in millions)
15
CAPE BANCORP
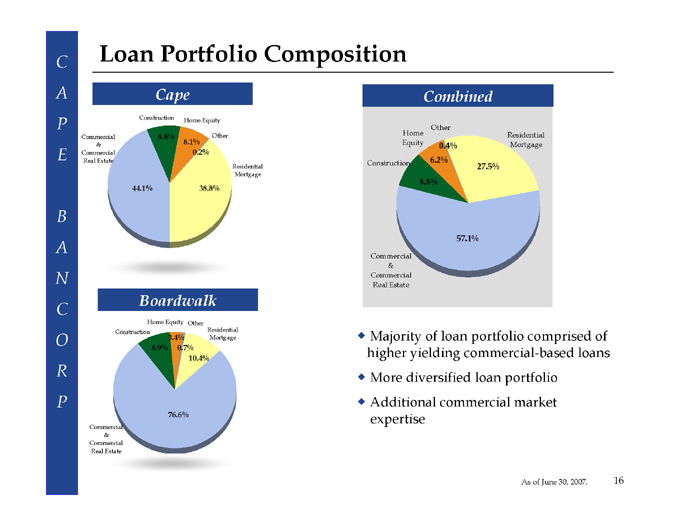
Loan Portfolio Composition
Cape
Construction Home Equity Commercial 8.8% Other
& 8.1%
Commercial 0.2% Real Estate
Residential Mortgage
44.1% 38.8%
Boardwalk
Home Equity Other
Construction Residential 3.4% Mortgage
8.9% 0.7% 10.4%
76.6%
Commercial & Commercial Real Estate
Combined
Other
Home Residential Equity 0.4% Mortgage Construction 6.2% 27.5% 8.8%
57.1%
Commercial & Commercial Real Estate
Majority of loan portfolio comprised of higher yielding commercial-based loans More diversified loan portfolio Additional commercial market expertise
As of June 30, 2007. 16

CAPE BANCORP
Disciplined Credit Culture
Since 2002, both banks have maintained a conservative credit culture resulting in superior asset quality.
Cape
2002 2003 2004 2005 2006 9/30/2007
NPAs / Total Assets 0.31% 0.38% 0.23% 0.49% 0.62% 0.54%
NPLs/ Total Loans 0.36% 0.55% 0.34% 0.68% 0.84% 0.74%
Allowance/NPLs 190.20% 160.30% 289.86% 134.52% 105.20% 118.82%
Allowance/Total Loans 0.69% 0.88% 0.98% 0.91% 0.89% 0.88%
Boardwalk
2002 2003 2004 2005 2006 9/30/2007
NPAs / Total Assets 0.51% 0.71% —— 0.11% 0.29%
NPLs/ Total Loans 0.84% 1.32% —— 0.17% 0.43%
Allowance/NPLs 184.32% 94.82% —— 681.88% 283.13%
Allowance/Total Loans 1.55% 1.26% 1.21% 1.17% 1.18% 1.22%
17
CAPE BANCORP
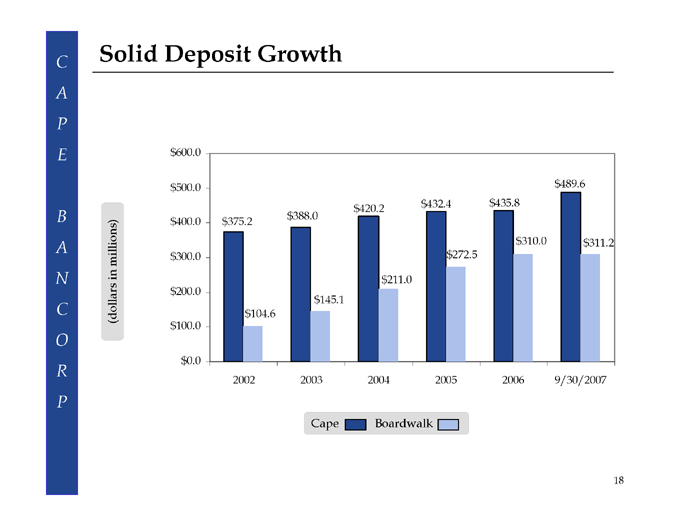
Solid Deposit Growth
$600.0 $500.0 $400.0 $300.0 $200.0 $100.0 $0.0
$489.6 $432.4 $435.8 $420.2 $388.0 $375.2 $310.0 $311.2 $272.5
$211.0 $145.1 $104.6
2002 2003 2004 2005 2006 9/30/2007
Cape Boardwalk
(dollars in millions)
18
CAPE BANCORP
Conversion Offering Information
CAPE BANCORP
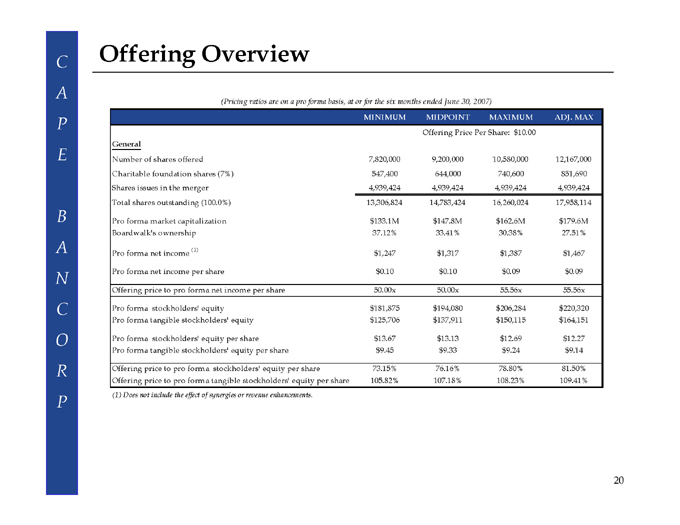
Offering Overview
(Pricing ratios are on a pro forma basis, at or for the six months ended June 30, 2007)
MINIMUM MIDPOINT MAXIMUM ADJ. MAX
Offering Price Per Share: $ 10.00
General
Number of shares offered 7,820,000 9,200,000 10,580,000 12,167,000
Charitable foundation shares (7%) 547,400 644,000 740,600 851,690
Shares issues in the merger 4,939,424 4,939,424 4,939,424 4,939,424
Total shares outstanding (100.0%) 13,306,824 14,783,424 16,260,024 17,958,114
Pro forma market capitalization $133.1M $147.8M $162.6M $ 179.6M
Boardwalk’s ownership 37.12% 33.41% 30.38% 27.51%
Pro forma net income (1) $ 1,247 $ 1,317 $ 1,387 $ 1,467
Pro forma net income per share $ 0.10 $ 0.10 $ 0.09 $ 0.09
Offering price to pro forma net income per share 50.00x 50.00x 55.56x 55.56x
Pro forma stockholders’ equity $ 181,875 $ 194,080 $ 206,284 $ 220,320
Pro forma tangible stockholders’ equity $ 125,706 $ 137,911 $ 150,115 $ 164,151
Pro forma stockholders’ equity per share $ 13.67 $ 13.13 $ 12.69 $ 12.27
Pro forma tangible stockholders’ equity per share $ 9.45 $ 9.33 $ 9.24 $ 9.14
Offering price to pro forma stockholders’ equity per share 73.15% 76.16% 78.80% 81.50%
Offering price to pro forma tangible stockholders’ equity per share 105.82% 107.18% 108.23% 109.41%
(1) |
| Does not include the effect of synergies or revenue enhancements. |
20
CAPE BANCORP
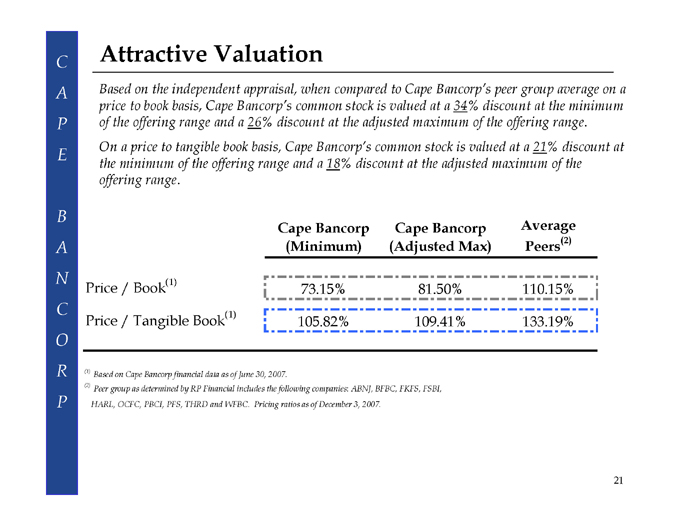
Attractive Valuation
Based on the independent appraisal, when compared to Cape Bancorp’s peer group average on a price to book basis, Cape Bancorp’s common stock is valued at a 34% discount at the minimum of the offering range and a 26% discount at the adjusted maximum of the offering range. On a price to tangible book basis, Cape Bancorp’s common stock is valued at a 21% discount at the minimum of the offering range and a 18% discount at the adjusted maximum of the offering range.
Cape Bancorp (Minimum) Cape Bancorp (Adjusted Max) Average Peers(2)
Price / Book(1) 73.15% 81.50% 110.15%
Price / Tangible Book(1) 105.82% 109.41% 133.19%
(1) |
| Based on Cape Bancorp financial data as of June 30, 2007. |
(2) Peer group as determined by RP Financial includes the following companies: ABNJ, BFBC, FKFS, FSBI, HARL, OCFC, PBCI, PFS, THRD and WFBC. Pricing ratios as of December 3, 2007.
21
CAPE BANCORP
Investment Highlights
Merger solidifies Cape’s position as the largest banking institution headquartered in Cape May and Atlantic Counties
Merger combines two companies with strong cultural compatibility and complementary business models
Growing presence in demographically attractive markets
Seasoned management team with an intimate knowledge of the local markets and strong ties to the community
Diversified loan portfolio with a continuing emphasis on commercial lending
Increase in loan-to-one borrower limit creates additional lending flexibility
Conservative credit practices have maintained superior asset quality
Established local identity in the communities served
22
CAPE BANCORP
Important!!
You were mailed proxy materials on November 23rd regarding our proposed conversion. Even if you’re not buying,
Please remember to Vote!!
Not voting has the same effect as voting “Against” the plan of conversion and establishment and funding of the charitable foundation.
23
CAPE BANCORP
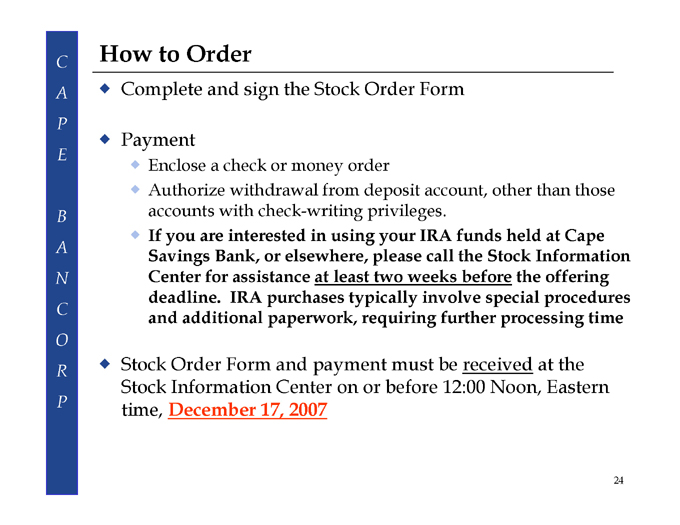
How to Order
Complete and sign the Stock Order Form
Payment
Enclose a check or money order
Authorize withdrawal from deposit account, other than those accounts with check-writing privileges.
If you are interested in using your IRA funds held at Cape Savings Bank, or elsewhere, please call the Stock Information Center for assistance at least two weeks before the offering deadline. IRA purchases typically involve special procedures and additional paperwork, requiring further processing time
Stock Order Form and payment must be received at the Stock Information Center on or before 12:00 Noon, Eastern time, December 17, 2007
24
CAPE BANCORP
Questions?
Stock Information Center
211 North Main Street Building 211, Suite 104 Cape May Court House, NJ 08210
(609) 465-7421 (local) (800) 694-8800 (toll free)
10:00 a.m. to 4:00 p.m., Monday – Friday, not open on weekends and bank holidays
25