
1 Q2 2015 Earnings Report July 22, 2015 6:00 am Pacific © 2015 Blackhawk Network

Forward Looking Statements © 2015 Blackhawk Network 2 This presentation contains forward-looking statements that involve risks and uncertainties, as well as assumptions that, if they never materialize or prove incorrect, could cause our results to differ materially from those expressed or implied by such forward-looking statements. The statements are not purely historical and are forward- looking statements within the meaning of Section 27A of the Securities Act of 1933, as amended, and Section 21E of the Securities Exchange Act of 1934, as amended. Forward-looking statements are often identified by the use of words such as, but not limited to, “anticipate,” “believe,” “can,” “continue,” “could,” “estimate,” “expect,” “intend,” “may,” “plan,” “project,” “seek,” “should,” “target,” “will,” “would,” “on track,” and similar expressions or variations intended to identify forward-looking statements. These statements are based on the beliefs and assumptions of our management based on information currently available to management. Such forward-looking statements are subject to risks, uncertainties and other important factors that could cause actual results and the timing of certain events to differ materially from future results expressed or implied by such forward-looking statements. Factors that could cause or contribute to such differences include, but are not limited to, those identified in the “Risk Factors” section in our filings with the Securities and Exchange Commission. Furthermore, such forward-looking statements speak only as of the date of this presentation. Except as required by law, we undertake no obligation to update any forward-looking statements to reflect events or circumstances after the date of such statements.
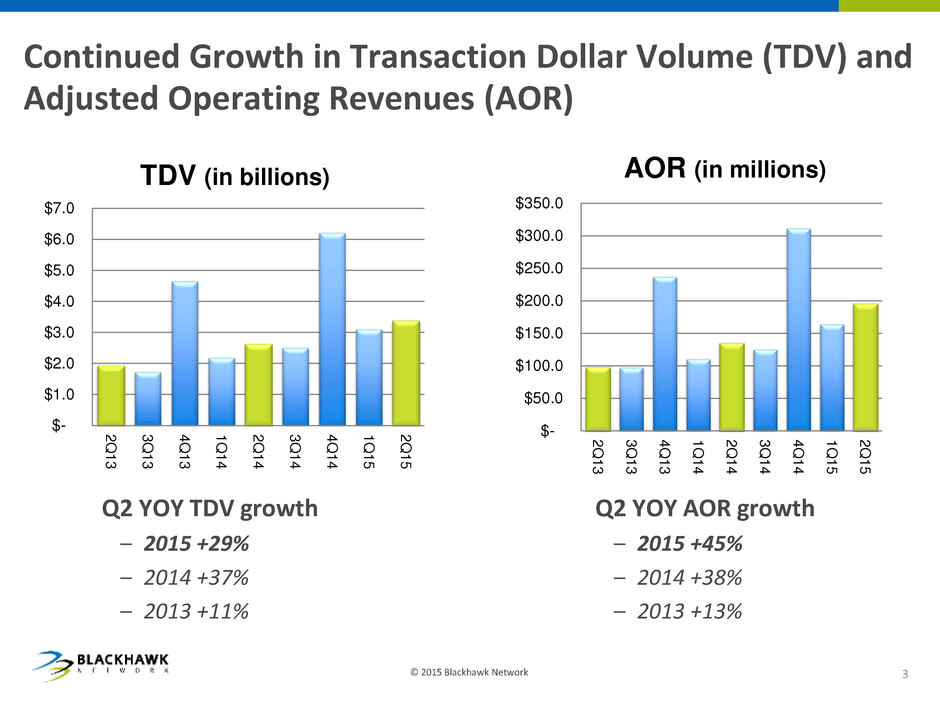
Continued Growth in Transaction Dollar Volume (TDV) and Adjusted Operating Revenues (AOR) 3 © 2015 Blackhawk Network Q2 YOY TDV growth – 2015 +29% – 2014 +37% – 2013 +11% $- $1.0 $2.0 $3.0 $4.0 $5.0 $6.0 $7.0 2Q 13 3Q 13 4Q 13 1Q 14 2Q 14 3Q 14 4Q 14 1Q 15 2Q 15 TDV (in billions) $- $50.0 $100.0 $150.0 $200.0 $250.0 $300.0 $350.0 2Q 13 3Q 13 4Q 13 1Q 14 2Q 14 3Q 14 4Q 14 1Q 15 2Q 15 AOR (in millions) Q2 YOY AOR growth – 2015 +45% – 2014 +38% – 2013 +13%

Adjusted EBITDA and Adjusted EPS 4 © 2015 Blackhawk Network Q2 YOY Adjusted EBITDA growth – 2015 +42% – 2014 +16% – 2013 +23% Q2 YOY Adjusted EPS growth – 2015 +36% – 2014 +75% – 2013 +14% $- $20.0 $40.0 $60.0 $80.0 $100.0 $120.0 2Q 13 3Q 13 4Q 13 1Q 14 2Q 14 3Q 14 4Q 14 1Q 15 2Q 15 Adjusted EBITDA (in millions) $- $0.20 $0.40 $0.60 $0.80 $1.00 $1.20 $1.40 2Q 13 3Q 13 4Q 13 1Q 14 2Q 14 3Q 14 4Q 14 1Q 15 2Q 15 Adjusted EPS

Key Financial Metrics (non-GAAP) Q2’15 vs Q2’14 5 © 2015 Blackhawk Network ($ in millions except EPS) Q2 ’15 Q2 ’14 % Change Adjusted Operating Revenues (AOR) $195.3 $134.7 45% Adjusted EBITDA $30.6 $21.6 42% Adjusted EBITDA Margin 15.7% 16.0% Adjusted Net Income $21.1 $14.8 42% Adjusted Diluted EPS $0.38 $0.28 36% • Excluding pass-through marketing revenues, Adjusted operating revenues grew 36% • Adjusted EBITDA growth lower than Adjusted AOR due to lower expenses in Q2’14 resulting from $3.9 million credit for litigation settlement • Excluding this 2014 item, adjusted EBITDA margin increased from 13.1% to 15.7% • Adjusted net income includes reduction in cash taxes payable related to 2014 spin-off from Safeway and acquisition related NOLs • $9.3M or $0.17 per diluted share for Q2’15 (vs $5.6M or $0.11 per diluted share for Q2’14)
U.S. Retail % Productivity improvements at existing distribution partners drove 65% of YOY TDV growth for Q2’15 Developing innovative, new card content including more local cards, health cards, transportation, lottery solutions and a gift card that enables consumers to “give the gift of stock” Whole Foods pilot successful; contract signed to enable chain-wide rollout in 2016; expected to be a top distribution partner at maturity © 2015 Blackhawk Network 6 On track to expand marketing activities by 30% YOY
Online and Digital YTD Q2 TDV growth triple digits with expanding network of ecommerce sites and mobile payment players Card exchange revenue growth accelerated to 70% during the second quarter through increased retail channels and increased marketing Focus on signing new, large banks over the next 12 months in the nearly $50B loyalty points conversion market Expect to increase marketing and promotional activities by approximately 200% in fiscal 2015 at third party etailers and our proprietary websites © 2015 Blackhawk Network 7
Incentives & Rewards Completed acquisition of Achievers, leading provider of employee engagement solutions; $70+ million billings, $50+ million revenues for calendar 2014 Consolidating sales, marketing and certain IT platforms across BES to optimize performance and reduce operating expenses Leveraging strong retail relationships to accelerate new account sales in consumer and employee incentives © 2015 Blackhawk Network 8 On track to realize $4 million in expense synergies in fiscal 2015 related to last year’s acquisitions, with an expected annualized benefit of $8M in 2016

International Retail © 2015 Blackhawk Network 9 Expanding Open Loop in several European countries Starting digital expansion in several non-U.S. markets with rollout of CardLab platform for eCommerce and bulk incentives Asia-Pac growth remains strong driven by triple digit TDV growth in Japan and Korea China JV expected to close in 2H15; targeting launch late 2015 in large retailers; India launched during the second quarter of 2015

Financial Details
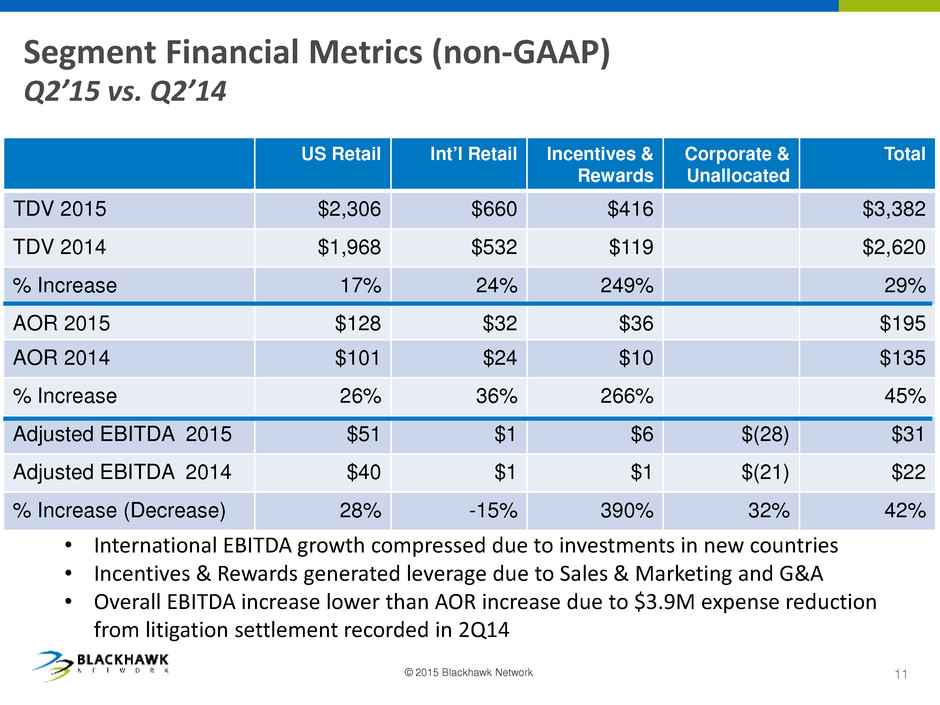
Segment Financial Metrics (non-GAAP) Q2’15 vs. Q2’14 US Retail Int’l Retail Incentives & Rewards Corporate & Unallocated Total TDV 2015 $2,306 $660 $416 $3,382 TDV 2014 $1,968 $532 $119 $2,620 % Increase 17% 24% 249% 29% AOR 2015 $128 $32 $36 $195 AOR 2014 $101 $24 $10 $135 % Increase 26% 36% 266% 45% Adjusted EBITDA 2015 $51 $1 $6 $(28) $31 Adjusted EBITDA 2014 $40 $1 $1 $(21) $22 % Increase (Decrease) 28% -15% 390% 32% 42% • International EBITDA growth compressed due to investments in new countries • Incentives & Rewards generated leverage due to Sales & Marketing and G&A • Overall EBITDA increase lower than AOR increase due to $3.9M expense reduction from litigation settlement recorded in 2Q14 © 2015 Blackhawk Network 11

Revenue Ratios – Q2’15 vs Q2’14 12 © 2015 Blackhawk Network Q2‘15 Q2‘14 Change FY Est* Prepaid and Processing Revenues (PPR) % of TDV 9.2% 9.3% -0.1% 9.2% Partner Distribution Expense (PDE) % of PPR 57.2% 60.9% -3.7% 56.8% Adjusted Operating Revenues (AOR) % of TDV 5.8% 5.1% 0.7% 5.7% Pro Forma Adjusted Operating Revenues % of TDV 4.0% 3.6% 0.4% 4.0% • PPR as % of TDV lower due to higher mix of open loop vs closed loop • PDE as a % of PPR lower due to addition of Parago and higher mix of US open loop • AOR increase primarily due to marketing revenues, Cardpool and Parago • Pro Forma AOR increase due to addition of Parago Note: PPR is total revenues excluding marketing revenues and product sales. See reconciliation to Pro forma AOR in Appendix * Current point estimate of full year ratios
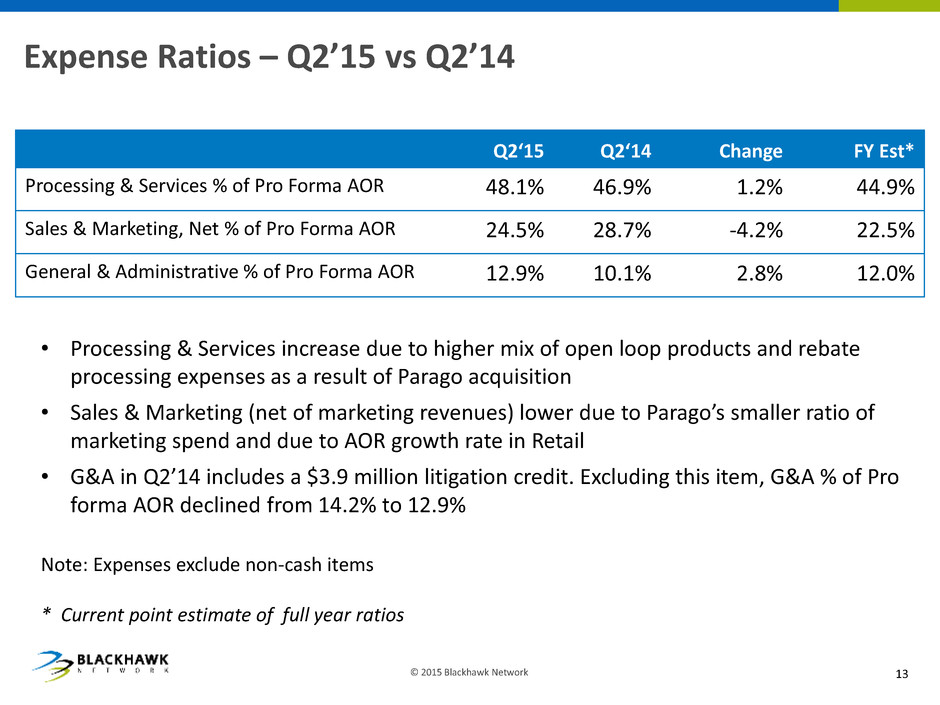
Expense Ratios – Q2’15 vs Q2’14 13 © 2015 Blackhawk Network Q2‘15 Q2‘14 Change FY Est* Processing & Services % of Pro Forma AOR 48.1% 46.9% 1.2% 44.9% Sales & Marketing, Net % of Pro Forma AOR 24.5% 28.7% -4.2% 22.5% General & Administrative % of Pro Forma AOR 12.9% 10.1% 2.8% 12.0% • Processing & Services increase due to higher mix of open loop products and rebate processing expenses as a result of Parago acquisition • Sales & Marketing (net of marketing revenues) lower due to Parago’s smaller ratio of marketing spend and due to AOR growth rate in Retail • G&A in Q2’14 includes a $3.9 million litigation credit. Excluding this item, G&A % of Pro forma AOR declined from 14.2% to 12.9% Note: Expenses exclude non-cash items * Current point estimate of full year ratios

Product Sales and Margin 14 © 2015 Blackhawk Network ($ in millions) Q2‘15 Q2‘14 % Change FY Est* Product Sales $34.6 $27.2 27% 50% Cost of Products Sold $32.1 $25.5 26% 48% Product Gross Profit $2.5 $1.7 46% 84% Product Gross Margin 7.1% 6.2% 15% 6.7% • Q2 Product Sales: comprised of Cardpool (83% of total) up 70% YOY offset by lower telecom handsets and card services & processing revenues • Margin improvement based on mix (higher average Cardpool margins) * Current point estimate of full year growth rate and margin

Achievers Estimates (+ / - 10%) 15 © 2015 Blackhawk Network ($ in millions) Q3‘15 Q4‘15 2H’15 GAAP as reported revenues $ 8.6 $18.4 $ 27.0 Add back: purchase price adjustment 2.1 4.4 6.5 Adjusted Operating Revenues 10.7 22.8 33.5 Adjusted EBITDA (1.8) 1.6 (0.2) Adjusted Net Income (Loss) before Reduction in Cash Taxes Payable (1.9) (0.3) (2.2) Reduction in Cash Taxes Payable (NOLs) 0.8 1.3 2.1 Adjusted Net Income (Loss) $ (1.1) $ 1.0 $ (0.1) • Revenues are recorded primarily on a gross basis at point of redemption with deferrals for software and breakage components; recognized over approximately 12 - 18 months • Purchase price adjustment relates to elimination of the majority of deferred revenue at acquisition; add back reflects normalized period results • Includes cash acquisition-related expenses estimated at $1.7M (primarily Q3)
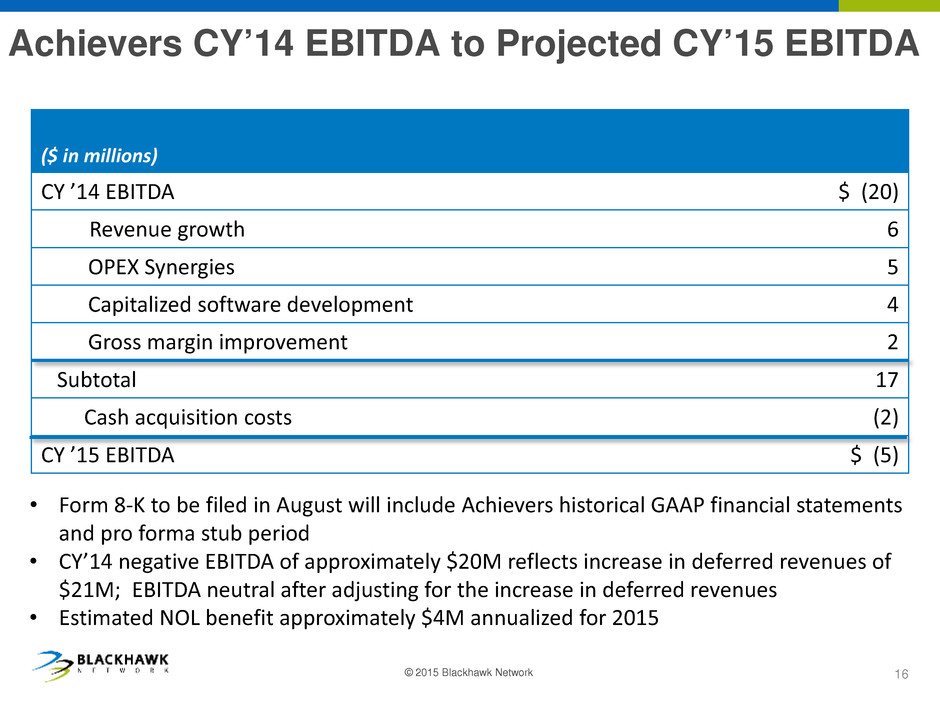
Achievers CY’14 EBITDA to Projected CY’15 EBITDA © 2015 Blackhawk Network 16 ($ in millions) CY ’14 EBITDA $ (20) Revenue growth 6 OPEX Synergies 5 Capitalized software development 4 Gross margin improvement 2 Subtotal 17 Cash acquisition costs (2) CY ’15 EBITDA $ (5) • Form 8-K to be filed in August will include Achievers historical GAAP financial statements and pro forma stub period • CY’14 negative EBITDA of approximately $20M reflects increase in deferred revenues of $21M; EBITDA neutral after adjusting for the increase in deferred revenues • Estimated NOL benefit approximately $4M annualized for 2015

Q3’15 Financial Guidance 17 © 2015 Blackhawk Network • Reduction in cash taxes payable expected to increase $2.4M compared to Q3’14 due to NOLs realized from Parago (+$1.6M) and Achievers (+$0.8M) • Projected share count 56.0 million vs. 54.3 million in Q3’14 ($ in millions except EPS) Q3’15 Guidance Q3’14 Actual % Increase Adjusted Operating Revenues $191.0 - $198.0 $125.4 52% - 58% Adjusted EBITDA $21.5 - $23.5 $14.7 46% - 56% Adjusted Net Income before Reduction in Cash Taxes Payable $5.5 - $6.5 $4.7 17% - 38% Adjusted Diluted EPS before Reduction in Cash Taxes Payable $0.10 - $0.12 $0.09 9% - 29% Adjusted Net Income $15.7 - $16.7 $12.4 27% - 34% Adjusted Diluted EPS $0.28 - $0.30 $0.23 22% - 30%

Q4’15 Financial Guidance ($ in millions except EPS) Q4’15 Guidance Q4’14 Actual % Increase Adjusted Operating Revenues $376 - $403 $312 21% - 29% Adjusted EBITDA $104 - $112 $96 8% - 16% Adjusted Net Income before Reduction in Cash Taxes Payable $53 - $57 $52 4% - 11% Adjusted Diluted EPS before Reduction in Cash Taxes Payable $0.95 - $1.02 $0.93 2% - 10% Adjusted Net Income $67 - $72 $64 4% - 12% Adjusted Diluted EPS $1.19 - $1.27 $1.16 2% - 10% • EBITDA growth rate and margin lower YOY mainly due to Achievers (140bps impact), International and FX (80bps) and lower revenue growth rate in US retail (30bps) • Adjusted net income reflects increases in depreciation (+35%) and interest (+22%) driven by acquisitions • Achievers NOL benefit expected to add $1M to reduction in cash taxes payable • Projected share count 56.2 million vs. 55.0 million in Q4’14 18
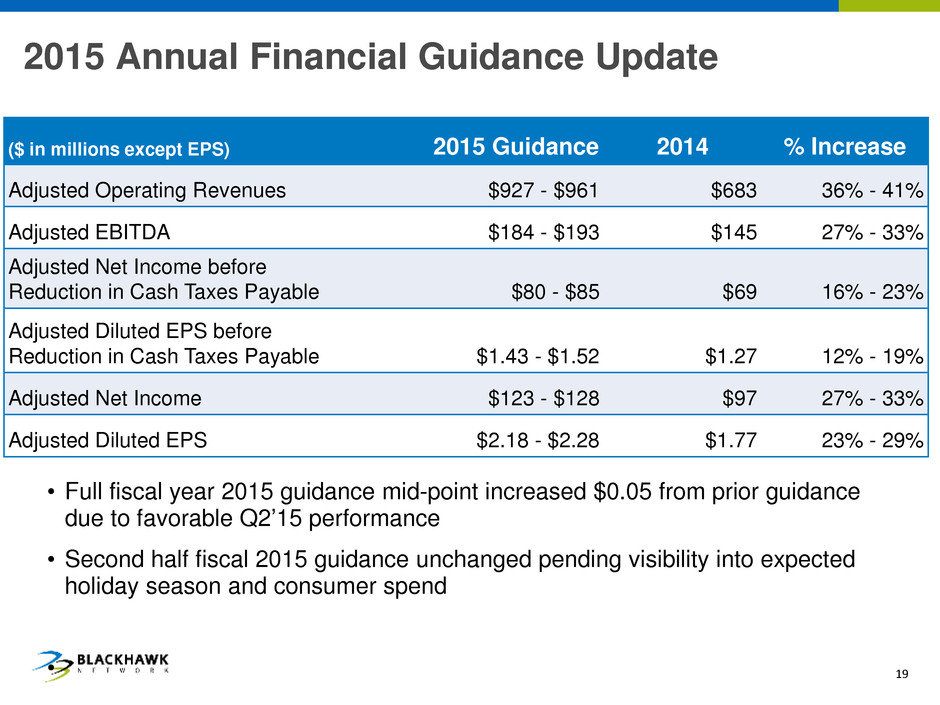
2015 Annual Financial Guidance Update ($ in millions except EPS) 2015 Guidance 2014 % Increase Adjusted Operating Revenues $927 - $961 $683 36% - 41% Adjusted EBITDA $184 - $193 $145 27% - 33% Adjusted Net Income before Reduction in Cash Taxes Payable $80 - $85 $69 16% - 23% Adjusted Diluted EPS before Reduction in Cash Taxes Payable $1.43 - $1.52 $1.27 12% - 19% Adjusted Net Income $123 - $128 $97 27% - 33% Adjusted Diluted EPS $2.18 - $2.28 $1.77 23% - 29% • Full fiscal year 2015 guidance mid-point increased $0.05 from prior guidance due to favorable Q2’15 performance • Second half fiscal 2015 guidance unchanged pending visibility into expected holiday season and consumer spend • 19
Appendix

Adjusted EBITDA Bridge – Q2’15 vs Q2’14 21 © 2015 Blackhawk Network ($ in millions) Existing 2014 Acquisitions Total Q2 2014 Adjusted EBITDA $22 $0 $22 AOR 36 24 60 OPEX (31) (20) (51) FX rate impact* - - - Q2 2015 Adjusted EBITDA $27 $4 $31 % increase YOY 24% n/a 42% * FX impact $0.5 million

Q2’15 Adjusted EBITDA Walk to Adjusted Net Income 22 © 2015 Blackhawk Network ($ in millions) Existing 2014 Acquisitions Total Q2 2015 Adjusted EBITDA $27 $4 $31 Depreciation (7) (3) (10) Interest, Net - (2) (2) Adjusted Income Before Taxes 20 (1) 19 Income Taxes (7) - (7) Adjusted Net Income Before Reduction in Cash Taxes Payable 13 (1) 12 Add: Reduction in Cash Taxes Payable 6 3 9 Q2 2015 Adjusted Net Income $19 $2 $21

Adjusted EPS Bridge – Q2’15 vs. Q2’14 23 © 2015 Blackhawk Network Total Excl Tax Tax Benefits Total Q2 2014 Adjusted EPS $0.17 $0.11 $0.28 Growth from existing businesses 0.08 0.08 Growth from 2014 acquisitions 0.02 0.03 0.05 Less: Interest increase 1st year (0.02) (0.02) Net increase from acquisitions 0.00 0.03 0.03 Cash tax benefit – spin-off 0.00 0.03 0.03 One-time expense items - 2014 spin 0.01 0.01 Decrease litigation settlement (0.04) (0.04) Dilution from increase in shares o/s (0.01) (0.01) Q2 2015 Adjusted EPS $0.21 $0.17 $0.38

GAAP Revenues, Adjusted Operating Revenues (AOR) and Pro Forma AOR Reconciliation 24 © 2015 Blackhawk Network ($ in millions) Q2‘15 Q2‘14 % Increase Total Operating Revenues $372 $284 31% Less: Partner Distribution Expense (177) (148) 19% Less: Bank Amendments - (1) N/M Adjusted Operating Revenues 195 135 45% Less: Marketing Revenues (28) (13) 117% Less: Product Sales (34) (27) 27% Add: Mark-to-Market and Intangible 1 - N/M Pro Forma Adjusted Operating Revenues $134 $95 41% • Pro forma AOR measures expense leverage • Marketing revenues are a pass through with offset in sales and marketing expense • Product sales and cost of product sold are separate line items on the income statement and product sales don’t drive material other operating expenses • Mark-to-market and intangible expense adjustments represent non-cash items
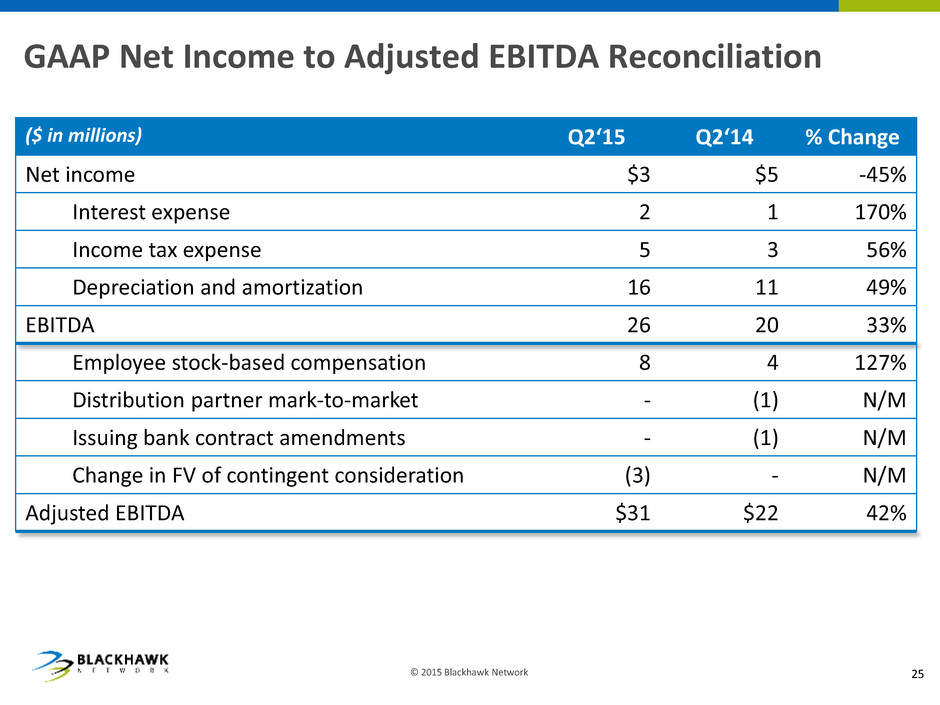
GAAP Net Income to Adjusted EBITDA Reconciliation © 2015 Blackhawk Network ($ in millions) Q2‘15 Q2‘14 % Change Net income $3 $5 -45% Interest expense 2 1 170% Income tax expense 5 3 56% Depreciation and amortization 16 11 49% EBITDA 26 20 33% Employee stock-based compensation 8 4 127% Distribution partner mark-to-market - (1) N/M Issuing bank contract amendments - (1) N/M Change in FV of contingent consideration (3) - N/M Adjusted EBITDA $31 $22 42% 25

GAAP Net Income to Adjusted Net Income Reconciliation © 2015 Blackhawk Network ($ in millions) Q2‘15 Q2‘14 % Change Income before income tax expense $8 $8 -5% Employee stock-based compensation 8 4 127% Distribution partner mark-to-market - (1) N/M Issuing bank contract amendments - (1) N/M Change in FV of contingent consideration (3) - N/M Amortization of intangibles 6 5 42% Adjusted income before income tax expense 19 15 27% Income tax expense 5 4 56% Tax expense on adjustments 2 2 -16% Spin-Off and NOL benefits (9) (6) 66% Adjusted tax expense (benefit) 2 - N/M Adjusted net income $21 $15 42% 26

Q & A


