Exhibit 99.1
Exhibit 99.1
Apollo Global Management, LLC – Investor Presentation
June 2014
Information contained herein is as of March 31, 2014 unless otherwise noted. Not for distribution in whole or in part without the express consent of Apollo Global Management, LLC. It should not be assumed that investments made in the future will be profitable or will equal the performance of the investments in this document.
Forward Looking Statements and Other Important Disclosures
This presentation may contain forward looking statements that are within the meaning of Section 27A of the Securities Act of 1933 and Section 21E of the Securities Exchange Act of 1934. These statements include, but are not limited to, discussions related to Apollo Global Management, LLC’s and its subsidiaries’ (collectively, “Apollo”) expectations regarding the performance of its business, its liquidity and capital resources and the other non-historical statements. These forward-looking statements are based on management’s beliefs, as well as assumptions made by, and information currently available to, management. When used in this presentation, the words “believe,” “anticipate,” “estimate,” “expect,” “intend” and similar expressions are intended to identify forward-looking statements. Although management believes that the expectations reflected in these forward-looking statements are reasonable, it can give no assurance that these expectations will prove to have been correct. These statements are subject to certain risks, uncertainties and assumptions. We believe these factors include but are not limited to those described under the section entitled “Risk Factors” in the Company’s Annual Report on Form 10-K filed with the Securities and Exchange Commission (“SEC”) on March 3, 2014, as such factors may be updated from time to time in our periodic filings with the SEC, which are accessible on the SEC’s website at www.sec.gov. These factors should not be construed as exhaustive and should be read in conjunction with the other cautionary statements that are included in this presentation and in other SEC filings. We undertake no obligation to publicly update or review any forward-looking statements, whether as a result of new information, future developments or otherwise.
Information contained herein may include information with respect to prior investment performance of one or more Apollo funds or investments including gross and/or net internal rates of return (“IRR”). Information with respect to prior performance, while a useful tool in evaluating Apollo’s investment activities, is not necessarily indicative of actual results that may be achieved for unrealized investments. “Gross IRR” of a private equity fund represents the cumulative investment-related cash flows for all of the investors in the fund on the basis of the actual timing of investment inflows and outflows (for unrealized investments assuming disposition on the respective “as of” dates referenced) aggregated on a gross basis quarterly, and the return is annualized and compounded before management fees, carried interest and certain other fund expenses (including interest incurred by the fund itself) and measures the returns on the fund’s investments as a whole without regard to whether all of the returns would, if distributed, be payable to the fund’s investors. “Net IRR” of a private equity fund means the gross IRR applicable to all investors, including related parties which may not pay fees, net of management fees, organizational expenses, transaction costs, and certain other fund expenses (including interest incurred by the fund itself); the realized and estimated unrealized value is adjusted such that a percentage of up to 20.0% of the unrealized gain is allocated to the general partner, thereby reducing the balance attributable to fund investors’ carried interest all offset to the extent of interest income, and measures returns based on amounts that, if distributed, would be paid to investors of the fund, to the extent that a private equity fund exceeds all requirements detailed within the applicable fund agreement. “Net IRR” of a “credit fund” means the Gross IRR applicable to all investors, including related parties which may not pay fees, net of management fees, organizational expenses, transaction costs, and certain other Fund expenses (including interest incurred by the Fund itself) and realized carried interest all offset to the extent of interest income, and measures returns based on amounts that, if distributed, would be paid to investors of the Fund.
This presentation is for informational purposes only and does not constitute an offer to sell, or the solicitation of an offer to buy, any security, product, service of Apollo as well as any Apollo sponsored investment fund, whether an existing or contemplated fund, for which an offer can be made only by such fund’s Confidential Private Placement Memorandum and in compliance with applicable law.
Unless otherwise noted, information included herein is presented as of the dates indicated. This presentation is not complete and the information contained herein may change at any time without notice. Apollo does not have any responsibility to update the presentation to account for such changes.
Apollo makes no representation or warranty, express or implied, with respect to the accuracy, reasonableness or completeness of any of the information contained herein, including, but not limited to, information obtained from third parties.
The information contained herein is not intended to provide, and should not be relied upon for, accounting, legal or tax advice or investment recommendations.
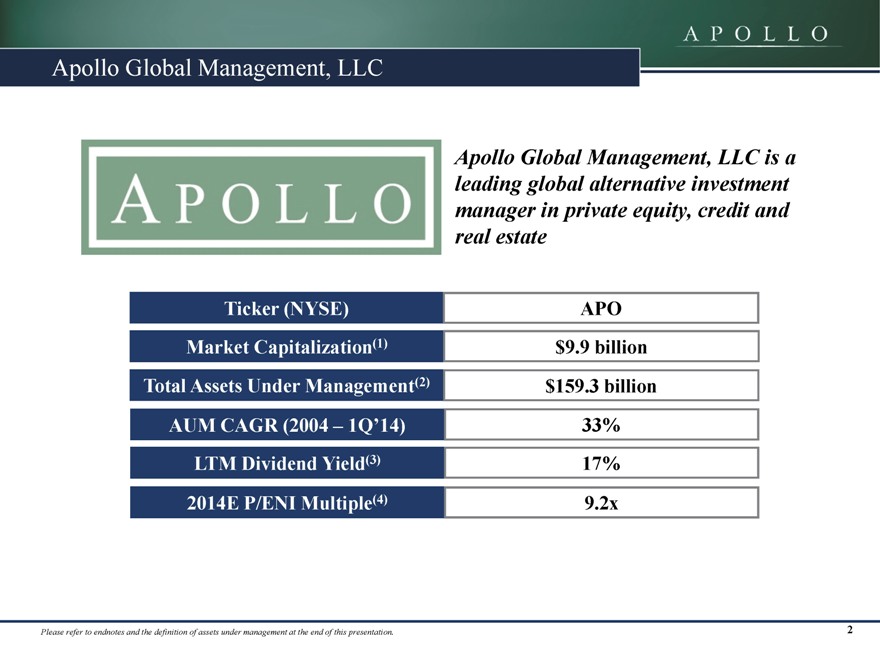
Apollo Global Management, LLC
Apollo Global Management, LLC is a leading global alternative investment manager in private equity, credit and real estate
Ticker (NYSE) APO
Market Capitalization(1) $9.9 billion
Total Assets Under Management(2) $159.3 billion
AUM CAGR (2004 – 1Q’14) 33%
LTM Dividend Yield(3) 17%
2014E P/ENI Multiple(4) 9.2x
Please refer to endnotes and the definition of assets under management at the end of this presentation. 2
Agenda
1. Overview of Apollo
2. Business Segments
3. Financial Overview
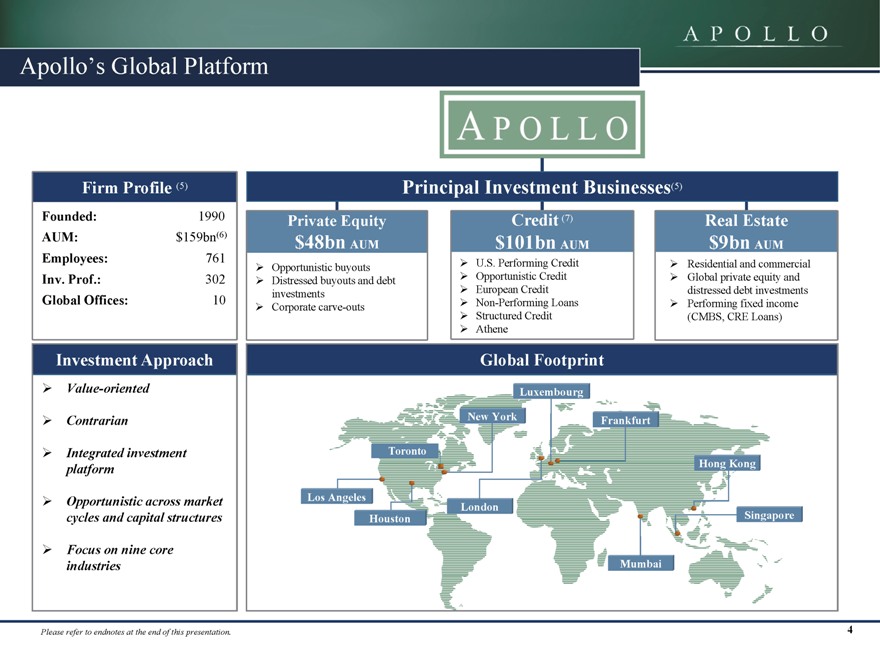
Apollo’s Global Platform
Firm Profile (5)
Founded: 1990
AUM: $159bn(6)
Employees: 761
Inv. Prof.: 302
Global Offices: 10
Principal Investment Businesses(5)
Private Equity Credit (7) Real Estate
$48bn AUM $101bn AUM $9bn AUM
Opportunistic buyouts U.S. Performing Credit Residential and commercial
Distressed buyouts and debt Opportunistic Credit Global private equity and
investments European Credit distressed debt investments
Corporate carve-outs Non-Performing Loans Performing fixed income
Structured Credit (CMBS, CRE Loans)
Athene
Investment Approach
Value-oriented
Contrarian
Integrated investment platform
Opportunistic across market cycles and capital structures
Focus on nine core industries
Global Footprint
Luxembourg
New York Frankfurt
Toronto
Hong Kong
Los Angeles London
Houston Singapore
Mumbai
Please refer to endnotes at the end of this presentation. 4
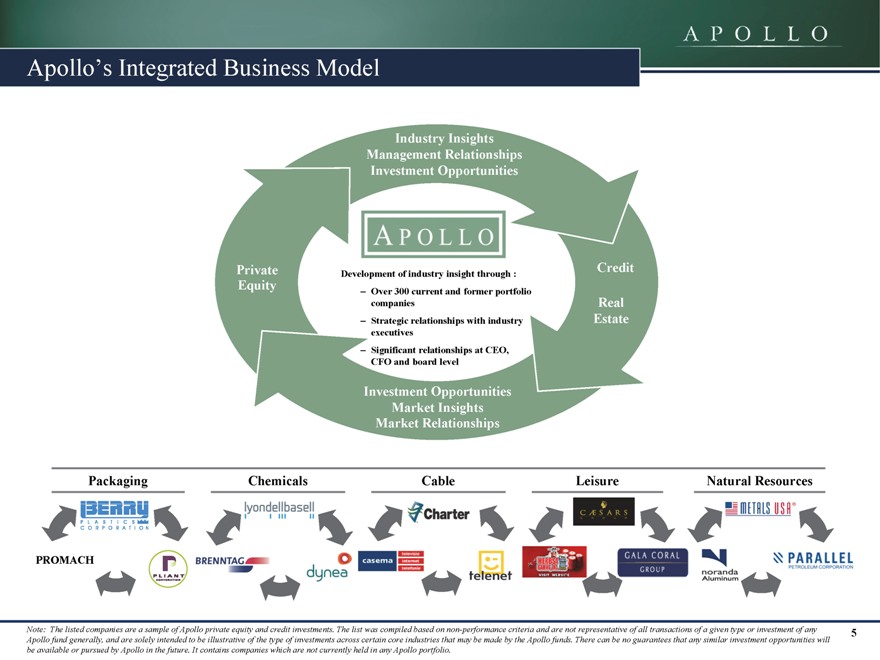
Apollo’s Integrated Business Model
Industry Insights Management Relationships Investment Opportunities
Private Credit
Development of industry insight through :
Equity
– Over 300 current and former portfolio companies Real
– Strategic relationships with industry Estate executives
– Significant relationships at CEO, CFO and board level
Investment Opportunities Market Insights Market Relationships
Packaging Chemicals Cable Leisure Natural Resources
PROMACH
Note: The listed companies are a sample of Apollo private equity and credit investments. The list was compiled based on non-performance criteria and are not representative of all transactions of a given type or investment of any 5 Apollo fund generally, and are solely intended to be illustrative of the type of investments across certain core industries that may be made by the Apollo funds. There can be no guarantees that any similar investment opportunities will be available or pursued by Apollo in the future. It contains companies which are not currently held in any Apollo portfolio.
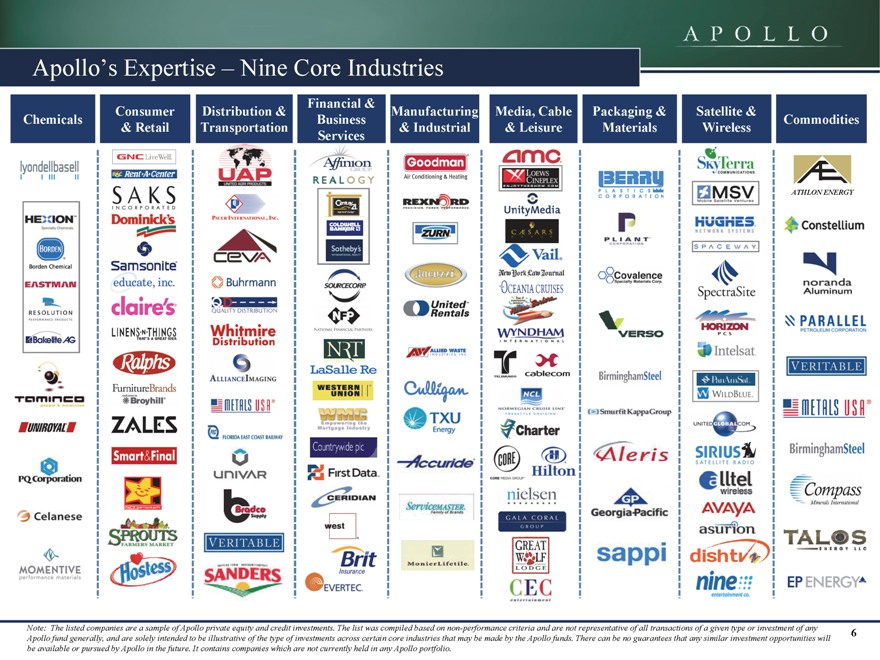
Apollo’s Expertise – Nine Core Industries
Financial &
Consumer Distribution & Manufacturing Media, Cable Packaging & Satellite &
Chemicals Business Commodities
& Retail Transportation & Industrial & Leisure Materials Wireless Services
ATHLON ENERGY
Note: The listed companies are a sample of Apollo private equity and credit investments. The list was compiled based on non-performance criteria and are not representative of all transactions of a given type or investment of any 6 Apollo fund generally, and are solely intended to be illustrative of the type of investments across certain core industries that may be made by the Apollo funds. There can be no guarantees that any similar investment opportunities will be available or pursued by Apollo in the future. It contains companies which are not currently held in any Apollo portfolio.
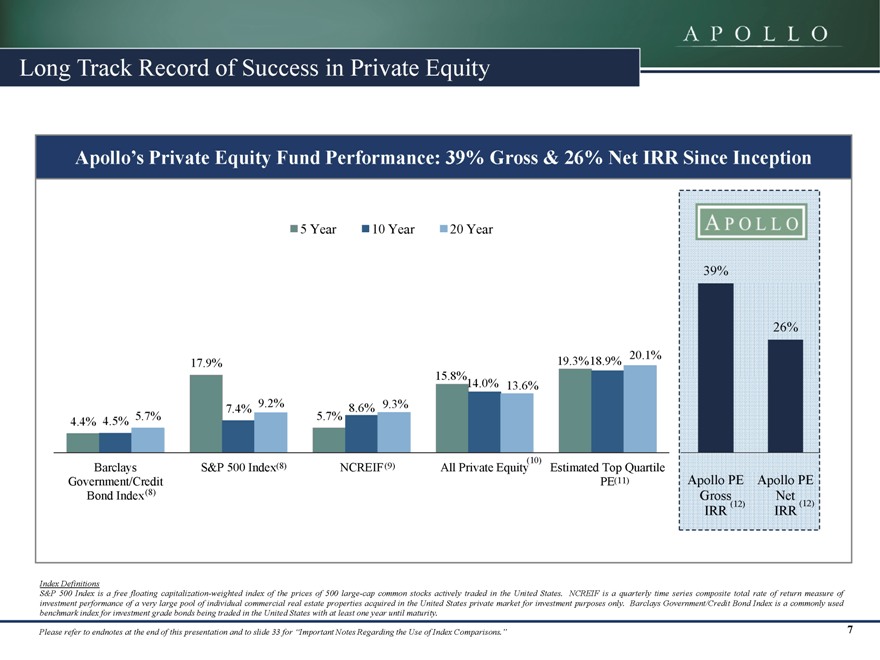
Long Track Record of Success in Private Equity
Apollo’s Private Equity Fund Performance: 39% Gross & 26% Net IRR Since Inception
39%
26%
20.1%
17.9% 19.3%18.9%
15.8%
14.0% 13.6% 7.4% 9.2% 8.6% 9.3% 4.5% 5.7% 5.7% 4.4%
Barclays S&P 500 Index(8) NCREIF(9) All Private Equity 10 Estimated Top Quartile
Government/Credit PE(11) Apollo PE Apollo PE Bond Index(8) Gross Net
IRR IRR
Index Definitions
S&P 500 Index is a free floating capitalization-weighted index of the prices of 500 large-cap common stocks actively traded in the United States. NCREIF is a quarterly time series composite total rate of return measure of investment performance of a very large pool of individual commercial real estate properties acquired in the United States private market for investment purposes only. Barclays Government/Credit Bond Index is a commonly used benchmark index for investment grade bonds being traded in the United States with at least one year until maturity.
Please refer to endnotes at the end of this presentation and to slide 33 for “Important Notes Regarding the Use of Index Comparisons.” 7
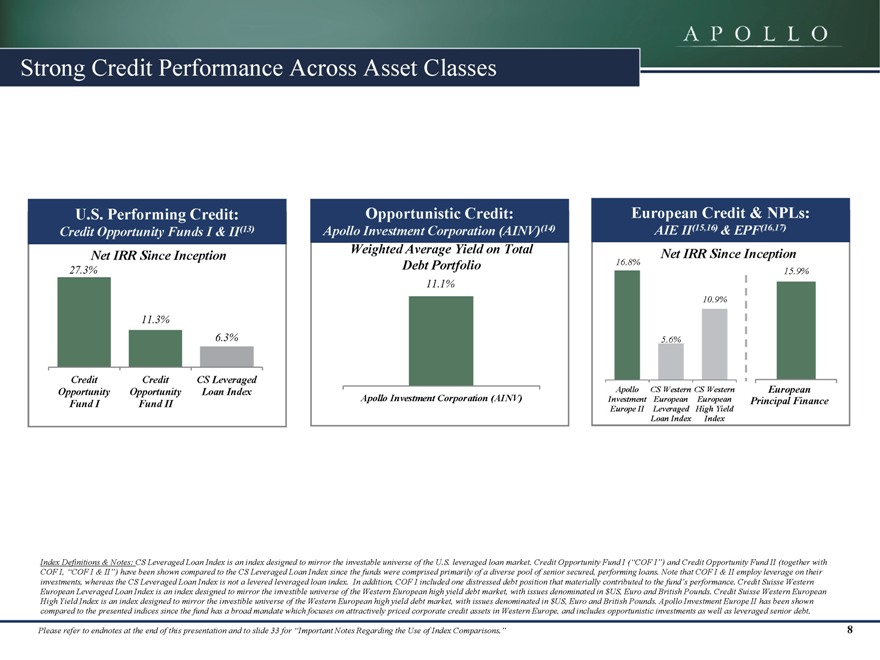
Strong Credit Performance Across Asset Classes
U.S. Performing Credit: Opportunistic Credit: European Credit & NPLs:
Credit Opportunity Funds I & II(13) Apollo Investment Corporation (AINV)(14) AIE II(15,16) & EPF(16,17) Weighted Average Yield on Total Net IRR Since Inception Net IRR Since Inception
Debt Portfolio 16.8%
27.3% 15.9% 11.1%
10.9%
11.3%
6.3% 5.6%
Credit Credit CS Leveraged
European
Opportunity Opportunity Loan Index Apollo CS Western CS Western
Apollo Investment Corporation (AINV) Principal Finance
Fund I Fund II Investment European European
Europe II Leveraged High Yield Loan Index Index
Index Definitions & Notes: CS Leveraged Loan Index is an index designed to mirror the investable universe of the U.S. leveraged loan market. Credit Opportunity Fund I (“COF I”) and Credit Opportunity Fund II (together with COF I, “COF I & II”) have been shown compared to the CS Leveraged Loan Index since the funds were comprised primarily of a diverse pool of senior secured, performing loans. Note that COF I & II employ leverage on their investments, whereas the CS Leveraged Loan Index is not a levered leveraged loan index. In addition, COF I included one distressed debt position that materially contributed to the fund’s performance. Credit Suisse Western European Leveraged Loan Index is an index designed to mirror the investible universe of the Western European high yield debt market, with issues denominated in $US, Euro and British Pounds. Credit Suisse Western European High Yield Index is an index designed to mirror the investible universe of the Western European high yield debt market, with issues denominated in $US, Euro and British Pounds. Apollo Investment Europe II has been shown compared to the presented indices since the fund has a broad mandate which focuses on attractively priced corporate credit assets in Western Europe, and includes opportunistic investments as well as leveraged senior debt.
Please refer to endnotes at the end of this presentation and to slide 33 for “Important Notes Regarding the Use of Index Comparisons.” 8
Significant Growth and Diversification
Apollo’s Total AUM Has Grown Significantly Over the Last Decade
($ in billions)
Total AUM: $159bn(18)
Private Equity Credit Real Estate Unallocated Strategic Accounts
$8.9
Dramatically different business today vs. at IPO
AUM CAGR: 32%
$8.8 $101.2
U.S. Performing Credit Structured
$64.4 $6.5 Credit $6.5 Opportunistic NPLs 1990- $22.3 $23.8 Euro Credit
2002:
PE Only $15.1 $4.4
$48.1
$38.8 $39.6 $37.8 $1.6 $29.1
$20.2 $8.2 $9.8
2002 2004 2006 2008 2010 At IPO (1Q’11) 2012 1Q’14
Apollo AUM CAGR (Since 2004): 33%
Please refer to endnotes at the end of this presentation. 9
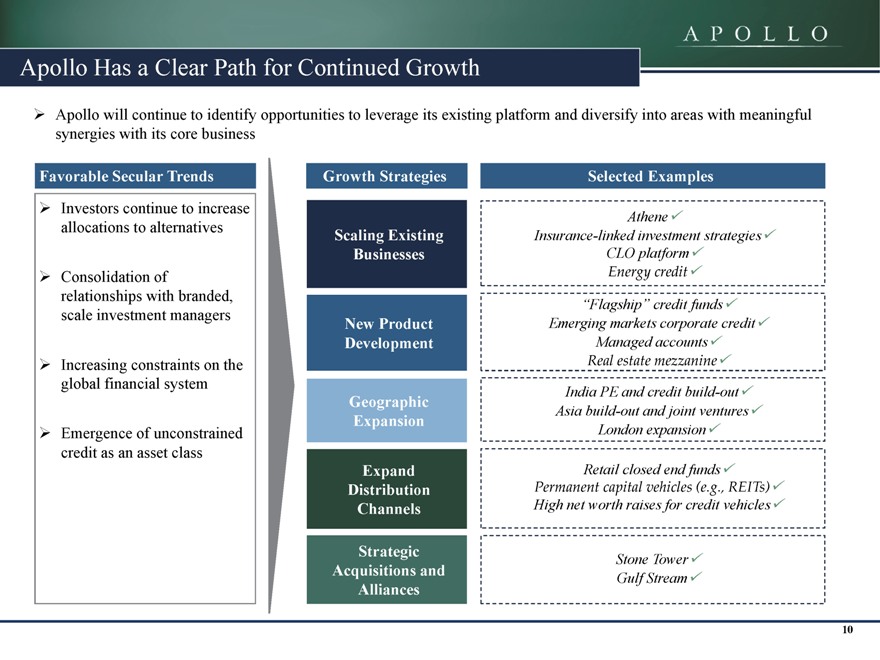
Apollo Has a Clear Path for Continued Growth
Apollo will continue to identify opportunities to leverage its existing platform and diversify into areas with meaningful synergies with its core business
Favorable Secular Trends
Investors continue to increase allocations to alternatives
Consolidation of relationships with branded, scale investment managers
Increasing constraints on the global financial system
Emergence of unconstrained credit as an asset class
Growth Strategies Selected Examples
Athene
Scaling Existing Insurance-linked investment strategies Businesses CLO platform
Energy credit
“Flagship” credit funds New Product Emerging markets corporate credit Development Managed accounts
Real estate mezzanine
India PE and credit build-out
Geographic
Asia build-out and joint ventures
Expansion
London expansion
Expand Retail closed end funds
Distribution Permanent capital vehicles (e.g., REITs)
Channels High net worth raises for credit vehicles
Strategic
Stone Tower
Acquisitions and
Gulf Stream
Alliances
10
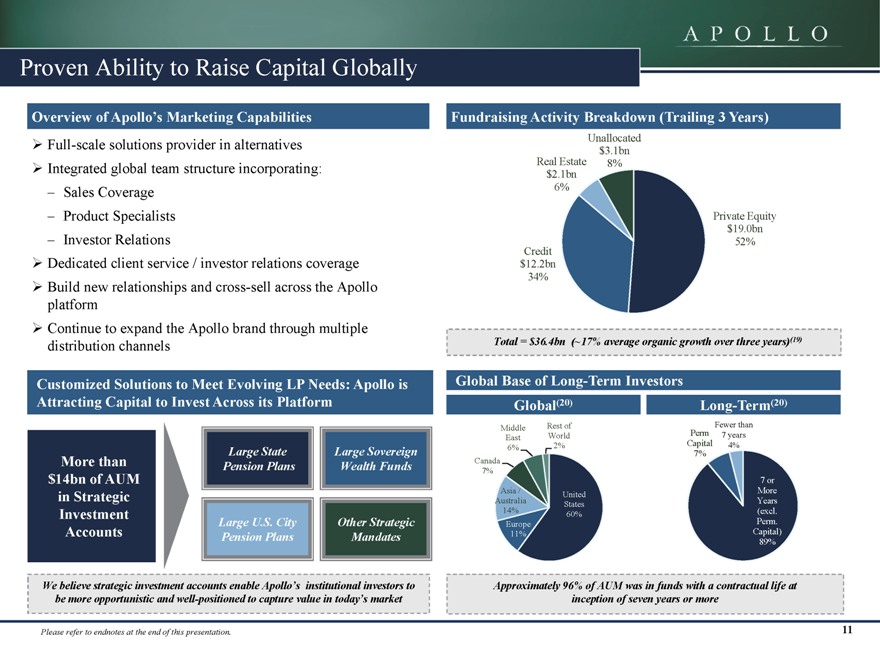
Proven Ability to Raise Capital Globally
Overview of Apollo’s Marketing Capabilities
Full-scale solutions provider in alternatives Integrated global team structure incorporating:
– Sales Coverage
– Product Specialists
– Investor Relations
Dedicated client service / investor relations coverage Build new relationships and cross-sell across the Apollo platform Continue to expand the Apollo brand through multiple distribution channels
Fundraising Activity Breakdown (Trailing 3 Years)
Unallocated $3.1bn Real Estate 8% $2.1bn 6%
Private Equity
$19.0bn Credit 52%
$12.2bn 34%
Total = $36.4bn (~17% average organic growth over three years)(19)
Customized Solutions to Meet Evolving LP Needs: Apollo is Attracting Capital to Invest Across its Platform
More than $14bn of AUM in Strategic Investment Accounts
Large State Pension Plans
Large Sovereign Wealth Funds
Large U.S. City Pension Plans
Other Strategic Mandates
Global Base of Long-Term Investors
Global(20) Long-Term(20)
Middle Rest of East World
6% 2% Canada 7%
Asia / United Australia States 14% 60% Europe 11%
Perm Fewer than
Capital 7 years
7% 4%
7 | | or More Years (excl. Perm. Capital) 89% |
We believe strategic investment accounts enable Apollo’s institutional investors to be more opportunistic and well-positioned to capture value in today’s market
Approximately 96% of AUM was in funds with a contractual life at inception of seven years or more
Please refer to endnotes at the end of this presentation. 11
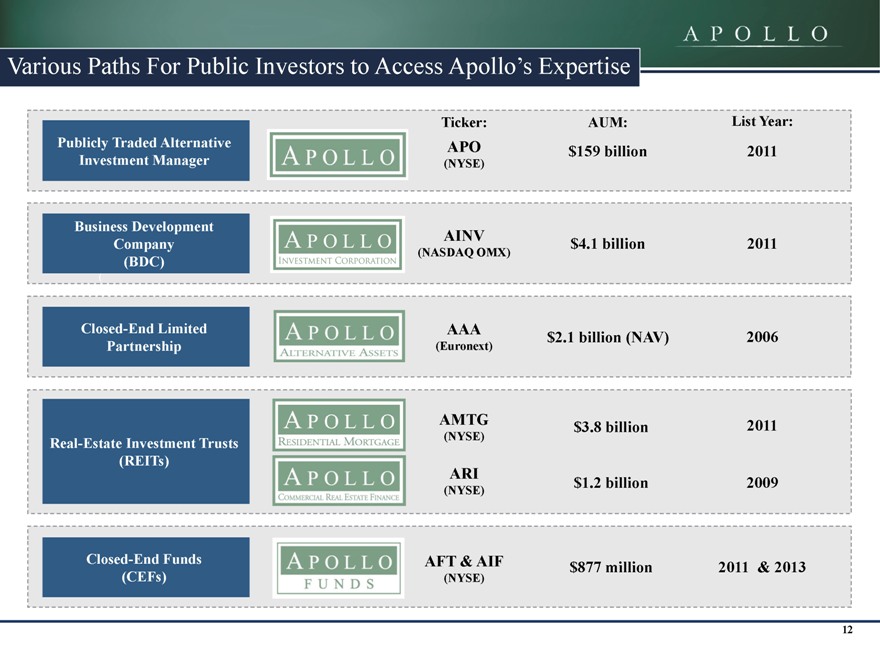
Various Paths For Public Investors to Access Apollo’s Expertise
Publicly Traded Alternative Investment Manager
Business Development Company (BDC)
Closed-End Limited Partnership
Real-Estate Investment Trusts (REITs)
Closed-End Funds (CEFs)
Ticker:
APO
(NYSE)
AINV
(NASDAQ OMX)
AAA
(Euronext)
AMTG
(NYSE)
(NYSE)
AFT & AIF
ARI
(NYSE)
AUM:
$159 billion
$4.1 billion
$2.1 billion (NAV)
$3.8 billion
$1.2 billion
$877 million
List Year:
2011 2011 2006
2011
2009
2011 & 2013
12
Agenda
1. Background & Business Model
2. Business Segments
3. Financial Overview
13
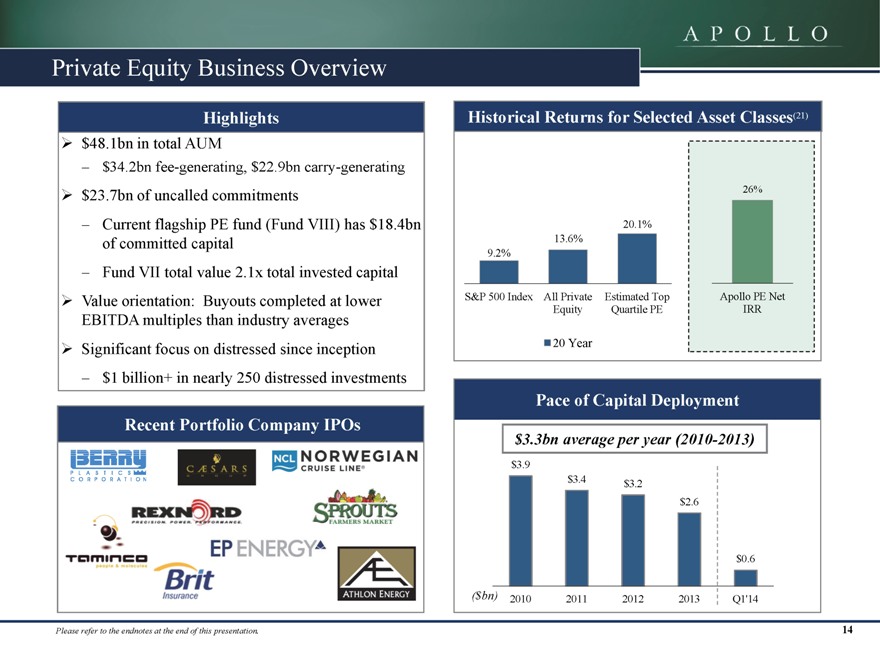
Private Equity Business Overview
Highlights
$48.1bn in total AUM
– $34.2bn fee-generating, $22.9bn carry-generating
$23.7bn of uncalled commitments
– Current flagship PE fund (Fund VIII) has $18.4bn of committed capital
– Fund VII total value 2.1x total invested capital Value orientation: Buyouts completed at lower EBITDA multiples than industry averages Significant focus on distressed since inception
– $1 billion+ in nearly 250 distressed investments
Historical Returns for Selected Asset Classes(21)
26%
20.1%
13.6% 9.2%
S&P 500 Index All Private Estimated Top Apollo PE Net Equity Quartile PE IRR
20 Year
Recent Portfolio Company IPOs
Pace of Capital Deployment
$3.3bn average per year (2010-2013)
$3.9 $3.4 $3.2
$2.6
$0.6
($bn) 2010 2011 2012 2013 Q1’14
Please refer to the endnotes at the end of this presentation. 14
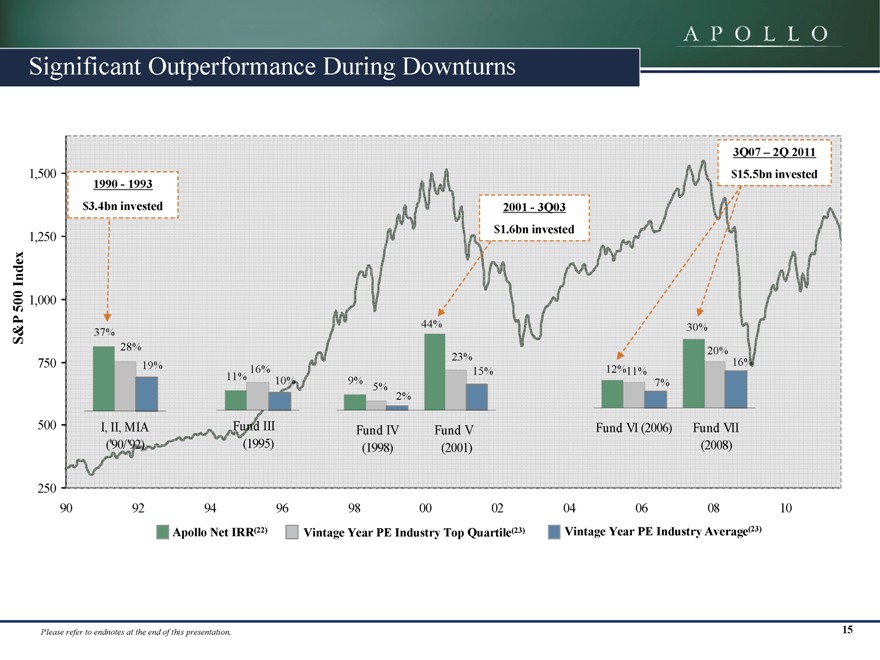
Significant Outperformance During Downturns
3Q07 – 2Q 2011 1,500 $15.5bn invested 1990—1993 $3.4bn invested 2001—3Q03 $1.6bn invested
1,250
1,000
44% 30%
37%
28% 23% 20%
750 19% 16% 16% 15% 12%11% 10% 9% 7% 5% 2% 11%
500 I, II, MIA Fund III Fund IV Fund V Fund VI (2006) Fund VII
(‘90/‘92) (1995) (1998) (2001) (2008)
250
90 92 94 96 98 00 02 04 06 08 10
Apollo Net IRR(22) Vintage Year PE Industry Top Quartile(23) Vintage Year PE Industry Average(23)
Please refer to endnotes at the end of this presentation. 15
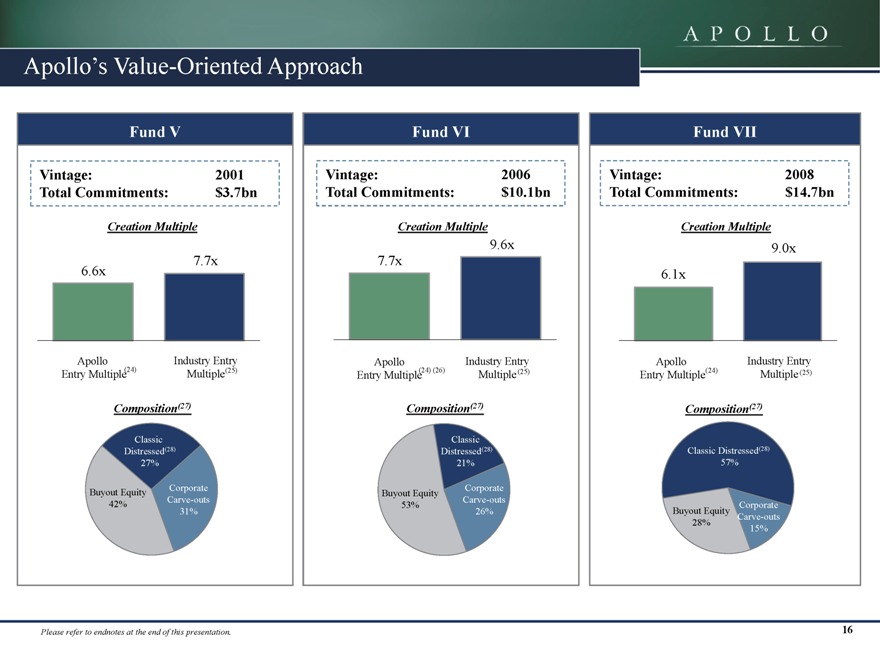
Apollo’s Value-Oriented Approach
Fund V
Vintage: 2001 Total Commitments: $3.7bn
Creation Multiple
7.7x 6.6x
Apollo Industry Entry Entry Multiple(24) Multiple(25)
Composition(27)
Classic Distressed(28) 27%
Corporate Buyout Equity Carve-outs 42% 31%
Fund VI
Vintage: 2006 Total Commitments: $10.1bn
Creation Multiple
9.6x 7.7x
Apollo Industry Entry Entry Multiple (24) (26) Multiple(25)
Composition(27)
Classic Distressed(28) 21%
Corporate Buyout Equity Carve-outs 53% 26%
Fund VII
Vintage: 2008 Total Commitments: $14.7bn
Creation Multiple
9.0x 6.1x
Apollo Industry Entry Entry Multiple(24) Multiple (25)
Composition(27)
Classic Distressed(28) 57%
Corporate Buyout Equity Carve-outs 28% 15%
Please refer to endnotes at the end of this presentation. 16
Credit Business Overview
Highlights
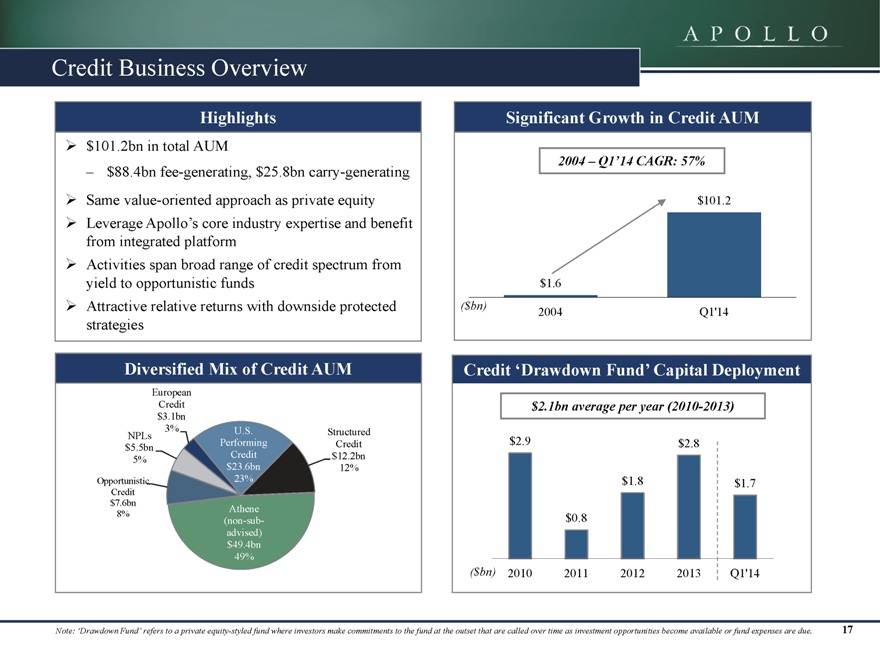
$101.2bn in total AUM
– $88.4bn fee-generating, $25.8bn carry-generating Same value-oriented approach as private equity Leverage Apollo’s core industry expertise and benefit from integrated platform Activities span broad range of credit spectrum from yield to opportunistic funds Attractive relative returns with downside protected strategies
Significant Growth in Credit AUM
2004 – Q1’14 CAGR: 57%
$101.2
$1.6
($bn)
2004 Q1’14
Diversified Mix of Credit AUM
European Credit $3.1bn
3% U.S. Structured NPLs Performing Credit $5.5bn Credit $12.2bn
5% $23.6bn 12%
Opportunistic 23% Credit $7.6bn
Athene
8%
(non-sub-advised) $49.4bn 49%
Credit ‘Drawdown Fund’ Capital Deployment
$2.1bn average per year (2010-2013)
$2.9 $2.8 $1.8 $1.7
$0.8
($bn) 2010 2011 2012 2013 Q1’14
Note: ‘Drawdown Fund’ refers to a private equity-styled fund where investors make commitments to the fund at the outset that are called over time as investment opportunities become available or fund expenses are due. 17
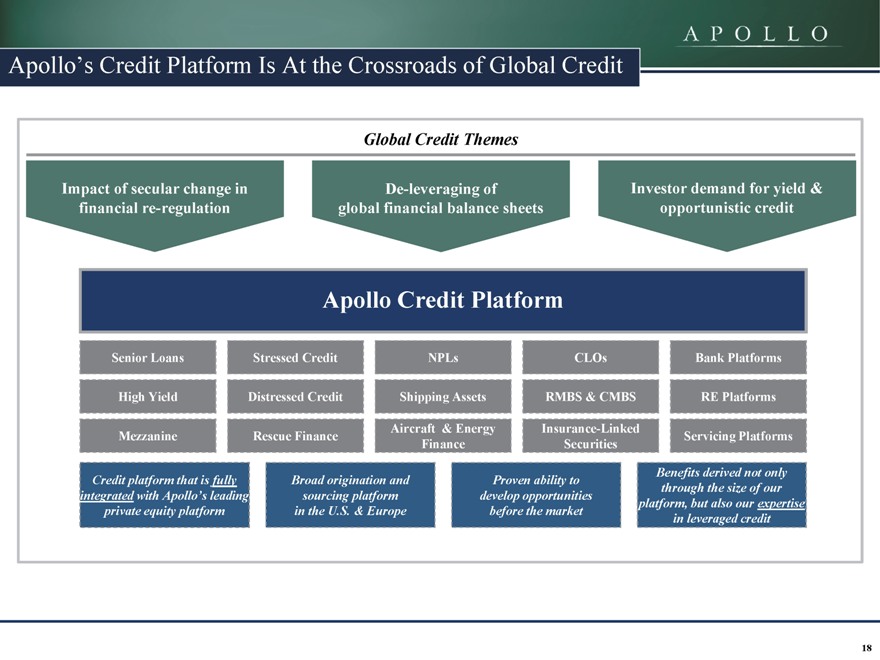
Apollo’s Credit Platform Is At the Crossroads of Global Credit
Global Credit Themes
Impact of secular change in De-leveraging of Investor demand for yield & financial re-regulation global financial balance sheets opportunistic credit
Apollo Credit Platform
Senior Loans Stressed Credit NPLs CLOs Bank Platforms
High Yield Distressed Credit Shipping Assets RMBS & CMBS RE Platforms
Aircraft & Energy Insurance-Linked
Mezzanine Rescue Finance Servicing Platforms Finance Securities
Credit platform that is fully Broad origination and Proven ability to through the size of our integrated with Apollo’s leading sourcing platform develop opportunities platform, but also our expertise private equity platform in the U.S. & Europe before the market in leveraged credit Benefits derived not only
18
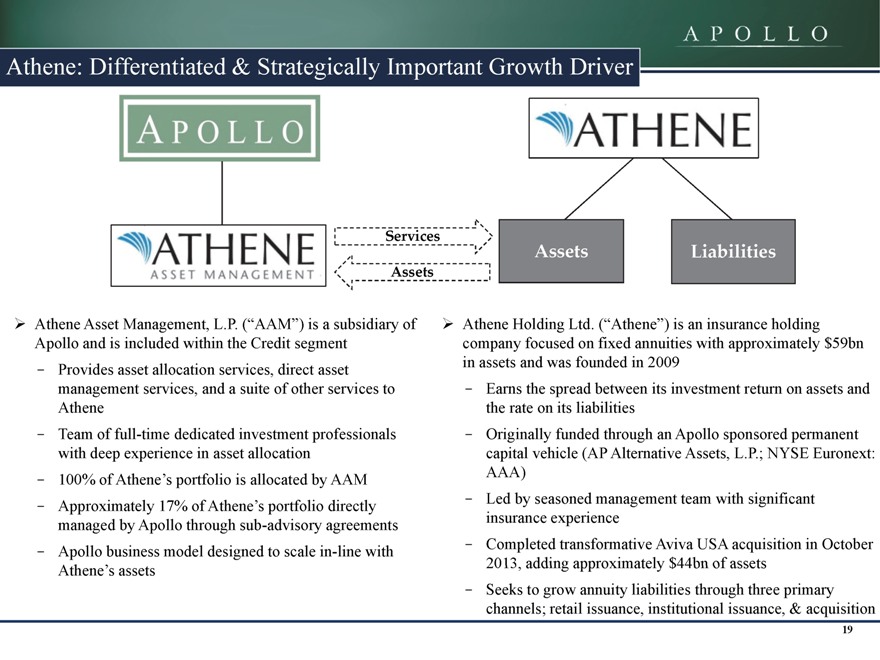
Athene: Differentiated & Strategically Important Growth Driver
Services
Assets
Assets
Liabilities
Athene Asset Management, L.P. (“AAM”) is a subsidiary of Apollo and is included within the Credit segment
- Provides asset allocation services, direct asset management services, and a suite of other services to Athene
- Team of full-time dedicated investment professionals with deep experience in asset allocation
- 100% of Athene’s portfolio is allocated by AAM
- Approximately 17% of Athene’s portfolio directly managed by Apollo through sub-advisory agreements
- Apollo business model designed to scale in-line with Athene’s assets
Athene Holding Ltd. (“Athene”) is an insurance holding company focused on fixed annuities with approximately $59bn in assets and was founded in 2009
- Earns the spread between its investment return on assets and the rate on its liabilities
- Originally funded through an Apollo sponsored permanent capital vehicle (AP Alternative Assets, L.P.; NYSE Euronext: AAA)
- Led by seasoned management team with significant insurance experience
- Completed transformative Aviva USA acquisition in October 2013, adding approximately $44bn of assets
- Seeks to grow annuity liabilities through three primary channels; retail issuance, institutional issuance, & acquisition
19
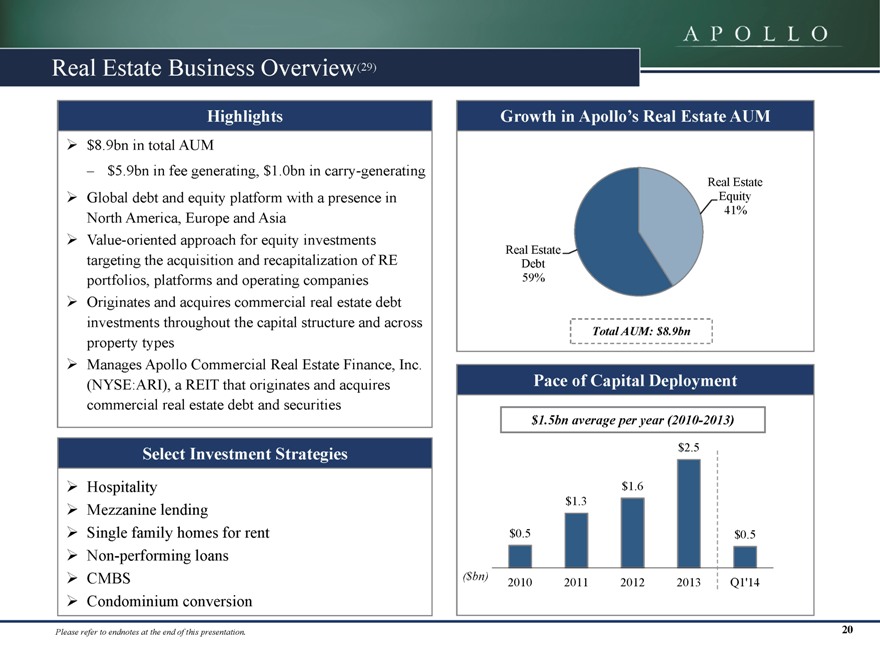
Real Estate Business Overview(29)
Highlights
$8.9bn in total AUM
– $5.9bn in fee generating, $1.0bn in carry-generating Global debt and equity platform with a presence in North America, Europe and Asia Value-oriented approach for equity investments targeting the acquisition and recapitalization of RE portfolios, platforms and operating companies Originates and acquires commercial real estate debt investments throughout the capital structure and across property types Manages Apollo Commercial Real Estate Finance, Inc.
(NYSE:ARI), a REIT that originates and acquires commercial real estate debt and securities
Select Investment Strategies
Hospitality Mezzanine lending
Single family homes for rent Non-performing loans CMBS
Condominium conversion
Growth in Apollo’s Real Estate AUM
Real Estate Equity 41%
Real Estate Debt 59%
Total AUM: $8.9bn
Pace of Capital Deployment
$1.5bn average per year (2010-2013)
$2.5
$1.6 $1.3
$0.5 $0.5
($bn)
2010 2011 2012 2013 Q1’14
20
Please refer to endnotes at the end of this presentation.
Agenda
1. Background & Business Model
2. Business Segments
3. Financial Overview
21
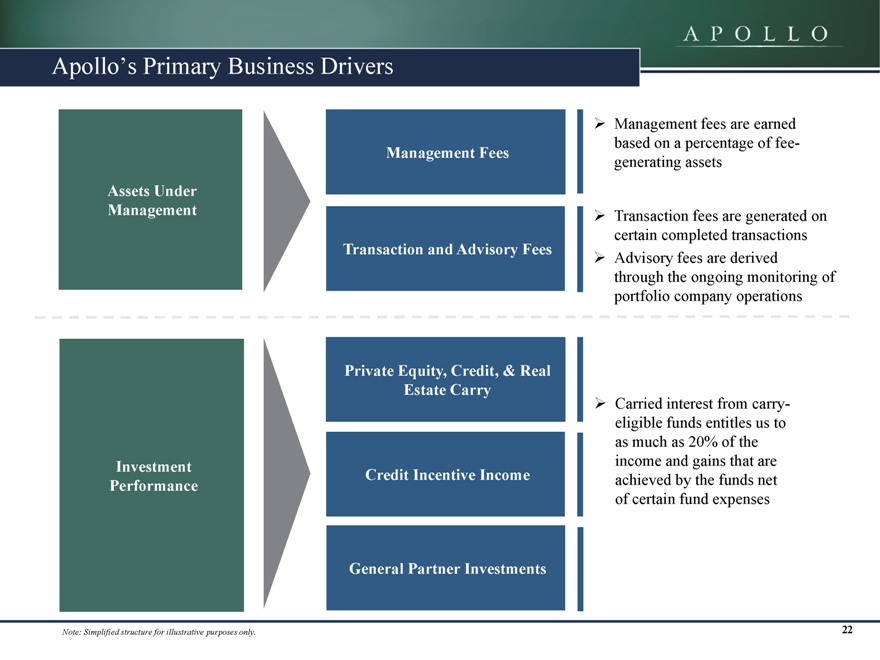
Apollo’s Primary Business Drivers
Assets Under Management
Management Fees
Transaction and Advisory Fees
Management fees are earned based on a percentage of fee-generating assets
Transaction fees are generated on certain completed transactions Advisory fees are derived through the ongoing monitoring of portfolio company operations
Investment Performance
Private Equity, Credit, & Real Estate Carry
Credit Incentive Income
General Partner Investments
Carried interest from carry-eligible funds entitles us to as much as 20% of the income and gains that are achieved by the funds net of certain fund expenses
Note: Simplified structure for illustrative purpose only
22
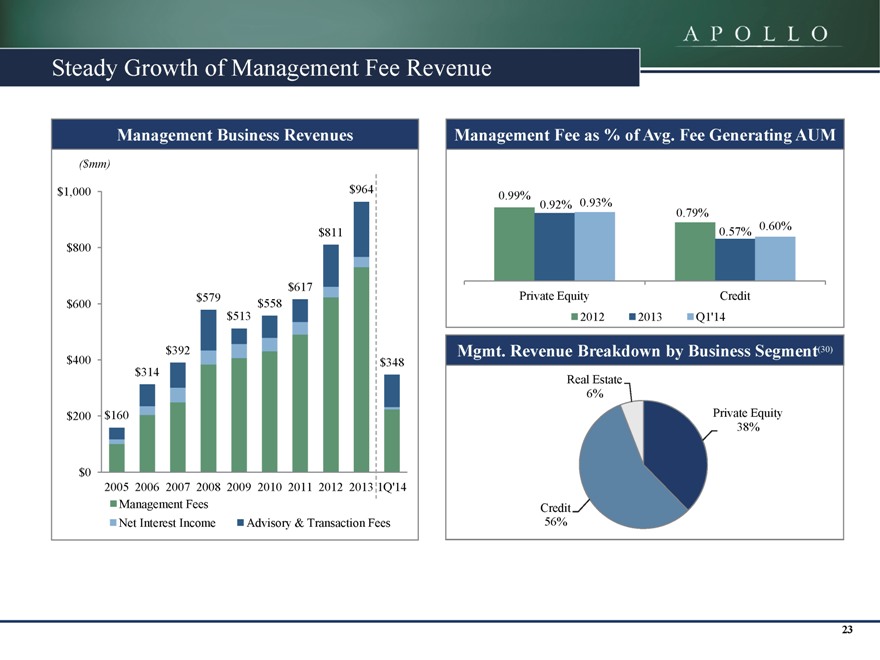
Steady Growth of Management Fee Revenue
Management Business Revenues
($mm)
$1,000 $964
$811 $800
$579 $617 $600 $558 $513
$392 $400 $348 $314
$200 $160
$0
2005 2006 2007 2008 2009 2010 2011 2012 2013 1Q’14 Management Fees Net Interest Income Advisory & Transaction Fees
Management Fee as % of Avg. Fee Generating AUM
0.99%
0.92% 0.93% 0.79%
0.60% 0.57%
Private Equity Credit 2012 2013 Q1’14
Mgmt. Revenue Breakdown by Business Segment(30)
Real Estate 6%
Private Equity 38%
Credit 56%
23
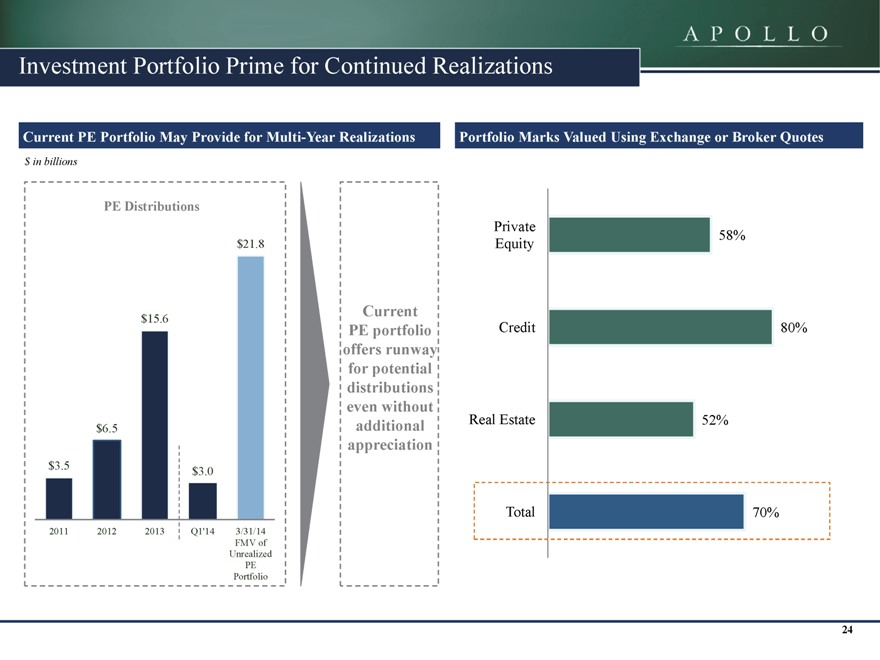
Investment Portfolio Prime for Continued Realizations
Current PE Portfolio May Provide for Multi-Year Realizations Portfolio Marks Valued Using Exchange or Broker Quotes
$ in billions
PE Distributions
$21.8
$15.6
$6.5
$3.5 $3.0
2011 2012 2013 Q1’14 3/31/14 FMV of Unrealized PE
Portfolio
Current PE portfolio offers runway for potential distributions even without additional appreciation
Private
58% Equity
Credit 80% Real Estate 52% Total 70%
24
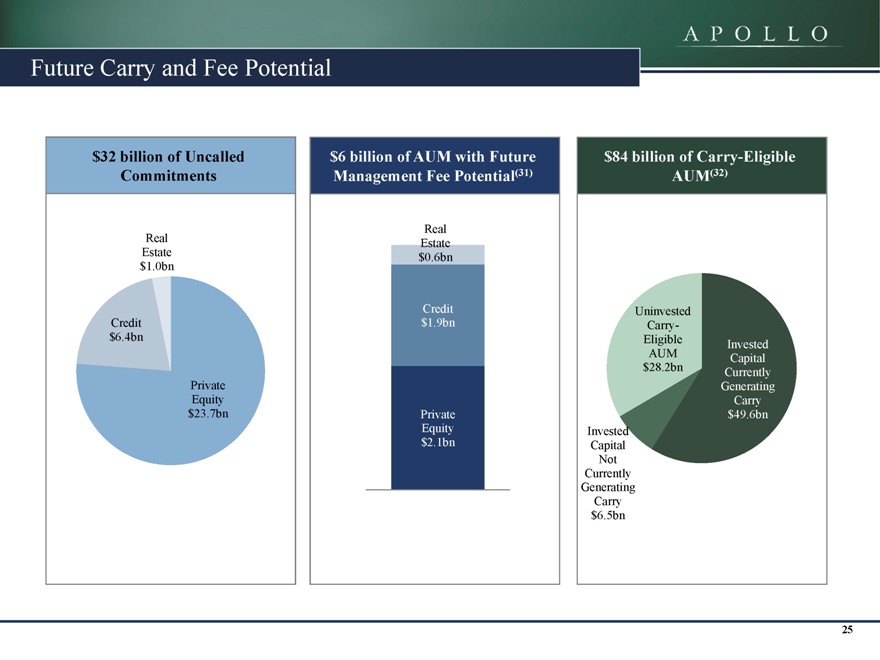
Future Carry and Fee Potential
$32 billion of Uncalled Commitments
Real Estate $1.0bn
Credit $6.4bn
Private Equity
$23.7bn
$6 billion of AUM with Future Management Fee Potential(31)
Real Estate $0.6bn
Credit $1.9bn
Private Equity $2.1bn
$84 billion of Carry-Eligible
AUM(32)
Uninvested Carry-
Eligible Invested AUM Capital
$28.2bn Currently Generating Carry
$49.6bn Invested Capital Not Currently Generating Carry $6.5bn
25
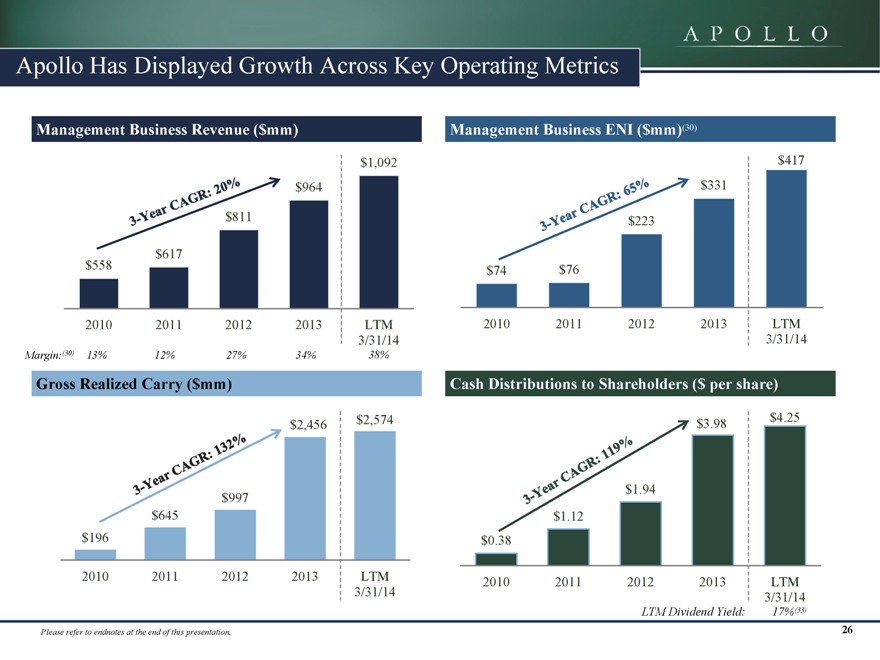
Apollo Has Displayed Growth Across Key Operating Metrics
Management Business Revenue ($mm) Management Business ENI ($mm)(30)
$1,092 $417
$964 $331
$811 $223
$617
$558 $74 $76
2010 2011 2012 2013 LTM 2010 2011 2012 2013 LTM
3/31/14 3/31/14
Margin:(30) 13% 12% 27% 34% 38%
Gross Realized Carry ($mm) Cash Distributions to Shareholders ($ per share)
$2,456 $2,574 $3.98 $4.25
$997 $1.94
$645 $1.12
$196 $0.38
2010 2011 2012 2013 LTM 2010 2011 2012 2013 LTM
3/31/14 3/31/14
LTM Dividend Yield: 17%(33)
Please refer to endnotes at the end of this presentation.
3-Year CAGR:20%
3-Year CAGR:65%
3-Year CAGR:132%
3-Year CAGR:119%
26
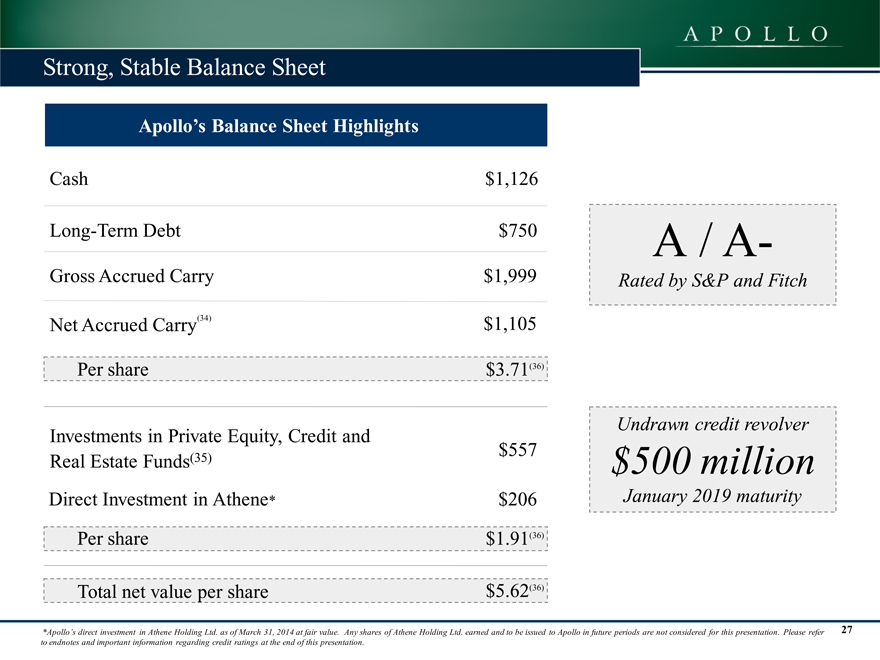
Strong, Stable Balance Sheet
Apollo’s Balance Sheet Highlights
Cash $1,126
Long-Term Debt $750
Gross Accrued Carry $1,999
Net Accrued Carry(34) $1,105
Per share $3.71(36)
Investments in Private Equity, Credit and
$557
Real Estate Funds(35)
Direct Investment in Athene* $206
Per share $1.91(36)
Total net value per share $5.62(36)
A / A-
Rated by S&P and Fitch
Undrawn credit revolver
$500 million
January 2019 maturity
*Apollo’s direct investment in Athene Holding Ltd. as of March 31, 2014 at fair value. Any shares of Athene Holding Ltd. earned and to be issued to Apollo in future periods are not considered for this presentation. Please refer to endnotes and important information regarding credit ratings at the end of this presentation.
Investor Relations Contacts
Gary Stein
Head of Corporate Communications gstein@apollolp.com 212-822-0467
Noah Gunn
Investor Relations Manager ngunn@apollolp.com 212-822-0540
28
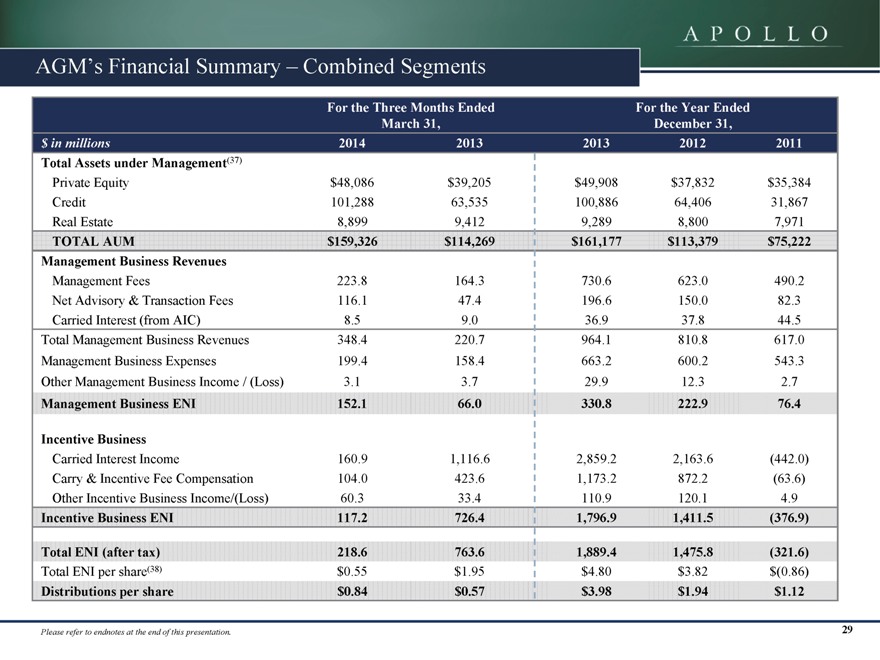
AGM’s Financial Summary – Combined Segments
For the Three Months Ended For the Year Ended
March 31, December 31,
$ in millions 2014 2013 2013 2012 2011
Total Assets under Management(37)
Private Equity $48,086 $39,205 $49,908 $37,832 $35,384
Credit 101,288 63,535 100,886 64,406 31,867
Real Estate 8,899 9,412 9,289 8,800 7,971
TOTAL AUM $159,326 $114,269 $161,177 $113,379 $75,222
Management Business Revenues
Management Fees 223.8 164.3 730.6 623.0 490.2
Net Advisory & Transaction Fees 116.1 47.4 196.6 150.0 82.3
Carried Interest (from AIC) 8.5 9.0 36.9 37.8 44.5
Total Management Business Revenues 348.4 220.7 964.1 810.8 617.0
Management Business Expenses 199.4 158.4 663.2 600.2 543.3
Other Management Business Income / (Loss) 3.1 3.7 29.9 12.3 2.7
Management Business ENI 152.1 66.0 330.8 222.9 76.4
Incentive Business
Carried Interest Income 160.9 1,116.6 2,859.2 2,163.6 (442.0)
Carry & Incentive Fee Compensation 104.0 423.6 1,173.2 872.2 (63.6)
Other Incentive Business Income/(Loss) 60.3 33.4 110.9 120.1 4.9
Incentive Business ENI 117.2 726.4 1,796.9 1,411.5 (376.9)
Total ENI (after tax) 218.6 763.6 1,889.4 1,475.8 (321.6)
Total ENI per share(38) $0.55 $1.95 $4.80 $3.82 $(0.86)
Distributions per share $0.84 $0.57 $3.98 $1.94 $1.12
Please refer to endnotes at the end of this presentation. 29
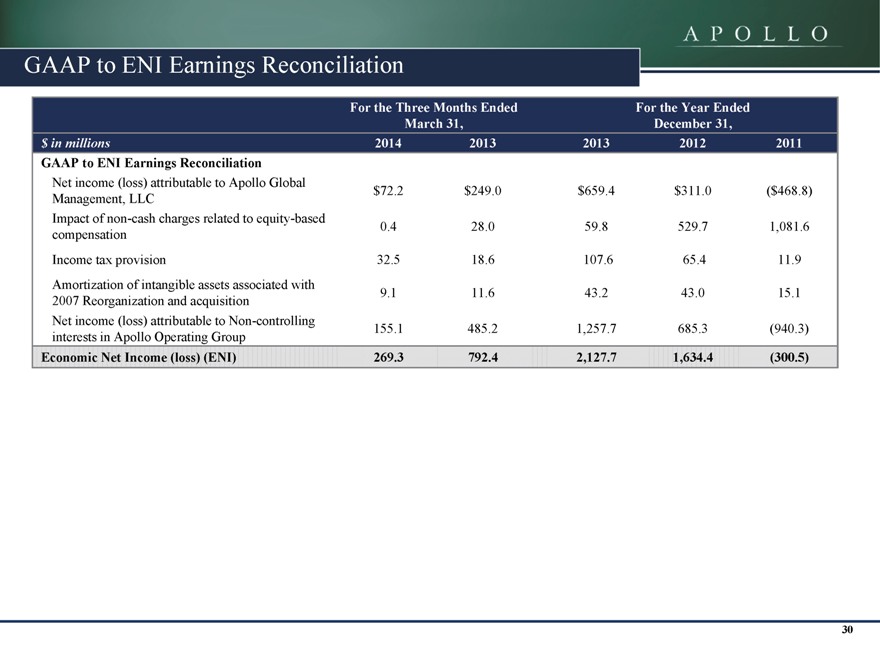
GAAP to ENI Earnings Reconciliation
For the Three Months Ended For the Year Ended
March 31, December 31,
$ in millions 2014 2013 2013 2012 2011
GAAP to ENI Earnings Reconciliation
Net income (loss) attributable to Apollo Global $72.2 $249.0 $659.4 $311.0 ($468.8)
Management, LLC
Impact of non-cash charges related to equity-based 0.4 28.0 59.8 529.7 1,081.6
compensation
Income tax provision 32.5 18.6 107.6 65.4 11.9
Amortization of intangible assets associated with 9.1 11.6 43.2 43.0 15.1
2007 Reorganization and acquisition
Net income (loss) attributable to Non-controlling 155.1 485.2 1,257.7 685.3 (940.3)
interests in Apollo Operating Group
Economic Net Income (loss) (ENI) 269.3 792.4 2,127.7 1,634.4 (300.5)
30
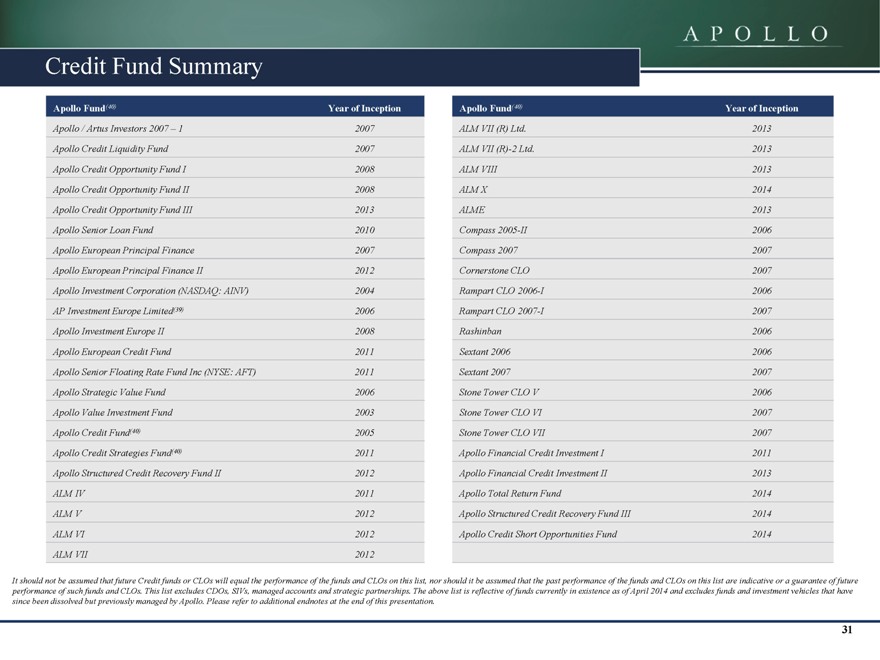
Credit Fund Summary
Apollo Fund(40) Year of Inception
Apollo / Artus Investors 2007 – 1 2007
Apollo Credit Liquidity Fund 2007
Apollo Credit Opportunity Fund I 2008
Apollo Credit Opportunity Fund II 2008
Apollo Credit Opportunity Fund III 2013
Apollo Senior Loan Fund 2010
Apollo European Principal Finance 2007
Apollo European Principal Finance II 2012
Apollo Investment Corporation (NASDAQ: AINV) 2004
AP Investment Europe Limited(39) 2006
Apollo Investment Europe II 2008
Apollo European Credit Fund 2011
Apollo Senior Floating Rate Fund Inc (NYSE: AFT) 2011
Apollo Strategic Value Fund 2006
Apollo Value Investment Fund 2003
Apollo Credit Fund(40) 2005
Apollo Credit Strategies Fund(40) 2011
Apollo Structured Credit Recovery Fund II 2012
ALM IV 2011
ALM V 2012
ALM VI 2012
ALM VII 2012
Apollo Fund(40) Year of Inception
ALM VII (R) Ltd. 2013
ALM VII (R)-2 Ltd. 2013
ALM VIII 2013
ALM X 2014
ALME 2013
Compass 2005-II 2006
Compass 2007 2007
Cornerstone CLO 2007
Rampart CLO 2006-I 2006
Rampart CLO 2007-I 2007
Rashinban 2006
Sextant 2006 2006
Sextant 2007 2007
Stone Tower CLO V 2006
Stone Tower CLO VI 2007
Stone Tower CLO VII 2007
Apollo Financial Credit Investment I 2011
Apollo Financial Credit Investment II 2013
Apollo Total Return Fund 2014
Apollo Structured Credit Recovery Fund III 2014
Apollo Credit Short Opportunities Fund 2014
It should not be assumed that future Credit funds or CLOs will equal the performance of the funds and CLOs on this list, nor should it be assumed that the past performance of the funds and CLOs on this list are indicative or a guarantee of future performance of such funds and CLOs. This list excludes CDOs, SIVs, managed accounts and strategic partnerships. The above list is reflective of funds currently in existence as of April 2014 and excludes funds and investment vehicles that have since been dissolved but previously managed by Apollo. Please refer to additional endnotes at the end of this presentation.
31
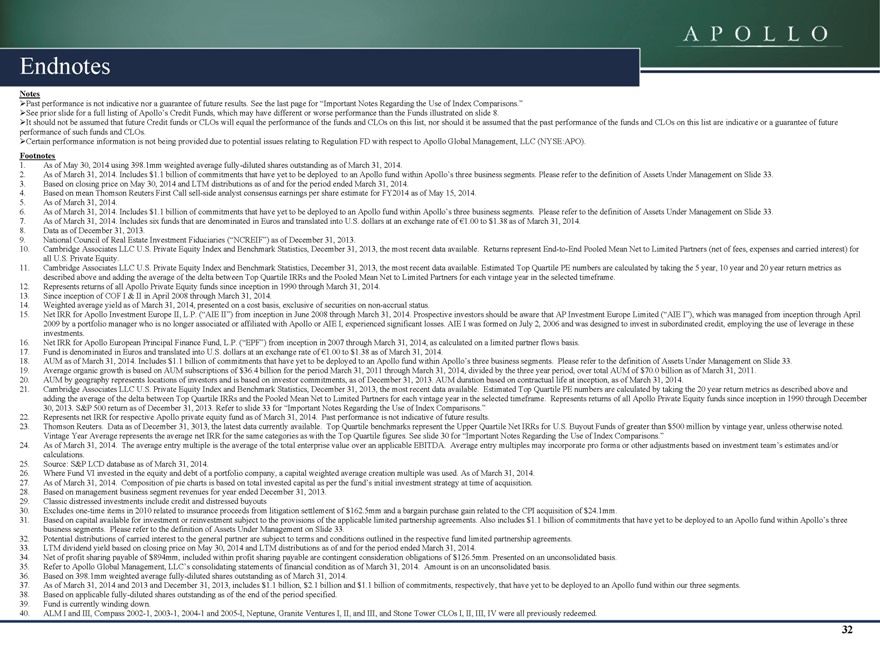
Endnotes
Notes
Past performance is not indicative nor a guarantee of future results. See the last page for “Important Notes Regarding the Use of Index Comparisons.”See prior slide for a full listing of Apollo’s Credit Funds, which may have different or worse performance than the Funds illustrated on slide 8.
It should not be assumed that future Credit funds or CLOs will equal the performance of the funds and CLOs on this list, nor should it be assumed that the past performance of the funds and CLOs on this list are indicative or a guarantee of future performance of such funds and CLOs.
Certain performance information is not being provided due to potential issues relating to Regulation FD with respect to Apollo Global Management, LLC (NYSE:APO).
Footnotes
1. As of May 30, 2014 using 398.1mm weighted average fully-diluted shares outstanding as of March 31, 2014.
2. As of March 31, 2014. Includes $1.1 billion of commitments that have yet to be deployed to an Apollo fund within Apollo’s three business segments. Please refer to the definition of Assets Under Management on Slide 33.
3. Based on closing price on May 30, 2014 and LTM distributions as of and for the period ended March 31, 2014.
4. Based on mean Thomson Reuters First Call sell-side analyst consensus earnings per share estimate for FY2014 as of May 15, 2014.
5. As of March 31, 2014.
6. As of March 31, 2014. Includes $1.1 billion of commitments that have yet to be deployed to an Apollo fund within Apollo’s three business segments. Please refer to the definition of Assets Under Management on Slide 33.
7. As of March 31, 2014. Includes six funds that are denominated in Euros and translated into U.S. dollars at an exchange rate of €1.00 to $1.38 as of March 31, 2014.
8. Data as of December 31, 2013.
9. National Council of Real Estate Investment Fiduciaries (“NCREIF”) as of December 31, 2013.
10. Cambridge Associates LLC U.S. Private Equity Index and Benchmark Statistics, December 31, 2013, the most recent data available. Returns represent End-to-End Pooled Mean Net to Limited Partners (net of fees, expenses and carried interest) for all U.S. Private Equity.
11. Cambridge Associates LLC U.S. Private Equity Index and Benchmark Statistics, December 31, 2013, the most recent data available. Estimated Top Quartile PE numbers are calculated by taking the 5 year, 10 year and 20 year return metrics as described above and adding the average of the delta between Top Quartile IRRs and the Pooled Mean Net to Limited Partners for each vintage year in the selected timeframe.
12. Represents returns of all Apollo Private Equity funds since inception in 1990 through March 31, 2014. 13. Since inception of COF I & II in April 2008 through March 31, 2014.
14. Weighted average yield as of March 31, 2014, presented on a cost basis, exclusive of securities on non-accrual status.
15. Net IRR for Apollo Investment Europe II, L.P. (“AIE II”) from inception in June 2008 through March 31, 2014. Prospective investors should be aware that AP Investment Europe Limited (“AIE I”), which was managed from inception through April 2009 by a portfolio manager who is no longer associated or affiliated with Apollo or AIE I, experienced significant losses. AIE I was formed on July 2, 2006 and was designed to invest in subordinated credit, employing the use of leverage in these investments.
16. Net IRR for Apollo European Principal Finance Fund, L.P. (“EPF”) from inception in 2007 through March 31, 2014, as calculated on a limited partner flows basis. 17. Fund is denominated in Euros and translated into U.S. dollars at an exchange rate of €1.00 to $1.38 as of March 31, 2014.
18. AUM as of March 31, 2014. Includes $1.1 billion of commitments that have yet to be deployed to an Apollo fund within Apollo’s three business segments. Please refer to the definition of Assets Under Management on Slide 33. 19. Average organic growth is based on AUM subscriptions of $36.4 billion for the period March 31, 2011 through March 31, 2014, divided by the three year period, over total AUM of $70.0 billion as of March 31, 2011.
20. AUM by geography represents locations of investors and is based on investor commitments, as of December 31, 2013. AUM duration based on contractual life at inception, as of March 31, 2014.
21. Cambridge Associates LLC U.S. Private Equity Index and Benchmark Statistics, December 31, 2013, the most recent data available. Estimated Top Quartile PE numbers are calculated by taking the 20 year return metrics as described above and adding the average of the delta between Top Quartile IRRs and the Pooled Mean Net to Limited Partners for each vintage year in the selected timeframe. Represents returns of all Apollo Private Equity funds since inception in 1990 through December 30, 2013. S&P 500 return as of December 31, 2013. Refer to slide 33 for “Important Notes Regarding the Use of Index Comparisons.” 22. Represents net IRR for respective Apollo private equity fund as of March 31, 2014. Past performance is not indicative of future results.
23. Thomson Reuters. Data as of December 31, 3013, the latest data currently available. Top Quartile benchmarks represent the Upper Quartile Net IRRs for U.S. Buyout Funds of greater than $500 million by vintage year, unless otherwise noted. Vintage Year Average represents the average net IRR for the same categories as with the Top Quartile figures. See slide 30 for “Important Notes Regarding the Use of Index Comparisons.” 24. As of March 31, 2014. The average entry multiple is the average of the total enterprise value over an applicable EBITDA. Average entry multiples may incorporate pro forma or other adjustments based on investment team’s estimates and/or calculations.
25. | | Source: S&P LCD database as of March 31, 2014. |
26. Where Fund VI invested in the equity and debt of a portfolio company, a capital weighted average creation multiple was used. As of March 31, 2014. 27. As of March 31, 2014. Composition of pie charts is based on total invested capital as per the fund’s initial investment strategy at time of acquisition. 28. Based on management business segment revenues for year ended December 31, 2013.
29. | | Classic distressed investments include credit and distressed buyouts |
30. Excludes one-time items in 2010 related to insurance proceeds from litigation settlement of $162.5mm and a bargain purchase gain related to the CPI acquisition of $24.1mm.
31. Based on capital available for investment or reinvestment subject to the provisions of the applicable limited partnership agreements. Also includes $1.1 billion of commitments that have yet to be deployed to an Apollo fund within Apollo’s three business segments. Please refer to the definition of Assets Under Management on Slide 33.
32. Potential distributions of carried interest to the general partner are subject to terms and conditions outlined in the respective fund limited partnership agreements. 33. LTM dividend yield based on closing price on May 30, 2014 and LTM distributions as of and for the period ended March 31, 2014.
34. Net of profit sharing payable of $894mm, included within profit sharing payable are contingent consideration obligations of $126.5mm. Presented on an unconsolidated basis. 35. Refer to Apollo Global Management, LLC’s consolidating statements of financial condition as of March 31, 2014. Amount is on an unconsolidated basis.
36. | | Based on 398.1mm weighted average fully-diluted shares outstanding as of March 31, 2014. |
37. As of March 31, 2014 and 2013 and December 31, 2013, includes $1.1 billion, $2.1 billion and $1.1 billion of commitments, respectively, that have yet to be deployed to an Apollo fund within our three segments. 38. Based on applicable fully-diluted shares outstanding as of the end of the period specified.
39. | | Fund is currently winding down. |
40. ALM I and III, Compass 2002-1, 2003-1, 2004-1 and 2005-I, Neptune, Granite Ventures I, II, and III, and Stone Tower CLOs I, II, III, IV were all previously redeemed.
32
Definitions
Assets Under Management (“AUM”) Definition – refers to the investments we manage or with respect to which we have control, including capital we have the right to call from our investors pursuant to their capital commitments to various funds. Our AUM equals the sum of: (i) the fair value of our private equity investments plus the capital that we are entitled to call from our investors pursuant to the terms of their capital commitments; (ii) the net asset value of our credit funds, other than certain collateralized loan obligations and collateralized debt obligations, which have a fee generating basis other than the mark-to-market value of the underlying assets, plus used or available leverage and/or capital commitments; (iii) the gross asset values or net asset values of our real estate entities and the structured portfolio company investments included within the funds we manage, which includes the leverage used by such structured portfolio companies; (iv) the incremental value associated with the reinsurance investments of the portfolio company assets that we manage; and (v) the fair value of any other investments that we manage plus unused credit facilities, including capital commitments for investments that may require pre-qualification before investment plus any other capital commitments available for investment that are not otherwise included in the clauses above. Our AUM measure includes Assets Under Management for which we charge either no or nominal fees. Our definition of AUM is not based on any definition of Assets Under Management contained in our operating agreement or in any of our Apollo fund management agreements. We consider multiple factors for determining what should be included in our definition of AUM. Such factors include but are not limited to (1) our ability to influence the investment decisions for existing and available assets; (2) our ability to generate income from the underlying assets in our funds; and (3) the AUM measures that we use internally or believe are used by other investment managers. Given the differences in the investment strategies and structures among other alternative investment managers, our calculation of AUM may differ from the calculations employed by other investment managers and, as a result, this measure may not be directly comparable to similar measures presented by other investment managers.
Important Notes Regarding the Use of Index Comparisons
Index performance and yield data are shown for illustrative purposes only and have limitations when used for comparison or for other purposes due to, among other matters, volatility, credit or other factors (such as number and types of securities). It may not be possible to directly invest in one or more of these indices and the holdings of any fund managed by Apollo may differ markedly from the holdings of any such index in terms of levels of diversification, types of securities or assets represented and other significant factors. Indices are unmanaged, do not charge any fees or expenses, assume reinvestment of income and do not employ special investment techniques such as leveraging or short selling. No such index is indicative of the future results of any fund managed by Apollo.
Credit Rating Disclaimer
Apollo, its affiliates, and third parties that provide information to Apollo, such as rating agencies, do not guarantee the accuracy, completeness, timeliness or availability of any information, including ratings, and are not responsible for any errors or omissions (negligent or otherwise), regardless of the cause, or the results obtained from the use of such content. Apollo, its affiliates and third party content providers give no express or implied warranties, including, but not limited to, any warranties of merchantability or fitness for a particular purpose or use, and they expressly disclaim any responsibility or liability for direct, indirect, incidental, exemplary, compensatory, punitive, special or consequential damages, costs expenses, legal fees or losses (including lost income or profits and opportunity costs) in connection with the use of the information herein. Credit ratings are statements of opinions and not statements of facts or recommendations to purchase, hold or sell securities. They do not address the suitability of securities for investment purposes and should not be relied on as investment advice.
Neither Apollo nor any of its respective affiliates have any responsibility to update any of the information provided in this summary document.
33