United States
Securities and Exchange Commission
Washington, D.C. 20549
Form N-CSR
Certified Shareholder Report of Registered Management Investment Companies
811-22217
(Investment Company Act File Number)
Federated Core Trust III
_______________________________________________________________
(Exact Name of Registrant as Specified in Charter)
Federated Investors Funds
4000 Ericsson Drive
Warrendale, Pennsylvania 15086-7561
(Address of Principal Executive Offices)
(412) 288-1900
(Registrant's Telephone Number)
John W. McGonigle, Esquire
Federated Investors Tower
1001 Liberty Avenue
Pittsburgh, Pennsylvania 15222-3779
(Name and Address of Agent for Service)
(Notices should be sent to the Agent for Service)
Date of Fiscal Year End: 03/31/15
Date of Reporting Period: 03/31/15
Item 1. Reports to Stockholders

Annual Shareholder Report
March 31, 2015
Federated Project and Trade Finance Core Fund
A Portfolio of Federated Core Trust III
Not FDIC Insured • May Lose Value • No Bank Guarantee
CONTENTS
| 1 |
| 4 |
| 5 |
| 11 |
| 12 |
| 13 |
| 14 |
| 15 |
| 16 |
| 23 |
| 24 |
| 25 |
| 28 |
| 30 |
| 30 |
Management's Discussion of Fund Performance (unaudited)
The total return of Federated Project and Trade Finance Core Fund (the “Fund”),1 based on net asset value for the 12-month reporting period ended March 31, 2015, was 1.04% compared to a return of 0.16% for the One-Month London InterBank Offered Rate (LIBOR),2 the Fund's broad-based securities market index. The Fund's total return for the most recently completed fiscal year reflected actual cash flows, transaction costs and other expenses which were not reflected in the total return of the LIBOR.
During the reporting period, the most significant factors affecting the Fund's performance relative to the LIBOR were: (1) the selection of individual securities within each sector and sector diversification; (2) the relatively high spreads in the market; and (3) the negative price movement in three specific positions.
Market Overview
Generally speaking, 2014 was a year shaped by unusually high instances of headline/geopolitical risk. However, this resulted in relatively muted volatility; that was, of course, until the fourth quarter. In this final reporting period for the year, markets were everything but calm, and volatility was anything but low. The culprit responsible for the instability was oil. Declining oil prices were the single largest destabilizing force in the closing months of 2014. Even the impact of augmented stimulus by both the European Central Bank and Bank of Japan paled in comparison to the rapid decline of benchmark oil prices. Clearly, the hardest hits were to oil producing economies, but ramifications were widespread and reverberated through practically every asset class. This market volatility did not bypass trade finance.
SECURITY SELECTION AND SECTOR DIVERSIFICATION
The Fund was invested in a portfolio of trade finance-related assets that was widely diversified over sectors and geographic regions. Regionally, the portfolio, as of the end of the reporting period, was invested 19.9% in Asia, 17.6% in Eastern Europe, 34.4% in Middle East/Africa, 18.0% in Latin America, 4.3% in Western Europe and held a 5.80% cash position. The countries represented in those regions include: Angola, Argentina, Armenia, Australia, Azerbaijan, Bangladesh, Belgium, Botswana, Brazil, Burundi, Chad, Chile, Colombia, Egypt, Gabon, Ghana, Greece, Guinea-Bissau, Hong Kong, India, Indonesia, Jamaica, Jordan, Kazakhstan, Kenya, Lebanon, Macedonia, Mauritius, Mexico, Mongolia, Morocco, Nigeria, Panama, Philippines, Russia, Saudi Arabia, Sierra Leone, Singapore, South Africa, Swaziland, Sweden, Tanzania, Turkey, Ukraine, United Arab Emirates, United Kingdom and Uruguay. The sector diversification of the Fund at the end of the reporting period was as follows: 0.6% Automotive, 14.0% Basic Industry, 6.3% Capital Goods, 1.9% Consumer Cyclical, 11.1% Consumer Non-Cyclical, 26.0% Energy, 16.8% Banking, 0.8% Foreign Sovereign, 2.1% Services, 5.3% Telecommunications, 2.6% Utilities, 4.8% Supranational, 1.9% Asset-Backed and 5.8% in cash. The Fund's broad diversification on both a regional and sector basis made a positive contribution to Fund performance on an absolute basis and relative to the LIBOR.
MARKET SPREADS
According to the World Trade Organization and research from HSBC, global trade is expected to grow by 3-5% in 2015. Each trade finance transaction is unique and finances a specific asset conversion cycle, not the borrower's general operations, and ranks senior in the capital structure. Considering the commodity and geopolitical-driven events of 2014, the asset class held up well when compared to other short-duration floating-rate instruments, especially when adjusted for volatility.
NEGATIVE PRICE MOVEMENT
Three positions were marked down late in December. The first was exposure to two Brazilian drilling companies. The portfolio was positioned in the Operating Company (Opco) as opposed to the Holding Company (Holdco) level of the companies. Therefore, our positions benefited from pledged offtake contracts and first liens over fixed and floating assets. For context, one drilling company's Holdco debt traded from $100.63 to $59.50 during the quarter, while the Opco debt traded from $103.35 to $94.40 illustrating the benefit of lending in a trade finance structure even in times of extreme volatility.
The second is an integrated steel company that became over-leveraged. The borrower is one of the largest employers in the country of domicile and over 80% of its debt is in local currency borrowed from local banks. Our position is in dollar-denominated loans secured by the sale of steel. Local banks are willing to swap their debt for controlling equity of the borrower.
The third example is an iron ore exporter that is 25% owned by a foreign investor. It is one of the largest employers and exporters in its country of domicile and its region. There is a dispute between the investor and the current majority ownership regarding a dividend payment. As a result, the investor has frozen the cash needed to service our trade finance deal. The investor has offered to inject $600 million into the borrower in exchange for an additional 70% equity stake.
Annual Shareholder Report
Although it is difficult to speculate on the timing and ultimate resolution of any of the above situations, as direct co-investors, portfolio management was actively involved with the borrower and other lenders in determining the eventual outcome.
| 1 | Federated Project and Trade Finance Core Fund is NOT a mutual fund. The Fund operates as an open-end extended payment fund. Shareholders of the Fund will have a restricted ability to redeem shares of the Fund (“Shares”). When a redeeming shareholder presents Shares to the transfer agent in proper order for redemption, the Fund has up to thirty-one (31) days to make payment to the redeeming shareholder. The price of the redeemed Shares will be determined as of the closing net asset value (NAV) of the Fund twenty-four (24) days after receipt of a shareholder redemption request or if such date is a weekend or holiday, on the preceding business day (the “Redemption Pricing Date”). Under normal circumstances, the Fund will make payment to the redeeming shareholder one business day after the Redemption Pricing Date (the “Redemption Payment Date”). However, the Fund reserves the right to make payment up to seven (7) days after the Redemption Pricing Date, provided such date does not exceed thirty-one (31) days after the Shares have been presented for redemption in proper order. Shareholders that redeem Shares will incur the risk that the value of their Shares presented for redemption will be worth less on the Redemption Pricing Date than on the date they submitted their redemption request. |
| 2 | Please see the footnotes to the line graphs under “Fund Performance and Growth of a $10,000 Investment” below for the definition of, and more information about, the LIBOR. |
Annual Shareholder Report
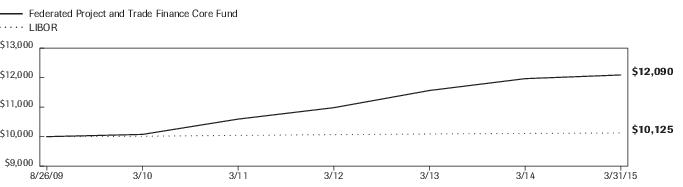
FUND PERFORMANCE AND GROWTH OF A $10,000 INVESTMENT
The graph below illustrates the hypothetical investment of $10,0001 in the Federated Project and Trade Finance Core Fund from August 26, 2009 (start of performance) to March 31, 2015, compared to the One-Month London Interbank Offered Rate (LIBOR).2 The Average Annual Total Return table below shows returns averaged over the stated periods.
Growth of a $10,000 Investment
Growth of $10,000 as of March 31, 2015
| Federated Project and Trade Finance Core Fund | | NA | LIBOR |
| F | NA | I |
| 8/26/2009 | 10,000 | | 10,000 |
| 3/31/2010 | 10,076 | | 10,014 |
| 3/31/2011 | 10,595 | | 10,043 |
| 3/31/2012 | 10,982 | | 10,067 |
| 3/31/2013 | 11,564 | | 10,091 |
| 3/31/2014 | 11,965 | | 10,109 |
| 3/31/2015 | 12,090 | | 10,125 |
41 graphic description end -->
Average Annual Total Returns for the Period Ended 3/31/2015
| | 1 Year | 5 Years | Start of
Performance* |
| Fund | 1.04% | 3.71% | 3.45% |
| LIBOR | 0.16% | 0.22% | 0.22% |
| * | The Fund's start of performance date was August 26, 2009. |
Performance data quoted represents past performance which is no guarantee of future results. Investment return and principal value will fluctuate so that an investor's shares, when redeemed, may be worth more or less than their original cost. Fund performance changes over time and current performance may be lower or higher than what is stated. For current to the most recent month-end performance and after-tax returns, current shareholders may call 1-800-341-7400. Returns shown do not reflect the deduction of taxes that a shareholder would pay on Fund distributions or the redemption of Fund shares.
| 1 | The Fund's performance assumes the reinvestment of all dividends and distributions. |
| 2 | The London Interbank Offered Rate (LIBOR) is a daily reference rate based on the interest rates at which banks borrow unsecured funds from other banks in the London wholesale money market (or interbank market). |
Annual Shareholder Report
Portfolio of Investments Summary Table (unaudited)
At March 31, 2015, the Fund's portfolio composition1 was as follows:
| Security Type | Percentage of
Total Net Assets |
| Trade Finance Agreements | 84.2% |
| Corporate Debt Securities | 5.5% |
| Foreign Government Securities | 2.7% |
| Asset-Backed Securities | 0.1% |
| Derivative Contracts2,3 | (0.0)% |
| Cash Equivalents4 | 5.7% |
| Other Assets and Liabilities—Net5 | 1.8% |
| TOTAL | 100.0% |
| 1 | See the Fund's Confidential Private Offering Memorandum and Part B: Information Required in a Statement of Additional Information for a description of these security types. |
| 2 | Based upon net unrealized appreciation (depreciation) or value of the derivative contracts as applicable. Derivative Contracts may consist of futures, forwards, options and swaps. The impact of a derivative contract on the Fund's performance may be larger than its unrealized appreciation (depreciation) or value may indicate. In many cases, the notional value or amount of a derivative contract may provide a better indication of the contract's significance to the portfolio. More complete information regarding the Fund's direct investments in derivative contracts, including unrealized appreciation (depreciation), value and notional values or amounts of such contracts, can be found in the table at the end of the Portfolio of Investments included in this Report. |
| 3 | Represents less than 0.1%. |
| 4 | Cash Equivalents include any investments in money market mutual funds and/or overnight repurchase agreements. |
| 5 | Assets, other than investments in securities and derivative contracts, less liabilities. See Statement of Assets and Liabilities. |
Annual Shareholder Report
Portfolio of Investments
March 31, 2015
Principal
Amount
or Shares | | | Value |
| | | ASSET-BACKED SECURITY—0.1%1 | |
| | | Finance—0.1% | |
| $544,215 | | Sealane 2011-1X, Class A, 2.2581%, 2/12/2016
(IDENTIFIED COST $544,928) | $566,528 |
| | | CORPORATE BONDS—5.5%1 | |
| | | Banking—1.9% | |
| 5,000,000 | | African Export-Import Bank, 3.875%, 6/4/2018 | 4,961,800 |
| 5,000,000 | | GTB Finance BV, Series 144A, 6.00%, 11/8/2018 | 4,638,500 |
| | | TOTAL | 9,600,300 |
| | | Oil & Gas—2.4% | |
| 4,500,000 | 2,3 | Afren PLC, Series REGS, 11.50%, 2/1/2016 | 2,155,500 |
| 4,114,080 | | Dolphin Energy Ltd., Series REGS, 5.888%, 6/15/2019 | 4,504,918 |
| 2,745,500 | | Odebrecht Drill VIII/IX, Series REGS, 6.35%, 6/30/2021 | 2,381,721 |
| 3,726,918 | | QGOG Atlantic & Alaskan Rigs Ltd., Series REGS, 5.25%, 7/30/2018 | 3,246,146 |
| | | TOTAL | 12,288,285 |
| | | Telecommunications & Cellular—1.2% | |
| 5,700,000 | | America Movil S.A.B. de C.V., Floating Rate Note—Sr. Note, 1.2677%, 9/12/2016 | 5,724,293 |
| | | TOTAL CORPORATE BONDS
(IDENTIFIED COST $31,579,476) | 27,612,878 |
| | | TRADE FINANCE AGREEMENTS—84.2%1 | |
| | | Automotive—0.5% | |
| 2,080,933 | | Volvo Chile, 2.6765%, 4/19/2016 | 1,990,413 |
| 846,978 | | Volvo Do Brazil, 2.4265%, 12/7/2015 | 835,459 |
| | | TOTAL | 2,825,872 |
| | | Banking—4.6% | |
| 5,000,000 | | Caixa Economica Federal, 0.45%, 10/16/2015 | 4,976,000 |
| 2,923,077 | | Itau Unibanco Holding SA, 0.7531%, 6/15/2015 | 2,921,615 |
| 6,000,000 | | State Bank India/London, 0.76855%, 12/10/2015 | 6,000,000 |
| 5,000,000 | | Turkiye Is Bankasi (Isbank), 0.000%, 5/29/2015 | 4,957,500 |
| 4,375,000 | | Zenith Bank Ltd., 3.5136%, 12/5/2016 | 4,348,750 |
| | | TOTAL | 23,203,865 |
| | | Basic Industry - Cement—0.2% | |
| 833,333 | | Jambyl Cement, 1.1765%, 7/15/2015 | 823,750 |
| | | Basic Industry - Fertilizers/Chemicals—1.0% | |
| 5,000,000 | | Eurochem II, 2.0626%, 8/22/2018 | 4,952,500 |
| | | Basic Industry - Metals/Mining Excluding Steel—10.1% | |
| 1,711,592 | | African Minerals, 5.8235%, 10/13/2016 | 1,114,246 |
| 3,226,649 | | Discovery Copper, 4.1115%, 3/31/2016 | 2,197,348 |
| 5,635,860 | | EMP II, 6.174%, 12/23/2018 | 5,618,953 |
| 5,292,664 | | Erdenet, 7.139%, 12/31/2015 | 3,974,791 |
| 2,250,000 | | Fortescue Metals Group Ltd., 4.7619%, 8/28/2015 | 2,247,750 |
| 14,375,000 | | FQM Ltd., 3.0067%, 5/1/2019 | 14,209,688 |
| 8,000,000 | | Kazakhmys II, 3.152%, 12/31/2018 | 7,956,000 |
| 4,604,098 | | Mechel Kuzbass III, 5.2646%, 12/8/2016 | 1,611,434 |
| 4,603,603 | | Mechel Yakutugol III, 5.2646%, 12/8/2016 | 1,611,261 |
| 4,975,650 | | Noble Group Ltd., 3.677%, 1/17/2018 | 4,930,869 |
| 3,000,000 | | Russian Copper, 4.173%, 12/4/2018 | 2,956,500 |
| 2,100,000 | | Solway, 6.175%, 5/30/2016 | 2,101,050 |
Annual Shareholder Report
Principal
Amount
or Shares | | | Value |
| | | TRADE FINANCE AGREEMENTS—continued1 | |
| | | Basic Industry - Metals/Mining Excluding Steel—continued | |
| $800,000 | | Tenex, 2.5146%, 3/28/2016 | $782,800 |
| | | TOTAL | 51,312,690 |
| | | Basic Industry - Steel Producers/Products—1.6% | |
| 4,955,357 | | Ferrexpo PLC, Series 144A, 2.425%, 8/31/2018 | 4,942,969 |
| 625,000 | | Metinvest15, 4.9228%, 5/25/2015 | 375,000 |
| 847,509 | | Stemcor Holdings Ltd., USD, 2.8788%, 12/31/2015 | 847,509 |
| 398,923 | | Stemcor Holdings Ltd., GBP, 2.8788%, 12/31/2015 | 591,763 |
| 250,841 | | Stemcor Holdings Ltd., EUR, 2.8788%, 12/31/2015 | 269,717 |
| 20,827 | | Stemcor Holdings Ltd., Super Senior Uplift, 3.0242%, 12/31/2015 | 20,827 |
| 2,285,284 | | Stemcor Holdings Ltd., Senior Uplift, 3.0242%, 12/31/2015 | 1,143,784 |
| | | TOTAL | 8,191,569 |
| | | Building & Development—1.1% | |
| 5,486,335 | | Cemex SA, 9.00%, 2/28/2017 | 5,404,040 |
| | | Capital Goods—3.5% | |
| 4,800,000 | | Biman, 5.7551%, 2/4/2019 | 4,814,400 |
| 7,500,000 | | Dogus Otomotiv Servis ve Ticaret AS, 3.2562%, 8/17/2015 | 7,503,750 |
| 4,375,000 | | TAAG Angola Airlines, 5.50%, 6/9/2020 | 4,379,375 |
| 1,000,000 | | TAAG II, Floating Rate Note, 6.0231%, 6/27/2016 | 999,000 |
| | | TOTAL | 17,696,525 |
| | | Capital Goods - Aerospace & Defense—1.2% | |
| 4,547,739 | | Air India, 3.21335%, 7/14/2015 | 4,509,083 |
| 1,500,000 | | TAAG ANG III, 4.0206%, 3/31/2016 | 1,500,750 |
| | | TOTAL | 6,009,833 |
| | | Consumer Cyclical—1.0% | |
| 5,000,000 | | PT Delta Dunia, 6.01185%, 3/3/2020 | 4,997,500 |
| | | Consumer Non-Cyclical—5.9% | |
| 4,000,000 | | Bahia Cellulose, 4.1267%, 2/14/2018 | 4,024,000 |
| 3,211,388 | 2,3 | Banacol, 11.50%, 6/15/2015 | 3,041,184 |
| 5,357,143 | | COCOBOD, 0.7709%, 8/28/2015 | 5,333,036 |
| 648,683 | | Export Trade Group, 3.150%, 12/31/2015 | 648,683 |
| 1,200,286 | 2,3 | GVO, 5.173%, 11/2/2015 | 1,143,871 |
| 4,603,446 | | Jamaica Broilers, 0.000%, 5/27/2015 | 4,580,429 |
| 1,142,857 | | JBS S.A., 5.675%, 11/9/2015 | 1,137,143 |
| 4,683,760 | | PT Delta Merlin, 5.5046%, 10/30/2016 | 4,613,504 |
| 4,090,909 | | Tiryaki Agro, 4.322%, 4/15/2019 | 3,867,954 |
| 40,374 | | Ukrland Farming, 8.678%, 6/29/2015 | 39,829 |
| 1,350,000 | | Vicentin, 7.3203%, 11/18/2015 | 1,335,825 |
| | | TOTAL | 29,765,458 |
| | | Consumer Non-Cyclical/Food-Wholesale—6.2% | |
| 1,500,000 | | Belagricola, 5.2754%, 6/28/2016 | 1,488,750 |
| 5,000,000 | | Biosev, 4.72615%, 6/19/2015 | 4,977,500 |
| 3,315,789 | | CPC International, Inc., 3.0199%, 12/1/2016 | 3,294,237 |
| 1,500,000 | | Kernel Holding SA, 5.761%, 3/3/2016 | 1,505,250 |
| 5,000,000 | | Louis Dreyfus II, 3.1504%, 10/4/2016 | 4,970,000 |
| 5,151,456 | | Marfrig, 4.1451%, 6/19/2015 | 5,146,304 |
| 4,000,000 | | Nidera Sementes, 3.87065%, 6/30/2016 | 3,986,000 |
| 2,571,429 | 2,3 | REI Agro Ltd., 6.2531%, 10/31/2015 | 772,713 |
| 5,000,000 | | Seara, 5.12065%, 6/15/2017 | 5,005,000 |
| | | TOTAL | 31,145,754 |
Annual Shareholder Report
Principal
Amount
or Shares | | | Value |
| | | TRADE FINANCE AGREEMENTS—continued1 | |
| | | Consumer Non-Cyclical/Tobacco���1.4% | |
| $7,000,000 | | Bladex, 1.10%, 7/17/2015 | $7,000,000 |
| | | Energy—10.1% | |
| 7,132,525 | | Adani Power Ltd., 3.5754%, 6/30/2018 | 6,711,706 |
| 5,000,000 | | Ancap II, 2.40275%, 11/27/2015 | 4,997,500 |
| 1,428,572 | | BB Energy II, 2.1738%, 6/24/2015 | 1,426,429 |
| 1,957,941 | | Gunvor Group, 3.678%, 11/30/2016 | 1,926,614 |
| 6,000,000 | | Hellenic Pet IV, 0.000%, 4/20/2015 | 5,943,600 |
| 4,545,500 | | Jordan Petroleum Refinery, 2.66675%, 1/26/2016 | 4,550,045 |
| 7,500,000 | | Preem AB VIII, 0.000%, 4/20/2015 | 7,488,750 |
| 8,000,000 | | Puma Energy II, 2.685%, 5/19/2017 | 7,984,000 |
| 3,246,521 | | Samir Energy II, 3.633%, 12/31/2015 | 3,249,767 |
| 6,477,829 | | Sonangol III, 3.678%, 9/28/2017 | 6,419,529 |
| 270,833 | 2,3 | SV Oil & Natural Gas Ltd., 4.1765%, 12/31/2015 | 268,667 |
| | | TOTAL | 50,966,607 |
| | | Energy - Integrated Energy—0.7% | |
| 2,725,383 | | Oando Insured A, 9.1911%, 6/30/2019 | 2,725,383 |
| 639,082 | | Oando Insured B, 8.7754%, 12/31/2017 | 639,082 |
| 302,820 | | Oando Uninsured A, 9.1911%, 6/30/2019 | 301,760 |
| 71,009 | | Oando Uninsured B, 8.7754%, 12/31/2017 | 70,760 |
| | | TOTAL | 3,736,985 |
| | | Energy - Refining—2.2% | |
| 7,500,000 | | Dangote, 4.8879%, 9/4/2020 | 7,522,500 |
| 3,428,571 | | Petron Corp., 2.578%, 9/30/2016 | 3,394,286 |
| | | TOTAL | 10,916,786 |
| | | Energy/Exploration and Production—10.1% | |
| 1,218,750 | | Canbaikal Resources Insured, 5.6778%, 4/10/2016 | 1,218,750 |
| 135,417 | | Canbaikal Resources Uninsured, 5.6778%, 4/10/2016 | 134,875 |
| 3,000,000 | | Circle Petro, 5.7677%, 6/11/2018 | 2,925,000 |
| 5,400,000 | | Kazmunaigas, 2.2765%, 7/15/2016 | 5,383,800 |
| 784,269 | | Mauriel Promme, 2.2668%, 12/23/2018 | 719,175 |
| 7,350,000 | | Navigat Energy II, 5.262%, 12/2/2018 | 7,291,200 |
| 7,000,000 | | Neconde, 8.2731%, 12/27/2018 | 6,905,500 |
| 5,743,672 | | Nigerian Petro, 4.02065%, 6/15/2019 | 5,669,005 |
| 3,386,798 | | PT CKP, 4.423%, 1/2/2017 | 3,364,783 |
| 2,607,692 | | Ptmitraperk, 6.178%, 11/30/2015 | 2,573,792 |
| 3,461,539 | | Rosneft Oil III, 2.6561%, 4/24/2017 | 3,328,269 |
| 4,482,235 | | SHT, 5.175%, 5/8/2017 | 4,453,101 |
| 5,735,294 | | Socar & Turcas, 2.8768%, 8/11/2016 | 5,743,897 |
| 1,428,571 | | TNK-BP Finance SA, 1.5626%, 8/23/2015 | 1,387,143 |
| | | TOTAL | 51,098,290 |
| | | Finance—7.0% | |
| 1,650,000 | | Alternatif Besle, 0.000%, 6/18/2015 | 1,640,925 |
| 1,500,000 | | Alternatif Karan, 0.000%, 6/10/2015 | 1,491,750 |
| 4,000,000 | | Banco Industial, 1.37%, 7/10/2015 | 4,012,000 |
| 5,000,000 | | Emirates NBD, 0.67415%, 8/20/2015 | 5,000,000 |
| 9,000,000 | | LFC TGB, 1.7626%, 5/24/2015 | 8,991,000 |
| 5,000,000 | | Turk Ekonomi BK, 0.000%, 7/8/2015 | 4,972,500 |
| 7,500,000 | | Turk Eximbank, 1.1342%, 3/4/2016 | 7,515,000 |
Annual Shareholder Report
Principal
Amount
or Shares | | | Value |
| | | TRADE FINANCE AGREEMENTS—continued1 | |
| | | Finance—continued | |
| $1,564,980 | | Turk Vakiflar II, 0.000%, 6/15/2015 | $1,557,938 |
| | | TOTAL | 35,181,113 |
| | | Finance/Banks/Brokers—7.3% | |
| 8,000,000 | | Africa Fin Corp., 3.173%, 12/1/2015 | 7,988,000 |
| 5,000,000 | | BPC Tranche B, 5.32265%, 12/13/2016 | 4,992,500 |
| 5,000,000 | | CFC Stanbic, 2.7551%, 11/5/2016 | 5,000,000 |
| 7,500,000 | | Int Bk AZ Murab, 2.75%, 12/24/2015 | 7,413,750 |
| 5,000,000 | | Turkey Garanti Bank, 3.323%, 5/3/2016 | 5,035,000 |
| 2,666,667 | | Union Bank of Nigeria, 4.678%, 1/28/2017 | 2,609,333 |
| 3,846,154 | | Veb, 3.6054%, 1/31/2020 | 3,861,539 |
| | | TOTAL | 36,900,122 |
| | | Services - Construction Services—0.2% | |
| 1,050,000 | | IIF, 2.433%, 7/18/2019 | 1,050,000 |
| | | Services/Railroads—1.2% | |
| 4,760,000 | | Azeri RR, 5.325%, 1/25/2018 | 4,667,180 |
| 1,218,815 | | Eastcomtrans, Floating Rate Note, 6.175%, 4/1/2016 | 1,205,408 |
| | | TOTAL | 5,872,588 |
| | | Sovereign—0.4% | |
| 1,914,019 | | Bangladesh, Government of, 3.655%, 11/10/2015 | 1,918,804 |
| | | Supranational—1.5% | |
| 7,500,000 | | PTA Bank, 2.7567%, 10/21/2016 | 7,507,500 |
| | | Telecommunications & Cellular—4.0% | |
| 5,143,000 | | Digicel D2, 3.7754%, 3/31/2019 | 5,145,571 |
| 4,200,000 | | IHS Zambia, Floating Rate Note, 6.675%, 3/6/2021 | 4,111,800 |
| 1,062,500 | | INT Towers, 5.4235%, 12/10/2021 | 1,033,281 |
| 2,792,673 | | Liquid Telecom, 4.7567%, 10/31/2019 | 2,791,276 |
| 649,100 | | MCS Holdings LLC, 6.174%, 11/23/2015 | 643,583 |
| 1,893,209 | | MCS Holdings LLC, 7.674%, 11/24/2017 | 1,869,544 |
| 5,000,000 | | MNC Sky Vision, 4.5199%, 12/11/2016 | 4,920,000 |
| | | TOTAL | 20,515,055 |
| | | Utility/Electricity Generation—1.2% | |
| 6,250,000 | | MOF Angola, 5.7562%, 2/16/2018 | 6,143,750 |
| | | TOTAL TRADE FINANCE AGREEMENTS
(IDENTIFIED COST $437,833,187) | 425,136,956 |
| | | FOREIGN GOVERNMENTS/AGENCIES—2.7%1 | |
| | | Banking—0.6% | |
| 3,000,000 | | African Export-Import Bank, 5.75%, 7/27/2016 | 3,135,180 |
| | | Sovereign—2.1% | |
| 4,269,878 | | Egypt, Government of, 3.212%, 4/29/2016 | 4,269,878 |
| 2,000,000 | | Jordan, Government of, 3.65%, 11/17/2015 | 2,003,000 |
| 4,000,001 | | Tanzania, United Republic of, 6.3971%, 3/9/2020 | 4,120,000 |
| | | TOTAL | 10,392,878 |
| | | TOTAL FOREIGN GOVERNMENTS/AGENCIES
(IDENTIFIED COST $13,458,666) | 13,528,058 |
Annual Shareholder Report
Principal
Amount
or Shares | | | Value |
| | | INVESTMENT COMPANY—5.7% | |
| 28,679,203 | 4,5 | Federated Prime Value Obligations Fund, Institutional Shares, 0.09%
(AT NET ASSET VALUE) | $28,679,203 |
| | | TOTAL INVESTMENTS—98.2%
(IDENTIFIED COST $512,095,460)6 | 495,523,623 |
| | | OTHER ASSETS AND LIABILITIES - NET—1.8%7 | 9,300,188 |
| | | TOTAL NET ASSETS—100% | $504,823,811 |
At March 31, 2015, the Fund had the following outstanding foreign exchange contracts:
| Settlement Date | Foreign
Currency
Units to
Receive | In
Exchange
For | Unrealized
Appreciation
(Depreciation) |
| Contracts Sold: |
| 4/16/2015 | 335,000 EUR | $356,362 | $(3,913) |
| 4/16/2015 | 500,000 GBP | $743,974 | $2,342 |
| NET UNREALIZED DEPRECIATION ON FOREIGN EXCHANGE CONTRACTS | $(1,571) |
Net Unrealized Depreciation on Foreign Exchange Contracts is included in “Other Assets and Liabilities—Net.”
| 1 | Are restricted securities that either: (a) cannot be offered for public sale without first being registered, or being able to take advantage of an exemption from registration, under the Securities Act of 1933, as amended; or (b) are subject to a contractual restriction on public sales. At March 31, 2015, these restricted securities amounted to $466,844,420, which represented 92.5% of total net assets. |
| 2 | Issuer in default. |
| 3 | Non-income-producing security. |
| 4 | Affiliated holding. |
| 5 | 7-day net yield. |
| 6 | The cost of investments for federal tax purposes amounts to $512,610,706. |
| 7 | Assets, other than investments in securities, less liabilities. See Statement of Assets and Liabilities. |
Note: The categories of investments are shown as a percentage of total net assets at March 31, 2015.
Various inputs are used in determining the value of the Fund's investments. These inputs are summarized in the three broad levels listed below:
Level 1—quoted prices in active markets for identical securities.
Level 2—other significant observable inputs (including quoted prices for similar securities, interest rates, prepayment speeds, credit risk, etc.). Also includes securities valued at amortized cost.
Level 3—significant unobservable inputs (including the Fund's own assumptions in determining the fair value of investments).
The inputs or methodology used for valuing securities are not an indication of the risk associated with investing in those securities.
The following is a summary of the inputs used, as of March 31, 2015, in valuing the Fund's assets carried at fair value:
| Valuation Inputs |
| | Level 1—
Quoted
Prices | Level 2—
Other
Significant
Observable
Inputs | Level 3—
Significant
Unobservable
Inputs | Total |
| Debt Securities: | | | | |
| Asset-Backed Security | $— | $— | $566,528 | $566,528 |
| Corporate Bonds | — | 27,612,878 | — | 27,612,878 |
| Trade Finance Agreements | — | — | 425,136,956 | 425,136,956 |
| Foreign Governments/Agencies | — | 7,255,180 | 6,272,878 | 13,528,058 |
| Investment Company | 28,679,203 | — | — | 28,679,203 |
| TOTAL SECURITIES | $28,679,203 | $34,868,058 | $431,976,362 | $495,523,623 |
| OTHER FINANCIAL INSTRUMENTS* | $— | $(1,571) | $— | $(1,571) |
| * | Other financial instruments include foreign exchange contracts.
|
Annual Shareholder Report
The Fund uses a pricing service to provide price evaluation for Level 3 for the asset-backed security, trade finance agreements and certain foreign governments/agencies. The quantitative unobservable inputs used by the pricing service are proprietary and not provided to the Fund and therefore the disclosure that would address these inputs is not included above.
Following is a reconciliation of assets in which significant unobservable inputs (Level 3) were used in determining fair value:
| | Investments in
Asset-Backed
Security | Investments in
Corporate
Bonds | Investments in
Trade Finance
Agreements | Investments in
Foreign
Governments/
Agencies |
| Balance as of April 1, 2014 | $5,192,471 | $6,250,664 | $375,570,459 | $— |
| Accrued discount/premiums | 216 | (1,286) | 1,400,749 | — |
| Realized gain (loss) | (1,975) | 27,514 | (684,382) | — |
| Change in unrealized appreciation (depreciation) | (138,987) | 20,303 | (5,398,363) | 3,000 |
| Purchases | — | — | 511,641,031 | 6,269,878 |
| (Sales) | (4,485,197) | (6,297,195) | (457,392,538) | — |
| Balance as of March 31, 2015 | $566,528 | $— | $425,136,956 | $6,272,878 |
| The total change in unrealized appreciation (depreciation) included in the Statement of Operations attributable to investments still held at March 31, 2015 | $1,817 | $— | $(11,913,284) | $3,000 |
The following acronyms are used throughout this portfolio:
| EUR | —Euro |
| GBP | —Great Britain Pound |
See Notes which are an integral part of the Financial Statements
Annual Shareholder Report
Financial Highlights
(For a Share Outstanding Throughout Each Period)
| Year Ended March 31 | 2015 | 2014 | 2013 | 2012 | 2011 |
| Net Asset Value, Beginning of Period | $9.65 | $9.77 | $9.77 | $9.95 | $9.93 |
| Income From Investment Operations: | | | | | |
| Net investment income | 0.371 | 0.43 | 0.491 | 0.53 | 0.45 |
| Net realized and unrealized gain (loss) on investments and foreign currency transactions | (0.27) | (0.10) | 0.01 | (0.16) | 0.04 |
| TOTAL FROM INVESTMENT OPERATIONS | 0.10 | 0.33 | 0.50 | 0.37 | 0.49 |
| Less Distributions: | | | | | |
| Distributions from net investment income | (0.38) | (0.43) | (0.46) | (0.51) | (0.45) |
| Distributions from net realized gain on investments and foreign currency transactions | — | (0.02) | (0.04) | (0.04) | (0.02) |
| TOTAL DISTRIBUTIONS | (0.38) | (0.45) | (0.50) | (0.55) | (0.47) |
| Net Asset Value, End of Period | $9.37 | $9.65 | $9.77 | $9.77 | $9.95 |
| Total Return2 | 1.04% | 3.47% | 5.30% | 3.76% | 5.05% |
| Ratios to Average Net Assets: | | | | | |
| Net expenses | 0.16% | 0.08% | 0.00%3 | 0.00%3 | 0.00%3 |
| Net investment income | 3.90% | 4.33% | 5.02% | 5.35% | 4.58% |
| Expense waiver/reimbursement4 | 0.19% | 0.16% | 0.35% | 0.35% | 0.45% |
| Supplemental Data: | | | | | |
| Net assets, end of period (000 omitted) | $504,824 | $464,440 | $268,138 | $224,842 | $143,710 |
| Portfolio turnover | 51% | 65% | 62% | 38% | 72% |
| 1 | Per share numbers have been calculated using the average shares method. |
| 2 | Based on net asset value. |
| 3 | The Adviser reimbursed all operating expenses incurred by the Fund. |
| 4 | This expense decrease is reflected in both the net expense and the net investment income ratios shown above. |
See Notes which are an integral part of the Financial Statements
Annual Shareholder Report
Statement of Assets and Liabilities
March 31, 2015
| Assets: | | |
| Total investment in securities, at value including $28,679,203 of investment in an affiliated holding (Note 5) (identified cost $512,095,460) | | $495,523,623 |
| Cash | | 3,321,278 |
| Cash denominated in foreign currencies (identified cost $199,777) | | 185,914 |
| Income receivable | | 256,490 |
| Receivable for investments sold | | 3,629,413 |
| Unrealized appreciation on foreign exchange contracts | | 2,342 |
| Bank loan receivable | | 2,278,616 |
| Prepaid expenses | | 3,462 |
| TOTAL ASSETS | | 505,201,138 |
| Liabilities: | | |
| Payable for investments purchased | $21,407 | |
| Unrealized depreciation on foreign exchange contracts | 3,913 | |
| Drawdown fees | 102,400 | |
| Income distribution payable | 146,798 | |
| Payable to adviser (Note 5) | 410 | |
| Payable for auditing fees | 102,399 | |
| TOTAL LIABILITIES | | 377,327 |
| Net assets for 53,856,773 shares outstanding | | $504,823,811 |
| Net Assets Consist of: | | |
| Paid-in capital | | $528,706,835 |
| Net unrealized depreciation of investments and translation of assets and liabilities in foreign currency | | (16,590,624) |
| Accumulated net realized loss on investments and foreign currency transactions | | (7,374,143) |
| Undistributed net investment income | | 81,743 |
| TOTAL NET ASSETS | | $504,823,811 |
| Net Asset Value, Offering Price and Redemption Proceeds Per Share: | | |
| Net asset value per share ($504,823,811 ÷ 53,856,773 shares outstanding), no par value, unlimited shares authorized | | $9.37 |
See Notes which are an integral part of the Financial Statements
Annual Shareholder Report
Statement of Operations
Year Ended March 31, 2015
| Investment Income: | | | |
| Interest | | | $19,707,247 |
| Dividends received from an affiliated holding (Note 5) | | | 29,737 |
| TOTAL INCOME | | | 19,736,984 |
| Expenses: | | | |
| Investment adviser fee (Note 5) | | $486,658 | |
| Custodian fees | | 40,283 | |
| Transfer agent fee | | 41,020 | |
| Directors'/Trustees' fees (Note 5) | | 10,313 | |
| Auditing fees | | 116,400 | |
| Legal fees | | 455,750 | |
| Portfolio accounting fees | | 328,314 | |
| Printing and postage | | 11,120 | |
| Risk insurance expense (Note 5) | | 38,390 | |
| Insurance expense (Note 5) | | 129,373 | |
| Miscellaneous (Note 5) | | 10,448 | |
| TOTAL EXPENSES | | 1,668,069 | |
| Waiver and Reimbursements (Note 5): | | | |
| Waiver/reimbursement of investment adviser fee | $(486,658) | | |
| Reimbursement of other operating expenses | (415,239) | | |
| TOTAL WAIVER AND REIMBURSEMENTS | | (901,897) | |
| Net expenses | | | 766,172 |
| Net investment income | | | 18,970,812 |
| Realized and Unrealized Loss on Investments and Foreign Currency Transactions: | | | |
| Net realized loss on investments and foreign currency transactions | | | (4,698,281) |
| Net change in unrealized depreciation of investments and translation of assets and liabilities in foreign currency | | | (9,534,300) |
| Net realized and unrealized loss on investments and foreign currency transactions | | | (14,232,581) |
| Change in net assets resulting from operations | | | $4,738,231 |
See Notes which are an integral part of the Financial Statements
Annual Shareholder Report
Statement of Changes in Net Assets
| Year Ended March 31 | 2015 | 2014 |
| Increase (Decrease) in Net Assets | | |
| Operations: | | |
| Net investment income | $18,970,812 | $16,608,500 |
| Net realized loss on investments and foreign currency transactions | (4,698,281) | (752,192) |
| Net change in unrealized appreciation/depreciation of investments and translation of assets and liabilities in foreign currency | (9,534,300) | (3,580,437) |
| CHANGE IN NET ASSETS RESULTING FROM OPERATIONS | 4,738,231 | 12,275,871 |
| Distributions to Shareholders: | | |
| Distributions from net investment income | (19,407,174) | (16,921,592) |
| Distributions from net realized gain on investments and foreign currency transactions | — | (852,122) |
| CHANGE IN NET ASSETS RESULTING FROM DISTRIBUTIONS TO SHAREHOLDERS | (19,407,174) | (17,773,714) |
| Share Transactions: | | |
| Proceeds from sale of shares | 123,344,761 | 202,434,423 |
| Net asset value of shares issued to shareholders in payment of distributions declared | 16,028,150 | 15,232,895 |
| Cost of shares redeemed | (84,319,907) | (15,868,198) |
| CHANGE IN NET ASSETS RESULTING FROM SHARE TRANSACTIONS | 55,053,004 | 201,799,120 |
| Change in net assets | 40,384,061 | 196,301,277 |
| Net Assets: | | |
| Beginning of period | 464,439,750 | 268,138,473 |
| End of period (including undistributed (distributions in excess of) net investment income of $81,743 and $(128,926), respectively) | $504,823,811 | $464,439,750 |
See Notes which are an integral part of the Financial Statements
Annual Shareholder Report
Statement of Cash Flows
Year Ended March 31, 2015
| Operating Activities: | |
| Change in net assets resulting from operations | $4,738,231 |
| Adjustments to Reconcile Change in Net Assets Resulting From Operations to Net Cash Used in Operating Activities: | |
| Purchase of investment securities | (794,476,087) |
| Proceeds from disposition of investment securities | 728,080,656 |
| Purchase of short-term investments, net | 11,122,125 |
| Increase in income receivable | (290,428) |
| Increase in prepaid expenses | (3,462) |
| Decrease in receivable for investments sold | 2,259,327 |
| Decrease in unrealized appreciation of foreign exchange contracts | 10 |
| Decrease in payable for investments purchased | (4,819,391) |
| Increase in drawdown fees | 77,387 |
| Increase in unrealized depreciation of foreign exchange contracts | 3,426 |
| Decrease in accrued expenses | (26,368) |
| Net realized loss on investments and foreign currency transactions | 4,698,281 |
| Change in unrealized depreciation of investments and translation of assets and liabilities in foreign currency | 9,530,864 |
| NET CASH USED IN OPERATING ACTIVITIES | (39,105,429) |
| Financing Activities: | |
| Proceeds from shares sold | 123,344,761 |
| Payments of shares redeemed | (84,319,907) |
| Distributions paid in cash | (3,483,990) |
| NET CASH PROVIDED BY FINANCING ACTIVITIES | 35,540,864 |
| Net decrease in cash | (3,564,565) |
| Cash at beginning period | 7,071,757 |
| Cash at end of period | $3,507,192 |
Non-cash financing activities not included herein consist of reinvestment of dividends and distributions of $16,028,150.
See Notes which are an integral part of the Financial Statements
Annual Shareholder Report
Notes to Financial Statements
March 31, 2015
1. ORGANIZATION
Federated Project and Trade Finance Core Fund (the “Fund”) is a non-diversified portfolio of Federated Core Trust III (the “Trust”). The Trust is registered under the Investment Company Act of 1940, as amended (the “1940 Act”), as an open-end management investment company. The Fund operates as an open-end extended payment fund. The Fund's investment objective is to provide total return. Currently, the Fund is only available for purchase by organizations or entities that are “accredited investors” within the meaning of Regulation D of the Securities Act of 1933 (the “1933 Act”) and “qualified purchasers” as defined in Section 2(a)(51) of the 1940 Act. The Fund is not a mutual fund, and its shares are offered pursuant to an exemption from registration under the 1933 Act, as amended.
2. SIGNIFICANT ACCOUNTING POLICIES
The following is a summary of significant accounting policies consistently followed by the Fund in the preparation of its financial statements. These policies are in conformity with U.S. generally accepted accounting principles (GAAP).
Investment Valuation
In calculating its net asset value (NAV), the Fund generally values investments as follows:
| ■ | Fixed-income securities acquired with remaining maturities greater than 60 days are fair valued using price evaluations provided by a pricing service approved by the Trustees. |
| ■ | Fixed-income securities and repurchase agreements acquired with remaining maturities of 60 days or less are valued at their cost (adjusted for the accretion of any discount or amortization of any premium), unless the issuer's creditworthiness is impaired or other factors indicate that amortized cost is not an accurate estimate of the investment's fair value, in which case it would be valued in the same manner as a longer-term security. |
| ■ | Equity securities listed on an exchange or traded through a regulated market system are valued at their last reported sale price or official closing price in their principal exchange or market. |
| ■ | Shares of other mutual funds or non-exchange-traded investment companies are valued based upon their reported NAVs. |
| ■ | Derivative contracts listed on exchanges are valued at their reported settlement or closing price, except that options are valued at the mean of closing bid and asked quotations. |
| ■ | Over-the-counter (OTC) derivative contracts are fair valued using price evaluations provided by a pricing service approved by the Trustees. |
| ■ | For securities that are fair valued in accordance with procedures established by and under the general supervision of the Trustees, certain factors may be considered such as: the last traded or purchase price of the security, information obtained by contacting the issuer or dealers, analysis of the issuer's financial statements or other available documents, fundamental analytical data, the nature and duration of restrictions on disposition, the movement of the market in which the security is normally traded, public trading in similar securities or derivative contracts of the issuer or comparable issuers, movement of a relevant index, or other factors including but not limited to industry changes and relevant government actions. |
If any price, quotation, price evaluation or other pricing source is not readily available when the NAV is calculated, or if the Fund cannot obtain price evaluations from a pricing service or from more than one dealer for an investment within a reasonable period of time as set forth in the Fund's valuation policies and procedures, the Fund uses the fair value of the investment determined in accordance with the procedures described below. There can be no assurance that the Fund could obtain the fair value assigned to an investment if it sold the investment at approximately the time at which the Fund determines its NAV per share.
Fair Valuation and Significant Events Procedures
The Trustees have ultimate responsibility for determining the fair value of investments for which market quotations are not readily available. The Trustees have appointed a valuation committee (“Valuation Committee”) comprised of officers of the Fund, Federated Investment Management Company (“Adviser”) and certain of the Adviser's affiliated companies to assist in determining fair value and in overseeing the calculation of the NAV. The Trustees have also authorized the use of pricing services recommended by the Valuation Committee to provide fair value evaluations of the current value of certain investments for purposes of calculating the NAV. The Valuation Committee employs various methods for reviewing third-party pricing-service evaluations including periodic reviews of third-party pricing services' policies, procedures and valuation methods (including key inputs, methods, models and assumptions), transactional back-testing, comparisons of evaluations of different pricing services, and review of price challenges by the Adviser based on recent market activity. In the event that market quotations and price evaluations are not available for an investment, the Valuation Committee determines the fair value of the investment in accordance with procedures adopted by the Trustees. The Trustees periodically review and approve the fair valuations made by the Valuation Committee and any changes made to the procedures.
The pricing services base their evaluations for the majority of Fund investments on indications of values from banks that make project and trade finance loans, weighted based on the accuracy of their historical indications and other factors to arrive at a price evaluation. Factors considered by pricing services in evaluating an investment include the yields or prices of investments of comparable quality, coupon, maturity, call rights and other potential prepayments, terms and type, reported transactions, indications as to values from dealers and general market conditions. The Fund may hold securities that are valued on the basis of prices provided by a single pricing source, including dealers from whom the securities were purchased. These securities may be less liquid and the price realized upon a sale may be different than the price used to value the security.
Annual Shareholder Report
Although the factors on which pricing services base their evaluations generally consist of observable inputs, certain fixed-income securities, such as trade finance agreements, are typically held to maturity by investors and therefore do not trade on a consistent basis. Accordingly, pricing services frequently cannot rely on executed trade prices to support their evaluations of these securities and must necessarily rely more heavily on unobservable inputs. In such circumstances, the Fund may classify securities as having a Level 3 valuation due to a lack of observable market transactions.
Some pricing services provide a single price evaluation reflecting the bid-side of the market for an investment (a “bid” evaluation). Other pricing services offer both bid evaluations and price evaluations indicative of a price between the prices bid and asked for the investment (a “mid” evaluation). The Fund normally uses bid evaluations for any U.S. Treasury and Agency securities, mortgage-backed securities and municipal securities. The Fund normally uses mid evaluations for any other types of fixed-income securities and any OTC derivative contracts. In the event that market quotations and price evaluations are not available for an investment, the fair value of the investment is determined in accordance with procedures adopted by the Trustees.
The Trustees also have adopted procedures requiring an investment to be priced at its fair value whenever the Adviser determines that a significant event affecting the value of the investment has occurred between the time as of which the price of the investment would otherwise be determined and the time as of which the NAV is computed. An event is considered significant if there is both an affirmative expectation that the investment's value will change in response to the event and a reasonable basis for quantifying the resulting change in value. Examples of significant events that may occur after the close of the principal market on which a security is traded, or after the time of a price evaluation provided by a pricing service or a dealer, include:
| ■ | With respect to securities traded principally in foreign markets, significant trends in U.S. equity markets or in the trading of foreign securities index futures contracts; |
| ■ | Political or other developments affecting the economy or markets in which an issuer conducts its operations or its securities are traded; |
| ■ | Announcements concerning matters such as acquisitions, recapitalizations, litigation developments, or a natural disaster affecting the issuer's operations or regulatory changes or market developments affecting the issuer's industry. |
The Trustees have adopted procedures whereby the Valuation Committee uses a pricing service to determine the fair value of equity securities traded principally in foreign markets when the Adviser determines that there has been a significant trend in the U.S. equity markets or in index futures trading. For other significant events, the Fund may seek to obtain more current quotations or price evaluations from alternative pricing sources. If a reliable alternative pricing source is not available, the Fund will determine the fair value of the investment in accordance with the fair valuation procedures approved by the Trustees. The Trustees have ultimate responsibility for any fair valuations made in response to a significant event.
Investment Income, Gains and Losses, Expenses and Distributions
Investment transactions are accounted for on a trade-date basis. Realized gains and losses from investment transactions are recorded on an identified-cost basis. Interest income and expenses are accrued daily. Dividend income and distributions to shareholders are recorded on the ex-dividend date. Foreign dividends are recorded on the ex-dividend date or when the Fund is informed of the ex-dividend date. Distributions of net investment income are declared daily and paid monthly. Non-cash dividends included in dividend income, if any, are recorded at fair value.
Premium and Discount Amortization
All premiums and discounts on fixed-income securities are amortized/accreted using the effective-interest-rate method.
Federal Taxes
It is the Fund's policy to comply with the Subchapter M provision of the Internal Revenue Code and to distribute to shareholders each year substantially all of its income. Accordingly, no provision for federal income tax is necessary. As of and during the year ended March 31, 2015, the Fund did not have a liability for any uncertain tax positions. The Fund recognizes interest and penalties, if any, related to tax liabilities as income tax expense in the Statement of Operations. As of March 31, 2015, tax years 2012 through 2015 remain subject to examination by the Fund's major tax jurisdictions, which include the United States of America and the state of Delaware.
Foreign Exchange Contracts
The Fund enters into foreign exchange contracts for the delayed-delivery of securities or foreign currency exchange transactions. The Fund enters into foreign exchange contracts to protect assets against adverse changes in foreign currency exchange rates or exchange control regulations. Purchased contracts are used to acquire exposure to foreign currencies, whereas, contracts to sell are used to hedge the Fund's securities against currency fluctuations. Risks may arise upon entering into these transactions from the potential inability of counterparties to meet the terms of their commitments and from unanticipated movements in security prices or foreign exchange rates. The foreign exchange contracts are adjusted by the daily exchange rate of the underlying currency and any gains or losses are recorded for financial statement purposes as unrealized until the settlement date.
Foreign exchange contracts are subject to Master Netting Agreements which are agreements between the Fund and its counterparties that provide for the net settlement of all transactions and collateral with the Fund, through a single payment, in the event of default or termination. Amounts presented on the Portfolio of Investments and Statement of Assets and Liabilities are not net settlement amounts but gross. Foreign exchange contracts outstanding at period end, including net unrealized appreciation/depreciation or net settlement amount, are listed after the Fund's Portfolio of Investments.
The average value at settlement date payable and receivable of foreign exchange contracts purchased and sold by the Fund throughout the period was $7,102 and $176,277, respectively. This is based on the contracts held as of each month-end throughout the fiscal period.
Annual Shareholder Report
Foreign Currency Translation
The accounting records of the Fund are maintained in U.S. dollars. All assets and liabilities denominated in foreign currencies (FCs) are translated into U.S. dollars based on the rates of exchange of such currencies against U.S. dollars on the date of valuation. Purchases and sales of securities, income and expenses are translated at the rate of exchange quoted on the respective date that such transactions are recorded. The Fund does not isolate that portion of the results of operations resulting from changes in foreign exchange rates on investments from the fluctuations arising from changes in market prices of securities held. Such fluctuations are included with the net realized and unrealized gain or loss from investments.
Reported net realized foreign exchange gains or losses arise from sales of portfolio securities, sales and maturities of short-term securities, sales of FCs, currency gains or losses realized between the trade and settlement dates on securities transactions, the difference between the amounts of dividends, interest and foreign withholding taxes recorded on the Fund's books, and the U.S. dollar equivalent of the amounts actually received or paid. Net unrealized foreign exchange gains and losses arise from changes in the value of assets and liabilities other than investments in securities at fiscal year end, resulting from changes in the exchange rate.
Restricted Securities
The Fund may purchase securities which are considered restricted. Restricted securities are securities that either: (a) cannot be offered for public sale without first being registered, or being able to take advantage of an exemption from registration, under the Securities Act of 1933; or (b) are subject to contractual restrictions on public sales. In some cases, when a security cannot be offered for public sale without first being registered, the issuer of the restricted security has agreed to register such securities for resale, at the issuer's expense, either upon demand by the Fund or in connection with another registered offering of the securities. Many such restricted securities may be resold in the secondary market in transactions exempt from registration. Restricted securities may be determined to be liquid under criteria established by the Trustees. The Fund will not incur any registration costs upon such resales. The Fund's restricted securities, like other securities, are priced in accordance with procedures established by and under the general supervision of the Trustees. The Fund's restricted securities were acquired between August 27, 2009 and March 31, 2015, with a total acquisition cost of $466,219,341.
Additional Disclosure Related to Derivative Instruments
| Fair Value of Derivative Instruments |
| | Asset | Liability |
| | Statement of
Assets and
Liabilities
Location | Fair
Value | Statement of
Assets and
Liabilities
Location | Fair
Value |
| Derivatives not accounted for as hedging instruments under ASC Topic 815 | | | | |
| Foreign exchange contracts | Unrealized appreciation on
foreign exchange
contracts | $2,342 | Unrealized depreciation on foreign
exchange contracts | $3,913 |
The Effect of Derivative Instruments on the Statement of Operations for the Year Ended March 31, 2015
| Amount of Realized Gain or (Loss) on Derivatives Recognized in Income |
| | Forward
Currency
Contracts |
| Foreign exchange contracts | $164,932 |
| Change in Unrealized Appreciation or (Depreciation) on Derivatives Recognized in Income |
| | Forward
Currency
Contracts |
| Foreign exchange contracts | $(3,436) |
Other
The preparation of financial statements in conformity with GAAP requires management to make estimates and assumptions that affect the amounts of assets, liabilities, expenses and revenues reported in the financial statements. Actual results could differ from those estimated. The Fund applies Investment Company accounting and reporting guidance.
Annual Shareholder Report
3. SHARES OF BENEFICIAL INTEREST
The following table summarizes share activity:
| Year Ended March 31 | 2015 | 2014 |
| Shares sold | 12,869,531 | 20,770,266 |
| Shares issued to shareholders in payment of distributions declared | 1,680,152 | 1,566,394 |
| Shares redeemed | (8,846,016) | (1,625,966) |
| NET CHANGE RESULTING FROM SHARE TRANSACTIONS | 5,703,667 | 20,710,694 |
4. FEDERAL TAX INFORMATION
The timing and character of income and capital gain distributions are determined in accordance with income tax regulations, which may differ from GAAP. These differences are due to differing treatments for defaulted securities, foreign currency reclasses and discount accretion/premium amortization on debt securities.
For the year ended March 31, 2015, permanent differences identified and reclassified among the components of net assets were as follows:
| Increase (Decrease) |
Undistributed
Net Investment
Income (Loss) | Accumulated
Net Realized
Gain (Loss) |
| $647,031 | $(647,031) |
Net investment income (loss), net realized gains (losses), and net assets were not affected by this reclassification.
The tax character of distributions as reported on the Statement of Changes in Net Assets for the years ended March 31, 2015 and 2014, was as follows:
| | 2015 | 2014 |
| Ordinary income1 | $19,407,174 | $17,478,854 |
| Long-term capital gains | — | $294,860 |
| 1 | For tax purposes, short-term capital gain distributions are considered ordinary income distributions. |
As of March 31, 2015, the components of distributable earnings on a tax basis were as follows:
| Undistributed ordinary income | $63,980 |
| Net unrealized depreciation | $(17,104,298) |
| Capital loss carryforwards | $(6,842,706) |
The difference between book-basis and tax-basis net unrealized appreciation/depreciation is attributable to defaulted securities and discount accretion/premium amortization on debt securities.
At March 31, 2015, the cost of investments for federal tax purposes was $512,610,706. The net unrealized depreciation of investments for federal tax purposes excluding any unrealized appreciation/depreciation resulting from: (a) the translation from FCs to U.S. dollars of assets and liabilities other than investments in securities; and (b) outstanding foreign currency commitments was $17,087,083. This consists of net unrealized appreciation from investments for those securities having an excess of value over cost of $1,079,637 and net unrealized depreciation from investments for those securities having an excess of cost over value of $18,166,720.
At March 31, 2015, the Fund had a capital loss carryforward of $6,842,706 which will reduce the Fund's taxable income arising from future net realized gains on investments, if any, to the extent permitted by the Code, thereby reducing the amount of distributions to shareholders which would otherwise be necessary to relieve the Fund of any liability for federal income tax. Pursuant to the Code, a net capital loss incurred in taxable years beginning after December 22, 2010, retains its character as either short-term or long-term and does not expire. All of the Fund's capital loss carryforwards were incurred in taxable years beginning after December 22, 2010.
The following schedule summarizes the Fund's capital loss carryforwards:
| Short-Term | Long-Term | Total |
| $1,545,872 | $5,296,834 | $6,842,706 |
Annual Shareholder Report
5. INVESTMENT ADVISER FEE AND OTHER TRANSACTIONS WITH AFFILIATES
Investment Adviser Fee
The advisory agreement between the Fund and the Adviser provides for an annual fee equal to 0.10% of the Fund's average daily net assets. The Adviser may voluntarily choose to waive any portion of its fee and/or reimburse certain operating expenses of the Fund. The Adviser and its affiliates on their own initiative have agreed to waive their fees (if any), and reimburse the Fund such that the Fund pays operating expenses associated with the operation and maintenance of the Fund (excluding fees and expenses that may be charged by the Adviser and its affiliates and operating expenses associated with premiums for risk insurance policies on portfolio securities) in an amount up to 0.15% of the Fund's average daily net assets. The Adviser and its affiliates can modify or terminate this voluntary waiver and/or reimbursement at any time at its sole discretion. For the year ended March 31, 2015, the Adviser voluntarily waived $435,747 of its fee and voluntarily reimbursed $415,239 of other operating expenses.
Certain of the Fund's assets are managed by Federated Investors (UK) LLP (the “Sub-Adviser”) an affiliate of the Adviser. Under the terms of a sub-advisory agreement between the Adviser and the Sub-Adviser, the Sub-Adviser receives an annual fee equal to 0.39% of the daily net assets of the Fund paid by the Adviser out of its resources and is not an incremental Fund expense. For the year ended March 31, 2015, the Sub-Adviser earned a fee of $1,897,967.
Interfund Transactions
During the year ended March 31, 2015, the Fund engaged in purchase and sale transactions with funds that have a common investment adviser (or affiliated investment advisers), common Directors/Trustees, and/or common Officers. These purchase and sale transactions complied with Rule 17a-7 under the Act and amounted to $2,682,329 and $1,826,563, respectively.
General
Certain Officers and Trustees of the Fund are Officers and Directors or Trustees of certain of the above companies. To efficiently facilitate payment, Directors'/Trustees' fees and certain expenses related to conducting meetings of the Directors/Trustees and other miscellaneous expenses are paid by an affiliate of the Adviser which in due course are reimbursed by the Fund. Such expenses may be included in Accrued and Miscellaneous Expenses on the Statement of Assets and Liabilities and Statement of Operations, respectively.
Transactions Involving Affiliated Holdings
Affiliated holdings are investment companies which are managed by the Adviser or an affiliate of the Adviser. The Adviser has agreed to reimburse the Fund for certain investment adviser fees as a result of transactions in other affiliated investment companies. For the year ended March 31, 2015, the Adviser reimbursed $50,911. Transactions involving the affiliated holding during the year ended March 31, 2015, were as follows:
| | Federated
Prime Value
Obligations Fund,
Institutional Shares |
| Balance of Shares Held 3/31/2014 | 39,801,328 |
| Purchases/Additions | 405,304,163 |
| Sales/Reductions | (416,426,288) |
| Balance of Shares Held 3/31/2015 | 28,679,203 |
| Value | $28,679,203 |
| Dividend Income | $29,737 |
6. Investment TRANSACTIONS
Purchases and sales of investments, excluding long-term U.S. government securities and short-term obligations, for the year ended March 31, 2015, were as follows:
| Purchases | $206,384,964 |
| Sales | $193,213,846 |
Annual Shareholder Report
7. CONCENTRATION OF RISK (UNAUDITED)
The Fund invests in securities of non-U.S. issuers. Political or economic developments may have an effect on the liquidity and volatility of portfolio securities and currency holdings.
At March 31, 2015, the diversification of countries was as follows:
| Country | Percentage of
Total Net Assets |
| Turkey | 10.5% |
| Brazil | 9.5% |
| Indonesia | 6.8% |
| Nigeria | 6.3% |
| Angola | 4.6% |
| India | 3.7% |
| Russia | 3.7% |
| South Africa | 2.9% |
| Kazakhstan | 2.8% |
| Azerbaijan | 2.4% |
| Mexico | 2.2% |
| Saudi Arabia | 2.2% |
| United States | 2.2% |
| Swaziland | 2.0% |
| Jamaica | 1.9% |
| United Arab Emerates | 1.9% |
| Burundi | 1.5% |
| Sweden | 1.5% |
| Egypt | 1.4% |
| Panama | 1.4% |
| Ukrainian SSR | 1.4% |
| Jordan | 1.3% |
| Mongolia | 1.3% |
| Greece | 1.2% |
| Ghana | 1.1% |
| Belgium | 1.0% |
| Botswana | 1.0% |
| Kenya | 1.0% |
| United Kingdom | 1.0% |
| Uruguay | 1.0% |
| Chad | 0.9% |
| Netherlands | 0.9% |
| Tanzania, United Republic of | 0.8% |
| Zambia | 0.8% |
| Philippines | 0.7% |
| Colombia | 0.6% |
| Macau | 0.6% |
| Mauritius | 0.6% |
| Supranational | 0.6% |
| Ivory Coast | 0.5% |
| Australia | 0.4% |
| Bhutan | 0.4% |
| Chile | 0.4% |
| Macedonia | 0.4% |
Annual Shareholder Report
| Country | Percentage of
Total Net Assets |
| Argentina | 0.3% |
| Mauritania | 0.3% |
| Serria Leone | 0.2% |
| Singapore | 0.2% |
| Cayman Islands | 0.1% |
| Gabon | 0.1% |
8. LINE OF CREDIT
The Fund participates in a $100,000,000 unsecured, uncommitted revolving line of credit (LOC) agreement with PNC Bank. The LOC was made available for extraordinary or emergency purposes, primarily for financing redemption payments. Borrowings are charged interest at a rate offered to the Fund by PNC Bank at the time of the borrowing. As of March 31, 2015, there were no outstanding loans. During the year ended March 31, 2015, the Fund did not utilize the LOC.
9. INTERFUND LENDING
Pursuant to an Exemptive Order issued by the Securities and Exchange Commission, the Fund, along with other funds advised by subsidiaries of Federated Investors, Inc., may participate in an interfund lending program. This program provides an alternative credit facility allowing the Fund to borrow from other participating affiliated funds. As of March 31, 2015, there were no outstanding loans. During the year ended March 31, 2015, the program was not utilized.
Annual Shareholder Report
Report of Independent Registered Public Accounting Firm
To the Board of Trustees of the Federated Core Trust III and the Shareholders of Federated Project and Trade Finance Core Fund:
We have audited the accompanying statement of assets and liabilities, including the portfolio of investments, of the Federated Project and Trade Finance Core Fund (the “Fund”), a series of the Federated Core Trust III, as of March 31, 2015, and the related statements of operations and cash flows for the year then ended, the statement of changes in net assets for each of the years in the two year period then ended, and the financial highlights for each of the years in the five year period then ended. These financial statements and financial highlights are the responsibility of the Fund's management. Our responsibility is to express an opinion on these financial statements and financial highlights based on our audits.
We conducted our audits in accordance with the standards of the Public Company Accounting
Oversight Board (United States). Those standards require that we plan and perform the audit to obtain reasonable assurance about whether the financial statements and financial highlights are free of material misstatement. An audit includes examining, on a test basis, evidence supporting the amounts and disclosures in the financial statements. Our procedures included confirmation of securities owned as of March 31, 2015 by correspondence with the custodian, transfer agent and brokers, or by other appropriate auditing procedures. An audit also includes assessing the accounting principles used and significant estimates made by management, as well as evaluating the overall financial statement presentation. We believe that our audits provide a reasonable basis for our opinion.
In our opinion, the financial statements and financial highlights referred to above present fairly, in all material respects, the financial position of the Federated Project and Trade Finance Core Fund as of March 31, 2015, the results of its operations and its cash flows for the year then ended, the changes in its net assets for each of the years in the two-year period then ended, and the financial highlights for each of the years in the five-year period then ended, in conformity with U.S. generally accepted accounting principles.
Boston, Massachusetts
May 28, 2015
Annual Shareholder Report
Shareholder Expense Example (unaudited)
As a shareholder of the Fund, you incur ongoing costs, including management fees and to the extent applicable, distribution (12b-1) fees and/or other service fees and other Fund expenses. This Example is intended to help you to understand your ongoing costs (in dollars) of investing in the Fund and to compare these costs with the ongoing costs of investing in other mutual funds. It is based on an investment of $1,000 invested at the beginning of the period and held for the entire period from October 1, 2014 to March 31, 2015.
ACTUAL EXPENSES
The first section of the table below provides information about actual account values and actual expenses. You may use the information in this section, together with the amount you invested, to estimate the expenses that you incurred over the period. Simply divide your account value by $1,000 (for example, an $8,600 account value divided by $1,000 = 8.6), then multiply the result by the number in the first section under the heading entitled “Expenses Paid During Period” to estimate the expenses attributable to your investment during this period.
HYPOTHETICAL EXAMPLE FOR COMPARISON PURPOSES
The second section of the table below provides information about hypothetical account values and hypothetical expenses based on the Fund's actual expense ratio and an assumed rate of return of 5% per year before expenses, which is not the Fund's actual return. Thus, you should not use the hypothetical account values and expenses to estimate the actual ending account balance or your expenses for the period. Rather, these figures are required to be provided to enable you to compare the ongoing costs of investing in the Fund with other funds. To do so, compare this 5% hypothetical example with the 5% hypothetical examples that appear in the shareholder reports of the other funds.
Please note that the expenses shown in the table are meant to highlight your ongoing costs only. Therefore, the second section of the table is useful in comparing ongoing costs only, and will not help you determine the relative total costs of owning different funds.
| | Beginning
Account Value
10/1/2014 | Ending
Account Value
3/31/2015 | Expenses Paid
During Period1 |
| Actual | $1,000.00 | $994.10 | $0.85 |
| Hypothetical (assuming a 5% return before expenses) | $1,000.00 | $1,024.08 | $0.86 |
| 1 | Expenses are equal to the Fund's annualized net expense ratio of 0.17%, multiplied by the average account value over the period, multiplied by 182/365 (to reflect the one-half-year period).
|
Annual Shareholder Report
Board of Trustees and Trust Officers
The Board of Trustees is responsible for managing the Trust's business affairs and for exercising all the Trust's powers except those reserved for the shareholders. The following tables give information about each Trustee and the senior officers of the Fund. Where required, the tables separately list Trustees who are “interested persons” of the Fund (i.e., “Interested” Trustees) and those who are not (i.e., “Independent” Trustees). Unless otherwise noted, the address of each person listed is Federated Investors Tower, 1001 Liberty Avenue, Pittsburgh, PA 15222. The address of all Independent Trustees listed is 4000 Ericsson Drive, Warrendale, PA 15086-7561; Attention: Mutual Fund Board. As of December 31, 2014, the Trust comprised one portfolio(s), and the Federated Fund Family consisted of 40 investment companies (comprising 131 portfolios). Unless otherwise noted, each Officer is elected annually. Unless otherwise noted, each Trustee oversees all portfolios in the Federated Fund Family and serves for an indefinite term. The Fund's Statement of Additional Information includes additional information about Trust Trustees and is available, without charge and upon request, by calling 1-800-341-7400.
Interested Trustees Background
Name
Birth Date
Positions Held with Trust
Date Service Began | Principal Occupation(s) for Past Five Years,
Other Directorships Held and Previous Position(s) |
John F. Donahue*
Birth Date: July 28, 1924
Trustee
Indefinite Term
Began serving: February 2008 | Principal Occupations: Director or Trustee of the Federated Fund Family; Chairman and Director, Federated Investors, Inc.; Chairman of the Federated Fund Family's Executive Committee.
Previous Positions: Chairman of the Federated Fund Family; Trustee, Federated Investment Management Company; Chairman and Director, Federated Investment Counseling. |
J. Christopher Donahue*
Birth Date: April 11, 1949
President and Trustee
Indefinite Term
Began serving: February 2008 | Principal Occupations: Principal Executive Officer and President of certain of the Funds in the Federated Fund Family; Director or Trustee of the Funds in the Federated Fund Family; President, Chief Executive Officer and Director, Federated Investors, Inc.; Chairman and Trustee, Federated Investment Management Company; Trustee, Federated Investment Counseling; Chairman and Director, Federated Global Investment Management Corp.; Chairman, Federated Equity Management Company of Pennsylvania and Passport Research, Ltd. (investment advisory subsidiary of Federated); Trustee, Federated Shareholder Services Company; Director, Federated Services Company.
Previous Positions: President, Federated Investment Counseling; President and Chief Executive Officer, Federated Investment Management Company, Federated Global Investment Management Corp. and Passport Research, Ltd. |
| * | Family relationships and reasons for “interested” status: John F. Donahue is the father of J. Christopher Donahue; both are “interested” due to their beneficial ownership of shares of Federated Investors, Inc. and the positions they hold with Federated and its subsidiaries. |
INDEPENDENT Trustees Background
Name
Birth Date
Positions Held with Trust
Date Service Began | Principal Occupation(s) for Past Five Years,
Other Directorships Held, Previous Position(s) and Qualifications |
John T. Collins
Birth Date: January 24, 1947
Trustee
Indefinite Term
Began serving: September 2013 | Principal Occupations: Director or Trustee of the Federated Fund Family; Chairman and CEO, The Collins Group, Inc. (a private equity firm).
Other Directorships Held: Director, KLX Corp.
Qualifications: Mr. Collins has served in several business and financial management roles and directorship positions throughout his career. Mr. Collins serves as Chairman Emeriti, Bentley University. Mr. Collins previously served as Director, FleetBoston Financial Corp.; Director and Audit Committee Member, Bank of America Corp. and Director, Beth Israel Deaconess Medical Center (Harvard University Affiliate Hospital). |
Maureen Lally-Green
Birth Date: July 5, 1949
Trustee
Indefinite Term
Began serving: August 2009 | Principal Occupations: Director or Trustee of the Federated Fund Family; Associate General Secretary, Diocese of Pittsburgh; Adjunct Professor of Law, Duquesne University School of Law.
Other Directorships Held: Director, CONSOL Energy Inc.
Qualifications: Judge Lally-Green has served in various legal and business roles and directorship positions throughout her career. Judge Lally-Green previously served as Professor of Law, Duquesne University School of Law and was a member of the Superior Court of Pennsylvania. Judge Lally-Green also holds the positions of: Member, Pennsylvania State Board of Education; Director, Saint Vincent College; Director and Chair, UPMC Mercy Hospital; Regent, St. Vincent Seminary; Director, Epilepsy Foundation of Western and Central Pennsylvania; Director, Our Campaign for the Church Alive!, Inc.; Director, Pennsylvania Bar Institute; and Director, Catholic High Schools of the Diocese of Pittsburgh, Inc. Judge Lally-Green has held the positions of: Director, Auberle; Director, Ireland Institute of Pittsburgh; Director, Saint Thomas More Society; and Director Cardinal Wuerl Catholic High School. |
Annual Shareholder Report
Name
Birth Date
Positions Held with Trust
Date Service Began | Principal Occupation(s) for Past Five Years,
Other Directorships Held, Previous Position(s) and Qualifications |
Peter E. Madden
Birth Date: March 16, 1942
Trustee
Indefinite Term
Began serving: February 2008 | Principal Occupation: Director or Trustee, and Chair of the Board of Directors or Trustees, of the Federated Fund Family; Retired.
Other Directorships Held: None.
Qualifications: Mr. Madden has served in several business management, mutual fund services and directorship positions throughout his career. Mr. Madden previously served as President, Chief Operating Officer and Director, State Street Bank and Trust Company (custodian bank) and State Street Corporation (financial services). He was Director, VISA USA and VISA International and Chairman and Director, Massachusetts Bankers Association. Mr. Madden served as Director, Depository Trust Corporation and Director, The Boston Stock Exchange. Mr. Madden also served as a Representative to the Commonwealth of Massachusetts General Court. |
Charles F. Mansfield, Jr.
Birth Date: April 10, 1945
Trustee
Indefinite Term
Began serving: February 2008 | Principal Occupations: Director or Trustee of the Federated Fund Family; Management Consultant.
Other Directorships Held: None.
Qualifications: Mr. Mansfield has served in several banking, business management and educational roles and directorship positions throughout his career. Mr. Mansfield previously served as Chief Executive Officer, PBTC International Bank; Partner, Arthur Young & Company (now Ernst & Young LLP); Chief Financial Officer of Retail Banking Sector, Chase Manhattan Bank; Senior Vice President, HSBC Bank USA (formerly, Marine Midland Bank); Vice President, Citibank; Assistant Professor of Banking and Finance, Frank G. Zarb School of Business, Hofstra University; Executive Vice President DVC Group, Inc. (marketing, communications and technology). |
Thomas M. O'Neill
Birth Date: June 14, 1951
Trustee
Indefinite Term
Began serving: February 2008 | Principal Occupations: Director or Trustee, Vice Chair of the Audit Committee of the Federated Fund Family; Sole Proprietor, Navigator Management Company (investment and strategic consulting).
Other Directorships Held: None.
Qualifications: Mr. O'Neill has served in several business, mutual fund and financial management roles and directorship positions throughout his career. Mr. O'Neill serves as Director, Medicines for Humanity and Director, The Golisano Children's Museum of Naples, Florida. Mr. O'Neill previously served as Chief Executive Officer and President, Managing Director and Chief Investment Officer, Fleet Investment Advisors; President and Chief Executive Officer, Aeltus Investment Management, Inc.; General Partner, Hellman, Jordan Management Co., Boston, MA; Chief Investment Officer, The Putnam Companies, Boston, MA; Credit Analyst and Lending Officer, Fleet Bank; Director and Consultant, EZE Castle Software (investment order management software); and Director, Midway Pacific (lumber). |
P. Jerome Richey
Birth Date: February 23, 1949
Trustee
Indefinite Term
Began serving: September 2013 | Principal Occupations: Director or Trustee of the Federated Fund Family; General Counsel, University of Pittsburgh.
Other Directorships Held: None.
Qualifications: Mr. Richey has served in several business and legal management roles and directorship positions throughout his career. Mr. Richey serves as Board Member, Epilepsy Foundation of Western Pennsylvania and Board member, World Affairs Council of Pittsburgh. Mr. Richey previously served as Chief Legal Officer and Executive Vice President, CONSOL Energy Inc. and Shareholder, Buchanan Ingersoll & Rooney PC (a law firm). |
John S. Walsh
Birth Date: November 28, 1957
Trustee
Indefinite Term
Began serving: February 2008 | Principal Occupations: Director or Trustee, Chair of the Audit Committee of the Federated Fund Family; President and Director, Heat Wagon, Inc. (manufacturer of construction temporary heaters); President and Director, Manufacturers Products, Inc. (distributor of portable construction heaters); President, Portable Heater Parts, a division of Manufacturers Products, Inc.
Other Directorships Held: None.
Qualifications: Mr. Walsh has served in several business management roles and directorship positions throughout his career. Mr. Walsh previously served as Vice President, Walsh & Kelly, Inc. (paving contractors). |
OFFICERS
Name
Birth Date
Address
Positions Held with Trust
Date Service Began | Principal Occupation(s) for Past Five Years
and Previous Position(s) |
John W. McGonigle
Birth Date: October 26, 1938
EXECUTIVE VICE PRESIDENT AND SECRETARY
Officer since: February 2008 | Principal Occupations: Executive Vice President and Secretary of the Federated Fund Family; Vice Chairman, Executive Vice President, Secretary and Director, Federated Investors, Inc.
Previous Positions: Trustee, Federated Investment Management Company and Federated Investment Counseling; Director, Federated Global Investment Management Corp., Federated Services Company and Federated Securities Corp. |
Richard B. Fisher
Birth Date: May 17, 1923
VICE CHAIRMAN
Officer since: February 2008 | Principal Occupations: Vice Chairman or Vice President of some of the Funds in the Federated Fund Family; Vice Chairman, Federated Investors, Inc.; Chairman, Federated Securities Corp.
Previous Positions: President and Director or Trustee of some of the Funds in the Federated Fund Family; Executive Vice President, Federated Investors, Inc.; Director and Chief Executive Officer, Federated Securities Corp. |
Annual Shareholder Report
Name
Birth Date
Address
Positions Held with Trust
Date Service Began | Principal Occupation(s) for Past Five Years
and Previous Position(s) |
Lori A. Hensler
Birth Date: January 6, 1967
TREASURER
Officer since: April 2013 | Principal Occupations: Principal Financial Officer and Treasurer of the Federated Fund Family; Senior Vice President, Federated Administrative Services; Financial and Operations Principal for Federated Securities Corp. and Edgewood Services, Inc.; and Assistant Treasurer, Federated Investors Trust Company. Ms. Hensler has received the Certified Public Accountant designation.
Previous Positions: Controller of Federated Investors, Inc.; Senior Vice President and Assistant Treasurer, Federated Investors Management Company; Treasurer, Federated Investors Trust Company; Assistant Treasurer, Federated Administrative Services, Federated Administrative Services, Inc., Federated Securities Corp., Edgewood Services, Inc., Federated Advisory Services Company, Federated Equity Management Company of Pennsylvania, Federated Global Investment Management Corp., Federated Investment Counseling, Federated Investment Management Company, Passport Research, Ltd., and Federated MDTA, LLC; Financial and Operations Principal for Federated Securities Corp., Edgewood Services, Inc. and Southpointe Distribution Services, Inc. |
Peter J. Germain
Birth Date: September 3, 1959
CHIEF LEGAL OFFICER
Officer since: January 2008 | Principal Occupations: Mr. Germain is Chief Legal Officer of the Federated Fund Family. He is General Counsel and Vice President, Federated Investors, Inc.; President, Federated Administrative Services and Federated Administrative Services, Inc.; Vice President, Federated Securities Corp.; Secretary, Federated Private Asset Management, Inc.; and Secretary, Retirement Plan Service Company of America. Mr. Germain joined Federated in 1984 and is a member of the Pennsylvania Bar Association.
Previous Positions: Deputy General Counsel, Special Counsel, Managing Director of Mutual Fund Services, Federated Investors, Inc.; Senior Vice President, Federated Services Company; and Senior Corporate Counsel, Federated Investors, Inc. |
Brian P. Bouda
Birth Date: February 28, 1947
CHIEF COMPLIANCE OFFICER AND SENIOR VICE PRESIDENT
Officer since: February 2008 | Principal Occupations: Senior Vice President and Chief Compliance Officer of the Federated Fund Family; Vice President and Chief Compliance Officer of Federated Investors, Inc. and Chief Compliance Officer of certain of its subsidiaries. Mr. Bouda joined Federated in 1999 and is a member of the American Bar Association and the State Bar Association of Wisconsin.
Previous Positions: Served in Senior Management positions with a large regional banking organization. |
Robert J. Ostrowski
Birth Date: April 26, 1963
Chief Investment Officer
Officer since: February 2008 | Principal Occupations: Robert J. Ostrowski joined Federated in 1987 as an Investment Analyst and became a Portfolio Manager in 1990. He was named Chief Investment Officer of Federated's taxable fixed-income products in 2004 and also serves as a Senior Portfolio Manager. Mr. Ostrowski became an Executive Vice President of the Fund's Adviser in 2009 and served as a Senior Vice President of the Fund's Adviser from 1997 to 2009. Mr. Ostrowski has received the Chartered Financial Analyst designation. He received his M.S. in Industrial Administration from Carnegie Mellon University. |
Chris McGinley
Birth Date: July 28, 1978
Vice President
Officer since: June 2012
Portfolio Manager since: December 2009 | Principal Occupations: Chris McGinley has been the Fund's Portfolio Manager since December 2009. He is Vice President of the Trust with respect to the Fund Mr. McGinley joined Federated in 2004 as an associate research analyst in the international fixed-income department. He became an Assistant Vice President of the Fund's Adviser in 2005. Mr. McGinley worked in Senator Rick Santorum's office in 2001 and from 2002 to 2004 he served as Legislative Correspondent for Senator Santorum. Mr. McGinley earned his B.S. and received his M.P.I.A. from the University of Pittsburgh. |
Ihab Salib
Birth Date: December 14, 1964
VICE PRESIDENT
Officer since: June 2012
Portfolio Manager since:
August 2009
| Principal Occupations: Ihab Salib has been a Portfolio Manager of the Fund since August 2009. He is Vice President of the Trust with respect to the Fund Mr. Salib joined Federated in April 1999 as a Senior Fixed-Income Trader/Assistant Vice President of the Fund's Adviser. In July 2000, he was named a Vice President of the Fund's Adviser and in January 2007 he was named a Senior Vice President of the Fund's Adviser. He has served as a Portfolio Manager since January 2002. From January 1994 through March 1999, Mr. Salib was employed as a Senior Global Fixed-Income Analyst with UBS Brinson, Inc. Mr. Salib received his B.A. with a major in Economics from Stony Brook University. |
Dalia Kay
Birth Date: March 13, 1970
VICE PRESIDENT
Officer since: August 2014
Portfolio Manager since:
April 2013 | Principal Occupations: Dalia Kay has been the Fund's Portfolio Manager since April 2013. She is Vice President of the Trust with respect to the Fund. Ms. Kay joined the Sub-Adviser in October 2013. From 1994 until September 30, 2013, Ms. Kay was a member of GML Capital LLP and its Trade Finance Portfolio Team. From April 2013 to September 30, 2013, Ms. Kay served as a portfolio manager to the Fund as a member of GML Capital LLP, the sub-adviser to the Fund during that time period. From December 2006 to September 30, 2013, Ms. Kay was an Investment Portfolio Adviser for GML Capital LLP's investment funds. From 1994 to December 2006, Ms. Kay was Associate Director of Trade Finance and Forfaiting with GML International Limited, where she coordinated origination, structuring, documentation and distribution of short- and medium-term trade finance transactions focusing on Turkey, Kazakhstan, Romania, Ukraine and the former Yugoslavia. Ms. Kay received a Diploma in Law and a BA in Economics from the University of Geneva. She is fluent in French. |
Patrick Bayliss
Birth Date: September 25, 1968
VICE PRESIDENT
Officer since: August 2014
Portfolio Manager since:
April 2013 | Principal Occupations: Patrick Bayliss has been the Fund's Portfolio Manager since April 2013 . He is Vice President of the Trust with respect to the Fund. Mr. Bayliss joined the Sub-Adviser in October 2013. From 2007 until September 30, 2013, Mr. Bayliss was a member of GML Capital LLP and its Trade Finance Portfolio Team. From April 2013 to September 30, 2013, Mr. Bayliss served as a portfolio manager to the Fund as a member of GML Capital LLP, the sub-adviser to the Fund during that time period. Mr. Bayliss began his career in 1990 at Saudi International Bank (now Gulf International Bank) where he became a Fund Manager, managing quantitative equity portfolios. This was followed by period at Deutsche Bank's credit trading in the Emerging Markets Division. Before joining GML Capital LLP, Mr. Bayliss was a co-founder of LTP Trade, a specialist trade finance company, and a Portfolio Manager at Bluecrest Capital Management. Mr. Bayliss holds a BSc (Econ) from Bristol University, U.K. |
Annual Shareholder Report
Evaluation and Approval of Advisory Contract–May 2014
Federated Project and Trade Finance Core Fund (the “Fund”)
Following a review and recommendation of approval by the Fund's independent trustees, the Fund's Board reviewed and approved at its May 2014 meetings the Fund's investment advisory and subadvisory contracts for an additional one-year term. The Board's decision regarding these contracts reflects the exercise of its business judgment on whether to continue the existing arrangements. The Fund is distinctive in that it is designed for the efficient management of a particular asset class and is made available for investment only to other Federated funds and a limited number of other accredited investors. Although the Adviser charges the Fund an investment advisory fee for its services, the Adviser has agreed to waive its fee and/or reimburse the Fund so that total fund expenses are zero. The Adviser or its affiliates may, however, receive compensation for managing assets invested in the Fund.
In this connection, the Federated Funds' Board had previously appointed a Senior Officer, whose duties include specified responsibilities relating to the process by which advisory fees are to be charged to a Federated fund. The Senior Officer has the authority to retain consultants, experts, or staff as may be reasonably necessary to assist in the performance of his duties, reports directly to the Board, and may be terminated only with the approval of a majority of the independent members of the Board. The Senior Officer prepared and furnished to the Board an independent, written evaluation that covered topics discussed below (the “Evaluation”). The Board considered that Evaluation, along with other information, in deciding to approve the advisory and subadvisory contracts.
As previously noted, the Adviser charges the Fund an investment advisory fee for its services but has agreed to waive its fee and/or reimburse the Fund so that total fund expenses are zero; however, the Board did consider compensation and benefits received by the Adviser and subadviser, including fees received for services provided to the Fund by other entities in the Federated organization and research services received by the Adviser from brokers that execute Federated fund trades. The Board is also familiar with and considered judicial decisions concerning allegedly excessive investment advisory fees which have indicated that the following factors may be relevant to an Adviser's fiduciary duty with respect to its receipt of compensation from a fund: the nature and quality of the services provided by the Adviser to a fund and its shareholders, including the performance and expenses of the fund and of comparable funds; the Adviser's cost of providing the services, including the profitability to the Adviser of providing advisory services to a fund; the extent to which the Adviser may realize “economies of scale” as a fund grows larger and, if such economies exist, whether they have been shared with a fund and its shareholders or the family of funds; any “fall-out financial benefits” that accrue to the Adviser because of its relationship with a fund (including research services received from brokers that execute fund trades and any fees paid to affiliates of the Adviser for services rendered to a fund); comparative fee structures, including a comparison of fees paid to the Adviser with those paid by similar funds; and the extent of care, conscientiousness and independence with which the Board members perform their duties and their expertise, including whether they are fully informed about all facts the Board deems relevant to its consideration of the Adviser's services and fees. The Board noted that SEC disclosure requirements regarding the basis for the Board's approval of the Fund's advisory contract generally track the factors listed above. Consistent with these judicial decisions, and SEC disclosure requirements, the Board also considered management fees charged to institutional and other clients of the Adviser and subadviser for what might be viewed as like services. The Board was aware of these factors and was guided by them in its review of the Fund's advisory and subadvisory contracts to the extent it considered them to be appropriate and relevant, as discussed further below.
The Board considered and weighed these circumstances in light of its substantial accumulated experience in governing the Fund and working with Federated on matters relating to the Federated funds, and was assisted in its deliberations by independent legal counsel. Throughout the year and in connection with its May meetings, the Board requested and received substantial and detailed information about the Fund and the Federated organization that was in addition to the extensive materials that comprise and accompany the Senior Officer's Evaluation. Federated provided much of this information at each regular meeting of the Board, and furnished additional substantial information in connection with the May meeting at which the Board's formal review of the advisory and subadvisory contracts occurred. At this May meeting, senior management of the Adviser also met with the independent trustees and their counsel to discuss the materials presented and any other matters thought relevant by the Adviser or the trustees. Between regularly scheduled meetings, the Board also received information on particular matters as the need arose. Thus, the Board's consideration of the advisory and subadvisory contracts included review of the Senior Officer's Evaluation, accompanying data and additional information covering such matters as: the Adviser's and subadviser's investment philosophy, revenue, profitability, personnel and processes; investment and operating strategies; the Fund's short- and long-term performance (in absolute terms, both on a gross basis and net of expenses, as well as in relationship to its particular investment program and certain competitor or “peer group” funds and/or other benchmarks, as appropriate), and comments on the reasons for performance; the Fund's investment objectives; the Fund's expenses (including the advisory fee itself and the overall expense structure of the Fund, both in absolute terms and relative to similar and/or competing funds, with due regard for contractual or voluntary expense limitations); the use and allocation of brokerage commissions derived from trading the Fund's portfolio securities (if any);
Annual Shareholder Report
and the nature, quality and extent of the advisory and other services provided to the Fund by the Adviser and its affiliates. The Board also considered the preferences and expectations of Fund shareholders; the entrepreneurial risk assumed by the Adviser in sponsoring the funds; the continuing state of competition in the mutual fund industry and market practices; the range of comparable fees for similar funds in the mutual fund industry; the Fund's relationship to the Federated family of funds which include a comprehensive array of funds with different investment objectives, policies and strategies which are available for exchange without the incurrence of additional sales charges; compliance and audit reports concerning the Federated funds and the Federated companies that service them (including communications from regulatory agencies), as well as Federated's responses to any issues raised therein; and relevant developments in the mutual fund industry and how the Federated funds and/or Federated are responding to them. The Board's evaluation process is evolutionary. The criteria considered and the emphasis placed on relevant criteria change in recognition of changing circumstances in the mutual fund marketplace.
The Fund's ability to deliver competitive performance when compared to its benchmark index was also deemed to be relevant by the Board as a useful indicator of how the Adviser is executing the Fund's investment program, which in turn was one of the Board's considerations in reaching a conclusion that the nature, extent, and quality of the Adviser's investment management services were such as to warrant continuation of the advisory and subadvisory contracts.
The Board was informed by the Adviser that, for the periods covered by the Evaluation, the Fund outperformed its benchmark index for the one-year period and outperformed its benchmark index for the three-year period.
Because the Fund's expenses will remain at zero due to waiver of the investment advisory fee and/or reimbursement of other expenses, the Fund's Board does not consider fee comparisons to other mutual funds or other institutional or separate accounts to be relevant.
The Board also received financial information about Federated, including information regarding the compensation and benefits Federated derived from its relationships with the Federated funds. This information covered not only the fees under the advisory contracts, but also fees received by Federated's subsidiaries for providing other services to the Federated funds under separate contracts (e.g., for serving as the Federated funds' administrator). The information also detailed any indirect benefit Federated may derive from its receipt of research services from brokers who execute Federated fund trades. In addition, the Board considered the fact that, in order for a fund to be competitive in the marketplace, Federated and its affiliates frequently waived fees and/or reimbursed other expenses and have disclosed to fund investors and/or indicated to the Board their intention to do so in the future, where appropriate. Moreover, the Board receives regular reporting as to the institution, adjustment or elimination of these voluntary waivers. In addition, following discussions regarding the Senior Officer's May 2013 recommendations, Federated made meaningful reductions to gross advisory fees for several funds. At the Board meeting in May 2014, the Senior Officer proposed, and the Board approved, reductions in the contractual advisory fees of certain other funds.
The Board and the Senior Officer also reviewed information compiled by Federated comparing profitability information for Federated to other publicly held fund management companies. In this regard, the Senior Officer concluded that Federated's profit margins did not appear to be excessive.
The Senior Officer noted that, subject to the comments and recommendations made within his Evaluation, his observations and the information accompanying the Evaluation supported a finding by the Board that the management fees for each of the funds were reasonable. Under these circumstances, no changes were recommended to, and no objection was raised to, the continuation of the Fund's advisory and subadvisory contracts.
The Board based its decision to approve the advisory and subadvisory contracts on the totality of the circumstances and relevant factors and with a view to past and future long-term considerations. Not all of the factors and considerations identified above were necessarily relevant to the Fund, nor did the Board consider any one of them to be determinative. In particular, due to the unusual nature of the Fund as primarily an internal product with no net advisory fee, the Board does not consider the assessment of whether economies of scale would be realized if the Fund were to grow to some sufficient size to be relevant. With respect to the factors that were relevant, the Board's decision to approve the contracts reflects its determination that Federated's performance and actions provided a satisfactory basis to support the decision to continue the existing arrangements.
Annual Shareholder Report
Voting Proxies on Fund Portfolio Securities
A description of the policies and procedures that the Fund uses to determine how to vote proxies, if any, relating to securities held in the Fund's portfolio, as well as a report on “Form N-PX” of how the Fund voted any such proxies during the most recent 12-month period ended June 30, are available, without charge and upon request, by calling 1-800-341-7400. These materials are also available at the SEC's website at www.sec.gov.
Quarterly Portfolio Schedule
The Fund files with the SEC a complete schedule of its portfolio holdings, as of the close of the first and third quarters of its fiscal year, on “Form N-Q.” These filings are available on the SEC's website at www.sec.gov and may be reviewed and copied at the SEC's Public Reference Room in Washington, DC. (Call 1-800-SEC-0330 for information on the operation of the Public Reference Room.)
Annual Shareholder Report
The Fund is not a bank deposit or obligation, is not guaranteed by any bank and is not insured or guaranteed by the U.S. government, the Federal Deposit Insurance Corporation, the Federal Reserve Board or any other government agency. Investment in the Fund involves investment risk, including the possible loss of principal.
This Report is authorized for distribution to prospective investors only when preceded or accompanied by the Fund's Confidential Private Offering Memorandum, which contains facts concerning its objective and policies, management fees, expenses and other information.
Federated Project and Trade Finance Core Fund
Federated Investors Funds
4000 Ericsson Drive
Warrendale, PA 15086-7561
Contact us at FederatedInvestors.com
or call 1-800-341-7400.
Federated Securities Corp., Placement Agent
CUSIP 31415N103
Q450320 (5/15)
Federated is a registered trademark of Federated Investors, Inc.
2015 ©Federated Investors, Inc.
Item 2. Code of Ethics
(a) As of the end of the period covered by this report, the registrant has adopted a code of ethics (the "Section 406 Standards for Investment Companies - Ethical Standards for Principal Executive and Financial Officers") that applies to the registrant's Principal Executive Officer and Principal Financial Officer; the registrant's Principal Financial Officer also serves as the Principal Accounting Officer.
(c) There was no amendment to the registrant’s code of ethics described in Item 2(a) above during the period covered by the report.
(d) There was no waiver granted, either actual or implicit, from a provision to the registrant’s code of ethics described in Item 2(a) above during the period covered by the report.
(e) Not Applicable
(f)(3) The registrant hereby undertakes to provide any person, without charge, upon request, a copy of the code of ethics. To request a copy of the code of ethics, contact the registrant at 1-800-341-7400, and ask for a copy of the Section 406 Standards for Investment Companies - Ethical Standards for Principal Executive and Financial Officers.
Item 3. Audit Committee Financial Expert
The registrant's Board has determined that each of the following members of the Board's Audit Committee is an “audit committee financial expert,” and is "independent," for purposes of this Item: John T. Collins, Thomas M. O'Neill and John S. Walsh.
Item 4. Principal Accountant Fees and Services
(a) Audit Fees billed to the registrant for the two most recent fiscal years:
Fiscal year ended 2015 - $124,400
Fiscal year ended 2014 – $93,000
(b) Audit-Related Fees billed to the registrant for the two most recent fiscal years:
Fiscal year ended 2015 - $0
Fiscal year ended 2014 - $0
Amount requiring approval of the registrant’s audit committee pursuant to paragraph (c)(7)(ii) of Rule 2-01 of Regulation S-X, $0 and $0 respectively.
(c) Tax Fees billed to the registrant for the two most recent fiscal years:
Fiscal year ended 2015 - $0
Fiscal year ended 2014 – $0
Amount requiring approval of the registrant’s audit committee pursuant to paragraph (c)(7)(ii) of Rule 2-01 of Regulation S-X, $0 and $0 respectively.
(d) All Other Fees billed to the registrant for the two most recent fiscal years:
Fiscal year ended 2015 - $0
Fiscal year ended 2014 – $0
Amount requiring approval of the registrant’s audit committee pursuant to paragraph (c)(7)(ii) of Rule 2-01 of Regulation S-X, $0 and $0 respectively.
(e)(1) Audit Committee Policies regarding Pre-approval of Services.
The Audit Committee is required to pre-approve audit and non-audit services performed by the independent auditor in order to assure that the provision of such services do not impair the auditor’s independence. Unless a type of service to be provided by the independent auditor has received general pre-approval, it will require specific pre-approval by the Audit Committee. Any proposed services exceeding pre-approved cost levels will require specific pre-approval by the Audit Committee.
Certain services have the general pre-approval of the Audit Committee. The term of the general pre-approval is 12 months from the date of pre-approval, unless the Audit Committee specifically provides for a different period. The Audit Committee will annually review the services that may be provided by the independent auditor without obtaining specific pre-approval from the Audit Committee and may grant general pre-approval for such services. The Audit Committee will revise the list of general pre-approved services from time to time, based on subsequent determinations. The Audit Committee will not delegate its responsibilities to pre-approve services performed by the independent auditor to management.
The Audit Committee has delegated pre-approval authority to its Chairman. The Chairman will report any pre-approval decisions to the Audit Committee at its next scheduled meeting. The Committee will designate another member with such pre-approval authority when the Chairman is unavailable.
AUDIT SERVICES
The annual Audit services engagement terms and fees will be subject to the specific pre-approval of the Audit Committee. The Audit Committee must approve any changes in terms, conditions and fees resulting from changes in audit scope, registered investment company (RIC) structure or other matters.
In addition to the annual Audit services engagement specifically approved by the Audit Committee, the Audit Committee may grant general pre-approval for other Audit Services, which are those services that only the independent auditor reasonably can provide. The Audit Committee has pre-approved certain Audit services, all other Audit services must be specifically pre-approved by the Audit Committee.
AUDIT-RELATED SERVICES
Audit-related services are assurance and related services that are reasonably related to the performance of the audit or review of the Company’s financial statements or that are traditionally performed by the independent auditor. The Audit Committee believes that the provision of Audit-related services does not impair the independence of the auditor, and has pre-approved certain Audit-related services, all other Audit-related services must be specifically pre-approved by the Audit Committee.
TAX SERVICES
The Audit Committee believes that the independent auditor can provide Tax services to the Company such as tax compliance, tax planning and tax advice without impairing the auditor’s independence. However, the Audit Committee will not permit the retention of the independent auditor in connection with a transaction initially recommended by the independent auditor, the purpose of which may be tax avoidance and the tax treatment of which may not be supported in the Internal Revenue Code and related regulations. The Audit Committee has pre-approved certain Tax services, all Tax services involving large and complex transactions must be specifically pre-approved by the Audit Committee.
ALL OTHER SERVICES
With respect to the provision of services other than audit, review or attest services the pre-approval requirement is waived if:
| (1) | The aggregate amount of all such services provided constitutes no more than five percent of the total amount of revenues paid by the registrant, the registrant’s adviser (not including any sub-adviser whose role is primarily portfolio management and is subcontracted with or overseen by another investment adviser), and any entity controlling, controlled by, or under common control with the investment adviser that provides ongoing services to the registrant to its accountant during the fiscal year in which the services are provided; |
| (2) | Such services were not recognized by the registrant, the registrant’s adviser (not including any sub-adviser whose role is primarily portfolio management and is subcontracted with or overseen by another investment adviser), and any entity controlling, controlled by, or under common control with the investment adviser that provides ongoing services to the registrant at the time of the engagement to be non-audit services; and |
| (3) | Such services are promptly brought to the attention of the Audit Committee of the issuer and approved prior to the completion of the audit by the Audit Committee or by one or more members of the Audit Committee who are members of the board of directors to whom authority to grant such approvals has been delegated by the Audit Committee. |
The Audit Committee may grant general pre-approval to those permissible non-audit services classified as All Other services that it believes are routine and recurring services, and would not impair the independence of the auditor.
The SEC’s rules and relevant guidance should be consulted to determine the precise definitions of prohibited non-audit services and the applicability of exceptions to certain of the prohibitions.
PRE-APPROVAL FEE LEVELS
Pre-approval fee levels for all services to be provided by the independent auditor will be established annually by the Audit Committee. Any proposed services exceeding these levels will require specific pre-approval by the Audit Committee.
PROCEDURES
Requests or applications to provide services that require specific approval by the Audit Committee will be submitted to the Audit Committee by both the independent auditor and the Principal Accounting Officer and/or Internal Auditor, and must include a joint statement as to whether, in their view, the request or application is consistent with the SEC’s rules on auditor independence.
(e)(2) Percentage of services identified in items 4(b) through 4(d) that were approved by the registrants audit committee pursuant to paragraph (c)(7)(i)(C) of Rule 2-01 of Regulation S-X:
4(b)
Fiscal year ended 2015 – 0%
Fiscal year ended 2014 – 0%
Percentage of services provided to the registrants investment adviser and any entity controlling, controlled by, or under common control with the investment adviser that provides ongoing services to the registrant that were approved by the registrants audit committee pursuant to paragraph (c)(7)(i)(C) of Rule 2-01 of Regulation S-X, 0% and NA respectively.
4(c)
Fiscal year ended 2015 – 0%
Fiscal year ended 2014 – 0%
Percentage of services provided to the registrants investment adviser and any entity controlling, controlled by, or under common control with the investment adviser that provides ongoing services to the registrant that were approved by the registrants audit committee pursuant to paragraph (c)(7)(i)(C) of Rule 2-01 of Regulation S-X, 0% and NA respectively.
4(d)
Fiscal year ended 2015 – 0%
Fiscal year ended 2014 – 0%
Percentage of services provided to the registrants investment adviser and any entity controlling, controlled by, or under common control with the investment adviser that provides ongoing services to the registrant that were approved by the registrants audit committee pursuant to paragraph (c)(7)(i)(C) of Rule 2-01 of Regulation S-X, 0% and NA respectively.
| (g) | Non-Audit Fees billed to the registrant, the registrant’s investment adviser, and certain entities controlling, controlled by or under common control with the investment adviser: |
Fiscal year ended 2015 - $15,972
Fiscal year ended 2014 - $0
(h) The registrant’s Audit Committee has considered that the provision of non-audit services that were rendered to the registrant’s adviser (not including any sub-adviser whose role is primarily portfolio management and is subcontracted with or overseen by another investment adviser), and any entity controlling, controlled by, or under common control with the investment adviser that provides ongoing services to the registrant that were not pre-approved pursuant to paragraph (c)(7)(ii) of Rule 2-01 of Regulation S-X is compatible with maintaining the principal accountant’s independence.
Item 5. Audit Committee of Listed Registrants
Not Applicable
Item 6. Schedule of Investments
(a) The registrant’s Schedule of Investments is included as part of the Report to Stockholders filed under Item 1 of this form.
(b) Not Applicable; Fund had no divestments during the reporting period covered since the previous Form N-CSR filing.
Item 7. Disclosure of Proxy Voting Policies and Procedures for Closed-End Management Investment Companies
Item 8. Portfolio Managers of Closed-End Management Investment Companies
Item 9. Purchases of Equity Securities by Closed-End Management Investment Company and Affiliated Purchasers
Item 10. Submission of Matters to a Vote of Security Holders
No Changes to Report
Item 11. Controls and Procedures
(a) The registrant’s President and Treasurer have concluded that the
registrant’s disclosure controls and procedures (as defined in rule 30a-3(c) under the Act) are effective in design and operation and are sufficient to form the basis of the certifications required by Rule 30a-(2) under the Act, based on their evaluation of these disclosure controls and procedures within 90 days of the filing date of this report on Form N-CSR.
(b) There were no changes in the registrant’s internal control over financial reporting (as defined in rule 30a-3(d) under the Act) during the second fiscal quarter of the period covered by this report that have materially affected, or are reasonably likely to materially affect, the registrant’s internal control over financial reporting.
Item 12. Exhibits
(a)(1) Code of Ethics- Not Applicable to this Report.
(a)(2) Certifications of Principal Executive Officer and Principal Financial Officer.
(a)(3) Not Applicable.
(b) Certifications pursuant to 18 U.S.C. Section 1350.
SIGNATURES
Pursuant to the requirements of the Securities Exchange Act of 1934 and the Investment Company Act of 1940, the registrant has duly caused this report to be signed on its behalf by the undersigned, thereunto duly authorized.
Registrant Federated Core Trust III
By /S/ Lori A. Hensler
Lori A. Hensler, Principal Financial Officer
Date May 28, 2015
Pursuant to the requirements of the Securities Exchange Act of 1934 and the Investment Company Act of 1940, this report has been signed below by the following persons on behalf of the registrant and in the capacities and on the dates indicated.
By /S/ J. Christopher Donahue
J. Christopher Donahue, Principal Executive Officer
Date May 28, 2015
By /S/ Lori A. Hensler
Lori A. Hensler, Principal Financial Officer
Date May 28, 2015