United States
Securities and Exchange Commission
Washington, D.C. 20549
Form N-CSR
Certified Shareholder Report of Registered Management Investment Companies
811-22217
(Investment Company Act File Number)
Federated Core Trust III
_______________________________________________________________
(Exact Name of Registrant as Specified in Charter)
Federated Hermes Funds
4000 Ericsson Drive
Warrendale, Pennsylvania 15086-7561
(Address of Principal Executive Offices)
(412) 288-1900
(Registrant's Telephone Number)
Peter J. Germain, Esquire
1001 Liberty Avenue
Pittsburgh, Pennsylvania 15222-3779
(Name and Address of Agent for Service)
(Notices should be sent to the Agent for Service)
Date of Fiscal Year End:03/31/20
Date of Reporting Period:03/31/20
| Item 1. | Reports to Stockholders |

Annual Shareholder Report
March 31, 2020
Federated Project and Trade Finance Core Fund
A Portfolio of Federated Core Trust III
IMPORTANT NOTICE REGARDING REPORT DELIVERY
Beginning on January 1, 2021, as permitted by regulations adopted by the Securities and Exchange Commission, paper copies of the Fund's shareholder reports like this one will no longer be sent by mail, unless you specifically request paper copies of the reports from the Fund or from your financial intermediary, such as a broker-dealer or bank. Instead, the reports will be made available on a website, and you will be notified by mail each time a report is posted and provided with a website link to access the report.
If you already elected to receive shareholder reports electronically, you will not be affected by this change and you need not take any action. You may elect to receive shareholder reports and other communications from the Fund or your financial intermediary electronically by contacting your financial intermediary (such as a broker-dealer or bank); other shareholders may call the Fund at 1-800-341-7400, Option 4.
You may elect to receive all future reports in paper free of charge. You can inform the Fund or your financial intermediary that you wish to continue receiving paper copies of your shareholder reports by contacting your financial intermediary (such as a broker-dealer or bank); other shareholders may call the Fund at 1-800-341-7400, Option 4. Your election to receive reports in paper will apply to all funds held with the Fund complex or your financial intermediary.
Not FDIC Insured ■ May Lose Value ■ No Bank Guarantee
CONTENTS
| 1 |
| 4 |
| 5 |
| 11 |
| 12 |
| 13 |
| 14 |
| 15 |
| 16 |
| 22 |
| 23 |
| 24 |
| 28 |
| 31 |
| 31 |
Management's Discussion of Fund Performance (unaudited)
The total return of Federated Project and Trade Finance Core Fund (the “Fund”),1 based on net asset value for the 12-month reporting period ended March 31, 2020, was 0.74% compared to a return of 2.13% for the ICE BofAML US Dollar 1-Month Deposit Offered Rate Constant Maturity Index(ICE1MDOR),2 the Fund's benchmark. The Fund's assets typically pay interest based on a spread to 1-month LIBOR, a global reference rate for short-term interest rates, and the weighted average life of the Fund's portfolio was 13.22 months as of the end of the reporting period. The Fund's total return for the most recently completed fiscal year reflected actual cash flows, transaction costs and other expenses which were not reflected in the total return of ICE1MDOR.
During the reporting period, the most significant factors affecting the Fund's performance relative to ICE1MDOR were: (1) the selection of individual securities within each sector and sector diversification; (2) stable spreads in the market (for most of the reporting period); (3) cash levels; and (4) the sell-off in risk assets due to the COVID-19 pandemic.
Market Overview
As of the end of the reporting period, the COVID-19 pandemic caused a level of volatility and uncertainty in financial markets that is unprecedented in recent memory. This is not only just a financial markets event but also a global health crisis that is causing both the public and private sectors to take exceptional steps to protect all stakeholders. Global companies are dealing with the multi-faceted impact of a massive decrease in demand, supply chain disruptions, and a devaluation of almost all primary good inputs and financial market assets.
The trade finance market intends to mitigate some of the risks associated with cross border flows so that essential goods continue to get from producers to suppliers. During the financial crisis in 2008, it was the structured or risk mitigated trade finance market that kept these flows intact. In April 2009, as a result of the 2008 Financial Crisis, the G20 committed $400 billion to support trade and economic development. The G8 communique of June 2009 stated: “The rapid implementation of the trade finance support announced in April in London is essential in restoring international trade flows, particularly to emerging and developing countries.”
In the global economy of $87 trillion, a total of $19 trillion worth of goods are subject to cross border trade. Decrease in economic activity has a significant impact on trade volumes. The impact of COVID-19 is hard to estimate, but the 2008 financial crisis, in our view, serves as a reference point when global GDP contraction of 2% led to a 10% decrease in trade.
A recovery in global trade volume is usually as steep as a decline, as evidenced by an example of China: the number of vessels calling at Chinese ports has returned to normal levels shortly after the country contained the outbreak.
A significant difference between the financial crisis of 2008 and the COVID-19 outbreak of 2020 is the impact the latter has on the trade supply chain. In particular, there has been short-term demand spikes caused by hoarding, logistical disruptions due to regional or country-wide lockdowns, staff quarantines and closed borders.
According to the United Nations Conference on Trade and Development, about 80% of global trade volume is carried by sea and handled by ports worldwide. While the World Trade Organization's economists were still estimating 2020 global trade growth/contraction (report expected in several weeks), the effects of the COVID-19 outbreak were evident in seaborne cargo and commodity prices. While containerized volumes in and out of China have recovered since February, there has been an increased number of cancelled sailings from China to the U.S. and Europe at very short notice. The idle fleet share has reached 10% in March from about 3% in October, which could be an early warning sign of demand falling off. As the world shuts down, current cargo at sea is likely prepaid goods tracking old demand. We expect a significant drop in total volumes in Q2. The dry bulk market has been hit significantly due to the Chinese economy slowdown with the Baltic Dry Index dropping to a four-year low in February.
According to the International Air Transport Association, airlines transport over 52 million metric tons of goods a year or $6.8 trillion, which represents greater than 35% of global trade by value but less than 1% of world trade by volume. This includes precious metals, such as gold, palladium and platinum, which are mostly shipped by air as the safest mode of transportation. Around half of air cargo volume is shipped in the hold of passenger as opposed to freight planes. Given the COVID-19 outbreak and lockdowns imposed, only 20% of last year's passenger wide body capacity is currently flying. This means that total capacity has decreased by 35% globally during the reporting period and is 60% lower on some of the main routes such as Europe to Africa during the reporting period. The above, combined with a short-term demand uptick for medical supplies, led to a significant increase in air freight rates. For example, TAC Air Cargo Index for Shanghai-North America route expanded from $2.6/kg to $6.5/kg during the reporting period. Reportedly, to address capacity constraints, a number of major airlines have made passenger aircraft in their fleets available for chartered cargo operations.
The effect of the COVID-19 slowdown can be seen across a number of industries that commonly utilize trade finance. This is observed across the metals and mining industry with prices dropping across the board, with gold and palladium the rare exceptions. Despite the Chinese economy restarting, the future of iron ore is uncertain, given industrial shutdowns in the rest of the world, in particular, in Japan, South Korea and Europe.
Annual Shareholder Report
In energy, the higher production of crude coupled with reduced global demand (the drop could be as high as 18-20 million barrels/day–20% of global consumption) turned crude market structure into contango with spot prices hitting record lows during the reporting period and traders hunting for tank and floating storage to monetize the market structure. It is estimated that at current levels, one day of global oil production is stored every 10 days. This will most likely lead to a scenario where normalization in energy markets significantly lags other markets. Normally, low energy prices have a net positive effect on global economy by decreasing industrial production costs and allowing consumers to spend more on other categories. With a large part of the world in lockdown, this positive effect might be dampened.
Agricultural commodities and food security have also been in the headlines as a result of the COVID-19 slowdown. Following imposition of export restrictions on wheat by Kazakhstan and rice by Vietnam, a number of media reports raised concern that countries will close borders and exports of cereals will stop. With current ample stocks and expected production estimated to grow by 2.2% in 2020/2021 (according to International Grains Council), the grain balance sheet has, in our view, significant surplus in key exporting countries. The availability is evidenced by the global grain prices, which are nowhere near 2010 (Russia export ban following a devastating wildfire) and 2012 (U.S. drought). If imposed at all, we expect export quotas (in the case of a bad Northern Hemisphere crop starting in summer 2020) rather than outright bans.
As a result, the official community has started to take action. Although International Monetary Fund programs have been widely followed in the mainstream press, there are trade finance specific programs as well. A number of multilateral development banks such as International Finance Corporation (IFC) (part of World Bank) are confirming additional capital commitments available to moderate and address COVID-19 impact. Thus, there is $2 billion in Global Trade Finance and $2 billion in Critical Commodities Finance programs currently from IFC as part of the total $8 billion COVID-19 package.
SECURITY SELECTION AND SECTOR DIVERSIFICATION
The Fund was invested in a portfolio of trade finance-related assets that was widely diversified over geographic regions and sectors. Regionally, the Fund, as of the end of the reporting period, was invested 35.10% in Sub-Saharan Africa, 13.52% in Asia, 13.08% in Middle East/North Africa, 11.35% in Eastern Europe, 8.75% in Latin America, 8.10% in Western Europe, 2.87% in North America and held a 7.22% cash position. The countries represented in those regions in which the Fund held investments include: Angola, Argentina, Armenia, Azerbaijan, Bahamas, Bahrain, Brazil, Burkina Faso, Chad, Colombia, Republic of Congo, Denmark, Ecuador, Egypt, Ethiopia, Gambia, Georgia, Ghana, India, Indonesia, Ireland, Italy, Ivory Coast, Jordan, Kazakhstan, Kenya, Kuwait, Lebanon, Maldives, Morocco, Nigeria, Oman, Pakistan, Paraguay, Qatar, Russia, Rwanda, Saudi Arabia, Senegal, Singapore, South Africa, Sri Lanka, Suriname, Tanzania, Thailand, Tunisia, Turkey, Ukraine, U.K., U.S., Uruguay and Zambia. The sector diversification of the Fund at the end of the reporting period was as follows: 31.04% Energy, 14.49% Foreign Sovereign, 11.39% Consumer Goods, 10.06% Basic Industry, 8.93% Banking, 5.44% Utilities, 4.62% Supranational, 4.57% Transportation, 1.19% Telecommunications, 0.71% Services, 0.29% Capital Goods, 0.04% Retail and 7.22% in cash.
The Fund's broad diversification on both a regional and sector basis made a positive contribution to Fund performance on an absolute basis and relative to ICE1MDOR, while the impact from the COVID-19 pandemic was the largest detractor from Fund performance.
MARKET SPREADS
Spreads in the market remained stable; however, ICE1MDOR decreased during the reporting period resulting in an average coupon of 3.95% for transactions in the Fund.
| 1 | Federated Project and Trade Finance Core Fund is NOT a mutual fund. The Fund operates as an open-end extended payment fund. Shareholders of the Fund will have a restricted ability to redeem shares of the Fund (“Shares”). When a redeeming shareholder presents Shares to the transfer agent in proper order for redemption, the Fund has up to thirty-one (31) days to make payment to the redeeming shareholder. The price of the redeemed Shares will be determined as of the closing net asset value (NAV) of the Fund twenty-four (24) days after receipt of a shareholder redemption request or if such date is a weekend or holiday, on the preceding business day (the “Redemption Pricing Date”). Under normal circumstances, the Fund will make payment to the redeeming shareholder one business day after the Redemption Pricing Date (the “Redemption Payment Date”). However, the Fund reserves the right to make payment up to seven (7) days after the Redemption Pricing Date, provided such date does not exceed thirty-one (31) days after the Shares have been presented for redemption in proper order. Shareholders that redeem Shares will incur the risk that the value of their Shares presented for redemption will be worth less on the Redemption Pricing Date than on the date they submitted their redemption request. |
| 2 | Please see the footnotes to the line graphs under “Fund Performance and Growth of a $10,000 Investment” below for the definition of, and more information about, the ICE1MDOR. |
Annual Shareholder Report
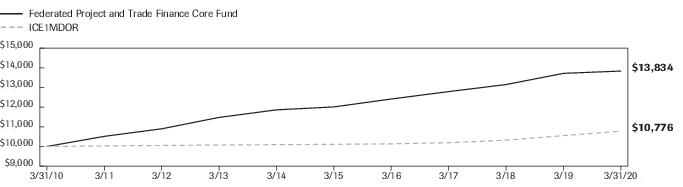
FUND PERFORMANCE AND GROWTH OF A $10,000 INVESTMENT
The graph below illustrates the hypothetical investment of $10,0001 in the Federated Project and Trade Finance Core Fund from March 31, 2010 to March 31, 2020, compared to the ICE BofAML US Dollar 1-Month Deposit Offered Rate Constant Maturity Index(ICE1MDOR).2 The Average Annual Total Return table below shows returns averaged over the stated periods.
Growth of a $10,000 Investment
Growth of $10,000 as of March 31, 2020
| Federated Project and Trade Finance Core Fund | | NA | ICE1MDOR |
| F | NA | I |
| 3/31/2010 | 10,000 | | 10,000 |
| 3/31/2011 | 10,515 | | 10,028 |
| 3/31/2012 | 10,899 | | 10,052 |
| 3/31/2013 | 11,477 | | 10,075 |
| 3/31/2014 | 11,862 | | 10,094 |
| 3/31/2015 | 12,011 | | 10,110 |
| 3/31/2016 | 12,413 | | 10,135 |
| 3/31/2017 | 12,790 | | 10,192 |
| 3/31/2018 | 13,147 | | 10,321 |
| 3/31/2019 | 13,717 | | 10,552 |
| 3/31/2020 | 13,834 | | 10,776 |
41 graphic description end -->
Average Annual Total Returnsfor the Period Ended 3/31/2020
| | 1 Year | 5 Years | 10 Years |
| Fund | 0.74% | 2.87% | 3.30% |
| ICE1MDOR | 2.13% | 1.28% | 0.75% |
Performance data quoted represents past performance which is no guarantee of future results. Investment return and principal value will fluctuate so that an investor's shares, when redeemed, may be worth more or less than their original cost. Fund performance changes over time and current performance may be lower or higher than what is stated. For current to the most recent month-end performance and after-tax returns, current shareholders may call 1-800-341-7400. Returns shown do not reflect the deduction of taxes that a shareholder would pay on Fund distributions or the redemption of Fund shares.
| 1 | The Fund's performance assumes the reinvestment of all dividends and distributions. |
| 2 | ICE1MDOR is an independent calculation of the ICE BofAML 1-Month LIBOR. ICE1MDOR is a widely used benchmark for short-term interest rates, providing an indication of the average rates at which LIBOR panel banks could obtain wholesale, unsecured funding for set periods in particular currencies. ICE1MDOR is not adjusted to reflect sales charges, expenses or other fees that the SEC requires to be reflected in the Fund's performance. The index is unmanaged and unlike the Fund, is not affected by cash flows. It is not possible to invest directly in an index. |
Annual Shareholder Report
Portfolio of Investments Summary Table (unaudited)
At March 31, 2020, the Fund's portfolio composition1 was as follows:
| Security Type | Percentage of
Total Net Assets |
| Trade Finance Agreements | 90.6% |
| Derivative Contracts2 | 0.3% |
| Cash Equivalents3 | 7.2% |
| Other Assets and Liabilities—Net4 | 1.9% |
| TOTAL | 100.0% |
| 1 | See the Fund's Private Offering Memorandum and Part B: Information Required in a Statement of Additional Information for a description of these security types. |
| 2 | Based upon net unrealized appreciation (depreciation) or value of the derivative contracts as applicable. Derivative contracts may consist of futures, forwards, options and swaps. The impact of a derivative contract on the Fund's performance may be larger than its unrealized appreciation (depreciation) or value may indicate. In many cases, the notional value or amount of a derivative contract may provide a better indication of the contract's significance to the portfolio. More complete information regarding the Fund's direct investments in derivative contracts, including unrealized appreciation (depreciation), value and notional values or amounts of such contracts, can be found in the table at the end of the Portfolio of Investments included in this Report. |
| 3 | Cash Equivalents include any investments in money market mutual funds and/or overnight repurchase agreements. |
| 4 | Assets, other than investments in securities and derivative contracts, less liabilities. See Statement of Assets and Liabilities. |
Annual Shareholder Report
Portfolio of Investments
March 31, 2020
Principal
Amount
or Shares | | | Acquisition
Date1 | Acquisition
Cost1 | Value in
U.S. Dollars |
| | 1 | TRADE FINANCE AGREEMENTS—90.6% | | | |
| | | Basic Industry - Building Materials—2.8% | | | |
| $16,910,018 | | Southwire Co., LLC, 1.768%, 4/3/2020 | 3/23/2020 | $16,900,880 | $16,910,018 |
| | | Basic Industry - Chemicals—1.1% | | | |
| 2,396,245 | 2 | Kuwait Paraxylen, Revolver, 1.640% (1-month USLIBOR +0.700%), 6/15/2021 | 5/31/2018– 12/11/2019 | 2,378,273 | 2,343,158 |
| 4,390,286 | 2 | Kuwait Paraxylen, Term Loan, 1.640% (1-month USLIBOR +0.700%), 6/15/2021 | 5/31/2018– 10/26/2018 | 4,337,069 | 4,296,035 |
| | | TOTAL | | | 6,639,193 |
| | | Basic Industry - Forestry/Paper—0.7% | | | |
| 4,200,000 | 2 | Bahia Cellulose, 3.611% (1-month USLIBOR +3.000%), 7/18/2023 | 11/20/2017 | 4,201,575 | 4,010,724 |
| | | Basic Industry - Metals/Mining Excluding Steel—2.4% | | | |
| 2,299,363 | 3,4,5,6 | Discovery Copper, 5.134%, 3/1/2015 | 10/20/2014– 9/22/2015 | 2,294,479 | 0 |
| 11,965,910 | 2 | Harmony Gold Mining Co. Ltd., 4.959% (3-month USLIBOR +0.030%), 9/30/2022 | 3/31/2018– 10/2/2019 | 11,973,410 | 11,144,115 |
| 3,472,222 | 2 | Suek Tranche B, 3.923% (1-month USLIBOR +3.000%), 5/17/2022 | 6/15/2017– 11/24/2017 | 3,472,222 | 3,295,568 |
| | | TOTAL | | | 14,439,683 |
| | | Basic Industry - Steel Producers/Products—2.5% | | | |
| 5,000,000 | 2 | Arcelormittal, 3.778% (6-month USLIBOR +1.900%), 12/12/2022 | 12/19/2018– 6/20/2019 | 5,000,000 | 4,731,777 |
| 5,500,000 | 2 | Ferrexpo AG, 6.241% (3-month USLIBOR +4.500%), 11/6/2022 | 3/7/2018– 11/6/2019 | 5,467,094 | 5,204,555 |
| 5,420,865 | 2 | Metinvest BV, 5.361% (1-month USLIBOR +4.750%), 10/18/2022 | 11/19/2018 | 5,260,543 | 5,059,228 |
| | | TOTAL | | | 14,995,560 |
| | | Capital Goods - Aerospace & Defense—0.3% | | | |
| 1,629,632 | 2 | Gulf Air BSC, 4.000% (1-month USLIBOR +3.250%), 1/19/2022 | 3/27/2017 | 1,630,243 | 1,553,604 |
| 208,333 | 2 | TAAG Angola Airlines, 5.690% (3-month USLIBOR +4.950%), 6/9/2020 | 6/16/2014 | 205,156 | 204,257 |
| | | TOTAL | | | 1,757,861 |
| | | Consumer Goods - Food - Wholesale—10.0% | | | |
| 2,600,000 | | Agrofertil, 4.138%, 4/3/2020 | 4/12/2019 | 2,496,740 | 2,597,409 |
| 642,978 | 6 | Banacol, 1.750%, 6/28/2025 | 1/2/2013– 6/28/2017 | 636,615 | 383,987 |
| 8,018,855 | | Dansk Landbrugs Grovvarseslskab AMBA, 1.850%, 4/27/2020 | 3/13/2020 | 8,001,958 | 8,006,165 |
| 9,661,691 | | Egypt, Government of, 4.164% - 4.586%, 6/22/2020 | 5/15/2019– 6/25/2019 | 9,661,692 | 9,612,070 |
| 1,274,302 | | Gambia, Government of, 4.857% - 5.745%, 8/31/2020 | 7/5/2019– 9/5/2019 | 1,274,302 | 1,238,612 |
| 11,428,571 | 2 | Ghana Cocoa Board, 1.539% (1-month USLIBOR +0.550%), 8/31/2020 | 9/30/2019– 12/16/2019 | 11,428,571 | 11,231,547 |
| 1,100,864 | 2,3,6 | GVO, 5.334% (3-month USLIBOR +10.000%), 11/2/2015 | 4/13/2011 | 1,105,045 | 880,691 |
| 4,172,912 | 2 | Metl Group, 3.889% (3-month USLIBOR +2.900%), 8/24/2020 | 6/13/2019– 12/30/2019 | 4,146,444 | 4,147,387 |
| 5,000,000 | 4,5,6 | Molino Canuelas, 9.900%, 12/16/2020 | 12/29/2016 | 4,950,000 | 1,500,000 |
| 10,000,000 | 2 | Olam Nigeria, 2.137% (3-month USLIBOR +1.050%), 6/4/2020 | 2/28/2020 | 10,000,000 | 9,901,026 |
| 4,000,000 | | PT Pacific Indopalm Industries, 3.660%, 5/29/2020 | 5/5/2019– 3/14/2019 | 4,000,000 | 3,949,151 |
| 2,571,429 | 3,4,5,6 | REI Agro Ltd., 7.772%, 10/31/2014 | 10/31/2012– 11/3/2014 | 2,571,429 | 387,000 |
| 1,667,000 | 3,4,5,6 | Seara, 5.844%, 6/15/2017 | 10/29/2014– 12/8/2014 | 1,658,665 | 406,081 |
Annual Shareholder Report
Principal
Amount
or Shares | | | Acquisition
Date1 | Acquisition
Cost1 | Value in
U.S. Dollars |
| | 1 | TRADE FINANCE AGREEMENTS—continued |
| | | Consumer Goods - Food - Wholesale—continued |
| $4,921,053 | 2,4,6 | Vicentin SAIC II, 7.832% (3-month USLIBOR +6.000%), 1/15/2024 | 11/5/2015– 2/21/2018 | $4,904,088 | $3,936,842 |
| 2,500,000 | 2,4,6 | Vicentin SAIC, 6.409% (3-month USLIBOR +4.500%), 5/21/2022 | 5/21/2019 | 2,500,000 | 2,000,000 |
| | | TOTAL | | | 60,177,968 |
| | | Consumer Goods - Personal & Household Products—0.9% | | | |
| 2,565,000 | 2,6 | PT Delta Dunia Sandang Tekstil, 7.194% (3-month USLIBOR +5.000%), 10/10/2021 | 10/6/2016 | 2,541,915 | 1,282,500 |
| 4,096,810 | | PT Pan Brothers TBK, 3.431% - 3.597%, 6/12/2020 | 12/17/2019– 2/12/2020 | 4,096,810 | 4,089,987 |
| | | TOTAL | | | 5,372,487 |
| | | Energy - Exploration & Production—12.1% | | | |
| 10,005 | 3,4,5,6 | Circle Petro, 7.132%, 6/11/2018 | 11/7/2014 | 9,739 | 4,507 |
| 1,556,843 | 2 | FPF003 PTE Ltd. Singapore, Inc., 3.800% (3-month USLIBOR +2.350%), 12/31/2021 | 12/19/2019 | 1,549,058 | 1,517,193 |
| 8,762,473 | 2 | FPF005 PTE Ltd. Singapore, Inc., 4.050% (3-month USLIBOR +2.600%), 8/13/2024 | 12/19/2019 | 8,718,661 | 8,311,036 |
| 10,055,330 | 2 | Heston BV, 3.039% (1-month USLIBOR +2.050%), 8/31/2022 | 11/15/2019 | 10,057,425 | 9,441,625 |
| 5,250,000 | 2 | Kosmos Energy, 3.994% (1-month USLIBOR +3.250%), 3/31/2025 | 9/23/2019 | 5,210,800 | 4,796,195 |
| 13,000,000 | 2 | Petrobras Oil & Gas B.V., 5.916% (12-month USLIBOR +6.500%), 12/5/2024 | 9/27/2019 | 12,902,500 | 12,197,852 |
| 3,386,963 | 2 | SHT, 4.329% (1-month USLIBOR +2.000%), 9/30/2020 | 8/26/2014 | 3,318,528 | 3,312,991 |
| 4,035,537 | 2,6 | SNPC, 6.566% (1-month USLIBOR +4.900%), 3/4/2020 | 7/26/2015– 3/4/2020 | 4,035,537 | 2,035,928 |
| 9,000,000 | 2 | SOCAR Energy '18, 3.894% (12-month USLIBOR +2.200%), 11/8/2023 | 11/26/2019 | 8,947,500 | 8,281,998 |
| 5,892,857 | 2 | SOCAR Energy, 4.951% (6-month USLIBOR +2.400%), 5/22/2020 | 6/10/2019 | 5,892,857 | 5,863,168 |
| 933,334 | 2 | Sonangol Finance Ltd., 5.127% (3-month USLIBOR +3.350%), 10/27/2021 | 4/23/2016 | 924,583 | 827,336 |
| 2,767,157 | 2 | Sonangol, 4.850% (3-month USLIBOR +3.400%), 7/30/2021 | 11/29/2016– 4/3/2017 | 2,668,098 | 2,519,852 |
| 15,000,000 | 2 | Yibal Export Pdo, 3.447% (1-month USLIBOR +1.600%), 6/30/2023 | 7/24/2016– 7/15/2019 | 14,896,750 | 14,261,449 |
| | | TOTAL | | | 73,371,130 |
| | | Energy - Integrated Energy—3.6% | | | |
| 2,275,031 | | Burkina Faso, Government of, 4.212%– 4.246%, 6/8/2020 | 11/28/2019– 12/10/2019 | 2,275,031 | 2,275,031 |
| 18,000,000 | | Puma International Financing SA, 5.870%, 1/20/2023 | 9/30/2019 | 17,352,000 | 16,717,138 |
| 2,760,000 | 2 | Staatsolie Maatschappij Suriname NV, 6.807% (3-month USLIBOR +5.125%), 5/23/2025 | 6/21/2019 | 2,760,000 | 2,589,166 |
| | | TOTAL | | | 21,581,335 |
| | | Energy - Oil Field Equipment & Services—10.1% | | | |
| 15,000,000 | | Ancap OPU, 1.563%, 6/2/2020 | 3/13/2020 | 15,000,000 | 14,960,554 |
| 10,000,000 | | Aramco OPU, 1.286%, 4/27/2020 | 3/13/2020 | 10,000,000 | 9,994,501 |
| 2,189,157 | | Engen Petroleum Ltd., 2.741%, 4/27/2020 | 2/4/2020 | 2,189,157 | 2,188,571 |
| 7,737,888 | | Engen Petroleum Ltd., 2.782%, 4/8/2020 | 2/4/2020 | 8,239,826 | 7,737,273 |
| 11,000,000 | | HPCL Mittal Ltd., 1.711%, 4/28/2020 | 3/18/2020 | 11,000,000 | 10,985,394 |
| 15,515,545 | | Italiana Petroli Spa, 2.046%, 4/20/2020 | 2/19/2020– 2/20/2020 | 15,515,545 | 15,508,206 |
| | | TOTAL | | | 61,374,499 |
| | | Energy - Oil Refining and Marketing—4.2% | | | |
| 5,843,750 | 2 | Dangote, 8.090% (6-month USLIBOR +6.500%), 8/31/2023 | 6/20/2014 - 8/2/2018 | 5,810,000 | 5,535,017 |
| 5,327,284 | | Maldives, Government of, 3.515% - 4.422%, 9/8/2020 | 1/30/2020– 3/26/2020 | 5,327,284 | 5,262,413 |
| 5,000,000 | | Pakistan, Government of, 4.359% - 5.043%, 9/8/2020 | 5/17/2019– 9/10/2019 | 5,000,000 | 4,971,952 |
| 950,404 | | Pakistan, Government of, 4.904% - 4.909%, 4/9/2020 | 4/9/2019– 4/16/2019 | 950,404 | 949,295 |
| 2,065,252 | 3,4,5,6 | Samir Energy II, 5.541%, 12/31/2015 | 5/30/2014 | 2,057,288 | 516,313 |
Annual Shareholder Report
Principal
Amount
or Shares | | | Acquisition
Date1 | Acquisition
Cost1 | Value in
U.S. Dollars |
| | 1 | TRADE FINANCE AGREEMENTS—continued |
| | | Energy - Oil Refining and Marketing—continued |
| $8,250,964 | 2 | Trafigura PTE, 3.603% (1-month USLIBOR +2.000%), 12/31/2020 | 11/27/2019 | $9,167,921 | $8,165,266 |
| | | TOTAL | | | 25,400,256 |
| | | Finance/Banks/Brokers—8.8% | | | |
| 9,000,000 | 2 | ABC International Bank PLC, 2.553% (3-month USLIBOR +0.850%), 8/15/2020 | 8/15/2019 | 9,000,000 | 8,943,679 |
| 5,500,000 | 2 | Banco del Pacifico, 7.158% (3-month USLIBOR +5.000%), 5/15/2024 | 5/21/2019 | 5,500,000 | 5,284,884 |
| 1,666,667 | 2 | Banco Supervielle SA, 4.541% (3-month USLIBOR +2.850%), 11/15/2020 | 6/28/2018 | 1,655,833 | 1,649,729 |
| 13,500,000 | 2 | Doha Bank, 1.484% (3-month USLIBOR +0.700%), 6/12/2020 | 10/8/2019 | 13,500,000 | 13,453,141 |
| 5,000,000 | | Zenith Bank (Ghana) Ltd., 5.404%, 4/17/2020 | 4/16/2019 | 4,997,500 | 4,991,917 |
| 14,000,000 | | Zenith Bank PLC, 3.321%, 8/5/2020 | 9/28/2019 | 14,000,000 | 13,526,896 |
| EUR 5,000,000 | | Ziraat Bankasi, 2.150%, 4/14/2020 | 4/16/2019 | 5,561,553 | 5,510,277 |
| | | TOTAL | | | 53,360,523 |
| | | Foreign Sovereign—14.3% | | | |
| EUR 9,000,000 | 2 | Bank of Industry Ltd.—Central Bank of Nigeria, 4.500% (3-month EURIBOR +4.500%), 2/14/2025 | 3/10/2020– 3/17/2020 | 10,042,427 | 9,524,753 |
| $3,750,000 | 2 | Bank of Industry, 7.847% (3-month USLIBOR +6.000%), 1/21/2021 | 6/5/2016 | 3,750,000 | 3,719,186 |
| 4,375,000 | 2 | Bank of Kigali Ltd., 8.503% (3-month USLIBOR +6.250%), 10/19/2021 | 6/19/2017 | 4,375,000 | 4,179,462 |
| EUR 3,600,000 | | Burkina Faso, Government of, 3.300%, 12/14/2020 | 3/12/2020 | 3,989,340 | 3,888,105 |
| EUR 9,000,000 | 2 | Cote d'Ivoire RC, 2.730% (6-month EURIBOR +0.000%), 7/6/2020 | 1/16/2020 | 10,023,745 | 9,848,452 |
| EUR 8,000,000 | | Cote d'Ivoire, Government of, 4.950%, 12/31/2025 | 9/4/2019 | 8,825,200 | 8,197,061 |
| $2,166,667 | 2 | Ethiopian Railway Corp., 5.941% (6-month USLIBOR +3.750%), 8/1/2021 | 5/4/2017 | 2,166,667 | 2,095,922 |
| 414,000 | | Gambia, Government of, 4.034%, 3/8/2021 | 3/12/2020 | 414,000 | 398,441 |
| 4,166,667 | 2 | JSC Partnership, 5.973% (12-month USLIBOR +4.000%), 9/22/2020 | 10/17/2018 | 4,175,000 | 4,087,363 |
| EUR 4,500,000 | 2 | Kenya, Government of, 6.350% (6-month EURIBOR +6.350%), 3/6/2026 | 1/27/2020 | 5,101,279 | 4,697,769 |
| $7,500,000 | 2 | Kenya, Government of, 7.440% (6-month USLIBOR +6.450%), 2/27/2026 | 4/16/2019 | 7,465,000 | 6,885,444 |
| 3,571,428 | 2 | Ministry of Finance Tanzania, 7.116% (6-month USLIBOR +5.200%), 6/23/2022 | 6/26/2019 | 3,550,000 | 3,440,458 |
| 1,000,000 | 2 | Ministry of Finance Zambia, 7.879% (6-month USLIBOR +6.000%), 7/13/2020 | 7/17/2017 | 1,000,000 | 939,633 |
| EUR 4,500,000 | | Senegal, Government of, 4.800%, 6/10/2020 | 2/4/2019 | 5,244,665 | 4,935,950 |
| $3,334,000 | 2 | Sri Lanka, Government of, 4.559% (6-month USLIBOR +2.000%), 5/26/2020 | 9/12/2017 | 3,320,839 | 3,046,666 |
| 17,000,000 | | Turk Eximbank, 2.796%, 11/18/2020 | 2/14/2020 | 17,000,000 | 16,682,102 |
| | | TOTAL | | | 86,566,767 |
| | | Retail - Food & Drug Retailers—0.0% | | | |
| 251,879 | | Lenovo Walmart, 1.161%, 4/7/2020 | 10/24/2019 | 250,338 | 251,407 |
| 12,690 | | Lenovo Walmart, 1.161%, 4/7/2020 | 11/21/2019 | 12,613 | 12,681 |
| | | TOTAL | | | 264,088 |
| | | Services - Building & Construction—0.5% | | | |
| 4,444,967 | 2,6 | SBG Ltd., 6.381% (3-month USLIBOR +4.000%), 6/30/2020 | 4/16/2018 | 4,370,885 | 3,111,477 |
| | | Services - Support Services—0.7% | | | |
| 4,587,915 | 2 | Airport International Group, 3.673% (6-month USLIBOR +1.750%), 11/15/2023 | 7/20/2016 | 4,290,924 | 4,232,938 |
| | | Supranational—4.6% | | | |
| 6,000,000 | 2 | Africa Finance Corp., 2.267% (3-month USLIBOR +1.000%), 12/27/2021 | 1/10/2019 | 5,941,500 | 5,831,637 |
| 5,000,000 | 2 | Africa Finance Corp., 2.928% (3-month USLIBOR +1.050%), 12/15/2020 | 3/21/2018 | 4,971,500 | 4,926,602 |
| 5,000,000 | 2 | African Export-Import Bank (Afreximbank), 2.453% (3-month USLIBOR +1.400%), 5/8/2020 | 4/2/2019 | 5,002,250 | 4,981,568 |
| 3,000,000 | 2 | African Export-Import Bank (Afreximbank), 2.600% (3-month USLIBOR +1.150%), 6/28/2020 | 7/26/2018 | 2,995,250 | 2,973,051 |
| 9,000,000 | 2 | Eastern and Southern African Trade and Development Bank, 3.072% (3-month USLIBOR +1.200%), 10/3/2020 | 10/4/2018 | 9,000,000 | 8,881,517 |
| | | TOTAL | | | 27,594,375 |
| | | Telecommunications - Wireless—1.2% | | | |
| 7,135,714 | 2 | MTN Group Ltd., 3.763% (3-month USLIBOR +2.150%), 8/25/2021 | 6/12/2018– 3/25/2020 | 7,128,964 | 7,135,714 |
Annual Shareholder Report
Principal
Amount
or Shares | | | Acquisition
Date1 | Acquisition
Cost1 | Value in
U.S. Dollars |
| | 1 | TRADE FINANCE AGREEMENTS—continued |
| | | Transportation - Air Transportation—2.6% | | | |
| $17,383,064 | 2 | Avolon Aerospace, 4.180% (1-month USLIBOR +1.600%), 3/31/2025 | 11/27/2019 | $17,465,634 | $15,948,984 |
| | | Transportation - Transport Infrastructure/Services—1.9% | | | |
| 5,071,768 | 2 | Armenia International Airports CJSC, 7.416% (6-month USLIBOR +5.500%), 12/23/2022 | 12/28/2017– 10/12/2018 | 5,122,486 | 4,851,599 |
| 4,270,000 | 2 | Asyaport, 6.274% (6-month USLIBOR +4.400%), 1/10/2024 | 7/28/2016 | 4,270,000 | 4,247,783 |
| 2,336,931 | 2 | Autopistas Urbanas SA (AUSA), 5.409% (3-month USLIBOR +3.500%), 11/15/2022 | 5/19/2017– 11/13/2017 | 2,301,876 | 2,228,681 |
| | | TOTAL | | | 11,328,063 |
| | | Utility - Electric-Generation—5.4% | | | |
| 9,000,000 | | Bahamas Electricity Corp., 5.830%, 6/11/2020 | 2/28/2020 | 8,977,500 | 8,895,420 |
| 927,498 | 2 | Casablanca & Giacote Solar PV Project, 5.212% (6-month USLIBOR +2.625%), 5/15/2020 | 5/15/2017 | 908,948 | 921,016 |
| 519,278 | 2 | Egypt Electric AfreximBK, 7.450% (3-month USLIBOR +5.250%), 4/10/2020 | 3/8/2017 | 519,278 | 518,895 |
| 3,294,142 | 2 | Egypt Electric, 6.827% (3-month USLIBOR +4.900%), 6/12/2023 | 12/11/2015– 2/13/2019 | 3,280,346 | 3,249,138 |
| 4,142,046 | 2 | Karpower International B.V., 7.811% (12-month USLIBOR +6.500%), 10/30/2021 | 9/17/2019– 3/4/2020 | 4,142,045 | 4,042,378 |
| IDR 96,228,147,388 | 2 | PT MaxPower, 5.750% (3-month USLIBOR +0.037%), 6/10/2039 | 6/12/2019– 3/17/2019 | 5,608,438 | 5,899,948 |
| $9,000,000 | | Tunisia, Government of, 2.968% - 3.147%, 8/31/2020 | 3/2/2020– 3/3/2020 | 9,000,000 | 8,994,713 |
| | | TOTAL | | | 32,521,508 |
| | | TOTAL TRADE FINANCE AGREEMENTS
(IDENTIFIED COST $580,649,529) | | | 548,095,151 |
| | | INVESTMENT COMPANY—7.2% | | | |
| 43,169,977 | | Federated Institutional Prime Value Obligations Fund, Institutional Shares, 0.82%7
(IDENTIFIED COST $43,154,095) | | | 43,144,075 |
| | | TOTAL INVESTMENT IN SECURITIES—97.8%
(IDENTIFIED COST $623,803,624)8 | | | 591,239,226 |
| | | OTHER ASSETS AND LIABILITIES - NET—2.2%9 | | | 13,536,815 |
| | | TOTAL NET ASSETS—100% | | | $604,776,041 |
At March 31, 2020, the Fund had the following outstanding foreign exchange contracts:
| Settlement Date | Counterparty | Foreign Currency
Units to
Deliver/Receive | In
Exchange For | Unrealized
Appreciation |
| Contracts Sold: |
| 4/22/2020 | Bank of America N.A. | 5,000,000 EUR | $5,827,570 | $309,010 |
| 5/6/2020 | State Street Bank & Trust Co. | 8,000,000 EUR | $9,007,266 | $172,508 |
| 5/22/2020 | State Street Bank & Trust Co. | 4,536,000 EUR | $5,089,427 | $77,017 |
| 5/22/2020 | State Street Bank & Trust Co. | 4,550,625 EUR | $5,231,910 | $203,339 |
| 6/12/2020 | Citibank N.A. | 4,600,000 EUR | $5,332,053 | $244,902 |
| 6/12/2020 | Barclays Bank PLC Wholesale | 80,000,000,000 IDR | $5,480,578 | $606,839 |
| 7/7/2020 | State Street Bank & Trust Co. | 9,116,707 EUR | $10,280,071 | $189,092 |
| 8/14/2020 | State Street Bank & Trust Co. | 585,900 EUR | $667,897 | $18,682 |
| 9/8/2020 | State Street Bank & Trust Co. | 4,316,504 EUR | $4,823,621 | $37,259 |
| 10/14/2020 | State Street Bank & Trust Co. | 735,555 EUR | $840,004 | $23,510 |
| 11/16/2020 | State Street Bank & Trust Co. | 1,446,045 EUR | $1,653,012 | $46,137 |
| 12/15/2020 | State Street Bank & Trust Co. | 902,250 EUR | $1,032,290 | $28,753 |
| NET UNREALIZED APPRECIATION ON FOREIGN EXCHANGE CONTRACTS | $1,957,048 |
Net Unrealized Appreciation on Foreign Exchange Contracts is included in “Other Assets and Liabilities—Net.”
Annual Shareholder Report
Affiliated fund holdings are investment companies which are managed by the Adviser or an affiliate of the Adviser. Transactions with affiliated fund holdings during the period ended March 31, 2020, were as follows:
| | Federated Institutional
Prime Value
Obligations Fund,
Institutional Shares |
| Balance of Shares Held 3/31/2019 | 84,012,725 |
| Purchases/Additions | 541,750,952 |
| Sales/Reductions | (582,593,700) |
| Balance of Shares Held 3/31/2020 | 43,169,977 |
| Value | $43,144,075 |
| Change in Unrealized Appreciation/Depreciation | $(17,029) |
| Net Realized Gain/(Loss) | $(57,092) |
| Dividend Income | $2,223,613 |
| Gain Distributions Received | $156 |
| 1 | Denotes a restricted security that either: (a) cannot be offered for public sale without first being registered, or availing of an exemption from registration, under the Securities Act of 1933; or (b) is subject to a contractual restriction on public sales. At March 31, 2020, these restricted securities amounted to $548,095,151, which represented 90.6% of total net assets. |
| 2 | Floating/variable note with current rate and current maturity or next reset date shown. |
| 3 | Principal amount and interest were not paid upon final maturity. |
| 4 | Issuer in default. |
| 5 | Non-income-producing security. |
| 6 | Fair value determined by a valuation committee using significant unobservable inputs in accordance with procedures established by and under the general supervision of the Fund's Board of Trustees (the “Trustees”). |
| 7 | 7-day net yield. |
| 8 | The cost of investments for federal tax purposes amounts to $624,477,431. |
| 9 | Assets, other than investments in securities, less liabilities. See Statement of Assets and Liabilities. |
Note: The categories of investments are shown as a percentage of total net assets at March 31, 2020.
Various inputs are used in determining the value of the Fund's investments. These inputs are summarized in the three broad levels listed below:
Level 1—quoted prices in active markets for identical securities.
Level 2—other significant observable inputs (including quoted prices for similar securities, interest rates, prepayment speeds, credit risk, etc.). Also includes securities valued at amortized cost.
Level 3—significant unobservable inputs (including the Fund's own assumptions in determining the fair value of investments).
The inputs or methodology used for valuing securities are not an indication of the risk associated with investing in those securities.
The following is a summary of the inputs used, as of March 31, 2020, in valuing the Fund's assets carried at fair value:
| Valuation Inputs | | | | |
| | Level 1—
Quoted
Prices | Level 2—
Other
Significant
Observable
Inputs | Level 3—
Significant
Unobservable
Inputs | Total |
| Debt Securities: | | | | |
| Trade Finance Agreements | $— | $— | $548,095,151 | $548,095,151 |
| Investment Company | 43,144,075 | — | — | 43,144,075 |
| TOTAL SECURITIES | $43,144,075 | $— | $548,095,151 | $591,239,226 |
| Other Financial Instruments1 | | | | |
| Assets | $— | $1,957,048 | $— | $1,957,048 |
| Liabilities | — | — | — | — |
| TOTAL OTHER FINANCIAL INSTRUMENTS | $— | $1,957,048 | $— | $1,957,048 |
| 1 | Other financial instruments are foreign exchange contracts.
|
Annual Shareholder Report
Trade finance agreements' fair values are primarily derived from discounted cash flow methodologies utilizing unobservable inputs due to the lack of market transactions. The discount rate used within the methodologies to discount the future anticipated cash flows is considered a significant unobservable input. Increases/(decreases) in the discount rate would result in a (decrease)/increase to an investment's fair value. The discount rates used as of March 31, 2020, as inputs for valuing Fund investments ranged from 1.109% to 100%.
Following is a reconciliation of assets in which significant unobservable inputs (Level 3) were used in determining fair value:
| | Investments in
Asset-Backed
Security | Investments in
Trade Finance
Agreements |
| Balance as of 3/31/2019 | $193,570 | $498,487,787 |
| Accrued discount/premiums | 146 | 908,200 |
| Realized gain (loss) | — | (11,216,732) |
| Change in unrealized appreciation (depreciation) | 728 | (12,836,510) |
| Purchases | — | 505,203,251 |
| (Sales) | (194,444) | (432,450,845) |
| Balance as of 3/31/2020 | $— | $548,095,151 |
| The total change in unrealized appreciation (depreciation) attributable to investments still held at 3/31/2020 | $— | $(22,494,603) |
The following acronyms are used throughout this portfolio:
| CJSC | —Closed Joint-Stock Company |
| EUR | —Euro Currency |
| EURIBOR | —Euro Interbank Offered Rate |
| IDR | —Indonesian Rupiah |
| LIBOR | —London Interbank Offered Rate |
See Notes which are an integral part of the Financial Statements
Annual Shareholder Report
Financial Highlights
(For a Share Outstanding Throughout Each Period)
| Year Ended March 31 | 2020 | 2019 | 2018 | 2017 | 2016 |
| Net Asset Value, Beginning of Period | $9.02 | $9.06 | $9.21 | $9.32 | $9.37 |
| Income From Investment Operations: | | | | | |
| Net investment income | 0.39 | 0.43 | 0.39 | 0.39 | 0.38 |
| Net realized and unrealized gain (loss) | (0.32) | (0.03) | (0.14) | (0.11) | (0.06) |
| TOTAL FROM INVESTMENT OPERATIONS | 0.07 | 0.40 | 0.25 | 0.28 | 0.32 |
| Less Distributions: | | | | | |
| Distributions from net investment income | (0.41) | (0.44) | (0.40) | (0.39) | (0.37) |
| Net Asset Value, End of Period | $8.68 | $9.02 | $9.06 | $9.21 | $9.32 |
| Total Return1 | 0.74% | 4.45% | 2.79% | 3.04% | 3.46% |
| Ratios to Average Net Assets: | | | | | |
| Net expenses | 0.09% | 0.14% | 0.18% | 0.18% | 0.22% |
| Net investment income | 4.32% | 4.77% | 4.27% | 4.24% | 4.07% |
| Expense waiver/reimbursement2 | 0.10% | 0.10% | 0.10% | 0.10% | 0.12% |
| Supplemental Data: | | | | | |
| Net assets, end of period (000 omitted) | $604,776 | $594,046 | $555,329 | $490,175 | $486,124 |
| Portfolio turnover | 62% | 57% | 51% | 47% | 47% |
| 1 | Based on net asset value. |
| 2 | This expense decrease is reflected in both the net expense and the net investment income ratios shown above. |
See Notes which are an integral part of the Financial Statements
Annual Shareholder Report
Statement of Assets and Liabilities
March 31, 2020
| Assets: | | |
| Investment in securities, at value including $43,144,075 of investment in an affiliated holding* (identified cost $623,803,624) | | $591,239,226 |
| Income receivable | | 4,989,762 |
| Income receivable from an affiliated holding* | | 61,420 |
| Receivable for investments sold | | 7,207,805 |
| Unrealized appreciation on foreign exchange contracts | | 1,957,048 |
| TOTAL ASSETS | | 605,455,261 |
| Liabilities: | | |
| Bank overdraft denominated in foreign currencies (identified cost $(133,655)) | $148,367 | |
| Bank overdraft | 18,638 | |
| Due to broker | 25,628 | |
| Income distribution payable | 236,069 | |
| Payable for custodian fees | 24,087 | |
| Payable for auditing fees | 78,216 | |
| Payable for portfolio accounting fees | 114,935 | |
| Accrued expenses (Note 5) | 33,280 | |
| TOTAL LIABILITIES | | 679,220 |
| Net assets for 69,649,169 shares outstanding | | $604,776,041 |
| Net Assets Consist of: | | |
| Paid-in capital | | $672,507,213 |
| Total distributable earnings (loss) | | (67,731,172) |
| TOTAL NET ASSETS | | $604,776,041 |
| Net Asset Value, Offering Price and Redemption Proceeds Per Share: | | |
| $604,776,041 ÷ 69,649,169 shares outstanding, no par value, unlimited shares authorized | | $8.68 |
| * | See information listed after the Fund's Portfolio of Investments. |
See Notes which are an integral part of the Financial Statements
Annual Shareholder Report
Statement of Operations
Year Ended March 31, 2020
| Investment Income: | | |
| Interest | | $25,175,070 |
| Dividends received from an affiliated holding* | | 2,223,613 |
| TOTAL INCOME | | 27,398,683 |
| Expenses: | | |
| Investment adviser fee (Note 5) | $621,562 | |
| Administrative fee (Note 5) | 610 | |
| Custodian fees | 26,135 | |
| Transfer agent fee | 41,901 | |
| Directors'/Trustees' fees (Note 5) | 10,868 | |
| Auditing fees | 109,691 | |
| Portfolio accounting fees | 328,947 | |
| Share registration costs | 1,600 | |
| Printing and postage | 16,249 | |
| Risk insurance expense (Note 5) | 12,175 | |
| Miscellaneous (Note 5) | 17,907 | |
| TOTAL EXPENSES | 1,187,645 | |
| Waiver/reimbursement of investment adviser fee (Note 5) | (621,562) | |
| Net expenses | | 566,083 |
| Net investment income | | 26,832,600 |
| Realized and Unrealized Gain (Loss) on Investments, Foreign Exchange Contracts and Foreign Currency Transactions: | | |
| Net realized loss on investments (including net realized loss of $(57,092) on sales of investments in an affiliated holding*) | | (11,102,525) |
| Net realized loss on foreign currency transactions | | (214,236) |
| Net realized gain on foreign exchange contracts | | 827,151 |
| Realized gain distribution from affiliated investment company shares | | 156 |
| Net change in unrealized depreciation of investments (including net change in unrealized appreciation of $(17,029) on investments in an affiliated holding*) | | (12,727,593) |
| Net change in unrealized appreciation/depreciation of translation of assets and liabilities in foreign currency | | (13,692) |
| Net change in unrealized appreciation of foreign exchange contracts | | 1,422,509 |
| Net realized and unrealized loss on investments, foreign exchange contracts and foreign currency transactions | | (21,808,230) |
| Change in net assets resulting from operations | | $5,024,370 |
| * | See information listed after the Fund's Portfolio of Investments. |
See Notes which are an integral part of the Financial Statements
Annual Shareholder Report
Statement of Changes in Net Assets
| Year Ended March 31 | 2020 | 2019 |
| Increase (Decrease) in Net Assets | | |
| Operations: | | |
| Net investment income | $26,832,600 | $27,950,180 |
| Net realized loss | (10,489,454) | (8,819,778) |
| Net change in unrealized appreciation/depreciation | (11,318,776) | 6,075,192 |
| CHANGE IN NET ASSETS RESULTING FROM OPERATIONS | 5,024,370 | 25,205,594 |
| Distributions to Shareholders | (28,448,541) | (28,191,419) |
| Share Transactions: | | |
| Proceeds from sale of shares | 75,125,000 | 64,010,417 |
| Net asset value of shares issued to shareholders in payment of distributions declared | 23,857,002 | 23,131,689 |
| Cost of shares redeemed | (64,827,360) | (45,440,000) |
| CHANGE IN NET ASSETS RESULTING FROM SHARE TRANSACTIONS | 34,154,642 | 41,702,106 |
| Change in net assets | 10,730,471 | 38,716,281 |
| Net Assets: | | �� |
| Beginning of period | 594,045,570 | 555,329,289 |
| End of period | $604,776,041 | $594,045,570 |
See Notes which are an integral part of the Financial Statements
Annual Shareholder Report
Statement of Cash Flows
For the Year Ended March 31, 2020
| Cash Flows from Operating Activities: | |
| Net increase in net assets from operations | $5,024,370 |
| Adjustments to Reconcile Change in Net Assets From Operations to Net Cash Used By Operating Activities: | |
| Purchases of investment securities | (505,203,251) |
| Proceeds from disposition of investment securities | 432,356,046 |
| Purchase of short-term investments, net | 40,811,332 |
| Amortization of premium/discount, net | 908,346 |
| Increase in income receivable | (259,206) |
| Increase in receivable for investments sold | (1,766,180) |
| Decrease in payable for investments purchased | (140,737) |
| Increase in accrued expenses | 15,936 |
| Net realized loss on investments | 11,102,369 |
| Net realized loss on foreign currency and foreign currency related transactions | 214,236 |
| Net realized gain on foreign exchange contracts | (827,151) |
| Net change in unrealized depreciation on investments | 12,727,593 |
| Net change in unrealized appreciation of foreign exchange contracts | (1,422,509) |
| NET CASH USED BY OPERATING ACTIVITIES | (6,458,806) |
| Cash Flows Provided By Financing Activities: | |
| Increase in cash and foreign cash overdraft | 167,005 |
| Proceeds from shares sold | 75,125,000 |
| Payment for shares redeemed | (64,827,360) |
| Distributions paid in cash | (4,758,878) |
| NET CASH PROVIDED BY FINANCING ACTIVITIES | 5,705,767 |
| Effect of exchange rate changes on cash | 13,692 |
| Net decrease in cash | (739,347) |
| Cash at beginning period | 739,347 |
| Cash at end of period | $— |
Non-cash financing activities not included herein consist of reinvestment of dividends and distributions of $23,857,002.
See Notes which are an integral part of the Financial Statements
Annual Shareholder Report
Notes to Financial Statements
March 31, 2020
1. ORGANIZATION
Federated Project and Trade Finance Core Fund (the “Fund”) is a non-diversified portfolio of Federated Core Trust III (the “Trust”). The Trust is registered under the Investment Company Act of 1940, as amended (the “Act”), as an open-end management investment company. The Fund operates as an open-end extended payment fund. The Fund's investment objective is to provide total return. Currently, the Fund is only available for purchase by organizations or entities that are “accredited investors” within the meaning of Regulation D of the Securities Act 1933 (the ”1933 Act”) and “qualified purchasers” as defined in Section 2(a)(51) of the Act. The Fund is not a mutual fund, and its shares are offered pursuant to an exemption from registration under the 1933 Act, as amended.
Effective on or about June 29, 2020, the name of the Trust and Fund will change to Federated Hermes Core Trust III and Project and Trade Finance Core Fund, respectively.
2. SIGNIFICANT ACCOUNTING POLICIES
The following is a summary of significant accounting policies consistently followed by the Fund in the preparation of its financial statements. These policies are in conformity with U.S. generally accepted accounting principles (GAAP).
Investment Valuation
In calculating its net asset value (NAV), the Fund generally values investments as follows:
| ■ | Fixed-income securities are fair valued using price evaluations provided by a pricing service approved by the Trustees. |
| ■ | Equity securities listed on an exchange or traded through a regulated market system are valued at their last reported sale price or official closing price in their principal exchange or market. |
| ■ | Shares of other mutual funds or non-exchange-traded investment companies are valued based upon their reported NAVs. |
| ■ | Derivative contracts listed on exchanges are valued at their reported settlement or closing price, except that options are valued at the mean of closing bid and asked quotations. |
| ■ | Over-the-counter (OTC) derivative contracts are fair valued using price evaluations provided by a pricing service approved by the Trustees. |
| ■ | For securities that are fair valued in accordance with procedures established by and under the general supervision of the Trustees, certain factors may be considered such as: the last traded or purchase price of the security, information obtained by contacting the issuer or dealers, analysis of the issuer's financial statements or other available documents, fundamental analytical data, the nature and duration of restrictions on disposition, the movement of the market in which the security is normally traded, public trading in similar securities or derivative contracts of the issuer or comparable issuers, movement of a relevant index, expected recovery rate on distressed securities, opinion of legal counsel regarding the outcome of any relevant legal matters or other factors including but not limited to industry changes and relevant government actions. |
If any price, quotation, price evaluation or other pricing source is not readily available when the NAV is calculated, if the Fund cannot obtain price evaluations from a pricing service or from more than one dealer for an investment within a reasonable period of time as set forth in the Fund's valuation policies and procedures, or if information furnished by a pricing service, in the opinion of the valuation committee (“Valuation Committee”), is deemed not representative of the fair value of such security, the Fund uses the fair value of the investment determined in accordance with the procedures described below. There can be no assurance that the Fund could obtain the fair value assigned to an investment if it sold the investment at approximately the time at which the Fund determines its NAV per share, and the actual value obtained could be materially different.
Fair Valuation and Significant Events Procedures
The Trustees have ultimate responsibility for determining the fair value of investments for which market quotations are not readily available. The Trustees have appointed a Valuation Committee comprised of officers of the Fund, Federated Investment Management Company (the “Adviser”) and certain of the Adviser's affiliated companies to assist in determining fair value and in overseeing the calculation of the NAV. The Trustees have also authorized the use of pricing services recommended by the Valuation Committee to provide fair value evaluations of the current value of certain investments for purposes of calculating the NAV. The Valuation Committee employs various methods for reviewing third-party pricing-service evaluations including periodic reviews of third-party pricing services' policies, procedures and valuation methods (including key inputs, methods, models and assumptions), transactional back-testing, comparisons of evaluations of different pricing services, and review of price challenges by the Adviser based on recent market activity. In the event that market quotations and price evaluations are not available for an investment, the Valuation Committee determines the fair value of the investment in accordance with procedures adopted by the Trustees. The Trustees periodically review and approve the fair valuations made by the Valuation Committee and any changes made to the procedures.
The Fund's investments in trade finance agreements are primarily determined by applying discounted cash flow methodologies utilizing various inputs such as available or implied credit ratings, loan characteristics, seniority, collateral, comparable debt instruments, yield curves or indices, broader loan data, bond data and bond sector curves. When appropriate, other considerations may include asset liquidation analyses, internal credit assessments and general market conditions. The Fund utilizes third-party pricing specialists in determining its valuations. Typically, there are no other sources of evaluations for these investments and the inputs utilized are less observable. Additionally, trade finance agreements are typically held to maturity by investors and therefore do not trade on a consistent basis. Accordingly, executed trade prices are usually unavailable and thus, generally cannot be relied upon to support valuations of these investments. Therefore, inputs unobservable in active markets must be relied upon more heavily and as such, the Fund's management has determined these to be level 3 investments. The prices realized for these investments upon sale may be different than prices used by the Fund to value them and the differences could be material.
Annual Shareholder Report
Some pricing services provide a single price evaluation reflecting the bid-side of the market for an investment (a “bid” evaluation). Other pricing services offer both bid evaluations and price evaluations indicative of a price between the prices bid and asked for the investment (a “mid” evaluation). The Fund normally uses bid evaluations for any U.S. Treasury and Agency securities, mortgage-backed securities and municipal securities. The Fund normally uses mid evaluations for any other types of fixed-income securities and any OTC derivative contracts. In the event that market quotations and price evaluations are not available for an investment, the fair value of the investment is determined in accordance with procedures adopted by the Trustees.
The Trustees also have adopted procedures requiring an investment to be priced at its fair value whenever the Adviser determines that a significant event affecting the value of the investment has occurred between the time as of which the price of the investment would otherwise be determined and the time as of which the NAV is computed. An event is considered significant if there is both an affirmative expectation that the investment's value will change in response to the event and a reasonable basis for quantifying the resulting change in value. Examples of significant events that may occur after the close of the principal market on which a security is traded, or after the time of a price evaluation provided by a pricing service or a dealer, include:
| ■ | With respect to securities traded principally in foreign markets, significant trends in U.S. equity markets or in the trading of foreign securities index futures contracts; |
| ■ | Political or other developments affecting the economy or markets in which an issuer conducts its operations or its securities are traded; |
| ■ | Announcements concerning matters such as acquisitions, recapitalizations, litigation developments, or a natural disaster affecting the issuer's operations or regulatory changes or market developments affecting the issuer's industry. |
The Trustees have adopted procedures whereby the Valuation Committee uses a pricing service to provide factors to update the fair value of equity securities traded principally in foreign markets from the time of the close of their respective foreign stock exchanges to the pricing time of the Fund. For other significant events, the Fund may seek to obtain more current quotations or price evaluations from alternative pricing sources. If a reliable alternative pricing source is not available, the Fund will determine the fair value of the investment in accordance with the fair valuation procedures approved by the Trustees. The Trustees have ultimate responsibility for any fair valuations made in response to a significant event.
Investment Income, Gains and Losses, Expenses and Distributions
Investment transactions are accounted for on a trade-date basis. Realized gains and losses from investment transactions are recorded on an identified-cost basis. Interest income and expenses are accrued daily. Dividend income and distributions to shareholders are recorded on the ex-dividend date. Foreign dividends are recorded on the ex-dividend date or when the Fund is informed of the ex-dividend date. Distributions of net investment income, if any, are declared daily and paid monthly. Non-cash dividends included in dividend income, if any, are recorded at fair value. Amortization/accretion of premium and discount is included in investment income. The detail of the total fund expense waiver and reimbursement of $621,562 is disclosed in various locations in Note 5.
Federal Taxes
It is the Fund's policy to comply with the Subchapter M provision of the Internal Revenue Code (the “Code”) and to distribute to shareholders each year substantially all of its income. Accordingly, no provision for federal income tax is necessary. As of and during the year ended March 31, 2020, the Fund did not have a liability for any uncertain tax positions. The Fund recognizes interest and penalties, if any, related to tax liabilities as income tax expense in the Statement of Operations. As of March 31, 2020, tax years 2017 through 2020 remain subject to examination by the Fund's major tax jurisdictions, which include the United States of America and the state of Delaware.
Foreign Exchange Contracts
The Fund enters into foreign exchange contracts to manage currency risk. Purchased contracts are used to acquire exposure to foreign currencies, whereas, contracts to sell are used to hedge the Fund's securities against currency fluctuations. Risks may arise upon entering into these transactions from the potential inability of counterparties to meet the terms of their commitments and from unanticipated movements in security prices or foreign exchange rates. The foreign exchange contracts are adjusted by the daily exchange rate of the underlying currency and any gains or losses are recorded for financial statement purposes as unrealized until the settlement date.
Foreign exchange contracts are subject to Master Netting Agreements which are agreements between the Fund and its counterparties that provide for the net settlement of all transactions and collateral with the Fund, through a single payment, in the event of default or termination. Amounts presented on the Portfolio of Investments and Statement of Assets and Liabilities are not net settlement amounts but gross.
Foreign exchange contracts outstanding at period end, including net unrealized appreciation/depreciation or net settlement amount, are listed after the Fund's Portfolio of Investments.
The average value at settlement date payable and receivable of foreign exchange contracts purchased and sold by the Fund throughout the period was $75,186 and $822,007, respectively. This is based on the contracts held as of each month-end throughout the fiscal period.
Foreign Currency Translation
The accounting records of the Fund are maintained in U.S. dollars. All assets and liabilities denominated in foreign currencies are translated into U.S. dollars based on the rates of exchange of such currencies against U.S. dollars on the date of valuation. Purchases and sales of securities, income and expenses are translated at the rate of exchange quoted on the respective date that such transactions are recorded. The Fund does not isolate that portion of the results of operations resulting from changes in foreign exchange rates on investments from the fluctuations arising from changes in market prices of securities held. Such fluctuations are included with the net realized and unrealized gain or loss from investments.
Reported net realized foreign exchange gains or losses arise from sales of foreign currencies, currency gains or losses realized between the trade and settlement dates on securities transactions, the difference between the amounts of dividends, interest and foreign withholding taxes recorded on the Fund's books, and the U.S. dollar equivalent of the amounts actually received or paid. Net unrealized foreign exchange gains and losses arise from changes in the value of assets and liabilities other than investments in securities at period end, resulting from changes in the exchange rate.
Annual Shareholder Report
Restricted Securities
The Fund may purchase securities which are considered restricted. Restricted securities are securities that either: (a) cannot be offered for public sale without first being registered, or being able to take advantage of an exemption from registration, under the Securities Act of 1933; or (b) are subject to contractual restrictions on public sales. In some cases, when a security cannot be offered for public sale without first being registered, the issuer of the restricted security has agreed to register such securities for resale, at the issuer's expense, either upon demand by the Fund or in connection with another registered offering of the securities. Many such restricted securities may be resold in the secondary market in transactions exempt from registration. Restricted securities may be determined to be liquid under criteria established by the Trustees. The Fund will not incur any registration costs upon such resales. The Fund's restricted securities, like other securities, are priced in accordance with procedures established by and under the general supervision of the Trustees.
Additional Disclosure Related to Derivative Instruments
| | Assets |
| | Statement of
Assets and
Liabilities
Location | Fair
Value |
| Derivatives not accounted for as hedging instruments under ASC Topic 815 | | |
| Foreign exchange contracts | Unrealized
appreciation
on foreign
exchange contracts | $1,957,048 |
The Effect of Derivative Instruments on the Statement of Operations for the Year Ended March 31, 2020
| Amount of Realized Gain or (Loss) on Derivatives Recognized in Income |
| | Foreign
Exchange
Contracts |
| Foreign exchange contracts | $827,151 |
| Change in Unrealized Appreciation or (Depreciation) on Derivatives Recognized in Income |
| | Foreign
Exchange
Contracts |
| Foreign exchange contracts | $1,422,509 |
Other
The preparation of financial statements in conformity with GAAP requires management to make estimates and assumptions that affect the amounts of assets, liabilities, expenses and revenues reported in the financial statements. Actual results could differ materially from those estimated. The Fund applies investment company accounting and reporting guidance.
3. SHARES OF BENEFICIAL INTEREST
The following table summarizes share activity:
| Year Ended March 31 | 2020 | 2019 |
| Shares sold | 8,366,294 | 7,053,285 |
| Shares issued to shareholders in payment of distributions declared | 2,662,739 | 2,551,639 |
| Shares redeemed | (7,270,765) | (5,015,001) |
| NET CHANGE RESULTING FROM FUND SHARE TRANSACTIONS | 3,758,268 | 4,589,923 |
4. FEDERAL TAX INFORMATION
The tax character of distributions as reported on the Statement of Changes in Net Assets for the years ended March 31, 2020 and 2019, was as follows:
| | 2020 | 2019 |
| Ordinary income | $28,448,541 | $28,191,419 |
Annual Shareholder Report
As of March 31, 2020, the components of distributable earnings on a tax-basis were as follows:
| Undistributed ordinary income | $467,703 |
| Net unrealized depreciation | $(32,646,077) |
| Capital loss carryforwards | $(35,552,798) |
The difference between book-basis and tax-basis net unrealized appreciation/depreciation is attributable to differing treatments for defaulted securities, deferral of losses on wash sales and mark to market of foreign exchange contracts.
At March 31, 2020, the cost of investments for federal tax purposes was $624,477,431. The net unrealized depreciation of investments for federal tax purposes was $32,631,366. This consists of net unrealized appreciation from investments for those securities having an excess of value over cost of $310,308 and net unrealized depreciation from investments for those securities having an excess of cost over value of $32,941,674.
As of March 31, 2020, the Fund had a capital loss carryforward of $35,552,798 which will reduce the Fund's taxable income arising from future net realized gains on investments, if any, to the extent permitted by the Code, thereby reducing the amount of distributions to shareholders which would otherwise be necessary to relieve the Fund of any liability for federal income tax. Pursuant to the Code, these net capital losses retain their character as either short-term or long-term and do not expire.
The following schedule summarizes the Fund's capital loss carryforwards:
| Short-Term | Long-Term | Total |
| $2,233,972 | $33,318,826 | $35,552,798 |
5. INVESTMENT ADVISER FEE AND OTHER TRANSACTIONS WITH AFFILIATES
Investment Adviser Fee
The advisory agreement between the Fund and the Adviser provides for an annual fee equal to 0.10% of the Fund's average daily net assets. The Adviser and certain of its affiliates on their own initiative have agreed to waive their respective fees (if any), and/or reimburse expenses. Total annual fund operating expenses (as shown in the financial highlights excluding fees and expenses that may be charged by the Adviser and its affiliates, operating expenses associated with premiums for risk insurance policies on portfolio securities and certain legal fees related to specific investments paid by the Fund, if any) paid by the Fund's shares (after the voluntarily waivers and reimbursements) will not exceed 0.15% of the Fund's average daily net assets. The Adviser and its affiliates can modify or terminate this voluntary reimbursement at any time at its sole discretion. For the year ended March 31, 2020, the Adviser voluntarily waived $544,680 of its fee.
The Adviser has agreed to reimburse the Fund for certain investment adviser fees as a result of transactions in other affiliated investment companies. For the year ended March 31, 2020, the Adviser reimbursed $76,882.
Certain of the Fund's assets are managed by Federated Investors (UK) LLP (the “Sub-Adviser”). Under the terms of a sub-advisory agreement between the Adviser and the Sub-Adviser, the Sub-Adviser receives an annual fee equal to 0.39% of the daily net assets of the Fund paid by Adviser out of its resources and is not an incremental Fund expense. For the year ended March 31, 2020, the Sub-Adviser earned a fee of $2,429,074.
Directors'/Trustees' and Miscellaneous Fees
Certain Officers and Trustees of the Fund are Officers and Directors or Trustees of certain of the above companies. To efficiently facilitate payment, Independent Directors'/Trustees' fees and certain expenses related to conducting meetings of the Directors/Trustees and other miscellaneous expenses are paid by an affiliate of the Adviser which in due course are reimbursed by the Fund. These expenses related to conducting meetings of the Directors/Trustees and other miscellaneous expenses may be included in Accrued and Miscellaneous Expenses on the Statement of Assets and Liabilities and Statement of Operations, respectively.
Affiliated Shares of Beneficial Interest
As of March 31, 2020, a majority of the shares of beneficial interest outstanding are owned by an affiliate of the Adviser.
6. INVESTMENT TRANSACTIONS
Purchases and sales of investments, excluding long-term U.S. government securities and short-term obligations, for the year ended March 31, 2020, were as follows:
| Purchases | $261,014,633 |
| Sales | $226,886,586 |
Annual Shareholder Report
7. CONCENTRATION OF RISK
A substantial portion of the Fund's portfolio may be comprised of entities in the Energy sector. As a result, the Fund may be more susceptible to any economic, business, political or other developments which generally affect these entities.
The Fund invests in securities of non-U.S. issuers. Political or economic developments may have an effect on the liquidity and volatility of portfolio securities and currency holdings.
At March 31, 2020, the diversification of countries was as follows:
| Country | Percentage of
Total Net Assets |
| Nigeria | 10.8% |
| South Africa | 4.7% |
| Turkey | 4.4% |
| Ghana | 3.5% |
| Angola | 3.4% |
| Kenya | 3.4% |
| Ivory Coast | 3.0% |
| Singapore | 3.0% |
| Ireland | 2.6% |
| Italy | 2.6% |
| Uruguay | 2.6% |
| Indonesia | 2.5% |
| Oman | 2.4% |
| Azerbaijan | 2.3% |
| Egypt | 2.2% |
| Qatar | 2.2% |
| Argentina | 1.9% |
| India | 1.9% |
| Ukraine | 1.7% |
| Kazakhstan | 1.6% |
| Bahamas | 1.5% |
| Jordan | 1.5% |
| Tunisia | 1.5% |
| United Kingdom | 1.5% |
| Malaysia | 1.4% |
| Denmark | 1.3% |
| Gabon | 1.3% |
| Tanzania, United Republic Of | 1.3% |
| Russia | 1.2% |
| Kuwait | 1.1% |
| Pakistan | 1.0% |
| Brazil | 0.9% |
| Ecuador | 0.9% |
| Maldives | 0.9% |
| Armenia | 0.8% |
| Senegal | 0.8% |
| Georgia | 0.7% |
| Lebanon | 0.7% |
| Rwanda | 0.7% |
| Chad | 0.5% |
| Saudi Arabia | 0.5% |
| Sri Lanka | 0.5% |
| Burkina Faso | 0.4% |
| Paraguay | 0.4% |
| Suriname | 0.4% |
| Bahrain | 0.3% |
Annual Shareholder Report
| Country | Percentage of
Total Net Assets |
| Congo | 0.3% |
| Ethiopia | 0.3% |
| Gambia | 0.3% |
| Thailand | 0.3% |
| Zambia | 0.2% |
| Colombia | 0.1% |
| Morocco | 0.1% |
| Botswana | 0.0%1 |
| 1 | Represents less than 0.1%. |
8. OTHER MATTERS
An outbreak of respiratory disease caused by a novel coronavirus was first detected in China in December 2019 and subsequently spread globally. As of the date of the issuance of these financial statements, this coronavirus has resulted in closing borders, enhanced health screenings, healthcare service preparation and delivery, quarantines, cancellations, and disruptions to supply chains, workflow operations and consumer activity, as well as general concern and uncertainty. The impact of this coronavirus may be short term or may last for an extended period of time and result in a substantial economic downturn. The impact of this outbreak, and other epidemics and pandemics that may arise in the future, could continue to negatively affect the worldwide economy, as well as the economies of individual countries, individual companies (including certain Fund service providers and issuers of the Fund's investments) and the markets in general in significant and unforeseen ways. Any such impact could adversely affect the Fund's performance.
9. subsequent event
Effective on or about June 26, 2020, the name of the Sub-Adviser will change to Federated Hermes (UK) LLP.
Annual Shareholder Report
Report of Independent Registered Public Accounting Firm
To The Board of Trustees of Federated Core Trust III and Shareholders of
Federated Project and Trade Finance Core Fund:
Opinion on the Financial Statements
We have audited the accompanying statement of assets and liabilities, including the portfolio of investments, of the Federated Project and Trade Finance Core Fund (the “Fund”), a portfolio of Federated Core Trust III, as of March 31, 2020, the related statements of operations and cash flows for the year then ended, the statements of changes in net assets for each of the years in the two-year period then ended, and the related notes (collectively, the “financial statements”) and the financial highlights for each of the years in the five-year period ended March 31, 2020. In our opinion, the financial statements and financial highlights present fairly, in all material respects, the financial position of the Fund as of March 31, 2020, the results of its operations and cash flows for the year then ended, the changes in its net assets for each of the years in the two-year period then ended, and the financial highlights for each of the years in the five-year period then ended, in conformity with U.S. generally accepted accounting principles.
Basis for Opinion
These financial statements and financial highlights are the responsibility of the Fund's management. Our responsibility is to express an opinion on these financial statements and financial highlights based on our audits. We are a public accounting firm registered with the Public Company Accounting Oversight Board (United States) (“PCAOB”) and are required to be independent with respect to the Fund in accordance with the U.S. federal securities laws and the applicable rules and regulations of the Securities and Exchange Commission and the PCAOB.
We conducted our audits in accordance with the standards of the PCAOB. Those standards require that we plan and perform the audit to obtain reasonable assurance about whether the financial statements and financial highlights are free of material misstatement, whether due to error or fraud. Our audits included performing procedures to assess the risks of material misstatement of the financial statements and financial highlights, whether due to error or fraud, and performing procedures that respond to those risks. Such procedures included examining, on a test basis, evidence regarding the amounts and disclosures in the financial statements and financial highlights. Such procedures also included confirmation of securities owned as of March 31, 2020, by correspondence with the custodian and brokers or by other appropriate auditing procedures. Our audits also included evaluating the accounting principles used and significant estimates made by management, as well as evaluating the overall presentation of the financial statements and financial highlights. We believe that our audits provide a reasonable basis for our opinion.

We have served as the auditor for one or more of Federated Hermes investment companies since 2006.
Boston, Massachusetts
May 27, 2020
Annual Shareholder Report
Shareholder Expense Example (unaudited)
As a shareholder of the Fund, you incur ongoing costs, including management fees and to the extent applicable, distribution (12b-1) fees and/or other service fees and other Fund expenses. This Example is intended to help you to understand your ongoing costs (in dollars) of investing in the Fund and to compare these costs with the ongoing costs of investing in other mutual funds. It is based on an investment of $1,000 invested at the beginning of the period and held for the entire period from October 1, 2019 to March 31, 2020.
ACTUAL EXPENSES
The first section of the table below provides information about actual account values and actual expenses. You may use the information in this section, together with the amount you invested, to estimate the expenses that you incurred over the period. Simply divide your account value by $1,000 (for example, an $8,600 account value divided by $1,000 = 8.6), then multiply the result by the number in the first section under the heading entitled “Expenses Paid During Period” to estimate the expenses attributable to your investment during this period.
HYPOTHETICAL EXAMPLE FOR COMPARISON PURPOSES
The second section of the table below provides information about hypothetical account values and hypothetical expenses based on the Fund's actual expense ratio and an assumed rate of return of 5% per year before expenses, which is not the Fund's actual return. Thus, you should not use the hypothetical account values and expenses to estimate the actual ending account balance or your expenses for the period. Rather, these figures are required to be provided to enable you to compare the ongoing costs of investing in the Fund with other funds. To do so, compare this 5% hypothetical example with the 5% hypothetical examples that appear in the shareholder reports of the other funds.
Please note that the expenses shown in the table are meant to highlight your ongoing costs only. Therefore, the second section of the table is useful in comparing ongoing costs only, and will not help you determine the relative total costs of owning different funds.
| | Beginning
Account Value
10/1/2019 | Ending
Account Value
3/31/2020 | Expenses Paid
During Period1 |
| Actual | $1,000.00 | $987.70 | $0.40 |
| Hypothetical (assuming a 5% return before expenses) | $1,000.00 | $1,024.60 | $0.40 |
| 1 | Expenses are equal to the Fund's annualized net expense ratio of 0.08%, multiplied by the average account value over the period, multiplied by 183/366 (to reflect the one-half-year period).
|
Annual Shareholder Report
Board of Trustees and Trust Officers
The Board of Trustees is responsible for managing the Trust's business affairs and for exercising all the Trust's powers except those reserved for the shareholders. The following tables give information about each Trustee and the senior officers of the Fund. Where required, the tables separately list Trustees who are “interested persons” of the Fund (i.e., “Interested” Trustees) and those who are not (i.e., “Independent” Trustees). Unless otherwise noted, the address of each person listed is 1001 Liberty Avenue, Pittsburgh, PA 15222. The address of all Independent Trustees listed is 4000 Ericsson Drive, Warrendale, PA 15086-7561; Attention: Mutual Fund Board. As of December 31, 2019, the Trust comprised one portfolio(s), and the Federated Hermes Fund Family consisted of 41 investment companies (comprising 135 portfolios). Unless otherwise noted, each Officer is elected annually. Unless otherwise noted, each Trustee oversees all portfolios in the Federated Hermes Fund Family and serves for an indefinite term. The Fund's Statement of Additional Information includes additional information about Trust Trustees and is available, without charge and upon request, by calling 1-800-341-7400.
Interested Trustees Background
Name
Birth Date
Positions Held with Trust
Date Service Began | Principal Occupation(s) for Past Five Years,
Other Directorships Held and Previous Position(s) |
J. Christopher Donahue*
Birth Date: April 11, 1949
President and Trustee
Indefinite Term
Began serving: February 2008 | Principal Occupations: Principal Executive Officer and President of certain of the Funds in the Federated Hermes Fund Family; Director or Trustee of the Funds in the Federated Hermes Fund Family; President, Chief Executive Officer and Director, Federated Hermes, Inc.; Chairman and Trustee, Federated Investment Management Company; Trustee, Federated Investment Counseling; Chairman and Director, Federated Global Investment Management Corp.; Chairman and Trustee, Federated Equity Management Company of Pennsylvania; Trustee, Federated Shareholder Services Company; Director, Federated Services Company.
Previous Positions: President, Federated Investment Counseling; President and Chief Executive Officer, Federated Investment Management Company, Federated Global Investment Management Corp. and Passport Research, Ltd; Chairman, Passport Research, Ltd. |
John B. Fisher*
Birth Date: May 16, 1956
Trustee
Indefinite Term
Began serving: May 2016 | Principal Occupations:Principal Executive Officer and President of certain of the Funds in the Federated Hermes Fund Family; Director or Trustee of certain of the Funds in the Federated Hermes Fund Family; Vice President, Federated Hermes, Inc.; President, Director/Trustee and CEO, Federated Advisory Services Company, Federated Equity Management Company of Pennsylvania, Federated Global Investment Management Corp., Federated Investment Counseling, Federated Investment Management Company; President of some of the Funds in the Federated Hermes Fund Family and Director, Federated Investors Trust Company.
Previous Positions: President and Director of the Institutional Sales Division of Federated Securities Corp.; President and Director of Federated Investment Counseling; President and CEO of Passport Research, Ltd.; Director, Edgewood Securities Corp.; Director, Federated Services Company; Director, Federated Hermes, Inc.; Chairman and Director, Southpointe Distribution Services, Inc. and President, Technology, Federated Services Company. |
| * | Reasons for “interested” status: J. Christopher Donahue and John B. Fisher are interested due to their beneficial ownership of shares of Federated Hermes, Inc. and due to positions they hold with Federated Hermes, Inc. and its subsidiaries. |
INDEPENDENT Trustees Background
Name
Birth Date
Positions Held with Trust
Date Service Began | Principal Occupation(s) for Past Five Years,
Other Directorships Held, Previous Position(s) and Qualifications |
John T. Collins
Birth Date: January 24, 1947
Trustee
Indefinite Term
Began serving: September 2013 | Principal Occupations: Director or Trustee of the Federated Hermes Fund Family; formerly, Chairman and CEO, The Collins Group, Inc. (a private equity firm) (Retired).
Other Directorships Held: Director, Chairman of the Compensation Committee, KLX Energy Services Holdings, Inc. (oilfield services); former Director of KLX Corp. (aerospace).
Qualifications: Mr. Collins has served in several business and financial management roles and directorship positions throughout his career. Mr. Collins previously served as Chairman and CEO of The Collins Group, Inc. (a private equity firm) and as a Director of KLX Corp. Mr. Collins serves as Chairman Emeriti, Bentley University. Mr. Collins previously served as Director and Audit Committee Member, Bank of America Corp.; Director, FleetBoston Financial Corp.; and Director, Beth Israel Deaconess Medical Center (Harvard University Affiliate Hospital). |
Annual Shareholder Report
Name
Birth Date
Positions Held with Trust
Date Service Began | Principal Occupation(s) for Past Five Years,
Other Directorships Held, Previous Position(s) and Qualifications |
G. Thomas Hough
Birth Date: February 28, 1955
Trustee
Indefinite Term
Began serving: August 2015 | Principal Occupations: Director or Trustee, Chair of the Audit Committee of the Federated Hermes Fund Family; formerly, Vice Chair, Ernst & Young LLP (public accounting firm) (Retired).
Other Directorships Held: Director, Chair of the Audit Committee, Equifax, Inc.; Director, Member of the Audit Committee, Haverty Furniture Companies, Inc.; formerly, Director, Member of Governance and Compensation Committees, Publix Super Markets, Inc.
Qualifications: Mr. Hough has served in accounting, business management and directorship positions throughout his career. Mr. Hough most recently held the position of Americas Vice Chair of Assurance with Ernst & Young LLP (public accounting firm). Mr. Hough serves on the President's Cabinet and Business School Board of Visitors for the University of Alabama. Mr. Hough previously served on the Business School Board of Visitors for Wake Forest University, and he previously served as an Executive Committee member of the United States Golf Association. |
Maureen Lally-Green
Birth Date: July 5, 1949
Trustee
Indefinite Term
Began serving: August 2009 | Principal Occupations: Director or Trustee of the Federated Hermes Fund Family; Adjunct Professor of Law, Duquesne University School of Law; formerly, Dean of the Duquesne University School of Law and Professor of Law and Interim Dean of the Duquesne University School of Law; formerly, Associate General Secretary and Director, Office of Church Relations, Diocese of Pittsburgh.
Other Directorships Held: Director, CNX Resources Corporation (formerly known as CONSOL Energy Inc.).
Qualifications: Judge Lally-Green has served in various legal and business roles and directorship positions throughout her career. Judge Lally-Green previously held the position of Dean of the School of Law of Duquesne University (as well as Interim Dean). Judge Lally-Green previously served as a member of the Superior Court of Pennsylvania and as a Professor of Law, Duquesne University School of Law. Judge Lally-Green was appointed by the Supreme Court of Pennsylvania to serve on the Supreme Court's Board of Continuing Judicial Education and the Supreme Court's Appellate Court Procedural Rules Committee. Judge Lally-Green also currently holds the positions on not for profit or for profit boards of directors as follows: Director and Chair, UPMC Mercy Hospital; Director and Vice Chair, Our Campaign for the Church Alive!, Inc.; Regent, Saint Vincent Seminary; Member, Pennsylvania State Board of Education (public); Director, Catholic Charities, Pittsburgh; and Director CNX Resources Corporation (formerly known as CONSOL Energy Inc.). Judge Lally-Green has held the positions of: Director, Auberle; Director, Epilepsy Foundation of Western and Central Pennsylvania; Director, Ireland Institute of Pittsburgh; Director, Saint Thomas More Society; Director and Chair, Catholic High Schools of the Diocese of Pittsburgh, Inc.; Director, Pennsylvania Bar Institute; Director, St. Vincent College; and Director and Chair, North Catholic High School, Inc. |
Charles F. Mansfield, Jr.
Birth Date: April 10, 1945
Trustee
Indefinite Term
Began serving: February 2008 | Principal Occupations: Director or Trustee of the Federated Hermes Fund Family; Management Consultant and Author.
Other Directorships Held: None.
Qualifications: Mr. Mansfield has served as a Marine Corps officer and in several banking, business management, educational roles and directorship positions throughout his long career. He remains active as a Management Consultant and Author. |
Thomas M. O'Neill
Birth Date: June 14, 1951
Trustee
Indefinite Term
Began serving: February 2008 | Principal Occupations: Director or Trustee of the Federated Hermes Fund Family; Sole Proprietor, Navigator Management Company (investment and strategic consulting).
Other Directorships Held: None.
Qualifications: Mr. O'Neill has served in several business, mutual fund and financial management roles and directorship positions throughout his career. Mr. O'Neill serves as Director, Medicines for Humanity and Director, The Golisano Children's Museum of Naples, Florida. Mr. O'Neill previously served as Chief Executive Officer and President, Managing Director and Chief Investment Officer, Fleet Investment Advisors; President and Chief Executive Officer, Aeltus Investment Management, Inc.; General Partner, Hellman, Jordan Management Co., Boston, MA; Chief Investment Officer, The Putnam Companies, Boston, MA; Credit Analyst and Lending Officer, Fleet Bank; Director and Consultant, EZE Castle Software (investment order management software); and Director, Midway Pacific (lumber). |
P. Jerome Richey
Birth Date: February 23, 1949
Trustee
Indefinite Term
Began serving: September 2013 | Principal Occupations: Director or Trustee of the Federated Hermes Fund Family; Management Consultant; Retired; formerly, Senior Vice Chancellor and Chief Legal Officer, University of Pittsburgh and Executive Vice President and Chief Legal Officer, CNX Resources Corporation (formerly known as CONSOL Energy Inc.).
Other Directorships Held: None.
Qualifications: Mr. Richey has served in several business and legal management roles and directorship positions throughout his career. Mr. Richey most recently held the positions of Senior Vice Chancellor and Chief Legal Officer, University of Pittsburgh. Mr. Richey previously served as Chairman of the Board, Epilepsy Foundation of Western Pennsylvania and Chairman of the Board, World Affairs Council of Pittsburgh. Mr. Richey previously served as Chief Legal Officer and Executive Vice President, CNX Resources Corporation (formerly known as CONSOL Energy Inc.); and Board Member, Ethics Counsel and Shareholder, Buchanan Ingersoll & Rooney PC (a law firm). |
Annual Shareholder Report
Name
Birth Date
Positions Held with Trust
Date Service Began | Principal Occupation(s) for Past Five Years,
Other Directorships Held, Previous Position(s) and Qualifications |
John S. Walsh
Birth Date: November 28, 1957
Trustee
Indefinite Term
Began serving: February 2008 | Principal Occupations: Director or Trustee, and Chair of the Board of Directors or Trustees, of the Federated Hermes Fund Family; President and Director, Heat Wagon, Inc. (manufacturer of construction temporary heaters); President and Director, Manufacturers Products, Inc. (distributor of portable construction heaters); President, Portable Heater Parts, a division of Manufacturers Products, Inc.
Other Directorships Held: None.
Qualifications: Mr. Walsh has served in several business management roles and directorship positions throughout his career. Mr. Walsh previously served as Vice President, Walsh & Kelly, Inc. (paving contractors). |
OFFICERS
Name
Birth Date
Address
Positions Held with Trust
Date Service Began | Principal Occupation(s) for Past Five Years
and Previous Position(s) |
Lori A. Hensler
Birth Date: January 6, 1967
TREASURER
Officer since: April 2013 | Principal Occupations: Principal Financial Officer and Treasurer of the Federated Hermes Fund Family; Senior Vice President, Federated Administrative Services; Financial and Operations Principal for Federated Securities Corp. and Edgewood Services, Inc.; and Assistant Treasurer, Federated Investors Trust Company. Ms. Hensler has received the Certified Public Accountant designation.
Previous Positions: Controller of Federated Hermes, Inc.; Senior Vice President and Assistant Treasurer, Federated Investors Management Company; Treasurer, Federated Investors Trust Company; Assistant Treasurer, Federated Administrative Services, Federated Administrative Services, Inc., Federated Securities Corp., Edgewood Services, Inc., Federated Advisory Services Company, Federated Equity Management Company of Pennsylvania, Federated Global Investment Management Corp., Federated Investment Counseling, Federated Investment Management Company, Passport Research, Ltd., and Federated MDTA, LLC; Financial and Operations Principal for Federated Securities Corp., Edgewood Services, Inc. and Southpointe Distribution Services, Inc. |
Peter J. Germain
Birth Date: September 3, 1959
CHIEF LEGAL OFFICER, SECRETARY and EXECUTIVE VICE PRESIDENT
Officer since: February 2008 | Principal Occupations: Mr. Germain is Chief Legal Officer, Secretary and Executive Vice President of the Federated Hermes Fund Family. He is General Counsel, Chief Legal Officer, Secretary and Executive Vice President, Federated Hermes, Inc.; Trustee and Senior Vice President, Federated Investors Management Company; Trustee and President, Federated Administrative Services; Director and President, Federated Administrative Services, Inc.; Director and Vice President, Federated Securities Corp.; Director and Secretary, Federated Private Asset Management, Inc.; Secretary, Federated Shareholder Services Company; and Secretary, Retirement Plan Service Company of America. Mr. Germain joined Federated Hermes in 1984 and is a member of the Pennsylvania Bar Association.
Previous Positions: Deputy General Counsel, Special Counsel, Managing Director of Mutual Fund Services, Federated Hermes, Inc.; Senior Vice President, Federated Services Company; and Senior Corporate Counsel, Federated Hermes, Inc. |
Stephen Van Meter
Birth Date: June 5, 1975
CHIEF COMPLIANCE OFFICER AND SENIOR VICE PRESIDENT
Officer since: July 2015 | Principal Occupations: Senior Vice President and Chief Compliance Officer of the Federated Hermes Fund Family; Vice President and Chief Compliance Officer of Federated Hermes, Inc. and Chief Compliance Officer of certain of its subsidiaries. Mr. Van Meter joined Federated Hermes, Inc. in October 2011. He holds FINRA licenses under Series 3, 7, 24 and 66.
Previous Positions: Mr. Van Meter previously held the position of Compliance Operating Officer, Federated Hermes, Inc. Prior to joining Federated Hermes, Inc., Mr. Van Meter served at the United States Securities and Exchange Commission in the positions of Senior Counsel, Office of Chief Counsel, Division of Investment Management and Senior Counsel, Division of Enforcement. |
Robert J. Ostrowski
Birth Date: April 26, 1963
Chief Investment Officer
Officer since: February 2008 | Principal Occupations: Robert J. Ostrowski joined Federated Hermes in 1987 as an Investment Analyst and became a Portfolio Manager in 1990. He was named Chief Investment Officer of Federated Hermes' taxable fixed-income products in 2004 and also serves as a Senior Portfolio Manager. Mr. Ostrowski became an Executive Vice President of the Fund's Adviser in 2009 and served as a Senior Vice President of the Fund's Adviser from 1997 to 2009. Mr. Ostrowski has received the Chartered Financial Analyst designation. He received his M.S. in Industrial Administration from Carnegie Mellon University. |
Chris McGinley
Birth Date: July 28, 1978
Vice President
Officer since: June 2012
Portfolio Manager since: December 2009 | Principal Occupations:Chris McGinleyhas been the Fund's Portfolio Manager since December 2009. He is Vice President of the Trust with respect to the Fund. Mr. McGinley joined Federated Hermes in 2004 as an associate research analyst in the international fixed-income department. He became an Assistant Vice President of the Fund's Adviser in 2005. Mr. McGinley worked in Senator Rick Santorum's office in 2001 and from 2002 to 2004 he served as Legislative Correspondent for Senator Santorum. Mr. McGinley earned his B.S. and received his M.P.I.A. from the University of Pittsburgh. |
Ihab Salib
Birth Date: December 14, 1964
VICE PRESIDENT
Officer since: June 2012
Portfolio Manager since:
August 2009
| Principal Occupations: Ihab Salib has been a Portfolio Manager of the Fund since August 2009. He is Vice President of the Trust with respect to the Fund. Mr. Salib joined Federated Hermes in April 1999 as a Senior Fixed-Income Trader/Assistant Vice President of the Fund's Adviser. In July 2000, he was named a Vice President of the Fund's Adviser and in January 2007 he was named a Senior Vice President of the Fund's Adviser. He has served as a Portfolio Manager since January 2002. From January 1994 through March 1999, Mr. Salib was employed as a Senior Global Fixed-Income Analyst with UBS Brinson, Inc. Mr. Salib received his B.A. with a major in Economics from Stony Brook University. |
Annual Shareholder Report
Name
Birth Date
Address
Positions Held with Trust
Date Service Began | Principal Occupation(s) for Past Five Years
and Previous Position(s) |
Maarten Offeringa
Birth Date: February 1, 1976
Vice President
Officer since: August 2019
Portfolio Manager since:
July 2019 | Principal Occupations: Maarten Offeringa has been the Fund's portfolio manager since July 2019. He is Vice President of the Trust with respect to the Fund. Mr. Offeringa joined Federated Hermes in 2018. Mr. Offeringa is responsible for providing research and advice on sector allocation and security selection. He has worked in financial services since 2002; has worked in investment management since 2018; has managed investment portfolios since 2019. Previous associations: Director, Bank of America Merrill Lynch; Vice President, J.P. Morgan. Education: MA, Vrije Universiteit Amsterdam. |
Annual Shareholder Report
Evaluation and Approval of Advisory Contract–May 2019
Federated Project and Trade Finance Core Fund (the “Fund”)
At its meetings in May 2019, the Fund's Board of Trustees (the “Board”), including a majority of those Trustees who are not “interested persons” of the Fund, as defined in the Investment Company Act of 1940 (the “Independent Trustees”), reviewed and unanimously approved the continuation of the Fund's investment advisory and subadvisory contracts for an additional one-year term. The Board's decision regarding the contracts reflects the exercise of its business judgment after considering all of the information received on whether to continue the existing arrangements.
The Fund is distinctive in that it is designed for the efficient management of a particular asset class and is made available for investment only to other Federated Funds and a limited number of other accredited investors.
Although Federated Investment Management Company (the “Adviser”) charges the Fund an investment advisory fee for its services, the Adviser has agreed to waive its fee and/or reimburse the Fund so that total Fund expenses are zero. The Adviser or its affiliates (collectively, “Federated”) may, however, receive compensation for managing assets invested in the Fund.
At the request of the Independent Trustees, the Fund's Chief Compliance Officer (the CCO) furnished to the Board in advance of its May 2019 meetings an independent written evaluation presenting on the topics discussed below. The Board considered the CCO's independent written evaluation (the “CCO Fee Evaluation Report”), along with other information, in evaluating the reasonableness of the Fund's management fee and in deciding to approve the continuation of the investment advisory and subadvisory contracts. The CCO, in preparing the CCO Fee Evaluation Report, has the authority to retain consultants, experts or staff as reasonably necessary to assist in the performance of his duties, reports directly to the Board, and can be terminated only with the approval of a majority of the Independent Trustees. At the request of the Independent Trustees, the CCO Fee Evaluation Report followed the same general approach and covered the same topics as that of the report that had previously been delivered by the CCO in his capacity as “Senior Officer,” prior to the elimination of the Senior Officer position in December 2017.
As previously noted, the Adviser charges the Fund an investment advisory fee for its services but has agreed to waive its fee and/or reimburse the Fund so that total fund expenses are zero. However, the Board did consider compensation and benefits received by the Adviser and subadviser, including fees received for services provided to the Fund by Federated and research services received by the Adviser from brokers that execute trades for funds advised by Federated (each, a “Federated Fund”). The Board also considered judicial decisions concerning allegedly excessive investment advisory fees in making its decision. Using these judicial decisions as a guide, the Board observed that the following factors may be relevant to an adviser's fiduciary duty with respect to its receipt of compensation from a fund: (1) the nature and quality of the services provided by an adviser to a fund and its shareholders (including the performance of the fund, its benchmark, and comparable funds); (2) an adviser's cost of providing the services (including the profitability to an adviser of providing advisory services to a fund); (3) the extent to which an adviser may realize “economies of scale” as a fund grows larger and, if such economies of scale exist, whether they have been shared with a fund and its shareholders or the family of funds; (4) any “fall-out” financial benefits that accrue to an adviser because of its relationship with a fund (including research services received from brokers that execute fund trades and any fees paid to affiliates of an adviser for services rendered to a fund); (5) comparative fee and expense structures (including a comparison of fees paid to an adviser with those paid by similar funds both internally and externally as well as management fees charged to institutional and other advisory clients of the adviser for what might be viewed as like services); and (6) the extent of care, conscientiousness and independence with which the fund's board members perform their duties and their expertise (including whether they are fully informed about all facts the board deems relevant to its consideration of an adviser's services and fees). The Board noted that the Securities and Exchange Commission (SEC) disclosure requirements regarding the basis for the Board's approval of the Fund's investment advisory and subadvisory contracts generally align with the factors listed above. The Board was aware of these factors and was guided by them in its review of the Fund's investment advisory and subadvisory contracts to the extent it considered them to be appropriate and relevant, as discussed further below.
The Board considered and weighed these factors in light of its substantial accumulated experience in governing the Fund and working with Federated on matters relating to the Federated Funds. The Independent Trustees were assisted in their deliberations by independent legal counsel.
In addition to the extensive materials that comprise and accompany the CCO Fee Evaluation Report, the Board received detailed information about the Fund and the Federated organization throughout the year, and in connection with its May meetings at which the Board's formal approval of the advisory and subadvisory contracts occurred. In this regard, Federated provided much of this information at each regular meeting of the Board, and furnished additional information specifically in connection with the May meetings. In the months preceding the May meetings, the Board requested and reviewed written materials prepared by Federated in response to requests on behalf of the Independent Trustees encompassing a wide variety of topics. At the May meetings, in addition to meeting in separate sessions of the Independent Trustees without
Annual Shareholder Report
management present senior management of the Adviser also met with the Independent Trustees and their counsel to discuss the materials presented and such additional matters as the Independent Trustees deemed reasonably necessary to evaluate the advisory and subadvisory contracts. Between regularly scheduled meetings, the Board also received information on particular matters as the need arose.
The Board's consideration of the investment advisory and subadvisory contracts included review of the CCO Fee Evaluation Report, accompanying data and additional information covering the following matters, as among others: the Adviser's and sub-adviser's investment philosophy, revenue, profitability, personnel and processes; investment and operating strategies; the Fund's short-term and long-term performance (in absolute terms, both on a gross basis and net of expenses, as well as in terms relative to its particular investment program and certain competitor or “peer group” funds and/or other benchmarks, as appropriate) and comments on the reasons for performance; the Fund's investment objectives; the Fund's expenses, including the advisory fee and the overall expense structure of the Fund (both in absolute terms and relative to similar and/or competing funds), with due regard for contractual or voluntary expense limitations; the use and allocation of brokerage commissions derived from trading the Fund's portfolio securities (if any); and the nature, quality and extent of the advisory and other services provided to the Fund by the Adviser and its affiliates. The Board also considered the preferences and expectations of Fund shareholders; the entrepreneurial and other risks assumed by the Adviser in sponsoring the Fund; the continuing state of competition in the mutual fund industry and market practices; the range of comparable fees for similar funds in the mutual fund industry; the Fund's relationship to the Federated Funds which include a comprehensive array of funds with different investment objectives, policies and strategies which are generally available for exchange without the incurrence of additional sales charges; compliance and audit reports concerning the Federated Funds and the Federated companies that service them (including communications from regulatory agencies), as well as Federated's responses to any issues raised therein; and relevant developments in the mutual fund industry and how the Federated Funds and/or Federated are responding to them. The Board's evaluation process is evolutionary. The criteria considered and the emphasis placed on relevant criteria change in recognition of changing circumstances in the mutual fund marketplace.
The Board considered the nature, extent and quality of the services provided to the Fund by the Adviser and the resources of the Adviser and its affiliates dedicated to the Fund. In this regard, the Board evaluated, among other things, the Adviser's personnel, experience, track record, financial resources, overall reputation and willingness to invest in personnel and infrastructure that benefit the Fund. In addition, the Board reviewed the qualifications, backgrounds and responsibilities of the portfolio management team primarily responsible for the day-to-day management of the Fund and the Adviser's ability and experience in attracting and retaining qualified personnel to service the Fund. The Board noted the investment research and company engagement capabilities of the Adviser and its affiliates. The Board also noted the compliance program of the Adviser and the compliance-related resources provided to the Fund by the Adviser, including the Adviser's commitment to respond to rulemaking initiatives of the SEC. The Fund's ability to deliver competitive performance when compared to its benchmark index was also deemed to be relevant by the Board as a useful indicator of how the Adviser is executing the Fund's investment program. The Adviser's ability to execute this program was one of the Board's considerations in reaching a conclusion that the nature, extent, and quality of the Adviser's investment management services warrant the continuation of the investment advisory and subadvisory contracts.
The Board was informed by the Adviser that, for the periods covered by the CCO Fee Evaluation Report, the Fund outperformed its benchmark index for the one-year, three-year and five-year periods.
Following such evaluation, and full deliberations, the Board concluded that the performance of the Fund supported renewal of the Fund's investment advisory and subadvisory contracts.
Because the Fund's expenses will remain at zero due to waiver of the investment advisory fee and/or reimbursement of expenses, the Board does not consider fee comparisons to other mutual funds or other institutional or separate accounts to be relevant to its deliberations.
The Board also received financial information about Federated, including information regarding the compensation and ancillary (or “fall-out”) benefits Federated derived from its relationships with the Federated Funds. This information covered not only the fees under the investment advisory contracts, but also fees received by Federated's subsidiaries for providing other services to the Federated Funds under separate contracts (e.g., for serving as the Federated Funds' administrator and distributor). In this regard, the Board considered that certain Federated subsidiaries provide distribution and shareholder services to the Federated Funds, for which they may be compensated through distribution and servicing fees paid pursuant to Rule 12b-1 plans or otherwise. The information also detailed any indirect benefit Federated may derive from its receipt of research services from brokers who execute Federated Fund trades. In addition, the Board considered the fact that, in order for a Federated Fund to be competitive in the marketplace, the Adviser and its affiliates frequently waived fees and/or reimbursed expenses and have disclosed to Federated Fund investors and/or indicated to the Board their intention to do so in the future. Moreover, the Board receives regular reporting as to the institution, adjustment or elimination of these voluntary waivers.
The Board considered Federated's previous reductions in contractual management fees to certain Federated Funds in response to the CCO's recommendations in the prior year's CCO Fee Evaluation Report.
Annual Shareholder Report
The Board and the CCO also reviewed information compiled by Federated comparing its profitability information to other publicly held fund management companies, including information regarding profitability trends over time. In this regard, the CCO concluded that Federated's profit margins did not appear to be excessive. The CCO also noted that Federated appeared financially sound, with the resources necessary to fulfill its obligations under its contracts with the Fund.
The CCO stated that his observations and the information accompanying the CCO Fee Evaluation Report supported a finding by the Board that the management fee for the Fund was reasonable. Under these circumstances, no changes were recommended to, and no objection was raised to, the continuation of the Fund's investment advisory and subadvisory contracts. The CCO also recognized that the Board's evaluation of the Federated Funds' advisory and subadvisory arrangements is a continuing and on-going process that is informed by the information that the Board requests and receives from management throughout the course of the year and, in this regard, the CCO noted certain items for future reporting to the Board or further consideration by management as the Board continues its on-going oversight of the Federated Funds.
In its decision to continue an existing investment advisory contract, the Board was mindful of the potential disruptions of the Fund's operations and various risks, uncertainties and other effects that could occur as a result of a decision to terminate or not renew an investment advisory contract. In particular, the Board recognized that many shareholders have invested in the Fund on the strength of the Adviser's industry standing and reputation and with the expectation that the Adviser will have a continuing role in providing advisory services to the Fund. Thus, the Board's approval of the investment advisory contract reflected the fact that it is the shareholders who have effectively selected the Adviser by virtue of having invested in the Fund. The Board concluded that, in light of the factors summarized above, including the nature, quality and scope of the services provided to the Fund by the Adviser and its affiliates, continuation of the investment advisory and subadvisory contracts was appropriate.
The Board based its decision to approve the investment advisory and subadvisory contracts on the totality of the circumstances and relevant factors and with a view to past and future long-term considerations. Not all of the factors and considerations identified above were necessarily relevant to the Fund, nor did the Board consider any one of them to be determinative. In particular, due to the unusual nature of the Fund as primarily an internal product with no net advisory fee, the Board does not consider the assessment of whether economies of scale would be realized if the Fund were to grow to a sufficient size to be particularly relevant. With respect to the factors that were relevant, the Board's decision to approve the continuation of the contracts reflects its view that Federated's performance and actions provided a satisfactory basis to support the decision to continue the existing arrangements.
Annual Shareholder Report
Voting Proxies on Fund Portfolio Securities
A description of the policies and procedures that the Fund uses to determine how to vote proxies, if any, relating to securities held in the Fund's portfolio, as well as a report on “Form N-PX” of how the Fund voted any such proxies during the most recent 12-month period ended June 30, are available, without charge and upon request, by calling 1-800-341-7400. A report on “Form N-PX” of how the Fund voted any such proxies during the most recent 12-month period ended June 30 is available via the Proxy Voting Record (Form N-PX) link associated with the Fund at www.FederatedInvestors.com under the “Private Funds” section of the “Products” tab, where you will be directed to a statement of agreement that you are an “accredited investor” before proceeding. Click “I agree” to agree to the terms then you will be taken to the “Private Funds” home page where you can select the appropriate asset class or category. Select a Fund to access the “Documents” tab. Form N-PX filings are also available at the SEC's website at www.sec.gov.
Quarterly Portfolio Schedule
Each fiscal quarter, the Fund will file with the SEC a complete schedule of its monthly portfolio holdings on “Form N-PORT.” The Fund's holdings as of the end of the third month of every fiscal quarter, as reported on Form N-PORT, will be publicly available on the SEC's website at www.sec.gov within 60 days of the end of the fiscal quarter upon filing. You may also access this information at www.FederatedInvestors.com under the “Private Funds” section of the “Products” tab, where you will be directed to a statement of agreement that you are an “accredited investor” before proceeding. Click “I agree” to agree to the terms then you will be taken to the “Private Funds” home page where you can select the appropriate asset class or category. Select a Fund to access the “Characteristics” tab.
Annual Shareholder Report
The Fund is not a bank deposit or obligation, is not guaranteed by any bank and is not insured or guaranteed by the U.S. government, the Federal Deposit Insurance Corporation, the Federal Reserve Board or any other government agency. Investment in the Fund involves investment risk, including the possible loss of principal.
This Report is authorized for distribution to prospective investors only when preceded or accompanied by the Fund's Private Offering Memorandum, which contains facts concerning its objective and policies, management fees, expenses and other information.
Federated Project and Trade Finance Core Fund
Federated Hermes Funds
4000 Ericsson Drive
Warrendale, PA 15086-7561
Contact us at FederatedInvestors.com
or call 1-800-341-7400.
Federated Securities Corp., Placement Agent
CUSIP 31415N103
Q450320 (5/20)
© 2020 Federated Hermes, Inc.
(a) As of the end of the period covered by this report, the registrant has adopted a code of ethics (the "Section 406 Standards for Investment Companies - Ethical Standards for Principal Executive and Financial Officers") that applies to the registrant's Principal Executive Officer and Principal Financial Officer; the registrant's Principal Financial Officer also serves as the Principal Accounting Officer.
(c) There was no amendment to the registrant’s code of ethics described in Item 2(a) above during the period covered by the report.
(d) There was no waiver granted, either actual or implicit, from a provision to the registrant’s code of ethics described in Item 2(a) above during the period covered by the report.
(e) Not Applicable
(f)(3) The registrant hereby undertakes to provide any person, without charge, upon request, a copy of the code of ethics. To request a copy of the code of ethics, contact the registrant at 1-800-341-7400, and ask for a copy of the Section 406 Standards for Investment Companies - Ethical Standards for Principal Executive and Financial Officers.
Item 3. Audit Committee Financial Expert
The registrant's Board has determined that each of the following members of the Board's Audit Committee is an “audit committee financial expert,” and is "independent," for purposes of this Item: John T. Collins, G. Thomas Hough and Thomas M. O'Neill.
| Item 4. | Principal Accountant Fees and Services |
(a) Audit Fees billed to the registrant for the two most recent fiscal years:
Fiscal year ended 2020 - $98,290
Fiscal year ended 2019 - $118,820
(b) Audit-Related Fees billed to the registrant for the two most recent fiscal years:
Fiscal year ended 2020 - $0
Fiscal year ended 2019 - $0
Amount requiring approval of the registrant’s audit committee pursuant to paragraph (c)(7)(ii) of Rule 2-01 of Regulation S-X, $0 and $0 respectively.
(c) Tax Fees billed to the registrant for the two most recent fiscal years:
Fiscal year ended 2020 - $0
Fiscal year ended 2019 – $0
Amount requiring approval of the registrant’s audit committee pursuant to paragraph (c)(7)(ii) of Rule 2-01 of Regulation S-X, $0 and $0 respectively.
(d) All Other Fees billed to the registrant for the two most recent fiscal years:
Fiscal year ended 2020 - $0
Fiscal year ended 2019 – $0
Amount requiring approval of the registrant’s audit committee pursuant to paragraph (c)(7)(ii) of Rule 2-01 of Regulation S-X, $0 and $0 respectively.
(e)(1) Audit Committee Policies regarding Pre-approval of Services.
The Audit Committee is required to pre-approve audit and non-audit services performed by the independent auditor in order to assure that the provision of such services do not impair the auditor’s independence. Unless a type of service to be provided by the independent auditor has received general pre-approval, it will require specific pre-approval by the Audit Committee. Any proposed services exceeding pre-approved cost levels will require specific pre-approval by the Audit Committee.
Certain services have the general pre-approval of the Audit Committee. The term of the general pre-approval is 12 months from the date of pre-approval, unless the Audit Committee specifically provides for a different period. The Audit Committee will annually review the services that may be provided by the independent auditor without obtaining specific pre-approval from the Audit Committee and may grant general pre-approval for such services. The Audit Committee will revise the list of general pre-approved services from time to time, based on subsequent determinations. The Audit Committee will not delegate its responsibilities to pre-approve services performed by the independent auditor to management.
The Audit Committee has delegated pre-approval authority to its Chairman. The Chairman will report any pre-approval decisions to the Audit Committee at its next scheduled meeting. The Committee will designate another member with such pre-approval authority when the Chairman is unavailable.
AUDIT SERVICES
The annual Audit services engagement terms and fees will be subject to the specific pre-approval of the Audit Committee. The Audit Committee must approve any changes in terms, conditions and fees resulting from changes in audit scope, registered investment company (RIC) structure or other matters.
In addition to the annual Audit services engagement specifically approved by the Audit Committee, the Audit Committee may grant general pre-approval for other Audit Services, which are those services that only the independent auditor reasonably can provide. The Audit Committee has pre-approved certain Audit services, all other Audit services must be specifically pre-approved by the Audit Committee.
AUDIT-RELATED SERVICES
Audit-related services are assurance and related services that are reasonably related to the performance of the audit or review of the Company’s financial statements or that are traditionally performed by the independent auditor. The Audit Committee believes that the provision of Audit-related services does not impair the independence of the auditor, and has pre-approved certain Audit-related services, all other Audit-related services must be specifically pre-approved by the Audit Committee.
TAX SERVICES
The Audit Committee believes that the independent auditor can provide Tax services to the Company such as tax compliance, tax planning and tax advice without impairing the auditor’s independence. However, the Audit Committee will not permit the retention of the independent auditor in connection with a transaction initially recommended by the independent auditor, the purpose of which may be tax avoidance and the tax treatment of which may not be supported in the Internal Revenue Code and related regulations. The Audit Committee has pre-approved certain Tax services, all Tax services involving large and complex transactions must be specifically pre-approved by the Audit Committee.
ALL OTHER SERVICES
With respect to the provision of services other than audit, review or attest services the pre-approval requirement is waived if:
| (1) | The aggregate amount of all such services provided constitutes no more than five percent of the total amount of revenues paid by the registrant, the registrant’s adviser (not including any sub-adviser whose role is primarily portfolio management and is subcontracted with or overseen by another investment adviser), and any entity controlling, controlled by, or under common control with the investment adviser that provides ongoing services to the registrant to its accountant during the fiscal year in which the services are provided; |
| (2) | Such services were not recognized by the registrant, the registrant’s adviser (not including any sub-adviser whose role is primarily portfolio management and is subcontracted with or overseen by another investment adviser), and any entity controlling, controlled by, or under common control with the investment adviser that provides ongoing services to the registrant at the time of the engagement to be non-audit services; and |
| (3) | Such services are promptly brought to the attention of the Audit Committee of the issuer and approved prior to the completion of the audit by the Audit Committee or by one or more members of the Audit Committee who are members of the board of directors to whom authority to grant such approvals has been delegated by the Audit Committee. |
The Audit Committee may grant general pre-approval to those permissible non-audit services classified as All Other services that it believes are routine and recurring services, and would not impair the independence of the auditor.
The SEC’s rules and relevant guidance should be consulted to determine the precise definitions of prohibited non-audit services and the applicability of exceptions to certain of the prohibitions.
PRE-APPROVAL FEE LEVELS
Pre-approval fee levels for all services to be provided by the independent auditor will be established annually by the Audit Committee. Any proposed services exceeding these levels will require specific pre-approval by the Audit Committee.
PROCEDURES
Requests or applications to provide services that require specific approval by the Audit Committee will be submitted to the Audit Committee by both the independent auditor and the Principal Accounting Officer and/or Internal Auditor, and must include a joint statement as to whether, in their view, the request or application is consistent with the SEC’s rules on auditor independence.
(e)(2) Percentage of services identified in items 4(b) through 4(d) that were approved by the registrants audit committee pursuant to paragraph (c)(7)(i)(C) of Rule 2-01 of Regulation S-X:
4(b)
Fiscal year ended 2020 – 0%
Fiscal year ended 2019 – 0%
Percentage of services provided to the registrants investment adviser and any entity controlling, controlled by, or under common control with the investment adviser that provides ongoing services to the registrant that were approved by the registrants audit committee pursuant to paragraph (c)(7)(i)(C) of Rule 2-01 of Regulation S-X, 0% and NA respectively.
4(c)
Fiscal year ended 2020 – 0%
Fiscal year ended 2019 – 0%
Percentage of services provided to the registrants investment adviser and any entity controlling, controlled by, or under common control with the investment adviser that provides ongoing services to the registrant that were approved by the registrants audit committee pursuant to paragraph (c)(7)(i)(C) of Rule 2-01 of Regulation S-X, 0% and NA respectively.
4(d)
Fiscal year ended 2020 – 0%
Fiscal year ended 2019 – 0%
Percentage of services provided to the registrants investment adviser and any entity controlling, controlled by, or under common control with the investment adviser that provides ongoing services to the registrant that were approved by the registrants audit committee pursuant to paragraph (c)(7)(i)(C) of Rule 2-01 of Regulation S-X, 0% and NA respectively.
| (g) | Non-Audit Fees billed to the registrant, the registrant’s investment adviser, and certain entities controlling, controlled by or under common control with the investment adviser: |
Fiscal year ended 2020 - $49,337
Fiscal year ended 2019 - $0
| (h) | The registrant’s Audit Committee has considered that the provision of non-audit services that were rendered to the registrant’s adviser (not including any sub-adviser whose role is primarily portfolio management and is subcontracted with or overseen by another investment adviser), and any entity controlling, controlled by, or under common control with the investment adviser that provides ongoing services to the registrant that were not pre-approved pursuant to paragraph (c)(7)(ii) of Rule 2-01 of Regulation S-X is compatible with maintaining the principal accountant’s independence. |
The registrant’s management and Audit Committee continue to believe that the registrant’s registered public accounting firm, KPMG LLP (“KPMG”), has the ability to exercise objective and impartial judgment on all issues encompassed within its audit services. KPMG is required to make a determination that it satisfies certain independence requirements under the federal securities laws. Like other registrants, there is a risk that activities or relationships of KPMG, or its partners or employees, can prevent a determination from being made that it satisfies such independence requirements with respect to the registrant, which could render it ineligible to serve as the registrant’s independent public accountant.
In its required communications to the Audit Committee of the registrant’s Board, KPMG informed the Audit Committee that KPMG and/or covered person professionals within KPMG maintain lending relationships with certain owners of greater than 10% of the shares of certain investment companies within the “investment company complex” as defined under Rule 2-01(f)(14) of Regulation S-X, which are affiliates of the registrant. KPMG has advised the Audit Committee that these lending relationships implicate Rule 2-01(c)(1)(ii)(A) of Regulation S-X (referred to as the “Loan Rule”). The Loan Rule prohibits an independent public accountant, or covered person professionals at such firm, from having a financial relationship (such as a loan) with a lender that is a record or beneficial owner of more than 10% of an audit client’s equity securities. For purposes of the Loan Rule, audit clients include the registrant, as well as all registered investment companies audited by KPMG (collectively, the “KPMG Funds”).
KPMG informed the Audit Committee that KPMG believes that these lending relationships described above do not and will not impair KPMG’s ability to exercise objective and impartial judgment in connection with financial statement audits of the registrant and a reasonable investor with knowledge of all relevant facts and circumstances would conclude that KPMG has been and is capable of objective and impartial judgment on all issues encompassed within KPMG’s audits.
On June 20, 2016, the Division of Investment Management of the Securities and Exchange Commission (“SEC”) issued a no-action letter to another mutual fund complex (see Fidelity Management & Research Company et al., No-Action Letter) related to similar Loan Rule matters as those described above (the “Letter”). In the Letter, the SEC Staff confirmed that it would not recommend enforcement action against an investment company that relied on the audit services performed by an independent public accountant where the Loan Rule was implicated in certain specified circumstances provided that: (1) the auditor has complied with PCAOB Rule 3526(b)(1) and 3526(b)(2); (2) the Loan Rule is implicated because of lending relationships; and (3) notwithstanding such lending relationships that implicate the Loan Rule, the auditor has concluded that it is objective and impartial with respect to the issues encompassed within its engagement as auditor of the funds. The circumstances described in the Letter are substantially similar to the circumstances that implicated the Loan Rule with respect to EY and the registrant. On September 22, 2017, the SEC extended the expiration of the Letter until the effectiveness of any amendments to the Loan Rule designed to address the concerns in the Letter. On June 18, 2019, the SEC adopted amendments (effective October 3, 2019) to the Loan Rule, which, refocus the analysis that must be conducted to determine whether an auditor is independent when the auditor has a lending relationship with certain shareholders of an audit client at any time during an audit or professional engagement period.
If it were to be determined that the relief available under the Letter was improperly relied upon, or that the independence requirements under the federal securities laws were not complied with regarding the registrant, for certain periods, any of the registrant’s filings with the SEC which contain financial statements of the registrant for such periods may be determined not to be consistent with or comply with applicable federal securities laws, the registrant’s ability to offer shares under its current registration statement may be impacted, andcertain financial reporting and/or other covenants with, and representations and warranties to, the registrant’s lender under its committed line of credit may be impacted. Such eventscould have a material adverse effect on the registrant and the KPMG Funds.
| Item 5. | Audit Committee of Listed Registrants |
Not Applicable
| Item 6. | Schedule of Investments |
(a) The registrant’s Schedule of Investments is included as part of the Report to Stockholders filed under Item 1 of this form.
(b) Not Applicable; Fund had no divestments during the reporting period covered since the previous Form N-CSR filing.
| Item 7. | Disclosure of Proxy Voting Policies and Procedures for Closed-End Management Investment Companies |
Not Applicable
| Item 8. | Portfolio Managers of Closed-End Management Investment Companies |
Not Applicable
| Item 9. | Purchases of Equity Securities by Closed-End Management Investment Company and Affiliated Purchasers |
Not Applicable
| Item 10. | Submission of Matters to a Vote of Security Holders |
No Changes to Report
| Item 11. | Controls and Procedures |
(a) The registrant’s President and Treasurer have concluded that the
registrant’s disclosure controls and procedures (as defined in rule 30a-3(c) under the Act) are effective in design and operation and are sufficient to form the basis of the certifications required by Rule 30a-(2) under the Act, based on their evaluation of these disclosure controls and procedures within 90 days of the filing date of this report on Form N-CSR.
(b) There were no changes in the registrant’s internal control over financial reporting (as defined in rule 30a-3(d) under the Act) during the registrant’s most recent fiscal half-year (the registrant’s second fiscal half-year in the case of an annual report) that have materially affected, or are reasonably likely to materially affect, the registrant’s internal control over financial reporting.
| Item 12. | Disclosure of Securities Lending Activities for Closed-End Management Investment Companies |
Not Applicable
(a)(1) Code of Ethics- Not Applicable to this Report.
(a)(2) Certifications of Principal Executive Officer and Principal Financial Officer.
(a)(3) Not Applicable.
(b) Certifications pursuant to 18 U.S.C. Section 1350.
SIGNATURES
Pursuant to the requirements of the Securities Exchange Act of 1934 and the Investment Company Act of 1940, the registrant has duly caused this report to be signed on its behalf by the undersigned, thereunto duly authorized.
RegistrantFederated Core Trust III
By/S/ Lori A. Hensler
Lori A. Hensler, Principal Financial Officer
DateMay 27, 2020
Pursuant to the requirements of the Securities Exchange Act of 1934 and the Investment Company Act of 1940, this report has been signed below by the following persons on behalf of the registrant and in the capacities and on the dates indicated.
By/S/ J. Christopher Donahue
J. Christopher Donahue, Principal Executive Officer
DateMay 27, 2020
By/S/ Lori A. Hensler
Lori A. Hensler, Principal Financial Officer
DateMay 27, 2020
