
Clinical Detail March 2022 Exhibit 99.2
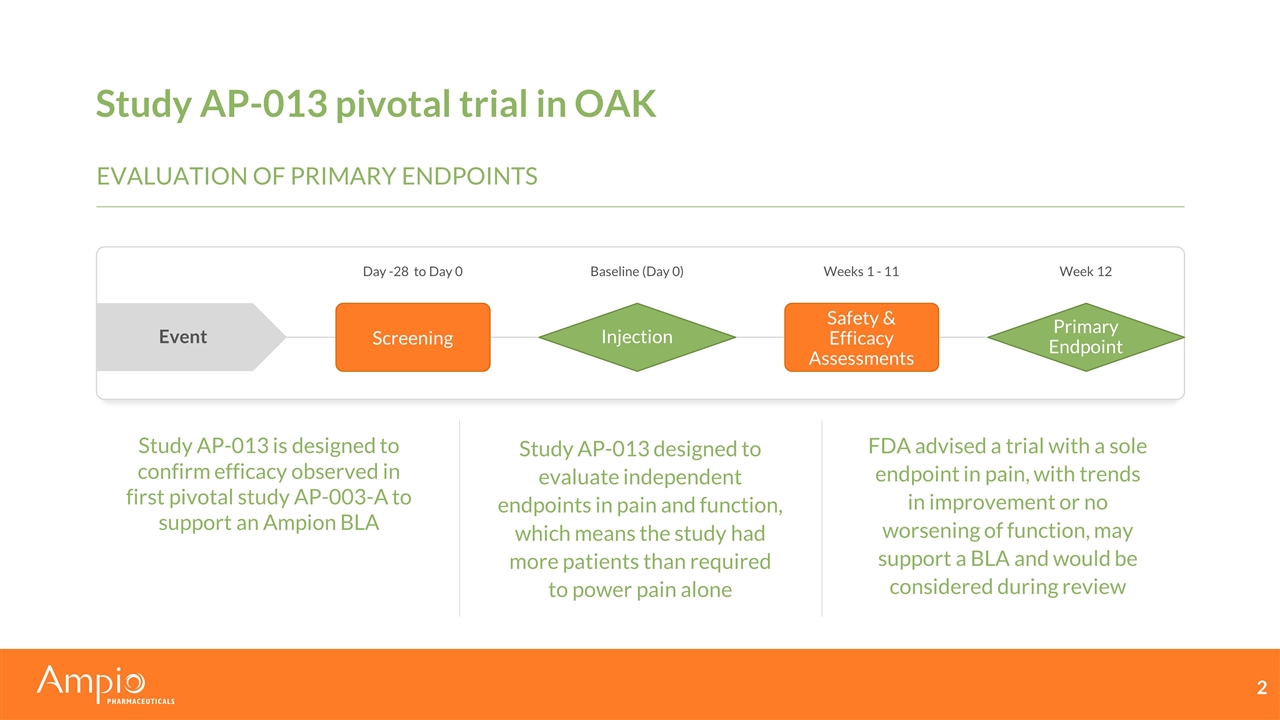
Study AP-013 pivotal trial in OAK Study AP-013 is designed to confirm efficacy observed in first pivotal study AP-003-A to support an Ampion BLA Study AP-013 designed to evaluate independent endpoints in pain and function, which means the study had more patients than required to power pain alone FDA advised a trial with a sole endpoint in pain, with trends in improvement or no worsening of function, may support a BLA and would be considered during review Screening Injection Safety & Efficacy Assessments Primary Endpoint Day -28 to Day 0 Baseline (Day 0) Weeks 1 - 11 Week 12 Event Evaluation of primary endpoints
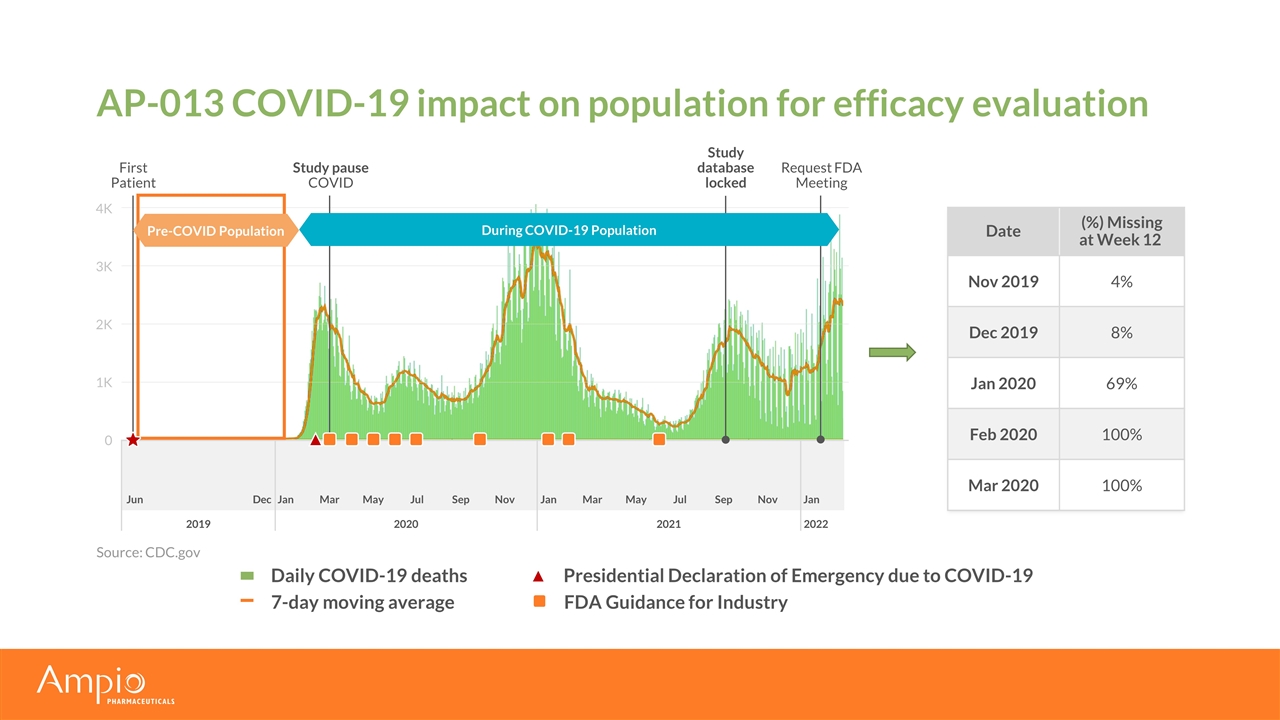
Jun Dec Jan Mar May Jul Sep Nov Jan Mar May Jul Sep Nov Jan AP-013 COVID-19 impact on population for efficacy evaluation Date (%) Missing at Week 12 Nov 2019 4% Dec 2019 8% Jan 2020 69% Feb 2020 100% Mar 2020 100% Source: CDC.gov Study pause COVID First Patient Request FDA Meeting 0 1K 2K 3K 4K 2019 2020 2021 2022 Daily COVID-19 deaths Study database locked Presidential Declaration of Emergency due to COVID-19 During COVID-19 Population Pre-COVID Population 7-day moving average FDA Guidance for Industry
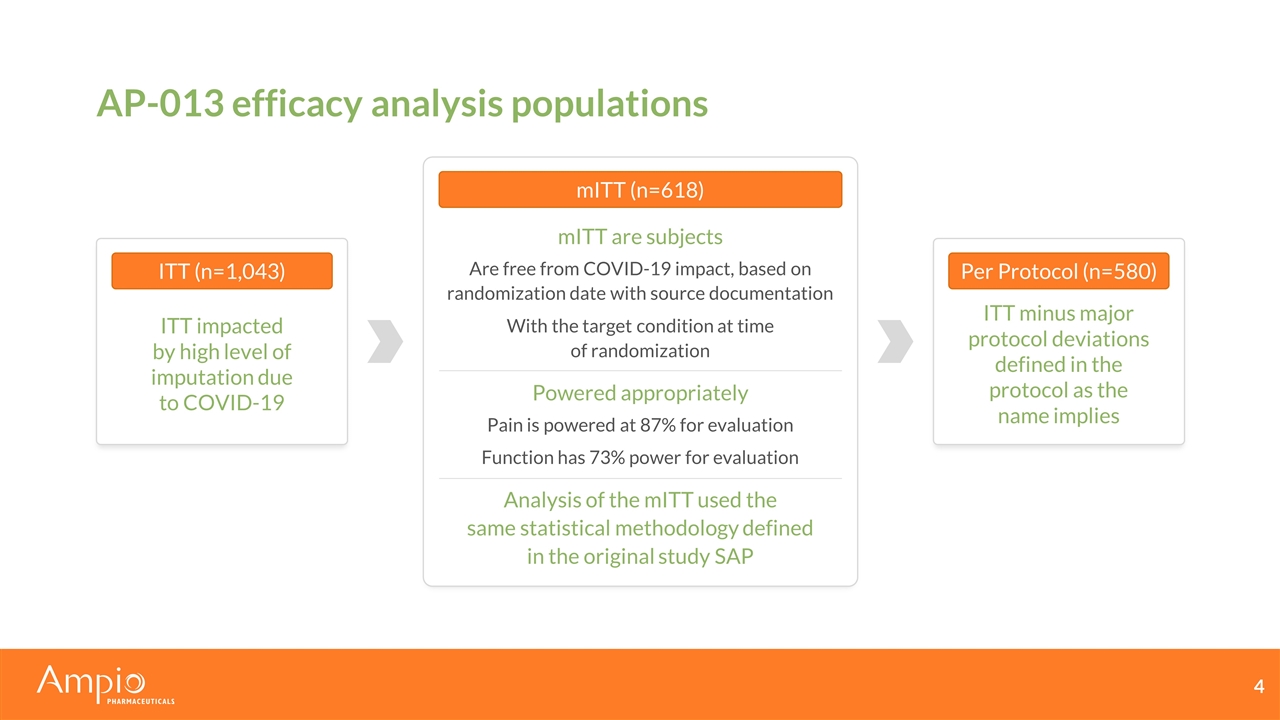
AP-013 efficacy analysis populations ITT (n=1,043) ITT impacted by high level of imputation due to COVID-19 mITT are subjects Are free from COVID-19 impact, based on randomization date with source documentation With the target condition at time of randomization Powered appropriately Pain is powered at 87% for evaluation Function has 73% power for evaluation Analysis of the mITT used the same statistical methodology defined in the original study SAP Per Protocol (n=580) ITT minus major protocol deviations defined in the protocol as the name implies mITT (n=618)
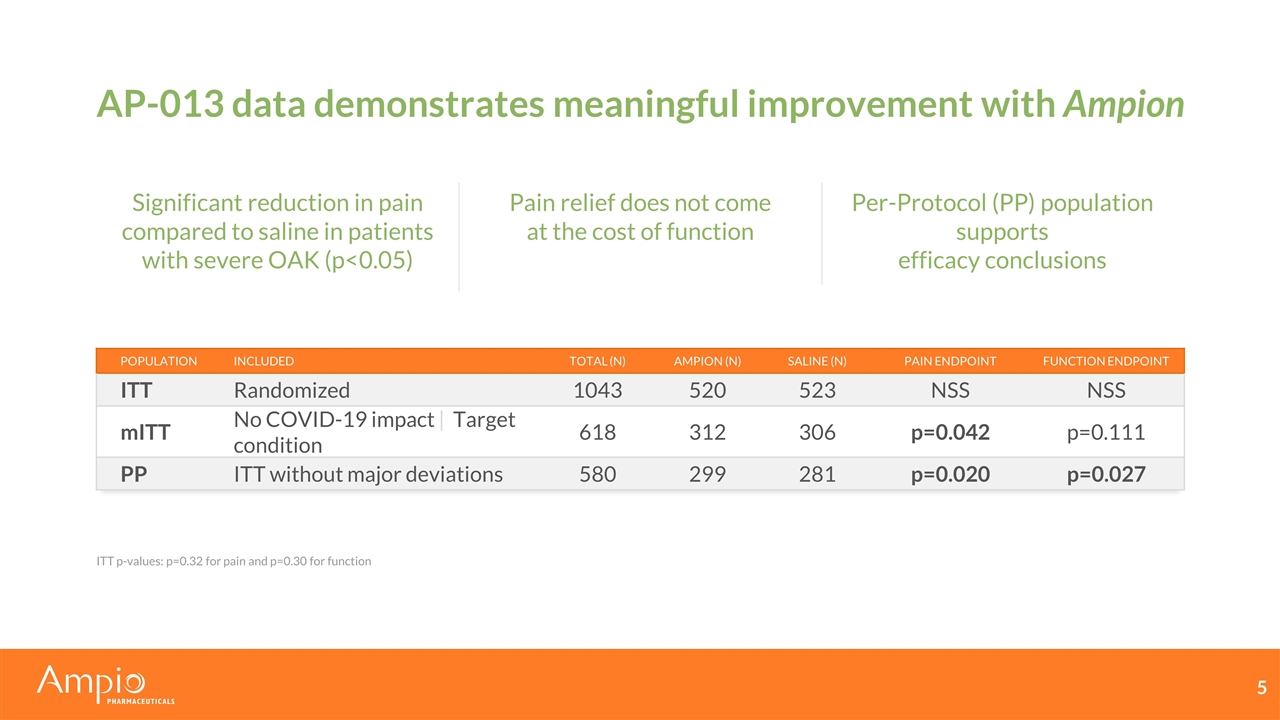
AP-013 data demonstrates meaningful improvement with Ampion Significant reduction in pain compared to saline in patients with severe OAK (p<0.05) Per-Protocol (PP) population supports efficacy conclusions Pain relief does not come at the cost of function ITT p-values: p=0.32 for pain and p=0.30 for function Population Included Total (n) Ampion (n) Saline (n) Pain Endpoint Function Endpoint ITT Randomized 1043 520 523 NSS NSS mITT No COVID-19 impact | Target condition 618 312 306 p=0.042 p=0.111 PP ITT without major deviations 580 299 281 p=0.020 p=0.027
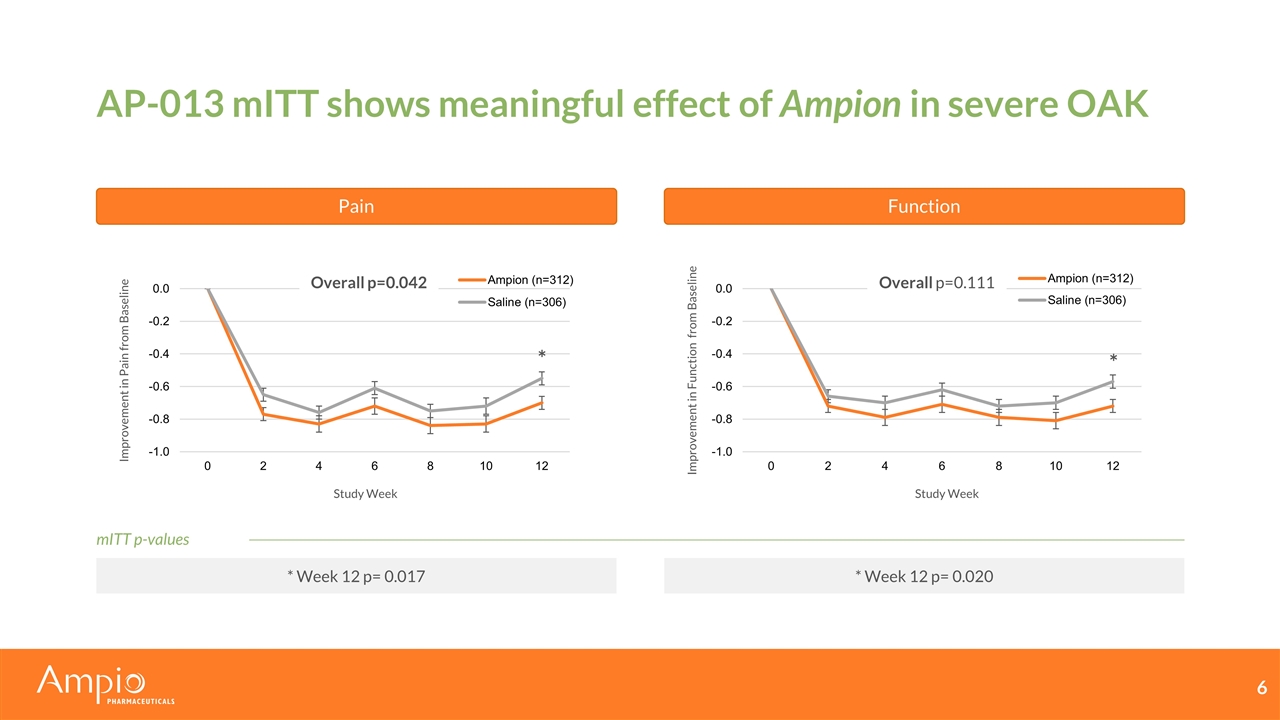
AP-013 mITT shows meaningful effect of Ampion in severe OAK Pain Function Overall p=0.042 Improvement in Pain from Baseline Study Week Improvement in Function from Baseline Study Week Overall p=0.111 * Week 12 p= 0.017 * Week 12 p= 0.020 * * mITT p-values
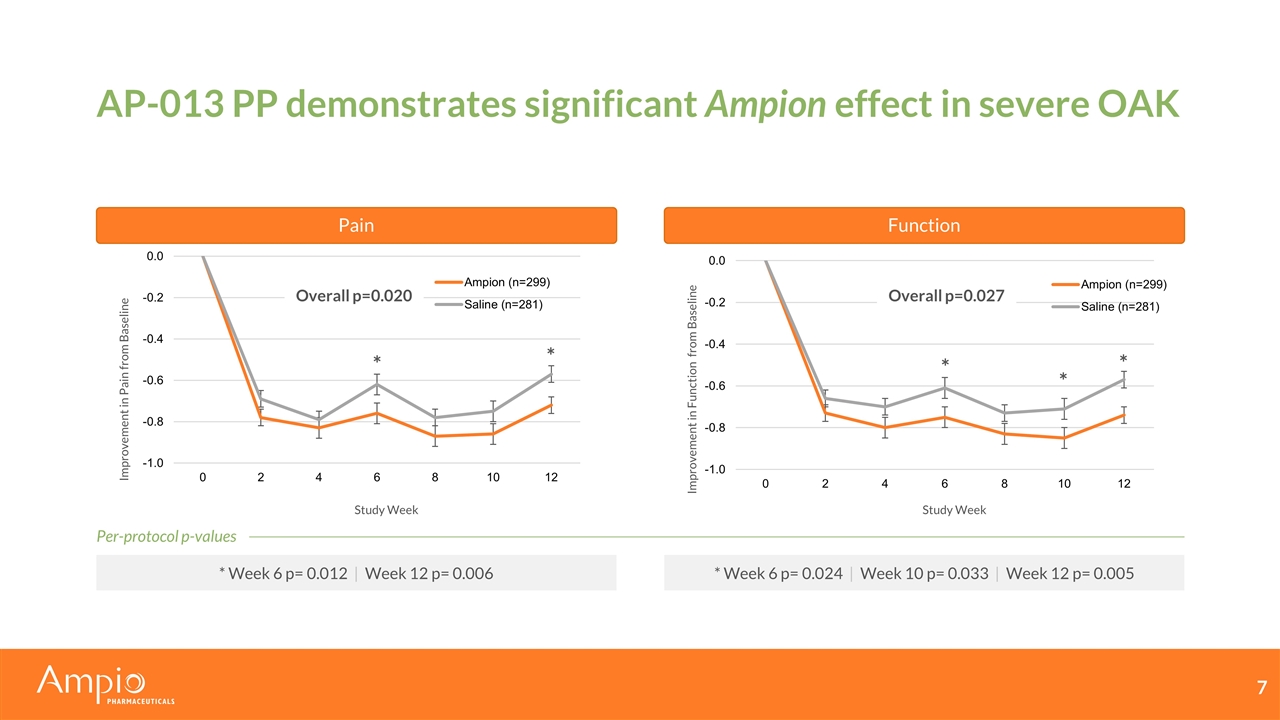
AP-013 PP demonstrates significant Ampion effect in severe OAK Pain Function Study Week Study Week Improvement in Pain from Baseline Improvement in Function from Baseline Overall p=0.020 * * * Week 6 p= 0.012 | Week 12 p= 0.006 * Week 6 p= 0.024 | Week 10 p= 0.033 | Week 12 p= 0.005 Per-protocol p-values * * * Overall p=0.027
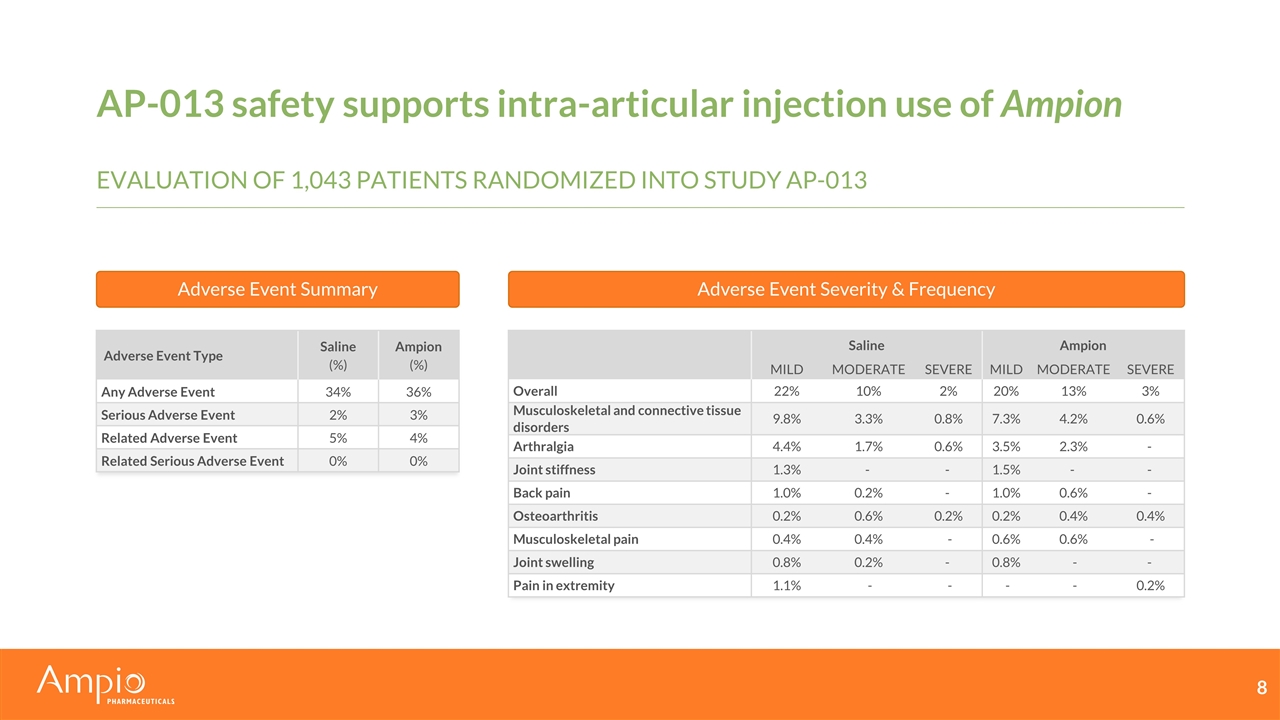
AP-013 safety supports intra-articular injection use of Ampion Adverse Event Type Saline (%) Ampion (%) Any Adverse Event 34% 36% Serious Adverse Event 2% 3% Related Adverse Event 5% 4% Related Serious Adverse Event 0% 0% Saline Ampion MILD MODERATE SEVERE MILD MODERATE SEVERE Overall 22% 10% 2% 20% 13% 3% Musculoskeletal and connective tissue disorders 9.8% 3.3% 0.8% 7.3% 4.2% 0.6% Arthralgia 4.4% 1.7% 0.6% 3.5% 2.3% - Joint stiffness 1.3% - - 1.5% - - Back pain 1.0% 0.2% - 1.0% 0.6% - Osteoarthritis 0.2% 0.6% 0.2% 0.2% 0.4% 0.4% Musculoskeletal pain 0.4% 0.4% - 0.6% 0.6% - Joint swelling 0.8% 0.2% - 0.8% - - Pain in extremity 1.1% - - - - 0.2% Adverse Event Summary Adverse Event Severity & Frequency Evaluation of 1,043 patients randomized into study AP-013
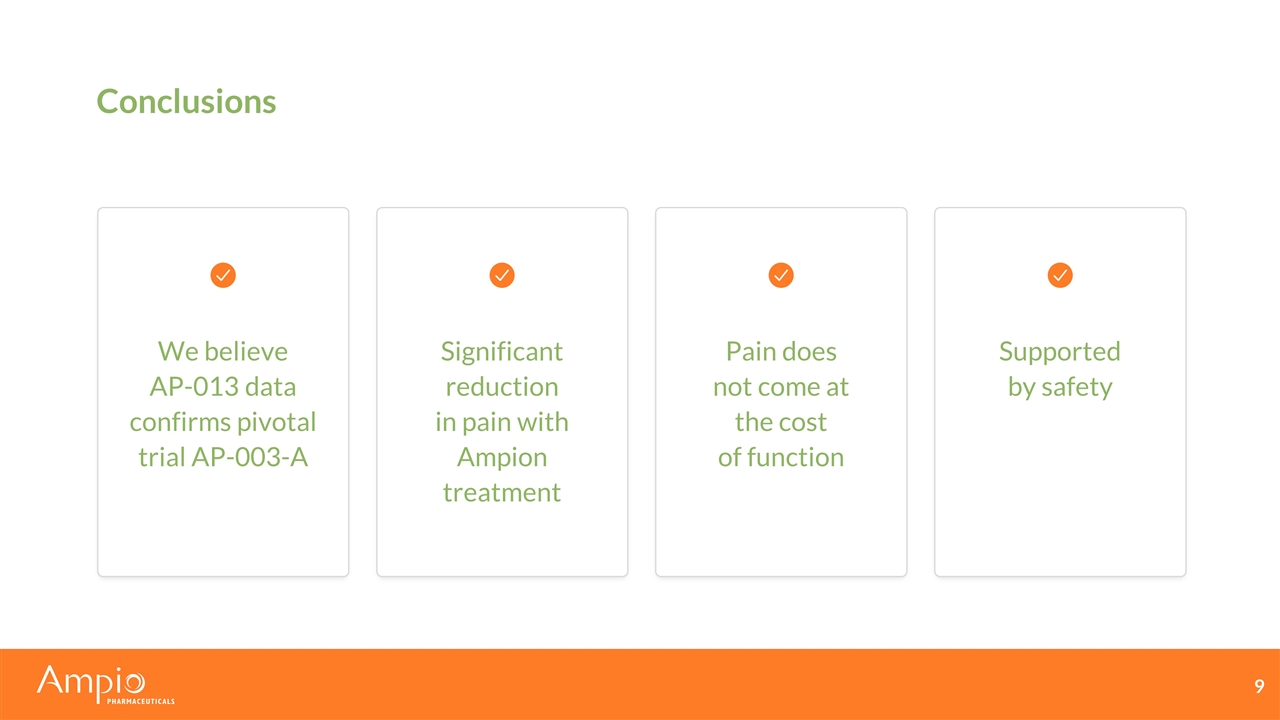
Conclusions We believe AP-013 data confirms pivotal trial AP-003-A Significant reduction in pain with Ampion treatment Pain does not come at the cost of function Supported by safety


