Maiden Holdings, Ltd. Investor Update May 2023
Investor Disclosures 1 Forward Looking Statements This presentation contains "forward-looking statements" which are made pursuant to the safe harbor provisions of the Private Securities Litigation Reform Act of 1995. The forward-looking statements are based on Maiden Holdings, Ltd.’s (the “Company”) future developments and their potential effects on the Company. There can be no assurance that actual developments will be those anticipated by the Company. Actual results may differ materially from those projected as a result of significant risks and uncertainties, including non-receipt of the expected payments, changes in interest rates, effect of the performance of financial markets on investment income and fair values of investments, developments of claims and the effect on loss reserves, accuracy in projecting loss reserves, the impact of competition and pricing environments, changes in the demand for the Company's products, the effect of general economic conditions and unusual frequency of storm activity, adverse state and federal legislation, regulations and regulatory investigations into industry practices, developments relating to existing agreements, heightened competition, changes in pricing environments, and changes in asset valuations. Additional information about these risks and uncertainties, as well as others that may cause actual results to differ materially from those projected is contained in Item 1A, Risk Factors in the Company's Annual Report on Form 10-K for the year ended December 31, 2022, filed with the SEC on March 15, 2023. The Company undertakes no obligation to publicly update any forward- looking statements, except as may be required by law. Any discrepancies between the amounts included in this presentation and amounts included in the Company’s Form 10-K for the year ended December 31, 2022, filed with the SEC are due to rounding. Non-GAAP Financial Measures In addition to the Summary Consolidated Balance Sheets and Consolidated Statements of Income, management uses certain key financial measures, some of which are non-GAAP measures, to evaluate the Company's financial performance and the overall growth in value generated for the Company’s common shareholders. Management believes that these measures, which may be defined differently by other companies, explain the Company’s results to investors in a manner that allows for a more complete understanding of the underlying trends in the Company’s business. The non-GAAP measures should not be viewed as a substitute for those determined in accordance with U.S. GAAP. See the Appendix of this presentation for a reconciliation of the Company’s non-GAAP measures to the nearest GAAP measure.

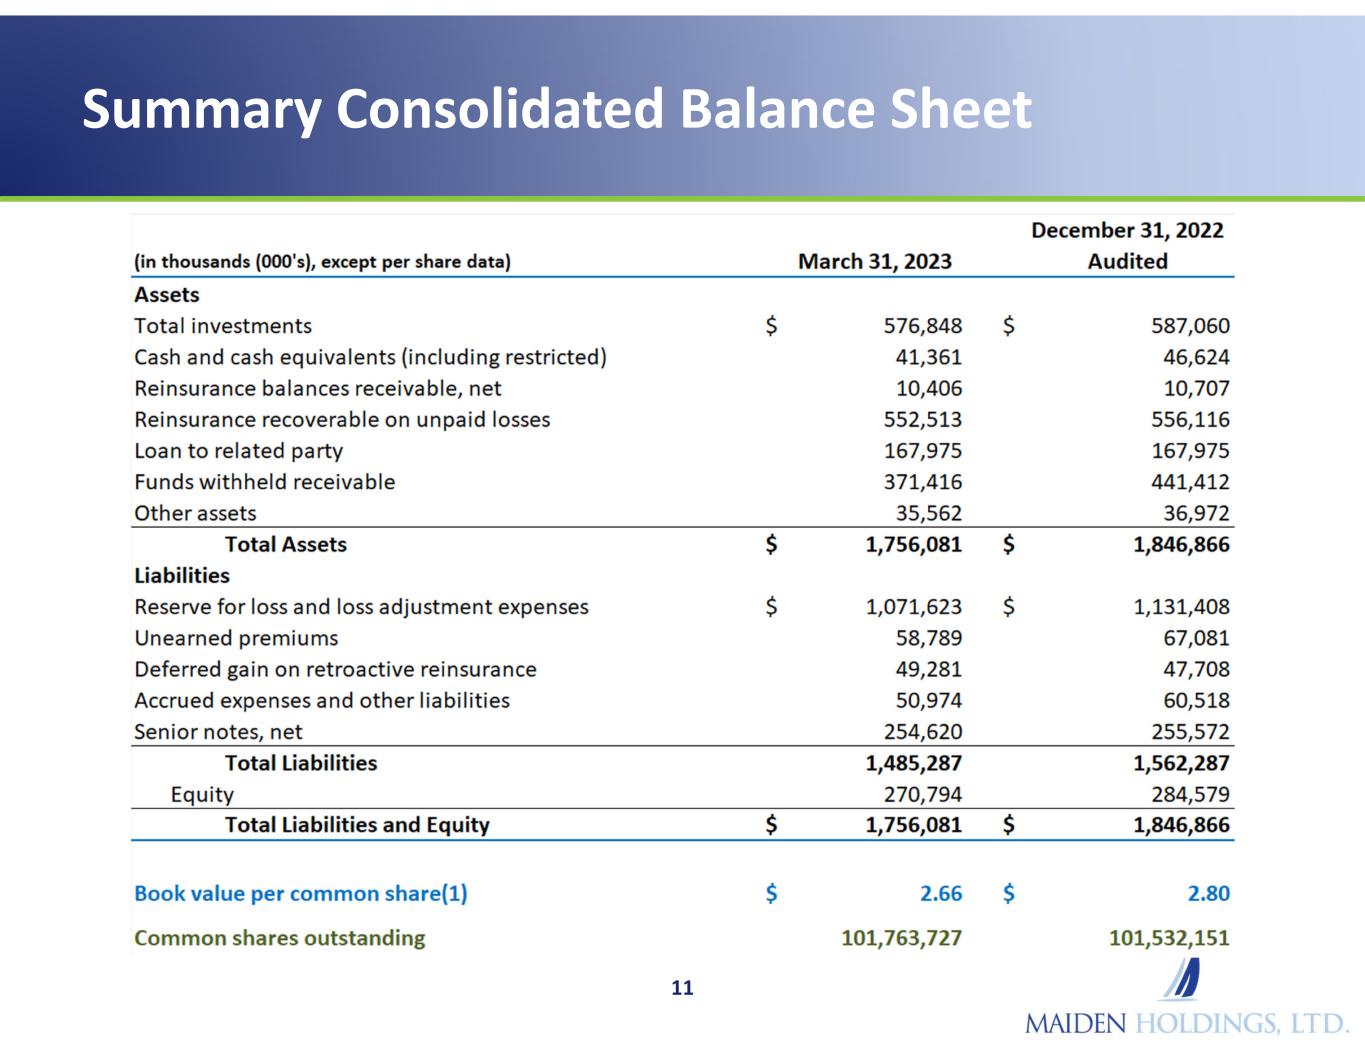
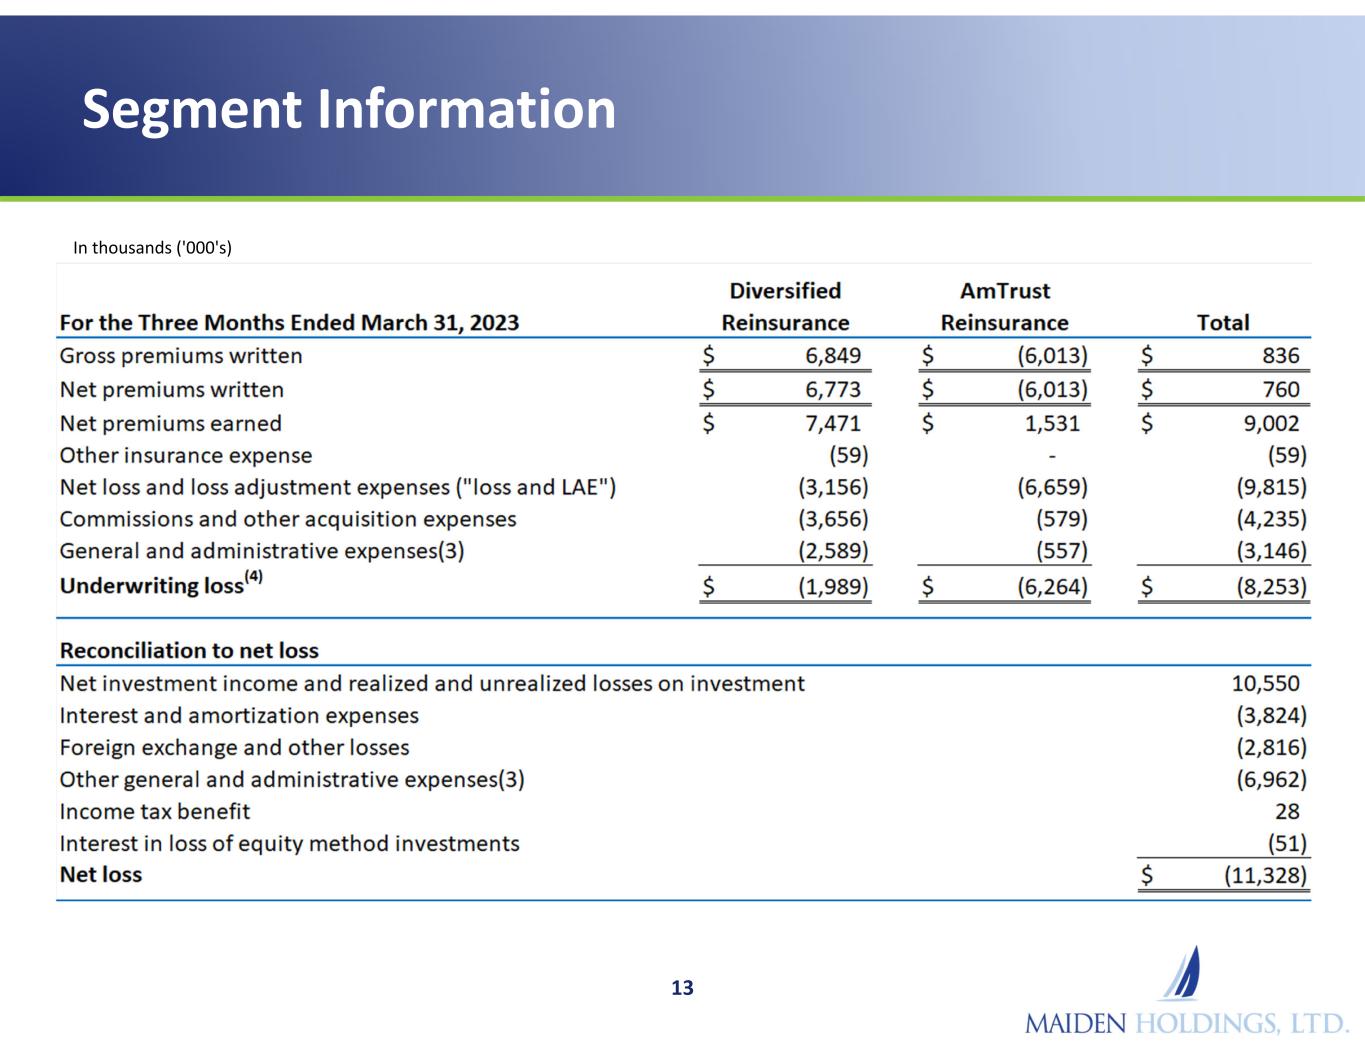
Maiden Holdings Q1 2023 Highlights 2 • GAAP net loss available to common shareholders was $11.3m or $0.11 per share o Results mainly driven by underwriting loss in AmTrust and Diversified segments AmTrust segment produced a $6.3m underwriting loss with smaller Diversified loss primarily from GLS unit o Adverse prior year loss development of $3.7m from both segments in Q1 2023, primarily from AmTrust but also from Bermuda Other run-off contracts as well See slide 6 for additional details on underwriting results and loss development by segment o Investment results were slightly higher in Q1 2023 due to significant increases in interest income received from the AmTrust loan and Funds Withheld Increases were mostly offset by lower realized investment gains and income from equity method investments o Operating expenses reflect traditionally higher quarterly expense but are 7.1% lower than Q1 2022 Expect run rate expenses in Q2 and beyond to reflect continue reduction in range of expenses • Q1 GAAP book value decreased to $2.66 per common share and adjusted book value decreased to $3.12 per common share o In addition to Q1 net loss, book value decreased due to $5.5m or $0.05 per common share upon adoption of new accounting standard for credit losses which should largely be non-recurring • Asset management reflected focus on income producing assets and challenging market o Alternative portfolio decreased in Q1 versus year-end reflecting slower deployment as markets remain uncertain and rising interest rates offer opportunity to reallocate to lower risk, income producing assets o Despite difficult market environment, target investment returns are starting to emerge • Full valuation allowance maintained on U.S. deferred tax asset of $1.18 per share at 3/31/2023 o Not recognized as an asset on balance sheet currently o Timing of asset recognition likely to be influenced by more stable loss development o Focus on current income producing assets targets to offset continuing reserve development * Please see the definition of non-GAAP financial measures in the Appendix of this presentation for additional important information regarding certain terms used herein
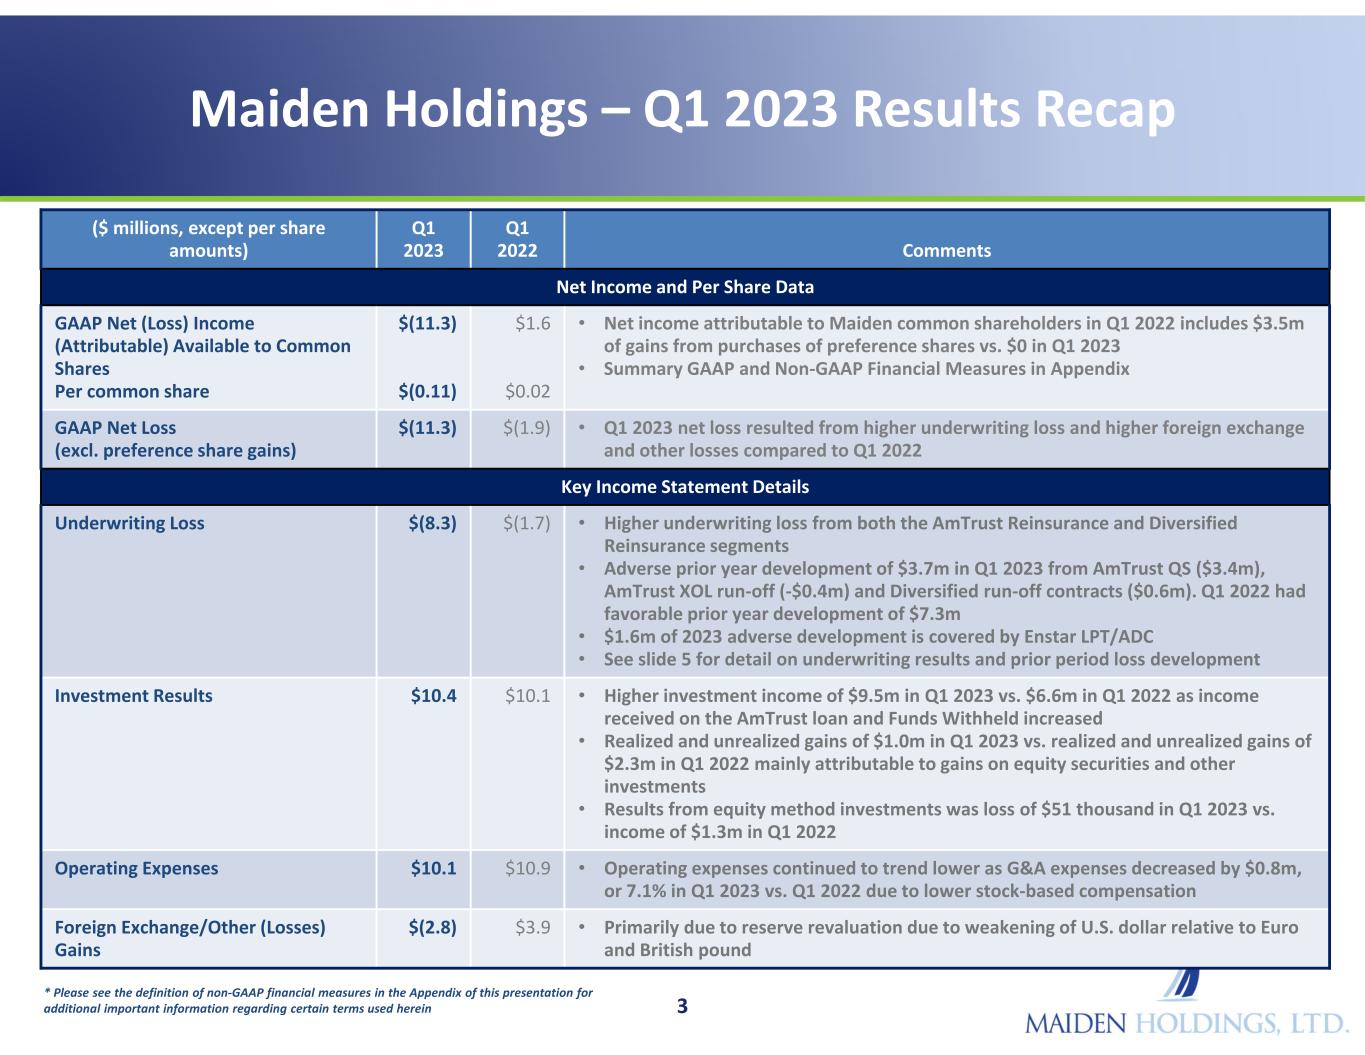
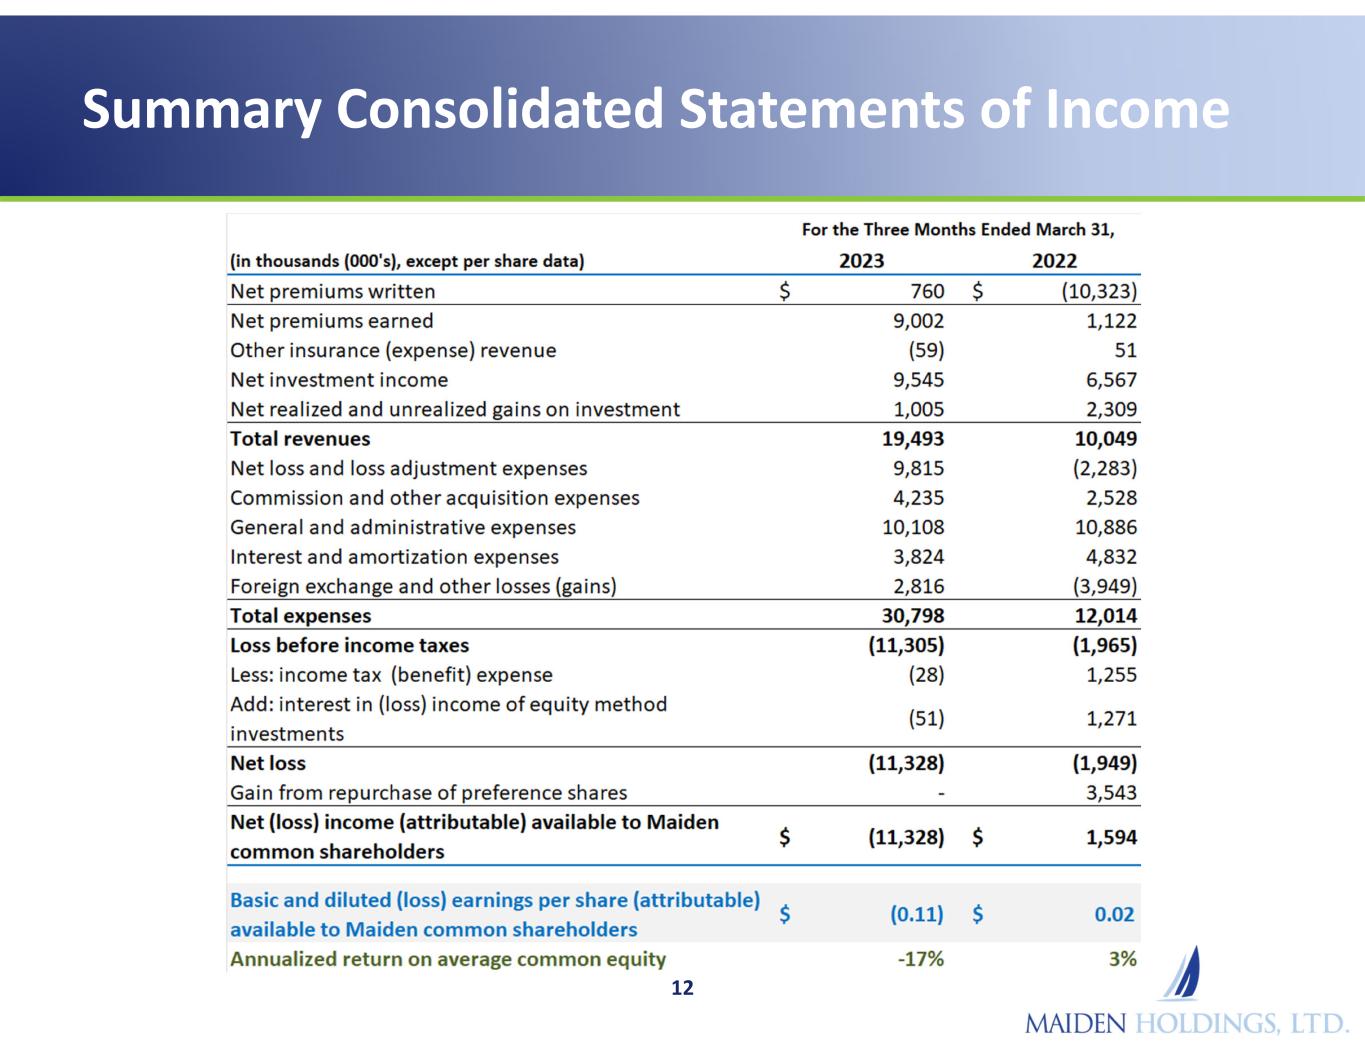
Maiden Holdings – Q1 2023 Results Recap 3 * Please see the definition of non-GAAP financial measures in the Appendix of this presentation for additional important information regarding certain terms used herein Comments Q1 2022 Q1 2023 ($ millions, except per share amounts) Net Income and Per Share Data • Net income attributable to Maiden common shareholders in Q1 2022 includes $3.5m of gains from purchases of preference shares vs. $0 in Q1 2023 • Summary GAAP and Non-GAAP Financial Measures in Appendix $1.6 $0.02 $(11.3) $(0.11) GAAP Net (Loss) Income (Attributable) Available to Common Shares Per common share • Q1 2023 net loss resulted from higher underwriting loss and higher foreign exchange and other losses compared to Q1 2022 $(1.9)$(11.3)GAAP Net Loss (excl. preference share gains) Key Income Statement Details • Higher underwriting loss from both the AmTrust Reinsurance and Diversified Reinsurance segments • Adverse prior year development of $3.7m in Q1 2023 from AmTrust QS ($3.4m), AmTrust XOL run-off (-$0.4m) and Diversified run-off contracts ($0.6m). Q1 2022 had favorable prior year development of $7.3m • $1.6m of 2023 adverse development is covered by Enstar LPT/ADC • See slide 5 for detail on underwriting results and prior period loss development $(1.7)$(8.3)Underwriting Loss • Higher investment income of $9.5m in Q1 2023 vs. $6.6m in Q1 2022 as income received on the AmTrust loan and Funds Withheld increased • Realized and unrealized gains of $1.0m in Q1 2023 vs. realized and unrealized gains of $2.3m in Q1 2022 mainly attributable to gains on equity securities and other investments • Results from equity method investments was loss of $51 thousand in Q1 2023 vs. income of $1.3m in Q1 2022 $10.1$10.4Investment Results • Operating expenses continued to trend lower as G&A expenses decreased by $0.8m, or 7.1% in Q1 2023 vs. Q1 2022 due to lower stock-based compensation $10.9$10.1Operating Expenses • Primarily due to reserve revaluation due to weakening of U.S. dollar relative to Euro and British pound $3.9$(2.8)Foreign Exchange/Other (Losses) Gains
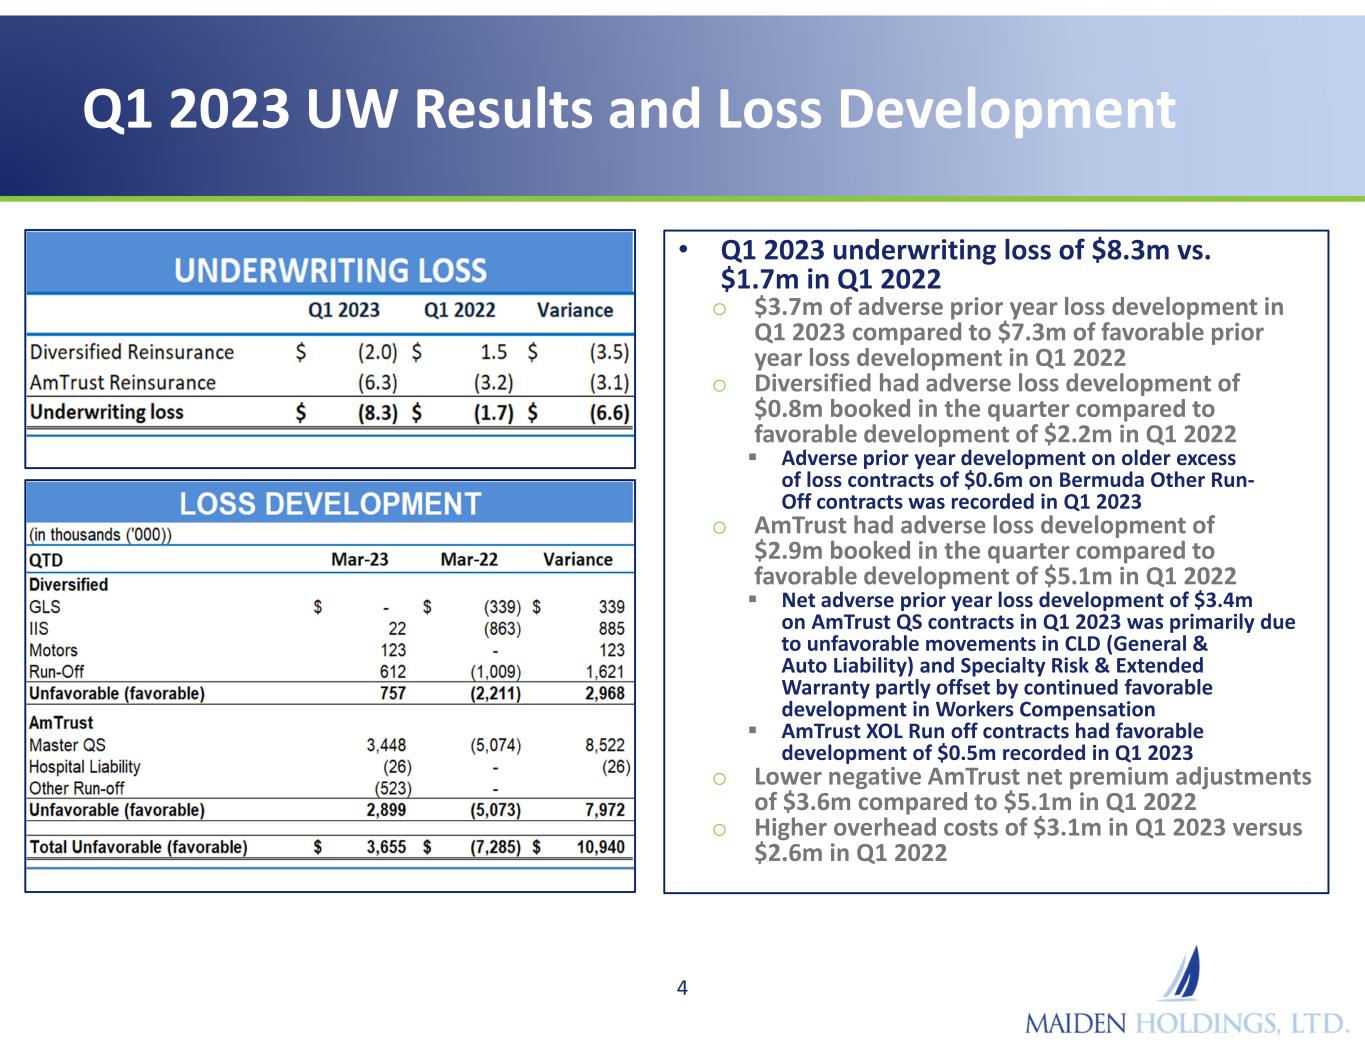
Q1 2023 UW Results and Loss Development • Q1 2023 underwriting loss of $8.3m vs. $1.7m in Q1 2022 o $3.7m of adverse prior year loss development in Q1 2023 compared to $7.3m of favorable prior year loss development in Q1 2022 o Diversified had adverse loss development of $0.8m booked in the quarter compared to favorable development of $2.2m in Q1 2022 Adverse prior year development on older excess of loss contracts of $0.6m on Bermuda Other Run- Off contracts was recorded in Q1 2023 o AmTrust had adverse loss development of $2.9m booked in the quarter compared to favorable development of $5.1m in Q1 2022 Net adverse prior year loss development of $3.4m on AmTrust QS contracts in Q1 2023 was primarily due to unfavorable movements in CLD (General & Auto Liability) and Specialty Risk & Extended Warranty partly offset by continued favorable development in Workers Compensation AmTrust XOL Run off contracts had favorable development of $0.5m recorded in Q1 2023 o Lower negative AmTrust net premium adjustments of $3.6m compared to $5.1m in Q1 2022 o Higher overhead costs of $3.1m in Q1 2023 versus $2.6m in Q1 2022 4
Maiden Holdings Business Strategy 5 • We create shareholder value by actively managing and allocating our assets and capital o We leverage our deep knowledge of the insurance and related financial services industries into ownership and management of businesses and assets with the opportunity for increased returns o Change in strategy since 2019 has allowed us to more flexibly allocate capital to activities we believe will produce the greatest returns for our common shareholders • Our strategy has three principal areas of focus o Asset management – investing in assets and asset classes in a prudent but expansive manner in order to maximize investment returns We limit the insurance risk we assume relative to the assets we hold and maintain required regulatory capital at very strong levels to manage our aggregate risk profile o Legacy underwriting - judiciously building a portfolio of run-off acquisitions and retroactive reinsurance transactions which we believe will produce attractive underwriting returns o Capital management - effectively managing capital and when appropriate, repurchasing securities or returning capital to enhance common shareholder returns • Strategic focus likely to continue to evolve as markets extend timelines for asset management and legacy underwriting target returns to materialize o Developing more predictable areas of revenue and profit a priority • We believe these areas of strategic focus will enhance our profitability o We believe our strategy increases the likelihood of fully utilizing the significant tax NOL carryforwards which would create additional common shareholder value o Expected returns from each strategic pillar are evaluated relative to our cost of debt capital
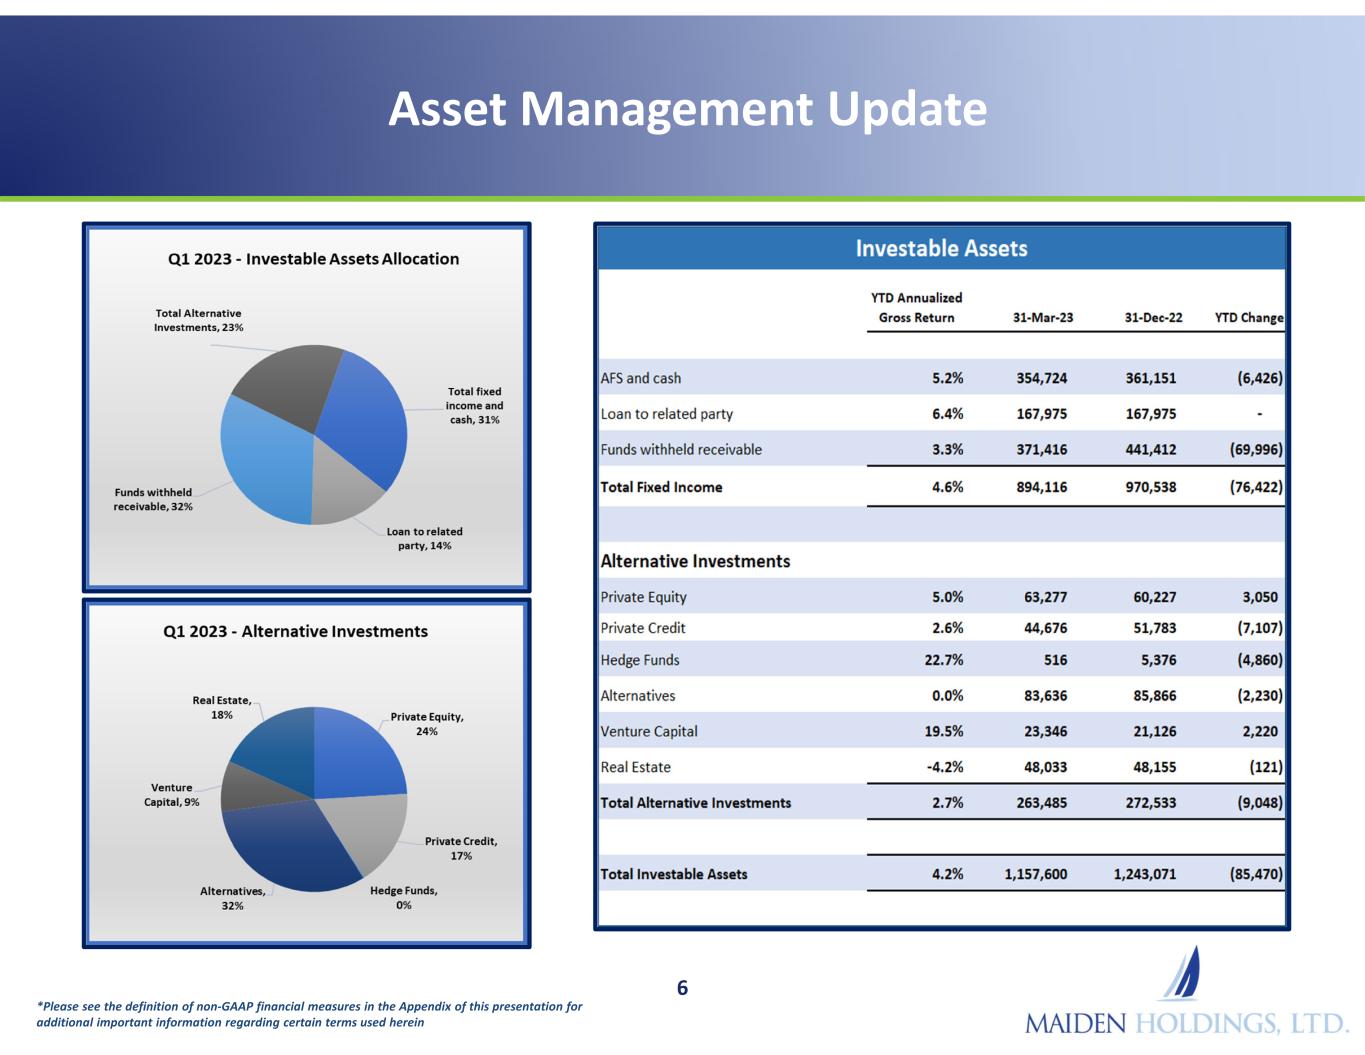
Asset Management Update 6 *Please see the definition of non-GAAP financial measures in the Appendix of this presentation for additional important information regarding certain terms used herein
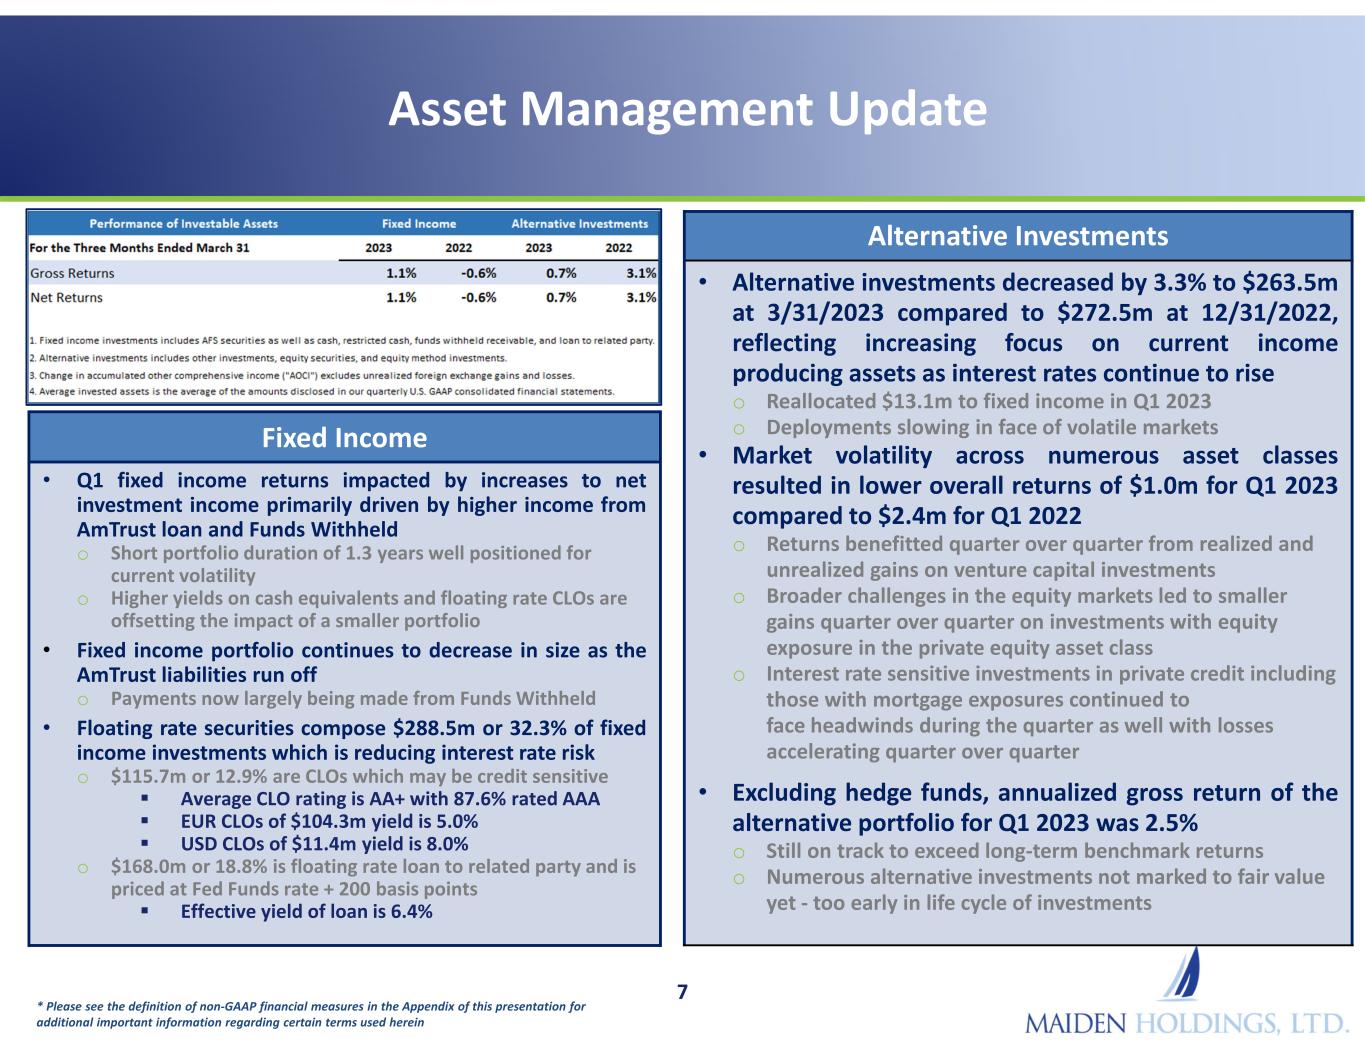
Asset Management Update 7 * Please see the definition of non-GAAP financial measures in the Appendix of this presentation for additional important information regarding certain terms used herein Alternative Investments • Alternative investments decreased by 3.3% to $263.5m at 3/31/2023 compared to $272.5m at 12/31/2022, reflecting increasing focus on current income producing assets as interest rates continue to rise o Reallocated $13.1m to fixed income in Q1 2023 o Deployments slowing in face of volatile markets • Market volatility across numerous asset classes resulted in lower overall returns of $1.0m for Q1 2023 compared to $2.4m for Q1 2022 o Returns benefitted quarter over quarter from realized and unrealized gains on venture capital investments o Broader challenges in the equity markets led to smaller gains quarter over quarter on investments with equity exposure in the private equity asset class o Interest rate sensitive investments in private credit including those with mortgage exposures continued to face headwinds during the quarter as well with losses accelerating quarter over quarter • Excluding hedge funds, annualized gross return of the alternative portfolio for Q1 2023 was 2.5% o Still on track to exceed long-term benchmark returns o Numerous alternative investments not marked to fair value yet - too early in life cycle of investments Fixed Income • Q1 fixed income returns impacted by increases to net investment income primarily driven by higher income from AmTrust loan and Funds Withheld o Short portfolio duration of 1.3 years well positioned for current volatility o Higher yields on cash equivalents and floating rate CLOs are offsetting the impact of a smaller portfolio • Fixed income portfolio continues to decrease in size as the AmTrust liabilities run off o Payments now largely being made from Funds Withheld • Floating rate securities compose $288.5m or 32.3% of fixed income investments which is reducing interest rate risk o $115.7m or 12.9% are CLOs which may be credit sensitive Average CLO rating is AA+ with 87.6% rated AAA EUR CLOs of $104.3m yield is 5.0% USD CLOs of $11.4m yield is 8.0% o $168.0m or 18.8% is floating rate loan to related party and is priced at Fed Funds rate + 200 basis points Effective yield of loan is 6.4%

Legacy Underwriting Update 8 • Active pipeline continues – challenging liability markets and market competition resulting in narrower and deliberate focus o Consistent flow of opportunities being presented but rate of declinations increasing • GLS holds insurance liabilities totaling approximately $32m at 3/31/2023 • GLS produced Q1 operating loss of $1.6m o $0.8m loss due to adjustment of previously recognized gain on acquisition of certain assets which should be non-recurring o $0.8m increase in G&A expense mainly due to increased internally allocated payroll and other overhead expenses
Capital Management Update • Board provided authority for senior note repurchases up to $100m o Authorization covers open market purchases and privately negotiated trades o Provides long-term capital management option for disciplined and prudent approach to balance sheet management • MRL now owns 29% of Maiden common shares, but is limited to 9.5% voting power per Maiden bye-laws o Common shares owned by MRL eliminated for accounting and financial reporting purposes on the Company’s consolidated financial statements and presented as treasury shares o Per share computations reflect elimination of MHLD common shares owned by MRL of 41,439,348 • Maiden capital management options on common shares no longer restricted o Can now issue dividends or repurchase common shares – no immediate plans o Company presently has $74.2m unutilized authorization to repurchase common shares 9 * Please see the definition of non-GAAP financial measures in the Appendix of this presentation for additional important information regarding certain terms used herein
Maiden Holdings, Ltd. Investor Update - Appendix Financial Data for Period Ended March 31, 2023
Summary Consolidated Balance Sheet 11
Summary Consolidated Statements of Income 12
Segment Information 13 In thousands ('000's)
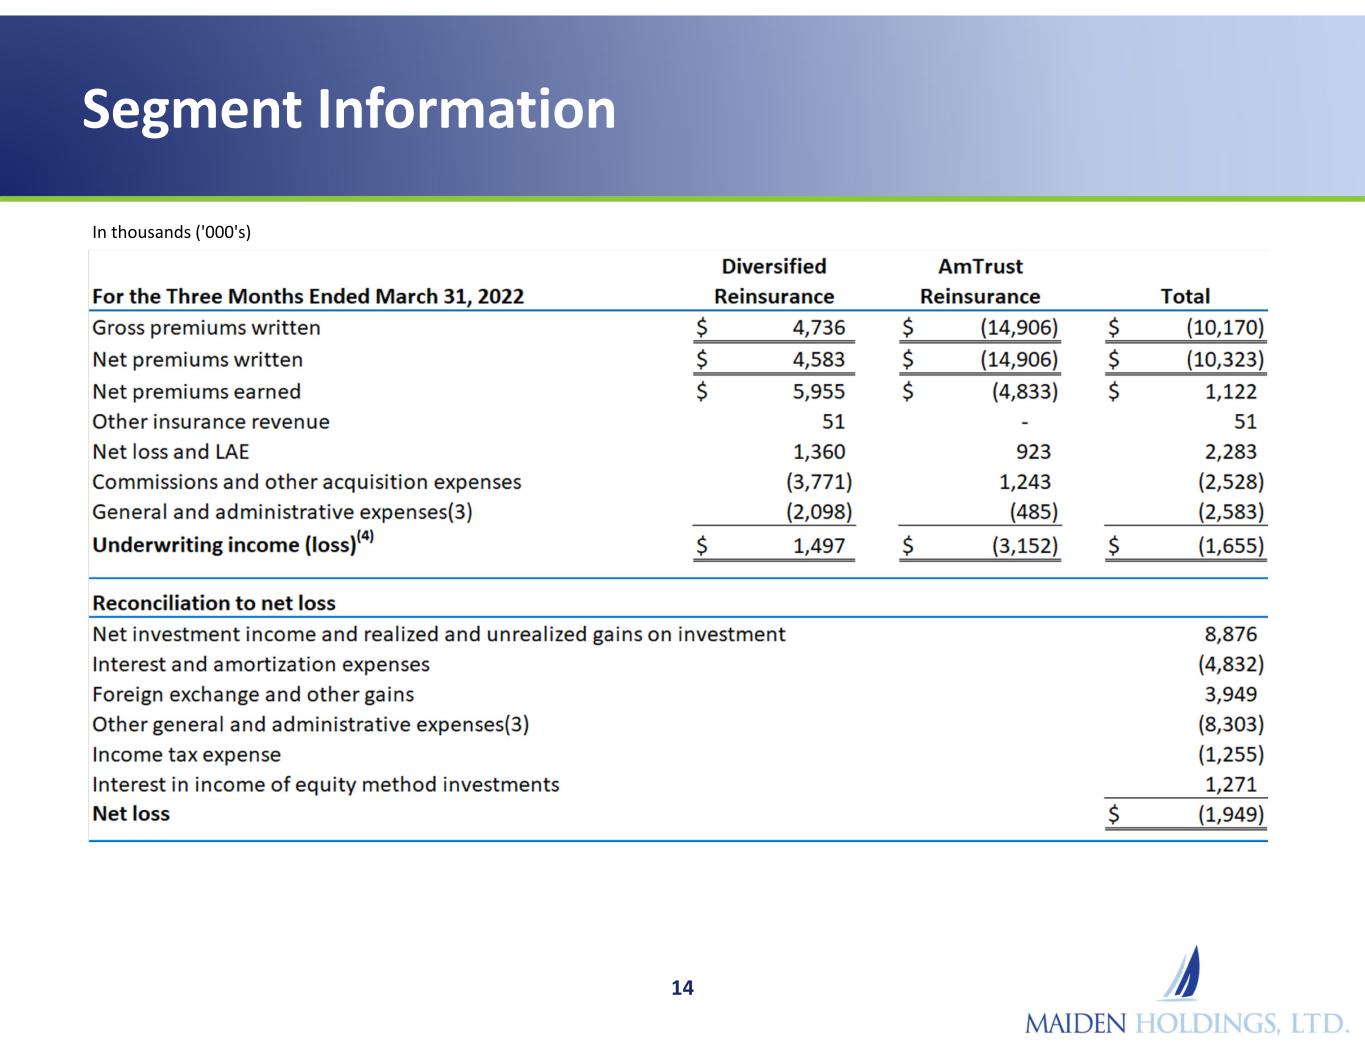
Segment Information 14 In thousands ('000's)
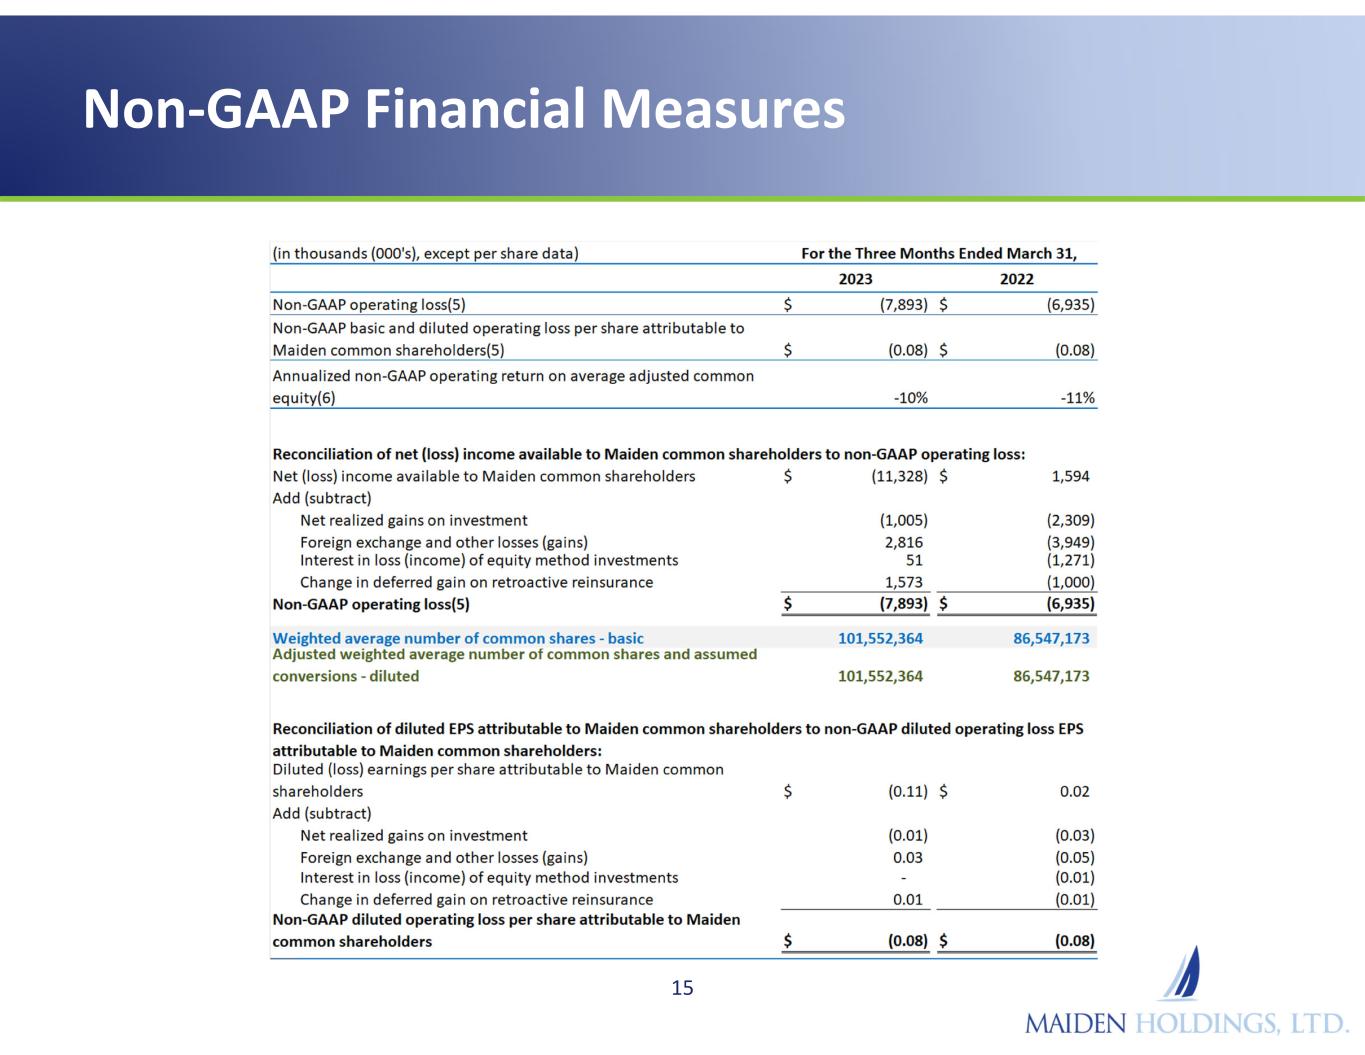
Non-GAAP Financial Measures 15
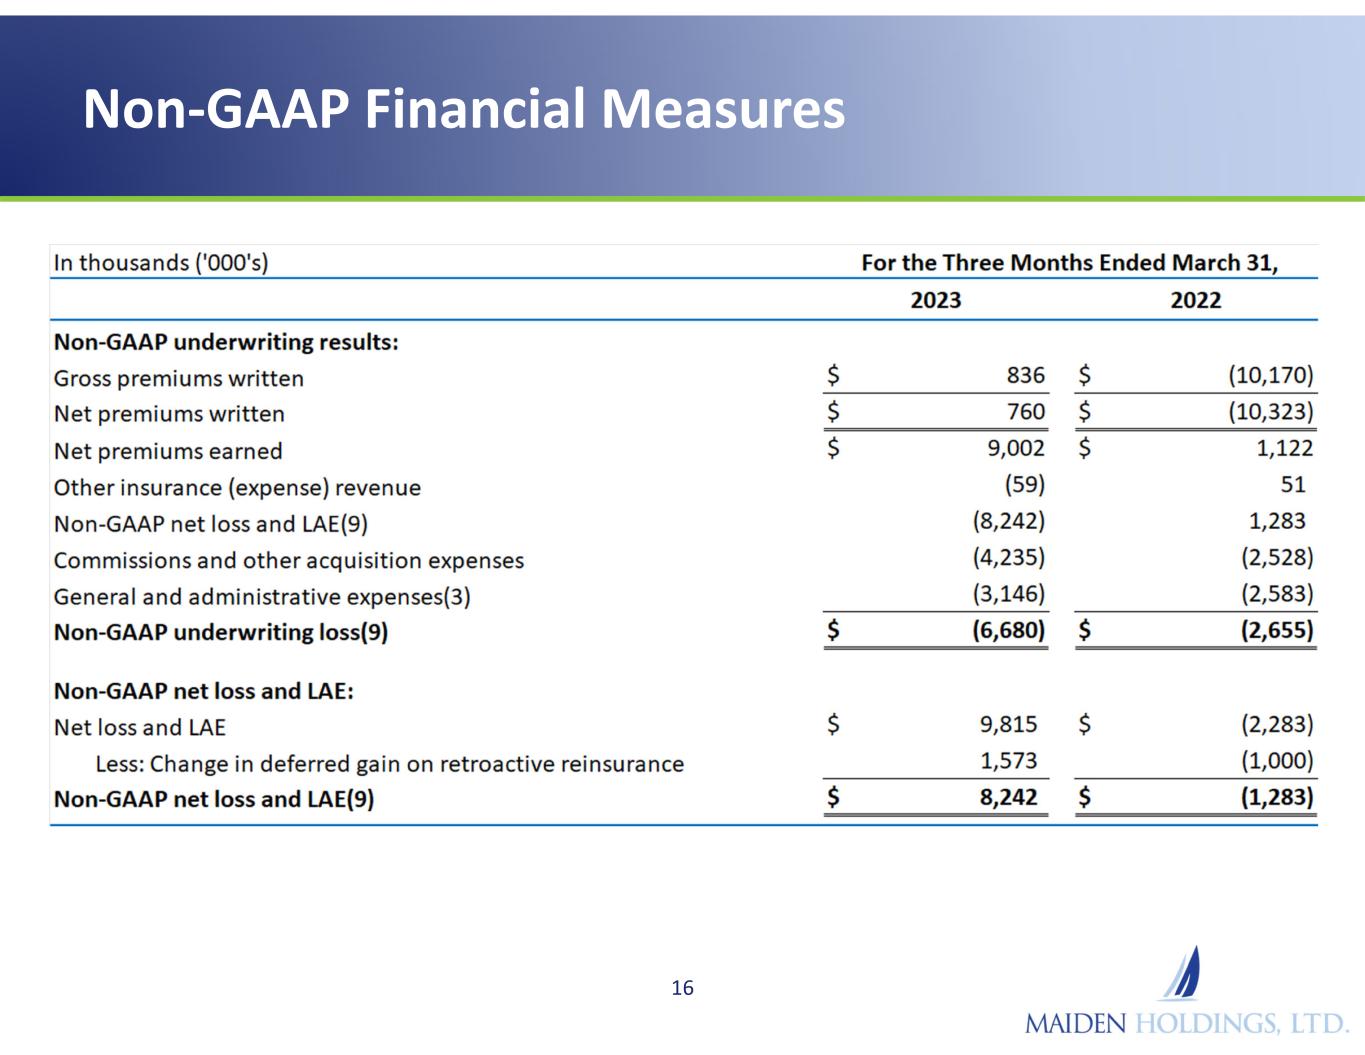
Non-GAAP Financial Measures 16

Non-GAAP Financial Measures 17
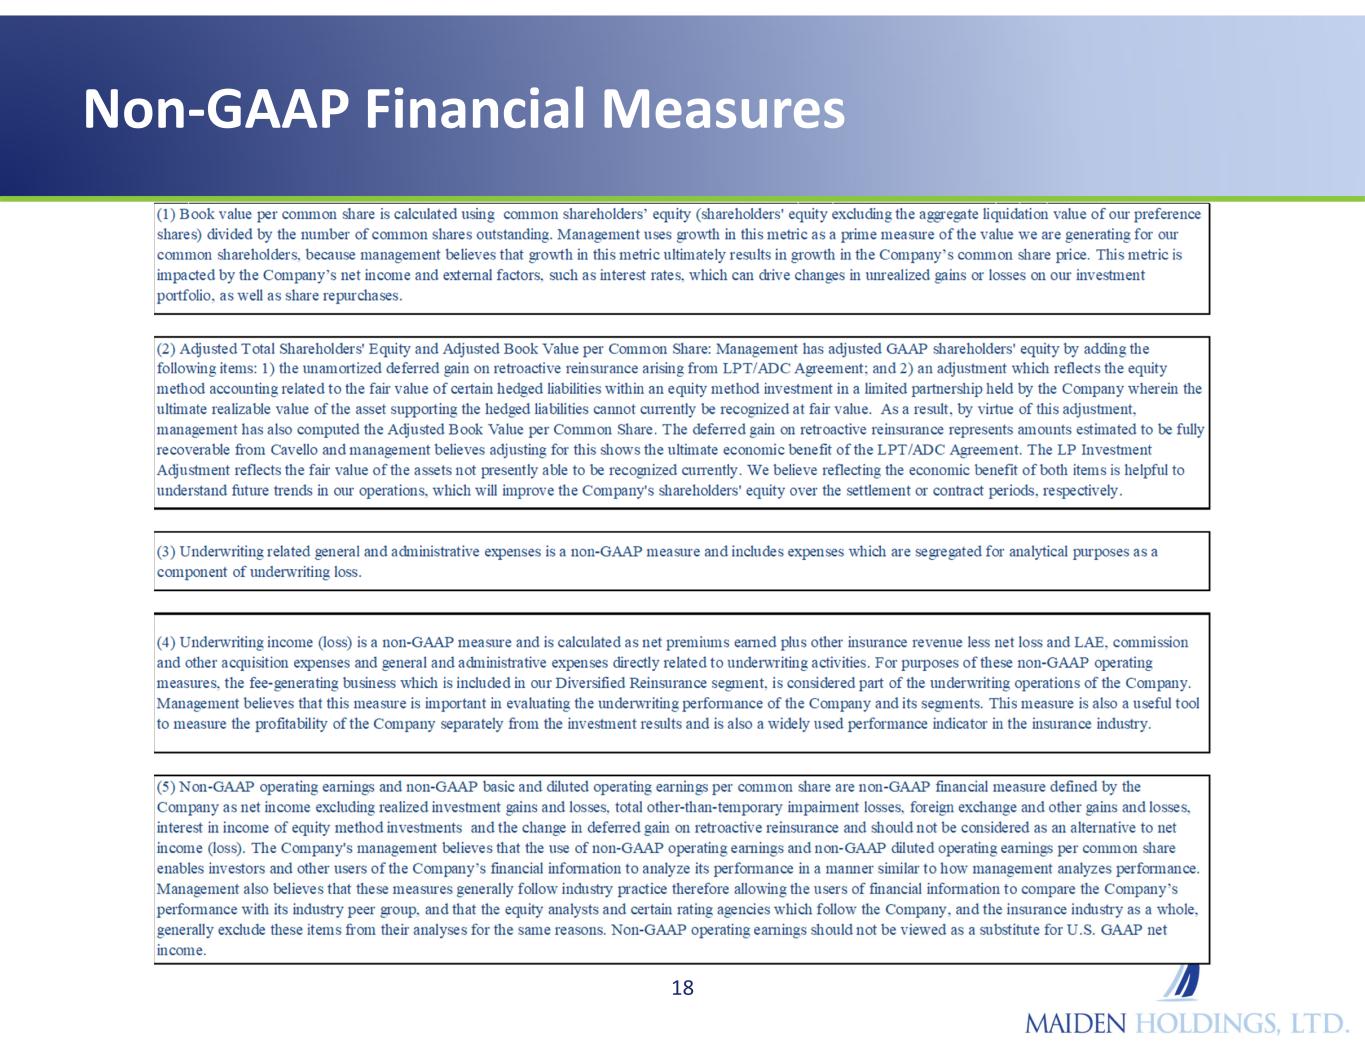
Non-GAAP Financial Measures 18

Non-GAAP Financial Measures 19


