Exhibit 99.3
PRO FORMA VALUATION REPORT KAISER FEDERAL FINANCIAL GROUP, INC. HOLDING COMPANY FOR Dated As Of: |
Prepared By:
RP® Financial, LC.
1700 North Moore Street
Suite 2210
Arlington, Virginia 22209
RP® FINANCIAL, LC. |
|
| |
Financial Services Industry Consultants |
|
August 31, 2007
Boards of Directors
K-Fed Mutual Holding Company
K-Fed Bancorp
Kaiser Federal Bank
1359 North Grand Avenue, Suite 200
Covina, California 91724
Members of the Boards of Directors:
At your request, we have completed and hereby provide an independent appraisal (“Appraisal”) of the estimated pro forma market value of the common stock to be issued by Kaiser Federal Financial Group, Inc., Covina, California (“Kaiser Federal Financial” or the “Company”), previously known as K-Fed Bancorp (“K-Fed”), in connection with the mutual-to-stock conversion of K-Fed Mutual Holding Company (the “MHC”). The MHC currently has a majority ownership interest in, and its principal asset consists of, approximately 63.53% of the common stock of K-Fed (the “MHC Shares”), the mid-tier holding company for Kaiser Federal Bank, Covina, California (the “Bank”). The remaining 36.47% of K-Fed’s common stock is owned by public stockholders. K-Fed, which completed its initial public stock offering in March 2004, owns 100% of the common stock of the Bank. It is our understanding that K-Fed will offer its stock, representing the majority ownership interest held by the MHC, in a subscription offering to Eligible Account Holders, Supplemental Eligible Account Holders and Other Members. To the extent that shares remain available for purchase after satisfaction of all subscriptions received in the subscription offering, the shares may be offered for sale in a community offering to members of the local community and the public at large.
This Appraisal is furnished pursuant to the requirements of the Code of Federal Regulations 563b.7 and has been prepared in accordance with the “Guidelines for Appraisal Reports for the Valuation of Savings and Loan Associations Converting from Mutual to Stock Form of Organization” of the Office of Thrift Supervision (“OTS”), which have been adopted in practice by the Federal Deposit Insurance Corporation (“FDIC”).
Plan of Conversion and Stock Issuance
On June 28, 2007, the respective Boards of Directors of the MHC, the Company and the Bank adopted a Plan of Conversion and Reorganization (the “Plan of Conversion”), pursuant to which the mutual holding company will convert to the stock form of organization. Pursuant to the Plan of Conversion, (i) the MHC will convert to stock form, (ii) the MHC and the Company
Washington Headquarters |
|
Rosslyn Center |
|
1700 North Moore Street, Suite 2210 | Telephone: (703) 528-1700 |
Arlington, VA 22209 | Fax No.: (703) 528-1788 |
www.rpfinancial.com | E-Mail: mail@rpfinancial.com |
Boards of Directors
August 31, 2007
Page 2
will merge into the Bank and the Bank will become a wholly owned subsidiary of a newly chartered stock company named Kaiser Federal Financial Group, Inc., (iii) the shares of common stock of the Company held by persons other than the MHC will be converted into shares of common stock of the Company pursuant to an exchange ratio designed to preserve the percentage ownership interests of such persons, and (iv) the Company will offer and sell shares of its common stock to certain depositors of the Bank, residents of Bank’s local community and shareholders of the Company and others in the manner and subject to the priorities set forth in the Plan of Conversion. As of August 31, 2007, the MHC’s ownership interest in Kaiser Federal Financial approximated 63.53%. The Company will also issue shares of its common stock to the public stockholders of Kaiser Federal Financial pursuant to an exchange ratio that will result in the public shareholders owning the same aggregate percentage of the newly issued shares of Kaiser Federal Financial common stock as owned immediately prior to the conversion. As of August 31, 2007, the public stockholders’ ownership interest in Kaiser Federal Financial approximated 36.47%.
RP® Financial, LC.
RP® Financial, LC. (“RP Financial”) is a financial consulting firm serving the financial services industry nationwide that, among other things, specializes in financial valuations and analyses of business enterprises and securities, including the pro forma valuation for savings institutions converting from mutual-to-stock form. The background and experience of RP Financial is detailed in Exhibit V-1. We believe that, except for the fee we will receive for our appraisal, we are independent of the Company, the Bank, the MHC and the other parties engaged by the Bank or the Company to assist in the stock conversion process.
Valuation Methodology
In preparing our Appraisal, we have reviewed the regulatory applications of Kaiser Federal Financial, the Bank and the MHC, including the prospectus as filed with the OTS and the Securities and Exchange Commission (“SEC”). We have conducted a financial analysis of Kaiser Federal Financial, the Bank and the MHC that has included a review of audited and unaudited financial information for fiscal years ended June 30, 2003 through 2007. In addition, we have conducted due diligence related discussions with Kaiser Federal Financial’s management; Crowe Chizek and Company LLC, the Company’s independent auditor; Luse, Gorman Pomerenk and Schick, the Company’s legal counsel for the stock conversion counsel; and Keefe, Bruyette & Woods, Kaiser Federal Financial’s marketing advisor in connection with the stock offering. All assumptions and conclusions set forth in the Appraisal were reached independently from such discussions. In addition, where appropriate, we have considered information based on other available published sources that we believe are reliable. While we believe the information and data gathered from all these sources are reliable, we cannot guarantee the accuracy and completeness of such information.
Boards of Directors
August 31, 2007
Page 3
We have investigated the competitive environment within which Kaiser Federal Financial operates and have assessed Kaiser Federal Financial’s relative strengths and weaknesses. We have kept abreast of the changing regulatory and legislative environment for financial institutions and analyzed the potential impact on Kaiser Federal Financial and the industry as a whole. We have analyzed the potential effects of the stock conversion on Kaiser Federal Financial’s operating characteristics and financial performance as they relate to the pro forma market value of Kaiser Federal Financial. We have analyzed the assets held by the MHC, which will be consolidated with Kaiser Federal Financial’s assets and equity pursuant to the completion of conversion. We have reviewed the economic and demographic characteristics of the Company’s primary market area. We have compared Kaiser Federal Financial’s financial performance and condition with selected publicly-traded thrifts in accordance with the Valuation Guidelines, as well as all publicly-traded thrifts and thrift holding companies. We have reviewed the current conditions in the securities markets in general and the market for thrift stocks in particular, including the market for existing thrift issues, initial public offerings by thrifts and thrift holding companies, and second-step conversion offerings. We have excluded from such analyses thrifts subject to announced or rumored acquisition, and/or institutions that exhibit other unusual characteristics.
The Appraisal is based on Kaiser Federal Financial’s representation that the information contained in the regulatory applications and additional information furnished to us by Kaiser Federal Financial and its independent auditor, legal counsel and other authorized agents are truthful, accurate and complete. We did not independently verify the financial statements and other information provided by Kaiser Federal Financial, or its independent auditor, legal counsel and other authorized agents nor did we independently value the assets or liabilities of Kaiser Federal Financial. The valuation considers Kaiser Federal Financial only as a going concern and should not be considered as an indication of Kaiser Federal Financial’s liquidation value.
Our appraised value is predicated on a continuation of the current operating environment for Kaiser Federal Financial and for all thrifts and their holding companies. Changes in the local, state and national economy, the legislative and regulatory environment for financial institutions and mutual holding companies, the stock market, interest rates, and other external forces (such as natural disasters or significant world events) may occur from time to time, often with great unpredictability and may materially impact the value of thrift stocks as a whole or the value of Kaiser Federal Financial’s stock alone. It is our understanding that there are no current plans for selling control of Kaiser Federal Financial following completion of the second-step stock offering. To the extent that such factors can be foreseen, they have been factored into our analysis.
The estimated pro forma market value is defined as the price at which Kaiser Federal Financial’s common stock, immediately upon completion of the second-step stock offering, would change hands between a willing buyer and a willing seller, neither being under any compulsion to buy or sell and both having reasonable knowledge of relevant facts.
Boards of Directors
August 31, 2007
Page 4
Valuation Conclusion
It is our opinion that, as of August 31, 2007, the estimated aggregate pro forma valuation of the shares to be issued in the conversion of the MHC, including: (1) newly-issued shares representing the MHC’s ownership interest in Kaiser Federal Financial, and (2) exchange shares issued to existing public shareholders of Kaiser Federal Financial, was $204,628,080 at the midpoint, equal to 20,462,808 shares at a per share value of $10.00. The resulting range of value pursuant to regulatory guidelines and the corresponding number of shares based on the Board approved $10.00 per share offering price is set forth below.
|
| Total Shares |
| Offering Shares |
| Exchange Shares Issued to the Public Shareholders |
| Exchange |
| ||||
|
|
|
|
|
| ||||||||
Shares |
|
|
|
|
|
|
|
|
|
|
| (x) |
|
Supermaximum |
|
| 27,062,063 |
|
| 17,192,500 |
|
| 9,869,563 |
|
| 1.9401 |
|
Maximum |
|
| 23,532,229 |
|
| 14,950,000 |
|
| 8,582,229 |
|
| 1.6870 |
|
Midpoint |
|
| 20,462,808 |
|
| 13,000,000 |
|
| 7,462,808 |
|
| 1.4670 |
|
Minimum |
|
| 17,393,386 |
|
| 11,050,000 |
|
| 6,343,386 |
|
| 1.2469 |
|
|
|
|
|
|
|
|
|
|
|
|
|
|
|
Distribution of Shares |
|
|
|
|
|
|
|
|
|
|
|
|
|
Supermaximum |
|
| 100.00 | % |
| 63.53 | % |
| 36.47 | % |
|
|
|
Maximum |
|
| 100.00 | % |
| 63.53 | % |
| 36.47 | % |
|
|
|
Midpoint |
|
| 100.00 | % |
| 63.53 | % |
| 36.47 | % |
|
|
|
Minimum |
|
| 100.00 | % |
| 63.53 | % |
| 36.47 | % |
|
|
|
|
|
|
|
|
|
|
|
|
|
|
|
|
|
Aggregate Market Value(1) |
|
|
|
|
|
|
|
|
|
|
|
|
|
Supermaximum |
| $ | 270,620,630 |
| $ | 171,925,000 |
| $ | 98,695,630 |
|
|
|
|
Maximum |
|
| 235,322,290 |
|
| 149,500,000 |
|
| 85,822,290 |
|
|
|
|
Midpoint |
|
| 204,628,080 |
|
| 130,000,000 |
|
| 74,628,080 |
|
|
|
|
Minimum |
|
| 173,933,860 |
|
| 110,500,000 |
|
| 63,433,860 |
|
|
|
|
(1) | Based on offering price of $10.00 per share. |
Establishment of the Exchange Ratio
OTS regulations provide that in a conversion of a mutual holding company, the minority stockholders are entitled to exchange the public shares for newly issued shares of Kaiser Federal Financial stock as a fully converted company. The Board of Directors of the MHC has independently determined the exchange ratio. The determined exchange ratio has been designed to preserve the current aggregate percentage ownership in Kaiser Federal Financial equal to
Boards of Directors
August 31, 2007
Page 5
63.53% as of June 30, 2007. The exchange ratio to be received by the existing minority shareholders of Kaiser Federal Financial will be determined at the end of the offering, based on the total number of shares sold in the subscription and community offerings. Based upon this calculation, and the valuation conclusion and offering range concluded above, the exchange ratio would be 1.2469 shares, 1.4670 shares, 1.6870 shares and 1.9401 shares of newly issued shares of Kaiser Federal Financial stock for each share of stock held by the public shareholders at the minimum, midpoint, maximum and supermaximum of the offering range, respectively. RP Financial expresses no opinion on the proposed exchange of newly issued Company shares for the shares held by the public stockholders or on the proposed exchange ratio.
Limiting Factors and Considerations
Our valuation is not intended, and must not be construed, as a recommendation of any kind as to the advisability of purchasing shares of the common stock. Moreover, because such valuation is necessarily based upon estimates and projections of a number of matters, all of which are subject to change from time to time, no assurance can be given that persons who purchase shares of common stock in the conversion will thereafter be able to buy or sell such shares at prices related to the foregoing valuation of the estimated pro forma market value thereof. The appraisal reflects only a valuation range as of this date for the pro forma market value of Kaiser Federal Financial immediately upon issuance of the stock and does not take into account any trading activity with respect to the purchase and sale of common stock in the secondary market following the completion of the second-step offering.
RP Financial’s valuation was based on the financial condition, operations and shares outstanding of Kaiser Federal Financial as of June 30, 2007, the date of the financial data included in the prospectus. The proposed exchange ratio to be received by the current public stockholders of Kaiser Federal Financial and the exchange of the public shares for newly issued shares of Kaiser Federal Financial common stock as a full public company was determined independently by the Boards of Directors of the MHC, Kaiser Federal Financial and the Bank. RP Financial expresses no opinion on the proposed exchange ratio to public stockholders or the exchange of public shares for newly issued shares.
RP Financial is not a seller of securities within the meaning of any federal and state securities laws and any report prepared by RP Financial shall not be used as an offer or solicitation with respect to the purchase or sale of any securities. RP Financial maintains a policy which prohibits RP Financial, its principals or employees from purchasing stock of its client institutions.
Boards of Directors
August 31, 2007
Page 6
This valuation will be updated as provided for in the conversion regulations and guidelines. These updates will consider, among other things, any developments or changes in the financial performance and condition of Kaiser Federal Financial, management policies, and current conditions in the equity markets for thrift shares, both existing issues and new issues. These updates may also consider changes in other external factors which impact value including, but not limited to: various changes in the legislative and regulatory environment for financial institutions, the stock market and the market for thrift stocks, and interest rates. Should any such new developments or changes be material, in our opinion, to the valuation of the shares, appropriate adjustments to the estimated pro forma market value will be made. The reasons for any such adjustments will be explained in the update at the date of the release of the update. The valuation will also be updated at the completion of Kaiser Federal Financial’s stock offering.
| Respectfully submitted, |
|
|
|
|
| RP® FINANCIAL, LC. |
|
|
|
|
|
|
|
|
| Ronald S. Riggins |
| President and Managing Director |
|
|
|
|
|
|
|
|
| James P. Hennessey |
| Senior Vice President |
RP® Financial, LC.
TABLE OF CONTENTS
KAISER FEDERAL FINANCIAL GROUP, INC.
Covina, California
DESCRIPTION |
| PAGE | |
| |||
|
| ||
|
|
|
|
|
| 1.1 | |
|
| 1.1 | |
|
| 1.2 | |
|
| 1.3 | |
|
| 1.3 | |
|
| 1.4 | |
|
| 1.8 | |
|
| 1.14 | |
|
| 1.19 | |
|
| 1.20 | |
|
| 1.24 | |
|
| 1.24 | |
|
| 1.25 | |
|
|
|
|
|
| ||
|
|
|
|
|
| 2.1 | |
|
| 2.2 | |
|
| 2.5 | |
|
| 2.8 | |
|
| 2.10 | |
|
| 2.11 | |
|
| 2.12 | |
|
|
|
|
|
| ||
|
|
|
|
|
| 3.1 | |
|
| 3.6 | |
|
| 3.9 | |
|
| 3.11 | |
|
| 3.13 | |
|
| 3.13 | |
|
| 3.16 | |
RP® Financial, LC.
TABLE OF CONTENTS
KAISER FEDERAL FINANCIAL GROUP, INC.
Covina, California
(continued)
DESCRIPTION |
| PAGE | |||
| |||||
|
| ||||
|
|
|
|
|
|
|
| 4.1 | |||
|
| 4.1 | |||
|
| 4.1 | |||
|
| 4.2 | |||
| 1. |
| 4.3 | ||
| 2. |
| 4.4 | ||
| 3. |
| 4.5 | ||
| 4. |
| 4.5 | ||
| 5. |
| 4.6 | ||
| 6. |
| 4.8 | ||
| 7. |
| 4.8 | ||
|
| A. |
| 4.9 | |
|
| B. |
| 4.14 | |
|
| C. |
| 4.18 | |
|
| D. |
| 4.18 | |
| 8. |
| 4.19 | ||
| 9. |
| 4.19 | ||
|
| 4.20 | |||
|
| 4.20 | |||
| 1. |
| 4.22 | ||
| 2. |
| 4.23 | ||
| 3. |
| 4.25 | ||
|
| 4.25 | |||
|
| 4.26 | |||
RP® FINANCIAL, LC.
LIST OF TABLES
KAISER FEDERAL FINANCIAL GROUP, INC.
Covina, California
TABLE |
| DESCRIPTION |
| PAGE |
|
| |||
1.1 |
|
| 1.9 | |
1.2 |
|
| 1.15 | |
2.1 |
|
| 2.9 | |
2.2 |
| Major Employers in LA, San Bernardino, and Santa Clara Counties |
| 2.10 |
2.3 |
|
| 2.12 | |
2.4 |
|
| 2.14 | |
2.5 |
|
| 2.15 | |
3.1 |
|
| 3.4 | |
3.2 |
|
| 3.7 | |
3.3 |
| Income as a Percent of Average Assets and Yields, Costs, Spreads |
| 3.10 |
3.4 |
|
| 3.12 | |
3.5 |
|
| 3.14 | |
3.6 |
| Interest Rate Risk Measures and Net Interest Income Volatility |
| 3.15 |
4.1 |
|
| 4.7 | |
4.2 |
|
| 4.16 | |
4.3 |
|
| 4.24 |
RP® FINANCIAL, LC.
Page 1.1
I. OVERVIEW AND FINANCIAL ANALYSIS
Kaiser Federal Bank (“Kaiser Federal” or the “Bank”) is a federally-chartered stock savings bank which conducts operations through its executive offices in Covina, California, and eight branch offices, seven of which are in southern California (Los Angeles, San Bernardino, and Riverside Counties), and one of which is located in Santa Clara in the San Francisco Bay area (Santa Clara County). Three of the nine locations are full service branches and the other six locations are financial service centers. Four of these financial service centers were opened from March 2006 through October 2006 in Bellflower, Harbor City, Los Angeles, and Riverside. Certain of the locations reflect, in part, the former credit union roots and the location of Kaiser Permanente Medical Care Program employees or physicians. The Bank also employs a variety of alternative delivery channels, including 54 ATMs (many of which are remotely located in Kaiser Permanente health care facilities), online banking with bill pay service, audio response, and a telephone call center.
Former Credit Union Operations
Kaiser Federal was originally chartered in 1953 as “Kaiser Foundation Hospital Employees Federal Credit Union,” serving the Los Angeles, San Pedro and Santa Monica employees of the hospital, clinic and KABAT-Kaiser Institute. Over the years, the Board of Directors made strategic decisions to increase the membership potential by adding other Kaiser health facilities and merging with a smaller Kaiser credit union in Northern California. Over the years, Kaiser Federal evolved into a full-service multi-branch financial institution operating through retail branches and remote ATMs located in both southern and northern California, and subsequently changed its name to Kaiser Permanente Federal Credit Union. The conversion to a federal mutual savings bank was completed in November 1999 (the “Charter Conversion”), when it adopted the current name and at which time it became subject to income taxes.
The objective of the Charter Conversion was to enhance long-term viability by expanding the field of membership to the local community. Furthermore, as a credit union the
RP® FINANCIAL, LC.
Page 1.2
loans/deposits ratio was historically low as the loan demand by depositors was relatively low. The Board sought to change the charter to become a more active lender in the local community.
Post-Charter Conversion Operations
The Bank’s post Charter Conversion operations have been characterized by relatively strong growth in loans and deposits, with much of the loan growth attributable to affiliate relationships. The loan growth has featured expanded lending authority, as evidenced in the growth of permanent residential mortgages and commercial and multi-family loans (“income property loans”).
Since the Charter Conversion, the Bank has been regulated by the Office of Thrift Supervision (“OTS”). The Bank is currently a member of the Federal Home Loan Bank (“FHLB”) system. The Bank’s deposits are insured up to the regulatory maximums by the Deposit Insurance Fund (“DIF”) of the Federal Deposit Insurance Corporation (“FDIC”).
Kaiser Federal reorganized into a mutual holding company (“MHC”) structure in July 2003, and no stock was issued publicly at the time. Simultaneous with the MHC reorganization and formation of K-Fed Mutual Holding Company (the “MHC”), a wholly-owned mid-tier stock holding company was formed, K-Fed Bancorp (“K-Fed”), and Kaiser Federal became a wholly-owned stock subsidiary of K-Fed. The MHC and K-Fed were both capitalized with $50,000 in cash concurrent with their formation.
On March 30, 2004, K-Fed completed a minority stock offering in which it sold 5,686,750 shares, or 39.09% of total shares to eligible depositors and the Employee Stock Ownership Plan (“ESOP”). The remaining 8,861,750 outstanding shares of K-Fed’s common stock were issued to the MHC. Since the initial public offering (“IPO”) K-Fed has declared eleven quarterly stock dividends and has repurchased 775,815 publicly-held shares through three stock repurchase programs.
At June 30, 2007, K-Fed had total assets of $799.6 million, deposits of $494.1 million and equity of $92.3 million, or 11.6% of total assets. As of this date, approximately 39.5% of K-Fed’s deposits were from customers who are employed by the Kaiser Permanente Medical Care
RP® FINANCIAL, LC.
Page 1.3
Program. Audited financial statements for the most recent period are included by reference as Exhibit I-1 and key operating ratios are set forth in Exhibit I-2.
Plan of Conversion and Reorganization
On June 28, 2007, K-Fed announced that the Boards of Directors of the MHC, K-Fed and the Bank unanimously adopted a Plan of Conversion and Reorganization (the “Plan of Conversion”), pursuant to which K-Fed will convert from the two-tier MHC structure to the full stock holding company structure and concurrently conduct a second-step conversion offering (“Second Step Conversion” or “Offering”) that will represent the MHC’s ownership interest in K-Fed. As of June 30, 2007, the MHC’s ownership interest in K-Fed approximated 63.5%. Pursuant to the plan of conversion, K-Fed, which owns 100% of the Bank, will be succeeded by a new federally chartered stock corporation named Kaiser Federal Financial Group, Inc. (“Kaiser Federal Financial” or the “Company”). The Company will also issue exchange shares of its common stock to the public shareholders pursuant to an exchange ratio that will result in the same 36.5% aggregate ownership percentage as immediately before the Offering.
The Second Step Conversion will increase the capital level to support further expansion, improve the overall competitive position of Kaiser Federal Financial in the local market area, enhance profitability and reduce interest rate risk. Importantly, the additional equity will provide a larger capital base for continued growth and diversification, as well as increase the lending capability and loans to one borrower limit. Future growth opportunities are expected through the current branch network as well as through de novo branching in the regional markets served. Additionally, the Company anticipates that growth opportunities will result from regional bank consolidation in the local market and the resulting fallout of customers who are attracted to Kaiser Federal Financial’s customer service and products and services. The MHC structure has limited the opportunity to acquire other institutions – so the Second Step Conversion should facilitate the Company’s ability to pursue such acquisitions through increased capital as well as the ability to use common stock as merger consideration. Further, the Second Step Conversion
RP® FINANCIAL, LC.
Page 1.4
will increase the public ownership, which is expected to improve the liquidity of the common stock.
| The projected use of stock proceeds is highlighted below. | ||
|
| ||
| • | The Company. The Company is expected to retain up to 50% of the net conversion proceeds. At present, Company funds, net of the loan to the ESOP, are expected to be invested initially into investment securities consistent with the Bank’s current composition (i.e., U.S. government and agency securities and high quality mortgage-related securities with laddered maturities and durations typically no longer than five years). Over time, Company funds are anticipated to be utilized for various corporate purposes, possibly including acquisitions, infusing additional equity into the Bank, repurchases of common stock, and the payment of regular and/or special cash dividends. |
|
|
|
|
|
| • | The Bank. The balance of the net offering proceeds will be infused into the Bank. Cash proceeds (i.e., net proceeds less deposits withdrawn to fund stock purchases) infused into the Bank are anticipated to become part of general operating funds, and are expected to initially be invested in short-term investments pending longer term deployment, i.e., funding lending activities, purchasing mortgage backed securities (“MBS”), general corporate purposes and/or expansion and diversification. |
|
The Company expects to continue to pursue a controlled growth strategy, leveraging its strong pro forma capital, growing primarily through the current delivery channels. If appropriate, Kaiser Federal Financial may also consider various capital management strategies to assist in the long-run objective of increasing return on equity.
Throughout much of its corporate history, Kaiser Federal Financial’s strategic focus was on serving its historical credit union field of membership. However, the Charter Conversion was undertaken to broaden the traditional customer base beyond the Kaiser Permanente Medical Program with the objective of enhancing future growth prospects while mitigating the risk exposure related to conducting businesses with a limited customer base tied to a single employer. The Company has been generally successful in such customer diversification initiatives through de novo branching, establishing a network of remote ATMs, broadening lending programs
RP® FINANCIAL, LC.
Page 1.5
(including originations and purchases), emphasizing marketing and competitive pricing strategies and pursuing strategic affiliations to increase loan volume.
Prior to the Charter Conversion, the deposit balances attributable to Kaiser Permanente employees accounted for 50% of total deposits. As of June 30, 2007, having more than doubled in size, the proportion of deposits from Kaiser Permanente employees has diminished to 39.5%, which illustrates the success of its customer diversification strategy. The loan customer diversification is directly attributable to the active purchases of 1-4 family and multi-family mortgage loans from other regional lenders. As the credit union lending restrictions were removed, the Company commenced an active program of originating (or purchasing) loans to non-customers. This loan customer diversification has lessened the Company’s credit risk profile directly linked to the employee concentration with Kaiser Permanente. As of June 30, 2007, 63% of account holders are current Kaiser Permanente employees; 19% are former Kaiser Permanente employees; and 18% are new community accounts.
The ability to market to a broader customer base (both from an employer and geographic perspective) and the ability to offer an expanded line of products, particularly in the mortgage area, have contributed to the Company’s asset and loan growth, which have equaled 16.5% and 15.7%, respectively, since the end of fiscal 2003. Additionally, the Charter Conversion enhanced the ability to expand deposits, loans and assets. Such expansion, coupled with the additional capital from the Minority Stock Issuance, have led to earnings growth for the Company, notwithstanding a highly competitive environment as well as spread compression attributable to a flat yield curve.
The current operating strategy is designed to take advantage of the broad geographic footprint encompassed by Kaiser Federal Financial’s offices and the remote ATMs from Southern California extending up through the San Francisco Bay area. The Company’s strong loan growth in recent years has been largely attributable to the purchase of loans secured by 1-4 family mortgage loans, whereby the servicing rights have been retained by the seller. Such purchases have generally consisted of loans acquired from major financial institutions or mortgage banking companies and have been comprised of adjustable rate or hybrid loans (i.e., loans which are adjustable for the first 3 or 5 years of the loan and adjustable thereafter). The Company’s internally originated 1-4 family mortgages have been relatively limited, and have
RP® FINANCIAL, LC.
Page 1.6
generally consisted of longer-term fixed rate mortgages, typically with maturities ranging from 15 to 30 years. However, over the past few years, the Company has been purchasing longer term-fixed rate mortgages. The focus of Kaiser Federal Financial’s mortgage lending encompasses the originations and purchases of both residential (i.e., secured by 1-4 family properties) and multi family residential loans and to a lesser extent the originations and purchases of commercial real estate loans. At June 30, 2007, the Company’s real estate loan portfolio totaled $635.4 million, or 90.5% of the gross loan portfolio. Purchased real estate loans as of the same date totaled $406.5 million, or 64.0% of the real estate loan portfolio. The Company also employs a staff of commercial loan officers who originated all of the Company’s commercial and multi-family mortgage loan volume in fiscal 2007. The Company has limited the cost of loan originations by relying heavily on purchased and/or broker sourced loans, particularly with respect to residential loans. All originated as well as purchased loans are underwritten internally pursuant to the Company’s board approved underwriting guidelines.
The Company’s strong deposit growth reflects the success of its premium pricing strategy. The premium deposit pricing has facilitated growth and enabled the Company to limit “brick and mortar” expense (including investment in systems) – the success of this strategy is underscored by the fact that only three of its offices are full service. The Company’s growth in fiscal 2004 is attributed to a significant amount of short-term deposit growth experienced during the second and third quarters in connection with the initial stock offering, as well as a new branch location that was acquired with the purchase of the Panorama City branch of Pan American Bank. The acquired deposits from Pan American Bank totaled $61.2 million. Total deposits declined slightly in 2006, but grew 6.6% in 2007 to the highest balance over the past five years.
The Company’s balance sheet growth has been partially funded by FHLB advances, which at June 30, 2007 totaled $210 million. All of the Company’s borrowed funds have fixed rates and have been used to fund both wholesale leveraging as well as increases in loan origination and purchase volume. Following the Second Step Conversion, the Company may use additional borrowings to facilitate additional wholesale to improve earnings and return on equity. To the extent additional borrowings are utilized by the Company, FHLB advances would likely
RP® FINANCIAL, LC.
Page 1.7
continue to be the principal source of such borrowings, followed by reverse repurchase agreements.
The Company’s earnings are largely dependent upon net interest income and operating expense levels, as sources of non-interest operating income remain relatively limited. Core earnings have generally been trending upward as the Company benefited from loan growth funded through a mix of deposits and borrowed funds as well as the net reinvestment benefit from the proceeds raised in the 2004 minority stock issuance.
The Company maintains nine branch offices, six of which are financial service centers (or “cashless” branches). In addition, the Company employs a variety of alternative delivery systems, particularly technology-oriented systems, which are designed to minimize overhead costs, provide convenient around-the-clock access for customers and increase profitability through continued balance sheet growth. The Company has significantly expanded its retail footprint through its network of 54 ATMs, the majority of which are remote locations. The Company maintains its own web site, and utilizes such technology to communicate key information to its customers. The Company provides the ability for online banking, which includes cash management and online bill payment. The Company’s 24-hour telephone banking system provides access to account information and numerous banking functions. Remote access methods, such as the ATM network, audio response unit, call center, and online banking/bill payer continue to process over 90% of the Company’s customer transactions. Branches and financial service centers strategically located for the Company’s markets provide touchstones to attract new account holders and facilitate transactions that cannot be completed electronically.
While Kaiser Federal recognized certain benefits as a credit union including its non-taxable status and strong corporate ties, that charter limited the types of products and services it could offer and to whom. Prior to the Charter Conversion, the Company had developed a niche in mortgage lending but was limited in its ability to expand such lending operations beyond the field of membership. Today, the Company has the ability to serve the local community and offer a more diverse array of products and services. Kaiser Federal offers a wide array of banking services including savings, certificate and checking accounts, ATM and debit cards, wire transfers, online banking, fixed or adjustable-rate mortgage loans on residential, multifamily and commercial properties as well as consumer loans. The post-offering business strategy employed
RP® FINANCIAL, LC.
Page 1.8
by the Company will continue to be to provide quality service, charge limited fees, pay highly competitive rates on savings, and charge equitable loan rates.
Growth Trends
Over the last five fiscal years, the Company has implemented a strategy of growth and expansion, realized both through internal growth at existing branches, the acquisition of one branch in Panorama City in fiscal 2004, and the establishment of four financial service centers in the first three quarters of 2006. The impetus for the balance sheet growth in the 2000 to 2004 period primarily included a strategic intent to grow and diversify the customer base. More recently, since the minority stock issuance completed in 2004, the Company has been seeking to grow the balance sheet with the objective of increasing earnings per share and long-term shareholder value.
This growth and expansion strategy is evidenced in the summary balance sheet data set forth in Table 1.1, which shows that total assets increased 16.5% annually from $433.8 million at the end of fiscal 2003, to $799.6 million for fiscal 2007. The Company’s assets are funded through a combination of deposits, borrowings and retained earnings. Deposits have always comprised the majority of funding liabilities, increasing at an annual rate of 9.3% since 2003. Borrowings have also increased reflecting certain asset/liability (“A/L”) management strategies and wholesale leveraging opportunities. In the future, the Company expects to continue to utilize FHLB advances and reverse repurchase agreements in several ways: (1) as an alternative source of liquidity to fund loan and other balance sheet growth; and (2) in connection with potential leveraging and/or interest rate risk management strategies, particularly if the yield curve steepens.
Annual equity growth equaled 27.1% since the end of fiscal 2003, with the expanded equity base primarily reflecting the impact of retained earnings over the period and the minority stock issuance completed in fiscal 2004. Since the end of fiscal 2004, equity has increased from $89.1 million to $92.3 million which is attributable to retained earnings exceeding dividend payments and stock repurchases for the period. Coupled with moderate balance sheet growth
RP ® Financial, LC.
Page 1.9
Table 1.1
Kaiser Federal Financial Group, Inc.
Historical Balance Sheets
(Amount and Percent of Assets)
|
| As of the Fiscal Year Ended June 30, |
| ||||||||||||||||
|
|
| |||||||||||||||||
|
| 2003 |
| 2004 |
| 2005 |
| ||||||||||||
|
|
|
|
| |||||||||||||||
|
| Amount |
| Pct |
| Amount |
| Pct |
| Amount |
| Pct |
| ||||||
|
|
|
|
|
|
|
| ||||||||||||
|
|
| ($000) |
|
| (%) |
|
| ($000) |
|
| (%) |
|
| ($000) |
|
| (%) |
|
Total Amount of: |
|
|
|
|
|
|
|
|
|
|
|
|
|
|
|
|
|
|
|
Assets |
| $ | 433,753 |
|
| 100.00 | % | $ | 584,422 |
|
| 100.00 | % | $ | 639,882 |
|
| 100.00 | % |
Cash and Cash Equivalents |
|
| 16,190 |
|
| 3.73 | % |
| 12,158 |
|
| 2.08 | % |
| 17,315 |
|
| 2.71 | % |
Loans Receivable (net) |
|
| 389,640 |
|
| 89.83 | % |
| 496,206 |
|
| 84.91 | % |
| 537,567 |
|
| 84.01 | % |
Investment Securities - AFS |
|
| 0 |
|
| 0.00 | % |
| 21,003 |
|
| 3.59 | % |
| 18,848 |
|
| 2.95 | % |
Investment Securities - HTM |
|
| 14,247 |
|
| 3.28 | % |
| 41,361 |
|
| 7.08 | % |
| 30,834 |
|
| 4.82 | % |
Other Investments |
|
| 6,437 |
|
| 1.48 | % |
| 2,970 |
|
| 0.51 | % |
| 9,010 |
|
| 1.41 | % |
FHLB Stock |
|
| 2,602 |
|
| 0.60 | % |
| 3,290 |
|
| 0.56 | % |
| 4,027 |
|
| 0.63 | % |
Goodwill and Core Deposit Intangible |
|
| 0 |
|
| 0.00 | % |
| 0 |
|
| 0.00 | % |
| 4,518 |
|
| 0.71 | % |
BOLI |
|
| 0 |
|
| 0.00 | % |
| 0 |
|
| 0.00 | % |
| 10,089 |
|
| 1.58 | % |
Deposits |
|
| 346,239 |
|
| 79.82 | % |
| 422,953 |
|
| 72.37 | % |
| 475,792 |
|
| 74.36 | % |
Borrowed Funds |
|
| 50,000 |
|
| 11.53 | % |
| 70,000 |
|
| 11.98 | % |
| 70,777 |
|
| 11.06 | % |
Total Equity |
|
| 35,395 |
|
| 8.16 | % |
| 89,116 |
|
| 15.25 | % |
| 90,760 |
|
| 14.18 | % |
Tangible Equity |
|
| 35,395 |
|
| 8.16 | % |
| 89,116 |
|
| 15.25 | % |
| 86,242 |
|
| 13.48 | % |
Loans/Deposits |
|
|
|
|
| 113.29 | % |
|
|
|
| 118.10 | % |
|
|
|
| 113.83 | % |
Number of Full Service Offices |
|
|
|
|
| 2 |
|
|
|
|
| 2 |
|
|
|
|
| 3 |
|
Number of Financial Service Centers |
|
|
|
|
| 1 |
|
|
|
|
| 2 |
|
|
|
|
| 2 |
|
|
| As of the Fiscal Year Ended June 30, |
| Compounded |
| |||||||||||
|
|
|
| |||||||||||||
|
| 2006 |
| 2007 |
|
| ||||||||||
|
|
|
|
| ||||||||||||
|
| Amount |
| Pct |
| Amount |
| Pct |
| Pct |
| |||||
|
|
|
|
|
|
| ||||||||||
|
|
| ($000) |
|
| (%) |
|
| ($000) |
|
| (%) |
|
| (%) |
|
Total Amount of: |
|
|
|
|
|
|
|
|
|
|
|
|
|
|
|
|
Assets |
| $ | 738,899 |
|
| 100.00 | % | $ | 799,625 |
|
| 100.00 | % |
| 16.52 | % |
Cash and Cash Equivalents |
|
| 25,579 |
|
| 3.46 | % |
| 26,732 |
|
| 3.34 | % |
| 13.36 | % |
Loans Receivable (net) |
|
| 634,093 |
|
| 85.82 | % |
| 699,143 |
|
| 87.43 | % |
| 15.74 | % |
Investment Securities - AFS |
|
| 11,289 |
|
| 1.53 | % |
| 13,579 |
|
| 1.70 | % |
| N.M |
|
Investment Securities - HTM |
|
| 24,738 |
|
| 3.35 | % |
| 21,096 |
|
| 2.64 | % |
| 10.31 | % |
Other Investments |
|
| 9,010 |
|
| 1.22 | % |
| 2,970 |
|
| 0.37 | % |
| -17.58 | % |
FHLB Stock |
|
| 8,746 |
|
| 1.18 | % |
| 9,870 |
|
| 1.23 | % |
| 39.56 | % |
Goodwill and Core Deposit Intangible |
|
| 4,387 |
|
| 0.59 | % |
| 4,273 |
|
| 0.53 | % |
| N.M |
|
BOLI |
|
| 10,514 |
|
| 1.42 | % |
| 10,954 |
|
| 1.37 | % |
| N.M |
|
Deposits |
|
| 463,454 |
|
| 62.72 | % |
| 494,128 |
|
| 61.79 | % |
| 9.30 | % |
Borrowed Funds |
|
| 179,948 |
|
| 24.35 | % |
| 210,016 |
|
| 26.26 | % |
| 43.16 | % |
Total Equity |
|
| 92,657 |
|
| 12.54 | % |
| 92,317 |
|
| 11.55 | % |
| 27.08 | % |
Tangible Equity |
|
| 88,270 |
|
| 11.95 | % |
| 88,044 |
|
| 11.01 | % |
| 25.59 | % |
Loans/Deposits |
|
|
|
|
| 138.71 | % |
|
|
|
| 143.49 | % |
|
|
|
Number of Full Service Offices |
|
|
|
|
| 3 |
|
|
|
|
| 3 |
|
|
|
|
Number of Financial Service Centers |
|
|
|
|
| 4 |
|
|
|
|
| 6 |
|
|
|
|
Source: Kaiser Federal Financial Group, Inc.’s prospectus.
RP® FINANCIAL, LC.
Page 1.10
achieved over the period, the equity-to-assets ratio declined from 15.3% as of the end of fiscal 2004 (just after the 2004 minority stock issuance) to 11.6% as of the end of fiscal 2007. Going forward, the post-offering equity growth rate is expected to be impacted by a number of factors including the higher level of capitalization, the reinvestment and leveraging of the offering proceeds, the expense of the stock benefit plans and the potential impact of dividends and stock repurchases.
Since a substantial portion of the Company’s recent growth has been facilitated through originated loans sourced from third parties who retain the servicing rights, the Company has limited contact with many of its new borrowers; thus, cross-selling opportunities are more limited than if such loans had been self originated. From a funding perspective, the Company has been pricing certain deposits at a premium. Thus, some of the Company’s newer depositors include a number of rate-based customers, which again provide limited opportunity for cross-selling, particularly for those depositors who are located outside the Company’s market area. These characteristics will be considered in the pricing section.
Loans Receivable
The Company’s lending strategy has primarily emphasized real estate lending, primarily 1-4 family residential mortgage loans and, to a lesser extent, income property loans. Kaiser Federal Financial’s loan portfolio composition as of June 30, 2007 underscores such emphasis – permanent first mortgage loans secured by 1-4 family residential properties totaled $469.5 million, equal to 66.9% of gross loans, while multi-family and commercial real estate loans totaled $165.9 million, equal to approximately 23.6%. Consumer loans equaled 9.5% of gross loans.
The majority of the Company’s 1-4 family residential mortgage loans conform to standards set by either Freddie Mac or Fannie Mae. Most non-conforming residential loans are non-conforming as to the loan amount (i.e., jumbo loans), while otherwise meeting the agency credit criteria. The majority of the Company’s 1-4 family mortgage loans are purchased from financial institutions and mortgage bankers. Purchased residential mortgage loans have typically been variable rate or hybrid ARMs (i.e., fixed for a period of up to 5 years and adjustable thereafter), however in recent years have also included 15 and 30 year fixed rate
RP® FINANCIAL, LC.
Page 1.11
loans. Specifically, during fiscal 2007, the Company only purchased fixed rate 1-4 family residential mortgage loans.
The majority of the loans that are purchased are acquired with servicing released to allow for greater investments in real estate lending without having to significantly increase the Company’s servicing and operations costs. Internal originations have been relatively modest in comparison to the purchase volume in recent years.
The Company’s multi-family and commercial mortgage lending has been conducted in California, particularly Southern California. Such loans are typically offered with adjustable rates, which adjust based on a U.S. Treasury index (typically the one year CMT) but which may be fixed for the first 3 or 5 years of the loan. Such loans typically possess maturities ranging up to 15 years, with amortization periods of up to 30 years. Income property loans are generated through an in-house staff of originators, as well as from the use of mortgage brokers. The Company retains a portion of the larger multi-family loans originated, and sells participations to manage the exposure to any one borrower.
Cash, Investments and Mortgage-Backed Securities
Kaiser Federal Financial’s preference is to deploy the majority of assets into loans while maintaining required liquidity. The Company anticipates initially reinvesting the net offering proceeds into investments with shorter maturities, pending longer-term deployment primarily into loans.
As of the end of fiscal 2007, the Company’s portfolio of cash and liquidity investments totaled $29.7 million, or 3.7% of total assets. At this date, this portfolio was comprised of non-interest bearing cash and cash equivalents ($11.0 million); federal funds sold ($15.8 million), and interest-bearing deposits at other financial institutions ($3.0 million). All of the foregoing assets are considered to be cash or cash equivalents, and thus are not classified as available for sale (“AFS”) or held to maturity (“HTM”). Additionally, the Company maintains a modest investment in FHLB stock with a book value of $9.9 million. See Exhibit I-3 for the investment portfolio composition.
RP® FINANCIAL, LC.
Page 1.12
The Company also maintains an investment portfolio of securities AFS and securities HTM. The securities classified as AFS consist primarily of mortgage-backed securities (“MBS”) which totaled $13.6 million, equal to 1.7% of assets as of the end of fiscal 2007. The securities classified as HTM consists of both MBS and collateralized mortgage obligations (“CMO”), which totaled $21.1 million, or 2.6% of assets as of the end of fiscal 2007. It is management’s intent to maintain comparatively modest MBS and CMO balances, however, in favor of loans.
Bank Owned Life Insurance
In April 2005, the Company purchased $10.0 million in bank owned life insurance (“BOLI”) and, as of June 30, 2007, the balance of BOLI totaled $11.0 million, which reflects a modest increase owing to increases in the cash surrender value of the policies. The balance of the BOLI reflects the value of life insurance contracts on selected members of the Company’s management and has been purchased with the intent to offset various benefit program expenses on a tax advantaged basis. The increase in the cash surrender value of the BOLI is recognized as an addition to non-interest income on an annual basis.
Intangible Assets
The Company maintained goodwill and core deposit intangibles totaling $4.3 million, or 0.5% of assets, at the end of fiscal 2007, which consisted of $3.95 million of goodwill and $323,000 of core deposit intangibles (“CDI”). The intangible assets stem from the September 2004 acquisition of the Pan American Bank’s Panorama City branch. The CDI is being amortized over approximately eight years on an accelerated basis and deducted for tax purposes over 15 years using the straight line method. The CDI will be fully amortized in approximately 2013. The goodwill is tested for impairment at least annually, and no impairment charges have been recorded to date.
Funding Structure
Retail deposits have generally met the substantial portion of the Company’s funding needs supplemented with borrowed funds from the FHLB of San Francisco. The Bank is
RP® FINANCIAL, LC.
Page 1.13
anticipating participating in a time deposit program with the State of California, which requires securities to be used as collateral..
The Company maintains a strong level of savings and transaction accounts, which totaled $255.4 million, or 51.7% of total deposits, as of the end of fiscal 2007. While savings and transaction accounts comprise the largest portion of deposits in aggregate, certificates of deposits (“CDs”) comprise the single largest segment of deposits. CDs equaled $238.7 million, or 48.3% of total deposits at June 30, 2007. In comparison, non-interest-bearing checking, money market and passbook savings accounts equaled $43.2 million (8.7% of deposits), $75.6 million (15.3% of deposits), and $136.6 million (27.7% of deposits), respectively.
The Company has continually utilized borrowed funds over the last five fiscal years, with all of the borrowings consisting of FHLB advances. As of June 30, 2007, FHLB advances totaled $210.0 million, representing 26.3% of total assets. The Company typically utilizes borrowings: (1) when such funds are priced attractively relative to deposits; (2) to lengthen the duration of liabilities; (3) to enhance earnings when attractive revenue enhancement opportunities arise; and (4) to generate additional liquid funds, if required. Recent growth in borrowings was attributable for efforts to fund loan growth, leverage equity and increase earnings. The Company may continue to utilize borrowings as a supplemental funding source in the future, generally on a short-to-intermediate term basis.
Equity
As a mutual institution, the Company’s equity was primarily impacted by the level of earnings. With the completion of the minority stock issuance in March 2004, Kaiser Federal Financial’s equity was more than doubled to $89.1 million, or 15.3% of assets as of June 30, 2004. Since fiscal year end 2004 of the limited increase in retained earnings has reflected the Company’s capital strategies, including the payment of shareholder dividends and share repurchases. As a result, the Company’s equity has only grown to $92.3 million, as of June 30, 2007, reflecting a 1.2% compounded annual rate of growth since the end of fiscal 2004. However, the equity ratio has declined since fiscal 2004 reflecting the impact of asset growth. The Bank maintained strong surpluses relative to its regulatory capital requirements at June 30, 2007, and thus qualified as a “well capitalized” institution. The offering proceeds will serve to
RP® FINANCIAL, LC.
Page 1.14
further strengthen the Company’s regulatory capital position and support further growth. As discussed previously, the post-offering equity growth rate is expected to be impacted by a number of factors including the higher level of capitalization, the reinvestment of the offering proceeds, the expense of the stock benefit plans and the potential impact of dividends and stock repurchases.
Table 1.2 shows the Company’s historical income statements for the fiscal years ended 2003 to 2007. The Company’s net earnings have increased to $4.7 million (0.61% of average assets) in fiscal 2007, from $2.4 million (0.68% of average assets) in fiscal 2003. Earnings have eased slightly from the nearly $5.0 million peak in fiscal 2005, or 0.82% of average assets.
Earnings were boosted in fiscal 2004 as a result of the balance sheet growth during the 12 month period, despite the narrowed spreads. The Company reported higher earnings in fiscal 2005, with profitability increasing to $5.0 million (0.82% of average assets), respectively, before slightly declining to $4.9 million (0.68% of average assets) in fiscal 2006 and declining to $4.7% (0.61% of average assets) for fiscal 2007. Peak earnings for fiscal 2005 is both the result of the net reinvestment benefit of the offering proceeds and continuing strong balance sheet growth. Earnings have since eased due to margin compression as balance sheet growth moderated and as the proportion of balance sheet funding was in the form of higher cost borrowings and CDs. Earnings in fiscal 2007 also benefited from the near elimination of the loss in equity investment. These trends are described more fully below.
Net Interest Income
Net interest income steadily increased over the fiscal 2003 to 2006 period, primarily reflecting from the minority stock issuance and the impact of balance sheet growth and the reinvestment of offering proceeds. However, there was a decline during the most recent fiscal year due to margin compression given the unfavorable yield curve environment. The yield-cost spreads are the result of several factors including the flattening yield curve experienced over the last several fiscal years as the Federal Open Market Committee (“FOMC”) has increased the targeted Federal funds rate 17 times in 25 basis point increments while longer term interest rates
RP ® Financial, LC.
Page 1.15
Table 1.2
Kaiser Federal Financial Group, Inc.
Historical Income Statements
|
| As of the Fiscal Year Ended June 30, |
| ||||||||||||||||||||||||||||
|
|
| |||||||||||||||||||||||||||||
|
| 2003 |
| 2004 |
| 2005 |
| 2006 |
| 2007 |
| ||||||||||||||||||||
|
|
|
|
|
|
| |||||||||||||||||||||||||
|
| Amount |
| Pct(1) |
| Amount |
| Pct(1) |
| Amount |
| Pct(1) |
| Amount |
| Pct(1) |
| Amount |
| Pct(1) |
| ||||||||||
|
|
|
|
|
|
|
|
|
|
|
| ||||||||||||||||||||
|
|
| ($000) |
|
| (%) |
|
| ($000) |
|
| (%) |
|
| ($000) |
|
| (%) |
|
| ($000) |
|
| (%) |
|
| ($000) |
|
| (%) |
|
Interest Income |
| $ | 20,444 |
|
| 5.70 | % | $ | 22,037 |
|
| 4.03 | % | $ | 28,168 |
|
| 4.62 | % | $ | 35,821 |
|
| 4.94 | % | $ | 41,166 |
|
| 5.34 | % |
Interest Expense |
|
| (8,365 | ) |
| -2.33 | % |
| (9,622 | ) |
| -1.76 | % |
| (10,800 | ) |
| -1.77 | % |
| (17,464 | ) |
| -2.41 | % |
| (23,140 | ) |
| -3.00 | % |
|
|
|
|
|
|
|
|
|
|
|
| ||||||||||||||||||||
Net Interest Income |
| $ | 12,079 |
|
| 3.37 | % | $ | 12,415 |
|
| 2.27 | % | $ | 17,368 |
|
| 2.85 | % | $ | 18,357 |
|
| 2.53 | % | $ | 18,026 |
|
| 2.34 | % |
Provision for Loan Losses |
|
| (1,124 | ) |
| -0.31 | % |
| (483 | ) |
| -0.09 | % |
| (406 | ) |
| -0.07 | % |
| (652 | ) |
| -0.09 | % |
| (529 | ) |
| -0.07 | % |
|
|
|
|
|
|
|
|
|
|
|
| ||||||||||||||||||||
Net Interest Income after Provisions |
| $ | 10,955 |
|
| 3.05 | % | $ | 11,932 |
|
| 2.18 | % | $ | 16,962 |
|
| 2.78 | % | $ | 17,705 |
|
| 2.44 | % | $ | 17,497 |
|
| 2.27 | % |
Bank-Owned Life Insurance |
|
| — |
|
| 0.00 | % |
| — |
|
| 0.00 | % |
| 89 |
|
| 0.01 | % |
| 426 |
|
| 0.06 | % |
| 439 |
|
| 0.06 | % |
Other Operating Income |
|
| 3,186 |
|
| 0.89 | % |
| 3,402 |
|
| 0.62 | % |
| 3,472 |
|
| 0.57 | % |
| 3,588 |
|
| 0.49 | % |
| 3,919 |
|
| 0.51 | % |
Operating Expense |
|
| (9,772 | ) |
| -2.72 | % |
| (10,000 | ) |
| -1.83 | % |
| (12,041 | ) |
| -1.98 | % |
| (13,476 | ) |
| -1.86 | % |
| (14,518 | ) |
| -1.88 | % |
|
|
|
|
|
|
|
|
|
|
|
| ||||||||||||||||||||
Net Operating Income |
| $ | 4,369 |
|
| 1.22 | % | $ | 5,334 |
|
| 0.98 | % | $ | 8,482 |
|
| 1.39 | % | $ | 8,243 |
|
| 1.14 | % | $ | 7,337 |
|
| 0.95 | % |
Loss on Equity Investment |
| $ | — |
|
| 0.00 | % | $ | (173 | ) |
| -0.03 | % | $ | (505 | ) |
| -0.08 | % | $ | (588 | ) |
| -0.08 | % | $ | (99 | ) |
| -0.01 | % |
MHC Reorganization Expenses |
|
| (220 | ) |
| -0.06 | % |
| — |
|
| 0.00 | % |
| — |
|
| 0.00 | % |
| — |
|
| 0.00 | % |
| — |
|
| 0.00 | % |
|
|
|
|
|
|
|
|
|
|
|
| ||||||||||||||||||||
Total Non-Operating Income/(Expense) |
| $ | (220 | ) |
| -0.06 | % | $ | (173 | ) |
| -0.03 | % | $ | (505 | ) |
| -0.08 | % | $ | (588 | ) |
| -0.08 | % | $ | (99 | ) |
| -0.01 | % |
Net Income Before Tax |
| $ | 4,149 |
|
| 1.16 | % | $ | 5,161 |
|
| 0.94 | % | $ | 7,977 |
|
| 1.31 | % | $ | 7,655 |
|
| 1.06 | % | $ | 7,238 |
|
| 0.94 | % |
Income Taxes |
|
| (1,710 | ) |
| -0.48 | % |
| (1,993 | ) |
| -0.36 | % |
| (2,980 | ) |
| -0.49 | % |
| (2,726 | ) |
| -0.38 | % |
| (2,534 | ) |
| -0.33 | % |
|
|
|
|
|
|
|
|
|
|
|
| ||||||||||||||||||||
Net Income (Loss) |
| $ | 2,439 |
|
| 0.68 | % | $ | 3,168 |
|
| 0.58 | % | $ | 4,997 |
|
| 0.82 | % | $ | 4,929 |
|
| 0.68 | % | $ | 4,704 |
|
| 0.61 | % |
Estimated Core Net Income |
|
|
|
|
|
|
|
|
|
|
|
|
|
|
|
|
|
|
|
|
|
|
|
|
|
|
|
|
|
|
|
Net Income |
| $ | 2,439 |
|
| 0.68 | % | $ | 3,168 |
|
| 0.58 | % | $ | 4,997 |
|
| 0.82 | % | $ | 4,929 |
|
| 0.68 | % | $ | 4,704 |
|
| 0.61 | % |
Addback(Deduct): Non-Recurring (Inc)/Exp |
|
| 220 |
|
| 0.06 | % |
| 173 |
|
| 0.03 | % |
| 505 |
|
| 0.08 | % |
| 588 |
|
| 0.08 | % |
| 99 |
|
| 0.01 | % |
Tax Effect (1) |
|
| (90 | ) |
| -0.03 | % |
| (71 | ) |
| -0.01 | % |
| (208 | ) |
| -0.03 | % |
| (242 | ) |
| -0.03 | % |
| (41 | ) |
| -0.01 | % |
|
|
|
|
|
|
|
|
|
|
|
| ||||||||||||||||||||
Estimated Core Net Income |
| $ | 2,569 |
|
| 0.72 | % | $ | 3,270 |
|
| 0.60 | % | $ | 5,294 |
|
| 0.87 | % | $ | 5,275 |
|
| 0.73 | % | $ | 4,762 |
|
| 0.62 | % |
Memo: |
|
|
|
|
|
|
|
|
|
|
|
|
|
|
|
|
|
|
|
|
|
|
|
|
|
|
|
|
|
|
|
Expense Coverage Ratio (2) |
|
| 123.61 | % |
|
|
|
| 124.15 | % |
|
|
|
| 144.24 | % |
|
|
|
| 136.22 | % |
|
|
|
| 124.16 | % |
|
|
|
Efficiency Ratio (3) |
|
| 64.02 | % |
|
|
|
| 63.22 | % |
|
|
|
| 57.53 | % |
|
|
|
| 60.24 | % |
|
|
|
| 64.86 | % |
|
|
|
Effective Tax Rate |
|
| 41.22 | % |
|
|
|
| 38.62 | % |
|
|
|
| 37.36 | % |
|
|
|
| 35.61 | % |
|
|
|
| 35.01 | % |
|
|
|
(1) | Based on an estimated effective tax rate of 41.1%. |
(2) | Net interest income divided by operating expenses. |
(3) | Operating expenses as a percent of the sum of net interest income and other operating income (excluding gains on sale). |
Source: Kaiser Federal Financial Group, Inc.’s prospectus.
RP® FINANCIAL, LC.
Page 1.16
have increased at a much more modest pace. Specifically, net interest income increased from $12.1 million in fiscal 2003 to a peak level of $18.4 million in fiscal 2006, before declining slightly to $18.0 million for the fiscal year 2007. The net interest income to average assets ratio has followed a somewhat different trend than the dollar amount, as described more fully below. After peaking at 3.37% for fiscal 2003, the net interest income ratio declined to 2.27% for fiscal 2004, which was caused by a temporary change in asset mix due to a significant amount of short-term deposit growth experienced during fiscal 2004 in connection with the initial stock offering, which were invested in low yielding Federal Funds, which were partially offset by lower levels of rates paid on deposits. The Company was able to recover somewhat into fiscal 2005, however, and since then, the adverse yield curve has resulted in two years of decline in the net interest income ratio.
The decline in the net interest income ratio primarily reflects several factors. First, with the charter conversion the Company began to expand mortgage lending, which has lower yields than the consumer lending historically emphasized. Moreover, loan yields have been adversely impacted by the high prepayment of purchased loans that were acquired at a premium (thus requiring the premium to be amortized). Additionally, some of the residential ARMs had low rates which initially provided a limited spread over the cost of funds. More recently, the Company’s cost of funds has increased quickly as the growth objectives were realized through highly competitive pricing on selected deposit accounts and the increased funding with borrowings. Growth in net interest income was achieved in fiscal 2006 due to balance sheet growth notwithstanding ongoing spread compression. As noted, however, moderated growth and a continuing adverse yield curve in 2007 also led to a dollar decline in net interest income.
The Company’s interest rate spreads (see Exhibit I-4) have declined modestly over the last three fiscal years, from 2.48% in fiscal 2005, to 2.17% in fiscal 2006, and diminishing still further to 1.87% in fiscal 2007. The spreads trends reflect the strategies and rate environment discussed above. The initial reinvestment of the offering proceeds should increase net interest income as the funds are reinvested, with longer-term earnings benefits realized through leveraging of the proceeds.
RP® FINANCIAL, LC.
Page 1.17
Loan Loss Provisions
Provisions for loan losses have historically reflected the large balance of consumer loans, particularly automobile loans. Loan loss provisions have moderated since the Charter Conversion and shift in lending strategy reflecting the high growth in mortgage loans and the lower concentration of consumer lending. Going forward, the Company will continue to evaluate the adequacy of the level of general valuation allowances (“GVAs”) on a regular basis, and establish additional loan loss provisions in accordance with the Company’s asset classification and loss reserve policies. For the fiscal year 2007, loan loss provisions totaled $529,000, or 0.07% of average assets.
Non-Interest Income
While non-interest income has increased over the last five fiscal years, the contribution to profitability has diminished. Specifically, non-interest income increased from $3.2 million (0.89% of average assets) in fiscal 2003, to $4.4 million (0.57% of average assets) for fiscal 2007. The largest component of the Company’s non-interest income consists of deposit service charges and fees earned on transaction accounts. Other components of non-interest income include returns on the investment in BOLI, which commenced late in fiscal 2005.
Growth in non-interest income from fiscal 2004 to fiscal 2007 is largely the result of increased ATM fees due to increased usage and deployment of remote ATMs.
Operating Expenses
The Company’s operating expenses have increased in recent years due to asset growth and branching, both from acquisition and de novo branching, as well as the deployment of additional remote ATMs. Specifically, the increase in operating expenses recently has been due to employee and facilities costs associated with the relocation of the Company’s Pasadena branch and the openings of financial service centers in Bellflower, Harbor City, Los Angeles, and Riverside. In addition, employee costs have risen due to remaining competitive on a salary basis as well as increased benefit costs including stock-based benefit plans and rising medical insurance premiums. Although operating expenses have increased from $9.8 million in fiscal
RP® FINANCIAL, LC.
Page 1.18
2003 to $14.5 million in fiscal 2007, the ratio to average assets leveled off near 1.90%, much lower than the 2003 ratio of 2.72%.
Operating expenses have increased recently due to increased audit costs as a result of complying with Sarbanes-Oxley and increased legal costs stemming from U.S. Mortgage’s 2006 bankruptcy filing (who services $1.0 million of commercial real estate loan participations previously purchased by the Bank).
Operating expenses are expected to increase on a post-offering basis as a result of the expense of the additional stock-related benefit plans, as well as the planned branching and growth initiatives which are currently underway. At the same time, continued balance sheet growth and reinvestment of the offering proceeds should largely offset the anticipated expense increase.
Non-Operating Income/Expense
Non-operating income and expense items have had a moderate impact on profitability. First, the Company incurred $220,000 of expense (0.06% of average assets) attributable to the July 1, 2003 MHC reorganization in fiscal 2003. Second, since 2004, the Company has realized a loss on an equity investment. The Company has a 14% investment in a California Affordable Housing Program, for the purposes of obtaining tax credits and for Community Reinvestment Act purposes, which totaled $2.1 million at June 30, 2007. The Company is committed to fund an additional $193,000 at June 30, 2007. Under the equity method of accounting, the Company recognizes its ownership share of the profits and losses of the fund. During fiscal 2005 and 2006, the loss on this equity investment was $505,000 and $588,000, respectively. For fiscal 2007, the loss on this equity investment was $99,000, or 0.01% of average assets. The investment is regularly evaluated for impairment and tax credits received from the fund are included in income as a reduction of income tax expense.
Taxes
The Company’s tax rate has declined from 41% in fiscal 2003 to 35% in fiscal 2007. The Company adopted several tax planning strategies including the BOLI investment as well as
RP® FINANCIAL, LC.
Page 1.19
investment in the California Affordable Housing Program which have reduced the effective tax rate.
Efficiency Ratio
The Company’s efficiency ratio steadily improved since fiscal 2003 from 64.0% to 57.8% in fiscal 2005, as balance sheet growth offset operating expense growth and spread compression. The efficiency ratio has since deteriorated to 66.2% for the most recent fiscal year primarily due to spread compression and the recent increase in operating expenses. On a post-offering basis, the efficiency ratio may show some improvement from the benefit of reinvesting the proceeds from the Offering. However, a portion of the benefit is expected to be offset by the increased expense of the stock benefit plans.
The primary aspects of the Company’s interest rate risk management include:
| • | Emphasizing the origination and purchase of adjustable rate residential mortgage loans or hybrid ARMS with repricing frequencies of up to five years when market conditions permit; |
|
|
|
| • | Maintaining a diversified loan portfolio which includes loans secured by commercial real estate and multi-family properties as well as non-mortgage loans which carry short terms to maturity and/or variable interest rates; |
|
|
|
| • | Maintaining a balance of cash or short-term investments; |
|
|
|
| • | Maintaining an acceptable level of capital which provides a favorable level of interest-earning assets relative to interest-bearing liabilities; and |
|
|
|
| • | Potentially selling a portion of the fixed rate mortgage loans originated based on risk and profitability considerations. |
The rate shock analysis as of June 30, 2007 (see Exhibit I-5) reflects a modest liability sensitive position with the net portfolio value (“NPV”) declining by 272 basis points pursuant to a positive 200 basis point instantaneous and permanent rate shock, resulting in a post-shock NPV ratio equal to 7.22%. By way of comparison, OTS estimates NPV data on a regional and national basis. Based on OTS estimates, incorporating June 30, 2007 financial data and market
RP® FINANCIAL, LC.
Page 1.20
rate information, assuming a positive 200 basis point instantaneous, and permanent rate shock, the post-shock NPV ratio for all thrifts operating in the OTS Western Region equaled 9.43%, as of March 31, 2007, which reflects a 192 basis point decline relative to the base scenario. Thus, the Company’s risk exposure is less favorable compared to the regional average.
The NPV analysis is an indicator of the risk to earnings in a volatile interest rate environment as it incorporates changing assumptions with respect to maturity and repricing of assets and liabilities. The OTS NPV analysis indicates that Kaiser Federal Financial has a lower NPV ratio and higher interest sensitivity measure pursuant to a rising interest rate scenario. The level of risk for the Company falls into the moderate risk category, pursuant to OTS guidelines.
In this regard, the Company’s interest rate risk exposure is moderated by the relatively high level of ARMs whose short to intermediate term repricing structure closely matches the short term repricing structure of the deposit base. Moreover, the Company’s interest rate risk exposure is projected to be further reduced following the completion of the conversion and reinvestment of the net conversion proceeds into interest-earning assets.
Overall, the data suggests Kaiser Federal Financial’s earnings would be adversely impacted by rising interest rates, although the Company has been somewhat successful in reducing its exposure to interest rate risk. At the same time, there are numerous limitations inherent in such analyses, such as the credit risk of the Company’s adjustable rate loans in a rising interest rate environment. Other areas of risk exposure for the Company which may not be captured by the NPV analysis above include the substantial balance of loan premiums. Specifically, as of June 30, 2007 the Company has $120,000 of purchase premiums on loans which will be amortized against interest income as the underlying loans pay down.
Lending Activities and Strategy
Since the Charter Conversion, the Company has been primarily emphasizing real estate lending, primarily 1-4 family residential mortgage loans and, to a lesser extent, income property loans. The majority of the Company’s 1-4 family residential mortgage loans consist of loans which are conforming to agency standards, and the non-conforming residential loans are conforming but for the loan amount (i.e., jumbo loans). To a lesser extent, the Company extends
RP® FINANCIAL, LC.
Page 1.21
consumer loans, primarily auto loans. Details regarding the Company’s loan portfolio composition are included in Exhibits I-6, I-7, I-8, and I-9.
Residential Lending
As of June 30, 2007, residential mortgage loans approximated $469.5 million, or 66.9% of total loans. The Company originates both fixed rate and adjustable rate 1-4 family mortgage loans and their general philosophy is to emphasize adjustable rate loans and/or shorter-term fixed rate mortgage loans for portfolio (hybrid loans with a fixed rate of up to 5 years initially) when competitive and market conditions permit. However, in the current interest rate environment, Kaiser Federal Financial has been originating mostly 15 and 30 year fixed rate loans for portfolio. The Company also purchases longer term fixed rate loans for portfolio. Specifically, the majority of loans purchased for fiscal 2007 were fixed rate 1-4 family real estate loans given the low yield on ARMs.
The repricing of ARM loans is tied to a variety of indexes, including the U.S. Treasury rate and LIBOR. Depending on the type of loan, there are a variety of periodic and lifetime rate caps which are generally structured based on the conditions prevailing in the competitive market.
The Company originates 1-4 family loans up to a loan-to-value (“LTV”) ratio of 90%, with private mortgage insurance (“PMI”) being required for loans with LTV ratios in excess of 80.0%. All 1-4 family mortgage loans originated or purchased by the Company are secured by residences in California.
As a complement to 1-4 family permanent mortgage lending, the Company also offers home equity loans, including fixed rate amortizing term loans and variable rate lines of credit tied to the Prime Rate.
Multi-Family and Commercial Mortgage Lending
Multi-family and commercial mortgage lending are typically secured by properties in southern California, but also include other California markets. As of June 30, 2007, multi-family and commercial mortgage loans equaled $88.1 million (12.6% of gross loans) and $77.8 million (11.1% of gross loans), respectively. The Company’s commercial real estate and multi-family
RP® FINANCIAL, LC.
Page 1.22
loan portfolio has exhibited relatively strong growth since the completion of the minority stock offering in March 2004, reflecting the Company’s expanded lending powers.
Multi-family and commercial mortgage loan rates typically adjust based on a U.S. Treasury index (typically the one year CMT), but may be fixed for the first 3 or 5 years. Such loans possess terms ranging up to 15 years, with amortization periods of up to 30 years, LTV ratios of up to 75%, and a targeted debt-coverage ratio of at least 1.2 times. Such loans are typically originated with prepayment penalties if the loan is repaid within the fixed rate term.
The Company’s typical commercial or multi-family loan is in the range of $1.0 to $1.5 million, but may be larger if the loan is well-collateralized or extended to a very credit-worthy borrower. Such loans are typically collateralized by small office buildings, family-type business establishments and apartment buildings.
Consumer Loans
The Company’s consumer loans totaled $66.6 million at June 30, 2007, the majority of which consist of auto loans and, to a lesser extent, home equity lines of credit (“HELOCs”) and loans secured by savings deposits.
The most significant component of the Company’s consumer lending is automobile loans. The Company originates auto loans only on a direct basis with the borrower. Most auto loans are extended pursuant to the Company’s pre-approved auto loan program (“PAAL”) whereby the borrower is pre-qualified for a loan up to a pre-established limit predicated on receipt of final approval from the Company. Customers for the PAAL product have historically been Kaiser Permanente employees but the Company has marketed this product to the broader community since the Charter Conversion. In recent years, automobile lending has declined, as the Company has placed more emphasis on real estate loan products. Loans secured by automobiles totaled $53.1 million, or 7.6% of gross loans, as of June 30, 2007.
Loan Originations, Purchases and Sales
The Company’s 1-4 family lending is conducted through direct solicitation techniques, real estate industry relationships, targeted marketing, as well as through purchases.
RP® FINANCIAL, LC.
Page 1.23
In 2005, the Company contracted with AnyHour Lending, Inc. to give Kaiser Federal Financial the ability to take and process residential mortgage loans 24 hours a day as well as over the Internet, although volume from this source has been limited. In recent periods, the majority of such loans have been generated through purchases, primarily acquired from major financial institutions or mortgage banking companies. In fiscal 2004 and 2005, the Company emphasized the purchase of adjustable rate 1-4 family mortgage loans; however, in fiscal 2006 and 2007, purchases have been primarily comprised of fixed rate 1-4 family mortgage loans given their more favorable yields. In addition, the Company has purchased adjustable rate interest-only mortgage loans; the Company has no plans to significantly increase such loans at this time.
All purchased loans are underwritten by the Company pursuant to its underwriting guidelines. The majority of the Company’s internally originated 1-4 family mortgages, which have been relatively limited, have consisted of longer-term fixed rate mortgages, typically with maturities ranging between 15 to 30 years.
Exhibit I-9, which shows the Company’s recent data regarding loan originations, repayments and sales, highlights the emphasis on mortgage lending. The Company’s loan diversification efforts are evidenced by the multi-family and commercial mortgage loan origination level, which totaled $37.2 million, or 33.4%, of all loan originations in fiscal 2007. Moreover, the Company has been an active loan purchaser acquiring $109.8 million of loans (all fixed rate 1-4 family mortgages), which fell slightly below total originations of $111.2 million within the past fiscal year. At June 30, 2007, the Company’s real estate loan portfolio totaled $635.4 million or 90.5% of the gross loan portfolio. Purchased real estate loans at June 30, 2007 totaled $406.5 million, or 64.0% of the real estate loan portfolio.
The majority of the Company’s loan purchases have been on a servicing retained basis by the seller. While this strategy has limited the increase in operating expenses, the Company has limited opportunity for cross-selling other financial products and services to such borrowers.
RP® FINANCIAL, LC.
Page 1.24
The Company’s asset quality has historically been strong and the level of non-performing assets (“NPAs”) is currently low. As reflected in Exhibit I-10, the NPA balance was $1.5 million, equal to 0.18% of assets, consisting of non-performing loans ($1.1 million) and repossessed assets ($0.3 million). The NPAs for fiscal 2007 consist primarily of 1-4 family residential real estate loans and properties. The ratio of allowances to total loans has declined from 0.58% as of the end of fiscal 2003 to 0.40% as of the end of fiscal 2007 (see Exhibits I-10 and I-11), due to the reduction of automobile loans in the portfolio, which constitute the majority of the Company’s charge-offs.
Funding Composition and Strategy
As of June 30, 2007, the Company’s assets were funded primarily with deposits, and, to a lesser extent, borrowings and equity (see Exhibits I-12, I-13 and I-14). The Company’s deposit services cater to individuals rather than commercial businesses.
Deposits
Local retail deposits have consistently addressed the substantial portion of Kaiser Federal Financial’s funding needs, with core deposits in the form of non-interest bearing checking, passbook accounts, and money market deposit accounts comprising the majority of deposits. In the aggregate, these accounts totaled $255.4 million, or 51.7% of total deposits as of June 30, 2007. As of June 30, 2007, CDs accounted for approximately 48.3% of deposits. Approximately 73.2% of CDs had remaining maturities of one year or less. Large balance CDs (i.e. balances greater than or equal to $100,000), which tend to be more rate sensitive than lower balance CDs, accounted for $93.5 million, or 18.9% of deposits, at June 30, 2007.
Borrowings
Borrowings have been utilized primarily as a supplemental funding source to fund lending activity. As of June 30, 2007, borrowed funds consisted of $210.0 million of FHLB advances. The Company interchanges the use of deposits and borrowings to fund assets depending on various factors including liquidity and asset/liability management strategies.
RP® FINANCIAL, LC.
Page 1.25
Recently, however, the Company has increased borrowings utilization as deposits have exhibited slower growth and the desire to increase earnings through continued loan growth.
The Company anticipates utilizing borrowings as a supplemental funding source in the future, generally for these same purposes. The Company’s overall preference is to utilize deposits to fund operations with the objective of building customer relationships and increasing cross-sell potential and fee income.
In March 2007, U.S. Mortgage converted its Chapter 11 bankruptcy to a Chapter 7 in the District Court of Nevada. U.S. Mortgage was responsible for servicing various commercial real estate participations loans totaling approximately $1.0 million that Kaiser Federal Financial purchased from the company. Through this transition period, all servicing functions of U.S. Mortgage are being handled by the Bankruptcy Trustee.
During the course of these proceedings, U.S. Bank has asserted a priority claim against $1.0 million in loan principal being serviced by U.S. Mortgage on the basis that U.S. Bank has a priority right to the funds. The Company is vigorously contesting this claim and believes it has the proper ownership interest in these loans.
RP® FINANCIAL, LC.
Page 2.1
Kaiser Federal Financial currently conducts operations through its executive offices in Covina, California, and a total of 8 branch offices, 7 of which are in southern California (Los Angeles, San Bernardino, and Riverside Counties) while the remaining branch is located in Santa Clara in the San Francisco Bay area (Santa Clara County) (see the map of locations below). Certain of the locations reflect, in part, the credit union roots and the location of the Kaiser Permanente Medical Care Program employees or physicians. The Bank intends to continue expanding its regional branch office network and financial service centers although the timing and locations have yet to be determined. Moreover, Kaiser Federal Financial will continue to extend the reach of its branch network through continued operation of the network of remote access service systems, including a network of 54 ATMs, Internet and telephone banking.
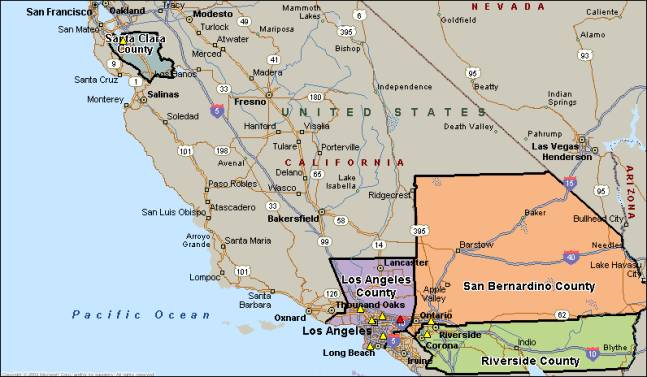
RP® FINANCIAL, LC.
Page 2.2
Future growth opportunities for Kaiser Federal Financial depend on the growth and stability of the regional economy, demographic growth trends, and the nature and intensity of the competitive environment. These factors have been briefly examined in the following pages to help determine the growth potential that exists for the Bank and the relative economic health of Kaiser Federal Financial’s market area. The growth potential and the stability provided by the market area have a direct bearing on the market value of the Bank, and will be factored into our valuation analysis accordingly. Exhibit II-1 provides a description of Kaiser Federal Financial’s office facilities and Exhibit II-2 provides historical interest rates.
The future success of the Company’s operations is partially dependent upon various national and local economic trends. In assessing economic trends over since the start of 2007, signs of slower economic growth continued to emerge, as manufacturing activity declined in January. The employment report for January was also less favorable, based on fewer jobs added and an increase in the unemployment rate to 4.6%. Retail sales were flat in January, while economic activity in the service sector continued to expand during January. Durable-goods orders fell 7.8% in January as demand for transportation equipment plunged. Existing home sales rose 3% in January on lower prices. Comparatively, new home sales fell by 16.6% in January from the previous month, the largest drop in 13 years. While the manufacturing sector grew in February, the service sector expanded at a slower than expected pace in February. The February unemployment rate dipped to 4.5%, even though job growth slowed during February. Other signs of a cooling economy included a nominal increase in retail sales during February, sales of new homes fell for the second straight month in February and capital goods orders, excluding defense and aircraft, fell in February. Comparatively, March data showed signs of a more resilient economy, retail sales were up strongly in March and the March unemployment rate dropped to a five-month low of 4.4% on stronger-than-expected job growth. Despite rising inventories of unsold homes, housing starts were also stronger than expected in March.
The beginning of the second quarter of 2007 showed indications of a slowing economy. The April unemployment rate edged up to 4.5%, as cautious employers added the fewest jobs in more than two years. Major retailers experienced a 2.3% decrease in same store sales during
RP® FINANCIAL, LC.
Page 2.3
April and home building permits slid in April to their lowest point in almost a decade. The general economy also showed some areas of strength in April, which included a jump in industrial output and an increase in manufacturing activity. Consumer confidence rose in May, as rising stocks and a strong job market kept Americans upbeat. The U.S. housing market remained sluggish in May, as the inventory of unsold homes was up in 18 major metropolitan areas and new housing starts continued to decline. Better-than-expected job growth maintained the national unemployment rate at 4.5% for May. Manufacturing activity picked up in June, while the housing market continued to struggle as the inventory of homes for sale continued to rise in June. New and existing home sales both declined in June. Solid job growth for June held the national unemployment rate at 4.5% and GDP grew at a stronger-than-expected 3.4% annualized rate during the second quarter.
Retail sales were up modestly in July 2007, while the unemployment rate for July increased to 4.6% on slower job growth. Industrial output showed a stronger than expected in July, while the housing market continued to struggle. New home construction fell in July to its lowest level in a decade and existing home sales dropped to for a fifth straight month in July. Home prices also fell in July for a record 12th consecutive month.
In terms of interest rate trends since the beginning of 2007, a stable interest rate environment continued to prevail, which was followed by a mild upward trend in interest rates in mid-January. Lower oil prices and increased expectations of the Federal Reserve not cutting rates anytime soon contributed to the rise in long-term Treasury yields. Following the Federal Reserve’s decision to leave rates unchanged at its end of January meeting, interest rates stabilized during the first half of February. Treasury bonds rallied in mid-February, based on indications from the Federal Reserve Chairman that inflation was headed lower. Signs of slower economic growth and a sell-off in the stock market continued the downward trend in Treasury yields in late-February. A stable interest rate environment prevailed throughout most of March, as economic measures generally reflected a downturn in economic activity and the March meeting of the Federal Reserve concluded with no change in the federal funds target rate. The Federal Reserve statement from the March meeting continued to cite inflation concerns, but the Federal Reserve dropped its stated bias to raise rates.
RP® FINANCIAL, LC.
Page 2.4
Some stronger than expected economic reports pushed long-term Treasury yields higher at the start of the second quarter of 2007. The release of the March minutes of the Federal Reserve, which revealed that more rate increases may be needed to combat inflation, further contributed to the rise in interest rates. Treasury yields eased lower in mid-April on tame inflation data reflected in the March consumer price numbers. Interest rates stabilized through the balance of April and for the first half of May. The Federal Reserve left interest rates unchanged at its May meeting and gave no signs that it was moving towards an interest rate cut. Long-term Treasury yields moved higher heading into late-May, with such factors as global growth, an increase in May consumer confidence and initial jobless claims falling for a fifth straight week contributing to the upward trend in interest rates. Bond prices plunged on inflation worries during the first half of June, with the yield on the 10-year Treasury note rising to a five year high of 5.25%. Interest rates eased lower during the second half of June on mixed economic data. The Federal Reserve left rates unchanged at its late-June meeting, but softened its hawkish inflation stance. At the same time, the Federal Reserve seemed to rule out the possibility of cutting rates any time soon.
Healthy job growth reflected in the June 2007 employment report pushed Treasury yields higher at the start of the third quarter. However, Treasury bonds rallied in mid-July on news of rating cuts on bonds backed by subprime mortgages, as investors dumped junk bonds for the relative safety of Treasury bonds. The rally in long-term Treasury bonds continued into late-July, on fears that the housing slump was spreading to the broader economy. Interest rates stabilized during the first half of August, as the Federal Reserve held rates steady as expected and core wholesale inflation showed only a modest increase in July. A half point cut in the Federal Reserve’s discount rate and increased speculation that the Federal Reserve would cut the federal funds rate in September pushed interest rates lower heading into the second half of August, with short-term Treasury yields posting their biggest decline in 19 years. The comparatively larger decline in short-term Treasury yields provided a positively sloped yield curve in late-August. As of August 31, 2007, the bond equivalent yields for U.S. Treasury bonds with terms of one and ten years equaled 4.55% and 4.60%, respectively, versus comparable year ago yields of 5.06% and 4.79%.
RP® FINANCIAL, LC.
Page 2.5
Local and Regional Market Conditions
Economic Overview – Los Angeles County
Los Angeles County’s economy has historically been tied to the aerospace, entertainment and tourism industries and has realized strong growth since the beginning of World War II. The presence of nearby military installations and test facilities coupled with the mild climate and good weather made the area an excellent location for aerospace firms to grow and prosper. These same conditions facilitated the growth of the entertainment and tourism businesses which have historically been the mainstay of the local economy. Strong population growth and the growing income levels coupled with the availability of land and the development of an extensive network of freeways provided for growth in the real estate industry (both development and finance).
The reliance upon the defense and tourism industries historically brought immense growth and prosperity to Los Angeles County, but also introduced significant volatility. The region’s growth came to a sudden halt in the early 1990s with the combined impact of the national recession, the commencement of the Gulf War, the breakup of the Soviet Union and subsequent end of the Cold War and downsizing of the U.S. military, all of which led to severe recessionary conditions through the mid-1990s.
Los Angeles County’s economy has improved dramatically since the mid-1990s when the longest and deepest recession in 60 years ended. In this regard, many economists and local business leaders believe the most recent economic recovery and expansion were not mere business or cyclical adjustments, but an extensive overhauling and restructuring of the region’s basic economic drivers.
From an economy largely dominated by aerospace, tourism and the entertainment industries, Los Angeles County’s economic base has transformed into a more diversified mix of high-technology commercial endeavors. Some of these sectors were by-products of the defense-related industries and knowledge, which capitalized on the highly educated and skilled labor force. Emerging growth areas include telecommunications, electronics, computers, software, and biomedical technologies.
RP® FINANCIAL, LC.
Page 2.6
International trade has also contributed to Los Angeles County’s economic growth in recent years fueled both by cross-border trade with nearby Mexico and by trade with other Pacific Rim countries. Currently, the Port of Los Angeles/Long Beach ranks first in the U.S. in total trade. Coupled with its status as a major entertainment and cultural center, Los Angeles has been a major entry way and settlement area for immigrants to the U.S.
Riverside and San Bernardino Counties - Inland Empire
Riverside and San Bernardino Counties are commonly referred to as the “Inland Empire” and together, these two counties comprise the Riverside-San Bernardino Metropolitan Statistical Area (“MSA”). While the Inland Empire encompasses a huge geographic area extending to the Nevada border, Kaiser Federal Financial’s operations are concentrated in the western portions of Riverside and San Bernardino Counties.
The Inland Empire has realized strong business and population growth in the last several decades owing, in part, to defense spending and the large military infrastructure in the region and to its location adjacent to the high cost coastal areas of Los Angeles, Orange and San Diego Counties. In this regard, many manufacturing, transportation and distribution companies have located in the Inland Empire. The area has also been a magnet for new residents seeking affordable housing outside of the expensive coastal markets.
Like Los Angeles County, the Inland Empire markets were dramatically impacted by the cutbacks in defense spending and base closures in the early 1990s. Concurrently, other significant employment losses occurred in the financial services and construction sectors, primarily as a result of Southern California’s troubled real estate markets. Since that time, the Inland Empire economy has recovered and is one of the fastest growing metropolitan areas in the country.
Much of the Inland Empire’s business growth can be attributed to companies that expand locally, and to those that relocate from the nearby coastal counties. From 1994-2004, 1,250 firms either moved to the region from the congested and high-priced regions of Los Angeles, Orange and San Diego Counties, put their new expansions in the area, or moved locally to add space and employees -- a trend that is expected to continue in the coming decades. This migration of firms and people from the coastal counties is occurring as the density of land
RP® FINANCIAL, LC.
Page 2.7
development in those counties has created a shortage of manufacturing and housing space, and increased spacing costs. Ultimately, the Inland Empire is the last region of Southern California to have large amounts of undeveloped land along developed transportation corridors, creating a powerful advantage for both residential and industrial/commercial developers.
In 2006, the Inland Empire added 48,100 jobs to the region and is projected to add 37,200 jobs in 2007. The Inland Empire’s fastest growing sectors have normally been those paying moderate incomes to blue collar workers, which typically work in the distribution and transportation sectors, as well as manufacturing and construction. In 2006, these sectors grew, adding 15,444 jobs. In 2007, with strong logistics activity but weak manufacturing and declining construction these sectors are forecasted to allow the blue collar group to add just 6,800 jobs and account for 18.3% of the inland area’s 37,200 job gain. The region’s prominent role as a transportation corridor also translates to healthy employment rates in affiliated industries. The Inland Empire’s modern and rapidly-expanding logistics infrastructure accommodates the transport of goods to every corner of the country and the world, and provides thousands of jobs in warehousing and transportation of goods, air cargo, rail transportation, and trucking.
Record levels of foreign trade and motion picture production, and a pronounced recovery in tourism have also had a positive economic impact. The Inland Empire’s diverse terrain and unique settings make it a popular region for film and entertainment production, while its mountain, lake and desert resorts and proximity to major population centers contributed to tourism.
Santa Clara County
Prior to World War II, the economy of Santa Clara County was tied to agriculture as a result of the moderate climate and long growing season. However, the southern portions of the San Francisco Bay area have grown exponentially over the last fifty years with the growth of the San Francisco Bay overall, coupled with the development of technology-related industries. In this regard, much of the growth in the technology sector which led to the development of the “Silicon Valley” as the region is known today was facilitated by the location of Stanford University in Palo Alto which provided for the engineering and creative resources required to stimulate growth of high technology industries.
RP® FINANCIAL, LC.
Page 2.8
The growth of computer and biotechnology industries in Santa Clara County fueled strong employment and income growth through the 1990s. Even after the dot-com crash, which caused the loss of over 250,000 jobs, Silicon Valley continues to maintain its status as one of the top research and development centers in the world and has currently reported an increase in employment, for the first time in five years. The turnaround coincides with a huge increase of investment in the emerging category of clean environment technology.
For reasons described above, the Bank’s markets have generally demonstrated strong population growth. The large size of the markets overall – Los Angeles County has 10.1 million residents, Riverside County has 2.1 million, San Bernardino County has 2.1 million residents while Santa Clara County has 1.8 million residents – gives the Bank exposure to a large base of potential customers (see Table 2.1), although it is a very competitive market.
Total population in Los Angeles and Santa Clara Counties increased at a comparatively moderate pace equal to 0.9% and 0.7% from 2000 to 2007, which fell short of both the state and national average. By comparison, growth in Riverside and San Bernardino Counties has been very strong, equal to 4.5% and 2.6% between 2000 and 2007, which were both growing at a faster pace than the California and the United States (equal to 1.5% and 1.2%, respectively). Importantly, growth projections for population through 2012 reflect that growth in Riverside and San Bernardino Counties will continue to grow at a faster pace, compared to the state and national averages.
Paralleling trends for population growth, the total number of households increased at comparatively modest levels in Los Angeles and Santa Clara Counties from 2000 to 2007, while exceeding the state and national averages in Riverside and San Bernardino Counties.
Median household income levels in Los Angeles, Riverside, and San Bernardino Counties are relatively favorable to the national average and fall modestly below the comparable state aggregate. Per capita income levels for the three counties all fell below the comparable national and state averages. Income levels in Santa Clara County reflect its status as one of the
RP ® Financial, LC.
Page 2.9
Table 2.1
Kaiser Federal Financial Group, Inc.
Summary Demographic Information
|
| Year |
| Growth Rate |
| |||||||||||
|
|
|
| |||||||||||||
|
| 2000 |
| 2007 |
| 2012 |
| 2000-2007 |
| 2007-2012 |
| |||||
|
|
|
|
|
|
| ||||||||||
Population (000) |
|
|
|
|
|
|
|
|
|
|
|
|
|
|
|
|
United States |
|
| 281,422 |
|
| 306,348 |
|
| 325,526 |
|
| 1.2 | % |
| 1.2 | % |
California |
|
| 33,872 |
|
| 37,483 |
|
| 40,012 |
|
| 1.5 | % |
| 1.3 | % |
Los Angeles County |
|
| 9,519 |
|
| 10,111 |
|
| 10,454 |
|
| 0.9 | % |
| 0.7 | % |
Riverside County |
|
| 1,545 |
|
| 2,101 |
|
| 2,554 |
|
| 4.5 | % |
| 4.0 | % |
San Bernardino County |
|
| 1,709 |
|
| 2,052 |
|
| 2,336 |
|
| 2.6 | % |
| 2.6 | % |
Santa Clara County |
|
| 1,683 |
|
| 1,771 |
|
| 1,835 |
|
| 0.7 | % |
| 0.7 | % |
Households (000) |
|
|
|
|
|
|
|
|
|
|
|
|
|
|
|
|
United States |
|
| 105,480 |
|
| 115,337 |
|
| 122,831 |
|
| 1.3 | % |
| 1.3 | % |
California |
|
| 11,503 |
|
| 12,540 |
|
| 13,324 |
|
| 1.2 | % |
| 1.2 | % |
Los Angeles County |
|
| 3,134 |
|
| 3,255 |
|
| 3,346 |
|
| 0.5 | % |
| 0.6 | % |
Riverside County |
|
| 506 |
|
| 676 |
|
| 818 |
|
| 4.2 | % |
| 3.9 | % |
San Bernardino County |
|
| 529 |
|
| 616 |
|
| 698 |
|
| 2.2 | % |
| 2.5 | % |
Santa Clara County |
|
| 566 |
|
| 594 |
|
| 613 |
|
| 0.7 | % |
| 0.6 | % |
Median Household Income ($) |
|
|
|
|
|
|
|
|
|
|
|
|
|
|
|
|
United States |
| $ | 42,164 |
| $ | 53,154 |
| $ | 62,503 |
|
| 3.4 | % |
| 3.3 | % |
California |
|
| 47,622 |
|
| 60,268 |
|
| 70,268 |
|
| 3.4 | % |
| 3.1 | % |
Los Angeles County |
|
| 42,495 |
|
| 54,338 |
|
| 63,809 |
|
| 3.6 | % |
| 3.3 | % |
Riverside County |
|
| 43,082 |
|
| 54,283 |
|
| 63,471 |
|
| 3.4 | % |
| 3.2 | % |
San Bernardino County |
|
| 42,301 |
|
| 52,779 |
|
| 61,911 |
|
| 3.2 | % |
| 3.2 | % |
Santa Clara County |
|
| 74,419 |
|
| 94,162 |
|
| 113,184 |
|
| 3.4 | % |
| 3.7 | % |
Per Capita Income ($) |
|
|
|
|
|
|
|
|
|
|
|
|
|
|
|
|
United States |
| $ | 21,587 |
| $ | 27,916 |
| $ | 33,873 |
|
| 3.7 | % |
| 3.9 | % |
California |
|
| 22,711 |
|
| 28,915 |
|
| 34,835 |
|
| 3.5 | % |
| 3.8 | % |
Los Angeles County |
|
| 20,683 |
|
| 26,078 |
|
| 31,603 |
|
| 3.4 | % |
| 3.9 | % |
Riverside County |
|
| 18,689 |
|
| 23,110 |
|
| 27,538 |
|
| 3.1 | % |
| 3.6 | % |
San Bernardino County |
|
| 16,856 |
|
| 20,727 |
|
| 24,581 |
|
| 3.0 | % |
| 3.5 | % |
Santa Clara County |
|
| 32,795 |
|
| 44,815 |
|
| 55,324 |
|
| 4.6 | % |
| 4.3 | % |
|
|
|
|
|
|
|
|
|
|
|
| |||||
2007 HH Income Dist.(%) |
| Less Than |
| $25,000 to |
| $50,000- |
| $100,000 to |
| $150,000+ |
| |||||
|
|
|
|
|
| |||||||||||
United States |
|
| 21.9 |
|
| 25.0 |
|
| 32.3 |
|
| 12.3 |
|
| 8.4 |
|
California |
|
| 19.6 |
|
| 22.1 |
|
| 31.8 |
|
| 14.6 |
|
| 11.8 |
|
Los Angeles County |
|
| 23.1 |
|
| 23.1 |
|
| 30.0 |
|
| 13.3 |
|
| 10.4 |
|
Riverside County |
|
| 21.3 |
|
| 24.7 |
|
| 33.7 |
|
| 13.0 |
|
| 7.3 |
|
San Bernardino County |
|
| 22.5 |
|
| 24.8 |
|
| 33.7 |
|
| 12.5 |
|
| 6.5 |
|
Santa Clara County |
|
| 9.7 |
|
| 12.7 |
|
| 30.4 |
|
| 20.8 |
|
| 26.4 |
|
Source: ESRI.
RP® FINANCIAL, LC.
Page 2.10
wealthiest counties in the U.S. as household and per capita income well exceeded the levels for the Bank’s other markets as well as the state and national average.
Local Economy/Largest Employers
The largest employers in Los Angeles County reflect its relatively diverse economy and the fact that some of the largest sectors (entertainment and tourism) are comprised of a multitude of relatively small employers which together comprise a large portion of the economy.
Table 2.2
Kaiser Federal Financial Group, Inc.
Major Employers in Los Angeles, San Bernardino and Santa Clara Counties
Employer |
| Business |
| Number of Employees |
|
| |||
Los Angeles County* |
|
|
|
|
Kaiser Permanente |
| Health Maint. Org. |
| 30,511 |
Northrop Grumman Corp. |
| Defense Contractor |
| 21,000 |
Boeing Co. |
| Aerospace & Defense Systems |
| 16,636 |
Kroger Co. |
| Grocery Retailer |
| 13,862 |
University of Southern CA |
| Private University |
| 12,238 |
Vons |
| Grocery Retailer |
| 12,224 |
Target Corp. |
| Retailer |
| 11,526 |
Bank of America Corp. |
| Banking & Financial Services |
| 10,801 |
ABM Industries, Inc. |
| Building Maint., Engineering, Etc. |
| 10,100 |
*Private Employers
Source: Los Angeles Business Journal, 2005
Riverside and San Bernardino Counties (Inland Empire)
County of San Bernardino |
| Government |
| 19,299 |
Stater Brothers Markets |
| Retail/Distribution |
| 16,000 |
County of Riverside |
| Government |
| 14,889 |
Kaiser Permanente |
| Healthcare |
| 9,590 |
University of California, Riverside |
| Higher Education |
| 6,294 |
March Air Reserve Base |
| Military |
| 6,200 |
Loma Linda University Medical |
| Healthcare |
| 6,000 |
Ontario Mills Mall |
| Retail |
| 5,500 |
Ontario International Airport |
| Transportation |
| 5,360 |
United Parcel Service |
| Package Delivery |
| 4,850 |
Source: Inland Empire Magazine, December 2004
RP® FINANCIAL, LC.
Page 2.11
| Santa Clara County |
|
|
|
|
| |
| Adobe Systems, Inc. |
| Computer Software Mfrs |
| Advanced Micro Devices, Inc. |
| Semiconductors |
| Apple Computer |
| Computer Equipment |
| Applied Materials, Inc. |
| Semiconductors; Equip. |
| Cadence Design Systems, Inc. |
| Computer Software |
| Cisco Systems, Inc. |
| Computer Peripherals (Mftrs) |
| El Camino Hospital |
| Hospital |
| Fujitsu IT Holdings, Inc. |
| Computer Software Mfrs |
| Hewlett-Packard Co. |
| Computers/Electronic Mfrs. |
| IBM Corp. |
| Computer /Electronic Mfrs. |
| Intel Corp. |
| Semiconductor Devices |
| Kaiser Permanente Medical Center |
| Hospital |
| Life Scan, Inc. |
| Health Care Equipment |
| Lockheed Martin Space Systems |
| Aerospace |
| National Semiconductor Corp. |
| Semiconductor Devices |
| Solectron Corp. |
| Electronic Components |
| Stanford Hospital and Clinics |
| Healthcare |
| Stanford University |
| Education |
| Valley Medical Center |
| Hospital |
Source: California Employment Development Department.
The Inland Empire and Santa Clara County reflect the characteristics and trends previously described. In this regard, the major employers in the Inland Empire reflect its suburban character with its mix of retailers and health care providers. Santa Clara County’s largest employers are relatively concentrated in the technology and health care sectors which reflect many of the industry leaders involved in the production of computer hardware and software.
Unemployment rates on a national level have been declining over the most recent 12 months, reflecting a strengthening economy (see Table 2.3). Unemployment rates in California and the Company’s markets have remained relatively stable, albeit at levels above the national average. The most recent unemployment rate for Los Angeles stands at 4.9% which is 0.4% above the national average and 0.3% below the average for California as a whole. The current unemployment rate in Santa Clara County is 4.7% which is relatively favorable compared to the unemployment rates of 5.4% and 5.7% reported for San Bernardino and Riverside Counties. All
RP® FINANCIAL, LC.
Page 2.12
of the Company’s markets reported unemployment rates under the state unemployment rate of 5.2%, with the exception of San Bernardino and Riverside Counties, which reported unemployment rates equal to 0.2% and 0.5% above the state average.
Table 2.3
Kaiser Federal Financial Group, Inc.
Unemployment Trends (1)
Region |
| June 2006 |
| June 2007 |
|
| |||
United States |
| 4.6% |
| 4.5% |
California |
| 4.9 |
| 5.2 |
Los Angeles County |
| 4.7 |
| 4.9 |
Riverside County |
| 5.1 |
| 5.7 |
San Bernardino County |
| 5.1 |
| 5.4 |
Santa Clara County |
| 4.7 |
| 4.7 |
(1) Unemployment rates are not seasonally adjusted. |
Source: U.S. Bureau of Labor Statistics.
As a savings bank with its primary business functions of real estate lending and the gathering of deposits in Southern California and the San Francisco Bay area, Kaiser Federal Financial’s primary competitors are: (1) other financial institutions with offices proximate to the Company’s locations; (2) other mortgage loan originators; (3) those depository and lending organizations not physically located within the Company’s markets, but capable of doing business remotely through the Internet or by other means; and (4) other competitors such as investment firms, mutual funds, insurance companies, etc.
Competition among financial institutions in the Company’s market is significant. As larger institutions compete for market share to achieve economies of scale, the environment for the Company’s products and services is expected to remain highly competitive. Community-sized institutions such as Kaiser Federal Financial typically compete with larger institutions on pricing or operate in a niche that will allow for operating margins to be maintained at profitable levels. The Company’s business plan reflects elements of both strategies.
RP® FINANCIAL, LC.
Page 2.13
Table 2.4 displays deposit market trends over recent years for the markets where the Company maintains branches. The large size of the markets overall are indicated by the deposit totals, which equaled $223.0 billion for Los Angeles County alone while San Bernardino and Santa Clara Counties were $17.7 billion and $49.9 billion, respectively. Furthermore, growth trends are relatively favorable as the Los Angeles County deposit market realized 8.6% annual growth for the two years ended June 30, 2006, which fell between the corresponding growth figures for San Bernardino County (9.8%) and Santa Clara County (3.5%).
The largest competitors in the markets served by Kaiser Federal Financial are comprised of some of the largest financial institutions in California and the nation as a whole. In this regard, Bank of America holds the largest market share in all three counties where the Company maintains branch offices, with a market share in the range of 20% based on deposit data as of June 30, 2006 (see Table 2.5 for details). Other large competitors include Washington Mutual, Wells Fargo, Union Bank and Citibank. At the same time, there are many smaller competitors, each holding less than 1.0% of the deposit market. Based on the most recent branch deposit data, Kaiser Federal Financial held less than 1% of all the markets where it operated.
RP ® Financial, LC.
Page 2.14
Table 2.4
Kaiser Federal Financial Group, Inc.
Deposit Summary
|
| As of June 30, |
| Deposit |
| |||||||||||||||||
|
|
| ||||||||||||||||||||
| 2004 |
| 2006 |
|
| |||||||||||||||||
|
|
|
| |||||||||||||||||||
| Deposits |
| Market |
| # of |
| Deposits |
| Market |
| # of |
|
| |||||||||
|
|
|
|
|
|
|
|
| ||||||||||||||
|
| (Dollars in Thousands) |
| (%) |
| |||||||||||||||||
State of California |
| $ | 671,110,640 |
|
| 100.0 | % |
| 6,423 |
| $ | 725,878,327 |
|
| 100.0 | % |
| 6,894 |
|
| 4.0 | % |
Commercial Banks |
|
| 465,367,089 |
|
| 69.3 | % |
| 4,816 |
|
| 530,213,958 |
|
| 73.0 | % |
| 5,254 |
|
| 6.7 | % |
Savings Institutions |
|
| 205,743,551 |
|
| 30.7 | % |
| 1,607 |
|
| 195,664,369 |
|
| 27.0 | % |
| 1,640 |
|
| -2.5 | % |
Los Angeles County |
| $ | 188,969,553 |
|
| 100.0 | % |
| 1,573 |
| $ | 222,980,335 |
|
| 100.0 | % |
| 1,681 |
|
| 8.6 | % |
Commercial Banks |
|
| 132,708,412 |
|
| 70.2 | % |
| 1,107 |
|
| 159,816,899 |
|
| 71.7 | % |
| 1,232 |
|
| 9.7 | % |
Savings Institutions |
|
| 56,261,141 |
|
| 29.8 | % |
| 466 |
|
| 63,163,436 |
|
| 28.3 | % |
| 449 |
|
| 6.0 | % |
Kaiser Federal Bank |
|
| 321,217 |
|
| 0.2 | % |
| 2 |
|
| 358,804 |
|
| 0.2 | % |
| 5 |
|
| 5.7 | % |
San Bernardino County |
| $ | 14,722,147 |
|
| 100.0 | % |
| 219 |
| $ | 17,738,515 |
|
| 100.0 | % |
| 234 |
|
| 9.8 | % |
Commercial Banks |
|
| 9,259,077 |
|
| 62.9 | % |
| 147 |
|
| 11,742,502 |
|
| 66.2 | % |
| 166 |
|
| 12.6 | % |
Savings Institutions |
|
| 5,463,070 |
|
| 37.1 | % |
| 72 |
|
| 5,996,013 |
|
| 33.8 | % |
| 68 |
|
| 4.8 | % |
Kaiser Federal Bank |
|
| 48,445 |
|
| 0.3 | % |
| 1 |
|
| 47,242 |
|
| 0.3 | % |
| 1 |
|
| -1.2 | % |
Santa Clara County |
| $ | 46,619,520 |
|
| 100.0 | % |
| 319 |
| $ | 49,926,715 |
|
| 100.0 | % |
| 339 |
|
| 3.5 | % |
Commercial Banks |
|
| 35,783,616 |
|
| 76.8 | % |
| 245 |
|
| 37,945,856 |
|
| 76.0 | % |
| 260 |
|
| 3.0 | % |
Savings Institutions |
|
| 10,835,904 |
|
| 23.2 | % |
| 74 |
|
| 11,980,859 |
|
| 24.0 | % |
| 79 |
|
| 5.2 | % |
Kaiser Federal Bank |
|
| 49,149 |
|
| 0.1 | % |
| 1 |
|
| 57,802 |
|
| 0.1 | % |
| 1 |
|
| 8.4 | % |
Sources: FDIC.
RP ® Financial, LC.
Page 2.15
Table 2.5
Kaiser Federal Financial Group, Inc.
Market Share by County
Company Name |
|
|
|
|
|
|
|
|
|
| Number of Branches |
| Deposits as of June 30, |
| 2006 |
| |||||||||
|
|
|
|
|
|
|
|
|
|
|
|
| |||||||||||||
| City |
| State |
| Charter |
|
| 2004 |
| 2005 |
| 2006 |
|
| |||||||||||
|
|
|
|
|
|
|
|
| |||||||||||||||||
|
|
|
|
|
|
|
|
|
|
|
|
|
|
| ($000) |
|
| ($000) |
|
| ($000) |
|
| (%) |
|
Los Angeles County |
|
|
|
|
|
|
|
|
|
|
|
|
|
|
|
|
|
|
|
|
|
|
|
|
|
Bank of America NA |
|
| Charlotte |
|
| NC |
|
| Bank |
|
| 254 |
| $ | 37,773,244 |
| $ | 42,753,839 |
| $ | 41,813,271 |
|
| 18.75 | % |
Washington Mutual Bank |
|
| Henderson |
|
| NV |
|
| Thrift |
|
| 183 |
|
| 25,142,192 |
|
| 25,347,415 |
|
| 25,631,802 |
|
| 11.50 | % |
Wells Fargo Bank NA |
|
| Sioux Falls |
|
| SD |
|
| Bank |
|
| 203 |
|
| 18,885,728 |
|
| 20,769,006 |
|
| 22,279,615 |
|
| 9.99 | % |
Union Bank of California NA |
|
| San Francisco |
|
| CA |
|
| Bank |
|
| 70 |
|
| 11,148,600 |
|
| 11,641,489 |
|
| 13,733,888 |
|
| 6.16 | % |
Citibank (West) FSB |
|
| San Francisco |
|
| CA |
|
| Thrift |
|
| 110 |
|
| 9,277,805 |
|
| 9,485,087 |
|
| 10,170,396 |
|
| 4.56 | % |
City National Bank |
|
| Beverly Hills |
|
| CA |
|
| Bank |
|
| 32 |
|
| 8,916,700 |
|
| 9,475,683 |
|
| 9,356,775 |
|
| 4.20 | % |
IndyMac Bank FSB |
|
| Pasadena |
|
| CA |
|
| Thrift |
|
| 19 |
|
| 4,933,974 |
|
| 6,569,080 |
|
| 8,917,681 |
|
| 4.00 | % |
Bank of the West |
|
| San Francisco |
|
| CA |
|
| Bank |
|
| 47 |
|
| 4,466,137 |
|
| 4,740,183 |
|
| 7,204,751 |
|
| 3.23 | % |
East West Bank |
|
| Pasadena |
|
| CA |
|
| Bank |
|
| 47 |
|
| 5,004,803 |
|
| 5,934,135 |
|
| 6,109,059 |
|
| 2.74 | % |
Comerica Bank |
|
| Detroit |
|
| MI |
|
| Bank |
|
| 17 |
|
| 6,737,621 |
|
| 7,368,448 |
|
| 5,806,934 |
|
| 2.60 | % |
Kaiser Federal Bank |
|
| Covina |
|
| CA |
|
| Thrift |
|
| 5 |
|
| 385,411 |
|
| 368,517 |
|
| 358,804 |
|
| 0.16 | % |
All Others |
|
|
|
|
|
|
|
|
|
|
| 694 |
|
| 56,297,338 |
|
| 63,839,317 |
|
| 71,597,359 |
|
| 32.11 | % |
|
|
|
|
|
|
|
|
|
|
|
|
|
|
|
| ||||||||||
Totals |
|
|
|
|
|
|
|
|
|
|
| 1,681 |
| $ | 188,969,553 |
| $ | 208,292,199 |
| $ | 222,980,335 |
|
| 100.00 | % |
San Bernardino County |
|
|
|
|
|
|
|
|
|
|
|
|
|
|
|
|
|
|
|
|
|
|
|
|
|
Bank of America NA |
|
| Charlotte |
|
| NC |
|
| Bank |
|
| 39 |
| $ | 3,151,371 |
| $ | 3,646,031 |
| $ | 3,845,266 |
|
| 21.68 | % |
Washington Mutual Bank |
|
| Henderson |
|
| NV |
|
| Thrift |
|
| 21 |
|
| 1,721,517 |
|
| 1,882,452 |
|
| 2,089,642 |
|
| 11.78 | % |
Wells Fargo Bank NA |
|
| Sioux Falls |
|
| SD |
|
| Bank |
|
| 27 |
|
| 1,285,712 |
|
| 1,649,462 |
|
| 1,857,362 |
|
| 10.47 | % |
Citizens Business Bank |
|
| Ontario |
|
| CA |
|
| Bank |
|
| 10 |
|
| 1,306,282 |
|
| 1,261,637 |
|
| 1,550,038 |
|
| 8.74 | % |
PFF Bank & Trust |
|
| Pomona |
|
| CA |
|
| Thrift |
|
| 14 |
|
| 1,162,515 |
|
| 1,255,118 |
|
| 1,310,714 |
|
| 7.39 | % |
Downey S&LA |
|
| Newport Beach |
|
| CA |
|
| Thrift |
|
| 14 |
|
| 537,294 |
|
| 683,125 |
|
| 779,536 |
|
| 4.39 | % |
World SB FSB |
|
| Oakland |
|
| CA |
|
| Thrift |
|
| 4 |
|
| 598,618 |
|
| 724,351 |
|
| 771,012 |
|
| 4.35 | % |
Union Bank of California NA |
|
| San Francisco |
|
| CA |
|
| Bank |
|
| 17 |
|
| 1,009,633 |
|
| 780,851 |
|
| 752,481 |
|
| 4.24 | % |
Citibank (West) FSB |
|
| San Francisco |
|
| CA |
|
| Thrift |
|
| 11 |
|
| 556,809 |
|
| 582,578 |
|
| 667,722 |
|
| 3.76 | % |
Vineyard Bank, NA |
|
| Corona |
|
| CA |
|
| Bank |
|
| 4 |
|
| 426,491 |
|
| 501,256 |
|
| 603,693 |
|
| 3.40 | % |
Kaiser Federal Bank |
|
| Covina |
|
| CA |
|
| Thrift |
|
| 1 |
|
| 48,445 |
|
| 49,201 |
|
| 47,242 |
|
| 0.27 | % |
All Others |
|
|
|
|
|
|
|
|
|
|
| 72 |
|
| 2,917,460 |
|
| 3,155,335 |
|
| 3,463,807 |
|
| 19.53 | % |
|
|
|
|
|
|
|
|
|
|
|
|
|
|
|
| ||||||||||
Totals |
|
|
|
|
|
|
|
|
|
|
| 234 |
| $ | 14,722,147 |
| $ | 16,171,397 |
| $ | 17,738,515 |
|
| 100.00 | % |
Santa Clara County |
|
|
|
|
|
|
|
|
|
|
|
|
|
|
|
|
|
|
|
|
|
|
|
|
|
Bank of America NA |
|
| Charlotte |
|
| NC |
|
| Bank |
|
| 60 |
| $ | 8,964,196 |
| $ | 10,106,479 |
| $ | 9,650,872 |
|
| 19.33 | % |
Wells Fargo Bank NA |
|
| Sioux Falls |
|
| SD |
|
| Bank |
|
| 58 |
|
| 8,229,151 |
|
| 9,047,605 |
|
| 9,352,026 |
|
| 18.73 | % |
Washington Mutual Bank |
|
| Henderson |
|
| NV |
|
| Thrift |
|
| 30 |
|
| 4,878,719 |
|
| 5,015,174 |
|
| 4,955,854 |
|
| 9.93 | % |
Comerica Bank |
|
| Detroit |
|
| MI |
|
| Bank |
|
| 14 |
|
| 4,651,661 |
|
| 4,026,863 |
|
| 4,056,957 |
|
| 8.13 | % |
Silicon Valley Bank |
|
| Santa Clara |
|
| CA |
|
| Bank |
|
| 2 |
|
| 3,303,058 |
|
| 3,513,257 |
|
| 3,321,787 |
|
| 6.65 | % |
Greater Bay Bank NA |
|
| Palo Alto |
|
| CA |
|
| Bank |
|
| 16 |
|
| 3,112,387 |
|
| 2,999,706 |
|
| 3,311,387 |
|
| 6.63 | % |
Citibank (West) FSB |
|
| San Francisco |
|
| CA |
|
| Thrift |
|
| 23 |
|
| 2,712,265 |
|
| 2,787,490 |
|
| 2,970,151 |
|
| 5.95 | % |
World SB FSB |
|
| Oakland |
|
| CA |
|
| Thrift |
|
| 8 |
|
| 1,836,325 |
|
| 2,156,353 |
|
| 2,333,946 |
|
| 4.67 | % |
Bank of the West |
|
| San Francisco |
|
| CA |
|
| Bank |
|
| 26 |
|
| 1,837,348 |
|
| 1,703,526 |
|
| 1,756,020 |
|
| 3.52 | % |
Union Bank of California NA |
|
| San Francisco |
|
| CA |
|
| Bank |
|
| 12 |
|
| 1,499,434 |
|
| 1,527,063 |
|
| 1,410,057 |
|
| 2.82 | % |
Kaiser Federal Bank |
|
| Covina |
|
| CA |
|
| Thrift |
|
| 1 |
|
| 49,149 |
|
| 58,145 |
|
| 57,802 |
|
| 0.12 | % |
All Others |
|
|
|
|
|
|
|
|
|
|
| 89 |
|
| 5,545,827 |
|
| 6,139,022 |
|
| 6,749,856 |
|
| 13.52 | % |
|
|
|
|
|
|
|
|
|
|
|
|
|
|
|
| ||||||||||
Totals |
|
|
|
|
|
|
|
|
|
|
| 339 |
| $ | 46,619,520 |
| $ | 49,080,683 |
| $ | 49,926,715 |
|
| 100.00 | % |
Source: SNL Financial and FDIC.
RP® FINANCIAL, LC.
Page 3.1
This chapter presents an analysis of Kaiser Federal Financial’s operations versus a group of comparable savings institutions (the “Peer Group”), who were selected from the universe of all publicly-traded savings institutions in a manner consistent with the regulatory valuation guidelines. The basis of the pro forma market valuation of Kaiser Federal Financial is derived from the pricing ratios of the Peer Group institutions, incorporating valuation adjustments for key differences in relation to the Peer Group. Since no Peer Group can be exactly comparable to Kaiser Federal Financial, key areas examined for differences are: financial condition; profitability, growth and viability of earnings; asset growth; primary market area; dividends; liquidity of the shares; marketing of the issue; management; and effect of government regulations and regulatory reform.
The Peer Group selection process is governed by the general parameters set forth in the regulatory valuation guidelines. Accordingly, the Peer Group is comprised of only those publicly-traded savings institutions whose common stock is either listed on a national exchange (New York Stock Exchange, or “NYSE”, and American Stock Exchange, or “AMEX”), or is NASDAQ listed, since their stock trading activity is regularly reported and generally more frequent than non-publicly traded and closely-held institutions. Institutions that are not listed on a national exchange or NASDAQ are inappropriate, since the trading activity for thinly-traded or closely-held stocks is typically highly irregular in terms of frequency and price and thus may not be a reliable indicator of market value. We have also excluded from the Peer Group those companies under acquisition or subject to rumored acquisition, in mutual holding company form and recent conversions, since the pricing ratios of these companies are typically subject to unusual distortion and/or have limited trading history. A recent listing of the universe of all publicly-traded savings institutions is included as Exhibit III-1.
Ideally, the Peer Group, which must have at least 10 members to comply with the regulatory valuation guidelines, should be comprised of locally or regionally-based institutions
RP® FINANCIAL, LC.
Page 3.2
with comparable resources, strategies and financial characteristics. There are approximately 170 publicly-traded institutions nationally, which includes approximately 40 publicly-traded MHCs. Given this limited number of public full stock thrifts, it is typically the case that the Peer Group will be comprised of institutions which are not directly comparable, but the overall group will still be the “best fit” group. To the extent that differences exist between the converting institution and the Peer Group, valuation adjustments will be applied to account for the differences. Since Kaiser Federal Financial will be a full public company upon completion of the offering, we considered only full stock companies to be viable candidates for inclusion in the Peer Group. From the universe of publicly-traded thrifts, we selected 10 institutions with characteristics similar to those of the Company. In the selection process, we applied the following “screens” to the universe of all publicly traded full stock thrifts. The first preference was for comparable public thrifts in California. Since there was an insufficient number from California, we broadened the geographic criteria to the Northwest and the densely populated Mid-Atlantic corridor. As we searched for peer companies outside California, we narrowed the asset range to $500 million to $1 billion and limited the ROE range to 12% or less, and to those who were profitable and not highly dependent on mortgage banking.
| Screen #1. California thrift institutions with total assets of $500 million to $5 billion. Five companies met the criteria for Screen #1 and four were included in the Peer Group: Bofi Holding, Inc. of CA, First PacTrust Bancorp of CA, Harrington West Financial Group of CA, and PFF Bancorp, Inc. of CA. Provident Financial Holdings of CA was not included in the Peer Group due to the Company’s dependency on mortgage banking and rapid sell off in the stock in recent months. These thrifts operate in the same general market area as the Company. |
|
|
| Screen #2. Northwest thrift institutions with total assets of $500 million to $1 billion and ROE of 12% or less. Three companies met the criteria for Screen #2 and all were included in the Peer Group: Rainier Pacific Financial Group of WA, Riverview Bancorp, Inc. of WA, and Timberland Bancorp, Inc. of WA. |
|
|
| Screen #3. Mid-Atlantic thrift institutions with total assets of $500 million to $1 billion and ROE of 12% or less. Nine companies met the criteria for Screen #3 and three were included in the Peer Group: Harleysville Savings Financial Bancorp of PA, Pamrapo Bancorp, Inc. of NJ, and TF Financial Corporation of PA. The selected companies were chosen because of their densely populated markets in the Philadelphia MSA or the New York MSA and because of their similar financial characteristics compared to the Company. |
RP® FINANCIAL, LC.
Page 3.3
Table 3.1 shows the general characteristics of each of the 10 Peer Group companies. While there are expectedly some differences between the Peer Group companies and Kaiser Federal Financial, we believe that the Peer Group companies, on average, provide a good basis for valuation subject to valuation adjustments. The following sections present a comparison of Kaiser Federal Financial’s financial condition, income and expense trends, loan composition, interest rate risk and credit risk versus the Peer Group as of the most recent publicly available date.
A summary description of the key characteristics of each of the Peer Group companies is detailed below.
| • | PFF Bancorp, Inc. of CA reported total assets of $4.5 billion and operates 30 branch offices in southern California. PFF Bancorp, Inc., the largest Peer Group member, maintains a high proportion of higher risk-weight construction and commercial mortgage loans. The level of high risk-weight lending may contribute to the higher amount of net charge offs in relation to the Peer Group, however, NPAs were relatively low. |
|
|
|
| • | Harrington West Financial Group of CA maintains $1.1 billion in total assets and operates 15 branches throughout the central coast of California as well as in the Kansas City MSA and the Phoenix/Scottsdale MSA. Financially, the balance sheet composition reflects a comparatively high proportion of the loan portfolio comprised of higher risk-weight construction, commercial mortgage, and commercial business loans. Earnings are comparable to the Peer Group average as its strong spreads and non-interest income levels are offset by its higher operating expenses in comparison to the Peer Group average. Despite the emphasis in higher risk-weight lending, Harrington West Financial had a lower NPAs ratio in relation to the Peer Group. |
|
|
|
| • | Bofi Holding, Inc of CA has an asset base of $947 million and operates through a single location. Bofi Holding maintains a large wholesale leveraging portfolio, which is reflected in its comparatively lower profitability. Bofi also is more diversified in the portfolio, with a high percentage of commercial mortgage and multi-family loans. |
|
|
|
| • | Rainier Pacific Financial Group of WA, a former credit union, has $905 million in assets and operates 13 branch offices in the Tacoma-Pierce County area of Washington. The balance sheet reflects a comparatively high ratio of wholesale leveraging relative to the other Peer Group companies. Rainier Pacific also has a well diversified loan portfolio, with a high percentage of multi-family and commercial real estate loans. Rainier Pacific’s comparatively lower profitability reflects its greater wholesale leveraging and recent branch expansion and new headquarters. |
RP® Financial, LC.
Page 3.4
Table 3.1
Peer Group of Publicly-Traded Thrifts
September 4, 2007(1)
|
|
|
|
|
|
|
|
|
|
|
|
|
|
|
|
|
|
|
|
|
| As of 8/31/2007 |
| ||||
|
|
|
|
|
|
|
|
|
|
|
|
|
|
|
|
|
|
|
|
|
|
| |||||
Ticker |
| Financial Institution |
| Exchange |
| Primary Market |
| Operating |
| Total |
| Offices |
| Fiscal |
| Conv. |
| Stock |
| Market |
| ||||||
|
|
|
|
|
|
|
|
|
|
| |||||||||||||||||
|
|
|
|
|
|
|
|
|
|
|
|
|
|
|
|
|
|
|
|
|
|
| ($) |
|
| ($Mil) |
|
PFB |
| PFF Bancorp, Inc. of Pomona CA |
| NYSE |
| Pomona, CA |
| Thrift |
| $ | 4,469 |
|
| 30 |
|
| 03-31 |
|
| 03/96 |
| $ | 17.52 |
| $ | 410 |
|
HWFG |
| Harrington West Financial Group of CA |
| NASDAQ |
| Solvang, CA |
| Thrift |
| $ | 1,130 |
|
| 15 |
|
| 12-31 |
|
| 11/02 |
| $ | 14.90 |
| $ | 83 |
|
BOFI |
| Bofi Holding, Inc. of CA |
| NASDAQ |
| San Diego, CA |
| Thrift |
| $ | 947 |
|
| 1 |
|
| 06-30 |
|
| 03/05 |
| $ | 7.27 |
| $ | 60 |
|
RPFG |
| Rainier Pacific Financial Group of WA |
| NASDAQ |
| Tacoma, WA |
| Thrift |
| $ | 905 |
|
| 13 |
|
| 12-31 |
|
| 10/03 |
| $ | 16.16 |
| $ | 106 |
|
RVSB |
| Riverview Bancorp, Inc. of WA |
| NASDAQ |
| Vancouver, WA |
| Thrift |
| $ | 832 |
|
| 16 |
|
| 03-31 |
|
| 10/97 |
| $ | 14.93 |
| $ | 173 |
|
HARL |
| Harleysville Savings Financial Corp. of PA |
| NASDAQ |
| Harleysville, PA |
| Thrift |
| $ | 778 |
|
| 5 |
|
| 09-30 |
|
| 08/87 |
| $ | 14.83 |
| $ | 57 |
|
FPTB |
| First PacTrust Bancorp of CA |
| NASDAQ |
| Chula Vista, CA |
| Thrift |
| $ | 769 |
|
| 9 |
|
| 12-31 |
|
| 08/02 |
| $ | 22.80 |
| $ | 100 |
|
THRD |
| TF Financial Corp. of Newtown PA |
| NASDAQ |
| Newtown, PA |
| Thrift |
| $ | 664 |
|
| 14 |
|
| 12-31 |
|
| 07/94 |
| $ | 27.05 |
| $ | 78 |
|
PBCI |
| Pamrapo Bancorp, Inc. of NJ |
| NASDAQ |
| Bayonne, NJ |
| Thrift |
| $ | 636 |
|
| 9 |
|
| 12-31 |
|
| 11/89 |
| $ | 18.10 |
| $ | 90 |
|
TSBK |
| Timberland Bancorp, Inc. of WA |
| NASDAQ |
| Hoquiam, WA |
| Thrift |
| $ | 624 |
|
| 25 |
|
| 09-30 |
|
| 01/98 |
| $ | 15.91 |
| $ | 112 |
|
NOTES: | (1) | Or most recent date available (M=March, S=September, D=December, J=June, E=Estimated, and P=Pro Forma). |
| (2) | Operating strategies are: Thrift=Traditional Thrift, M.B.=Mortgage Banker, R.E.=Real Estate Developer, Div.=Diversified and Ret.=Retail Banking. |
| (3) | BIF-insured savings bank institution. |
|
|
|
Source: | Corporate offering circulars, data derived from information published in SNL Securities Quarterly Thrift Report, and financial reports of publicly-traded thrifts. | |
RP® FINANCIAL, LC.
Page 3.5
| • | Riverview Bancorp, Inc. of WA has $832 million in assets and operates 16 branch offices in Washington and Oregon. Riverview Bancorp has the highest ROA and net interest income ratio, reflecting its loan diversification strategy and high ratio of loans/assets. Their loan diversification reflects construction, commercial real estate, and business loans, and asset quality has been strong. |
|
|
|
| • | Harleysville Savings Financial Corporation of PA has $778 million in assets and operates five offices in the Philadelphia MSA. Harleysville Savings Financial Corporation’s balance sheet structure partially reflects a wholesale leveraging strategy. The loan portfolio reflects moderate diversification beyond 1-4 family residential loans. Harleysville Saving’s lower profitability reflects its wholesale leveraging strategy and lesser loan diversification. |
|
|
|
| • | First PacTrust Bancorp, Inc. of CA, a former credit union, has $769 million in assets and operates nine offices in San Diego and Riverside Counties, in the same general region as the Company. The majority of First PacTrust’s loans are for 1-4 family residential loans, but it has also diversified into commercial real estate lending. |
|
|
|
| • | TF Financial Corporation of PA has assets of $664 million and operates 14 branches in Pennsylvania MSA. The asset structure reflects a relatively higher proportion of loans/assets, with the majority of loans invested in 1-4 family loans. The relatively high ratio of loans provides TF Financial maintains a relatively strong net interest margin and ROA. NPAs are higher than the Peer Group average, and the reserve coverage ratio falls below the Peer Group average. |
|
|
|
| • | Pamrapo Bancorp, Inc. of NJ has assets of $636 and operates nine offices in Northern New Jersey (in the New York MSA). Pamrapo Bancorp’s balance sheet composition reflects a comparatively lower proportion of loans and higher proportion of investments (mainly MBS). The majority of Pamrapo Bancorp’s loan portfolio consists of 1-4 family residential mortgages, while reflecting diversification in commercial and multi-family mortgages, construction, C&I and consumer loans. Pamrapo Bancorp enjoys a relatively high net interest income ratio and overall profitability. Pamrapo Bancorp had the highest amount of NPAs among the Peer Group members. |
|
|
|
| • | Timberland Bancorp, Inc. of WA has $624 million in assets and operates 25 branch offices in Washington. Timberland Bancorp maintains a considerably diversified loan portfolio which has contributed to its relatively high net interest income and overall profitability ratios. Timberland Bancorp has good asset quality, exhibiting NPAs that are lower than the Peer Group average. |
In aggregate, the Peer Group companies maintain a lower equity level as the industry average (9.2% of assets versus 12.6% for all public companies), generate a higher level of core profitability (0.75% for the Peer Group and 0.49% for all public companies), and generate a higher ROE based on core earnings (8.01% versus 4.70% for all public companies). Overall, the
RP® FINANCIAL, LC.
Page 3.6
Peer Group’s pricing ratios were at a modest discount to all publicly traded thrift institutions, including both the price/earnings multiple and the price/tangible book value ratio.
|
| All |
|
| Peer Group |
| |
|
|
|
| ||||
Financial Characteristics (Averages) |
|
|
|
|
|
|
|
Assets ($Mil) |
| $ | 3,136 |
| $ | 1,176 |
|
Market Capitalization ($Mil) |
| $ | 413 |
| $ | 127 |
|
Equity/Assets (%) |
|
| 12.58 | % |
| 9.17 | % |
Core Return on Average Assets (%) |
|
| 0.49 | % |
| 0.75 | % |
Core Return on Average Equity (%) |
|
| 4.70 | % |
| 8.01 | % |
|
|
|
|
|
|
|
|
Pricing Ratios (Averages)(1) |
|
|
|
|
|
|
|
Price/Core Earnings (x) |
|
| 20.71 | x |
| 18.40 | x |
Price/Book (%) |
|
| 130.65 | % |
| 126.99 | % |
Price/Tangible Book (%) |
|
| 149.25 | % |
| 137.30 | % |
Price/Assets (%) |
|
| 16.47 | % |
| 11.95 | % |
(1) | Based on market prices as of August 31, 2007. |
Source: Corporate reports, offering circulars, and RP Financial, L.C. calculations.
Since there are some key differences between Kaiser Federal Financial and this “best fit” Peer Group, we have prepared the following analysis to point out such differences, as well as the similarities.
Table 3.2 shows comparative balance sheet measures for the Company and the Peer Group (as of June 30, 2007 publicly available information). Kaiser Federal Financial’s equity-to-assets ratio of 11.6% was above the Peer Group’s average equity ratio of 9.2%, respectively, even before the completion of the Offering. Tangible equity equaled 11.0% of assets for the Company, versus 8.6% on average for the Peer Group. The increase in Kaiser Federal Financial’s pro forma equity position will be favorable from a risk perspective and in terms of future earnings potential through reinvestment and leveraging. At the same time, the Company’s higher pro forma capitalization will also result in a lower return on equity. Both the Company’s and the Peer Group’s capital ratios reflected capital surpluses with respect to the regulatory capital requirements.
RP ® Financial, LC.
Page 3.7
Table 3.2
Balance Sheet Composition and Growth Rates
Kaiser Federal Financial Group, Inc. and the Comparable Group
As of June 30, 2007
|
|
| Balance Sheet as a Percent of Assets |
| ||||||||||||||||||
|
|
|
| |||||||||||||||||||
|
|
|
|
|
|
|
|
|
|
|
|
|
|
|
|
|
|
|
|
|
|
|
|
|
| Cash & |
| MBS & |
| Loans |
| Deposits |
| Borrowed |
| Subd. |
| Net |
| Goodwill |
| Tng Net |
| MEMO: |
|
|
|
|
|
|
|
|
|
|
|
|
|
| ||||||||||
Kaiser Federal Financial Group, Inc. |
|
|
|
|
|
|
|
|
|
|
|
|
|
|
|
|
|
|
|
|
| |
June 30, 2007 |
| 3.3 | % | 5.9 | % | 87.4 | % | 61.8 | % | 26.3 | % | 0.0 | % | 11.6 | % | 0.5 | % | 11.0 | % | 0.0 | % | |
All Public Companies |
|
|
|
|
|
|
|
|
|
|
|
|
|
|
|
|
|
|
|
|
| |
Averages |
| 4.4 | % | 19.8 | % | 70.2 | % | 68.7 | % | 17.0 | % | 0.7 | % | 12.4 | % | 1.0 | % | 11.4 | % | 0.0 | % | |
Medians |
| 2.7 | % | 18.1 | % | 70.6 | % | 70.6 | % | 15.4 | % | 0.0 | % | 10.6 | % | 0.1 | % | 9.3 | % | 0.0 | % | |
State of CA |
|
|
|
|
|
|
|
|
|
|
|
|
|
|
|
|
|
|
|
|
| |
Averages |
| 1.9 | % | 15.2 | % | 79.0 | % | 64.2 | % | 25.1 | % | 0.9 | % | 8.1 | % | 0.1 | % | 8.0 | % | 0.1 | % | |
Medians |
| 1.4 | % | 12.5 | % | 83.2 | % | 68.2 | % | 22.7 | % | 0.5 | % | 7.7 | % | 0.0 | % | 7.7 | % | 0.0 | % | |
Comparable Group |
|
|
|
|
|
|
|
|
|
|
|
|
|
|
|
|
|
|
|
|
| |
Averages |
| 2.9 | % | 19.5 | % | 73.1 | % | 68.3 | % | 20.9 | % | 0.8 | % | 9.2 | % | 0.6 | % | 8.6 | % | 0.1 | % | |
Medians |
| 1.9 | % | 20.7 | % | 73.0 | % | 71.1 | % | 17.2 | % | 0.0 | % | 9.6 | % | 0.2 | % | 9.0 | % | 0.0 | % | |
Comparable Group |
|
|
|
|
|
|
|
|
|
|
|
|
|
|
|
|
|
|
|
|
| |
BOFI | Bofi Holding, Inc. of CA |
| 5.5 | % | 39.1 | % | 53.6 | % | 57.9 | % | 33.5 | % | 0.5 | % | 7.7 | % | 0.0 | % | 7.7 | % | 0.5 | % |
FPTB | First PacTrust Bancorp of CA |
| 2.2 | % | 2.7 | % | 91.2 | % | 75.8 | % | 12.7 | % | 0.0 | % | 10.8 | % | 0.0 | % | 10.8 | % | 0.0 | % |
HARL | Harleysville Savings Fin. Corp. of PA |
| 1.0 | % | 42.2 | % | 53.0 | % | 55.7 | % | 37.0 | % | 0.0 | % | 6.3 | % | 0.0 | % | 6.3 | % | 0.0 | % |
HWFG | Harrington West Fin. Group of CA |
| 1.6 | % | 26.6 | % | 67.2 | % | 68.2 | % | 22.7 | % | 2.3 | % | 6.1 | % | 0.6 | % | 5.5 | % | 0.0 | % |
PFB | PFF Bancorp, Inc. of Pomona CA |
| 1.3 | % | 4.9 | % | 91.2 | % | 72.8 | % | 16.2 | % | 2.0 | % | 8.3 | % | 0.0 | % | 8.3 | % | 0.0 | % |
PBCI | Pamrapo Bancorp, Inc. of NJ |
| 5.0 | % | 23.5 | % | 69.7 | % | 75.7 | % | 14.0 | % | 0.0 | % | 9.2 | % | 0.0 | % | 9.2 | % | 0.0 | % |
RPFG | Rainier Pacific Fin. Group of WA |
| 1.5 | % | 22.6 | % | 70.6 | % | 50.9 | % | 38.4 | % | 0.0 | % | 9.9 | % | 0.4 | % | 9.6 | % | 0.0 | % |
RVSB | Riverview Bancorp, Inc. of WA |
| 8.2 | % | 3.4 | % | 79.7 | % | 83.2 | % | 0.9 | % | 2.7 | % | 12.0 | % | 3.2 | % | 8.8 | % | 0.0 | % |
THRD | TF Financial Corp. of Newtown PA |
| 0.9 | % | 18.8 | % | 75.3 | % | 73.7 | % | 15.1 | % | 0.0 | % | 10.0 | % | 0.7 | % | 9.3 | % | 0.0 | % |
TSBK | Timberland Bancorp, Inc. of WA |
| 2.1 | % | 11.3 | % | 79.7 | % | 69.5 | % | 18.1 | % | 0.0 | % | 11.9 | % | 1.1 | % | 10.7 | % | 0.0 | % |
|
|
| Balance Sheet Annual Growth Rates |
| ||||||||||||
|
|
|
| |||||||||||||
|
|
| Assets |
| MBS, Cash & |
| Loans |
| Deposits |
| Borrows. |
| Net |
| Tng Net |
|
|
|
|
|
|
|
|
|
|
| |||||||
Kaiser Federal Financial Group, Inc. |
|
|
|
|
|
|
|
|
|
|
|
|
|
|
| |
June 30, 2007 |
| 8.21 | % | -6.45 | % | 10.26 | % | 6.62 | % | 16.71 | % | -0.37 | % | -0.26 | % | |
All Public Companies |
|
|
|
|
|
|
|
|
|
|
|
|
|
|
| |
Averages |
| 4.19 | % | -1.30 | % | 7.80 | % | 5.50 | % | -3.95 | % | 2.53 | % | 1.93 | % | |
Medians |
| 2.76 | % | -3.77 | % | 7.15 | % | 3.53 | % | -6.67 | % | 2.42 | % | 1.88 | % | |
State of CA |
|
|
|
|
|
|
|
|
|
|
|
|
|
|
| |
Averages |
| 4.49 | % | 1.57 | % | 1.84 | % | 8.16 | % | -6.53 | % | 6.70 | % | 6.69 | % | |
Medians |
| 0.44 | % | -10.55 | % | 2.73 | % | 8.15 | % | -13.72 | % | 6.48 | % | 7.65 | % | |
Comparable Group |
|
|
|
|
|
|
|
|
|
|
|
|
|
|
| |
Averages |
| 3.51 | % | -5.64 | % | 3.32 | % | 7.21 | % | -16.36 | % | 2.58 | % | 2.66 | % | |
Medians |
| -0.01 | % | -9.14 | % | 1.73 | % | 3.63 | % | -13.72 | % | 4.36 | % | 2.86 | % | |
Comparable Group |
|
|
|
|
|
|
|
|
|
|
|
|
|
|
| |
BOFI | Bofi Holding, Inc. of CA |
| 28.37 | % | NM |
| -4.82 | % | 29.17 | % | 33.61 | % | 3.56 | % | 3.56 | % |
FPTB | First PacTrust Bancorp of CA |
| -6.45 | % | 0.07 | % | -7.05 | % | 8.15 | % | -51.20 | % | 5.14 | % | 5.14 | % |
HARL | Harleysville Savings Fin. Corp. of PA |
| 0.38 | % | -9.14 | % | 8.92 | % | -0.14 | % | 0.62 | % | 2.15 | % | 2.15 | % |
HWFG | Harrington West Fin. Group of CA |
| 0.44 | % | -11.23 | % | 6.03 | % | 8.41 | % | -17.72 | % | 6.48 | % | 7.64 | % |
PFB | PFF Bancorp, Inc. of Pomona CA |
| -0.41 | % | -32.34 | % | 2.73 | % | 3.89 | % | -13.72 | % | -1.41 | % | -1.41 | % |
PBCI | Pamrapo Bancorp, Inc. of NJ |
| -1.19 | % | -0.02 | % | -1.41 | % | 0.86 | % | -10.13 | % | -1.48 | % | -1.48 | % |
RPFG | Rainier Pacific Fin. Group of WA |
| -1.56 | % | -19.59 | % | 6.52 | % | 2.42 | % | -7.84 | % | 5.45 | % | 1.92 | % |
RVSB | Riverview Bancorp, Inc. of WA |
| 4.89 | % | 46.00 | % | 0.74 | % | 13.96 | % | -62.25 | % | 6.71 | % | 9.62 | % |
THRD | TF Financial Corp. of Newtown PA |
| -1.50 | % | 4.04 | % | -3.44 | % | 2.05 | % | -18.62 | % | 5.29 | % | 5.75 | % |
TSBK | Timberland Bancorp, Inc. of WA |
| 12.15 | % | -28.52 | % | 24.98 | % | 3.37 | % | NM |
| -6.13 | % | -6.34 | % |
|
|
| Regulatory Capital |
| ||||
|
|
|
| |||||
|
|
| Tangible |
| Core |
| Reg.Cap. |
|
|
|
|
|
|
| |||
Kaiser Federal Financial Group, Inc. |
|
|
|
|
|
|
| |
June 30, 2007 |
| 8.32 | % | 6.32 | % | 13.30 | % | |
All Public Companies |
|
|
|
|
|
|
| |
Averages |
| 10.78 | % | 10.62 | % | 17.81 | % | |
Medians |
| 9.35 | % | 9.33 | % | 15.04 | % | |
State of CA |
|
|
|
|
|
|
| |
Averages |
| 8.53 | % | 8.53 | % | 14.12 | % | |
Medians |
| 8.60 | % | 8.60 | % | 12.04 | % | |
Comparable Group |
|
|
|
|
|
|
| |
Averages |
| 9.39 | % | 9.11 | % | 13.68 | % | |
Medians |
| 9.02 | % | 8.88 | % | 13.64 | % | |
Comparable Group |
|
|
|
|
|
|
| |
BOFI | Bofi Holding, Inc. of CA |
| 8.60 | % | 8.60 | % | 15.76 | % |
FPTB | First PacTrust Bancorp of CA |
| 9.84 | % | 9.84 | % | 14.61 | % |
HARL | Harleysville Savings Fin. Corp. of PA |
| NA |
| 6.55 | % | 13.43 | % |
HWFG | Harrington West Fin. Group of CA |
| 7.72 | % | 7.72 | % | 11.17 | % |
PFB | PFF Bancorp, Inc. of Pomona CA |
| 8.72 | % | 8.72 | % | 11.21 | % |
PBCI | Pamrapo Bancorp, Inc. of NJ |
| 8.73 | % | 8.73 | % | 16.10 | % |
RPFG | Rainier Pacific Fin. Group of WA |
| 9.33 | % | 9.33 | % | 12.98 | % |
RVSB | Riverview Bancorp, Inc. of WA |
| 9.60 | % | 9.60 | % | 11.38 | % |
THRD | TF Financial Corp. of Newtown PA |
| 9.02 | % | 9.02 | % | 16.36 | % |
TSBK | Timberland Bancorp, Inc. of WA |
| 12.96 | % | 12.96 | % | 13.84 | % |
(1) | Financial information is for the quarter ending March 31, 2007. |
Source: | Audited and unaudited financial statements, corporate reports and offering circulars, and RP® Financial, LC. calculations. The information provided in this table has been obtained from sources we believe are reliable, but we cannot guarantee the accuracy or completeness of such information. |
|
|
Copyright (c) 2007 by RP® Financial, LC. | |
RP® FINANCIAL, LC.
Page 3.8
The Company’s asset composition reflects a higher concentration of loans to assets, at 87.4% versus a 73.1% average for the Peer Group. Comparatively, the ratio of cash, investments, and MBS for the Company was lower than for the Peer Group (9.2% of assets versus 22.4% for the Peer Group). Overall, the Company’s interest-earning assets (“IEA”) approximated 96.6% of assets, which is slightly higher than the comparative Peer Group ratio of 95.5%. On a pro forma basis, the Company’s IEA advantage is expected to increase as the net proceeds are reinvested into IEA.
The Company’s deposits equaled 61.8% of assets, which was slightly below the Peer Group average of 68.3%. The Company has utilized borrowings to a greater extent than the Peer Group, on average, at 26.3% and 21.7% of assets (includes subordinated debt), respectively. Total interest-bearing liabilities (“IBL”) maintained by Kaiser Federal Financial and the Peer Group, equaled 88.1% and 90.0% of assets, respectively. The ratio of IBL will be reduced on a post-offering basis as the Company funds a greater portion of its operations with equity.
Kaiser Federal Financial posted higher 12 month asset growth than the Peer Group, at 8.21% and 3.51%, respectively. The Company’s comparatively faster growth is attributable to efforts to expand lending and leverage its equity, particularly following the completion of the minority stock issuance in 2004, as noted earlier. The Company’s faster loan growth (10.26% versus 3.32% for the Peer Group on average) partially reflects the higher level of loan purchases by comparison. The portfolio of cash, investments and MBS modestly decreased for the Peer Group, by 5.64% as compared to the comparable shrinkage of 6.45% for the Company.
The Company’s deposit growth rate was comparable to the Peer Group average as Kaiser Federal Financial sought to fund targeted asset growth, 6.62% versus 7.21% for the Peer Group on average. Borrowed funds increased much more rapidly for the Company at a 16.71% annual pace versus moderate shrinkage of 16.36% for the Peer Group, as the Company increased borrowings to support its leveraging objectives.
The Company’s equity declined by 0.37% as compared to modest growth of 2.58% for the Peer Group based on the average. Reduction of the Company’s equity and the modest growth for the Peer Group reflects the adoption of dividend and capital management strategies by both the Company and the Peer Group. On a post-offering basis, the Company’s equity
RP® FINANCIAL, LC.
Page 3.9
growth rate is expected to remain comparatively modest as the benefit of reinvestment of the Offering proceeds may be offset by additional share repurchases, the payment of dividends and as expenses may likely increase reflecting the impact of the expanded stock benefit plans.
Table 3.3 displays comparative statements of operations for the Company and the Peer Group. Kaiser Federal Financial and the Peer Group reported net income to average assets ratios of 0.61% and 0.78%, respectively. The Company’s operations reflect a relatively favorable level of operating expense and fee income, the benefits of which are offset by a comparatively weaker net interest income ratio.
The Peer Group’s interest income and interest expense ratios relative to average assets were relatively favorable in comparison to the Company, resulting in a stronger net interest income ratio. The Peer Group’s higher interest income ratio was realized through earning a high yield on interest-earning assets (6.59% versus 5.55% for the Company). Despite the Company’s higher ratio of loans-to-assets, the Company’s lower asset yields reflect its higher concentration of 1-4 family residential mortgage loans, the majority of which are fixed rate loans. In contrast, many of the Peer Group companies have a more substantial internal origination capability and greater loan diversification into higher yielding loans. The Company’s marginally lower interest expense ratio, 3.00% versus 3.35% of average assets for the Peer Group, reflects the Company’s relatively strong capital ratio, notwithstanding the higher level of borrowings and competitive rate posture taken to stimulate deposit growth. Kaiser Federal Financial’s interest expense ratio is expected to diminish on a pro forma basis, as the conversion proceeds will represent interest-free funds for the Company. Overall, the Company’s net interest income ratio of 2.34% compared unfavorably to the Peer Group average of 2.95%.
Non-interest operating income is a marginally higher contributor to Kaiser Federal Financial’s earnings relative to the Peer Group, at 0.57% and 0.54%, respectively. Kaiser Federal Financial operates with a modestly lower operating expense ratio than the Peer Group, notwithstanding the Company’s recent expansion through acquisition and de novo branching. The operating expense ratios for Kaiser Federal Financial and the Peer Group were 1.88% and
RP ® Financial, LC.
Page 3.10
Table 3.3
Income as Percent of Average Assets and Yields, Costs, Spreads
Kaiser Federal Financial Group, Inc. and Comparables
For the 12 Months Ended June 30, 2007
|
|
|
| Net Interest Income |
| NII |
| Other Income |
| Total |
| |||||||||||
|
|
|
|
|
|
| ||||||||||||||||
| Net |
| Income |
| Expense |
| NII |
| Loss |
|
| Loan |
| R.E. |
| Other |
|
| ||||
|
|
|
|
|
|
|
|
|
|
|
|
| ||||||||||
Kaiser Federal Financial Group, Inc. |
|
|
|
|
|
|
|
|
|
|
|
|
|
|
|
|
|
|
|
|
| |
June 30, 2007 |
| 0.61 | % | 5.34 | % | 3.00 | % | 2.34 | % | 0.07 | % | 2.27 | % | 0.00 | % | 0.00 | % | 0.57 | % | 0.57 | % | |
All Public Companies |
|
|
|
|
|
|
|
|
|
|
|
|
|
|
|
|
|
|
|
|
| |
Averages |
| 0.50 | % | 5.83 | % | 3.09 | % | 2.73 | % | 0.11 | % | 2.63 | % | 0.03 | % | 0.00 | % | 0.62 | % | 0.65 | % | |
Medians |
| 0.55 | % | 5.74 | % | 3.10 | % | 2.72 | % | 0.06 | % | 2.61 | % | 0.00 | % | 0.00 | % | 0.50 | % | 0.52 | % | |
State of CA |
|
|
|
|
|
|
|
|
|
|
|
|
|
|
|
|
|
|
|
|
| |
Averages |
| 0.80 | % | 6.60 | % | 3.89 | % | 2.71 | % | 0.17 | % | 2.54 | % | 0.03 | % | -0.01 | % | 0.35 | % | 0.37 | % | |
Medians |
| 0.78 | % | 6.76 | % | 3.78 | % | 2.69 | % | 0.14 | % | 2.65 | % | 0.01 | % | 0.00 | % | 0.36 | % | 0.38 | % | |
Comparable Group |
|
|
|
|
|
|
|
|
|
|
|
|
|
|
|
|
|
|
|
|
| |
Averages |
| 0.78 | % | 6.30 | % | 3.35 | % | 2.95 | % | 0.10 | % | 2.85 | % | 0.02 | % | 0.00 | % | 0.51 | % | 0.54 | % | |
Medians |
| 0.71 | % | 6.11 | % | 3.53 | % | 2.98 | % | 0.05 | % | 2.92 | % | 0.01 | % | 0.00 | % | 0.42 | % | 0.45 | % | |
Comparable Group |
|
|
|
|
|
|
|
|
|
|
|
|
|
|
|
|
|
|
|
|
| |
BOFI | Bofi Holding, Inc. of CA |
| 0.40 | % | 5.43 | % | 4.11 | % | 1.32 | % | 0.00 | % | 1.33 | % | 0.00 | % | 0.00 | % | 0.08 | % | 0.08 | % |
FPTB | First PacTrust Bancorp of CA |
| 0.54 | % | 5.89 | % | 3.68 | % | 2.21 | % | -0.04 | % | 2.25 | % | 0.00 | % | 0.00 | % | 0.29 | % | 0.29 | % |
HARL | Harleysville Savings Fin. Corp. of PA |
| 0.43 | % | 5.19 | % | 3.67 | % | 1.53 | % | 0.00 | % | 1.53 | % | 0.00 | % | 0.00 | % | 0.21 | % | 0.21 | % |
HWFG | Harrington West Fin. Group of CA |
| 0.63 | % | 6.76 | % | 4.07 | % | 2.69 | % | 0.04 | % | 2.65 | % | 0.00 | % | 0.00 | % | 0.38 | % | 0.38 | % |
PFB | PFF Bancorp, Inc. of Pomona CA |
| 0.90 | % | 7.49 | % | 3.57 | % | 3.92 | % | 0.68 | % | 3.24 | % | 0.05 | % | 0.01 | % | 0.45 | % | 0.51 | % |
PBCI | Pamrapo Bancorp, Inc. of NJ |
| 0.87 | % | 5.86 | % | 2.74 | % | 3.12 | % | 0.06 | % | 3.07 | % | 0.01 | % | 0.00 | % | 0.38 | % | 0.40 | % |
RPFG | Rainier Pacific Fin. Group of WA(2) |
| 0.43 | % | 6.33 | % | 3.49 | % | 2.84 | % | 0.07 | % | 2.77 | % | 0.15 | % | 0.00 | % | 0.85 | % | 1.01 | % |
RVSB | Riverview Bancorp, Inc. of WA |
| 1.43 | % | 7.58 | % | 3.17 | % | 4.40 | % | 0.14 | % | 4.27 | % | 0.02 | % | 0.00 | % | 1.04 | % | 1.06 | % |
THRD | TF Financial Corp. of Newtown PA |
| 0.80 | % | 5.73 | % | 2.57 | % | 3.16 | % | 0.00 | % | 3.16 | % | 0.01 | % | 0.00 | % | 0.51 | % | 0.52 | % |
TSBK | Timberland Bancorp, Inc. of WA |
| 1.37 | % | 6.74 | % | 2.42 | % | 4.32 | % | 0.07 | % | 4.25 | % | 0.00 | % | 0.02 | % | 0.91 | % | 0.93 | % |
|
| G&A/Other Exp. |
| Non-Op. Items |
| Yields, Costs, and Spreads |
| MEMO: |
| MEMO: |
| ||||||||||
|
|
|
|
|
| ||||||||||||||||
| G&A |
| Goodwill |
| Net |
| Extrao. |
| Yield |
| Cost |
| Yld-Cost |
|
|
| |||||
|
|
|
|
|
|
|
|
|
| ||||||||||||
Kaiser Federal Financial Group, Inc. |
|
|
|
|
|
|
|
|
|
|
|
|
|
|
|
|
|
|
|
| |
June 30, 2007 |
| 1.88 | % | 0.00 | % | -0.01 | % | 0.00 | % | 5.55 | % | 3.68 | % | 1.87 | % | $ | 8,835 |
| 35.01 | % | |
All Public Companies |
|
|
|
|
|
|
|
|
|
|
|
|
|
|
|
|
|
|
|
| |
Averages |
| 2.57 | % | 0.02 | % | 0.07 | % | 0.00 | % | 6.19 | % | 3.58 | % | 2.62 | % | $ | 5,493 |
| 32.41 | % | |
Medians |
| 2.49 | % | 0.00 | % | 0.01 | % | 0.00 | % | 6.05 | % | 3.62 | % | 2.67 | % | $ | 4,443 |
| 32.63 | % | |
State of CA |
|
|
|
|
|
|
|
|
|
|
|
|
|
|
|
|
|
|
|
| |
Averages |
| 1.90 | % | 0.01 | % | 0.31 | % | 0.00 | % | 6.86 | % | 4.30 | % | 2.56 | % | $ | 6,643 |
| 39.21 | % | |
Medians |
| 1.97 | % | 0.00 | % | 0.06 | % | 0.00 | % | 7.00 | % | 4.21 | % | 2.72 | % | $ | 5,983 |
| 40.59 | % | |
Comparable Group |
|
|
|
|
|
|
|
|
|
|
|
|
|
|
|
|
|
|
|
| |
Averages |
| 2.21 | % | 0.01 | % | 0.02 | % | 0.00 | % | 6.59 | % | 3.70 | % | 2.89 | % | $ | 5,379 |
| 33.64 | % | |
Medians |
| 2.17 | % | 0.00 | % | 0.04 | % | 0.00 | % | 6.12 | % | 3.94 | % | 2.92 | % | $ | 5,982 |
| 34.01 | % | |
Comparable Group |
|
|
|
|
|
|
|
|
|
|
|
|
|
|
|
|
|
|
|
| |
BOFI | Bofi Holding, Inc. of CA |
| 0.79 | % | 0.00 | % | 0.06 | % | 0.00 | % | 5.53 | % | 4.53 | % | 1.00 | % | $ | NM |
| 40.76 | % |
FPTB | First PacTrust Bancorp of CA |
| 1.72 | % | 0.00 | % | 0.00 | % | 0.00 | % | 6.12 | % | 4.13 | % | 1.99 | % | $ | 6,929 |
| 34.01 | % |
HARL | Harleysville Savings Fin. Corp. of PA |
| 1.21 | % | 0.00 | % | 0.02 | % | 0.00 | % | 5.38 | % | 3.95 | % | 1.44 | % | $ | 9,048 |
| 20.51 | % |
HWFG | Harrington West Fin. Group of CA |
| 1.97 | % | 0.02 | % | -0.09 | % | 0.00 | % | 7.08 | % | 4.36 | % | 2.72 | % | $ | 5,982 |
| 33.95 | % |
PFB | PFF Bancorp, Inc. of Pomona CA |
| 2.20 | % | 0.00 | % | -0.01 | % | 0.00 | % | 7.68 | % | 3.94 | % | 3.74 | % | $ | 5,983 |
| 41.82 | % |
PBCI | Pamrapo Bancorp, Inc. of NJ |
| 2.14 | % | 0.00 | % | 0.07 | % | 0.00 | % | 5.97 | % | 3.05 | % | 2.92 | % | $ | 6,629 |
| 37.25 | % |
RPFG | Rainier Pacific Fin. Group of WA(2) |
| 3.11 | % | 0.03 | % | 0.03 | % | 0.00 | % | NM |
| NM |
| NM |
| $ | 4,570 |
| NM |
|
RVSB | Riverview Bancorp, Inc. of WA |
| 3.17 | % | 0.02 | % | 0.05 | % | 0.00 | % | 8.29 | % | 3.65 | % | 4.64 | % | $ | 3,263 |
| 34.73 | % |
THRD | TF Financial Corp. of Newtown PA |
| 2.62 | % | 0.00 | % | 0.05 | % | 0.00 | % | 6.02 | % | 2.89 | % | 3.13 | % | $ | 3,513 |
| 27.61 | % |
TSBK | Timberland Bancorp, Inc. of WA |
| 3.20 | % | 0.05 | % | 0.07 | % | 0.00 | % | 7.26 | % | 2.79 | % | 4.46 | % | $ | 2,497 |
| 32.10 | % |
(1) | Financial information is for the quarter ending March 31, 2007. |
(2) | Income and expense information has been annualized from available financial information. |
|
|
Source: | Audited and unaudited financial statements, corporate reports and offering circulars, and RP® Financial, LC. calculations. The information provided in this table has been obtained from sources we believe are |
| reliable, but we cannot guarantee the accuracy or completeness of such information. |
|
|
Copyright (c) 2007 by RP® Financial, LC. | |
RP® FINANCIAL, LC.
Page 3.11
2.21%, respectively. Intangible assets amortization was nominal for the Peer Group, and the Company had no amortizing intangible assets. On a post-offering basis, the Company’s operating expenses can be expected to increase with the incremental cost of the stock-based benefit plans.
Kaiser Federal Financial’s efficiency ratio (operating expenses as a percent of the sum of non-interest operating income and net interest income) of 64.9% is slightly less favorable than the Peer Group’s ratio of 63.3%. On a post-offering basis, the Company’s efficiency ratio may improve marginally with the reinvestment of the offering proceeds, and thus remain at an advantage.
Loan loss provisions for the Company and the Peer Group were relatively modest, amounting to 0.07% and 0.10% of average assets for Kaiser Federal Financial and the Peer Group, respectively, reflecting relatively strong asset quality, but high net loan chargeoffs for the Company.
Non-operating income and expense were negligible for Kaiser Federal Financial and the Peer Group, enhancing their overall comparability.
The Company’s effective tax rate for the last 12 months of 35.0% is slightly higher than the Peer Group average of 33.6%. The Company expects that its effective tax rate will continue to approximate the recent historical level in fiscal 2007.
Kaiser Federal Financial’s loan portfolio reflects a comparatively greater concentration of 1-4 family residential mortgage loans and MBS, which aggregated to 60.0% of assets and 46.3% of assets for the Company and the Peer Group, respectively (see Table 3.4). Loans secured by permanent 1-4 family residential mortgage loans equaled 58.7% of assets for the Company versus 33.2% on average for the Peer Group, while MBS comprised 2.5% and 13.1%, respectively.
The Peer Group’s lending activities show greater diversification in various areas of high risk-weight lending including multi-family and commercial mortgage lending. Specifically, multi-family and commercial mortgage loans represented 24.4% of assets, which was modestly
RP ® Financial, LC.
Page 3.12
Table 3.4
Loan Portfolio Composition and Related Information
Kaiser Federal Financial Group, Inc. and the Comparable Group
As of June 30, 2007
|
|
|
|
| Portfolio Composition as a Percent of Assets |
|
|
|
|
|
|
|
|
|
| ||||||||||||||||
|
|
|
|
|
|
|
|
|
|
|
|
|
|
| |||||||||||||||||
Institution |
| MBS |
| 1-4 |
| Constr. |
| 5+Unit |
| Commerc. |
| Consumer |
| RWA/ |
| Serviced |
| Servicing |
| ||||||||||||
|
|
|
|
|
|
|
|
|
| ||||||||||||||||||||||
|
|
|
|
| (%) |
| (%) |
| (%) |
| (%) |
| (%) |
| (%) |
| (%) |
| ($000) |
| ($000) |
| |||||||||
Kaiser Federal Financial Group, Inc. |
|
| 2.46 | % |
| 58.71 | % |
| 0.00 | % |
| 20.75 | % |
| 0.00 | % |
| 8.33 | % |
| 63.55 | % | $ | 1,300 |
| $ | 0 |
| |||
All Public Companies (1) |
|
|
|
|
|
|
|
|
|
|
|
|
|
|
|
|
|
|
|
|
|
|
|
|
|
|
|
| |||
Averages |
|
| 10.18 | % |
| 37.29 | % |
| 6.68 | % |
| 18.39 | % |
| 4.24 | % |
| 3.03 | % |
| 63.35 | % | $ | 1,297,195 |
| $ | 15,314 |
| |||
Medians |
|
| 7.62 | % |
| 35.45 | % |
| 4.32 | % |
| 16.78 | % |
| 2.79 | % |
| 0.78 | % |
| 63.98 | % | $ | 31,870 |
| $ | 120 |
| |||
State of CA (1) |
|
|
|
|
|
|
|
|
|
|
|
|
|
|
|
|
|
|
|
|
|
|
|
|
|
|
|
| |||
Averages |
|
| 10.63 | % |
| 46.97 | % |
| 6.64 | % |
| 25.21 | % |
| 2.39 | % |
| 0.39 | % |
| 64.48 | % | $ | 16,266,318 |
| $ | 230,570 |
| |||
Medians |
|
| 7.23 | % |
| 48.66 | % |
| 3.55 | % |
| 23.36 | % |
| 0.90 | % |
| 0.04 | % |
| 65.29 | % | $ | 99,260 |
| $ | 133 |
| |||
Comparable Group |
|
|
|
|
|
|
|
|
|
|
|
|
|
|
|
|
|
|
|
|
|
|
|
|
|
|
|
| |||
Averages |
|
| 13.05 | % |
| 33.21 | % |
| 12.57 | % |
| 24.40 | % |
| 2.96 | % |
| 1.38 | % |
| 70.56 | % | $ | 56,143 |
| $ | 256 |
| |||
Medians |
|
| 9.48 | % |
| 30.20 | % |
| 7.46 | % |
| 24.46 | % |
| 1.48 | % |
| 0.49 | % |
| 72.47 | % | $ | 22,187 |
| $ | 152 |
| |||
Comparable Group |
|
|
|
|
|
|
|
|
|
|
|
|
|
|
|
|
|
|
|
|
|
|
|
|
|
|
|
| |||
BOFI | Bofi Holding, Inc. of CA |
|
| 31.26 | % |
| 13.60 | % |
| 0.07 | % |
| 43.33 | % |
| 0.02 | % |
| 1.18 | % |
| 55.58 | % | $ | 0 |
| $ | 0 |
| ||
FPTB | First PacTrust Bancorp of CA |
|
| 0.00 | % |
| 75.84 | % |
| 4.73 | % |
| 10.42 | % |
| 0.14 | % |
| 0.33 | % |
| 71.38 | % | $ | 0 |
| $ | 0 |
| ||
HARL | Harleysville Savings Fin. Corp. of PA |
|
| 26.00 | % |
| 50.48 | % |
| 0.99 | % |
| 1.56 | % |
| 0.14 | % |
| 0.16 | % |
| 49.44 | % | $ | 3,754 |
| $ | 0 |
| ||
HWFG | Harrington West Fin. Group of CA |
|
| 25.55 | % |
| 13.84 | % |
| 14.74 | % |
| 29.84 | % |
| 9.05 | % |
| 0.19 | % |
| 73.58 | % | $ | 6,307 |
| $ | 10 |
| ||
PFB | PFF Bancorp, Inc. of Pomona CA |
|
| 4.21 | % |
| 36.66 | % |
| 26.02 | % |
| 20.50 | % |
| 5.46 | % |
| 2.67 | % |
| 86.26 | % | $ | 109,434 |
| $ | 294 |
| ||
PBCI | Pamrapo Bancorp, Inc. of NJ |
|
| 21.28 | % |
| 43.56 | % |
| 1.83 | % |
| 23.31 | % |
| 1.35 | % |
| 0.38 | % |
| 56.87 | % | $ | 265 |
| $ | 0 |
| ||
RPFG | Rainier Pacific Fin. Group of WA(1) |
|
| 6.25 | % |
| 14.09 | % |
| 8.40 | % |
| 41.38 | % |
| 1.61 | % |
| 6.03 | % |
| 81.96 | % | $ | 113,435 |
| $ | 549 |
| ||
RVSB | Riverview Bancorp, Inc. of WA |
|
| 0.97 | % |
| 8.75 | % |
| 35.40 | % |
| 32.03 | % |
| 8.21 | % |
| 0.44 | % |
| 90.93 | % | $ | 130,603 |
| $ | 351 |
| ||
THRD | TF Financial Corp. of Newtown PA |
|
| 12.71 | % |
| 51.57 | % |
| 6.51 | % |
| 15.98 | % |
| 0.96 | % |
| 0.54 | % |
| 57.66 | % | $ | 38,066 |
| $ | 333 |
| ||
TSBK | Timberland Bancorp, Inc. of WA |
|
| 2.28 | % |
| 23.75 | % |
| 26.97 | % |
| 25.61 | % |
| 2.66 | % |
| 1.88 | % |
| 81.94 | % | $ | 159,564 |
| $ | 1,018 |
| ||
(1) | Financial information is for the quarter ending March 31, 2007. |
|
|
Source: | Audited and unaudited financial statements, corporate reports and offering circulars, and RP® Financial, LC. calculations. |
| The information provided in this table has been obtained from sources we believe are reliable, but we cannot |
| guarantee the accuracy or completeness of such information. |
|
|
Copyright (c) 2007 by RP® Financial, LC. | |
RP® FINANCIAL, LC.
Page 3.13
greater than the 20.8% ratio for the Company. Conversely, the Company was a more active consumer lender, with 8.3% of assets invested in consumer loans versus 1.4% percent for the Peer Group on average. The Peer Group maintained construction loan (12.6% of assets) and business loan (3.0% of assets) portfolios, while the Company was not engaged in these lending areas. Overall, the Peer Group’s more significant diversification into higher risk types of lending translated into a higher risk-weighted-assets ratio compared to the Company (70.6% versus 63.6% for the Company).
The Company maintained a minimum level of loans serviced for others at $1.3 million compared to the Peer Group’s balance of $56.1 million. It should be reiterated that a large proportion of the Company’s loans have been purchased and are serviced by others.
The Company’s credit risk exposure appears to be similar to the Peer Group, on average, based on the NPAs ratio. As shown in Table 3.5, the Company’s NPAs ratio, including accruing loans that are more than 90 days past due, equaled 0.18% of assets, which was the same as the comparable Peer Group average ratio. The Company maintained a ratio of non-performing loans/loans which was nearly equal to the Peer Group average (0.16% versus 0.17% for the Peer Group). Reserve coverage in relation to non-performing assets was less favorable for the Company, as was the Company’s reserve ratio in relation to total loans. However, reserve coverage in relation to non-performing loans was more favorable for the Company. The Company’s chargeoffs were comparable to the Peer Group’s, largely reflecting its automobile loan portfolio.
Table 3.6 reflects various key ratios highlighting the relative interest rate risk exposure of the Company and the Peer Group. From a balance sheet perspective, Kaiser Federal Financial’s higher equity position on a pro forma basis and improved pro forma IEA/IBL ratio suggest lower exposure. On a post-offering basis, these ratios should improve relative to the Peer Group.
RP ® Financial, LC.
Page 3.14
Table 3.5
Credit Risk Measures and Related Information
Kaiser Federal Financial Group, Inc. and the Comparable Group
As of June 30, 2007 or Most Recent Date Available
Institution |
| REO/ |
| NPAs & |
| NPLs/ |
| Rsrves/ |
| Rsrves/ |
| Rsrves/ |
| Net Loan |
| NLCs/ |
| ||
|
|
|
|
|
|
|
|
| |||||||||||
|
| (%) |
| (%) |
| (%) |
| (%) |
| (%) |
| (%) |
| ($000) |
| (%) |
| ||
Kaiser Federal Financial Group, Inc. |
| 0.04 | % | 0.18 | % | 0.16 | % | 0.40 | % | 245.84 | % | 193.05 | % | $ | 446 | % | 0.07 | % | |
All Public Companies |
|
|
|
|
|
|
|
|
|
|
|
|
|
|
|
|
|
| |
Averages |
| 0.09 | % | 0.60 | % | 0.61 | % | 0.84 | % | 236.18 | % | 205.29 | % | $ | 486 | % | 0.11 | % | |
Medians |
| 0.01 | % | 0.40 | % | 0.43 | % | 0.78 | % | 178.00 | % | 115.61 | % | $ | 65 | % | 0.03 | % | |
State of CA |
|
|
|
|
|
|
|
|
|
|
|
|
|
|
|
|
|
| |
Averages |
| 0.09 | % | 0.51 | % | 0.68 | % | 0.83 | % | 136.96 | % | 172.89 | % | $ | 1,978 | % | 0.12 | % | |
Medians |
| 0.01 | % | 0.46 | % | 0.67 | % | 0.72 | % | 76.56 | % | 107.20 | % | $ | 402 | % | 0.03 | % | |
Comparable Group |
|
|
|
|
|
|
|
|
|
|
|
|
|
|
|
|
|
| |
Averages |
| 0.00 | % | 0.18 | % | 0.17 | % | 0.84 | % | 164.66 | % | 244.20 | % | $ | 791 | % | 0.09 | % | |
Medians |
| 0.00 | % | 0.06 | % | 0.07 | % | 0.74 | % | 70.01 | % | 248.93 | % | $ | 6 | % | 0.00 | % | |
Comparable Group |
|
|
|
|
|
|
|
|
|
|
|
|
|
|
|
|
|
| |
BOFI | Bofi Holding, Inc. of CA |
| 0.00 | % | NA |
| NA |
| 0.28 | % | NA |
| NA |
| $ | 0 | % | 0.00 | % |
FPTB | First PacTrust Bancorp of CA |
| 0.00 | % | NA |
| NA |
| 0.65 | % | NA |
| NA |
| $ | 8 | % | 0.00 | % |
HARL | Harleysville Savings Fin. Corp. of PA |
| 0.00 | % | 0.06 | % | 0.06 | % | 0.47 | % | NA |
| 394.73 | % | $ | 3 | % | 0.00 | % |
HWFG | Harrington West Fin. Group of CA |
| 0.00 | % | 0.01 | % | NA |
| 0.80 | % | NA |
| NA |
| $ | 0 | % | 0.00 | % |
PFB | PFF Bancorp, Inc. of Pomona CA |
| 0.01 | % | 0.25 | % | 0.27 | % | 1.46 | % | 59.80 | % | 405.52 | % | $ | 7,605 | % | 0.74 | % |
PBCI | Pamrapo Bancorp, Inc. of NJ |
| 0.00 | % | 0.60 | % | 0.15 | % | 0.67 | % | 80.22 | % | 73.42 | % | $ | 0 | % | 0.00 | % |
RPFG | Rainier Pacific Fin. Group of WA |
| 0.00 | % | 0.03 | % | 0.04 | % | 1.27 | % | NA |
| NA |
| $ | 191 | % | 0.12 | % |
RVSB | Riverview Bancorp, Inc. of WA |
| 0.00 | % | 0.03 | % | 0.03 | % | 1.30 | % | NA |
| NA |
| $ | 75 | % | -0.01 | % |
THRD | TF Financial Corp. of Newtown PA |
| 0.00 | % | 0.42 | % | 0.56 | % | 0.57 | % | 57.40 | % | 103.13 | % | $ | 20 | % | 0.02 | % |
TSBK | Timberland Bancorp, Inc. of WA |
| 0.01 | % | 0.06 | % | 0.07 | % | 0.90 | % | 461.20 | % | NA |
| $ | 3 | % | 0.00 | % |
(1) | Financial information is for the quarter ending March 31, 2007. |
|
|
Source: | Audited and unaudited financial statements, corporate reports and offering circulars, and RP® Financial, LC. calculations. The information provided in this table has been obtained from sources we believe are reliable, but we cannot guarantee the accuracy or completeness of such information. |
|
|
Copyright (c) 2007 by RP® Financial, LC. | |
RP ® Financial, LC.
Page 3.15
Table 3.6
Interest Rate Risk Measures and Net Interest Income Volatility
Kaiser Federal Financial Group, Inc. and the Comparable Group
As of June 30, 2007 or Most Recent Date Available
|
|
| Balance Sheet Measures |
| Quarterly Change in Net Interest Income |
| ||||||||||||||
|
|
|
|
| ||||||||||||||||
Institution |
| Equity/ |
| IEA/ |
| Non-Earn. |
| 6/30/2007 |
| 3/31/2007 |
| 12/31/2006 |
| 9/30/2006 |
| 6/30/2006 |
| 3/31/2006 |
| |
|
|
|
|
|
|
|
|
|
| |||||||||||
|
| (%) |
| (%) |
| (%) |
| (change in net interest income is annualized in basis points) |
| |||||||||||
Kaiser Federal Financial Group, Inc. |
| 11.0 | % | 109.6 | % | 3.4 | % | 1 |
| 6 |
| -20 |
| -3 |
| -1 |
| 2 |
| |
All Public Companies |
| 11.3 | % | 110.0 | % | 5.6 | % | 1 |
| 0 |
| -8 |
| -6 |
| -3 |
| -2 |
| |
State of CA |
| 8.0 | % | 106.5 | % | 3.9 | % | -4 |
| 6 |
| -3 |
| -6 |
| -2 |
| 20 |
| |
Comparable Group |
|
|
|
|
|
|
|
|
|
|
|
|
|
|
|
|
|
|
| |
Averages |
| 8.6 | % | 106.3 | % | 4.4 | % | -6 |
| -1 |
| -8 |
| -9 |
| -3 |
| 1 |
| |
Medians |
| 9.0 | % | 106.6 | % | 4.3 | % | -6 |
| 0 |
| -10 |
| -11 |
| -2 |
| -1 |
| |
Comparable Group |
|
|
|
|
|
|
|
|
|
|
|
|
|
|
|
|
|
|
| |
BOFI | Bofi Holding, Inc. of CA |
| 7.7 |
| 106.9 | % | 1.8 | % | -4 |
| 12 |
| -2 |
| -6 |
| -13 |
| 2 |
|
FPTB | First PacTrust Bancorp of CA |
| 10.8 |
| 108.7 | % | 3.9 | % | -12 |
| 8 |
| -11 |
| -12 |
| -9 |
| -4 |
|
HARL | Harleysville Savings Fin. Corp. of PA |
| 6.3 |
| 103.9 | % | 3.7 | % | -7 |
| 7 |
| -12 |
| -11 |
| 1 |
| 11 |
|
HWFG | Harrington West Fin. Group of CA |
| 5.5 |
| 102.3 | % | 4.6 | % | 1 |
| 7 |
| -9 |
| -1 |
| -2 |
| 7 |
|
PFB | PFF Bancorp, Inc. of Pomona CA |
| 8.3 |
| 107.2 | % | 2.5 | % | -3 |
| -4 |
| -12 |
| -23 |
| -2 |
| 16 |
|
PBCI | Pamrapo Bancorp, Inc. of NJ |
| 9.2 |
| 109.5 | % | 1.8 | % | -12 |
| -4 |
| -19 |
| -11 |
| -11 |
| -3 |
|
RPFG | Rainier Pacific Fin. Group of WA |
| 9.6 |
| 106.0 | % | 5.3 | % | NA |
| NA |
| -4 |
| 8 |
| -21 |
| -3 |
|
RVSB | Riverview Bancorp, Inc. of WA |
| 8.8 |
| 105.2 | % | 8.7 | % | -10 |
| -6 |
| -2 |
| -17 |
| 4 |
| -4 |
|
THRD | TF Financial Corp. of Newtown PA |
| 9.3 |
| 107.0 | % | 5.0 | % | -6 |
| -29 |
| 2 |
| -5 |
| 7 |
| -15 |
|
TSBK | Timberland Bancorp, Inc. of WA |
| 10.7 |
| 106.3 | % | 6.9 | % | 1 |
| 0 |
| -13 |
| -10 |
| 13 |
| 1 |
|
(1) Financial information is for the quarter ending March 31, 2007. | |
NA=Change is greater than 100 basis points during the quarter. | |
|
|
Source: | Audited and unaudited financial statements, corporate reports and offering circulars, and RP® Financial, LC. calculations. The information provided in this table has been obtained from sources we believe are reliable, but we cannot guarantee the accuracy or completeness of such information. |
|
|
Copyright (c) 2007 by RP® Financial, LC. | |
RP® FINANCIAL, LC.
Page 3.16
To analyze interest rate risk associated with the net interest margin, we also reviewed quarterly changes in net interest income as a percent of average assets for Kaiser Federal Financial and the Peer Group. In general, the recent relative fluctuations in the Company’s net interest income to average assets ratios were considered to be slightly greater than the Peer Group average, and thus, based on the interest rate environment that prevailed during the period analyzed in Table 3.6, Kaiser Federal Financial was viewed as maintaining a similar to modestly greater degree of interest rate risk exposure in the net interest margin. However, the Company’s net interest income ratio should be stabilized to some degree following the Offering, given the initial expected proceeds reinvestment strategy (primarily short-to-intermediate term investment securities).
Based on the above analysis, RP Financial concluded that the Peer Group forms a reasonable basis for determining the pro forma market value of Kaiser Federal Financial. In those areas where differences exist, these will be addressed in the form of valuation adjustments in the next section.
RP® FINANCIAL, LC.
Page 4.1
This chapter presents the valuation analysis and methodology used to determine Kaiser Federal Financial’s estimated pro forma market value of the common stock to be issued in conjunction with the Second Step Conversion transaction. The valuation incorporates the appraisal methodology promulgated by the Federal and state banking agencies for standard conversions and mutual holding company offerings, particularly regarding selection of the Peer Group, fundamental analysis on both the Company and the Peer Group, and determination of the Company’s pro forma market value utilizing the market value approach.
The OTS written appraisal guidelines, originally released in October 1983 and updated in late-1994, and adopted by the FDIC, specify the market value methodology for estimating the pro forma market value of an institution. The valuation methodology provides for: (1) the selection of a peer group of comparable publicly-traded institutions, excluding from consideration institutions which have recently converted, subject to acquisition or in MHC form; (2) a financial and operational comparison of the subject company to the selected peer group, identifying key differences and similarities; and (3) a valuation analysis in which the pro forma market value of the subject company is determined based on the market pricing of the peer group as of the date of valuation, incorporating valuation adjustments for key differences. In addition, the pricing characteristics of recent conversions, both at conversion and in the aftermarket, must be considered.
RP Financial Approach to the Valuation
The valuation analysis herein complies with such regulatory approval guidelines. Accordingly, the valuation incorporates a detailed analysis based on the Peer Group, discussed in Chapter III, which constitutes “fundamental analysis” techniques. Additionally, the valuation incorporates a “technical analysis” of recently completed stock conversions, including closing pricing and aftermarket trading of such offerings. It should be noted that these valuation
RP® FINANCIAL, LC.
Page 4.2
analyses cannot possibly fully account for all the market forces which impact trading activity and pricing characteristics of a particular stock on a given day.
The pro forma market value determined herein is a preliminary value for the Company’s to-be-issued stock. Throughout the Second Step Conversion process, RP Financial will: (1) review changes in Kaiser Federal Financial’s operations and financial condition; (2) monitor Kaiser Federal Financial’s operations and financial condition relative to the Peer Group to identify any fundamental changes; (3) monitor the external factors affecting value including, but not limited to, local and national economic conditions, interest rates, and the stock market environment, including the market for thrift stocks; and (4) monitor pending conversion offerings (including those in the offering phase), both regionally and nationally. If material changes should occur during the Second Step Conversion process, RP Financial will evaluate if updated valuation reports should be prepared reflecting such changes and their related impact on value, if any. RP Financial will also prepare a final valuation update at the closing of the Offering to determine if the prepared valuation analysis and resulting range of value continues to be appropriate.
The appraised value determined herein is based on the current market and operating environment for the Company and for all thrifts. Subsequent changes in the local and national economy, the legislative and regulatory environment, the stock market, interest rates, and other external forces (such as natural disasters or major world events), which may occur from time to time (often with great unpredictability) may materially impact the market value of all thrift stocks, including Kaiser Federal Financial’s value, or Kaiser Federal Financial’s value alone. To the extent a change in factors impacting the Company’s value can be reasonably anticipated and/or quantified, RP Financial has incorporated the estimated impact into the analysis.
A fundamental analysis discussing similarities and differences relative to the Peer Group was presented in Chapter III. The following sections summarize the key differences between the Company and the Peer Group and how those differences affect the pro forma valuation. Emphasis is placed on the specific strengths and weaknesses of the Company relative to the Peer Group in such key areas as financial condition, profitability, growth and viability of earnings,
RP® FINANCIAL, LC.
Page 4.3
asset growth, primary market area, dividends, liquidity of the shares, marketing of the issue, management, and the effect of government regulations and/or regulatory reform. We have also considered the market for thrift stocks, including the market for new issues, to assess the impact on value of Kaiser Federal Financial coming to market at this time.
The financial condition of an institution is an important determinant in pro forma market value, because investors typically look to such factors as asset/liability composition, credit risk profile, balance sheet liquidity and equity levels in assessing investment attractiveness. The similarities and differences in the Company’s and the Peer Group’s financial strength are noted as follows:
| • | Overall A/L Composition. The Company’s asset composition includes a higher proportion of loans overall, with both residential mortgage loans and consumer loans exceeding the Peer Group average. The Peer Group was modestly more diversified in the areas of construction and commercial lending, including both commercial mortgage and C&I lending. Notwithstanding the higher ratio of total loans to assets, the Company’s net interest income ratio is below the Peer Group attributable to the comparatively lower loan yields given the loan mix. The Company relies more heavily on borrowed funds, which has supported its faster asset growth rate. The Company’s favorable ratio of IEA/IBL will improve on a post-Offering basis, thereby increasing its current advantage. One distinct disadvantage relative to the Peer Group should be noted – that is, the Company has limited contact with many of its loan customers given the high proportion of purchased loans, thus providing limited opportunity to cross-sell. |
|
|
|
| • | Credit Risk Profile. The Company’s credit risk profile appears to be similar based on a comparable NPAs/assets ratio relative to the Peer Group average. However, there are some offsetting risk factors for the Company, including lower reserve coverage ratios, both in terms of reserve coverage to loans and NPAs. |
|
|
|
| • | Balance Sheet Liquidity. The Company currently maintains a lower level of cash, investments and MBS, although this will be reversed on a post-Offering basis. Unlike the Peer Group, on average, the majority of the Company’s investments are designated HTM, which limits balance sheet liquidity; although, since the investments are shorter duration MBS and CMOs, there is good cashflow. The Company’s borrowing capacity is considered to be modestly lower relative to the Peer Group’s borrowings capacity, given the Company’s higher level of borrowings. |
RP® FINANCIAL, LC.
Page 4.4
| • | Equity. The Company operates with a higher pre-Offering tangible equity level than the Peer Group (11.0% and 8.6% of assets, respectively). Following the Offering, the Company’s increased tangible equity ratio implies greater leverage capacity, lower dependence on interest-bearing liabilities to fund assets and a greater capacity to absorb unanticipated losses. At the same time, the Company’s higher pro forma equity position will depress its pro forma return on equity. |
On balance, we have made no adjustment for the Company’s financial condition on a pro forma basis relative to the Peer Group.
2. Profitability, Growth and Viability of Earnings
Earnings and profitability (percent of average assets) are key factors in determining pro forma market value, as the level and risk characteristics of an institution’s earnings stream and the prospects and ability to generate future earnings heavily influence the multiple the investment community will pay for earnings. The major factors considered in the valuation are described below.
| • | Reported Profitability. The Company’s profitability was modestly lower than the Peer Group average for the most recent 12 months, primarily reflecting its comparatively weaker net interest income ratio, which was only partially offset by its more favorable operating expense and non-interest income ratios. The net reinvestment benefit of the Offering proceeds into interest-earning assets should partially offset this disadvantage. |
|
|
|
| • | Core Profitability. Non-operating items were negligible for both the Company and the Peer Group and, thus, Kaiser Federal Financial’s core profitability remained at a modest disadvantage in comparison to the Peer Group average. |
|
|
|
| • | Interest Rate Risk. Quarterly changes in the net interest income ratio indicate a slightly greater degree of volatility for the Company. The net reinvestment benefit of the Offering proceeds is anticipated to eliminate some of the Company’s greater volatility. On balance, we considered interest rate risk to be a neutral factor in the earnings valuation adjustment. |
|
|
|
| • | Credit Risk. Loan loss provisions had a limited impact on the Company’s and Peer Group’s profitability for the past year and both had similar levels of NPAs. At the same time, the Company’s reserve ratios fall below the Peer Group averages in relation to total loans and NPAs. While the Company maintains a lower risk weighted assets ratio, the Company has experienced a comparable level of chargeoffs. We considered credit risk to be a neutral factor in the earnings valuation adjustment. |
RP® FINANCIAL, LC.
Page 4.5
| • | Earnings Growth Potential. Several factors were considered in assessing earnings growth potential. First, the Company’s earnings growth potential increases on a post-Offering basis given the increased leverage capacity and reinvestment benefits. Second, while the Company has been expanding its financial services centers, the balance sheet growth advantage has been attributable to borrowings. Third, the majority of the Company’s recent loan portfolio increase has been attributable to purchases, and since these loans are serviced by others, the Company has far less potential to cross-sell and emphasize relationship banking than the Peer Group companies. Fourth, given the Company’s continuing dependency on Kaiser Permanente affiliations and more limited loan origination platform, the Company faces cultural issues in seeking to expand through mergers. |
|
|
|
| • | Return on Equity. The Company’s pro forma equity position will considerably exceed the Peer Group average. Coupled with the modestly lower pro forma core ROA, the Company’s pro forma core ROE is anticipated to be much lower than the Peer Group average. |
Overall, we concluded that a slight downward adjustment for profitability, growth and viability of earnings was appropriate.
The Company’s recent asset growth exceeded the Peer Group average, reflecting the Company’s efforts to support earnings through leveraging equity, through retail means but also by purchasing loans funded by borrowings. The Company’s retail growth has been consistent with the Peer Group. The Company’s stronger equity position and desire to increase return on equity have been key factors leading to the decision to utilize wholesale funding and purchase loans. From a franchise perspective the wholesale funding/loan purchase strategy is less valuable than the retail growth. On a pro forma basis, the Company’s higher pro forma equity position will facilitate the ability for continued strong growth. On balance, we believe a slight upward adjustment was warranted for this factor.
The general condition of an institution’s market area has an impact on value, as future success is in part dependent upon opportunities for profitable activities in the local market served. Operating in Los Angeles, San Bernardino, and Riverside Counties in southern
RP® FINANCIAL, LC.
Page 4.6
California and Santa Clara County in northern California, the Company faces significant competition for loans and deposits from larger financial institutions, which provide a broader array of services and have significantly larger branch networks. Demographic and income trends and characteristics in the Company’s primary market area are generally consistent to the primary market areas served by the Peer Group companies on the whole, and four of the Peer Group companies operate in the same market area (see Table 4.1). The deposit market share exhibited by the Company was relatively smaller than the Peer Group average in their respective primary market areas (0.2% for the Company versus 5.3% for the Peer Group), but the majority of the Peer Group companies were in comparatively smaller markets. Unemployment rates in Kaiser Federal Financial’s market were above the average and medians for the Peer Group’s markets. On balance, we concluded that no adjustment was appropriate for the Company’s market area.
Kaiser Federal Financial has indicated its preliminary intent to pay dividends in an amount such that current minority shareholders of Kaiser Federal Financial will continue to receive the same total cash dividend payment, with the per share dividend amount adjusted for the exchange ratio in the Second Step Conversion. At the current midpoint valuation, the annual dividend payment would equal $0.27 per share and provide a yield of 2.7% based on the $10.00 per share initial Offering price (i.e., reflects the stated intent to maintain the current dividend of $0.40 per share adjusted for the exchange ratio to minority shareholders). However, future declarations of dividends by the Board of Directors will depend upon a number of factors, including investment opportunities, growth objectives, financial condition, profitability, tax considerations, minimum capital requirements, regulatory limitations, stock market characteristics and general economic conditions.
Nine out of the ten of the Peer Group companies pay regular cash dividends, with implied dividend yields ranging from 1.61% to 5.08%. The average dividend yield on the stocks of the Peer Group institutions was 3.1% as of August 31, 2007, representing an average payout ratio of 37.9% of core earnings. As of August 31, 2007, approximately 88% of all fully-converted publicly-traded thrifts had adopted cash dividend policies (see Exhibit IV-1) exhibiting an
RP ® Financial, LC.
Page 4.7
Table 4.1
Kaiser Federal Financial Group, Inc.
Peer Group Market Area Comparative Analysis
|
|
|
|
| Estimated |
| Projected |
| Estimated |
| Projected |
| Per Capita |
| 6/30/06 |
| Unemployment |
| |||||||||||||
|
|
|
|
|
|
|
|
|
|
|
| ||||||||||||||||||||
Institution |
| Headquarters |
| 2000 |
| 2007 |
|
|
|
| Amount |
| % State |
|
|
| |||||||||||||||
|
|
|
|
|
|
|
|
|
|
| |||||||||||||||||||||
|
|
|
|
|
| (000) |
|
| (000) |
|
| (000) |
|
|
|
|
|
|
|
|
|
|
|
|
|
|
|
|
|
|
|
PFF Bancorp, Inc. of CA |
|
| Los Angeles |
|
| 9,519 |
|
| 10,111 |
|
| 10,454 |
|
| 6.22 | % |
| 3.39 | % | $ | 26,078 |
|
| 90.19 | % |
| 0.53 | % |
| 4.9 | % |
Harrington West Fin. Group of CA |
|
| Santa Barbara |
|
| 399 |
|
| 422 |
|
| 439 |
|
| 5.75 | % |
| 3.85 | % | $ | 29,256 |
|
| 101.18 | % |
| 3.21 | % |
| 4.2 | % |
Rainier Pacific Fin. Group of WA |
|
| Pierce |
|
| 701 |
|
| 783 |
|
| 843 |
|
| 11.71 | % |
| 7.62 | % | $ | 27,259 |
|
| 91.00 | % |
| 5.37 | % |
| 4.7 | % |
Bofi Holding, Inc. of CA |
|
| San Diego |
|
| 2,814 |
|
| 3,064 |
|
| 3,192 |
|
| 8.90 | % |
| 4.18 | % | $ | 29,468 |
|
| 101.91 | % |
| 0.92 | % |
| 4.6 | % |
Riverview Bancorp, Inc. of WA |
|
| Clark |
|
| 345 |
|
| 419 |
|
| 481 |
|
| 21.48 | % |
| 14.62 | % | $ | 28,092 |
|
| 93.78 | % |
| 11.26 | % |
| 5.3 | % |
First PacTrust Bancorp of CA |
|
| San Diego |
|
| 2,814 |
|
| 3,064 |
|
| 3,192 |
|
| 8.90 | % |
| 4.18 | % | $ | 29,468 |
|
| 101.91 | % |
| 0.92 | % |
| 4.6 | % |
Harleysville Savings Fin. Cp. of PA |
|
| Montgomery |
|
| 750 |
|
| 790 |
|
| 818 |
|
| 5.26 | % |
| 3.58 | % | $ | 41,542 |
|
| 150.50 | % |
| 6.81 | % |
| 3.4 | % |
TF Financial Corporation of PA |
|
| Bucks |
|
| 598 |
|
| 638 |
|
| 668 |
|
| 6.78 | % |
| 4.64 | % | $ | 37,687 |
|
| 136.54 | % |
| 1.56 | % |
| 3.7 | % |
Pamrapo Bancorp, Inc. of NJ |
|
| Hudson |
|
| 609 |
|
| 622 |
|
| 631 |
|
| 2.10 | % |
| 1.47 | % | $ | 27,379 |
|
| 77.43 | % |
| 2.17 | % |
| 5.3 | % |
Timberland Bancorp, Inc. of WA |
|
| Grays Harbor |
|
| 67 |
|
| 72 |
|
| 74 |
|
| 6.77 | % |
| 2.60 | % | $ | 21,356 |
|
| 71.29 | % |
| 19.81 | % |
| 6.2 | % |
|
|
| Averages: |
|
| 1,862 |
|
| 1,999 |
|
| 2,079 |
|
| 8.38 | % |
| 5.01 | % | $ | 29,759 |
|
| 101.57 | % |
| 5.26 | % |
| 4.7 | % |
|
|
| Medians: |
|
| 655 |
|
| 711 |
|
| 743 |
|
| 6.78 | % |
| 4.02 | % | $ | 28,674 |
|
| 97.48 | % |
| 2.69 | % |
| 4.7 | % |
Kaiser Federal Financial Group, Inc. |
|
| Los Angeles |
|
| 9,519 |
|
| 10,111 |
|
| 10,454 |
|
| 6.22 | % |
| 3.39 | % | $ | 26,078 |
|
| 90.19 | % |
| 0.16 | % |
| 4.9 | % |
|
|
| San Bernardino |
|
| 1,709 |
|
| 2,052 |
|
| 2,336 |
|
| 20.06 | % |
| 13.84 | % | $ | 20,727 |
|
| 71.68 | % |
| 0.27 | % |
| 5.4 | % |
|
|
| Santa Clara |
|
| 1,683 |
|
| 1,771 |
|
| 1,835 |
|
| 5.24 | % |
| 3.61 | % | $ | 44,815 |
|
| 154.99 | % |
| 0.12 | % |
| 4.7 | % |
|
|
| Riverside |
|
| 1,545 |
|
| 2,101 |
|
| 2,554 |
|
| 35.97 | % |
| 21.56 | % | $ | 23,110 |
|
| 79.92 | % |
| — | % |
| 5.7 | % |
(1) Total institution deposits in headquarters county as percent of total county deposits (banks and thrifts only). |
Sources: SNL, FDIC, US Dept. of Labor.
RP® FINANCIAL, LC.
Page 4.8
average yield of 2.9% and an average payout ratio of 45.3% of earnings. The dividend paying thrifts generally maintain higher than average profitability ratios, facilitating their ability to pay cash dividends.
The Company’s indicated dividend policy provides for a modestly higher yield compared to the yield provided by the Peer Group. While the Company’s implied payout ratio of 84.64% of pro forma earnings at the midpoint is above the Peer Group’s payout ratio, the Company’s ability to maintain a higher payout ratio is supported by its much higher pro forma equity ratio and expectations that the Company will seek to increase earnings through growth. Accordingly, on balance, we concluded that no adjustment was warranted for purposes of the Company’s dividend policy.
The Peer Group is by definition composed of companies that are traded in the public markets. Nine of the Peer Group companies trade on the NASDAQ system while one company is traded on the New York Stock Exchange (“NYSE”). Typically, the number of shares outstanding and market capitalization provides an indication of how much liquidity there will be in a particular stock. The market capitalization of the Peer Group companies ranged from $57.1 million to $410.3 million as of August 31, 2007, with average and median market values of $126.9 million and $95.2 million, respectively. The shares issued and outstanding to the public shareholders of the Peer Group members ranged from 2.9 million to 23.4 million, with average and median shares outstanding equaling 7.9 million and 6.1 million, respectively. The Company’s pro forma market value and shares outstanding for the Company will exceed the Peer Group average and median, as well as the majority of the Peer Group companies individually. Accordingly, we have not applied an adjustment for this factor.
We believe that four separate markets need to be considered for thrift stocks such as the Company coming to market: (1) the after-market for public companies, in which trading activity is regular and investment decisions are made based upon financial condition, earnings, capital, ROE, dividends and future prospects; (2) the new issue market in which converting thrifts are
RP® FINANCIAL, LC.
Page 4.9
evaluated on the basis of the same factors, but on a pro forma basis without the benefit of prior operations as a fully-converted publicly-held company and stock trading history; (3) the acquisition market for thrift franchises in California; and (4) the market for the public stock of the Company. All of these markets were considered in the valuation of the Company’s to-be-issued stock.
The value of publicly-traded thrift stocks is easily measurable, and is tracked by most investment houses and related organizations. Exhibit IV-1 provides pricing and financial data on all publicly-traded thrifts. In general, thrift stock values react to market stimuli such as interest rates, inflation, perceived industry health, projected rates of economic growth, regulatory issues and stock market conditions in general. Exhibit IV-2 displays historical stock market trends for various indices and includes historical stock price index values for thrifts and commercial banks. Exhibit IV-3 displays historical stock price indices for thrifts only.
In terms of assessing general stock market conditions, the performance of the overall stock market has been mixed over the past year. Stocks traded in a narrow range before strengthening at the end of August 2006 and into early-September, as oil prices dropped below $70 a barrel for the first time in two months and the unemployment rate for August dropped to 4.7%. The Dow Jones Industrial Average moved to a four-month high in mid-September, with further declines in oil prices and the Federal Reserve’s decision to leave rates unchanged helping to sustain the positive trend. Stocks retreated modestly heading into late-September, as investors reacted negatively to an economic report showing a slow down in business activity in the Mid-Atlantic region. Lower oil prices and a strong consumer sentiment report helped stocks to rally at the close of the third quarter.
The broader stock market rally was sustained into the fourth quarter of 2006, as the DJIA moved to an all-time high in early-October. Lower oil prices and growing expectations that the next move by the Federal Reserve would be to cut rates extended the stock market rally into mid-October, with the DJIA approaching the 12000 market. The DJIA closed above 12000 heading into late-October 2006, with optimism about corporate earnings, the Federal Reserve’s decision to hold rates steady and lower oil prices sustaining the rally. Despite a slight pullback at
RP® FINANCIAL, LC.
Page 4.10
the end of October, the 3.4% gain in DJIA for October was the best monthly gain since November 2005. Stocks continued to edge lower at the beginning of November, but then rebounded strongly in mid-November. Favorable inflation data reflected in wholesale and consumer prices for October, merger news and upbeat comments by the Federal Reserve about interest rates were factors that contributed to rally in the broader market. Stocks traded in a narrow range ahead of the holiday shopping season in late-November. After posting a big one day loss in late-November on concerns about retail sales, lower oil prices, merger news and favorable economic reports provided a boost to stocks in early-December. The DJIA traded to record highs in mid- and late-December, as stocks benefited from some robust economic reports and investors betting on a strong finish for the year.
Lower oil prices helped to sustain the positive trend in stocks at the start of 2007, which was followed by a mild pullback due to weakness in technology stocks. Optimism about the economy and some favorable earnings reports helped to lift the DJIA to a record high heading into late-January 2007, which was followed by a one day sell-off on a weak housing report and concerns about higher rates. Stocks surged higher at the end of January 2007, as the Federal Reserve concluded its late-January meeting with no change in rates. The broader stock market traded in a narrow range in early-February and then the DJIA rallied to a new record in mid-February. Comments by the Federal Reserve Chairman that helped to alleviate concerns of higher rates, as well as lower oil prices, were factors that contributed to the mid-February rally. Comparatively, higher oil prices contributed to a downturn in stocks heading into late-February. A sell-off in China’s stock market turned into a global market sell-off, as the DJIA plunged over 400 points on February 27th.
Stocks recovered some of the losses from the one day sell-off in early-March 2007, as the broader stock market benefited from a rebound in China’s stock market. Mounting troubles for subprime mortgage lenders and weak economic data fueled a sharp downturn in the broader stock market in mid-March, reflecting concerns that rising subprime mortgage delinquencies would filter into the broader economy. Following the sell-off, merger announcements, rallies in overseas markets and a drop in oil prices supported a rebound in the broader stock market ahead of the March meeting of the Federal Reserve. The Federal Reserve’s decision to hold rates steady strengthened the stock market rebound, as investors were buoyed by
RP® FINANCIAL, LC.
Page 4.11
the Federal Reserve’s assessment that the economy continued to expand at a moderate pace. Stocks fluctuated at the close of the first quarter on mixed economic data.
Signs of an improving housing market provided a boost to the stock market at the start of the second quarter 2007, with news of an increase in an index of pending existing home sales during February supporting a one-day gain of more than 120 points in the DJIA. News of Iran’s release of British hostages, lower oil prices and a favorable March employment report also contributed to the broader market gains in early-April. The broader market rally continued through most of April, as merger news and strong corporate profits lifted the DJIA above a close of 13000 in late-April. For the month of April, the DJIA closed up 5.7%. Stronger than expected manufacturing data and lower oil prices helped to propel the DJIA to five consecutive record highs in early-May. Following a sharp one day sell-off on a weak retail sale report for April, the positive trend in the broader stock market continued into mid-May. A new wave of corporate deals, lower oil prices and a stronger than expected reading for May consumer confidence was noted factors that held to sustain the rally. Stocks eased lower in late-May reflecting profit taking and concerns about a pullback in China’s stock market. Inflation worries and higher rates pushed stocks lower in early-June, while a strong retail sales report for May triggered a rebound in the stock market in mid-June. Stocks generally traded lower in the second half in June on continued inflation concerns, as well as higher oil prices and weakness in the housing market.
The broader stock market showed a positive trend at the start of third quarter of 2007, with the DJIA closing at record highs in mid-July. A positive report on manufacturing activity in June, healthy job growth reflected in the June employment report and merger news contributed to the stock market rally. A favorable second quarter earnings report by IBM helped the DJIA close above the 14000 mark heading into late-July, which was followed a general downturn in stock during late-July and early-August. Stocks were driven lower by fears that the housing slump was spreading to the broader economy and concerns of a widening credit crunch prompted by home mortgage lender cutting off credit or raising rates for a growing number of borrowers. The stock market turned highly volatile in mid-August, reflecting mixed economic news and the ongoing fallout from the credit crisis. Volatility in the stock market continued to prevail through the end of August, based on concerns about the impact of the credit crunch on
RP® FINANCIAL, LC.
Page 4.12
the economy and speculation about whether or not the Federal Reserve would cut rates at the September meeting. As an indication of the general trends in the nation’s stock markets over the past year, as of August 31, 2007 the DJIA closed at 13357.74 an increase of 17.4% from one year ago and an increase of 7.2% year-to-date, and the NASDAQ closed at 2596.36 an increase of 18.9% from one year ago and an increase of 7.5% year-to-date. The Standard & Poors 500 Index closed at 1473.99 on August 31 2007 an increase of 13.1% from one year ago and an increase of 3.9% year-to-date.
The market for thrift stocks has been mixed during the past twelve months, but, in general, thrift stocks have underperformed the broader stock market. Thrift stocks trended lower in late-August 2006 reflecting concerns of a slowdown in housing, while a favorable August employment report provided a boost to the thrift sector at the beginning of September. Inflationary fears prompted a brief sell-off in thrift stocks heading into mid-September, which was followed by a rebound as falling oil prices benefited stocks in general.
Thrift stocks advanced at the start of the fourth quarter of 2006, based on economic data that suggested the economy was slowing and comments from the Federal Reserve Chairman that raised hopes of a decline in short-term interest rates. Acquisition news and strength in the broader market sustained the upward trend in thrift stocks into mid-October. Thrift stocks sold off with the broader market at the end of October and into early-November, as economic data showing slower growth raised concerns for some investors. Strength in the broader market supported a rebound in thrift stocks ahead of the national elections. Favorable inflation data boosted thrifts stocks along with the broader market in mid-November. Weaker than expected housing data pressured thrift stocks lower heading into late-November. Merger news, including Bank of New York’s announced merger with Mellon Financial Corp., sparked gains in thrift stocks in early-December 2006. Thrift stocks traded in a narrow range through mid-December, as the Federal Reserve left interest rates unchanged as expected. An upbeat report on home sales helped thrift and bank stocks participate in the broader market rally in late-December.
Thrift stocks traded lower at the beginning of 2007, as a favorable employment report for December reduced expectations of the Federal Reserve cutting interest rates. Mixed fourth quarter earnings reports and investor nervousness ahead of the Federal Reserve meeting
RP® FINANCIAL, LC.
Page 4.13
provided for a choppy trading market for thrift issues in mid- and late-January. Thrift stocks posted gains in late-January and early-February, as thrift investors reacted favorably to the Federal Reserve’s decision to hold rates steady. While the DJIA moved to a new high in mid-February, thrift stocks traded in a narrow range heading into late-February. The late-February sell-off triggered by the downturn in China’s stock market hit thrift stocks as well. Selling pressure in thrift stocks increased during the first half of March, as mortgage lenders in general were hurt by the deterioration in market conditions for subprime mortgage lenders. In mid-March, the Mortgage Bankers Association reported that subprime mortgage delinquencies rose to a four year high during the fourth quarter of 2006. Thrift stocks participated in the broader stock market rally following the Federal Reserve’s decision to hold rates steady at its March meeting, based on expectations that the economy would continue to expand at a moderate pace. Thrift stocks pulled back in late-March, as lenders were hurt by news that sales of new homes fell for the second straight month in February and consumer confidence dropped in March.
A favorable report on February pending existing home sales sparked gains in thrift stocks at the start of the second quarter of 2007. In contrast to the broader market, thrift stocks trended lower in mid-April as a weak housing market and the overhang of problems in the subprime lending market continued to weigh on the thrift sector. Some positive earnings reports helped to boost thrift stocks heading into the second half of April, but the rally did not match gains posted in the broader market. A late-April report showing a decline in home sales in March served to dampen enthusiasm for thrift stocks, while news of Bank of America’s $21 billion proposed acquisition of LaSalle Bank Corp. had little impact on trading activity among thrift and bank stocks. Thrift stocks headed higher along with the broader stock market in early-May, but did not sustain the upward momentum into mid-May. A disappointing report on the outlook for the housing market weighed on the thrift sector in mid-May, with the National Association of Home Builders report projecting that home sales and housing production would not begin to improve until late in 2007. Merger news provided a boost to thrift stocks heading into late-May, but the gains were not sustained as thrift stocks traded lower on news of stronger than expected economic data and higher interest rates. A favorable employment report for May boosted thrift stocks at the start of June, which was followed by a general downturn in thrift
RP® FINANCIAL, LC.
Page 4.14
stocks going into mid-June on higher interest rates. Higher interest rates and lackluster housing data furthered the downward trend in thrift stocks during the second half of June.
The thrift sector continued to struggle at the beginning of the third quarter of 2007 on earnings worries and the widening meltdown in the subprime market as Standard & Poor and Moody’s announced plans to downgrade securities backed by subprime mortgages. Bargain hunting and strength in the broader market supported a brief rebound in thrift stocks in mid-July, which was followed a sharp sell off on fears of spreading subprime problems and some second quarter earnings reports showing deterioration in credit quality. A disappointing second quarter earnings report by Countrywide Financial and a larger-than-expected decline in new home sales knocked thrift equities lower in late-July. The downturn in thrift stocks continued into the beginning of August on news that American Home Mortgage Investment Corp. was shutting down operations due to liquidity problems. Thrift stocks participated in the volatility exhibited in the broader market volatility in mid-August, but, in general, the downward trend in thrift equities continued during the first half of August. Thrift equities benefited from the mid-August discount rate cut by the Federal Reserve and then fluctuated along with the broader market through the end of August based on speculation over the outcome of the Federal Reserve’s next meeting. On August 31, 2007, the SNL Index for all publicly-traded thrifts closed at 1,537.5 a decrease of 8.8% from one year ago and a decrease of 16.0% year-to-date. The SNL MHC Index closed at 3,516.6 on August 31, 2007, an increase of 4.1% from one year ago and a decrease of 9.2% year-to-date.
In addition to thrift stock market conditions in general, the new issue market for converting thrifts is also an important consideration in determining the Company’s pro forma market value. The new issue market is separate and distinct from the market for seasoned thrift issues in that the pricing ratios for converting issues are computed on a pro forma basis, specifically: (1) the numerator and denominator are both impacted by the conversion offering amount, unlike existing stock issues in which price change affects only the numerator; and (2) the pro forma pricing ratio incorporates assumptions regarding source and use of proceeds, effective tax rates, stock plan purchases, etc. which impact pro forma financials, whereas pricing
RP® FINANCIAL, LC.
Page 4.15
for existing issues are based on reported financials. The distinction between pricing of converting and existing issues is perhaps no clearer than in the case of the price/book (“P/B”) ratio in that the P/B ratio of a converting thrift will typically result in a discount to tangible book value whereas in the current market for existing thrifts the P/B ratio often reflects a premium to book value. Therefore, it is appropriate to also consider the market for new issues, both at the time of the conversion and in the aftermarket.
The market for converting thrift issues has weakened over the past several quarters. In contrast to the new issue market prevailing through 2006 and into early 2007, the selloff in the broader market has translated into a weakening of the thrift IPO market. In this regard, fewer offerings have been oversubscribed and all but one of the thrift conversion offerings (all transaction structures) were trading below their IPO prices as of August 31, 2007.
As shown in Table 4.2, two standard and three mutual holding company offerings were completed during the past three months. However, second-step conversion offerings are considered to be more relevant for our analysis, and only one was completed over the last three months. In general, second-step conversions tend to be priced (and trade in the aftermarket) at a higher P/B ratio than standard conversions. We believe investors take into consideration the generally more leveraged pro forma balance sheets of second-step companies, their track records as public companies prior to conversion, and their generally higher pro forma ROE measures relative to standard conversions in pricing their common stocks.
As indicated at the beginning of this chapter, RP Financial’s analysis of recent conversion offering pricing characteristics at closing and in the aftermarket has been limited to a “technical” analysis and, thus, the pricing characteristics of recent conversion offerings can not be a primary determinate of value. Particular focus was placed on the P/TB approach in this analysis, since the P/E multiples do not reflect the actual impact of reinvestment and the source of the stock proceeds (i.e., external funds vs. deposit withdrawals).
Abington Bancorp, Inc. of Pennsylvania converted to full stock form in June 2007 at a pro forma P/TB ratio of 102.9% and a pro forma P/E ratio of 27.2 times. During their first week of trading as a fully-converted company, the stock price of Abington Bancorp decreased by 1.6% from its IPO price, and by 7.5% over the first month of trading. As of August 31, 2007,
RP® Financial, LC. |
Page 4.16 |
Table 4.2
Pricing Characteristics and After-Market Trends
Recent Conversions Completed (Last Three Months)
|
| Pre-Conversion Data |
|
|
| ||||||||||||||||||||||||||
|
|
|
|
| |||||||||||||||||||||||||||
Institutional Information |
| Financial Info. |
| Asset Quality |
| Offering Information |
| ||||||||||||||||||||||||
|
|
|
| ||||||||||||||||||||||||||||
Institution |
| Conver. |
| Ticker |
| Assets |
| Equity/ |
| NPAs/ |
| Res. |
| Gross |
| % |
| % of |
| Exp./ |
| ||||||||||
|
|
|
|
|
|
|
|
|
|
| |||||||||||||||||||||
|
|
|
|
|
|
|
| ($Mil) |
| (%) |
| (%) |
| (%) |
| ($Mil.) |
| (%) |
| (%) |
| (%) |
| ||||||||
Standard Conversions |
|
|
|
|
|
|
|
|
|
|
|
|
|
|
|
|
|
|
|
|
|
|
|
|
|
|
|
|
|
|
|
Louisiana Bancorp, Inc., LA |
|
| 7/10/07 |
| LABC-NASDAQ |
| $ | 216 |
|
| 13.74 | % |
| 0.12 | % |
| 852 | % | $ | 63.5 |
|
| 100 | % |
| 120 | % |
| 2.3 | % | |
Quaint Oak Bancorp, Inc., PA*(1) |
|
| 7/5/07 |
| QNTO-OTCBB |
| $ | 61 |
|
| 7.96 | % |
| 1.46 | % |
| 64 | % | $ | 13.9 |
|
| 100 | % |
| 132 | % |
| 4.0 | % | |
Averages - Standard Conversions: |
| $ | 139 |
|
| 10.85 | % |
| 0.79 | % |
| 458 | % | $ | 38.7 |
|
| 100 | % |
| 126 | % |
| 3.1 | % | ||||||
Medians - Standard Conversions: |
| $ | 139 |
|
| 10.85 | % |
| 0.79 | % |
| 458 | % | $ | 38.7 |
|
| 100 | % |
| 126 | % |
| 3.1 | % | ||||||
Second Step Conversions |
|
|
|
|
|
|
|
|
|
|
|
|
|
|
|
|
|
|
|
|
|
|
|
|
|
|
|
|
|
|
|
Abington Bancorp, Inc., PA* |
|
| 6/28/07 |
| ABBC-NASDAQ |
| $ | 951 |
|
| 12.15 | % |
| 0.25 | % |
| 67 | % | $ | 139.7 |
|
| 57 | % |
| 87 | % |
| 3.6 | % | |
Averages - Second Step Conversions: |
| $ | 951 |
|
| 12.15 | % |
| 0.25 | % |
| 67 | % | $ | 139.7 |
|
| 57 | % |
| 87 | % |
| 3.6 | % | ||||||
Medians - Second Step Conversions: |
| $ | 951 |
|
| 12.15 | % |
| 0.25 | % |
| 67 | % | $ | 139.7 |
|
| 57 | % |
| 87 | % |
| 3.6 | % | ||||||
Mutual Holding Company Conversions |
|
|
|
|
|
|
|
|
|
|
|
|
|
|
|
|
|
|
|
|
|
|
|
|
|
|
|
|
|
|
|
FSB Community Bncshrs, Inc., NY* |
|
| 8/15/07 |
| FSBC-OTCBB |
| $ | 151 |
|
| 9.05 | % |
| 0.03 | % |
| 700 | % | $ | 8.4 |
|
| 47 | % |
| 85 | % |
| 10.2 | % | |
Beneficial Mutual Bancorp, Inc., PA* |
|
| 7/16/07 |
| BNCL-NASDAQ |
| $ | 3,483 |
|
| 11.44 | % |
| 0.50 | % |
| 207 | % | $ | 236.1 |
|
| 44 | % |
| 132 | % |
| 1.3 | % | |
Hometown Bancorp, Inc., NY |
|
| 6/29/07 |
| HTWC-OTCBB |
| $ | 124 |
|
| 7.04 | % |
| 0.39 | % |
| 167 | % | $ | 10.7 |
|
| 45 | % |
| 132 | % |
| 6.5 | % | |
Averages - Mutual Holding Company Conversions: |
| $ | 1,253 |
|
| 9.18 | % |
| 0.31 | % |
| 358 | % | $ | 85.1 |
|
| 45 | % |
| 117 | % |
| 6.0 | % | ||||||
Medians - Mutual Holding Company Conversions: |
| $ | 151 |
|
| 9.05 | % |
| 0.39 | % |
| 207 | % | $ | 10.7 |
|
| 45 | % |
| 132 | % |
| 6.5 | % | ||||||
Averages - All Conversions: |
| $ | 831 |
|
| 10.23 | % |
| 0.46 | % |
| 343 | % | $ | 78.7 |
|
| 66 | % |
| 115 | % |
| 4.7 | % | ||||||
Medians - All Conversions: |
| $ | 184 |
|
| 10.25 | % |
| 0.32 | % |
| 187 | % | $ | 38.7 |
|
| 52 | % |
| 126 | % |
| 3.8 | % | ||||||
|
|
|
|
|
|
|
|
|
|
|
|
|
| Insider Purchases |
|
|
|
| ||||||||||
|
|
|
|
|
|
|
|
|
|
|
|
|
|
|
|
|
| |||||||||||
|
|
|
|
|
|
|
|
|
|
|
|
|
| % Off Incl. Fdn |
|
|
|
|
|
|
| |||||||
|
|
|
|
|
|
|
| Contribution to |
|
|
|
|
|
|
|
| ||||||||||||
Institutional Information |
|
| Benefit Plans |
|
|
|
|
|
|
| ||||||||||||||||||
|
|
|
|
|
| Initial |
| |||||||||||||||||||||
Institution |
| Conver. |
| Ticker |
| Form |
| % of |
| ESOP |
| Recog. |
| Stk |
| Mgmt.& |
|
| ||||||||||
|
|
|
|
|
|
|
|
|
| |||||||||||||||||||
|
|
|
|
|
|
|
|
|
|
| (%) |
| (%) |
| (%) |
| (%) |
| (%)(2) |
| (%) |
| ||||||
Standard Conversions |
|
|
|
|
|
|
|
|
|
|
|
|
|
|
|
|
|
|
|
|
|
|
|
|
|
|
|
|
Louisiana Bancorp, Inc., LA |
|
| 7/10/07 |
| LABC-NASDAQ |
|
| N.A. |
|
| N.A. |
|
| 8.0 | % |
| 4.0 | % |
| 10.0 | % |
| 3.4 | % |
| 0.00 | % | |
Quaint Oak Bancorp, Inc., PA*(1) |
|
| 7/5/07 |
| QNTO-OTCBB |
|
| N.A. |
|
| N.A. |
|
| 8.0 | % |
| 4.0 | % |
| 10.0 | % |
| 6.1 | % |
| 0.00 | % | |
Averages - Standard Conversions: |
|
| N.A. |
|
| N.A. |
|
| 8.0 | % |
| 4.0 | % |
| 10.0 | % |
| 4.8 | % |
| 0.00 | % | ||||||
Medians - Standard Conversions: |
|
| N.A. |
|
| N.A. |
|
| 8.0 | % |
| 4.0 | % |
| 10.0 | % |
| 4.8 | % |
| 0.00 | % | ||||||
Second Step Conversions |
|
|
|
|
|
|
|
|
|
|
|
|
|
|
|
|
|
|
|
|
|
|
|
|
|
|
|
|
Abington Bancorp, Inc., PA* |
|
| 6/28/07 |
| ABBC-NASDAQ |
|
| N.A. |
|
| N.A. |
|
| 7.5 | % |
| 3.7 | % |
| 9.3 | % |
| 4.9 | % |
| 1.50 | % | |
Averages - Second Step Conversions: |
|
| N.A. |
|
| N.A. |
|
| 7.5 | % |
| 3.7 | % |
| 9.3 | % |
| 4.9 | % |
| 1.50 | % | ||||||
Medians - Second Step Conversions: |
|
| N.A. |
|
| N.A. |
|
| 7.5 | % |
| 3.7 | % |
| 9.3 | % |
| 4.9 | % |
| 1.50 | % | ||||||
Mutual Holding Company Conversions |
|
|
|
|
|
|
|
|
|
|
|
|
|
|
|
|
|
|
|
|
|
|
|
|
|
|
|
|
FSB Community Bncshrs, Inc., NY* |
|
| 8/15/07 |
| FSBC-OTCBB |
|
| N.A. |
|
| N.A. |
|
| 8.3 | % |
| 4.2 | % |
| 10.4 | % |
| 3.2 | % |
| 0.00 | % | |
Beneficial Mutual Bancorp, Inc., PA* |
|
| 7/16/07 |
| BNCL-NASDAQ |
|
| C/S |
|
| 500K/4.02 | % |
| 8.8 | % |
| 4.4 | % |
| 11.1 | % |
| 1.3 | % |
| 0.00 | % | |
Hometown Bancorp, Inc., NY |
|
| 6/29/07 |
| HTWC-OTCBB |
|
| N.A. |
|
| N.A. |
|
| 8.7 | % |
| 4.4 | % |
| 10.9 | % |
| 4.2 | % |
| 0.00 | % | |
Averages - Mutual Holding Company Conversions: |
|
| NA |
|
| NA |
|
| 8.6 | % |
| 4.3 | % |
| 10.8 | % |
| 2.9 | % |
| 0.00 | % | ||||||
Medians - Mutual Holding Company Conversions: |
|
| NA |
|
| NA |
|
| 8.7 | % |
| 4.4 | % |
| 10.9 | % |
| 3.2 | % |
| 0.00 | % | ||||||
Averages - All Conversions: |
|
| NA |
|
| NA |
|
| 8.2 | % |
| 4.1 | % |
| 10.3 | % |
| 3.8 | % |
| 0.25 | % | ||||||
Medians - All Conversions: |
|
| NA |
|
| NA |
|
| 8.2 | % |
| 4.1 | % |
| 10.2 | % |
| 3.8 | % |
| 0.00 | % | ||||||
|
|
|
|
|
|
|
| Pro Forma Data |
|
|
|
| ||||||||||||||||
|
|
|
|
|
|
|
|
|
|
|
| |||||||||||||||||
Institutional Information |
| Pricing Ratios(3) |
| Financial Charac. |
|
|
|
| ||||||||||||||||||||
|
|
|
|
|
| |||||||||||||||||||||||
Institution |
| Conver. |
| Ticker |
| P/TB |
| Core |
| P/A |
| Core |
| TE/A |
| Core |
| IPO |
| |||||||||
|
|
|
|
|
|
|
|
|
| |||||||||||||||||||
|
|
|
|
|
|
|
| (%) |
| (x) |
| (%) |
| (%) |
| (%) |
| (%) |
| ($) |
| |||||||
Standard Conversions |
|
|
|
|
|
|
|
|
|
|
|
|
|
|
|
|
|
|
|
|
|
|
|
|
|
|
|
|
Louisiana Bancorp, Inc., LA |
|
| 7/10/07 |
| LABC-NASDAQ |
|
| 75.5 | % |
| 31.5x |
|
| 23.5 | % |
| 0.7 | % |
| 31.1 | % |
| 2.4 | % | $ | 10.00 |
| |
Quaint Oak Bancorp, Inc., PA*(1) |
|
| 7/5/07 |
| QNTO-OTCBB |
|
| 84.1 | % |
| 20.3x |
|
| 19.1 | % |
| 0.9 | % |
| 22.3 | % |
| 4.2 | % | $ | 10.00 |
| |
Averages - Standard Conversions: |
|
| 79.8 | % |
| 25.9x |
|
| 21.3 | % |
| 0.8 | % |
| 26.7 | % |
| 3.3 | % | $ | 10.00 |
| ||||||
Medians - Standard Conversions: |
|
| 79.8 | % |
| 25.9x |
|
| 21.3 | % |
| 0.8 | % |
| 26.7 | % |
| 3.3 | % | $ | 10.00 |
| ||||||
Second Step Conversions |
|
|
|
|
|
|
|
|
|
|
|
|
|
|
|
|
|
|
|
|
|
|
|
|
|
|
|
|
Abington Bancorp, Inc., PA* |
|
| 6/28/07 |
| ABBC-NASDAQ |
|
| 102.9 | % |
| 27.2x |
|
| 22.8 | % |
| 0.8 | % |
| 22.1 | % |
| 3.8 | % | $ | 10.00 |
| |
Averages - Second Step Conversions: |
|
| 102.9 | % |
| 27.2x |
|
| 22.8 | % |
| 0.8 | % |
| 22.1 | % |
| 3.8 | % | $ | 10.00 |
| ||||||
Medians - Second Step Conversions: |
|
| 102.9 | % |
| 27.2x |
|
| 22.8 | % |
| 0.8 | % |
| 22.1 | % |
| 3.8 | % | $ | 10.00 |
| ||||||
Mutual Holding Company Conversions |
|
|
|
|
|
|
|
|
|
|
|
|
|
|
|
|
|
|
|
|
|
|
|
|
|
|
|
|
FSB Community Bncshrs, Inc., NY* |
|
| 8/15/07 |
| FSBC-OTCBB |
|
| 88.5 | % |
| 166.7x |
|
| 11.3 | % |
| 0.1 | % |
| 12.8 | % |
| 0.6 | % | $ | 10.00 |
| |
Beneficial Mutual Bancorp, Inc., PA* |
|
| 7/16/07 |
| BNCL-NASDAQ |
|
| 97.6 | % |
| 44.9x |
|
| 20.2 | % |
| 0.3 | % |
| 12.2 | % |
| 2.0 | % | $ | 10.00 |
| |
Hometown Bancorp, Inc., NY |
|
| 6/29/07 |
| HTWC-OTCBB |
|
| 82.6 | % |
| 23.9x |
|
| 16.6 | % |
| 0.7 | % |
| 13.1 | % |
| 4.9 | % | $ | 10.00 |
| |
Averages - Mutual Holding Company Conversions: |
|
| 89.5 | % |
| 78.5x |
|
| 16.0 | % |
| 0.3 | % |
| 12.7 | % |
| 2.5 | % | $ | 10.00 |
| ||||||
Medians - Mutual Holding Company Conversions: |
|
| 88.5 | % |
| 44.9x |
|
| 16.6 | % |
| 0.3 | % |
| 12.8 | % |
| 2.0 | % | $ | 10.00 |
| ||||||
Averages - All Conversions: |
|
| 88.5 | % |
| 52.4x |
|
| 18.9 | % |
| 0.6 | % |
| 18.9 | % |
| 3.0 | % | $ | 10.00 |
| ||||||
Medians - All Conversions: |
|
| 86.3 | % |
| 29.4x |
|
| 19.7 | % |
| 0.7 | % |
| 17.6 | % |
| 3.1 | % | $ | 10.00 |
| ||||||
|
|
|
|
|
|
|
| Post-IPO Pricing Trends |
| ||||||||||||||||||||||
|
|
|
|
|
|
|
|
| |||||||||||||||||||||||
Institutional Information |
| Closing Price: |
| ||||||||||||||||||||||||||||
|
| ||||||||||||||||||||||||||||||
Institution |
| Conver. |
| Ticker |
| First |
| % |
| After |
| % |
| After |
| % |
| Thru |
| % |
| ||||||||||
|
|
|
|
|
|
|
|
|
|
| |||||||||||||||||||||
|
|
|
|
|
|
|
| ($) |
| (%) |
| ($) |
| (%) |
| ($) |
| (%) |
| ($) |
| (%) |
| ||||||||
Standard Conversions |
|
|
|
|
|
|
|
|
|
|
|
|
|
|
|
|
|
|
|
|
|
|
|
|
|
|
|
|
|
|
|
Louisiana Bancorp, Inc., LA |
|
| 7/10/07 |
| LABC-NASDAQ |
| $ | 10.95 |
|
| 9.5 | % | $ | 10.40 |
|
| 4.0 | % | $ | 10.91 |
|
| 9.1 | % | $ | 10.86 |
|
| 8.6 | % | |
Quaint Oak Bancorp, Inc., PA*(1) |
|
| 7/5/07 |
| QNTO-OTCBB |
| $ | 9.80 |
|
| -2.0 | % | $ | 9.30 |
|
| -7.0 | % | $ | 8.90 |
|
| -11.0 | % | $ | 9.00 |
|
| -10.0 | % | |
Averages - Standard Conversions: |
| $ | 10.38 |
|
| 3.8 | % | $ | 9.85 |
|
| -1.5 | % | $ | 9.91 |
|
| -0.9 | % | $ | 9.93 |
|
| -0.7 | % | ||||||
Medians - Standard Conversions: |
| $ | 10.38 |
|
| 3.8 | % | $ | 9.85 |
|
| -1.5 | % | $ | 9.91 |
|
| -0.9 | % | $ | 9.93 |
|
| -0.7 | % | ||||||
Second Step Conversions |
|
|
|
|
|
|
|
|
|
|
|
|
|
|
|
|
|
|
|
|
|
|
|
|
|
|
|
|
|
|
|
Abington Bancorp, Inc., PA* |
|
| 6/28/07 |
| ABBC-NASDAQ |
| $ | 9.60 |
|
| -4.0 | % | $ | 9.84 |
|
| -1.6 | % | $ | 9.25 |
|
| -7.5 | % | $ | 9.59 |
|
| -4.1 | % | |
Averages - Second Step Conversions: |
| $ | 9.60 |
|
| -4.0 | % | $ | 9.84 |
|
| -1.6 | % | $ | 9.25 |
|
| -7.5 | % | $ | 9.59 |
|
| -4.1 | % | ||||||
Medians - Second Step Conversions: |
| $ | 9.60 |
|
| -4.0 | % | $ | 9.84 |
|
| -1.6 | % | $ | 9.25 |
|
| -7.5 | % | $ | 9.59 |
|
| -4.1 | % | ||||||
Mutual Holding Company Conversions |
|
|
|
|
|
|
|
|
|
|
|
|
|
|
|
|
|
|
|
|
|
|
|
|
|
|
|
|
|
|
|
FSB Community Bncshrs, Inc., NY* |
|
| 8/15/07 |
| FSBC-OTCBB |
| $ | 10.00 |
|
| 0.0 | % | $ | 10.00 |
|
| 0.0 | % | $ | 8.75 |
|
| -12.5 | % | $ | 8.75 |
|
| -12.5 | % | |
Beneficial Mutual Bancorp, Inc., PA* |
|
| 7/16/07 |
| BNCL-NASDAQ |
| $ | 9.21 |
|
| -7.9 | % | $ | 9.38 |
|
| -6.2 | % | $ | 8.70 |
|
| -13.0 | % | $ | 9.50 |
|
| -5.0 | % | |
Hometown Bancorp, Inc., NY |
|
| 6/29/07 |
| HTWC-OTCBB |
| $ | 10.00 |
|
| 0.0 | % | $ | 10.00 |
|
| 0.0 | % | $ | 8.75 |
|
| -12.5 | % | $ | 8.25 |
|
| -17.5 | % | |
Averages - Mutual Holding Company Conversions: |
| $ | 9.74 |
|
| -2.6 | % | $ | 9.79 |
|
| -2.1 | % | $ | 8.73 |
|
| -12.7 | % | $ | 8.83 |
|
| -11.7 | % | ||||||
Medians - Mutual Holding Company Conversions: |
| $ | 10.00 |
|
| 0.0 | % | $ | 10.00 |
|
| 0.0 | % | $ | 8.75 |
|
| -12.5 | % | $ | 8.75 |
|
| -12.5 | % | ||||||
Averages - All Conversions: |
| $ | 9.93 |
|
| -0.7 | % | $ | 9.82 |
|
| -1.8 | % | $ | 9.21 |
|
| -7.9 | % | $ | 9.33 |
|
| -6.8 | % | ||||||
Medians - All Conversions: |
| $ | 9.90 |
|
| -1.0 | % | $ | 9.92 |
|
| -0.8 | % | $ | 8.83 |
|
| -11.8 | % | $ | 9.25 |
|
| -7.5 | % | ||||||
Note: * - Appraisal performed by RP Financial; BOLD=RP Financial did the Conversion Business Plan. “NT” - Not Traded; “NA” - Not Applicable, Not Available; C/S-Cash/Stock.
(1) | Non-OTS regulated thrift. |
(2) | As a percent of MHC offering for MHC transactions. |
(3) | Does not take into account the adoption of SOP 93-6. |
(4) | Latest price if offering is less than one week old. |
(5) | Latest price if offering is more than one week but less than one month old. |
(6) | Mutual holding company pro forma data on full conversion basis. |
(7) | Simultaneously completed acquisition of another financial institution. |
(8) | Simultaneously converted to a commercial bank charter. |
(9) | Former credit union. |
August 31, 2007
RP® FINANCIAL, LC.
Page 4.17
Abington Bancorp was trading at a price of $9.59 per share, or 4.1% below its IPO price, at a pro forma P/TB ratio and P/Core Earnings multiple of 96.0% and 38.4 times, respectively. Kaiser Federal Financial’s midpoint pricing ratios are near parity with Abington Bancorp’s pro forma pricing at closing while Kaiser Federal Financial’s pro forma midpoint pricing ratios are at premium (6.5% premium to P/TB and 19.9% discount to the P/Core Earnings multiple) to Abington Bancorp’s pricing ratios based on its August 31, 2007, trading level.
Although less comparable to the Company given their different transaction structures, the two standard conversion offerings and two minority stock offerings by MHCs also provide insight into the current state of the new issue market. The two standard conversion offerings by Louisiana Bancorp and Quaint Oak Bancorp (Pennsylvania), respectively, were completed at an average pro forma P/TB of 79.8% and P/E multiple of 25.9 times. Demand for both issues was relatively strong, although the Louisiana Bancorp transaction was not oversubscribed closing between the maximum and supermaximum of the range taking all orders received. Quaint Oak Bancorp’s offering was oversubscribed and closed at the supermaximum of the offering range. As of August 31, 2007, Louisiana Bancorp was trading modestly above its IPO price (8.6%) while Quaint Oak Bancorp’s price had fallen by 10.0% relative to its IPO price.
Weakness is also evident in the aftermarket trading in the minority stock of recent offerings completed by MHCs. The recent offerings completed by Beneficial Mutual Bancorp (Pennsylvania) and Hometown Bancorp (New York) were oversubscribed and closed at the supermaximum of their respective offering ranges at pro forma full-converted P/TBs of 97.6% and 82.6%, respectively. FSB Community Bancshares’ offering had to be extended to close at the minimum of the offering range and, to date, the stock has only traded on one day since closing on August 15, 2007. As of August 31, 2007, both Beneficial Mutual Bancorp and Hometown Bancorp were trading below their IPO prices by 5.0% and 17.5%, respectively. FSB Community Bancshares’ stock did not trade until August 31, 2007 and closed down 17.5% from the IPO price.
In response to market weakness, the majority of the conversions just commencing their offerings faced reductions in pro forma valuations immediately prior to going effective, which such reductions falling in the 10% to 15% range generally. The results of these offerings
RP® FINANCIAL, LC.
Page 4.18
and after-market performance will be important indicators to consider in an updated valuation of the Company prior to going effective.
Also considered in the valuation was the potential impact on the Company’s stock price of recently completed and pending acquisitions of other savings institutions headquartered in California. As shown in Exhibit IV-4, there were ten thrift acquisitions completed from the beginning of 2004 through year-to-date 2007. The recent acquisition activity involving savings institutions may imply a certain degree of acquisition speculation for the Company’s stock. To the extent that acquisition speculation may impact the Company’s Offering, we have largely taken this into account in selecting companies for the Peer Group which operate in markets that have experienced a comparable level of acquisition activity as the Company’s market and, thus, are subject to the same type of acquisition speculation that may influence Kaiser Federal Financial’s stock. However, since converting thrifts are subject to a three-year regulatory moratorium from being acquired, acquisition speculation in Kaiser Federal Financial’s stock would tend to be less compared to the stocks of the Peer Group companies.
D. Trading in Kaiser Federal Financial’s Stock
Since Kaiser Federal Financial’s minority stock currently trades under the symbol “KFED” on the NASDAQ national stock market, RP Financial also considered the recent trading activity in the valuation analysis. Kaiser Federal Financial had a total of 13,948,945 shares issued and outstanding at August 31, 2007, of which 5,087,195 shares were held by public shareholders and traded as public securities. As of August 31, 2007, the Company’s closing stock price was $13.72 per share, implying an aggregate value of $191,379,525. There are significant differences between the Company’s minority stock (currently being traded) and the conversion stock that will be issued by the Company. Such differences include different liquidity characteristics (the new conversion stock will be more liquid owing to larger number of public shares available to trade) and a different return on equity for the conversion stock. Since the pro forma impact has not been publicly disseminated to date, it is appropriate to discount the current trading level. As the pro forma impact is made known publicly, the trading level will become more informative.
RP® FINANCIAL, LC.
Page 4.19
* * * * * * * * * * *
In determining our valuation adjustment for marketing of the issue, we considered trends in both the overall thrift market, the new issue market including the new issue market for second-step conversions, the acquisition market and recent trading activity in the Company’s minority stock. Taking these factors and trends into account, RP Financial concluded that a slight downward adjustment was appropriate in the valuation analysis for purposes of marketing of the issue.
Kaiser Federal Financial’s management team appears to have experience and expertise in all of the key areas of the Company’s operations. Exhibit IV-5 provides summary resumes of Kaiser Federal Financial’s Board of Directors and senior management. The financial characteristics of the Company suggest that the Board and senior management have been effective in implementing an operating strategy that can be well managed by the Company’s present organizational structure. The Company currently does not have any senior management positions that are vacant.
Similarly, the returns, capital positions, and other operating measures of the Peer Group companies are indicative of well-managed financial institutions, which have Boards and management teams that have been effective in implementing competitive operating strategies. Therefore, on balance, we concluded no valuation adjustment relative to the Peer Group was appropriate for this factor.
9. Effect of Government Regulation and Regulatory Reform
In summary, as a fully-converted federally-insured institution, Kaiser Federal Financial will operate in substantially the same regulatory environment as the Peer Group members – all of whom are well capitalized institutions and are operating with no apparent restrictions. Exhibit IV-6 reflects the Company’s pro forma regulatory capital ratios, while the Peer Group’s regulatory capital ratios were previously shown in Table 3.2. On balance, no adjustment has been applied for the effect of government regulation and regulatory reform.
RP® FINANCIAL, LC.
Page 4.20
Overall, based on the factors discussed above, we concluded that the Company’s pro forma market value should reflect the following valuation adjustments relative to the Peer Group:
| Key Valuation Parameters: |
| Valuation Adjustment |
|
| ||
| Financial Condition |
| No Adjustment |
| Profitability, Growth and Viability of Earnings |
| Slight Downward |
| Asset Growth |
| Slight Upward |
| Primary Market Area |
| No Adjustment |
| Dividends |
| No Adjustment |
| Liquidity of the Shares |
| No Adjustment |
| Marketing of the Issue |
| Slight Downward |
| Management |
| No Adjustment |
| Effect of Government Regulations and Regulatory Reform |
| No Adjustment |
In applying the accepted valuation methodology promulgated by the OTS and adopted by the FDIC, i.e., the pro forma market value approach, including the fully-converted analysis described above, we considered the three key pricing ratios in valuing the Company’s to-be-issued stock – price/earnings (“P/E”), price/book (“P/B”), and price/assets (“P/A”) approaches -- all performed on a pro forma basis including the effects of the stock proceeds. In computing the pro forma impact of the Second Step Conversion and the related pricing ratios, we have incorporated the valuation parameters disclosed in Kaiser Federal Financial’s prospectus for Offering expenses, reinvestment rate, effective tax rate and stock benefit plan assumptions (summarized in Exhibits IV-7 and IV-8).
RP Financial’s valuation placed an emphasis on the following:
| • | P/E Approach. The P/E approach is generally the best indicator of long-term value for a stock. Given the similarities between the Company’s and the Peer Group’s operating strategies, earnings composition and overall financial condition, the P/E approach was carefully considered in this valuation. At the same time, since reported earnings for both the Company and the Peer Group included certain non-recurring items, we also made adjustments to earnings to |
RP® FINANCIAL, LC.
Page 4.21
|
| arrive at core earnings estimates for the Company and the Peer Group and resulting price/core earnings ratios. |
|
|
|
| • | P/B Approach. P/B ratios have generally served as a useful benchmark in the valuation of thrift stocks, particularly in the context of a public offering, as the earnings approach involves assumptions regarding the use of proceeds. RP Financial considered the P/B approach to be a useful indicator of pro forma value, taking into account the pricing ratios under the P/E and P/A approaches. We have also modified the P/B approach to exclude the impact of intangible assets (i.e., price/tangible book value or “P/TB”), in that the investment community frequently makes this adjustment in its evaluation of this pricing approach. |
|
|
|
| • | P/A Approach. P/A ratios are generally a less reliable indicator of market value, as investors typically assign less weight to assets and attribute greater weight to book value and earnings - we have also given less weight to the assets approach. Furthermore, this approach as set forth in the regulatory valuation guidelines does not take into account the amount of stock purchases funded by deposit withdrawals, thus understating the pro forma P/A ratio. At the same time, the P/A ratio is an indicator of franchise value, and, in the case of highly capitalized institutions, high P/A ratios may limit the investment community’s willingness to pay market multiples for earnings or book value when ROE is expected to be low. |
|
|
|
| • | Trading of Kaiser Federal Financial stock. Converting institutions generally do not have stock outstanding. Kaiser Federal Financial, however, has public shares outstanding due to the mutual holding company form of ownership. Since Kaiser Federal Financial is currently traded on NASDAQ, it is an indicator of investor interest in the Company’s conversion stock and therefore received some weight in our valuation. Based on the August 31, 2007 stock price of $13.72 per share and the 13,948,945 shares of Kaiser Federal Financial stock outstanding, the Company’s implied market value of $191.4 million was considered in the valuation process. However, since the conversion stock will have different characteristics than the minority shares, and since pro forma information has not been publicly disseminated to date, the current trading price of Kaiser Federal Financial’s stock was somewhat discounted herein and may become more informative towards the closing of the Offering. |
The Company has adopted Statement of Position (“SOP”) 93-6, which causes earnings per share computations to be based on shares issued and outstanding excluding unreleased ESOP shares. For purposes of preparing the pro forma pricing analyses, we have reflected all shares issued in the Offering, including all ESOP shares, to capture the full dilutive impact, particularly
RP® FINANCIAL, LC.
Page 4.22
since the ESOP shares are economically dilutive, receive dividends and can be voted. However, we did consider the impact of SOP 93-6 in the valuation.
Based on the application of the three valuation approaches, taking into consideration the valuation adjustments discussed above, RP Financial concluded that, as of August 31, 2007, the aggregate pro forma market value of Kaiser Federal Financial’s conversion stock was $204,628,080 at the midpoint, equal to 20,462,808 shares at $10.00 per share. The midpoint and resulting valuation range is based on the sale of a 63.53% ownership interest to the public, which provides for a $130.0 million public Offering at the midpoint value.
1. Earnings Approach (“P/E” and “Core P/E”). The application of the P/E valuation method requires calculating the Company’s pro forma market value by applying a valuation P/E multiple to the pro forma earnings base. In applying this technique, we considered both reported earnings and a recurring earnings base, that is, earnings adjusted to exclude any one-time non-operating items, plus the estimated after-tax earnings benefit of the reinvestment of the net proceeds. The Company’s reported earnings equaled $4.704 million for the twelve months ended June 30, 2007. In deriving the Company’s core earnings, the only adjustment made to reported earnings was to eliminate the loss on the Company’s equity investment in a California Affordable Housing Program of $99,000. Accordingly, on a tax affected basis, reflecting the marginal tax rate of 41.1%, the Company’s core earnings were determined to equal $4.762 million for the 12 months ended June 30, 2007 (Note: see Exhibit IV-9 for the adjustments applied to the Peer Group’s earnings in the calculation of core earnings).
Based on the Company’s reported and estimated core earnings, and incorporating the impact of the pro forma assumptions discussed previously, the Company’s pro forma reported P/E multiples at the $204.6 million midpoint value equaled 30.77 times. Over the range of value the Company’s reported and core P/E ratios are at substantial premiums based on reported and core earnings (both based on averages and medians), as shown in the table on the following page.
RP® FINANCIAL, LC.
Page 4.23
Kaiser Fed. Financial P/E Premium/(Discounts) Vs. Peer Group Over Range of Value
|
| Kaiser Fed. Fin |
| Peer Group |
| Kaiser Fed.Fin. Premiums/(Discounts) | ||||||||||||||
|
|
|
| |||||||||||||||||
|
|
|
|
|
| Average |
| Median |
| Average |
| Median | ||||||||
|
|
|
|
|
|
|
|
| ||||||||||||
|
| P/E |
| Core |
| P/E |
| Core |
| P/E |
| Core |
| P/E |
| Core |
| P/E |
| Core |
|
|
|
|
|
|
|
|
|
|
| ||||||||||
Superrange |
| 37.65x |
| 37.35x |
| 17.73x |
| 18.40x |
| 15.43x |
| 16.10x |
| 112.35% |
| 102.99% |
| 144.01% |
| 131.99% |
Maximum |
| 34.26x |
| 33.97x |
| 17.73x |
| 18.40x |
| 15.43x |
| 16.10x |
| 93.23% |
| 84.62% |
| 122.03% |
| 110.99% |
Midpoint |
| 31.04x |
| 30.77x |
| 17.73x |
| 18.40x |
| 15.43x |
| 16.10x |
| 75.07% |
| 67.23% |
| 101.17% |
| 91.12% |
Minimum |
| 27.54x |
| 27.29x |
| 17.73x |
| 18.40x |
| 15.43x |
| 16.10x |
| 55.33% |
| 48.32% |
| 78.48% |
| 69.50% |
Source: Table 4.3
2. Book Value Approach (“P/B” and “P/TB”). The application of the P/B valuation method requires calculating the Company’s pro forma market value by applying a valuation P/B ratio, derived from the Peer Group’s P/B ratio, to the Company’s pro forma book value, including $22,000 of net assets at the MHC. In applying the P/B approach, we considered both reported book value (“P/B”) and tangible book value (“P/TB”). Based on the $204.6 million midpoint valuation, Kaiser Federal Financial’s pro forma P/B and P/TB ratios equaled 100.13% and 102.27%, respectively. The resulting discounts to the Peer Group’s P/B and P/TB ratios, both averages and medians, over the range of value appear below.
Kaiser Fed. Financial P/B Premium/(Discounts) Vs. Peer Group Over Range of Value
|
| Kaiser Fed. Fin |
| Peer Group |
| Kaiser Fed.Fin. Premiums/(Discounts) | ||||||||||||||
|
|
|
| |||||||||||||||||
|
|
|
|
|
| Average |
| Median |
| Average |
| Median | ||||||||
|
|
|
|
|
|
|
|
| ||||||||||||
|
| P/B |
| P/TB |
| P/B |
| P/TB |
| P/B |
| P/TB |
| P/B |
| P/TB |
| P/B |
| P/TB |
|
|
|
|
|
|
|
|
|
|
| ||||||||||
Superrange |
| 112.74% |
| 1 14.78% |
| 126.99% |
| 137.30% |
| 119.01% |
| 124.46% |
| -11.2% |
| -16.4% |
| -5.27% |
| -7.78% |
Maximum |
| 106.50% |
| 108.60% |
| 126.99% |
| 137.30% |
| 119.01% |
| 124.46% |
| -16.1% |
| -20.9% |
| -10.51% |
| -12.74% |
Midpoint |
| 100.13% |
| 102.27% |
| 126.99% |
| 137.30% |
| 119.01% |
| 124.46% |
| -21.2% |
| -25.5% |
| -15.86% |
| -17.83% |
Minimum |
| 92.63% |
| 94.79% |
| 126.99% |
| 137.30% |
| 119.01% |
| 124.46% |
| -27.1% |
| -31.0% |
| -22.17% |
| -23.84% |
Source: Table 4.3
RP® Financial, LC. |
Page 4.24 |
Table 4.3
Public Market Pricing
Kaiser Federal Financial Group, Inc.
As of August 31, 2007
|
|
|
|
| Market |
| Per Share Data |
| ||||||||
|
|
|
|
|
|
| ||||||||||
|
|
|
|
|
| Core |
| Book |
| |||||||
|
|
|
|
| Price/ |
| Market |
| 12 Month |
| Value/ |
| ||||
|
|
|
|
|
|
|
|
| ||||||||
|
|
|
|
| ($) |
| ($Mil) |
| ($) |
| ($) |
| ||||
Kaiser Federal Financial Group, Inc. |
|
|
|
|
|
|
|
|
|
|
|
|
| |||
Superrange |
| $ | 10.00 |
| $ | 270.62 |
| $ | 0.27 |
| $ | 8.87 |
| |||
Maximum |
| $ | 10.00 |
| $ | 235.32 |
| $ | 0.29 |
| $ | 9.39 |
| |||
Midpoint |
| $ | 10.00 |
| $ | 204.63 |
| $ | 0.32 |
| $ | 9.99 |
| |||
Minimum |
| $ | 10.00 |
| $ | 173.93 |
| $ | 0.36 |
| $ | 10.80 |
| |||
All Public Companies(7) |
|
|
|
|
|
|
|
|
|
|
|
|
| |||
Averages |
| $ | 16.62 |
| $ | 412.92 |
| $ | 0.74 |
| $ | 13.46 |
| |||
Medians |
|
| 14.14 |
|
| 91.89 |
|
| 0.48 |
|
| 11.55 |
| |||
All Non-MHC State of CA(7) |
|
|
|
|
|
|
|
|
|
|
|
|
| |||
Averages |
| $ | 25.23 |
| $ | 553.61 |
| $ | 2.05 |
| $ | 23.61 |
| |||
Medians |
| $ | 22.80 |
| $ | 148.07 |
| $ | 1.08 |
| $ | 18.95 |
| |||
Comparable Group Averages |
|
|
|
|
|
|
|
|
|
|
|
|
| |||
Averages |
| $ | 16.95 |
| $ | 126.93 |
| $ | 1.07 |
| $ | 13.57 |
| |||
Medians |
| $ | 16.04 |
| $ | 95.24 |
| $ | 1.04 |
| $ | 12.58 |
| |||
State of California |
|
|
|
|
|
|
|
|
|
|
|
|
| |||
BOFI |
|
| Bofi Holding, Inc. Of CA |
| $ | 7.27 |
| $ | 60.11 |
| $ | 0.32 |
| $ | 8.19 |
|
BYFC |
|
| Broadway Financial Corp. of CA |
| $ | 10.35 |
| $ | 17.51 |
| $ | 0.87 |
| $ | 10.86 |
|
DSL |
|
| Downey Financial Corp. of CA |
| $ | 56.59 |
| $ | 1,576.26 |
| $ | 5.78 |
| $ | 52.58 |
|
FPTB |
|
| First PacTrust Bancorp of CA |
| $ | 22.80 |
| $ | 100.41 |
| $ | 0.98 |
| $ | 18.95 |
|
FED |
|
| FirstFed Financial Corp. of CA |
| $ | 50.25 |
| $ | 804.50 |
| $ | 7.57 |
| $ | 45.24 |
|
HWFG |
|
| Harrington West Fncl Grp of CA |
| $ | 14.90 |
| $ | 82.65 |
| $ | 1.40 |
| $ | 12.42 |
|
IMB |
|
| IndyMac Bancorp, Inc. of CA |
| $ | 24.20 |
| $ | 1,782.69 |
| $ | (1.34 | ) | $ | 27.83 |
|
PFB |
|
| PFF Bancorp, Inc. of Pomona CA |
| $ | 17.52 |
| $ | 410.32 |
| $ | 1.77 |
| $ | 15.82 |
|
PROV |
|
| Provident Fin. Holdings of CA |
| $ | 23.22 |
| $ | 148.07 |
| $ | 1.08 |
| $ | 20.63 |
|
Comparable Group |
|
|
|
|
|
|
|
|
|
|
|
|
| |||
BOFI |
|
| Bofi Holding, Inc. Of CA |
| $ | 7.27 |
| $ | 60.11 |
| $ | 0.32 |
| $ | 8.19 |
|
FPTB |
|
| First PacTrust Bancorp of CA |
| $ | 22.80 |
| $ | 100.41 |
| $ | 0.98 |
| $ | 18.95 |
|
HARL |
|
| Harleysville Svgs Fin Cp of PA |
| $ | 14.83 |
| $ | 57.13 |
| $ | 0.84 |
| $ | 12.73 |
|
HWFG |
|
| Harrington West Fncl Grp of CA |
| $ | 14.90 |
| $ | 82.65 |
| $ | 1.40 |
| $ | 12.42 |
|
PFB |
|
| PFF Bancorp, Inc. of Pomona CA |
| $ | 17.52 |
| $ | 410.32 |
| $ | 1.77 |
| $ | 15.82 |
|
PBCI |
|
| Pamrapo Bancorp, Inc. of NJ |
| $ | 18.10 |
| $ | 90.07 |
| $ | 1.07 |
| $ | 11.80 |
|
RPFG |
|
| Rainier Pacific Fin Grp of WA |
| $ | 16.16 |
| $ | 106.14 |
| $ | 0.42 |
| $ | 13.69 |
|
RVSB |
|
| Riverview Bancorp, Inc. of WA |
| $ | 14.93 |
| $ | 172.70 |
| $ | 1.00 |
| $ | 8.62 |
|
THRD |
|
| TF Fin. Corp. of Newtown PA |
| $ | 27.05 |
| $ | 78.04 |
| $ | 1.77 |
| $ | 22.95 |
|
TSBK |
|
| Timberland Bancorp, Inc. of WA |
| $ | 15.91 |
| $ | 111.77 |
| $ | 1.12 |
| $ | 10.53 |
|
|
|
|
| Pricing Ratios(3) |
| |||||||||||||
|
|
|
|
| ||||||||||||||
|
|
|
| P/E |
| P/B |
| P/A |
| P/TB |
| P/Core |
| |||||
|
|
|
|
|
|
|
|
| ||||||||||
|
|
|
| (x) |
| (%) |
| (%) |
| (%) |
| (x) |
| |||||
Kaiser Federal Financial Group, Inc. |
|
|
|
|
|
|
|
|
|
|
|
|
|
|
|
| ||
Superrange |
|
| 37.65 | x |
| 112.74 | % |
| 28.57 | % |
| 114.78 | % |
| 37.35 | x | ||
Maximum |
|
| 34.26 | x |
| 106.50 | % |
| 25.35 | % |
| 108.60 | % |
| 33.97 | x | ||
Midpoint |
|
| 31.04 | x |
| 100.13 | % |
| 22.45 | % |
| 102.27 | % |
| 30.77 | x | ||
Minimum |
|
| 27.54 | x |
| 92.63 | % |
| 19.43 | % |
| 94.79 | % |
| 27.29 | x | ||
All Public Companies(7) |
|
|
|
|
|
|
|
|
|
|
|
|
|
|
|
| ||
Averages |
|
| 19.97 | x |
| 130.65 | % |
| 16.47 | % |
| 149.25 | % |
| 20.71 | x | ||
Medians |
|
| 17.89 | x |
| 120.79 | % |
| 13.46 | % |
| 136.61 | % |
| 19.09 | x | ||
All Non-MHC State of CA(7) |
|
|
|
|
|
|
|
|
|
|
|
|
|
|
|
| ||
Averages |
|
| 12.21 | x |
| 105.92 | % |
| 8.50 | % |
| 107.95 | % |
| 14.54 | x | ||
Medians |
|
| 11.27 | x |
| 110.75 | % |
| 8.37 | % |
| 111.17 | % |
| 11.27 | x | ||
Comparable Group Averages |
|
|
|
|
|
|
|
|
|
|
|
|
|
|
|
| ||
Averages |
|
| 17.73 | x |
| 126.99 | % |
| 11.95 | % |
| 137.30 | % |
| 18.40 | x | ||
Medians |
|
| 15.43 | x |
| 119.01 | % |
| 11.74 | % |
| 124.46 | % |
| 16.10 | x | ||
State of California |
|
|
|
|
|
|
|
|
|
|
|
|
|
|
|
| ||
BOFI |
| Bofi Holding, Inc. Of CA |
|
| 20.19 |
|
| 88.77 | % |
| 6.35 | % |
| 88.77 | % |
| 22.72 | x |
BYFC |
| Broadway Financial Corp. of CA |
|
| 11.76 | x |
| 95.30 | % |
| 5.51 | % |
| 95.30 | % |
| 11.90 | x |
DSL |
| Downey Financial Corp. of CA |
|
| 8.45 | x |
| 107.63 | % |
| 10.58 | % |
| 107.87 | % |
| 9.79 | x |
FPTB |
| First PacTrust Bancorp of CA |
|
| 23.27 | x |
| 120.32 | % |
| 13.05 | % |
| 120.32 | % |
| 23.27 | x |
FED |
| FirstFed Financial Corp. of CA |
|
| 6.34 | x |
| 111.07 | % |
| 10.49 | % |
| 111.17 | % |
| 6.64 | x |
HWFG |
| Harrington West Fncl Grp of CA |
|
| 11.64 | x |
| 119.97 | % |
| 7.31 | % |
| 132.09 | % |
| 10.64 | x |
IMB |
| IndyMac Bancorp, Inc. of CA |
|
| 6.97 | x |
| 86.96 | % |
| 5.63 | % |
| 92.33 | % |
| NM |
|
PFB |
| PFF Bancorp, Inc. of Pomona CA |
|
| 10.01 | x |
| 110.75 | % |
| 9.18 | % |
| 111.17 | % |
| 9.90 | x |
PROV |
| Provident Fin. Holdings of CA |
|
| 11.27 | x |
| 112.55 | % |
| 8.37 | % |
| 112.55 | % |
| 21.50 | x |
Comparable Group |
|
|
|
|
|
|
|
|
|
|
|
|
|
|
|
| ||
BOFI |
| Bofi Holding, Inc. Of CA |
|
| 20.19 |
|
| 88.77 | % |
| 6.35 | % |
| 88.77 | % |
| 22.72 | x |
FPTB |
| First PacTrust Bancorp of CA |
|
| 23.27 |
|
| 120.32 | % |
| 13.05 | % |
| 120.32 | % |
| 23.27 | x |
HARL |
| Harleysville Svgs Fin Cp of PA |
|
| 17.05 |
|
| 116.50 | % |
| 7.34 | % |
| 116.50 | % |
| 17.65 | x |
HWFG |
| Harrington West Fncl Grp of CA |
|
| 11.64 |
|
| 119.97 | % |
| 7.31 | % |
| 132.09 | % |
| 10.64 | x |
PFB |
| PFF Bancorp, Inc. of Pomona CA |
|
| 10.01 |
|
| 110.75 | % |
| 9.18 | % |
| 111.17 | % |
| 9.90 | x |
PBCI |
| Pamrapo Bancorp, Inc. of NJ |
|
| 16.16 |
|
| 153.39 | % |
| 14.15 | % |
| 153.39 | % |
| 16.92 | x |
RPFG |
| Rainier Pacific Fin Grp of WA |
|
| 35.91 |
|
| 118.04 | % |
| 11.73 | % |
| 122.33 | % |
| 38.48 | x |
RVSB |
| Riverview Bancorp, Inc. of WA |
|
| 14.64 |
|
| 173.20 | % |
| 20.75 | % |
| 235.12 | % |
| 14.93 | x |
THRD |
| TF Fin. Corp. of Newtown PA |
|
| 14.70 |
|
| 117.86 | % |
| 11.75 | % |
| 126.58 | % |
| 15.28 | x |
TSBK |
| Timberland Bancorp, Inc. of WA |
|
| 13.72 |
|
| 151.09 | % |
| 17.91 | % |
| 166.77 | % |
| 14.21 | x |
|
|
|
| Dividends(4) |
| Financial Characteristics(6) |
| ||||||||||||||
|
|
|
|
|
| ||||||||||||||||
|
|
|
| Amount/ |
| Yield |
| Payout |
| Total |
| Equity/ |
| NPAs/ |
| ||||||
|
|
|
|
|
|
|
|
|
| ||||||||||||
|
|
|
| ($) |
| (%) |
| (%) |
| ($Mil) |
| (%) |
| (%) |
| ||||||
Kaiser Federal Financial Group, Inc. |
|
|
|
|
|
|
|
|
|
|
|
|
|
|
|
|
|
|
| ||
Superrange |
| $ | 0.21 |
|
| 2.06 | % |
| 77.62 | % | $ | 947 |
|
| 25.34 | % |
| 0.15 | % | ||
Maximum |
| $ | 0.24 |
|
| 2.37 | % |
| 81.22 | % | $ | 928 |
|
| 23.80 | % |
| 0.16 | % | ||
Midpoint |
| $ | 0.27 |
|
| 2.73 | % |
| 84.64 | % | $ | 912 |
|
| 22.42 | % |
| 0.16 | % | ||
Minimum |
| $ | 0.32 |
|
| 3.21 | % |
| 88.35 | % | $ | 895 |
|
| 20.98 | % |
| 0.16 | % | ||
All Public Companies(7) |
|
|
|
|
|
|
|
|
|
|
|
|
|
|
|
|
|
|
| ||
Averages |
| $ | 0.41 |
|
| 2.34 | % |
| 35.89 | % | $ | 3,136 |
|
| 12.58 | % |
| 0.60 | % | ||
Medians |
| $ | 0.34 |
|
| 2.39 | % |
| 40.68 | % | $ | 778 |
|
| 10.67 | % |
| 0.37 | % | ||
All Non-MHC State of CA(7) |
|
|
|
|
|
|
|
|
|
|
|
|
|
|
|
|
|
|
| ||
Averages |
| $ | 0.60 |
|
| 2.79 | % |
| 25.23 | % | $ | 7,071 |
|
| 7.93 | % |
| 0.51 | % | ||
Medians |
| $ | 0.50 |
|
| 3.10 | % |
| 22.99 | % | $ | 1,770 |
|
| 7.43 | % |
| 0.46 | % | ||
Comparable Group Averages |
|
|
|
|
|
|
|
|
|
|
|
|
|
|
|
|
|
|
| ||
Averages |
| $ | 0.55 |
|
| 3.06 | % |
| 37.92 | % | $ | 1,176 |
|
| 9.17 | % |
| 0.18 | % | ||
Medians |
| $ | 0.59 |
|
| 3.10 | % |
| 42.94 | % | $ | 805 |
|
| 9.58 | % |
| 0.06 | % | ||
State of California |
|
|
|
|
|
|
|
|
|
|
|
|
|
|
|
|
|
|
| ||
BOFI |
| Bofi Holding, Inc. Of CA |
| $ | 0.00 |
|
| 0.00 | % |
| 0.00 | % | $ | 947 |
|
| 7.15 | % |
| NA |
|
BYFC |
| Broadway Financial Corp. of CA |
| $ | 0.20 |
|
| 1.93 | % |
| 22.99 | % | $ | 318 |
|
| 5.78 | % |
| 0.02 | % |
DSL |
| Downey Financial Corp. of CA |
| $ | 0.48 |
|
| 0.85 | % |
| 8.30 | % | $ | 14,903 |
|
| 9.83 | % |
| 0.94 | % |
FPTB |
| First PacTrust Bancorp of CA |
| $ | 0.74 |
|
| 3.25 | % |
| NM |
| $ | 769 |
|
| 10.85 | % |
| NA |
|
FED |
| FirstFed Financial Corp. of CA |
| $ | 0.00 |
|
| 0.00 | % |
| 0.00 | % | $ | 7,669 |
|
| 9.44 | % |
| 0.46 | % |
HWFG |
| Harrington West Fncl Grp of CA |
| $ | 0.50 |
|
| 3.36 | % |
| 35.71 | % | $ | 1,130 |
|
| 6.09 | % |
| 0.01 | % |
IMB |
| IndyMac Bancorp, Inc. of CA |
| $ | 2.00 |
|
| 8.26 | % |
| NM |
| $ | 31,659 |
|
| 6.48 | % |
| 1.09 | % |
PFB |
| PFF Bancorp, Inc. of Pomona CA |
| $ | 0.76 |
|
| 4.34 | % |
| 42.94 | % | $ | 4,469 |
|
| 8.29 | % |
| 0.25 | % |
PROV |
| Provident Fin. Holdings of CA |
| $ | 0.72 |
|
| 3.10 | % |
| 66.67 | % | $ | 1,770 |
|
| 7.43 | % |
| 0.83 | % |
Comparable Group |
|
|
|
|
|
|
|
|
|
|
|
|
|
|
|
|
|
|
| ||
BOFI |
| Bofi Holding, Inc. Of CA |
| $ | 0.00 |
|
| 0.00 | % |
| 0.00 | % | $ | 947 |
|
| 7.15 | % |
| NA |
|
FPTB |
| First PacTrust Bancorp of CA |
| $ | 0.74 |
|
| 3.25 | % |
| NM |
| $ | 769 |
|
| 10.85 | % |
| NA |
|
HARL |
| Harleysville Svgs Fin Cp of PA |
| $ | 0.68 |
|
| 4.59 | % |
| NM |
| $ | 778 |
|
| 6.30 | % |
| 0.06 | % |
HWFG |
| Harrington West Fncl Grp of CA |
| $ | 0.50 |
|
| 3.36 | % |
| 35.71 | % | $ | 1,130 |
|
| 6.09 | % |
| 0.01 | % |
PFB |
| PFF Bancorp, Inc. of Pomona CA |
| $ | 0.76 |
|
| 4.34 | % |
| 42.94 | % | $ | 4,469 |
|
| 8.29 | % |
| 0.25 | % |
PBCI |
| Pamrapo Bancorp, Inc. of NJ |
| $ | 0.92 |
|
| 5.08 | % |
| NM |
| $ | 636 |
|
| 9.23 | % |
| 0.60 | % |
RPFG |
| Rainier Pacific Fin Grp of WA |
| $ | 0.26 |
|
| 1.61 | % |
| 61.90 | % | $ | 905 |
|
| 9.94 | % |
| 0.03 | % |
RVSB |
| Riverview Bancorp, Inc. of WA |
| $ | 0.44 |
|
| 2.95 | % |
| 44.00 | % | $ | 832 |
|
| 11.98 | % |
| 0.03 | % |
THRD |
| TF Fin. Corp. of Newtown PA |
| $ | 0.80 |
|
| 2.96 | % |
| 45.20 | % | $ | 664 |
|
| 9.97 | % |
| 0.42 | % |
TSBK |
| Timberland Bancorp, Inc. of WA |
| $ | 0.40 |
|
| 2.51 | % |
| 35.71 | % | $ | 624 |
|
| 11.85 | % |
| 0.06 | % |
|
|
|
| Financial Characteristics(6) |
|
|
|
|
|
|
| ||||||||||
|
|
|
|
|
|
|
|
|
|
| |||||||||||
|
|
|
| Reported |
| Core |
|
|
|
|
| ||||||||||
|
|
|
|
|
| Offering |
| Exchange |
| ||||||||||||
|
|
|
| ROA |
| ROE |
| ROA |
| ROE |
|
|
| ||||||||
|
|
|
|
|
|
|
|
|
| ||||||||||||
|
|
|
| (%) |
| (%) |
| (%) |
| (%) |
| ($Mil) |
| (x) |
| ||||||
Kaiser Federal Financial Group, Inc. |
|
|
|
|
|
|
|
|
|
|
|
|
|
|
|
|
|
|
| ||
Superrange |
|
| 0.76 | % |
| 2.99 | % |
| 0.76 | % |
| 3.02 | % |
| 171.93 |
|
| 1.94008 |
| ||
Maximum |
|
| 0.74 | % |
| 3.11 | % |
| 0.75 | % |
| 3.14 | % |
| 149.50 |
|
| 1.68703 |
| ||
Midpoint |
|
| 0.72 | % |
| 3.23 | % |
| 0.73 | % |
| 3.25 | % |
| 130.00 |
|
| 1.46698 |
| ||
Minimum |
|
| 0.71 | % |
| 3.36 | % |
| 0.71 | % |
| 3.39 | % |
| 110.50 |
|
| 1.24693 |
| ||
All Public Companies(7) |
|
|
|
|
|
|
|
|
|
|
|
|
|
|
|
|
|
|
| ||
Averages |
|
| 0.53 | % |
| 5.04 | % |
| 0.49 | % |
| 4.70 | % |
|
|
|
|
|
| ||
Medians |
|
| 0.55 | % |
| 4.54 | % |
| 0.54 | % |
| 4.64 | % |
|
|
|
|
|
| ||
All Non-MHC State of CA(7) |
|
|
|
|
|
|
|
|
|
|
|
|
|
|
|
|
|
|
| ||
Averages |
|
| 0.79 | % |
| 10.43 | % |
| 0.59 | % |
| 7.68 | % |
|
|
|
|
|
| ||
Medians |
|
| 0.78 | % |
| 10.55 | % |
| 0.54 | % |
| 8.45 | % |
|
|
|
|
|
| ||
Comparable Group Averages |
|
|
|
|
|
|
|
|
|
|
|
|
|
|
|
|
|
|
| ||
Averages |
|
| 0.77 | % |
| 8.12 | % |
| 0.75 | % |
| 8.01 | % |
|
|
|
|
|
| ||
Medians |
|
| 0.71 | % |
| 8.76 | % |
| 0.73 | % |
| 8.40 | % |
|
|
|
|
|
| ||
State of California |
|
|
|
|
|
|
|
|
|
|
|
|
|
|
|
|
|
|
| ||
BOFI |
| Bofi Holding, Inc. Of CA |
|
| 0.36 | % |
| 4.47 | % |
| 0.32 | % |
| 3.98 | % |
|
|
|
|
|
|
BYFC |
| Broadway Financial Corp. of CA |
|
| 0.50 | % |
| 8.54 | % |
| 0.49 | % |
| 8.45 | % |
|
|
|
|
|
|
DSL |
| Downey Financial Corp. of CA |
|
| 1.15 | % |
| 13.43 | % |
| 1.00 | % |
| 11.59 | % |
|
|
|
|
|
|
FPTB |
| First PacTrust Bancorp of CA |
|
| 0.54 | % |
| 5.28 | % |
| 0.54 | % |
| 5.28 | % |
|
|
|
|
|
|
FED |
| FirstFed Financial Corp. of CA |
|
| 1.39 | % |
| 18.33 | % |
| 1.32 | % |
| 17.49 | % |
|
|
|
|
|
|
HWFG |
| Harrington West Fncl Grp of CA |
|
| 0.62 | % |
| 10.55 | % |
| 0.68 | % |
| 11.54 | % |
|
|
|
|
|
|
IMB |
| IndyMac Bancorp, Inc. of CA |
|
| 0.90 | % |
| 12.94 | % |
| -0.35 | % |
| -5.00 | % |
|
|
|
|
|
|
PFB |
| PFF Bancorp, Inc. of Pomona CA |
|
| 0.90 | % |
| 10.60 | % |
| 0.91 | % |
| 10.72 | % |
|
|
|
|
|
|
PROV |
| Provident Fin. Holdings of CA |
|
| 0.78 | % |
| 9.70 | % |
| 0.41 | % |
| 5.09 | % |
|
|
|
|
|
|
Comparable Group |
|
|
|
|
|
|
|
|
|
|
|
|
|
|
|
|
|
|
| ||
BOFI |
| Bofi Holding, Inc. Of CA |
|
| 0.36 | % |
| 4.47 | % |
| 0.32 | % |
| 3.98 | % |
|
|
|
|
|
|
FPTB |
| First PacTrust Bancorp of CA |
|
| 0.54 | % |
| 5.28 | % |
| 0.54 | % |
| 5.28 | % |
|
|
|
|
|
|
HARL |
| Harleysville Svgs Fin Cp of PA |
|
| 0.44 | % |
| 6.88 | % |
| 0.42 | % |
| 6.64 | % |
|
|
|
|
|
|
HWFG |
| Harrington West Fncl Grp of CA |
|
| 0.62 | % |
| 10.55 | % |
| 0.68 | % |
| 11.54 | % |
|
|
|
|
|
|
PFB |
| PFF Bancorp, Inc. of Pomona CA |
|
| 0.90 | % |
| 10.60 | % |
| 0.91 | % |
| 10.72 | % |
|
|
|
|
|
|
PBCI |
| Pamrapo Bancorp, Inc. of NJ |
|
| 0.87 | % |
| 9.43 | % |
| 0.83 | % |
| 9.01 | % |
|
|
|
|
|
|
RPFG |
| Rainier Pacific Fin Grp of WA |
|
| 0.33 | % |
| 3.29 | % |
| 0.30 | % |
| 3.07 | % |
|
|
|
|
|
|
RVSB |
| Riverview Bancorp, Inc. of WA |
|
| 1.43 | % |
| 12.11 | % |
| 1.40 | % |
| 11.88 | % |
|
|
|
|
|
|
THRD |
| TF Fin. Corp. of Newtown PA |
|
| 0.80 | % |
| 8.10 | % |
| 0.77 | % |
| 7.79 | % |
|
|
|
|
|
|
TSBK |
| Timberland Bancorp, Inc. of WA |
|
| 1.37 | % |
| 10.52 | % |
| 1.32 | % |
| 10.15 | % |
|
|
|
|
|
|
(1) | Average of High/Low or Bid/Ask price per share. |
(2) | EPS (estimate core basis) is based on actual trailing 12 month data, adjusted to omit non-operating items on a tax-effected basis, and is shown on a pro forma basis where appropriate. |
(3) | P/E = Price to earnings; P/B = Price to book; P/A = Price to assets; P/TB = Price to tangible book value; and P/Core = Price to core earnings. |
(4) | Indicated 12 month dividend, based on last quarterly dividend declared. |
(5) | Indicated 12 month dividend as a percent of trailing 12 month estimated core earnings. |
(6) | ROA (return on assets) and ROE (return on equity) are indicated ratios based on trailing 12 month common earnings and average common equity and total assets balances. |
(7) | Excludes from averages and medians those companies the subject of actual or rumored acquisition activities or unusual operating characteristics. |
Source: Corporate reports, offering circulars, and RP Financial, LC. calculations. The information provided in this report has been obtained from sources we believe are reliable, but we cannot guarantee the accuracy or completeness of such information.
Copyright (c) 2007 by RP® Financial, LC.
RP® FINANCIAL, LC.
Page 4.25
3. Assets Approach (“P/A”). The P/A valuation methodology determines market value by applying a valuation P/A ratio to the Company’s pro forma asset base, conservatively assuming no deposit withdrawals are made to fund stock purchases. In all likelihood there will be deposit withdrawals, which results in understating the pro forma P/A ratio computed herein. At the midpoint of the valuation range, Kaiser Federal Financial’s value equaled 22.45% of pro forma assets. The resulting premiums to the Peer Group’s average and median P/A ratios, over the range of value, appear below.
Kaiser Fed. Financial P/A Premium/(Discounts) Vs. Peer Group Over Range of Value
|
| Kaiser Fed. Fin |
| Peer Group |
| Kaiser Fed.Fin. Premiums/(Discounts) |
| ||||
|
|
|
|
| |||||||
|
|
|
| Average |
| Median |
| Average |
| Median |
|
|
|
|
|
|
|
|
| ||||
|
| P/A |
| P/A |
| P/A |
| P/A |
| P/A |
|
|
|
|
|
|
|
| |||||
Superrange |
| 28.57% |
| 11.95% |
| 11.74% |
| 139.1% |
| 143.36% |
|
Maximum |
| 25.35% |
| 11.95% |
| 11.74% |
| 112.1% |
| 115.93% |
|
Midpoint |
| 22.45% |
| 11.95% |
| 11.74% |
| 87.9% |
| 91.23% |
|
Minimum |
| 19.43% |
| 11.95% |
| 11.74% |
| 62.6% |
| 65.50% |
|
Based on the foregoing, it is our opinion that, as of August 31, 2007, the estimated aggregate pro forma market value of the Company, inclusive of the sale of the MHC’s ownership interest to the public shareholders was $204,628,080 at the midpoint. Based on this valuation and the approximate 63.53% ownership interest being sold in the public Offering, the midpoint value of the Company’s stock Offering is $130,000,000, equal to 13,000,000 shares at a per share value of $10.00. The resulting range of value pursuant to regulatory guidelines and the corresponding number of shares based on the Board approved $10.00 per share Offering price is set forth below. The pro forma valuation calculations relative to the Peer Group are shown in Table 4.3 and are detailed in Exhibit IV-7 and Exhibit IV-8.
RP® FINANCIAL, LC.
Page 4.26
|
| Total Shares |
| Offering Shares |
| Exchange Shares |
| Exchange |
| ||||
|
|
|
|
|
| ||||||||
Shares |
|
|
|
|
|
|
|
|
|
|
| (x) |
|
Supermaximum |
|
| 27,062,063 |
|
| 17,192,500 |
|
| 9,869,563 |
|
| 1.9401 |
|
Maximum |
|
| 23,532,229 |
|
| 14,950,000 |
|
| 8,582,229 |
|
| 1.6870 |
|
Midpoint |
|
| 20,462,808 |
|
| 13,000,000 |
|
| 7,462,808 |
|
| 1.4670 |
|
Minimum |
|
| 17,393,386 |
|
| 11,050,000 |
|
| 6,343,386 |
|
| 1.2469 |
|
|
|
|
|
|
|
|
|
|
|
|
|
|
|
Distribution of Shares |
|
|
|
|
|
|
|
|
|
|
|
|
|
Supermaximum |
|
| 100.00 | % |
| 63.53 | % |
| 36.47 | % |
|
|
|
Maximum |
|
| 100.00 | % |
| 63.53 | % |
| 36.47 | % |
|
|
|
Midpoint |
|
| 100.00 | % |
| 63.53 | % |
| 36.47 | % |
|
|
|
Minimum |
|
| 100.00 | % |
| 63.53 | % |
| 36.47 | % |
|
|
|
|
|
|
|
|
|
|
|
|
|
|
|
|
|
Aggregate Market Value (1) |
|
|
|
|
|
|
|
|
|
|
|
|
|
Supermaximum |
| $ | 270,620,630 |
| $ | 171,925,000 |
| $ | 98,695,630 |
|
|
|
|
Maximum |
|
| 235,322,290 |
|
| 149,500,000 |
|
| 85,822,290 |
|
|
|
|
Midpoint |
|
| 204,628,080 |
|
| 130,000,000 |
|
| 74,628,080 |
|
|
|
|
Minimum |
|
| 173,933,860 |
|
| 110,500,000 |
|
| 63,433,860 |
|
|
|
|
(1) Based on offering price of $10.00 per share. |
Establishment of the Exchange Ratio
OTS regulations provide that in a conversion of a mutual holding company, the minority stockholders are entitled to exchange the public shares for newly issued shares of Kaiser Federal Financial stock as a fully converted company. The Board of Directors of the MHC has independently determined the exchange ratio. The determined exchange ratio has been designed to preserve the current aggregate percentage ownership in Kaiser Federal Financial equal to 36.47% as of August 31, 2007. The exchange ratio to be received by the existing minority shareholders of Kaiser Federal Financial will be determined at the end of the Offering, based on the total number of shares sold in the subscription and community offerings. Based upon this calculation, and the valuation conclusion and Offering range concluded above, the exchange ratio would be 1.2470 shares, 1.4670 shares, 1.6870 shares and 1.9401 shares of newly issued shares of Kaiser Federal Financial stock for each share of stock held by the public shareholders
RP® FINANCIAL, LC.
Page 4.27
at the minimum, midpoint, maximum and supermaximum of the Offering range, respectively. RP Financial expresses no opinion on the proposed exchange of newly issued Company shares for the shares held by the public stockholders or on the proposed exchange ratio.