Issuer Free Writing Prospectus
Dated November 3, 2010
Filed Pursuant to Rule 433
Registration Statement No. 333-167179
 |
 Kaiser Federal Financial Group, Inc.
                        KFFG

                              2nd Step Conversion
                        November 2010

        Kay M. Hoveland, President & Chief Executive Officer
        Dustin Luton, Chief Financial Officer
|
 |
 FORWARD-LOOKING STATEMENTS

This Presentation may contain certain forward-looking statements regarding our
prospective performance and strategies within the meaning of Section 27A of the
Securities Act of 1933, as amended and Section 21E of the Securities Exchange
Act of 1934, as amended. We intend such forward-looking statements to be
covered by the safe harbor provisions for forward-looking statements contained
in the Private Securities Litigation Reform Act of 1995, and are including this
statement for purposes of said safe harbor provisions. Kaiser Federal Financial
Group, Inc. (“The Company”) has filed a registration statement
(including a prospectus) with the Securities and Exchange Commission (the
“SEC”) for the offering to which this communication relates. Before
you invest, you should read the prospectus in that registration statement and
other documents the Company has filed with the SEC for more complete
information about the Company and this offering. You may get these documents
for free by visiting EDGAR on the SEC Web site at www.sec.gov. Alternatively,
the Company, any underwriter or any dealer participating in the offering will
arrange to send you the prospectus if you request it by calling Keefe, Bruyette
& Woods, Inc. toll free at (877) 860-2086.

This presentation contains “forward-looking statements.” You can
identify these forward-looking statements through our use of words such as
“may,” “will,” “anticipate,” “assume,”
“should,” “indicate,” “would,”
“believe,” “contemplate,” “expect,”
“estimate,” “continue,” “plan,”
“project,” “could,” “intend,” “target”
and other similar words and expressions of the future. These forward-looking
statements include, but are not limited to:

o     statements of our goals, intentions and expectations;

o     statements regarding our business plans, prospects, growth and operating
      strategies;

o     statements regarding the asset quality of our loan and investment
      portfolios; and

o     estimates of our risks and future costs and benefits.

These forward-looking statements are based on current beliefs and expectations
of our management and are inherently subject to significant business, economic
and competitive uncertainties and contingencies, many of which are beyond our
control. In addition, these forward-looking statements are subject to
assumptions with respect to future business strategies and decisions that are
subject to change.

Throughout this presentation, the peer companies include: PVSA, BFIN, UBNK,
BOFI, PULB, ABBC, FPTB, HOME, FSBI, and HBNK. The data presented in this
presentation relating to the peer companies is based on the calendar year, not
KFED’s fiscal year. Data for peers is sourced from SNL Financial LC.

                                                                               2
|
 |
 FORWARD-LOOKING STATEMENTS (continued)

The following factors, among others, could cause actual results to differ
materially from the anticipated results or other expectations expressed in the
forward-looking statements:

o     general economic conditions, either nationally or in our market areas,
      that are worse than expected;
o     fluctuations in the demand for loans, the number of unsold homes, land and
      other properties and fluctuations in real estate values in our market
      area;
o     the credit risks of lending activities, including changes in the levels
      and trends in loans delinquencies and write-offs and changes in our
      allowance for loans losses and provisions for loan losses that may be
      impacted by deterioration in the housing and commercial real estate
      markets;
o     competition among depository and other financial institutions;
o     inflation and changes in the interest rate environment that reduce our
      margins or reduce the fair value of financial instruments;
o     adverse changes in the securities markets;
o     changes in laws or government regulations or policies affecting financial
      institutions, such as the Dodd-Frank Act, including changes in our primary
      federal regulator, regulatory fees and capital requirements;
o     results of examinations of us by the Office of Thrift Supervision or other
      regulatory authorities, including the possibility that any such authority
      may, among other things, require us to increase our allowance for loan
      losses, write-down assets, adjust our regulatory capital position or
      affect our ability to borrow funds or maintain or increase our deposits
      which could adversely affect our liquidity and earnings;
o     our ability to enter new markets successfully and capitalize on growth
      opportunities;
o     our ability to successfully integrate any assets, liabilities, customers,
      systems, and management personnel we may in the future acquire into our
      operations and our ability to realize related revenue synergies and cost
      savings within expected time frames and any
o     goodwill charges related thereto;
o     changes in consumer spending, borrowing and savings habits;
o     the availability of resources to address changes in laws, rules, or
      regulations or to respond
o     to regulatory actions;
o     our ability to pay dividends;
o     changes in accounting policies and practices, as may be adopted by the
      bank regulatory agencies, the Financial Accounting Standards Board the
      Securities and Exchange Commission and the Public Company Accounting
      Oversight Board;
o     changes in our organization, compensation and benefit plans;
o     changes in the financial condition or future prospects of issuers of
      securities that we own; and
o     other economic competitive, governmental, regulatory and technological
      factors affecting our operations, pricing, products and services and other
      risks described elsewhere in this Presentation.

This list of important factors is not all inclusive. For a discussion of these
and other risks that may cause actual results to differ from expectations,
please refer to the Company’s Prospectus dated September 28, 2010 on file
with the SEC. Readers are cautioned not to place undue reliance on the
forward-looking statements contained herein, which speak only as of the date of
this Presentation. Except as required by applicable law or regulation, we do
not undertake, and specifically disclaim any obligation, to update any
forward-looking statements, whether written or oral, that may be made from time
to time by or on behalf of the Company or Kaiser Federal Bank.

                                                                               3
|
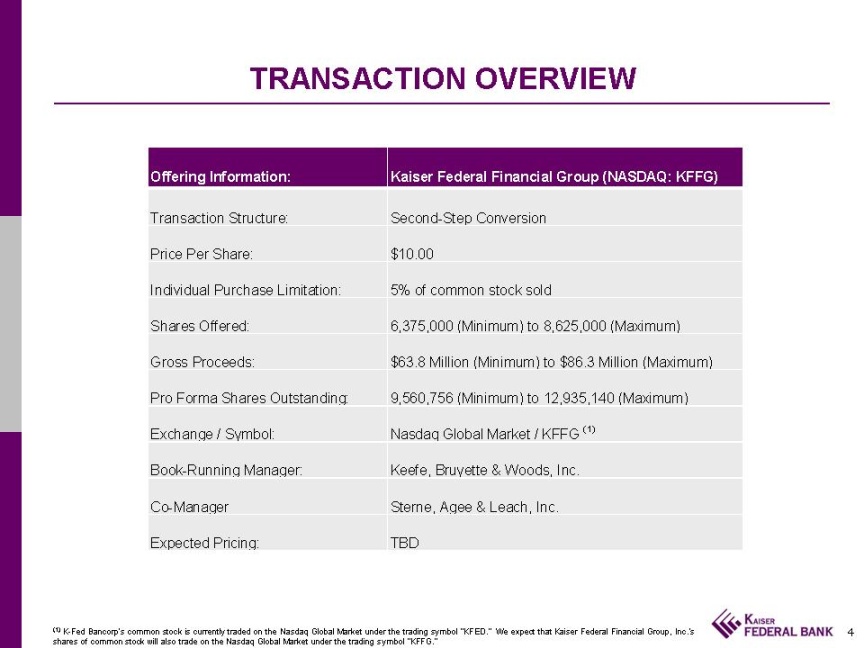 |
 TRANSACTION OVERVIEW

Offering Information:              Kaiser Federal Financial Group (NASDAQ: KFFG)

Transaction Structure:             Second-Step Conversion

Price Per Share:                   $10.00

Individual Purchase Limitation:    5% of common stock sold

Shares Offered:                    6,375,000 (Minimum) to 8,625,000 (Maximum)

Gross Proceeds:                    $63.8 Million (Minimum) to $86.3 Million (Maximum)

Pro Forma Shares Outstanding:      9,560,756 (Minimum) to 12,935,140 (Maximum)

Exchange / Symbol:                 Nasdaq Global Market / KFFG (1)

Book-Running Manager:              Keefe, Bruyette & Woods, Inc.

Co-Manager                         Sterne, Agee & Leach, Inc.

Expected Pricing:                  TBD

K-Fed Bancorp’s common stock is currently traded on the Nasdaq Global
Market under the trading symbol “KFED.” We expect that Kaiser Federal
Financial Group, Inc.’s shares of common stock will also trade on the
Nasdaq Global Market under the trading symbol “KFFG.”

                                                                               4
|
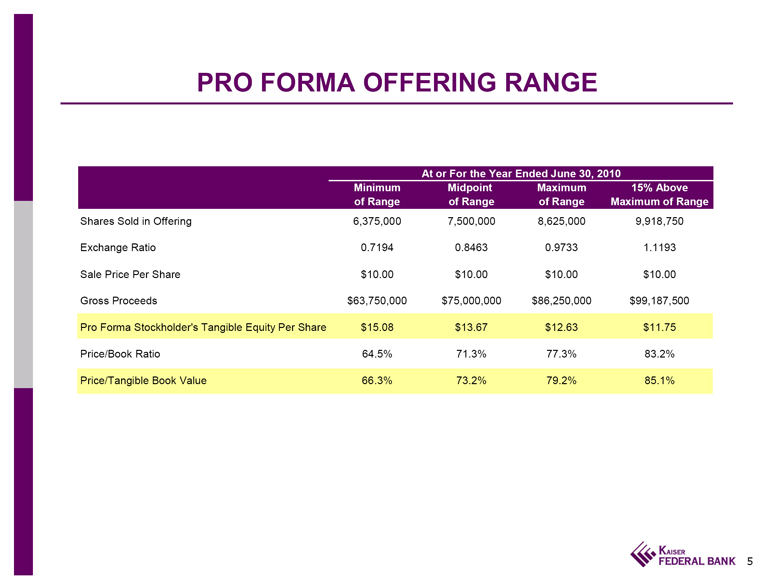 |
 PRO FORMA OFFERING RANGE

                                            At or For the Year Ended June 30, 2010
                                  Minimum        Midpoint       Maximum         15% Above
                                 of Range        of Range       of Range     Maximum of Range
Shares Sold in Offering          6,375,000       7,500,000     8,625,000        9,918,750

Exchange Ratio                    0.7194          0.8463         0.9733           1.1193

Sale Price Per Share              $10.00          $10.00         $10.00           $10.00

Gross Proceeds                  $63,750,000     $75,000,000   $86,250,000      $99,187,500

Pro Forma Stockholder’s      $15.08          $13.67         $12.63           $11.75
Tangible Equity Per Share

Price/Book Ratio                   64.5%           71.3%         77.3%            83.2%

Price/Tangible Book Value          66.3%           73.2%         79.2%            85.1%

                                                                               5
|
 |
 A HISTORY OF GROWTH

2003
K-Fed Bancorp is formed on July 1, 2003 as a K-Fed Bancorp is formed on July 1,
2003 as a wholly-owned subsidiary of K-Fed Mutual wholly-owned subsidiary of
K-Fed Mutual Holding Company Holding Company

1953
Kaiser Permanente Federal Credit Union (KPFCU) is founded

2007
On June 26, 2007 K-Fed On June 26, 2007 K-Fed Bancorp (MHC) is added Bancorp
(MHC) is added to the Russell 3000 Index to the Russell 3000 Index

1999
KPFCU converts to KPFCU converts to a mutual savings a mutual savings
association association

2004
On March 30, 2004, K-Fed Bancorp On March 30, 2004, K-Fed Bancorp completes a
minority stock offering in completes a minority stock offering in which it sold
5,686,750 shares, or which it sold 5,686,750 shares, or 39.09% of its
outstanding common stock 39.09% of its outstanding common stock

On September 24, 2004, K-Fed Bancorp On September 24, 2004, K-Fed Bancorp
acquires United PanAm Financial Corp. acquires United PanAm Financial Corp.
branch in Panorama City, CA branch in Panorama City, CA

2010
On September 29, 2010 K-On September 29, 2010 K-Fed Bancorp announces Fed
Bancorp announces conversion offering and plans conversion offering and plans
to offer between 6,375,000 to offer between 6,375,000 and 9,918,750 common and
9,918,750 common shares in connection with a shares in connection with a
second-stage conversion of second-stage conversion of K-Fed MHC


                                                                               6
|
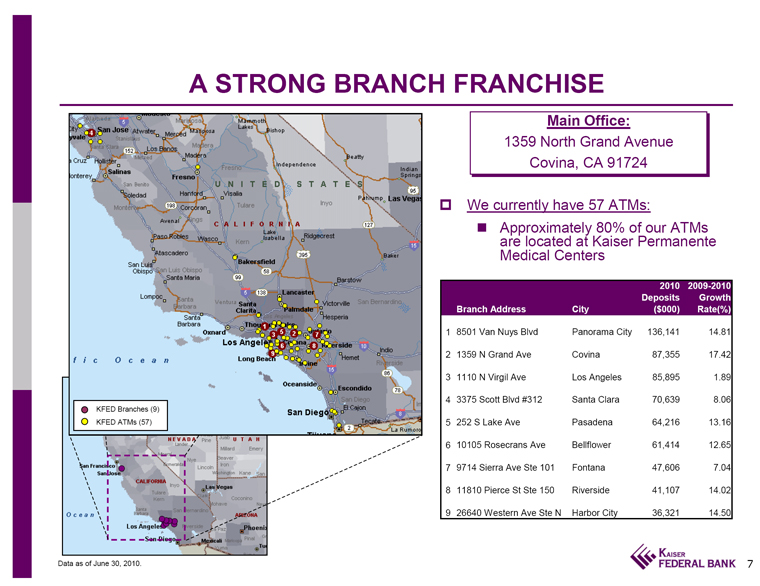 |
 A STRONG BRANCH FRANCHISE

o KFED Branches (9)
o KFED ATMs (57)

                                  Main Office:
                             1359 North Grand Avenue
                                Covina, CA 91724

o     We currently have 57 ATMs:

o     Approximately 80% of our ATMs are located at Kaiser Permanente Medical
      Centers

                                                          2010    2009-2010
                                                      Deposits       Growth
     Branch Address                 City                ($000)      Rate(%)

1    8501 Van Nuys Blvd             Panorama City      136,141        14.81

2    1359 N Grand Ave               Covina              87,355        17.42

3    1110 N Virgil Ave              Los Angeles         85,895         1.89

4    3375 Scott Blvd #312           Santa Clara         70,639         8.06

5    252 S Lake Ave                 Pasadena            64,216        13.16

6    10105 Rosecrans Ave            Bellflower          61,414        12.65

7    9714 Sierra Ave Ste 101        Fontana             47,606         7.04

8    11810 Pierce St Ste 150        Riverside           41,107        14.02

9    26640 Western Ave Ste N        Harbor City         36,321        14.50


Data as of June 30, 2010.

                                                                               7
|
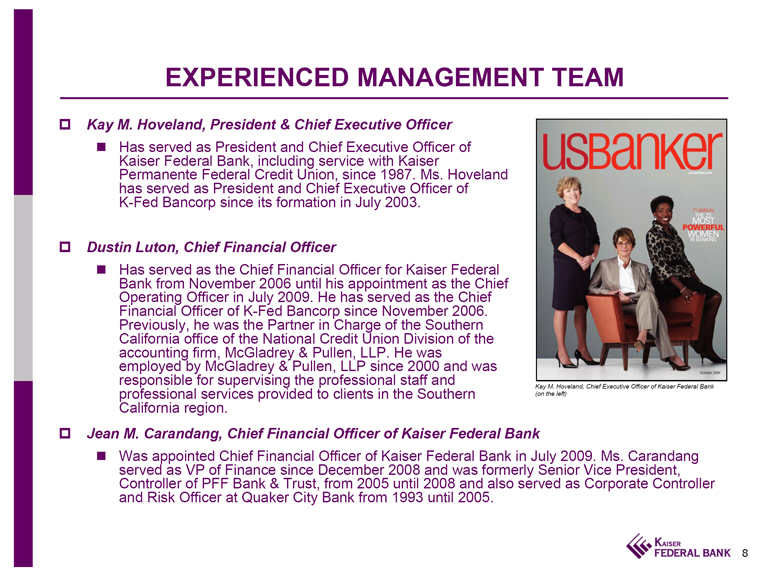 |
 EXPERIENCED MANAGEMENT TEAM

o     Kay M. Hoveland, President & Chief Executive Officer

      o     Has served as President and Chief Executive Officer of Kaiser
            Federal Bank, including service with Kaiser Permanente Federal
            Credit Union, since 1987. Ms. Hoveland has served as President and
            Chief Executive Officer of K-Fed Bancorp since its formation in July
            2003.

o     Dustin Luton, Chief Financial Officer

      o     Has served as the Chief Financial Officer for Kaiser Federal Bank
            from November 2006 until his appointment as the Chief Operating
            Officer in July 2009. He has served as the Chief Financial Officer
            of K-Fed Bancorp since November 2006. Previously, he was the Partner
            in Charge of the Southern California office of the National Credit
            Union Division of the accounting firm, McGladrey & Pullen, LLP.
            He was employed by McGladrey & Pullen, LLP since 2000 and was
            responsible for supervising the professional staff and professional
            services provided to clients in the Southern California region.

o     Jean M. Carandang, Chief Financial Officer of Kaiser Federal Bank

      o     Was appointed Chief Financial Officer of Kaiser Federal Bank in July
            2009. Ms. Carandang served as VP of Finance since December 2008 and
            was formerly Senior Vice President, Controller of PFF Bank &
            Trust, from 2005 until 2008 and also served as Corporate Controller
            and Risk Officer at Quaker City Bank from 1993 until 2005.

Kay M. Hoveland, Chief Executive Officer of Kaiser Federal Bank (on the left)

                                                                               8
|
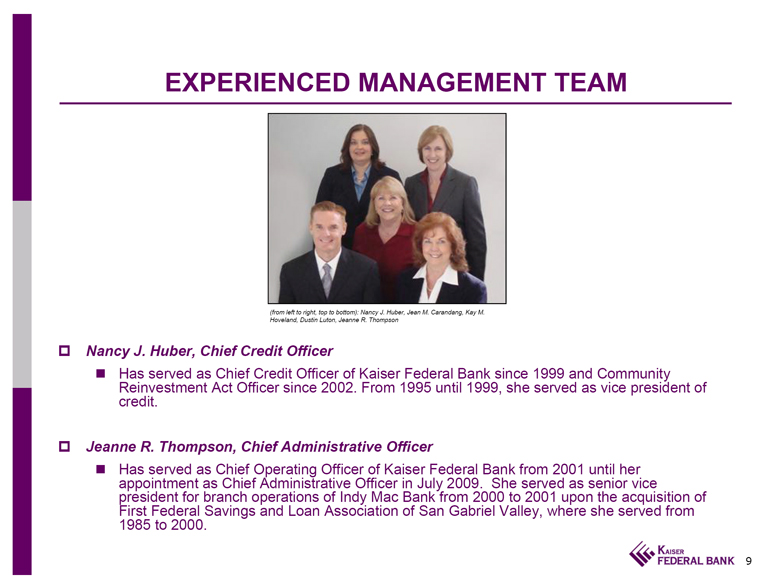 |
 EXPERIENCED MANAGEMENT TEAM

(from left to right, top to bottom): Nancy J. Huber, Jean M. Carandang, Kay M.
Hoveland, Dustin Luton, Jeanne R. Thompson

o     Nancy J. Huber, Chief Credit Officer

      o     Has served as Chief Credit Officer of Kaiser Federal Bank since 1999
            and Community Reinvestment Act Officer since 2002. From 1995 until
            1999, she served as vice president of credit.

o     Jeanne R. Thompson, Chief Administrative Officer

      o     Has served as Chief Operating Officer of Kaiser Federal Bank from
            2001 until her appointment as Chief Administrative Officer in July
            2009. She served as senior vice president for branch operations of
            Indy Mac Bank from 2000 to 2001 upon the acquisition of First
            Federal Savings and Loan Association of San Gabriel Valley, where
            she served from 1985 to 2000.

                                                                               9
|
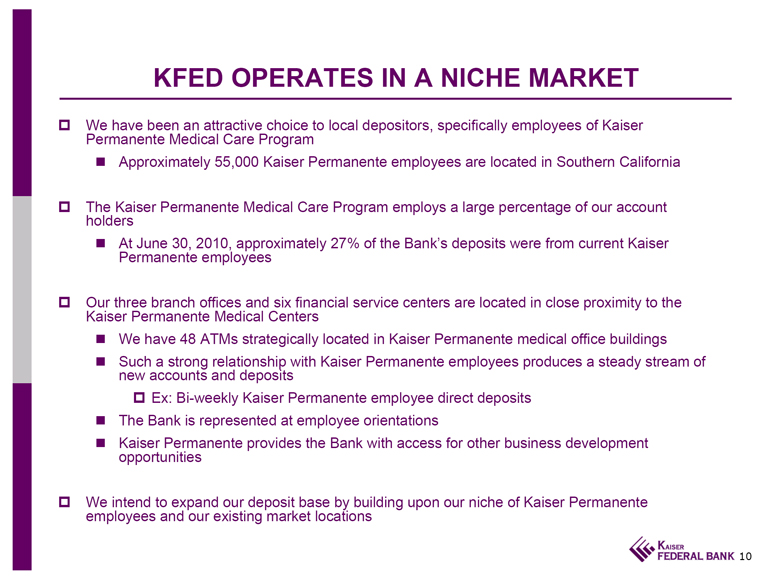 |
 KFED OPERATES IN A NICHE MARKET

o     We have been an attractive choice to local depositors, specifically
      employees of Kaiser Permanente Medical Care Program

      o     Approximately 55,000 Kaiser Permanente employees are located in
            Southern California

o     The Kaiser Permanente Medical Care Program employs a large percentage of
      our account holders

      o     At June 30, 2010, approximately 27% of the Bank’s deposits were
            from current Kaiser Permanente employees

o     Our three branch offices and six financial service centers are located in
      close proximity to the Kaiser Permanente Medical Centers

      o     We have 48 ATMs strategically located in Kaiser Permanente medical
            office buildings

      o     Such a strong relationship with Kaiser Permanente employees produces
            a steady stream of new accounts and deposits

            o     Ex: Bi-weekly Kaiser Permanente employee direct deposits

      o     The Bank is represented at employee orientations

      o     Kaiser Permanente provides the Bank with access for other business
            development opportunities

o     We intend to expand our deposit base by building upon our niche of Kaiser
      Permanente employees and our existing market locations

                                                                              10
|
 |
 BUSINESS STRATEGY AND OFFERING RATIONALE

o     Our goal is to promote the financial well being of our customers and the
      communities we serve by:

      o     Maintaining cost efficiencies and reducing our non-performing assets

      o     De Novo branch expansion or by acquiring branches along with
            FDIC-assisted acquisitions of whole banks

      o     Capitalizing on current and new customer relationships

o Reasons to convert:

      o     Support internal growth

      o     Increase loan portfolio

      o     Improve liquidity of our shares of common stock

      o     Finance the acquisition of financial institutions, including
            FDIC-assisted transactions and branch expansion

      o     Eliminate uncertainties associated with financial regulatory reforms

o     With the proceeds, we intend to invest a substantial portion of the net
      proceeds in short-term investments, investment-grade debt obligations and
      mortgage-backed securities and/or:

o     Fund a loan to the employee stock ownership plan

o     Lending

o     Finance the acquisition of financial institutions

o     Pay cash dividends to stockholders

o     Repurchase shares of our common stock(1)

o     Repay $20 million of FHLB borrowings that mature on November 29, 2010

o     Other general purposes

(1) Under current OTS regulations, we may not repurchase shares of our common
stock during the first year following the completion of the conversion, except
when extraordinary circumstances exist and with prior regulatory approval.

                                                                              11
|
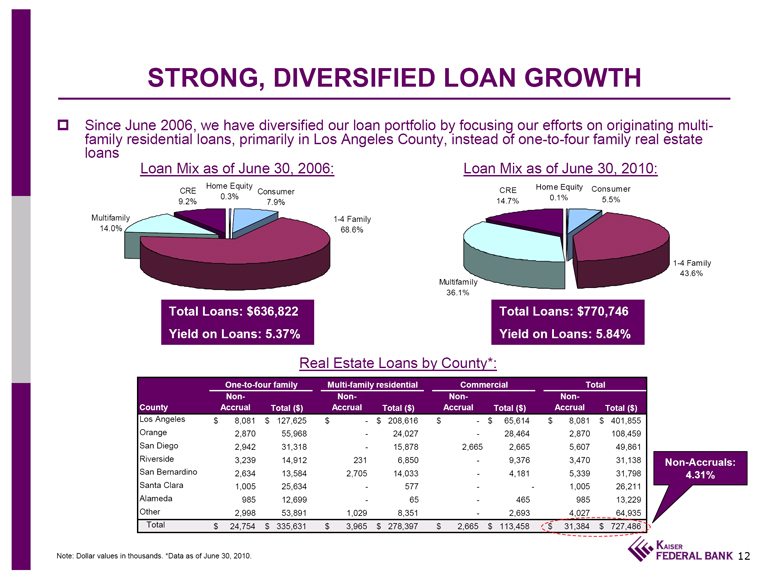 |
 STRONG, DIVERSIFIED LOAN GROWTH

Since June 2006, we have diversified our loan portfolio by focusing our
efforts on originating multi-family residential loans, primarily in Los Angeles
County, instead of one-to-four family real estate loans

                         Loan Mix as of June 30, 2006:

Multifamily       CRE          Home Equity        Consumer        1-4 Family
   14.0%          9.2%            0.3%              7.9%            68.6%

                             Total Loans: $636,822
                             Yield on Loans: 5.37%

                         Loan Mix as of June 30, 2010:

Multifamily       CRE          Home Equity        Consumer        1-4 Family
   36.1%          14.7%           0.1%              5.5%            43.6%


                             Total Loans: $770,746
                             Yield on Loans: 5.84%

                         Real Estate Loans by County*:

                    One-to-four family    Multi-family residential           Commercial             Total
                     Non-                     Non-                      Non-                        Non-
County             Accrual     Total ($)    Accrual     Total ($)     Accrual      Total ($)      Accrual      Total ($)
Los Angeles      $     8,081  $   127,625  $         -  $   208,616  $          - $     65,614  $     8,081 $       401,855
Orange                 2,870       55,968            -       24,027             -       28,464        2,870         108,459
San Diego              2,942       31,318            -       15,878         2,665        2,665        5,607          49,861
Riverside              3,239       14,912          231        6,850             -        9,376        3,470          31,138
San Bernardino         2,634       13,584        2,705       14,033             -        4,181        5,339          31,798
Santa Clara            1,005       25,634            -          577             -            -        1,005          26,211
Alameda                  985       12,699            -           65             -          465          985          13,229
Other                  2,998       53,891        1,029        8,351             -        2,693        4,027          64,935
Total            $    24,754  $   335,631  $     3,965  $   278,397  $      2,665 $    113,458  $    31,384 $       727,486

Non-Accruals: 4.31%

Note: Dollar values in thousands. *Data as of June 30, 2010.

                                                                              12
|
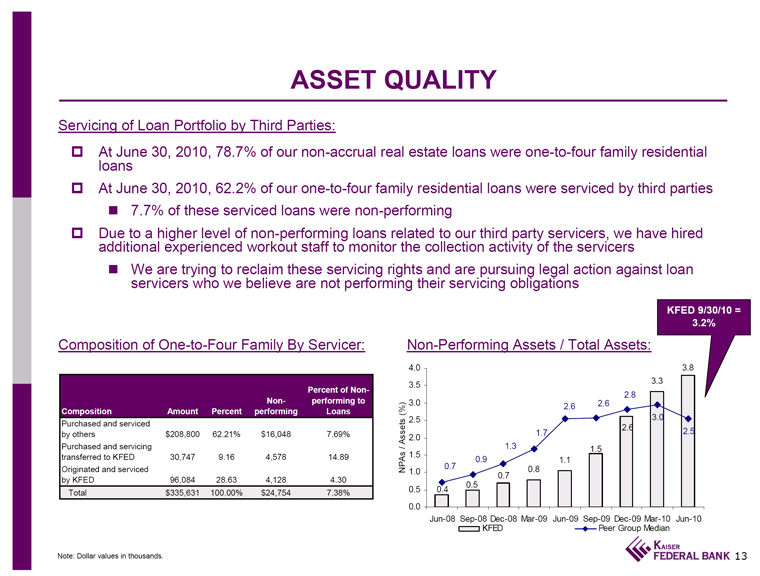 |
 ASSET QUALITY

Servicing of Loan Portfolio by Third Parties:

o     At June 30, 2010, 78.7% of our non-accrual real estate loans were
      one-to-four family residential loans

o     At June 30, 2010, 62.2% of our one-to-four family residential loans were
      serviced by third parties

      o     7.7% of these serviced loans were non-performing

o     Due to a higher level of non-performing loans related to our third party
      servicers, we have hired additional experienced workout staff to monitor
      the collection activity of the servicers

      o     We are trying to reclaim these servicing rights and are pursuing
            legal action against loan servicers who we believe are not
            performing their servicing obligations

Composition of One-to-Four Family By Servicer:

                                                                        Percent of Non-
                                                            Non-         performing to
Composition                    Amount       Percent      performing          Loans
Purchased and serviced
by others                     $208,800      62.21%        $16,048            7.69%
Purchased and servicing
transferred to KFED            30,747        9.16          4,578             14.89
Originated and serviced
by KFED                        96,084        28.63         4,128              4.30
Total                         $335,631      100.00%       $24,754            7.38%


Non-Performing Assets / Total Assets:

                               NPAs / Assets (%)
4.0
3.5
3.0
2.5
2.0
1.5
1.0
0.5
0.0   0.7       0.9       1.3     1.7      2.6      2.6      2.8       3.3      3.8
      0.4       0.5       0.7     0.8      1.1      1.5      2.6       3.0      2.5
     Jun-08    Sep-08   Dec-08   Mar-09  Jun-09    Sep-09   Dec-09   Mar-10    Jun-10
                  KFED                             Peer Group Median

KFED 9/30/10 = 3.2%

Note: Dollar values in thousands.

                                                                              13
|
 |
ASSET QUALITY
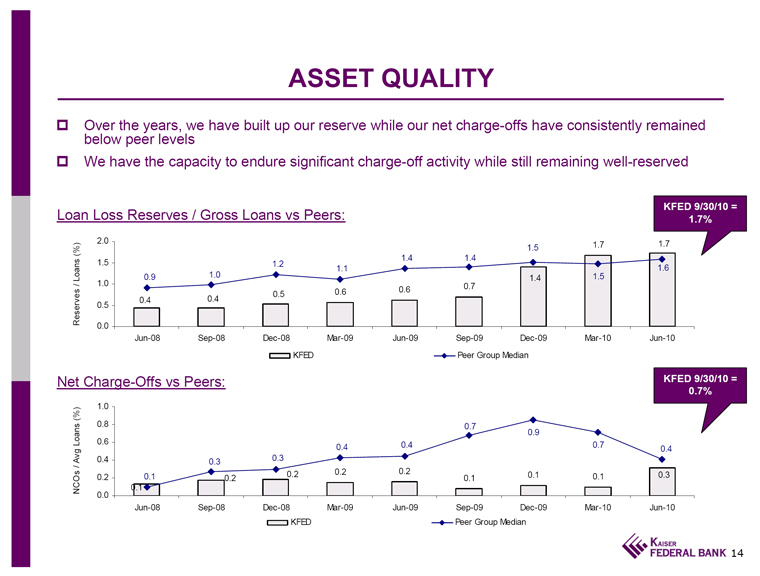
o Over the years, we have built up our reserve while our net charge-offs
have consistently remained below peer levels
o We have the capacity to endure significant charge-off activity while still
remaining well-reserved
Loan Loss Reserves / Gross Loans vs Peers:
Reserves / Loans (%)
2.0
1.5
1.0
0.5 0.9 1.0 1.2 1.1 1.4 1.4 1.5 1.7 1.7
0.0 0.4 0.4 0.5 0.6 0.6 0.7 1.4 1.5 1.6
Jun-08 Sep-08 Dec-08 Mar-09 Jun-09 Sep-09 Dec-09 Mar-10 Jun-10
KFED Peer Group Median
KFED 9/30/10 = 1.7%
Net Charge-Offs vs Peers:
NCOs / Avg Loans (%)
1.0
0.8
0.6
0.4
0.2 0.1 0.3 0.3 0.4 0.4 0.7 0.9 0.7 0.4
0.0 0.1 0.2 0.2 0.2 0.2 0.1 0.1 0.1 0.3
Jun-08 Sep-08 Dec-08 Mar-09 Jun-09 Sep-09 Dec-09 Mar-10 Jun-10
KFED Peer Group Median
KFED 9/30/10 = 0.7%
14
|
 |
KFED IS A SOLID PERFORMER
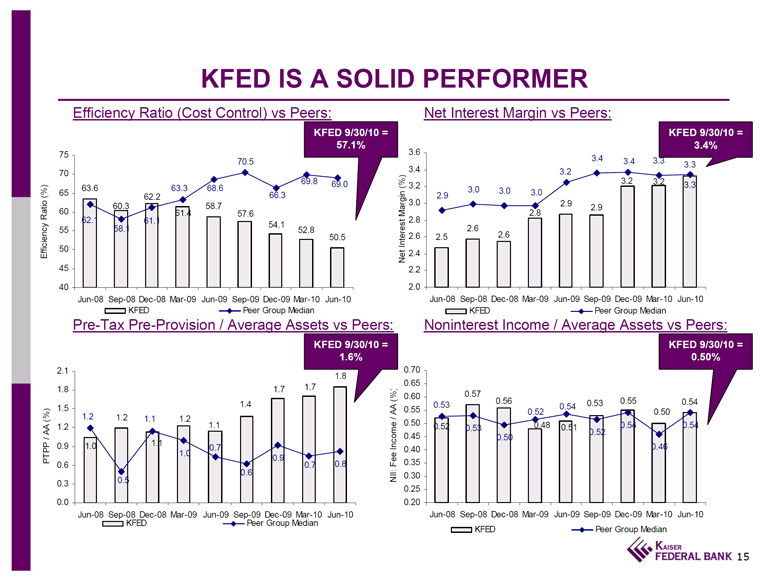
Efficiency Ratio (Cost Control) vs Peers:
Efficiency Ratio (%)
75
70
65
60
55
50
45 63.6 60.3 62.2 63.3 68.6 70.5 66.3 69.8 69.0
40 62.1 58.1 61.1 61.4 58.7 57.6 54.1 52.8 50.5
Jun-08 Sep-08 Dec-08 Mar-09 Jun-09 Sep-09 Dec-09 Mar-10 Jun-10
KFED Peer Group Median
KFED 9/30/10 = 57.1%
Net Interest Margin vs Peers:
Net Interest Margin (%)
3.6
3.4
3.2
3.0
2.8
2.6
2.2 2.9 3.0 3.0 3.0 3.2 3.4 3.4 3.3 3.3
2.0 2.5 2.6 2.6 2.8 2.9 2.9 3.2 3.2 3.3
Jun-08 Sep-08 Dec-08 Mar-09 Jun-09 Sep-09 Dec-09 Mar-10 Jun-
KFED Peer Group Median
KFED 9/30/10 = 3.4%
Pre-Tax Pre-Provision / Average Assets vs Peers:
PTPP / AA (%)
2.1
1.8
1.5
1.2
0.9
0.6
0.3 1.2 1.2 1.1 1.2 1.1 1.4 1.7 1.7 1.8
0.0 1.0 0.5 1.1 1.0 0.7 0.6 0.9 0.7 0.8
Jun-08 Sep-08 Dec-08 Mar-09 Jun-09 Sep-09 Dec-09 Mar-10 Jun-10
KFED Peer Group Median
KFED 9/30/10 = 1.6%
Noninterest Income / Average Assets vs Peers:
NII: Fee Income / AA (%)
0.70
0.65
0.60
0.55
0.50
0.45
0.40
0.35
0.30
0.25 0.53 0.57 0.56 0.52 0.54 0.53 0.55 0.50 0.54
0.20 0.52 0.53 0.50 0.48 0.51 0.52 0.54 0.46 0.54
Jun-08 Sep-08 Dec-08 Mar-09 Jun-09 Sep-09 Dec-09 Mar-10 Jun-10
KFED Peer Group Median
KFED 9/30/10 = 0.50%
15
|
 |
STRONG PERFORMER THROUGH THE RECESSION
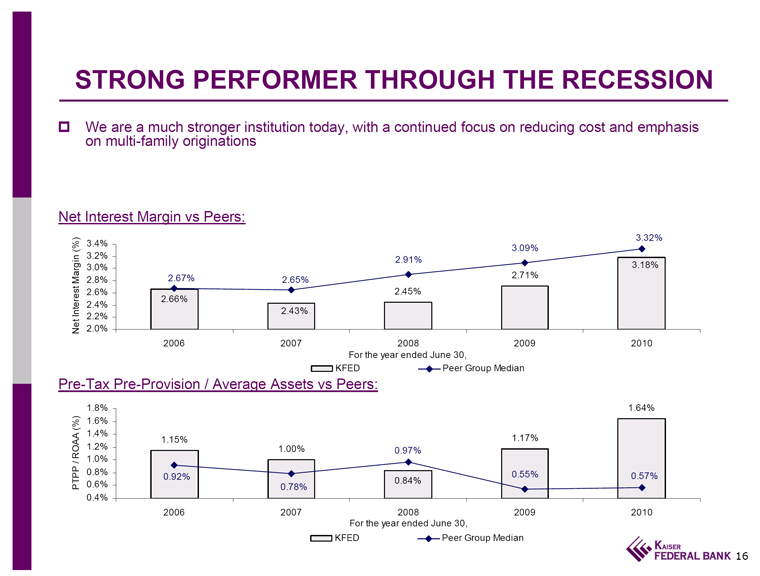
o We are a much stronger institution today, with a continued focus on
reducing cost and emphasis on multi-family originations
Net Interest Margin vs Peers:
Net Interest Margin (%)
3.4%
3.2%
3.0%
2.8%
2.6%
2.4%
2.2%
2.0%
2.67% 2.65% 2.91% 3.09% 3.32%
2.66% 2.43% 2.45% 2.71% 3.18%
2006 2007 2008 2009 2010
For the year ended June 30,
KFED Peer Group Median
Pre-Tax Pre-Provision / Average Assets vs Peers:
PTPP / ROAA (%)
1.8%
1.6%
1.4%
1.2%
1.0%
0.8%
0.6%
0.4%
1.15% 1.00% 0.97% 1.17% 1.64%
0.92% 0.78% 0.84% 0.55% 0.57%
2006 2007 2008 2009 2010
For the year ended June 30,
KFED Peer Group Median
16
|
 |
 BUILDING STOCKHOLDER VALUE

o     Our business strategy in a difficult economic and operating environment
      has retained shareholder value

o     We have maintained a strong history of paying quarterly dividends to our
      public shareholders

      o     We have continued to sustain a quarterly dividend

      o     Being well capitalized after a second-step conversion offering
            allows us to continue to pay a dividend unlike some of our peers

o     Since March 31, 2004, we have repurchased 1,438,240 shares for an
      aggregate amount of $18.3 million

o     We currently pay an annual dividend of $0.44 per share and our current
      dividend yield and dividend payout ratio are 5.75% and 52.22%,
      respectfully(1)

(1) Pricing as of November 2, 2010. Note: KFED’s dividend payout ratio is
based off of core earnings for the last twelve months and is calculated using
actual dividends paid out, excluding those waived by K-Fed Bancorp’s
mutual holding company parent, K-Fed Mutual Holding Company, divided by net
income.

                                                                              17
|
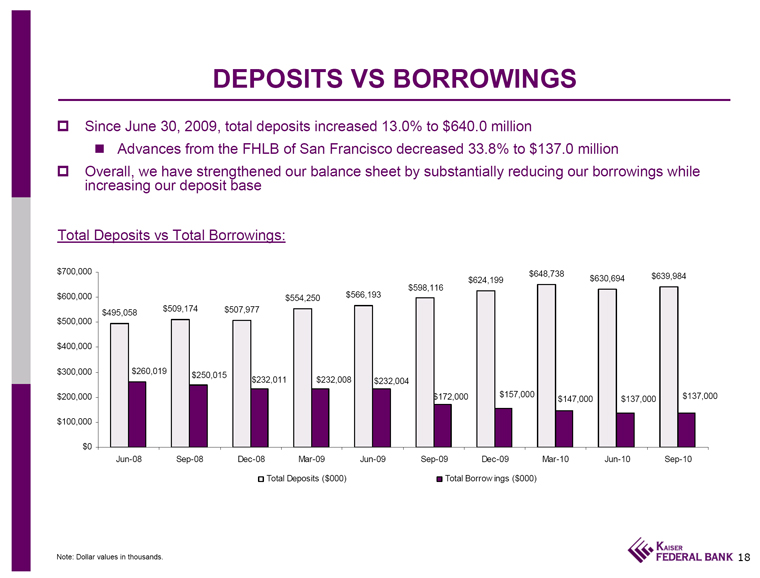 |
 DEPOSITS VS BORROWINGS

o     Since June 30, 2009, total deposits increased 13.0% to $640.0 million

      o     Advances from the FHLB of San Francisco decreased 33.8% to $137.0
            million

o     Overall, we have strengthened our balance sheet by substantially reducing
      our borrowings while increasing our deposit base

Total Deposits vs Total Borrowings:


$700,000
$600,000
$500,000
$400,000
$300,000
$200,000
$100,000
$0

  $495,058   $509,174  $507,977  $554,250  $566,193   $598,116   $624,199 $648,738   $630,694  $639,984
  $260,019   $250,015  $232,011  $232,008  $232,004   $172,000   $157,000 $147,000   $137,000  $137,000
  Jun-08     Sep-08    Dec-08    Mar-09    Jun-09     Sep-09     Dec-09   Mar-10     Jun-10    Sep-10

  Total Deposits ($000)         Total Borrow ings ($000)

Note: Dollar values in thousands.                                             18
|
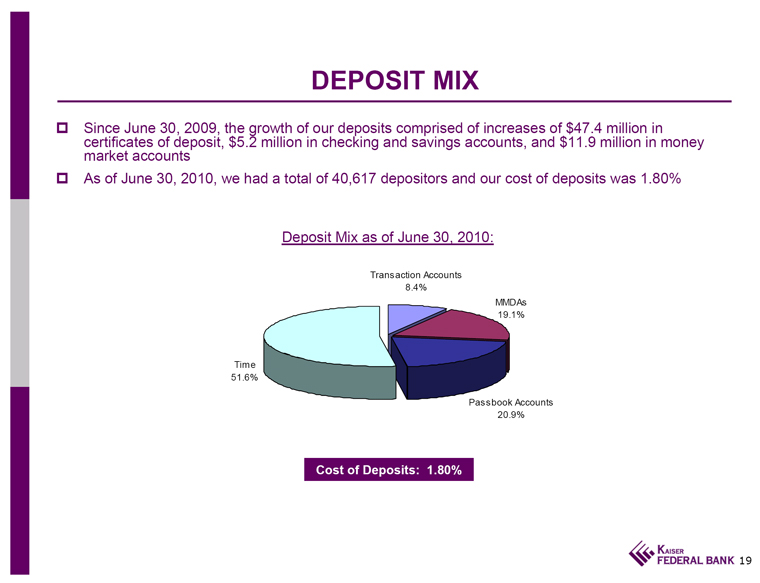 |
 DEPOSIT MIX

o     Since June 30, 2009, the growth of our deposits comprised of increases of
      $47.4 million in certificates of deposit, $5.2 million in checking and
      savings accounts, and $11.9 million in money market accounts

o     As of June 30, 2010, we had a total of 40,617 depositors and our cost of
      deposits was 1.80%

                        Deposit Mix as of June 30, 2010:

Transaction Accounts             8.4%

MMDAs                           19.1%

Time                            51.6%

Passbook Accounts               20.9%

                             Cost of Deposits: 1.80%

                                                                              19
|
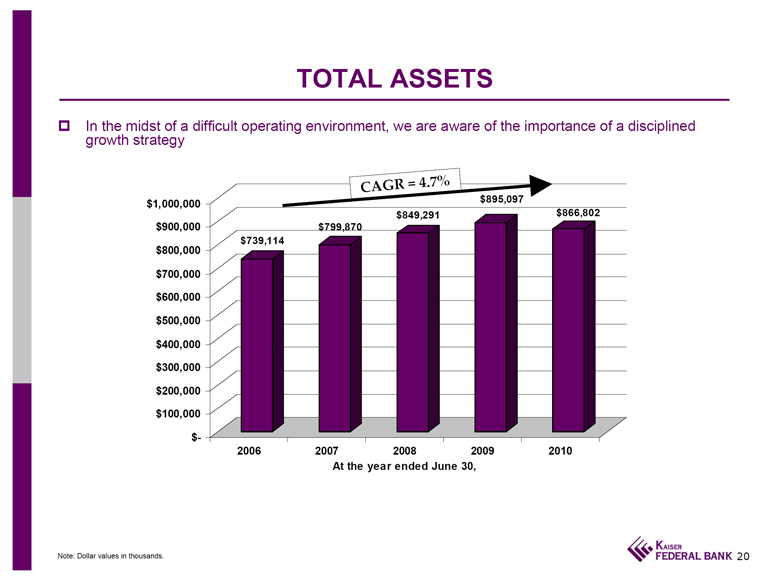 |
 TOTAL ASSETS

o     In the midst of a difficult operating environment, we are aware of the
      importance of a disciplined growth strategy

                                          CA GR = 4.7 %
$1,000,000
$  900,000
$  800,000
$  700,000
$  600,000
$  500,000
$  400,000
$  300,000
$  200,000
$  100,000
$        -
               $739,114    $799,870    $849,291   $895,097  $866,802
                 2006        2007         2008      2009      2010

                           At the year ended June 30,

Note: Dollar values in thousands.                                             20
|
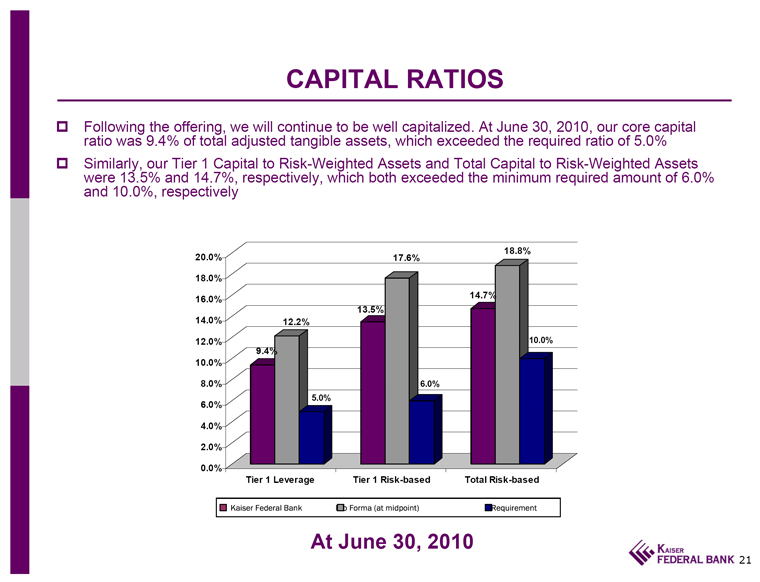 |
 CAPITAL RATIOS

o     Following the offering, we will continue to be well capitalized. At June
      30, 2010, our core capital ratio was 9.4% of total adjusted tangible
      assets, which exceeded the required ratio of 5.0%

o     Similarly, our Tier 1 Capital to Risk-Weighted Assets and Total Capital to
      Risk-Weighted Assets were 13.5% and 14.7%, respectively, which both
      exceeded the minimum required amount of 6.0% and 10.0%, respectively

20.0%
18.0%
16.0%

14.0%
12.0%

10.0%
8.0%

6.0%
4.0%
2.0%
0.0%            9.4%  12.2% 5.0%     13.5% 17.6% 6.0%     14.7%  18.8%  10.0%
                 Tier 1 Leverage     Tier 1 Risk-based     Total Risk-based

Kaiser Federal Bank        Pro Forma (at midpoint)            Requirement

                                At June 30, 2010

                                                                              21
|
 |
 FUTURE OPPORTUNITIES THROUGH ACQUISITION

o     Our management team has proven to be effective in its ability to
      assimilate an acquired branch’s operations

      o     In 2004, we acquired $60 million in deposits from United PanAm
            Financial Corporation

o     As a fully converted stock holding company, we will have greater
      flexibility in structuring future mergers and acquisitions

      o     The new stock holding company structure will enable us to offer
            stock or cash for consideration without restriction and therefore
            will enhance our ability to compete with other bidders when
            acquisition opportunities arise

o     Through the retention of the offerings proceeds, we will consider
      expanding our market presence through traditional M&A and FDIC-assisted
      acquisitions, primarily in Southern California

o     We will focus on the following attributes of potential acquisition
      targets:

      o     Franchise fit, attractive market demographics

            o     Acquiring branches in close proximity to Kaiser Permanente
                  Medical Centers in Southern California and surrounding
                  communities

      o     Platform that provides opportunity for sustained growth

      o     Potential for operating cost synergies

      o     Established management team with knowledge of local market

      o     Balance sheet makeup: low cost of funds, diversified loan portfolio,
            manageable asset quality

      o     Social and cultural fit

                                                                              22
|
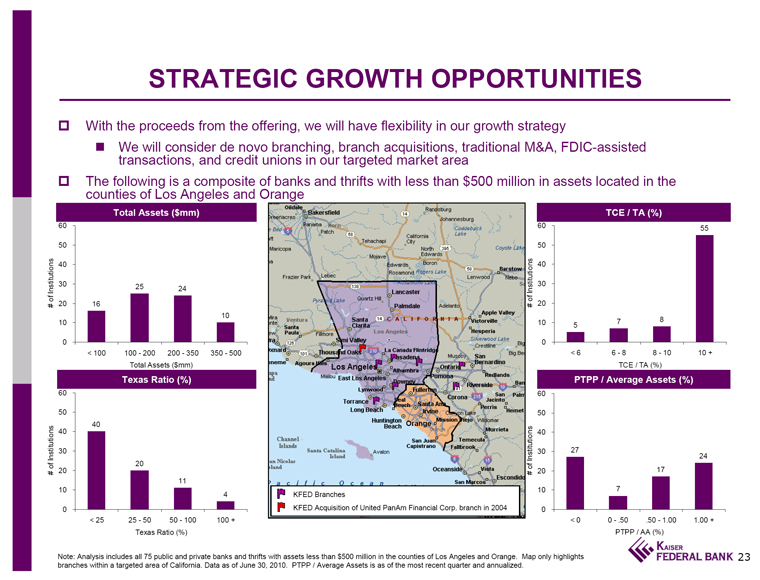 |
 STRATEGIC GROWTH OPPORTUNITIES

o     With the proceeds from the offering, we will have flexibility in our
      growth strategy

      o     We will consider de novo branching, branch acquisitions, traditional
            M&A, FDIC-assisted transactions, and credit unions in our targeted
            market area

o     The following is a composite of banks and thrifts with less than $500
      million in assets located in the counties of Los Angeles and Orange
                       Total Assets ($mm)
                       # of Institutions
60
50
40
30
20
10
0
        16        25            24         10
      < 100    100 - 200    200 - 350   350 - 500

                       Total Assets ($mm)

                       Texas Ratio (%)
                       # of Institutions
60
50
40
30
20
10
0
        40       20        11        4
       < 25   25 - 50   50 - 100   100 +

                       Texas Ratio (%)

KFED Branches

KFED Acquisition of United PanAm Financial Corp. branch in 2004

                       TCE / TA (%)
                       # of Institutions
60
50
40
30
20
10
0
         5      7         8         55
       < 6    6 - 8     8 - 10     10 +

                       TCE / TA (%)

          PTPP / Average Assets (%)
              # of Institutions
60
50
40
30
20
10
0
        27      7          17          24
       < 0    0 -.50   .50 - 1.00    1.00 +

                       PTPP / AA (%)

Note: Analysis includes all 75 public and private banks and thrifts with assets
less than $500 million in the counties of Los Angeles and Orange. Map only
highlights branches within a targeted area of California. Data as of June 30,
2010. PTPP / Average Assets is as of the most recent quarter and annualized.

                                                                              23
|
 |
 WHY INVEST IN
                         KAISER FEDERAL FINANCIAL GROUP

o     Experienced management team

o     Strong asset quality

o     Historically consistent capital management strategies

o     Sustained performance even in a tough economic environment

o     KFFG operates in a niche market

o     Strong franchise in an attractive market area

o     Has solid potential for growth

o     Capital raised will position KFFG to finance the acquisition of financial
      institutions

o     Favorable valuation

                                                                              24
|
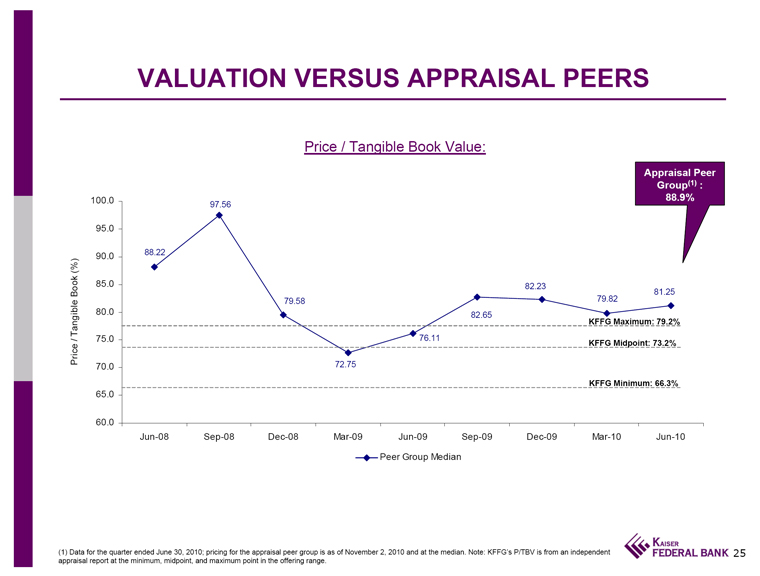 |
VALUATION VERSUS APPRAISAL PEERS

                          Price / Tangible Book Value:

                                                                  Appraisal Peer
                                                                     Group(1):
                                                                       88.9%

Price / Tangible Book (%)

100.0
95.0
90.0                                                            KFFG Maximum: 79.2%
85.0
80.0                                                            KFFG Midpoint: 73.2%
75.0
70.0                                                            KFFG Minimum: 66.3%
65.0
60.0
      88.22      97.56     79.58     72.75     76.11     82.65     82.23   79.82     81.25
      Jun-08     Sep-08    Dec-08    Mar-09    Jun-09    Sep-09    Dec-09  Mar-10    Jun-10

                                Peer Group Median

(1) Data for the quarter ended June 30, 2010; pricing for the appraisal peer
group is as of November 2, 2010 and at the median. Note: KFFG’s P/TBV is
from an independent appraisal report at the minimum, midpoint, and maximum
point in the offering range.

                  25
|
 |
 THANK YOU VERY MUCH FOR
                                 YOUR TIME TODAY

                           WE LOOK FORWARD TO VISITING
                           WITH YOU AND ANSWERING ANY
                            QUESTIONS YOU MIGHT HAVE
|
 | APPENDIX 27 |
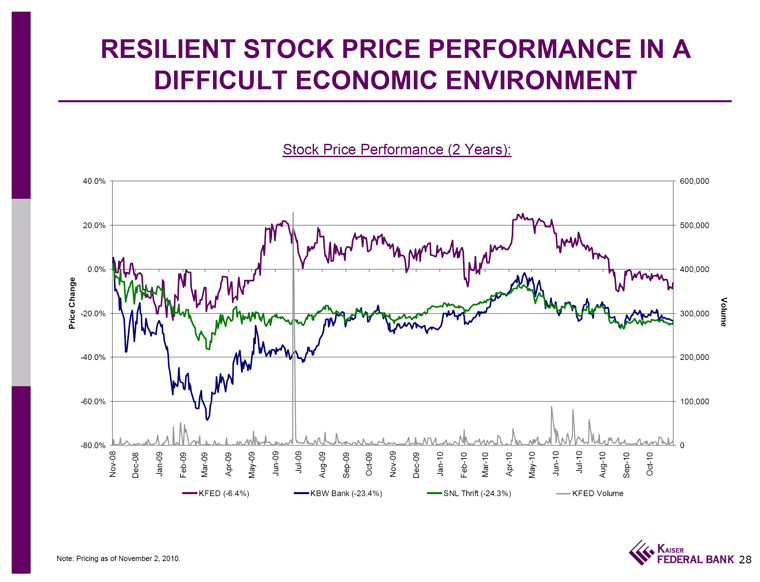 |
RESILIENT STOCK PRICE PERFORMANCE IN A
                         DIFFICULT ECONOMIC ENVIRONMENT

                       Stock Price Performance (2 Years):

                     Price Change           Volume

 Nov-08                 -40.0%               600,000
 Dec-08                 -20.0%               500,000
 Jan-09                   0.0%                 400,000
 Feb-09                  20.0%               300,000
 Mar-09                  40.0%              200,000
 Apr-09                 -60.0%              100,000
 May-09                 -80.0%                     0
 Jun-09
 Jul-09
 Aug-09
 Sep-09
 Oct-09
 Nov-09
 Dec-09
 Jan-10
 Feb-10
 Mar-10
 Apr-10
 May-10
 Jun-10
 Jul-10
 Aug-10
 Sep-10
 Oct-10

KFED (-6.4%)   KBW Bank (-23.4%)     SNL Thrift (-24.3%)       KFED Volume

Note: Pricing as of November 2, 2010.

                            28
|
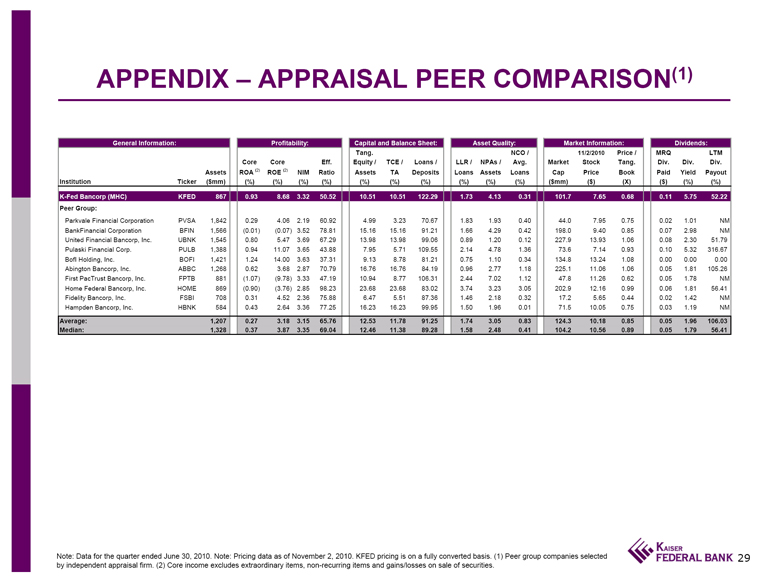 |
APPENDIX - APPRAISAL PEER COMPARISON(1)

 General Information:                  Profitability:         Capital and Balance Sheet:        Asset Quality:           Market Information:               Dividends:
                                                                Tang.                                        NCO /          11/2/2010  Price /     MRQ            LTM
                                Core    Core            Eff.   Equity /  TCE /  Loans /   LLR /    NPAs /     Avg.   Market   Stock     Tang.     Div.     Div.   Div.
                       Assets ROA (2) ROE (2)   NIM    Ratio    Assets    TA    Deposits  Loans    Assets    Loans     Cap    Price      Book     Paid    Yield  Payout
  Institution   Ticker ($mm)    (%)     (%)     (%)     (%)      (%)      (%)     (%)      (%)      (%)       (%)     ($mm)    ($)       (X)       ($)     (%)    (%)

K-Fed Bancorp   KFED       867    0.93    8.68    3.32   50.52     10.51  10.51    122.29    1.73      4.13      0.31  101.7      7.65      0.68     0.11    5.75 52.22
   (MHC)
Peer Group:
Parkvale        PVSA     1,842    0.29    4.06    2.19   60.92      4.99   3.23     70.67    1.83      1.93      0.40   44.0      7.95      0.75     0.02    1.01    NM
   Financial
   Corporation
BankFinancial   BFIN     1,566  (0.01)  (0.07)    3.52   78.81     15.16  15.16     91.21    1.66      4.29      0.42  198.0      9.40      0.85     0.07    2.98    NM
   Corporation
United          UBNK     1,545    0.80    5.47    3.69   67.29     13.98  13.98     99.06    0.89      1.20      0.12  227.9     13.93      1.06     0.08    2.30 51.79
   Financial
   Bancorp, Inc.
Pulaski         PULB     1,388    0.94   11.07    3.65   43.88      7.95   5.71    109.55    2.14      4.78      1.36   73.6      7.14      0.93     0.10    5.32316.67
   Financial
   Corp.
BofI Holding,   BOFI     1,421    1.24   14.00    3.63   37.31      9.13   8.78     81.21    0.75      1.10      0.34  134.8     13.24      1.08     0.00    0.00  0.00
   Inc.
Abington        ABBC     1,268    0.62    3.68    2.87   70.79     16.76  16.76     84.19    0.96      2.77      1.18  225.1     11.06      1.06     0.05    1.81105.26
   Bancorp, Inc.
First PacTrust  FPTB       881  (1.07)  (9.78)    3.33   47.19     10.94   8.77    106.31    2.44      7.02      1.12   47.8     11.26      0.62     0.05    1.78    NM
   Bancorp, Inc.
Home Federal    HOME       869  (0.90)  (3.76)    2.85   98.23     23.68  23.68     83.02    3.74      3.23      3.05  202.9     12.16      0.99     0.06    1.81 56.41
   Bancorp, Inc.
Fidelity        FSBI       708    0.31    4.52    2.36   75.88      6.47   5.51     87.36    1.46      2.18      0.32   17.2      5.65      0.44     0.02    1.42    NM
   Bancorp, Inc.
Hampden         HBNK       584    0.43    2.64    3.36   77.25     16.23  16.23     99.95    1.50      1.96      0.01   71.5     10.05      0.75     0.03    1.19    NM
   Bancorp, Inc.
Average:                 1,207    0.27    3.18    3.15   65.76     12.53  11.78     91.25    1.74      3.05      0.83  124.3     10.18      0.85     0.05    1.96106.03
Median:                  1,328    0.37    3.87    3.35   69.04     12.46  11.38     89.28    1.58      2.48      0.41  104.2     10.56      0.89     0.05    1.79 56.41

Note: Data for the quarter ended June 30, 2010. Note: Pricing data as of
November 2, 2010. KFED pricing is on a fully converted basis. (1) Peer group
companies selected  by independent appraisal firm. (2) Core income excludes
extraordinary items, non-recurring items and gains/losses on sale of securities.

                                    29
|