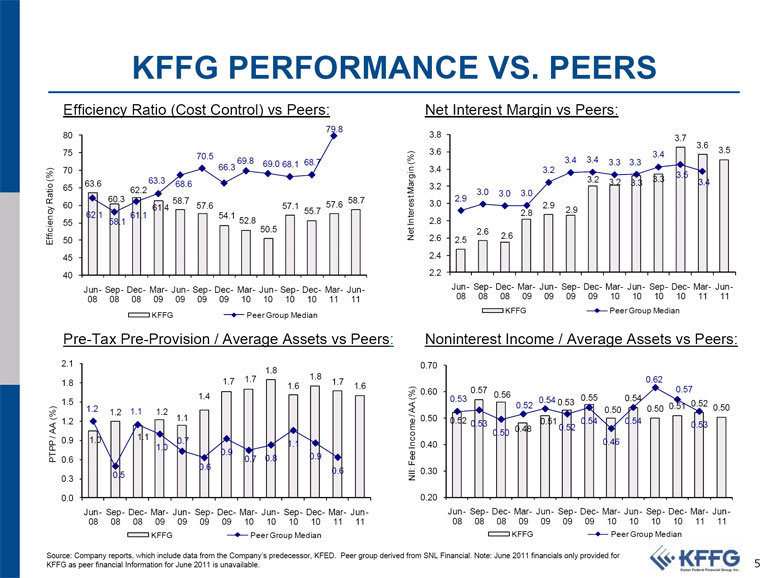
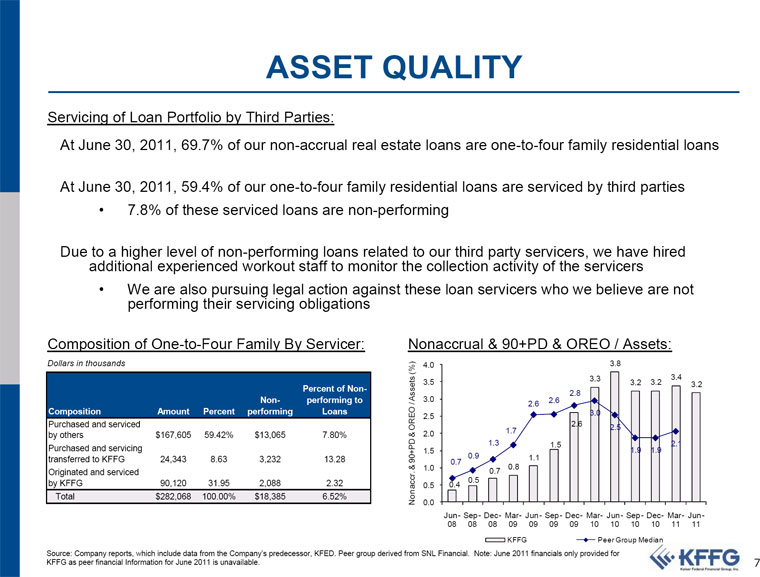
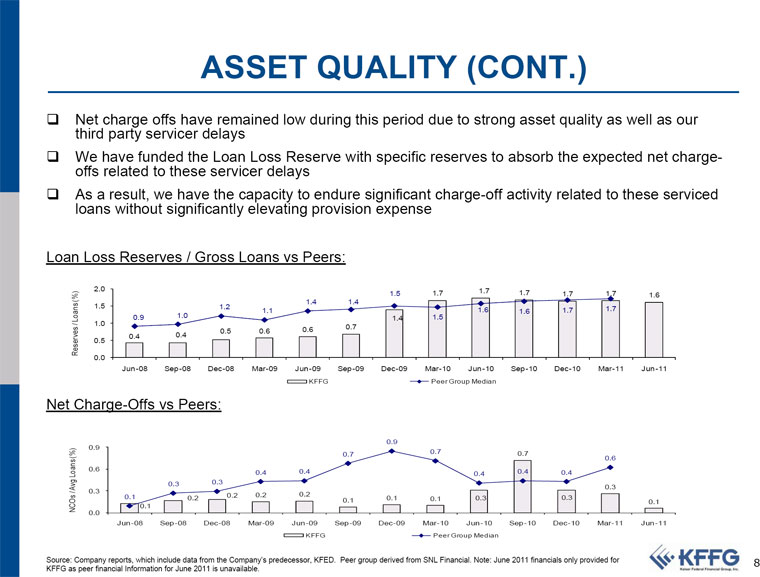
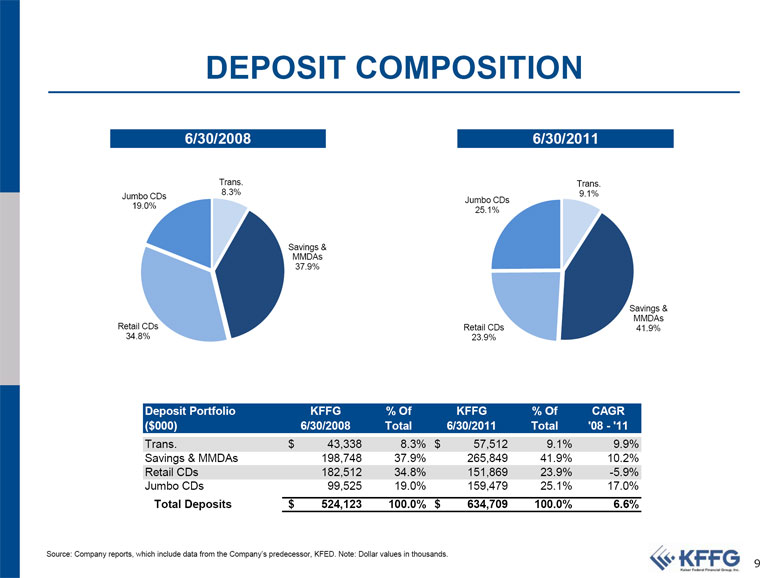
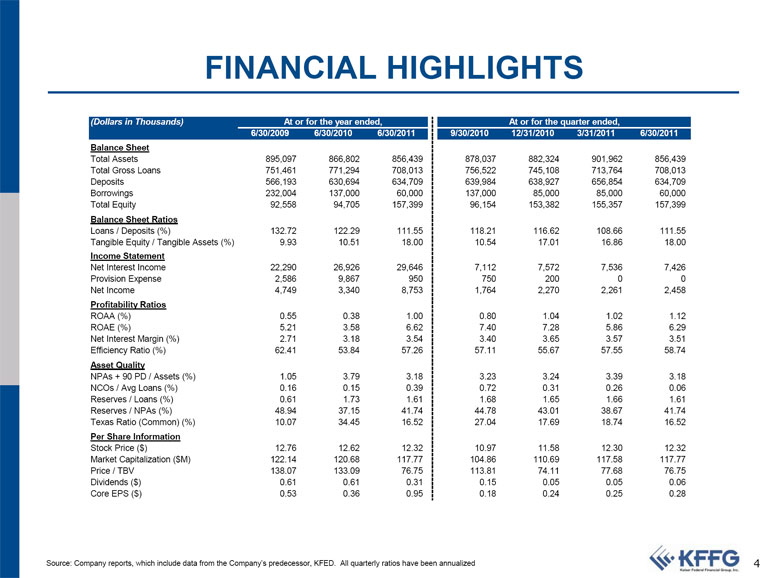
 | FINANCIAL HIGHLIGHTS (Dollars in Thousands) At or for the year ended, At or for the quarter ended, 6/30/2009 6/30/2010 6/30/2011 9/30/2010 12/31/2010 3/31/2011 6/30/2011 Balance Sheet Total Assets 895,097 866,802 856,439 878,037 882,324 901,962 856,439 Total Gross Loans 751,461 771,294 708,013 756,522 745,108 713,764 708,013 Deposits 566,193 630,694 634,709 639,984 638,927 656,854 634,709 Borrowings 232,004 137,000 60,000 137,000 85,000 85,000 60,000 Total Equity 92,558 94,705 157,399 96,154 153,382 155,357 157,399 Balance Sheet Ratios Loans / Deposits (%) 132.72 122.29 111.55 118.21 116.62 108.66 111.55 Tangible Equity / Tangible Assets (%) 9.93 10.51 18.00 10.54 17.01 16.86 18.00 Income Statement Net Interest Income 22,290 26,926 29,646 7,112 7,572 7,536 7,426 Provision Expense 2,586 9,867 950 750 200 0 0 Net Income 4,749 3,340 8,753 1,764 2,270 2,261 2,458 Profitability Ratios ROAA (%) 0.55 0.38 1.00 0.80 1.04 1.02 1.12 ROAE (%) 5.21 3.58 6.62 7.40 7.28 5.86 6.29 Net Interest Margin (%) 2.71 3.18 3.54 3.40 3.65 3.57 3.51 Efficiency Ratio (%) 62.41 53.84 57.26 57.11 55.67 57.55 58.74 Asset Quality NPAs + 90 PD / Assets (%) 1.05 3.79 3.18 3.23 3.24 3.39 3.18 NCOs / Avg Loans (%) 0.16 0.15 0.39 0.72 0.31 0.26 0.06 Reserves / Loans (%) 0.61 1.73 1.61 1.68 1.65 1.66 1.61 Reserves / NPAs (%) 48.94 37.15 41.74 44.78 43.01 38.67 41.74 Texas Ratio (Common) (%) 10.07 34.45 16.52 27.04 17.69 18.74 16.52 Per Share Information Stock Price ($) 12.76 12.62 12.32 10.97 11.58 12.30 12.32 Market Capitalization ($M) 122.14 120.68 117.77 104.86 110.69 117.58 117.77 Price / TBV 138.07 133.09 76.75 113.81 74.11 77.68 76.75 Dividends ($) 0.61 0.61 0.31 0.15 0.05 0.05 0.06 Core EPS ($) 0.53 0.36 0.95 0.18 0.24 0.25 0.28 Source: Company reports, which include data from the Company’s predecessor, KFED. All quarterly ratios have been annualized 4 |
