October 2013 Investor Presentation
Forward - Looking Statements Except for the historical information contained in this presentation, the matters discussed may be deemed to be forward - looking statements, within the meaning of the Private Securities Litigation Reform Act of 1995, that involve risks and uncertainties. Forward - looking statements can be identified by the fact that they do not relate strictly to historical or current facts. They often include words like “believe,” “expect,” “anticipate,” “estimate” and “intend” or future or conditional verbs such as “will,” “would,” “should,” “could” or “may.” Forward - looking statements, by their nature, are subject to risks and uncertainties. Certain factors that could cause actual results to differ materially from expected results include increased competitive pressures; changes in the interest rate environment; demand for loans in Simplicity Bank’s market area; adverse changes in general economic conditions, either nationally or in Simplicity Bank’s market areas; adverse changes within the securities markets; legislative and regulatory changes that could adversely affect the business in which the Company and its subsidiary are engaged; the future earnings and capital levels of Simplicity Bank, which would affect the ability of the Company to pay dividends in accordance with its dividend policies; and other risks detailed from time to time in the Company’s Securities and Exchange Commission filings. Actual strategies and results in future periods may differ materially from those currently expected. We caution readers not to place undue reliance on forward - looking statements. The Company disclaims any obligation to revise or update any forward - looking statements contained in this release to reflect future events or developments. 2
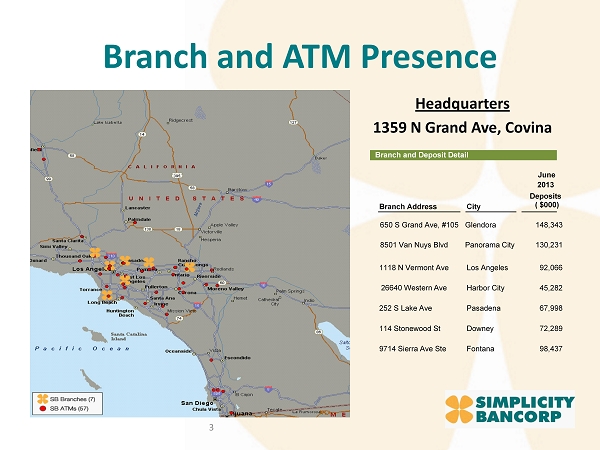
Branch and ATM Presence Headquarters 1359 N Grand Ave, Covina 3 Branch and Deposit Detail Branch Address City June 2013 Deposits ( $000) 8501 Van Nuys Blvd Panorama City 130,231 650 S Grand Ave, #105 Glendora 148,343 1118 N Vermont Ave Los Angeles 92,066 Harbor City 45,282 252 S Lake Ave Pasadena 67,998 114 Stonewood St Downey 72,289 9714 Sierra Ave Ste Fontana 98,437 26640 Western Ave
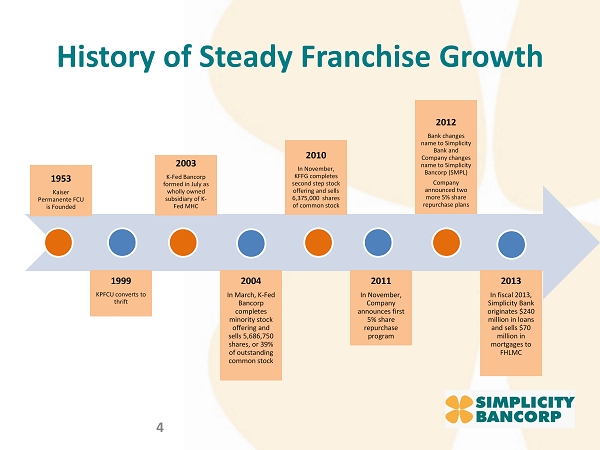
History of Steady Franchise Growth 4 1953 Kaiser Permanente FCU is Founded 1999 KPFCU converts to thrift 2003 K - Fed Bancorp formed in July as wholly owned subsidiary of K - Fed MHC 2004 In March, K - Fed Bancorp completes minority stock offering and sells 5,686,750 shares, or 39% of outstanding common stock 2010 In November, KFFG completes second step stock offering and sells 6,375,000 shares of common stock 2011 In November, Company announces first 5% share repurchase program 2012 Bank changes name to Simplicity Bank and Company changes name to Simplicity Bancorp (SMPL) Company announced two more 5% share repurchase plans 2013 In fiscal 2013, Simplicity Bank originates $240 million in loans and sells $70 million in mortgages to FHLMC
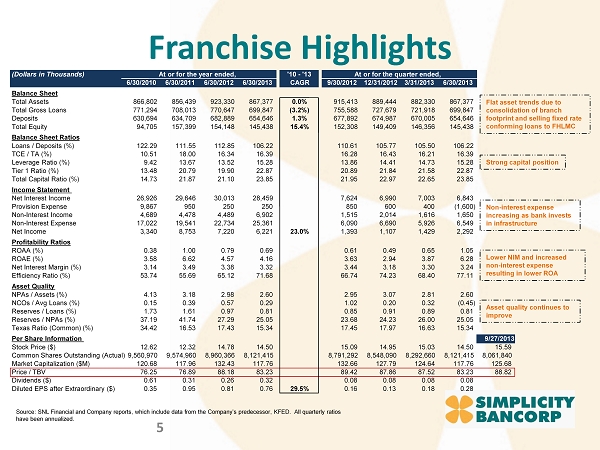
Franchise Highlights 5 Flat asset trends due to consolidation of branch footprint and selling fixed rate conforming loans to FHLMC Strong capital position Non - interest expense increasing as bank invests in infrastructure Asset quality continues to improve Lower NIM and increased non - interest expense resulting in lower ROA Source: SNL Financial and Company reports, which include data from the Company’s predecessor, KFED. All quarterly ratios have been annualized. (Dollars in Thousands) At or for the year ended, '10 - '13 At or for the quarter ended, 6/30/2010 6/30/2011 6/30/2012 6/30/2013 CAGR 9/30/2012 12/31/2012 3/31/2013 6/30/2013 Balance Sheet Total Assets 866,802 856,439 923,330 867,377 0.0% 915,413 889,444 882,330 867,377 Total Gross Loans 771,294 708,013 770,647 699,847 (3.2%) 755,588 727,679 721,918 699,847 Deposits 630,694 634,709 682,889 654,646 1.3% 677,892 674,987 670,005 654,646 Total Equity 94,705 157,399 154,148 145,438 15.4% 152,308 149,409 146,356 145,438 Balance Sheet Ratios Loans / Deposits (%) 122.29 111.55 112.85 106.22 110.61 105.77 105.50 106.22 TCE / TA (%) 10.51 18.00 16.34 16.39 16.28 16.43 16.21 16.39 Leverage Ratio (%) 9.42 13.67 13.52 15.28 13.86 14.41 14.73 15.28 Tier 1 Ratio (%) 13.48 20.79 19.90 22.87 20.89 21.84 21.58 22.87 Total Capital Ratio (%) 14.73 21.87 21.10 23.85 21.95 22.97 22.65 23.85 Income Statement Net Interest Income 26,926 29,646 30,013 28,459 7,624 6,990 7,003 6,843 Provision Expense 9,867 950 250 250 850 600 400 (1,600) Non - Interest Income 4,689 4,478 4,489 6,902 1,515 2,014 1,616 1,650 Non - Interest Expense 17,022 19,541 22,734 25,361 6,090 6,690 5,926 6,549 Net Income 3,340 8,753 7,220 6,221 23.0% 1,393 1,107 1,429 2,292 Profitability Ratios ROAA (%) 0.38 1.00 0.79 0.69 0.61 0.49 0.65 1.05 ROAE (%) 3.58 6.62 4.57 4.16 3.63 2.94 3.87 6.28 Net Interest Margin (%) 3.14 3.49 3.38 3.32 3.44 3.18 3.30 3.24 Efficiency Ratio (%) 53.74 55.69 65.12 71.68 66.74 74.23 68.40 77.11 Asset Quality NPAs / Assets (%) 4.13 3.18 2.98 2.60 2.95 3.07 2.81 2.60 NCOs / Avg Loans (%) 0.15 0.39 0.57 0.29 1.02 0.20 0.32 (0.45) Reserves / Loans (%) 1.73 1.61 0.97 0.81 0.85 0.91 0.89 0.81 Reserves / NPAs (%) 37.19 41.74 27.29 25.05 23.68 24.23 26.00 25.05 Texas Ratio (Common) (%) 34.42 16.53 17.43 15.34 17.45 17.97 16.63 15.34 Per Share Information 9/27/2013 Stock Price ($) 12.62 12.32 14.78 14.50 15.09 14.95 15.03 14.50 15.59 Common Shares Outstanding (Actual) 9,560,970 9,574,960 8,960,366 8,121,415 8,791,292 8,548,090 8,292,660 8,121,415 8,061,840 Market Capitalization ($M) 120.68 117.96 132.43 117.76 132.66 127.79 124.64 117.76 125.68 Price / TBV 76.25 76.89 88.18 83.23 89.42 87.86 87.52 83.23 88.82 Dividends ($) 0.61 0.31 0.26 0.32 0.08 0.08 0.08 0.08 Diluted EPS after Extraordinary ($) 0.35 0.95 0.81 0.76 29.5% 0.16 0.13 0.18 0.28
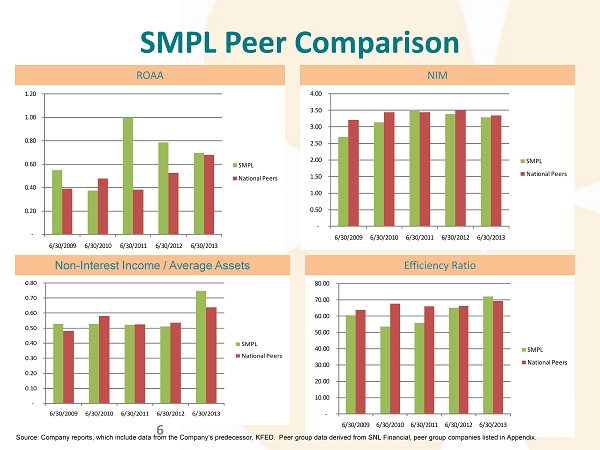
SMPL Peer Comparison 6 - 0.20 0.40 0.60 0.80 1.00 1.20 6/30/2009 6/30/2010 6/30/2011 6/30/2012 6/30/2013 SMPL National Peers ROAA - 0.50 1.00 1.50 2.00 2.50 3.00 3.50 4.00 6/30/2009 6/30/2010 6/30/2011 6/30/2012 6/30/2013 SMPL National Peers - 10.00 20.00 30.00 40.00 50.00 60.00 70.00 80.00 6/30/2009 6/30/2010 6/30/2011 6/30/2012 6/30/2013 SMPL National Peers NIM Non - Interest Income / Average Assets Efficiency Ratio Source: Company reports, which include data from the Company’s predecessor, KFED. Peer group data derived from SNL Financial , p eer group companies listed in Appendix. - 0.10 0.20 0.30 0.40 0.50 0.60 0.70 0.80 6/30/2009 6/30/2010 6/30/2011 6/30/2012 6/30/2013 SMPL National Peers
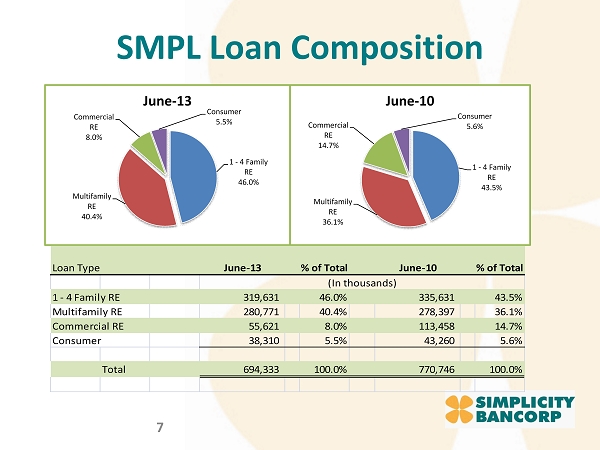
SMPL Loan Composition 7 1 - 4 Family RE 46.0% Multifamily RE 40.4% Commercial RE 8.0% Consumer 5.5% June - 13 1 - 4 Family RE 43.5% Multifamily RE 36.1% Commercial RE 14.7% Consumer 5.6% June - 10 Loan Type June-13 % of Total June-10 % of Total 1 - 4 Family RE 319,631 46.0% 335,631 43.5% Multifamily RE 280,771 40.4% 278,397 36.1% Commercial RE 55,621 8.0% 113,458 14.7% Consumer 38,310 5.5% 43,260 5.6% Total 694,333 100.0% 770,746 100.0% (In thousands)
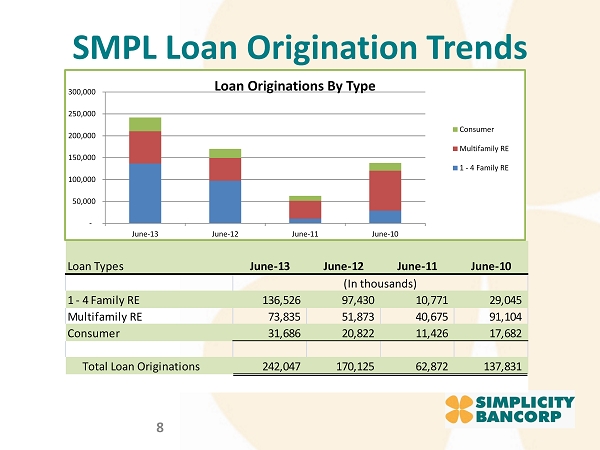
SMPL Loan Origination Trends 8 Loan Types June-13 June-12 June-11 June-10 1 - 4 Family RE 136,526 97,430 10,771 29,045 Multifamily RE 73,835 51,873 40,675 91,104 Consumer 31,686 20,822 11,426 17,682 Total Loan Originations 242,047 170,125 62,872 137,831 (In thousands) - 50,000 100,000 150,000 200,000 250,000 300,000 June-13 June-12 June-11 June-10 Loan Originations By Type Consumer Multifamily RE 1 - 4 Family RE
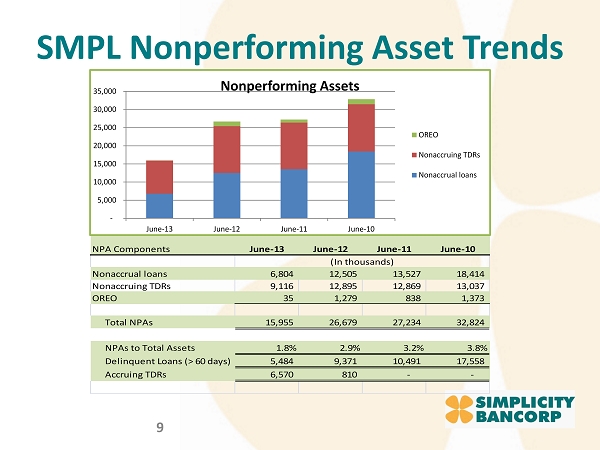
SMPL Nonperforming Asset Trends 9 NPA Components June-13 June-12 June-11 June-10 Nonaccrual loans 6,804 12,505 13,527 18,414 Nonaccruing TDRs 9,116 12,895 12,869 13,037 OREO 35 1,279 838 1,373 Total NPAs 15,955 26,679 27,234 32,824 NPAs to Total Assets 1.8% 2.9% 3.2% 3.8% Delinquent Loans (> 60 days) 5,484 9,371 10,491 17,558 Accruing TDRs 6,570 810 - - (In thousands) - 5,000 10,000 15,000 20,000 25,000 30,000 35,000 June-13 June-12 June-11 June-10 Nonperforming Assets OREO Nonaccruing TDRs Nonaccrual loans
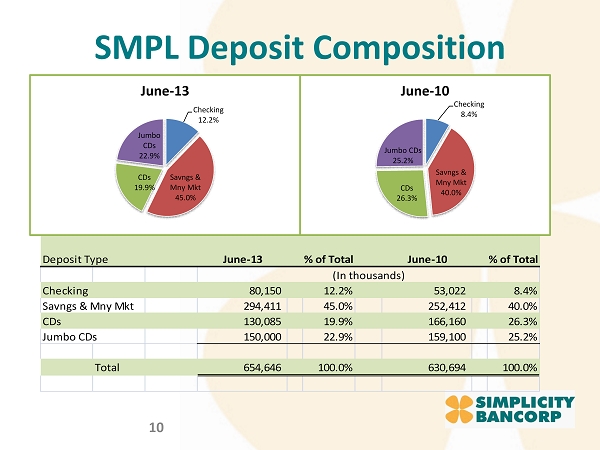
SMPL Deposit Composition 10 Deposit Type June-13 % of Total June-10 % of Total Checking 80,150 12.2% 53,022 8.4% Savngs & Mny Mkt 294,411 45.0% 252,412 40.0% CDs 130,085 19.9% 166,160 26.3% Jumbo CDs 150,000 22.9% 159,100 25.2% Total 654,646 100.0% 630,694 100.0% (In thousands) Checking 12.2% Savngs & Mny Mkt 45.0% CDs 19.9% Jumbo CDs 22.9% June - 13 Checking 8.4% Savngs & Mny Mkt 40.0% CDs 26.3% Jumbo CDs 25.2% June - 10
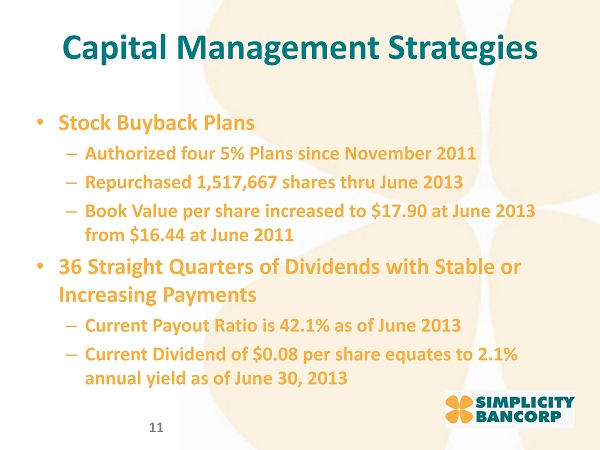
Capital Management Strategies 11 • Stock Buyback Plans – Authorized four 5% Plans since November 2011 – Repurchased 1,517,667 shares thru June 2013 – Book Value per share increased to $17.90 at June 2013 from $16.44 at June 2011 • 36 Straight Quarters of Dividends with Stable or Increasing Payments – Current Payout Ratio is 42.1% as of June 2013 – Current Dividend of $0.08 per share equates to 2.1% annual yield as of June 30, 2013
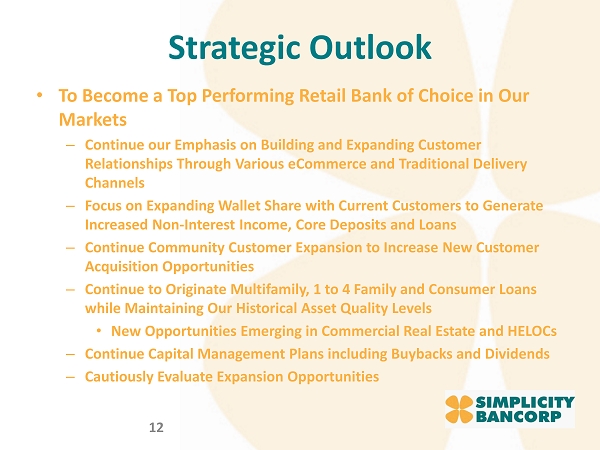
Strategic Outlook 12 • To Become a Top Performing Retail Bank of Choice in Our Markets – Continue our Emphasis on Building and Expanding Customer Relationships Through Various eCommerce and Traditional Delivery Channels – Focus on Expanding Wallet Share with Current Customers to Generate Increased Non - Interest Income, Core Deposits and Loans – Continue Community Customer Expansion to Increase New Customer Acquisition Opportunities – Continue to Originate Multifamily, 1 to 4 Family and Consumer Loans while Maintaining Our Historical Asset Quality Levels • New Opportunities Emerging in Commercial Real Estate and HELOCs – Continue Capital Management Plans including Buybacks and Dividends – Cautiously Evaluate Expansion Opportunities
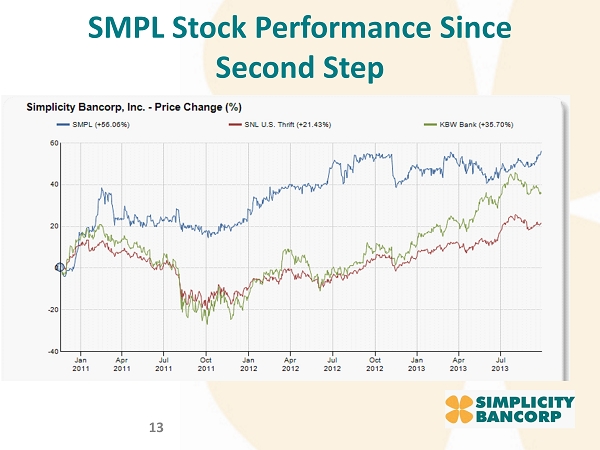
SMPL Stock Performance Since Second Step 13
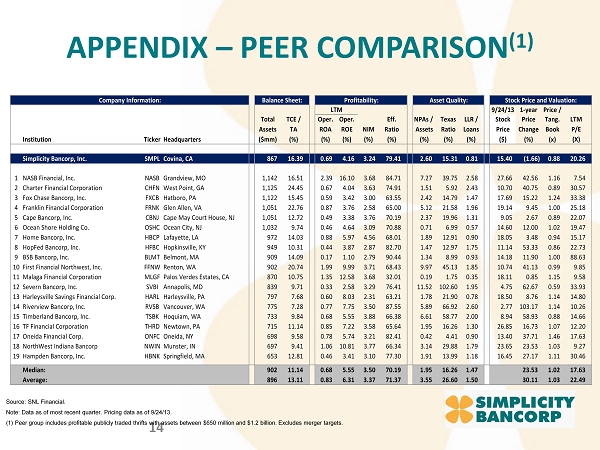
APPENDIX – PEER COMPARISON (1) 14 Company Information: Balance Sheet: Profitability: Asset Quality: Stock Price and Valuation: Dividends: LTM 9/24/13 1-year Price / Total TCE / Oper. Oper. Eff. NPAs / Texas LLR / Stock Price Tang. LTM Assets TA ROA ROE NIM Ratio Assets Ratio Loans Price Change Book P/E Institution TickerHeadquarters ($mm) (%) (%) (%) (%) (%) (%) (%) (%) ($) (%) (x) (X) Simplicity Bancorp, Inc. SMPL Covina, CA 867 16.39 0.69 4.16 3.24 79.41 2.60 15.31 0.81 15.40 (1.66) 0.88 20.26 1 NASB Financial, Inc. NASB Grandview, MO 1,142 16.51 2.39 16.10 3.68 84.71 7.27 39.75 2.58 27.66 42.56 1.16 7.54 2 Charter Financial Corporation CHFN West Point, GA 1,125 24.45 0.67 4.04 3.63 74.91 1.51 5.92 2.43 10.70 40.75 0.89 30.57 3 Fox Chase Bancorp, Inc. FXCB Hatboro, PA 1,122 15.45 0.59 3.42 3.00 63.55 2.42 14.79 1.47 17.69 15.22 1.24 33.38 4 Franklin Financial Corporation FRNK Glen Allen, VA 1,051 22.76 0.87 3.76 2.58 65.00 5.12 21.58 1.96 19.14 9.45 1.00 25.18 5 Cape Bancorp, Inc. CBNJ Cape May Court House, NJ 1,051 12.72 0.49 3.38 3.76 70.19 2.37 19.96 1.31 9.05 2.67 0.89 22.07 6 Ocean Shore Holding Co. OSHC Ocean City, NJ 1,032 9.74 0.46 4.64 3.09 70.88 0.71 6.99 0.57 14.60 12.00 1.02 19.47 7 Home Bancorp, Inc. HBCP Lafayette, LA 972 14.03 0.88 5.97 4.56 68.01 1.89 12.91 0.90 18.05 3.48 0.94 15.17 8 HopFed Bancorp, Inc. HFBC Hopkinsville, KY 949 10.31 0.44 3.87 2.87 82.70 1.47 12.97 1.75 11.14 53.33 0.86 22.73 9 BSB Bancorp, Inc. BLMT Belmont, MA 909 14.09 0.17 1.10 2.79 90.44 1.34 8.99 0.93 14.18 11.90 1.00 88.63 10First Financial Northwest, Inc. FFNWRenton, WA 902 20.74 1.99 9.99 3.71 68.43 9.97 45.13 1.85 10.74 41.13 0.99 9.85 11Malaga Financial Corporation MLGFPalos Verdes Estates, CA 870 10.75 1.35 12.58 3.68 32.01 0.19 1.75 0.35 18.11 0.85 1.15 9.58 12Severn Bancorp, Inc. SVBI Annapolis, MD 839 9.71 0.33 2.58 3.29 76.41 11.52 102.60 1.95 4.75 62.67 0.59 33.93 13Harleysville Savings Financial Corp. HARL Harleysville, PA 797 7.68 0.60 8.03 2.31 63.21 1.78 21.90 0.78 18.50 8.76 1.14 14.80 14Riverview Bancorp, Inc. RVSB Vancouver, WA 775 7.28 0.77 7.75 3.50 87.55 5.89 66.92 2.60 2.77 103.17 1.14 10.26 15Timberland Bancorp, Inc. TSBK Hoquiam, WA 733 9.84 0.68 5.55 3.88 66.38 6.61 58.77 2.00 8.94 58.93 0.88 14.66 16TF Financial Corporation THRD Newtown, PA 715 11.14 0.85 7.22 3.58 65.64 1.95 16.26 1.30 26.85 16.73 1.07 12.20 17Oneida Financial Corp. ONFC Oneida, NY 698 9.58 0.78 5.74 3.21 82.41 0.42 4.41 0.90 13.40 37.71 1.46 17.63 18NorthWest Indiana Bancorp NWINMunster, IN 697 9.41 1.06 10.81 3.77 66.34 3.14 29.88 1.79 23.65 23.53 1.03 9.27 19Hampden Bancorp, Inc. HBNK Springfield, MA 653 12.81 0.46 3.41 3.10 77.30 1.91 13.99 1.18 16.45 27.17 1.11 30.46 Median: 902 11.14 0.68 5.55 3.50 70.19 1.95 16.26 1.47 23.53 1.02 17.63 Average: 896 13.11 0.83 6.31 3.37 71.37 3.55 26.60 1.50 30.11 1.03 22.49 Source: SNL Financial. Note: Data as of most recent quarter. Pricing data as of 9/24/13. (1) Peer group includes profitable publicly traded thrifts with assets between $650 million and $1.2 billion. Excludes merger ta rgets.