Quarterly Stakeholder Letter FOURTH QUARTER | FISCAL YEAR 2022
QUARTERLY STAKEHOLDER LETTER | FOURTH QUARTER 2022 | 2 Dear Phreesia stakeholders, Our organization has accomplished much to be proud of in fiscal year 2022, Phreesia’s 17th year and our third as a public company. It has been another year we won’t soon forget—full of challenges, but also exciting opportunities for growth and innovation. We greatly appreciate our employees’ hard work and the support and partnership of our clients and investors. As healthcare organizations across the country struggled with staffing shortages, we helped them drive operational and cost efficiencies to optimize their workforce, now and in the future. We supported our clients in vaccinating huge numbers of patients against COVID-19 and in bringing patients back to their provider’s office for needed care. We also helped our life sciences clients connect with clinically relevant patients by delivering targeted health content and patient insights. We experienced tremendous growth this past year—in our platform, our capabilities and our team. That growth is the result of our significant and strategic investments in people, products and processes that we believe will help us better serve the needs of our clients. We expanded our Sales & Marketing, Research & Development, Engineering and Client Support teams, and made infrastructure investments in privacy, security and scalability to ensure that we can continue to provide the highest quality products and services. As our fiscal year came to a close, we received recognition from several groups for our team’s recent achievements. In December, Medical Marketing and Media (MM+M) named Phreesia Life Sciences to its list of Best Places to Work 2021. In January, Phreesia joined the 2022 Bloomberg Gender-Equality Index (GEI) for the second year in a row, a welcome acknowledgement of our commitment to supporting gender equality through an inclusive culture, board representation, pathways to leadership for women, pay equity and strong family-leave policies. We also were named 2022 Best in KLAS for Patient Intake Management by the KLAS research and insights firm—the fourth consecutive year we have received this honor. We believe these distinctions reflect the strength of our product offerings, our leadership and our workplace culture, and I would like to congratulate our entire team for their contributions throughout the fiscal year. We are proud of our team’s achievements in fiscal year 2022, and we believe our investments in growth position us to deliver on our goals and objectives in fiscal year 2023. We are pleased to share some of our thinking behind those investment decisions in this quarter’s letter. On behalf of the Phreesia leadership team, thank you for your interest in Phreesia. Chaim Indig Chief Executive Officer and Co-Founder MARCH 30, 2022
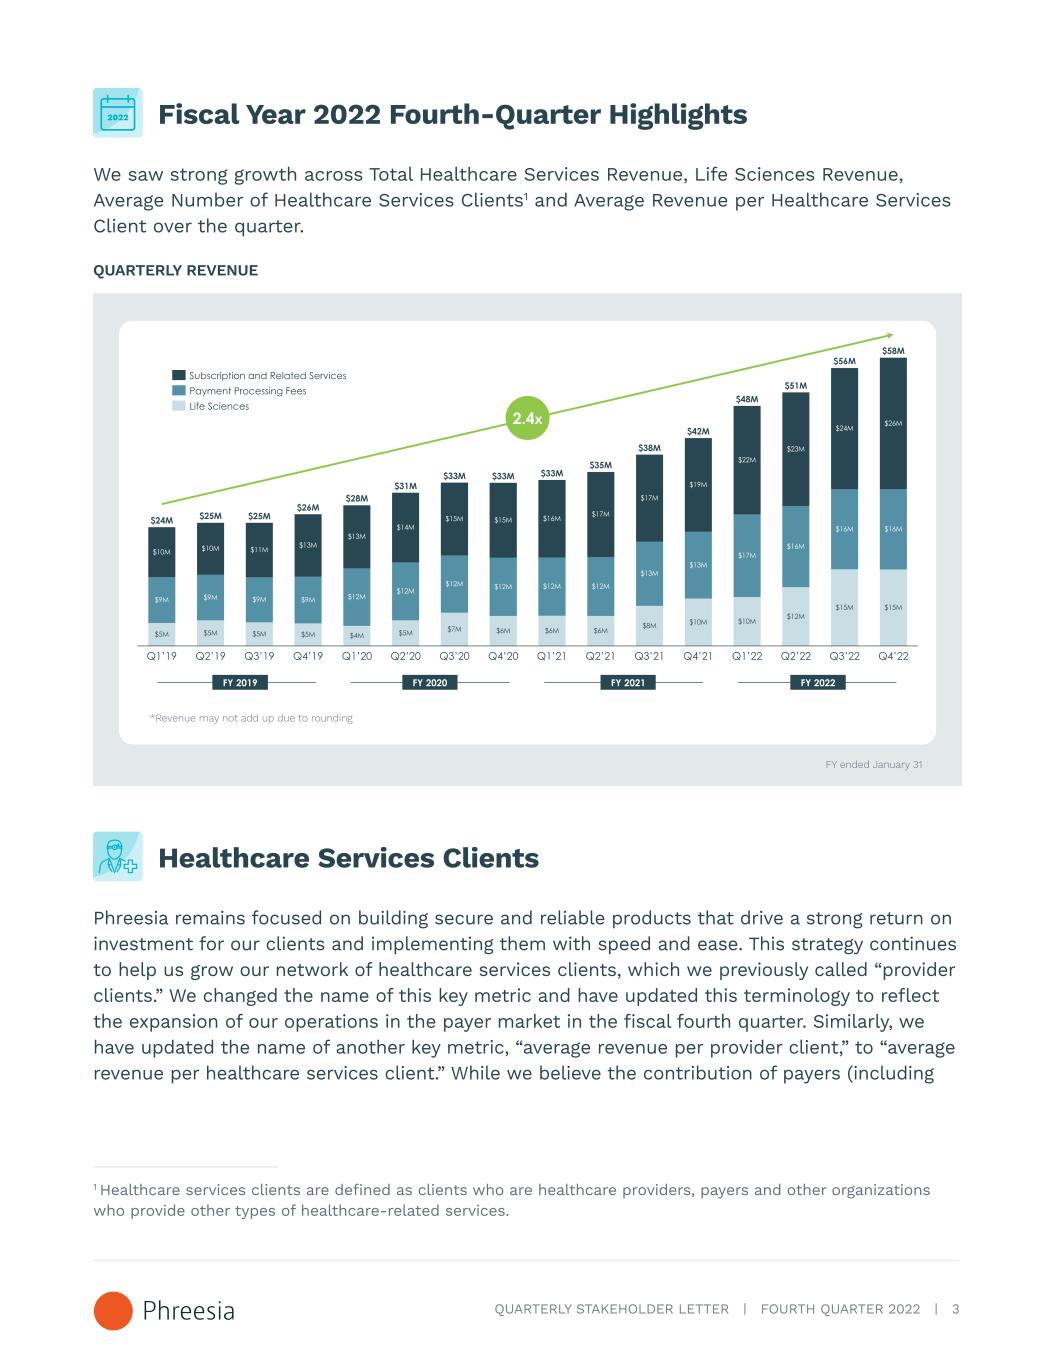
QUARTERLY STAKEHOLDER LETTER | FOURTH QUARTER 2022 | 3 Fiscal Year 2022 Fourth-Quarter Highlights We saw strong growth across Total Healthcare Services Revenue, Life Sciences Revenue, Average Number of Healthcare Services Clients1 and Average Revenue per Healthcare Services Client over the quarter. QUARTERLY REVENUE $5M $15M $10M Q2’22Q1’22 $12M $9M $25M Q2’19Q1’19 Q4’19 $9M $10M $5M $12M $11M $5M $9M $5M $16M $22M Q2’20Q3’19 $13M $9M $17M $4M $13M $12M $19M Q1’20 $24M $14M $6M $17M $12M $16M $5M Q2’21 $15M Q4’21 $7M Q3’20 $13M $12M $6M Q4’20 $12M Q1’21 $17M $12M $6M $8M Q3’21 $13M $25M $10M $10M $23M $16M Q3’22 $24M $26M $28M $31M $33M $33M $33M $35M $15M $42M $48M $51M $56M Q4’22 $58M $16M $26M $15M $38M 2.4x Subscription and Related Services Life Sciences Payment Processing Fees FY 2019 FY 2020 FY 2021 FY 2022 *Revenue may not add up due to rounding FY ended January 31 Healthcare Services Clients Phreesia remains focused on building secure and reliable products that drive a strong return on investment for our clients and implementing them with speed and ease. This strategy continues to help us grow our network of healthcare services clients, which we previously called “provider clients.” We changed the name of this key metric and have updated this terminology to reflect the expansion of our operations in the payer market in the fiscal fourth quarter. Similarly, we have updated the name of another key metric, “average revenue per provider client,” to “average revenue per healthcare services client.” While we believe the contribution of payers (including 1 Healthcare services clients are defined as clients who are healthcare providers, payers and other organizations who provide other types of healthcare-related services.
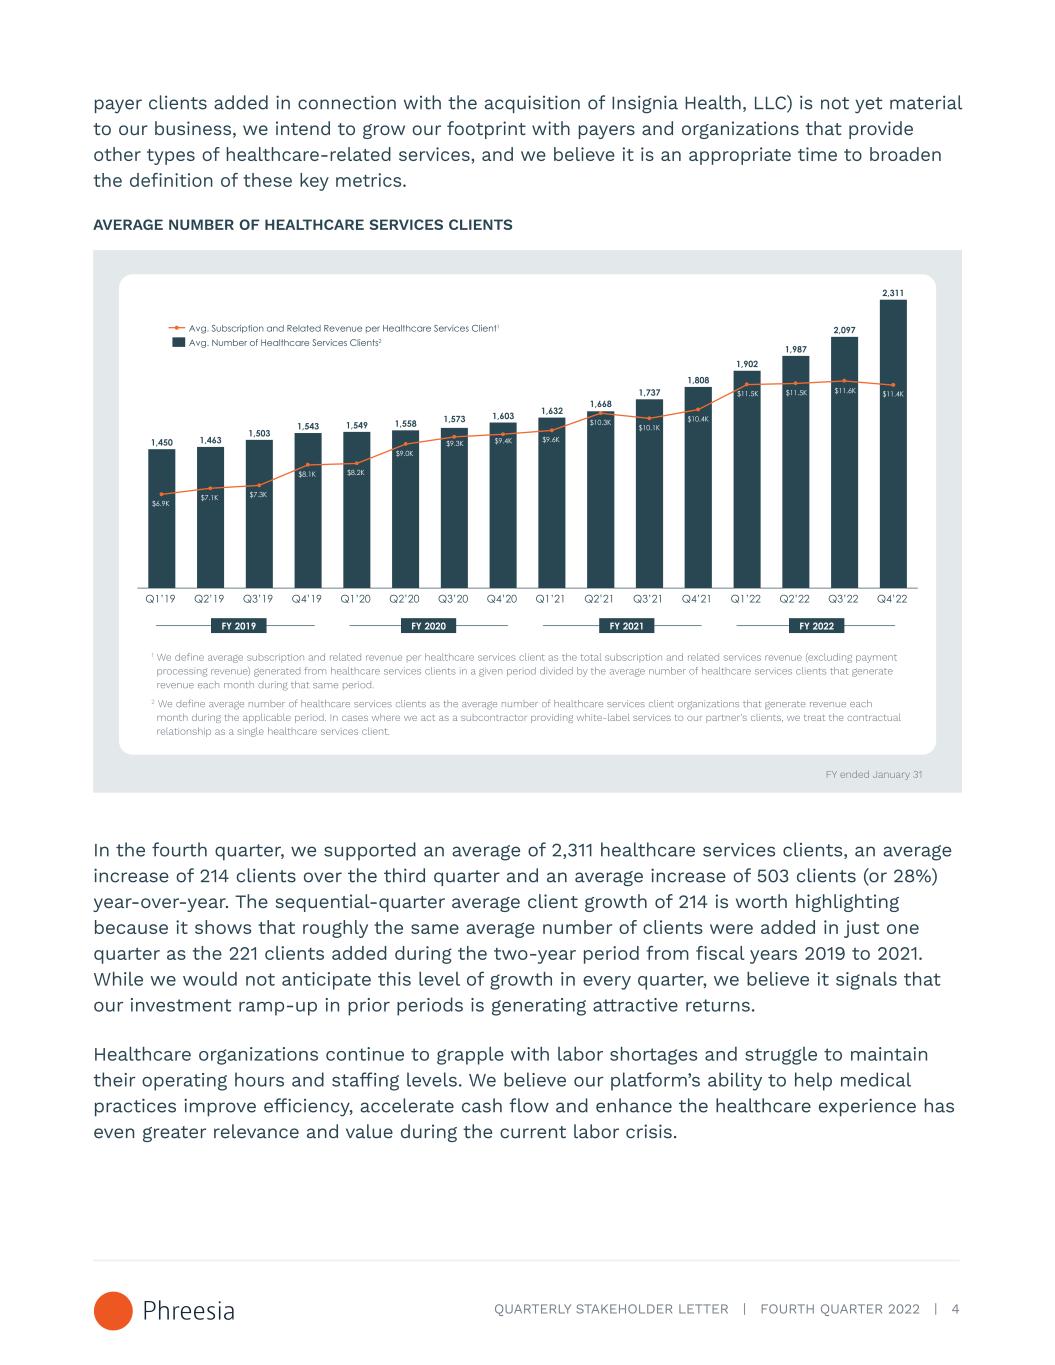
QUARTERLY STAKEHOLDER LETTER | FOURTH QUARTER 2022 | 4 payer clients added in connection with the acquisition of Insignia Health, LLC) is not yet material to our business, we intend to grow our footprint with payers and organizations that provide other types of healthcare-related services, and we believe it is an appropriate time to broaden the definition of these key metrics. AVERAGE NUMBER OF HEALTHCARE SERVICES CLIENTS 1,450 1,463 1,503 1,543 1,549 1,558 1,573 1,603 1,632 1,668 1,737 1,808 1,902 1,987 2,097 2,311 Q3’19 Q4’19 Q3’20Q1’19 Q4’22Q2’19 Q1’20 Q3’21Q2’20 Q4’20 Q1’21 Q2’21 Q4’21 Q1’22 Q3’22 $7.1K $6.9K $9.6K $7.3K $8.1K $10.4K $8.2K $9.0K $9.3K $9.4K $11.5K $10.3K $10.1K $11.5K $11.6K $11.4K Q2’22 Avg. Subscription and Related Revenue per Healthcare Services Client1 Avg. Number of Healthcare Services Clients2 FY 2019 FY 2020 FY 2021 FY 2022 1 We define average subscription and related revenue per healthcare services client as the total subscription and related services revenue (excluding payment processing revenue) generated from healthcare services clients in a given period divided by the average number of healthcare services clients that generate revenue each month during that same period. 2 We define average number of healthcare services clients as the average number of healthcare services client organizations that generate revenue each month during the applicable period. In cases where we act as a subcontractor providing white-label services to our partner's clients, we treat the contractual relationship as a single healthcare services client. FY ended January 31 In the fourth quarter, we supported an average of 2,311 healthcare services clients, an average increase of 214 clients over the third quarter and an average increase of 503 clients (or 28%) year-over-year. The sequential-quarter average client growth of 214 is worth highlighting because it shows that roughly the same average number of clients were added in just one quarter as the 221 clients added during the two-year period from fiscal years 2019 to 2021. While we would not anticipate this level of growth in every quarter, we believe it signals that our investment ramp-up in prior periods is generating attractive returns. Healthcare organizations continue to grapple with labor shortages and struggle to maintain their operating hours and staffing levels. We believe our platform’s ability to help medical practices improve efficiency, accelerate cash flow and enhance the healthcare experience has even greater relevance and value during the current labor crisis.

QUARTERLY STAKEHOLDER LETTER | FOURTH QUARTER 2022 | 5 We also believe that our current investments in Sales & Marketing expense have long-term value. In fiscal years 2020, 2021 and 2022, our average healthcare services client retention2 was 88%, 89% and 90%, and our average healthcare services revenue retention3 was 94%, 95% and 95%, respectively. When considering the economic value of a new client to Phreesia, we believe it is important to consider all sources of revenue, including our Life Sciences solutions, which could not be monetized or grown without our client network. Subscription and Related Services We achieved our fastest subscription and related services year-over-year growth as a public company in the fourth quarter of fiscal year 2022 at 40%. In addition to the client growth trends discussed earlier in the letter, we believe our land-and-expand go-to-market motion has contributed to similarly strong growth in average subscription and related services revenue per healthcare services client. This amount has increased 66% from $6,898 for the first quarter of fiscal year 2019 to $11,443 for the fourth quarter of fiscal year 2022, exhibiting step-function growth as we balance acceleration in client growth with expansion and cross- sell execution. With roughly 50,000 potential healthcare services clients representing a total addressable subscription and related services market of approximately $6.3 billion, we would expect the contribution from the growth of both clients and subscription and related services to vary from quarter to quarter. In recent quarters, add-on modules in our Clinical Support and Access solution areas have been popular. For example, Phreesia’s social determinants of health (SDOH) screening tools, part of our Clinical Support capabilities, enable our clients to collect data around a variety of social factors such as reliable transportation, stable housing and access to healthy food. In a recent Fierce Healthcare article, one of our clients, Strong Children Wellness, shared its experience using Phreesia to identify families at risk of eviction and connect them with the resources they need. In addition, our Access offerings have benefited clients as they work to bring patients back to their offices for necessary care. Allison Conley, Executive Director of Capital Area Pediatrics, spoke to PatientEngagementHIT about her organization’s success using Phreesia’s Self- Scheduling tool to roll out its pediatric COVID-19 vaccination campaign. “Self-scheduling has made it a lot easier,” Conley said, noting that the tool allows parents to book an appointment time that works best for them, and saves both parents and staff from dealing with phone calls and long hold times. 2 Healthcare services client retention is defined as the trailing twelve-month average of the annualized number of clients retained in each month, divided by the number of clients at the beginning of each month. 3 Healthcare services revenue retention is defined as the trailing twelve-month average of the annualized revenue associated with number of clients retained in each month, divided by the annualized revenue associated with number of clients at the beginning of each month.
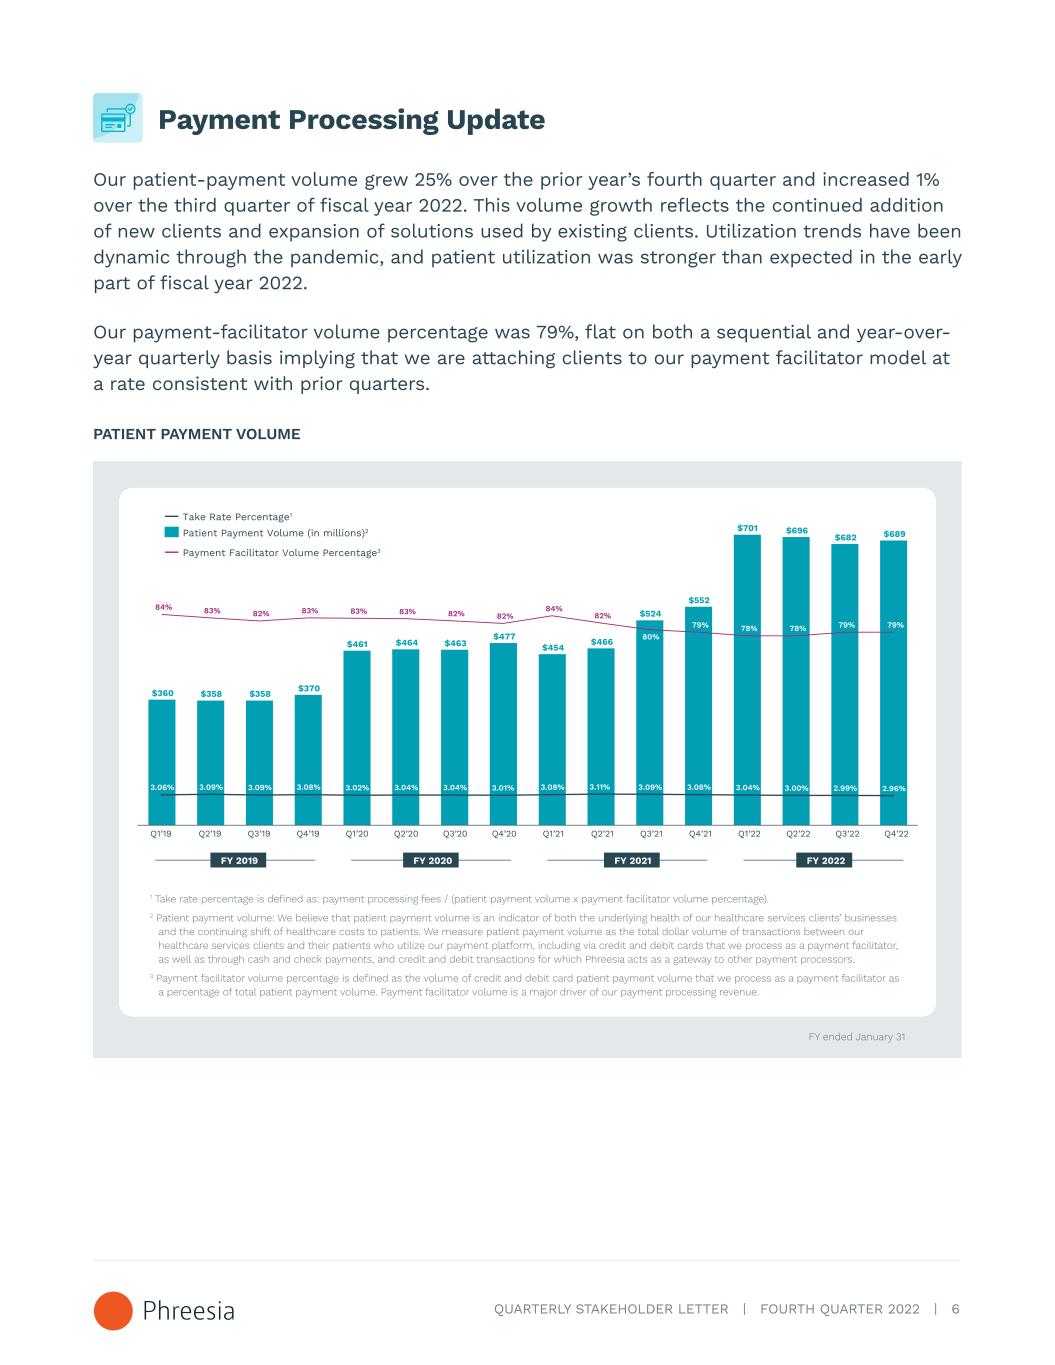
QUARTERLY STAKEHOLDER LETTER | FOURTH QUARTER 2022 | 6 Payment Processing Update Our patient-payment volume grew 25% over the prior year’s fourth quarter and increased 1% over the third quarter of fiscal year 2022. This volume growth reflects the continued addition of new clients and expansion of solutions used by existing clients. Utilization trends have been dynamic through the pandemic, and patient utilization was stronger than expected in the early part of fiscal year 2022. Our payment-facilitator volume percentage was 79%, flat on both a sequential and year-over- year quarterly basis implying that we are attaching clients to our payment facilitator model at a rate consistent with prior quarters. PATIENT PAYMENT VOLUME Q1’19 Q2’19 Q3’19 Q4’19 Q1’20 Q2’20 Q3’20 Q4’20 Q1’21 Q2’21 Q3’21 Q4’21 Q1’22 Q2’22 Q3’22 Q4’22 $360 $358 $358 $370 $461 $464 $463 $477 $454 $466 $524 $552 $701 $696 $682 $689 3.06% 3.09% 3.09% 3.08% 3.02% 3.04% 3.04% 3.01% 3.08% 3.11% 3.09% 3.08% 3.04% 3.00% 2.99% 2.96% Payment Facilitator Volume Percentage3 Take Rate Percentage1 Patient Payment Volume (in millions)2 84% 83% 82% 83% 83% 83% 82% 82% 84% 82% 80% 79% 78% 78% 79% 79% FY 2019 FY 2020 FY 2021 FY 2022 1 Take rate percentage is defined as: payment processing fees / (patient payment volume x payment facilitator volume percentage). 2 Patient payment volume: We believe that patient payment volume is an indicator of both the underlying health of our healthcare services clients’ businesses and the continuing shift of healthcare costs to patients. We measure patient payment volume as the total dollar volume of transactions between our healthcare services clients and their patients who utilize our payment platform, including via credit and debit cards that we process as a payment facilitator, as well as through cash and check payments, and credit and debit transactions for which Phreesia acts as a gateway to other payment processors. 3 Payment facilitator volume percentage is defined as the volume of credit and debit card patient payment volume that we process as a payment facilitator as a percentage of total patient payment volume. Payment facilitator volume is a major driver of our payment processing revenue. FY ended January 31

QUARTERLY STAKEHOLDER LETTER | FOURTH QUARTER 2022 | 7 The Phreesia Platform The Phreesia platform offers our clients the following set of solutions to activate patients in their care. Over the past year, we have made significant investments in our platform to support new client growth, revenue opportunities and overall scale and reliability. • Our Access solution provides a comprehensive appointment-scheduling system with applications for online appointments, reminders and referral tracking and management. • Our Registration solution automates patient self-registration via Phreesia Mobile—either before or at the time of the patient’s visit—or via our purpose-built PhreesiaPads or Arrivals Kiosks for on-site check-in. The solution also includes the Phreesia Dashboard, which our clients’ staff use to monitor and manage the intake process. • Our Revenue Cycle solution offers insurance-verification processes, point-of-sale payments applications and cost-estimation presentment tools that help clients maximize the timely collection of patient payments. • Our Clinical Support solution collects clinical intake and patient-reported outcomes data for more than 25 specialties, enabling our clients to ask the right patients appropriate clinical questions at the right time, gathering key data that aligns with their quality-reporting goals. The solution also allows clients to communicate with patients through automated tailored surveys, announcements, text messaging and email, as well as through Phreesia’s targeted Health Campaigns. • Our Life Sciences solution offers our life sciences clients a channel that leverages our large and growing network of more than 2,000 healthcare services clients. We utilize this channel to activate patients by sending them targeted and clinically relevant content that allows them to have more informed conversations with their providers. We also help our life sciences clients obtain direct patient feedback to incorporate into their business models. THE PHREESIA PLATFORM Mobile and in-office intake modalitiesAppointment reminders Point-of-service payments Insurance verification Card on file and payment assurance Payment plans Online payments Specialty-specific workflows Registration for virtual visits Consent management Self-service patient-reported outcome Behavioral health screenings Social determinants of health screening COVID-19 support modules Referral management Integrated patient scheduling Automated appointment rescheduling ACCESS REGISTRATION REVENUE CYCLE CLINICAL SUPPORT Patient text messaging Patient education and engagement
QUARTERLY STAKEHOLDER LETTER | FOURTH QUARTER 2022 | 8 The Phreesia platform provides significant and measurable value to patients, healthcare services organizations and life sciences companies: • For patients, we offer a safe, seamless, individualized intake experience and flexible payment options. • For healthcare services clients, we enable them to increase collections, streamline the referral process, improve quality measures, boost patient satisfaction, improve patient activation and consistently collect key clinical, demographic and social data. • For life sciences clients, we promote patient awareness and education about their products. Based on ongoing analyses of client advertising campaigns conducted by data analytics companies, we believe that patients exposed to a brand campaign using the Phreesia platform are more likely, on average, to take an action—such as filling a prescription for that brand’s product—than patients who don’t see the campaign. Our platform has evolved to provide a range of technology applications and modules that address the growing needs of the healthcare market, including those arising during the COVID-19 pandemic. Technology Integrations In January 2022, Phreesia joined MEDITECH Greenfield, a testing ground for applications that can integrate with MEDITECH Expanse. This collaboration will enable API-based integration between MEDITECH and Phreesia, helping Phreesia develop more innovative products and solutions and bringing even greater value to our shared clients. Earlier in the fourth quarter, Phreesia completed validation of our application with Cerner through the code Developer Program. Organizations using Cerner Millennium now have access to additional Phreesia features through Cerner Ignite APIs (FHIR). We now offer appointment arrival and check-in, self-scheduling and real-time payment posting integrated with Cerner Millennium. Through code Developer Program, Phreesia will continue to validate and expand upon our Cerner-integrated offerings.

QUARTERLY STAKEHOLDER LETTER | FOURTH QUARTER 2022 | 9 Life Sciences In calendar year 2021, Phreesia’s platform surveyed more than one million patients to drive patient insights for our life sciences clients. The Phreesia Life Sciences team gathered and published results on topics including migraine treatment and perceptions and engaging and supporting caregivers. PatientInsights, Phreesia Life Sciences’ market-research platform, also was named to healthcare marketing trade publication PM360’s list of 2021 Most Innovative Services. Just one of eight services to be honored for “compelling offerings that help the industry tackle new challenges,” PatientInsights was recognized for its ability to deliver customized surveys to clients’ target populations, including hard-to-reach patient groups who don’t typically participate in market research. Investments in Growth We ended the fourth quarter and fiscal year 2022 with 1,701 employees, an increase of 211 team members over the previous quarter and 874 employees over the previous year. As we noted last quarter, we believe it is important to recognize and reward our team members for their past, current and expected future performance. Therefore, in addition to increased hiring expense trends, we incurred further expense for compensation increases to ensure we are retaining our best talent. We entered fiscal year 2022 with a detailed plan to accelerate hiring and overall investments across all areas of Phreesia. We felt it was important to prepare for anticipated growth in the number of our clients and the use of our platform. As a team, we are pleased to be on the other side of this significant investment in time and resources, having recruited and onboarded hundreds of talented individuals who can now support that continued growth across our business. We outsource certain of our software development and design, quality assurance and operations activities to third-party contractors that have employees and consultants in international locations, including India, Russia and Ukraine. The continued military incursion of Russia into Ukraine could adversely affect our third-party contractors that have employees and consultants located in Russia and Ukraine. Phreesia has compassion for our colleagues in these regions of the world and we are providing as much support and flexibility for them as we can during this challenging time. VIEW VIDEO IN BROWSER → Life Sciences’ 2021 top PatientInsights findings
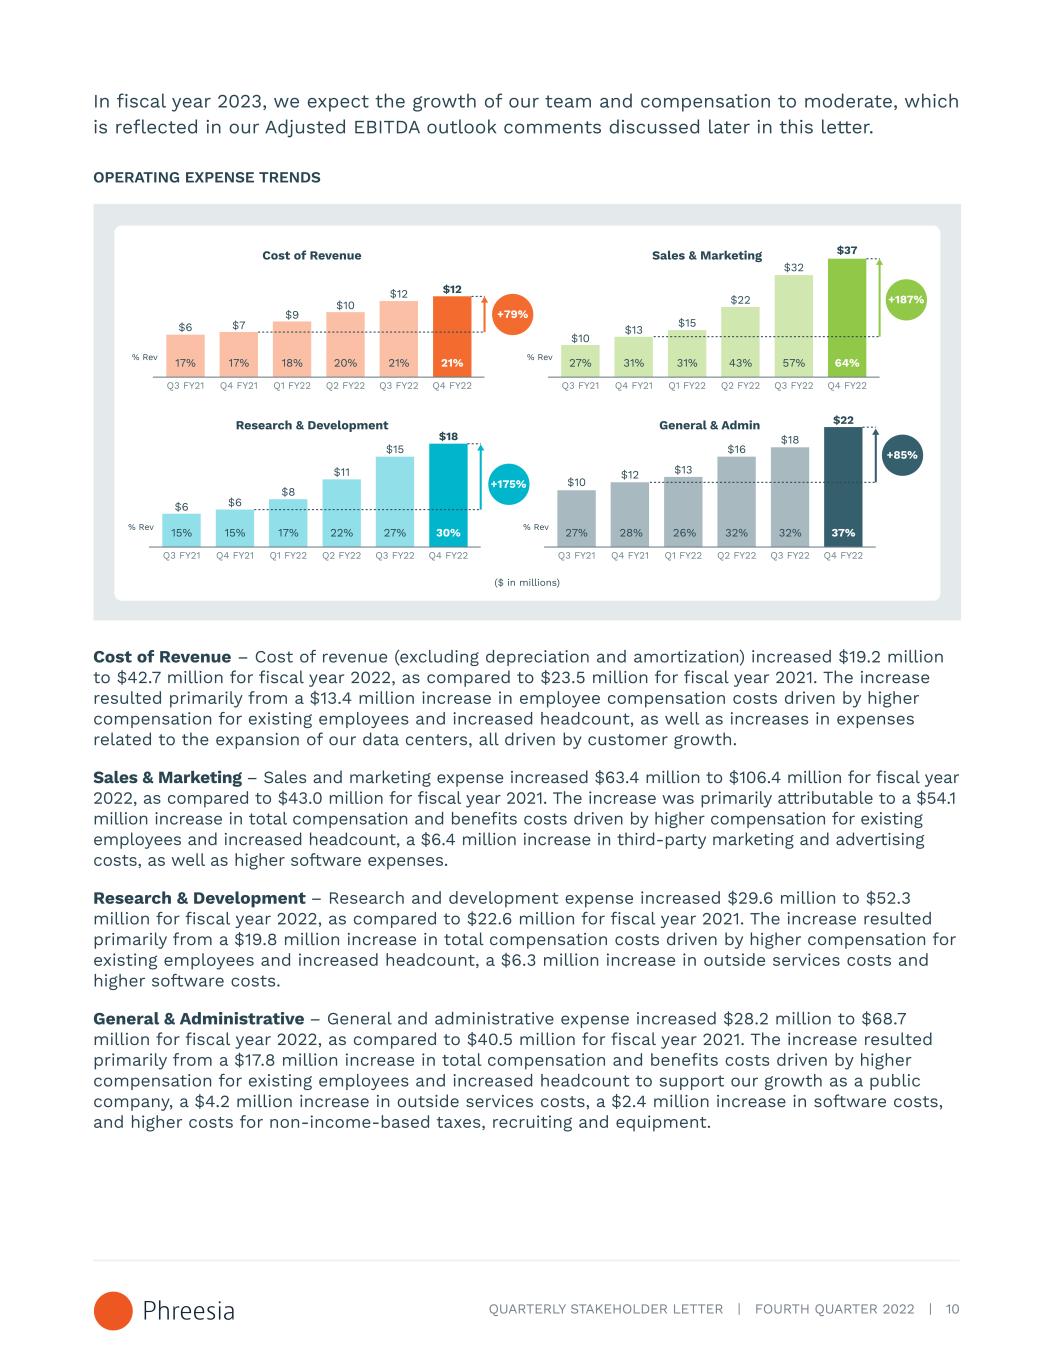
QUARTERLY STAKEHOLDER LETTER | FOURTH QUARTER 2022 | 10 In fiscal year 2023, we expect the growth of our team and compensation to moderate, which is reflected in our Adjusted EBITDA outlook comments discussed later in this letter. OPERATING EXPENSE TRENDS Q3 FY21 17% $6 $7 $9 $10 $12 $12 17% 18% 20% 21% 21%% Rev Q4 FY21 Q1 FY22 Cost of Revenue Q2 FY22 Q3 FY22 Q4 FY22 +79% Q3 FY21 15% $6 $6 $8 $11 $15 $18 15% 17% 22% 27% 30%% Rev Q4 FY21 Q1 FY22 Q2 FY22 Q3 FY22 Q4 FY22 +175% Q3 FY21 27% $10 $13 $15 $22 $32 $37 31% 31% 43% 57% 64%% Rev Q4 FY21 Q1 FY22 Sales & Marketing Q2 FY22 Q3 FY22 Q4 FY22 +187% Q3 FY21 27% $10 $12 $13 $16 $18 $22 28% 26% 32% 32% 37%% Rev Q4 FY21 Q1 FY22 General & AdminResearch & Development Q2 FY22 Q3 FY22 Q4 FY22 +85% ($ in millions) Cost of Revenue – Cost of revenue (excluding depreciation and amortization) increased $19.2 million to $42.7 million for fiscal year 2022, as compared to $23.5 million for fiscal year 2021. The increase resulted primarily from a $13.4 million increase in employee compensation costs driven by higher compensation for existing employees and increased headcount, as well as increases in expenses related to the expansion of our data centers, all driven by customer growth. Sales & Marketing – Sales and marketing expense increased $63.4 million to $106.4 million for fiscal year 2022, as compared to $43.0 million for fiscal year 2021. The increase was primarily attributable to a $54.1 million increase in total compensation and benefits costs driven by higher compensation for existing employees and increased headcount, a $6.4 million increase in third-party marketing and advertising costs, as well as higher software expenses. Research & Development – Research and development expense increased $29.6 million to $52.3 million for fiscal year 2022, as compared to $22.6 million for fiscal year 2021. The increase resulted primarily from a $19.8 million increase in total compensation costs driven by higher compensation for existing employees and increased headcount, a $6.3 million increase in outside services costs and higher software costs. General & Administrative – General and administrative expense increased $28.2 million to $68.7 million for fiscal year 2022, as compared to $40.5 million for fiscal year 2021. The increase resulted primarily from a $17.8 million increase in total compensation and benefits costs driven by higher compensation for existing employees and increased headcount to support our growth as a public company, a $4.2 million increase in outside services costs, a $2.4 million increase in software costs, and higher costs for non-income-based taxes, recruiting and equipment.

QUARTERLY STAKEHOLDER LETTER | FOURTH QUARTER 2022 | 11 Cash Flow Statement, Balance Sheet and Liquidity As of January 31, 2022, and January 31, 2021, we had cash and cash equivalents of $313.8 million and $218.8 million, respectively. Cash and cash equivalents consist of money market accounts and cash on deposit. For the fiscal years ended in January 31, 2022 2021 2020 Net cash (used in) provided by operating activities $(74,710) $2,890 $826 Cash flows used in investing activities: Acquisitions, net of cash acquired (34,423) (6,510) — Capitalized internal-use software (12,385) (7,334) (5,305) Purchases of property and equipment (18,420) (11,241) (7,015) Net cash used in investing activities $(65,228) $(25,085) $(12,320) In addition to our available cash, we recently modified our revolving credit facility with Silicon Valley Bank to increase the available revolving line of credit to $100 million from $50 million. We believe this modification will give us additional financial flexibility, with attractive terms, through fiscal year 2025. The facility is available to us for working capital and general corporate purposes and has an annual fee of 0.25%, an interest rate of the greater of the Wall Street Journal prime rate minus 0.50%, floating or 3.25%, and a May 5, 2025 maturity date. Fiscal Year 2023 Outlook Our revenue outlook for fiscal year 2023 is $271 million to $275 million implying year-over-year growth of 27% to 29%. Our Adjusted EBITDA outlook for fiscal year 2023 is negative $154 million to negative $149 million compared to negative $59 million in fiscal year 2022. The majority of the implied increase in investment projected for fiscal year 2023 is already incorporated in the annualized run rate of our fourth quarter fiscal year 2022 results. As we are now on the other side of the significant hiring initiatives we undertook in fiscal year 2022 to support our anticipated growth, we expect our Adjusted EBITDA outlook in fiscal year 2023 to be the low annual mark for fiscal years 2023-2025. We also expect to see operating leverage in the early part of fiscal year 2024 and approach profitability4 in fiscal year 2025. 4 Profitability in terms of Adjusted EBITDA.
QUARTERLY STAKEHOLDER LETTER | FOURTH QUARTER 2022 | 12 Fiscal Year 2025 Target We also are introducing an annualized revenue target of $500 million to be achieved during a quarter of fiscal year 2025.5 We believe our platform and diverse revenue streams offer us multiple paths for achieving our target. Non-GAAP Financial Measures We have not reconciled the Adjusted EBITDA outlook to GAAP Net income (loss) because we do not provide an outlook for GAAP Net income (loss) due to the uncertainty and potential variability of Other (income) expense, net and (Benefit from) provision for income taxes, which are reconciling items between Adjusted EBITDA and GAAP Net income (loss). Because we cannot reasonably predict such items, a reconciliation of the non-GAAP financial measure outlook to the corresponding GAAP measure is not available without unreasonable effort. We caution, however, that such items could have a significant impact on the calculation of GAAP Net income (loss). Forward Looking Statements This stakeholder letter includes express or implied statements that are not historical facts and are considered forward-looking within the meaning of Section 27A of the Securities Act and Section 21E of the Securities Exchange Act. Forward-looking statements generally relate to future events or our future financial or operating performance and may contain projections of our future results of operations or of our financial information or state other forward- looking information. These statements include, but are not limited to, statements regarding: Phreesia’s future financial performance, including our revenue and Adjusted EBITDA; our outlook for fiscal year 2023 and fiscal year 2025 targets; our business strategy and operating plans; industry trends and predictions; and our anticipated growth and operating leverage. In some cases, you can identify forward-looking statements by the following words: “may,” “will,” “could,” “would,” “should,” “expect,” “intend,” “plan,” “anticipate,” “believe,” “estimate,” “predict,” “project,” “potential,” “continue,” “ongoing,” or the negative of these terms or other comparable terminology, although not all forward-looking statements contain these words. 5 For our target revenue, annualized is defined as multiplying the highest-revenue quarter in fiscal year 2025 by four.

QUARTERLY STAKEHOLDER LETTER | FOURTH QUARTER 2022 | 13 Although we believe that the expectations reflected in these forward-looking statements are reasonable, these statements relate to future events or our future operational or financial performance and involve known and unknown risks, uncertainties and other factors that may cause our actual results, performance or achievements to be materially different from any future results, performance or achievements expressed or implied by these forward- looking statements. Furthermore, actual results may differ materially from those described in the forward-looking statements and will be affected by a variety of risks and factors that are beyond our control, including, without limitation, risks associated with: our ability to effectively manage our growth and meet our growth objectives; our focus on the long- term and our investments in growth; the competitive environment in which we operate; our ability to develop and release new products and services, and develop and release successful enhancements, features and modifications to our existing products and services; our ability to maintain the security and availability of our platform; changes in laws and regulations applicable to our business model; our ability to make accurate predictions about our industry; the impact of the COVID-19 pandemic on our business and economic conditions; our ability to attract, retain and cross-sell to healthcare services clients; our ability to continue to operate effectively with a primarily remote workforce and attract and retain key talent; our ability to realize the intended benefits of our acquisitions; and other general market, political, economic and business conditions. The forward-looking statements contained in this letter are also subject to other risks and uncertainties, including those more fully described in our filings with the Securities and Exchange Commission (“SEC”), including in our Annual Report on Form 10-K for the fiscal year ended January 31, 2022, that will be filed with the SEC following this letter. The forward-looking statements in this letter speak only as of the date on which the statements are made. We undertake no obligation to update, and expressly disclaim the obligation to update, any forward-looking statements made in this letter to reflect events or circumstances after the date of this letter or to reflect new information or the occurrence of unanticipated events, except as required by law. About Phreesia Phreesia gives healthcare organizations a suite of robust applications to manage the patient intake process. Our innovative SaaS platform engages patients in their healthcare and provides a modern, convenient experience, while enabling our clients to enhance clinical care and drive efficiency. INVESTOR RELATIONS CONTACT: Balaji Gandhi investors@phreesia.com MEDIA CONTACT: Annie Harris aharris@phreesia.com


