
Quarterly Stakeholder Letter THIRD QUARTER | FISCAL YEAR 2023
QUARTERLY STAKEHOLDER LETTER | THIRD QUARTER 2023 | 2 Dear Phreesia stakeholders, Between long hours, overloaded schedules and the challenges of the pandemic, front-office staff at healthcare organizations across the country are burned out. Nearly three-quarters of medical practice leaders say their biggest challenge is staffing as turnover rates escalate in an already- tight labor market.1 We believe Phreesia’s solutions address these problems in a meaningful way, which is what keeps us motivated and focused each day. As a team, we place a great deal of value on earning and keeping the trust of clients, colleagues, patients and other stakeholders, including our investors. We are also committed to a culture of continuous improvement and learning, which enables us to iterate and adjust quickly. We believe our third quarter results reflect our operating philosophy. We showed progress towards our longer-term revenue and profitability targets of $500 million of annualized revenue2 and returning to Adjusted EBITDA profitability, respectively, during fiscal 2025. Phreesia was able to deliver strong organic growth and operating leverage while introducing new solutions to complement our best in KLAS3 patient intake offerings. This could not have been achieved without the commitment and focus of all 1,563 Phreesians4 and our partners and vendors. As we enter the final quarter of our fiscal year, I could not be prouder of our team’s execution throughout the year. We thank you for your support, trust and interest in Phreesia and look forward to updating you on our future progress. Chaim Indig Chief Executive Officer and Co-Founder DECEMBER 8, 2022 1 Medical Group Management Association, https://www.mgma.com/data/data-stories/staffing,-uncertainty-among-top-pandemic-challenge 2 For our target revenue, “annualized” is defined as multiplying the highest-revenue quarter in fiscal year 2025 by four. 3 https://ir.phreesia.com/news/news-details/2022/Phreesia-Named-2022-Best-in-KLAS-for-Patient-Intake- Management-for-a-Fourth-Year/default.aspx 4 As of 10/31/2022

QUARTERLY STAKEHOLDER LETTER | THIRD QUARTER 2023 | 3 Fiscal Year 2023 Third Quarter Highlights We are updating the nomenclature for one of our revenue categories in our consolidated statement of operations beginning with this reporting period. The revenue line previously named Life sciences will be named “Network solutions” going forward. This change in nomenclature had no effect on prior period revenue amounts. We believe Phreesia’s growth and value in the healthcare ecosystem stems from our expanding network, which connects patients, providers, payers and other stakeholders. Our network impacts more than 1 in 10 patient visits in the U.S. every day.5 We believe our network also enables us to bring our current solutions to market quickly and identify new solutions that harness our ability to deliver direct communications that activate, engage and educate patients about topics critical to their health on behalf of our life sciences and payer clients. Our Life sciences revenue has been generated through fees charged to our life sciences clients by delivering messages to patients who opt-in to our direct communications. This revenue would not be possible without the Phreesia network. Over the past several years, Phreesia has been investing in additional solutions that leverage our network to help patients become more activated in their care and achieve better health outcomes. These additional solutions include new types of direct communications to patients. We are very proud of the work we do to provide relevant content to patients who provide consent. We believe that accurate information, responsibly delivered, improves health and health outcomes. As a result of the introduction of these new solutions, we believe it is now appropriate to rename our Life sciences revenue category to “Network solutions.” We think it is important to implement this name change before new sources of Network solutions contribute to revenue in a more meaningful way because it allows us to communicate this potential transition to our consolidated statement of operations with more clarity for our investors and analysts. Later in this letter, we will introduce one of our new Network solutions revenue opportunities, MemberConnect for payer clients, which is beginning to contribute to revenue. REVENUE We saw strength across our organization in the third quarter of fiscal 2023 as evidenced by total revenue growth of 31% year-over-year, consisting of Subscription and Related Services, Payment Processing and Network solutions revenue growth of 35%, 22% and 33%, respectively. 5 Phreesia Fiscal First Quarter 2023 Quarterly Stakeholder Letter and William Blair & Company, LLC, Healthcare Mosaic Report: Analyzing the Clinical Workforce Issue: A Clear and Present Danger for U.S. Healthcare Systems, January 24, 2022
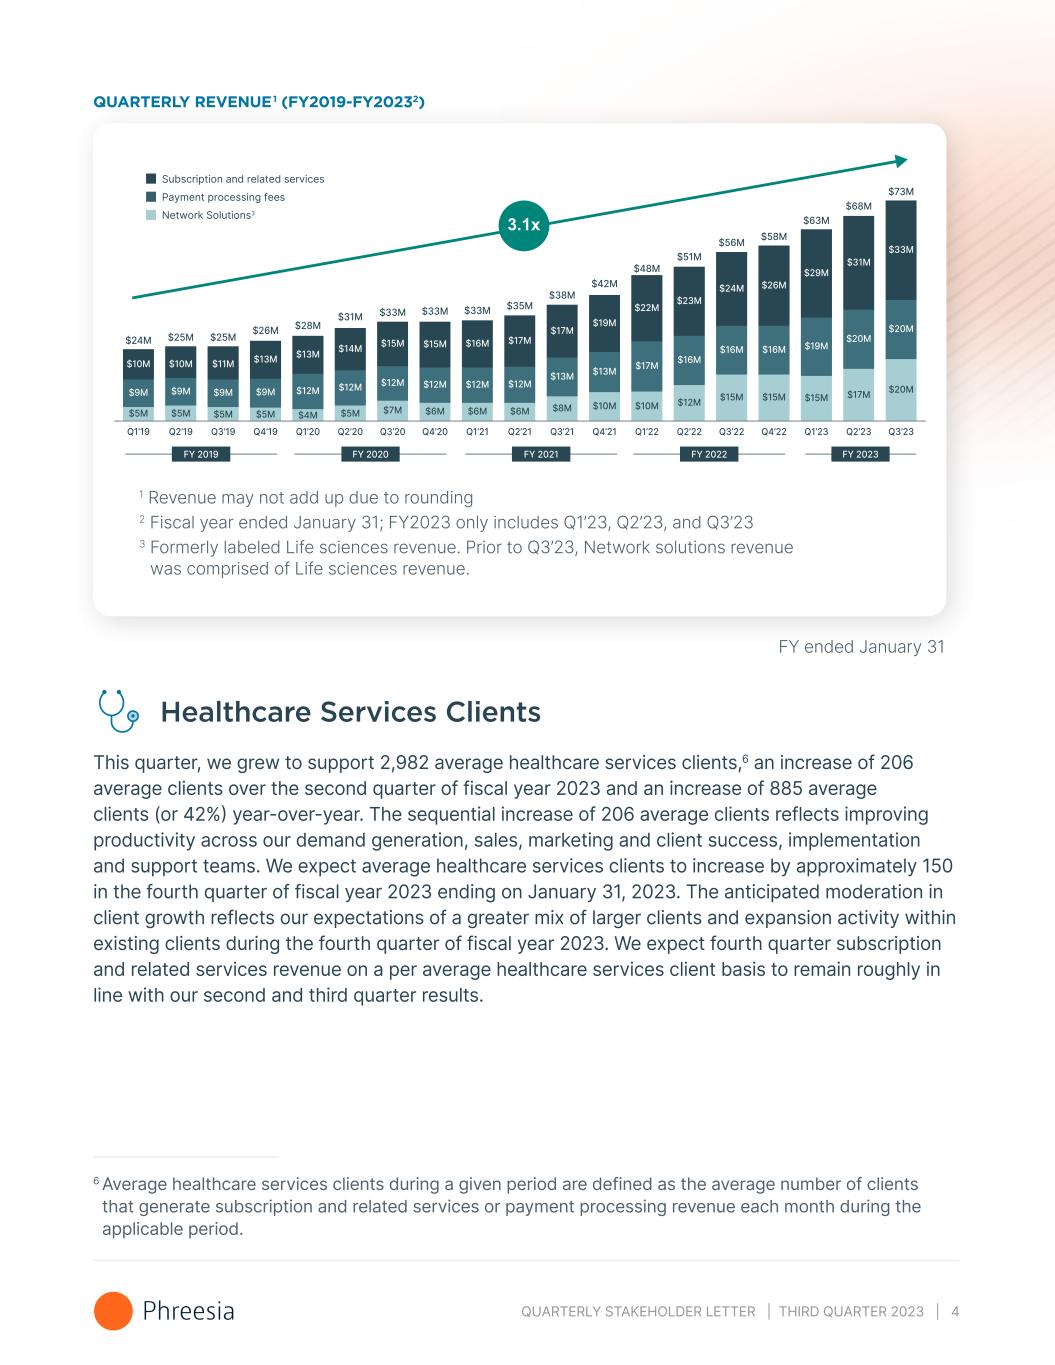
QUARTERLY STAKEHOLDER LETTER | THIRD QUARTER 2023 | 4 QUARTERLY REVENUE1 (FY2019-FY20232) Subscription and related services Payment processing fees Network Solutions3 $10M $10M $11M $13M $13M $14M $15M $15M $16M $17M $17M $19M $9M $9M $9M $9M $12M $12M $5M $5M $5M $5M $4M $5M $12M $7M $12M $12M $12M $6M $6M $6M $13M $8M $13M $22M $23M $24M $26M $16M $12M $17M $10M $10M $16M $16M $29M $19M $31M $33M $20M $20M $15M $15M $15M $17M $20M $24M $25M $25M $26M $28M $31M $33M $33M $33M $35M $38M $42M $48M $51M $56M $58M $63M $68M $73M Q1’19 Q2’19 Q3’19 Q4’19 Q1’20 Q2’20 Q3’20 Q4’20 Q1’21 Q2’21 Q3’21 Q4’21 Q1’22 Q2’22 Q3’22 Q4’22 Q1’23 Q2’23 Q3’23 FY 2019 FY 2020 FY 2021 FY 2022 FY 2023 1 Revenue may not add up due to rounding 2 Fiscal year ended January 31; FY2023 only includes Q1’23, Q2’23, and Q3’23 3 Formerly labeled Life sciences revenue. Prior to Q3’23, Network solutions revenue was comprised of Life sciences revenue. Healthcare Services Clients This quarter, we grew to support 2,982 average healthcare services clients,6 an increase of 206 average clients over the second quarter of fiscal year 2023 and an increase of 885 average clients (or 42%) year-over-year. The sequential increase of 206 average clients reflects improving productivity across our demand generation, sales, marketing and client success, implementation and support teams. We expect average healthcare services clients to increase by approximately 150 in the fourth quarter of fiscal year 2023 ending on January 31, 2023. The anticipated moderation in client growth reflects our expectations of a greater mix of larger clients and expansion activity within existing clients during the fourth quarter of fiscal year 2023. We expect fourth quarter subscription and related services revenue on a per average healthcare services client basis to remain roughly in line with our second and third quarter results. 6 Average healthcare services clients during a given period are defined as the average number of clients that generate subscription and related services or payment processing revenue each month during the applicable period. FY ended January 31
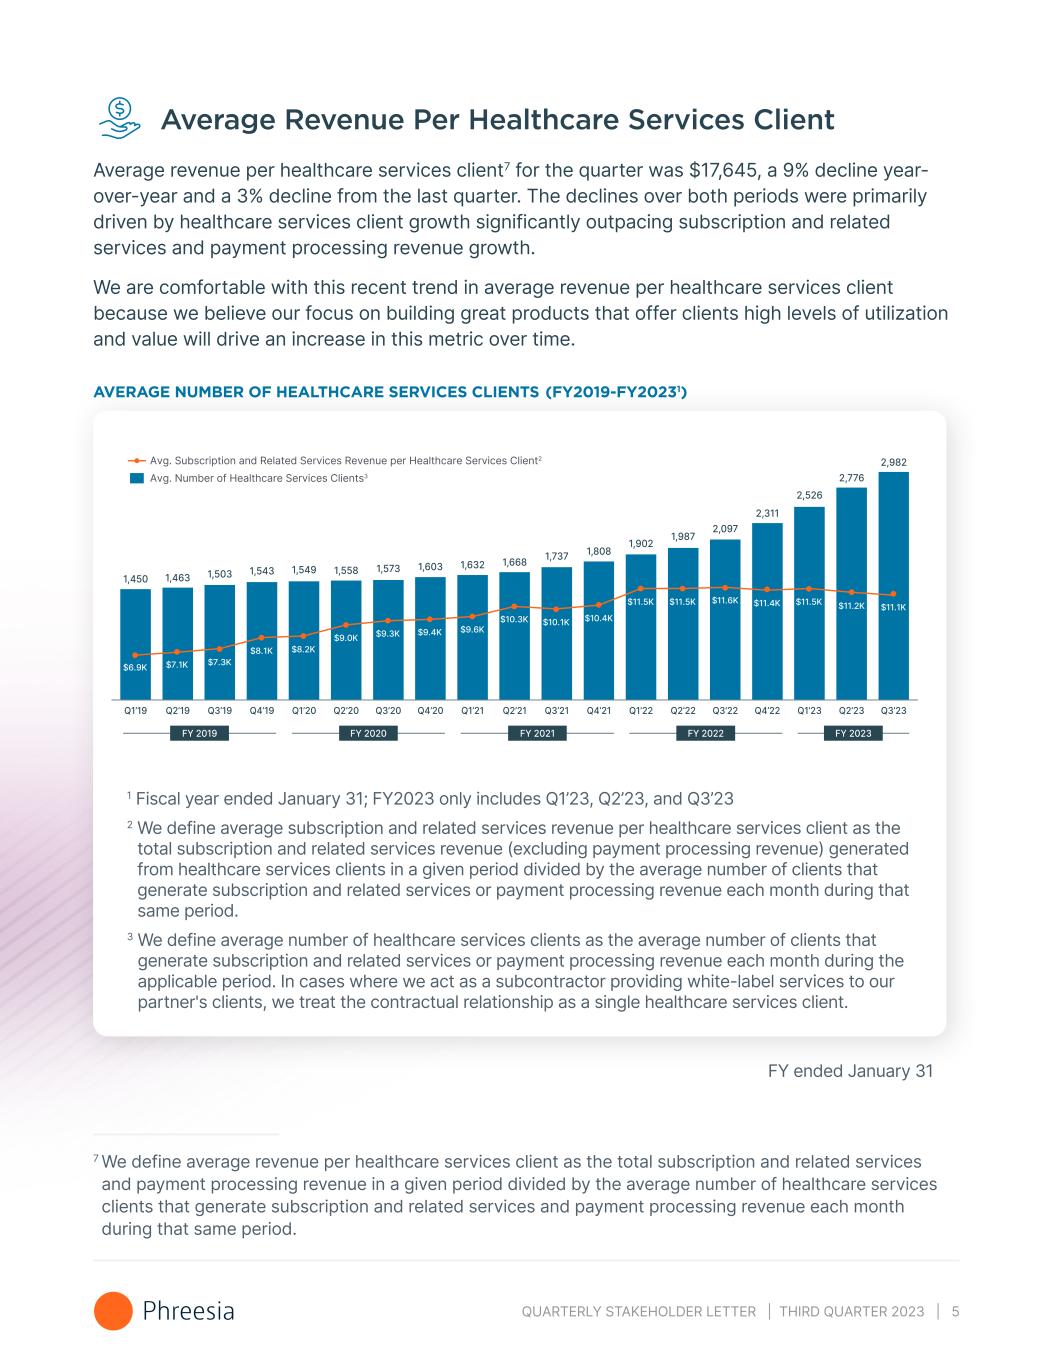
QUARTERLY STAKEHOLDER LETTER | THIRD QUARTER 2023 | 5 Average Revenue Per Healthcare Services Client Average revenue per healthcare services client7 for the quarter was $17,645, a 9% decline year- over-year and a 3% decline from the last quarter. The declines over both periods were primarily driven by healthcare services client growth significantly outpacing subscription and related services and payment processing revenue growth. We are comfortable with this recent trend in average revenue per healthcare services client because we believe our focus on building great products that offer clients high levels of utilization and value will drive an increase in this metric over time. AVERAGE NUMBER OF HEALTHCARE SERVICES CLIENTS (FY2019-FY20231) 1,450 1,463 1,503 1,543 1,549 1,558 1,573 1,603 1,632 1,668 1,737 1,808 1,902 1,987 2,097 2,311 2,526 2,776 2,982 Q1’19 Q2’19 Q3’19 Q4’19 Q1’20 Q2’20 Q3’20 Q4’20 Q1’21 Q2’21 Q3’21 Q4’21 Q1’22 Q2’22 Q3’22 Q4’22 Q1’23 Q2’23 Q3’23 FY 2019 FY 2020 FY 2021 FY 2022 FY 2023 $7.1K$6.9K $9.6K $7.3K $8.1K $10.4K $8.2K $9.0K $9.3K $9.4K $11.5K $10.3K $10.1K $11.5K $11.6K $11.4K $11.5K $11.2K $11.1K Avg. Subscription and Related Services Revenue per Healthcare Services Client2 Avg. Number of Healthcare Services Clients3 1 Fiscal year ended January 31; FY2023 only includes Q1’23, Q2’23, and Q3’23 2 We define average subscription and related services revenue per healthcare services client as the total subscription and related services revenue (excluding payment processing revenue) generated from healthcare services clients in a given period divided by the average number of clients that generate subscription and related services or payment processing revenue each month during that same period. 3 We define average number of healthcare services clients as the average number of clients that generate subscription and related services or payment processing revenue each month during the applicable period. In cases where we act as a subcontractor providing white-label services to our partner's clients, we treat the contractual relationship as a single healthcare services client. FY ended January 31 7 We define average revenue per healthcare services client as the total subscription and related services and payment processing revenue in a given period divided by the average number of healthcare services clients that generate subscription and related services and payment processing revenue each month during that same period.
QUARTERLY STAKEHOLDER LETTER | THIRD QUARTER 2023 | 6 Subscription and Related Services Subscription and related services revenue grew 35% in the third quarter of fiscal year 2023 compared to the third quarter of the prior fiscal year. Average subscription and related services revenue per healthcare services client was $11,064 in the third quarter, down $128 sequentially from $11,192 in the second quarter. We continue to estimate the annual total addressable market for our subscription and related services to be approximately $6.3 billion, which implies roughly 50,000 healthcare services clients each spending approximately $126,000 for subscription and related services on an annual basis, or $31,500 on a quarterly basis. We expect contributions resulting from an increase in our overall number of average clients, as well as subscription and related services revenue per client, to vary from quarter to quarter, but we expect both areas to meaningfully contribute to our overall growth when measured over a longer period of time. Payment Processing Our patient-payment volume grew 19% year-over-year, most significantly reflecting the addition of new clients over the prior year’s third quarter. Our payment processing gross margin8 was 35% in the third quarter, compared to 36% and 41% in the second quarter of fiscal 2023 and the third quarter of fiscal 2022, respectively. The year-over- year decline of 6% stems from elevated payment processing gross margin during the pandemic due to a higher mix of more profitable card-not-present transactions and delayed interchange price increases. We have found we have been able to win larger deals by being more competitive on pricing, which has contributed to the gross margin decline. Our payment-facilitator volume percentage has been relatively consistent over time, coming in at 81% in the third quarter of fiscal year 2023, up 1 percentage point and up 2 percentage points on a sequential and year-over-year basis, respectively. 8 We define payment processing gross margin as the difference between payment processing fees revenue and payment processing expense, divided by payment processing fees revenue.
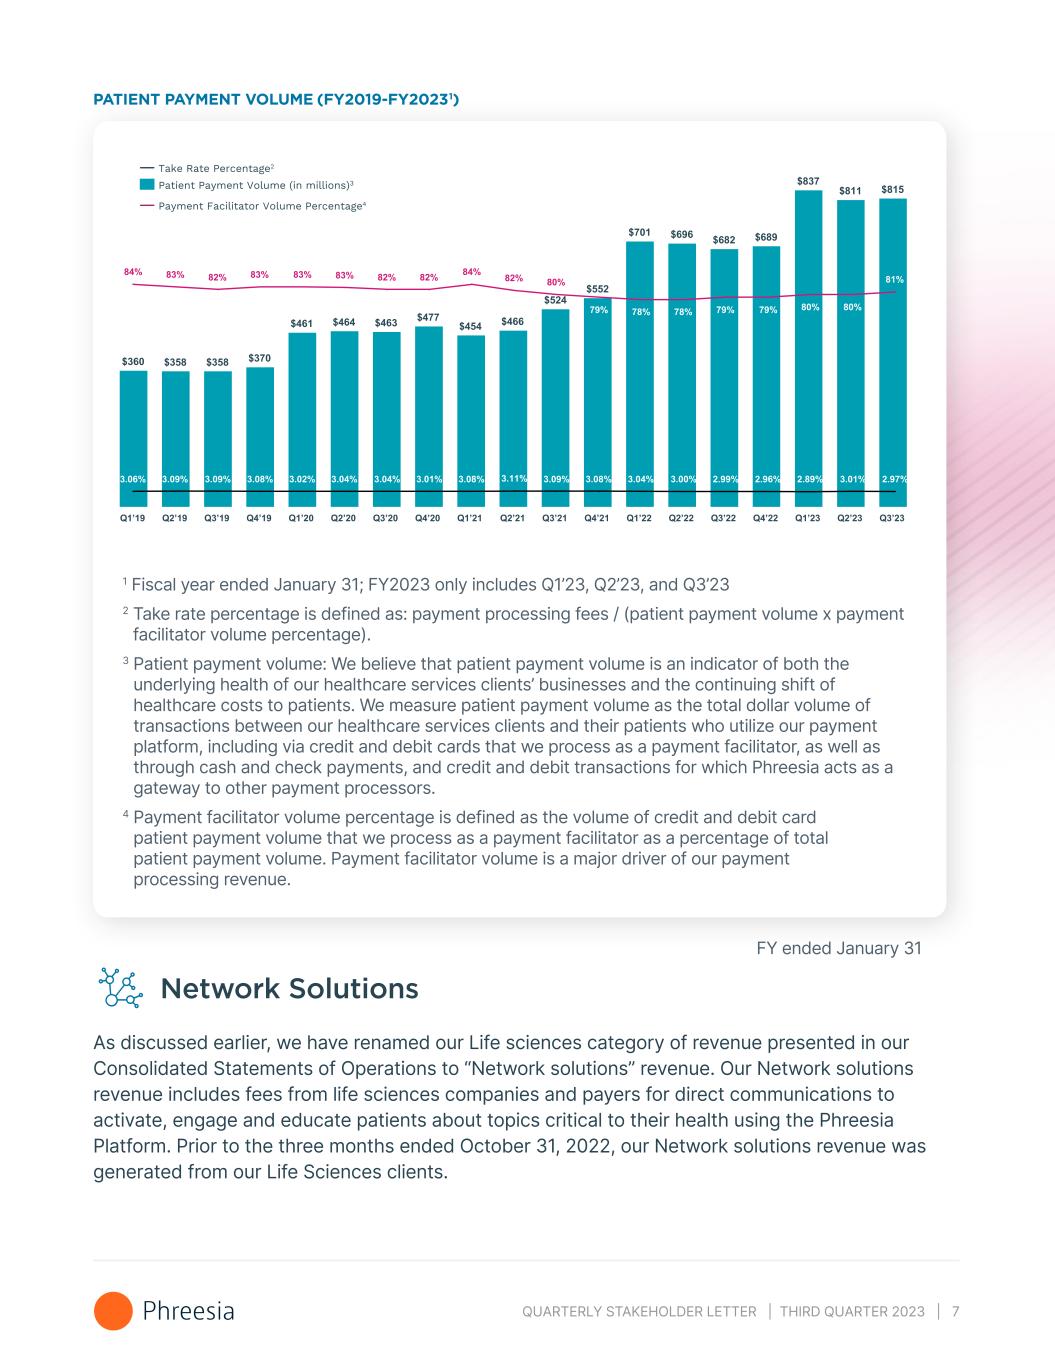
QUARTERLY STAKEHOLDER LETTER | THIRD QUARTER 2023 | 7 PATIENT PAYMENT VOLUME (FY2019-FY20231) $360 $358 $358 $370 $461 $464 $463 $477 $454 $466 $524 $552 $701 $696 $682 $689 $837 $811 $815 Q1’19 Q2’19 Q3’19 Q4’19 Q1’20 Q2’20 Q3’20 Q4’20 Q1’21 Q2’21 Q3’21 Q4’21 Q1’22 Q2’22 Q3’22 Q4’22 Q1’23 Q2’23 Q3’23 84% 83% 82% 83% 83% 83% 82% 82% 84% 82% 80% 79% 78% 78% 79% 79% 80% 80% 81% 3.06% 3.09% 3.09% 3.08% 3.02% 3.04% 3.04% 3.01% 3.08% 3.11% 3.09% 3.08% 3.04% 3.00% 2.99% 2.96% 2.89% 3.01% 2.97% Take Rate Percentage2 Patient Payment Volume (in millions)3 Payment Facilitator Volume Percentage4 1 Fiscal year ended January 31; FY2023 only includes Q1’23, Q2’23, and Q3’23 2 Take rate percentage is defined as: payment processing fees / (patient payment volume x payment facilitator volume percentage). 3 Patient payment volume: We believe that patient payment volume is an indicator of both the underlying health of our healthcare services clients’ businesses and the continuing shift of healthcare costs to patients. We measure patient payment volume as the total dollar volume of transactions between our healthcare services clients and their patients who utilize our payment platform, including via credit and debit cards that we process as a payment facilitator, as well as through cash and check payments, and credit and debit transactions for which Phreesia acts as a gateway to other payment processors. 4 Payment facilitator volume percentage is defined as the volume of credit and debit card patient payment volume that we process as a payment facilitator as a percentage of total patient payment volume. Payment facilitator volume is a major driver of our payment processing revenue. FY ended January 31 Network Solutions As discussed earlier, we have renamed our Life sciences category of revenue presented in our Consolidated Statements of Operations to “Network solutions” revenue. Our Network solutions revenue includes fees from life sciences companies and payers for direct communications to activate, engage and educate patients about topics critical to their health using the Phreesia Platform. Prior to the three months ended October 31, 2022, our Network solutions revenue was generated from our Life Sciences clients.

QUARTERLY STAKEHOLDER LETTER | THIRD QUARTER 2023 | 8 Network solutions revenue to date is almost entirely associated with the direct communications about Life Sciences brands that we deliver to patients. As we will discuss in the Payer Update section of this letter, we have introduced new direct communications solutions for payers that we have been investing in for over a year. We believe these solutions could become a bigger contributor to this revenue line over time. Life Sciences We believe one of the differentiating factors driving our growth within the life sciences market is the Phreesia network, which offers life sciences organizations a platform to engage patients across a variety of important subpopulations, who authorize the use of their data. In previous stakeholder letters, we have highlighted our work with specific patient populations, including those with migraine and diabetes. During the third quarter, our team published research highlighting the needs of constipation patients and how engaging patients at the point of care can help address those needs. This research was cited by several publications. Millions of people live with constipation. According to one estimate, 16% of all adults and 33% of those over age 60 suffer from the condition.9 These figures suggest that prescription constipation treatments should be among the best-known and most widely used therapies on the market. However, many people have yet to find treatments that adequately control their symptoms. Our latest PatientInsights report explored key constipation research findings derived from Phreesia PatientInsights survey results collected in October and November 2021 from 6,780 adults diagnosed with or treated for constipation checking in for their doctor’s appointments. OUR RESEARCH FOUND THAT surveyed said they experience constipation symptoms all or almost all the time surveyed reported that constipation has a moderate or great impact on their everyday life 62% of patients 1 in 2 patients 42% of patients 54% of patients 9 "American Gastroenterological Association medical position statement on constipation,” Gastroenterology, January 2013. 90% of patients surveyed know OTC constipation drugs are not intended for long term use, half of those surveyed (50%) also said they have taken an OTC constipation medication for more than a year surveyed could not recall a single prescription brand of constipation medication surveyed said they brought up constipation symptoms to their doctor in fewer than 1 in 4 appointments
QUARTERLY STAKEHOLDER LETTER | THIRD QUARTER 2023 | 9 We believe PatientInsights expands our value to Life Sciences clients beyond direct messaging, and it is the breadth and depth of the Phreesia network that allows us to gather these valuable patient perspectives. We believe that the relevant health information we present to patients after they complete their check-in and provide consent has contributed to better health outcomes, including increased rates of diagnosis, treatment for chronic diseases, preventive screenings and vaccinations, and improvements in symptoms and quality of life. Payer Update Phreesia has been gradually investing in the payer space over the past several years. In addition to our organic initiatives, in 2021, Phreesia acquired Insignia Health, LLC (Insignia), whose client base consisted of a significant number of government and commercial payers. As our level of investment and involvement in the payer space has grown, we recognized that we needed to establish dedicated leadership for this area of our organization. Because our payer solutions rely heavily on our network and platform, we believed it would be important to identify someone from within our organization to have executive leadership of our partnerships with payer organizations, supporting their objectives to help their members achieve optimal healthcare experiences and health outcomes. Earlier this year, Michael Davidoff was appointed Senior Vice President, Payer Solutions. He has worked at Phreesia for nearly 15 years and has held key leadership roles including Senior Vice President, Marketing and Business Development, and Vice President, Financial Products. We believe that one of the many benefits of the size, breadth and depth of the Phreesia network is our ability, as a product-led growth company, to identify and develop new solutions that enhance our value across the healthcare ecosystem. To date, our value has primarily been realized by patients, healthcare providers, life sciences organizations, and, more recently, payers and their members. Specific examples of Phreesia solutions that leverage the scale of our network to drive value include ProviderConnect, used to facilitate patient referrals, and PatientConnect, used to help life sciences organizations reach patients that may need or use their medications. Payers represent a large, growing and historically unpenetrated market for Phreesia. However, our research and development investments in the payer space, and our exclusive worldwide rights to the Patient Activation Measure® (PAM®) acquired through Insignia, have resulted in many new health plan relationships. Building on this foundation, we developed and recently introduced a solution we currently refer to as MemberConnect. The goal of MemberConnect is to help health plans attract new members and engage and better understand their existing membership. Two notable applications of our MemberConnect solution are in the Medicare space and the Activation space:

QUARTERLY STAKEHOLDER LETTER | THIRD QUARTER 2023 | 10 1. Medicare – During this fall’s Medicare Advantage Annual Enrollment Period, we partnered with health plans and their agents to identify seniors 64 years and older who are interested in learning more about different Medicare products available to them. Just as we help patients understand their medication options with our life sciences solutions, our platform and network enable us to connect eligible and interested seniors with health plan agents who can educate them about the Medicare products that may best suit their needs. We believe our solution delivers timely, actionable highly qualified leads to health plans for potential member acquisition. Demographics and Clinical Intake 2 MA lead generation 5 6 Data PassPre-Registration Text HIPAA Authorization 4 PROsand SDOH 3 7 Welcome Screen & Authentication 2. Activation – We believe we deliver significant value to our health plan clients by giving them insight into their members’ knowledge, skills and confidence to manage their own health through their access to the PAM®. Peer-reviewed research and client experiences show that improvements in PAM significantly improve health outcomes and reduce healthcare costs which led to its endorsement as a performance measure by the National Quality Forum. Participants in the healthcare industry often talk about meeting patients where they are at in their health journey. We are investing in the Phreesia Network to expand the use of PAM®, which we believe will help health plans and provider organizations meet members where they are in their healthcare experience, and do this at scale. We are encouraged by the progress we are making with these two specific applications of our MemberConnect solution. We estimate the current opportunity in MemberConnect to be approximately $1 billion, extending our estimated total addressable market to approximately $10 billion from approximately $9 billion. When added to the $850 million market opportunity for direct communications about life sciences brands, the incremental $1 billion MemberConnect market opportunity brings our total Network solutions market opportunity to approximately $1.9 billion. The Network solutions revenue we generate is significantly reliant upon the growth in the number of our healthcare services clients, several of whom are both payers and providers.

QUARTERLY STAKEHOLDER LETTER | THIRD QUARTER 2023 | 11 OUR CURRENT ADDRESSABLE MARKET Subscription-based revenue ~50K addressable healthcare services clients1 in United States ~1.3M individual providers:2 ~1.0M active physicians ~146K nurse practitioners ~83K physician assistants $93B addressable out-of-pocket3 in United States DTC point-of-care marketing spend4 Health plan member enrollment5 Consumer-related transaction and payment processing fees Network solutions $6.3B $2.3B TAM of ~$10B $1.9B 1 IQIVIA, Definitive Healthcare and company estimates 2 Kaiser Family Foundation, BLS Data, American Association of Nurse Practitioners, National Commission of Certification of Physician Assistants - assumes ~1,022,000 total physicians; ~237,000 NPs of which ~110,000 are out-of-hospital taking appointments and 36,000 in-hospital taking appointments; 106,000 PAs, of which ~42,000 are out-of-hospital taking appointments and 41,000 in-hospital taking appointments 3 CMS, includes out-of-pocket spending for physician, clinical and other professional services 4 ZS Associates, projected spending in point-of-care marketing in pharma (2014 – 2020) 5 Based on eligible individuals for health plan enrollment and estimated average revenue per engagement as of August 25, 2022. Kff.org Medicare issue brief - Medicare advantage 2022 enrollment and key trends FY ended January 31 Phreesia Platform Update Phreesia’s platform brings value to different clients in different ways as we continue to enhance our products across four groups. In addition to introducing new products in our Access and NetworkConnect groups, we continue to make investments in our core Registration and Revenue Cycle solutions in order to drive self-service rates on our platform, which helps fuel organic revenue growth.
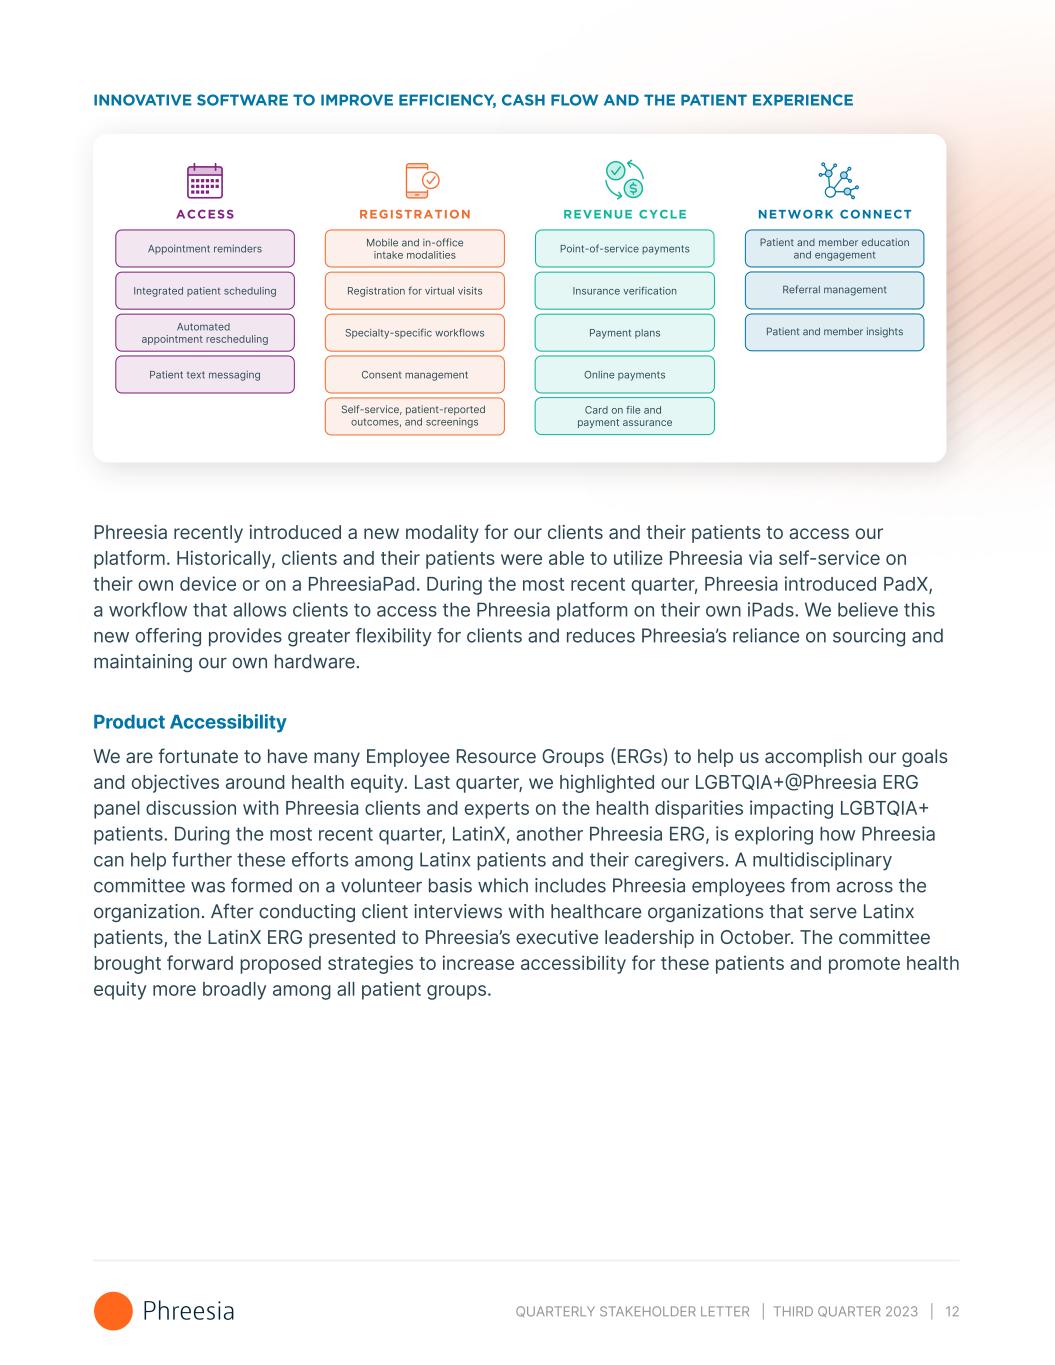
QUARTERLY STAKEHOLDER LETTER | THIRD QUARTER 2023 | 12 INNOVATIVE SOFTWARE TO IMPROVE EFFICIENCY, CASH FLOW AND THE PATIENT EXPERIENCE Mobile and in-office intake modalitiesAppointment reminders Point-of-service payments Insurance verification Card on file and payment assurance Payment plans Online payments Specialty-specific workflows Registration for virtual visits Consent management Self-service, patient-reported outcomes, and screenings Patient and member education and engagement Referral management Patient and member insights Integrated patient scheduling Automated appointment rescheduling ACCESS REGISTRATION REVENUE CYCLE NETWORK CONNECT Patient text messaging Phreesia recently introduced a new modality for our clients and their patients to access our platform. Historically, clients and their patients were able to utilize Phreesia via self-service on their own device or on a PhreesiaPad. During the most recent quarter, Phreesia introduced PadX, a workflow that allows clients to access the Phreesia platform on their own iPads. We believe this new offering provides greater flexibility for clients and reduces Phreesia’s reliance on sourcing and maintaining our own hardware. Product Accessibility We are fortunate to have many Employee Resource Groups (ERGs) to help us accomplish our goals and objectives around health equity. Last quarter, we highlighted our LGBTQIA+@Phreesia ERG panel discussion with Phreesia clients and experts on the health disparities impacting LGBTQIA+ patients. During the most recent quarter, LatinX, another Phreesia ERG, is exploring how Phreesia can help further these efforts among Latinx patients and their caregivers. A multidisciplinary committee was formed on a volunteer basis which includes Phreesia employees from across the organization. After conducting client interviews with healthcare organizations that serve Latinx patients, the LatinX ERG presented to Phreesia’s executive leadership in October. The committee brought forward proposed strategies to increase accessibility for these patients and promote health equity more broadly among all patient groups.
QUARTERLY STAKEHOLDER LETTER | THIRD QUARTER 2023 | 13 Culture Gender Equality Report We recently published the latest installment of our annual Gender Equality Report on our Investor Relations website. At Phreesia, we recognize that our ability to execute on our mission of creating a better, more engaging experience depends on our people. We are committed to supporting gender equality in our organization, including through our inclusive culture, board representation, pathways to leadership for women, pay equity and strong family-leave policies. Sara DiNardo Named Top 50 Women Leaders in SaaS We are proud of our colleague and leader Sara DiNardo, Vice President of Client Solutions, who was recently named to The Software Report’s list of the Top 50 Women Leaders in SaaS of 2022. Honorees were chosen based on their demonstrated leadership capabilities, career track record and quantifiable contributions to the Software-as-a-Service industry. This is the fifth consecutive year a woman leader from Phreesia has been named to the list. Past Phreesia awardees are Allison Hoffman, General Counsel; Kristin Roberts, Vice President of Market Development; Kharen Hauck, Vice President of Marketing; and Amy VanDuyn, Senior Vice President of Human Resources. Investments and Operating Leverage Investments in Data Centers Over the past three years, Phreesia has increased its annual investments in data centers. We believe this is an important aspect of our capital allocation strategy because it helps drive the long-term scalability and reliability of our platform. In October and November of 2022, we completed major milestones in our multi-year investment of moving to a data center vendor that we believe provides better overall connectivity with the goal of giving our customers faster, more reliable service. Due to the successful migration of this traffic across our platform, over 90% of our customer traffic uses our new hosting facilities as of the end of the most recent quarter. We plan to migrate the remaining traffic across our platform in early fiscal 2024. We would like to acknowledge our team members across the organization who are contributing to this ongoing initiative.
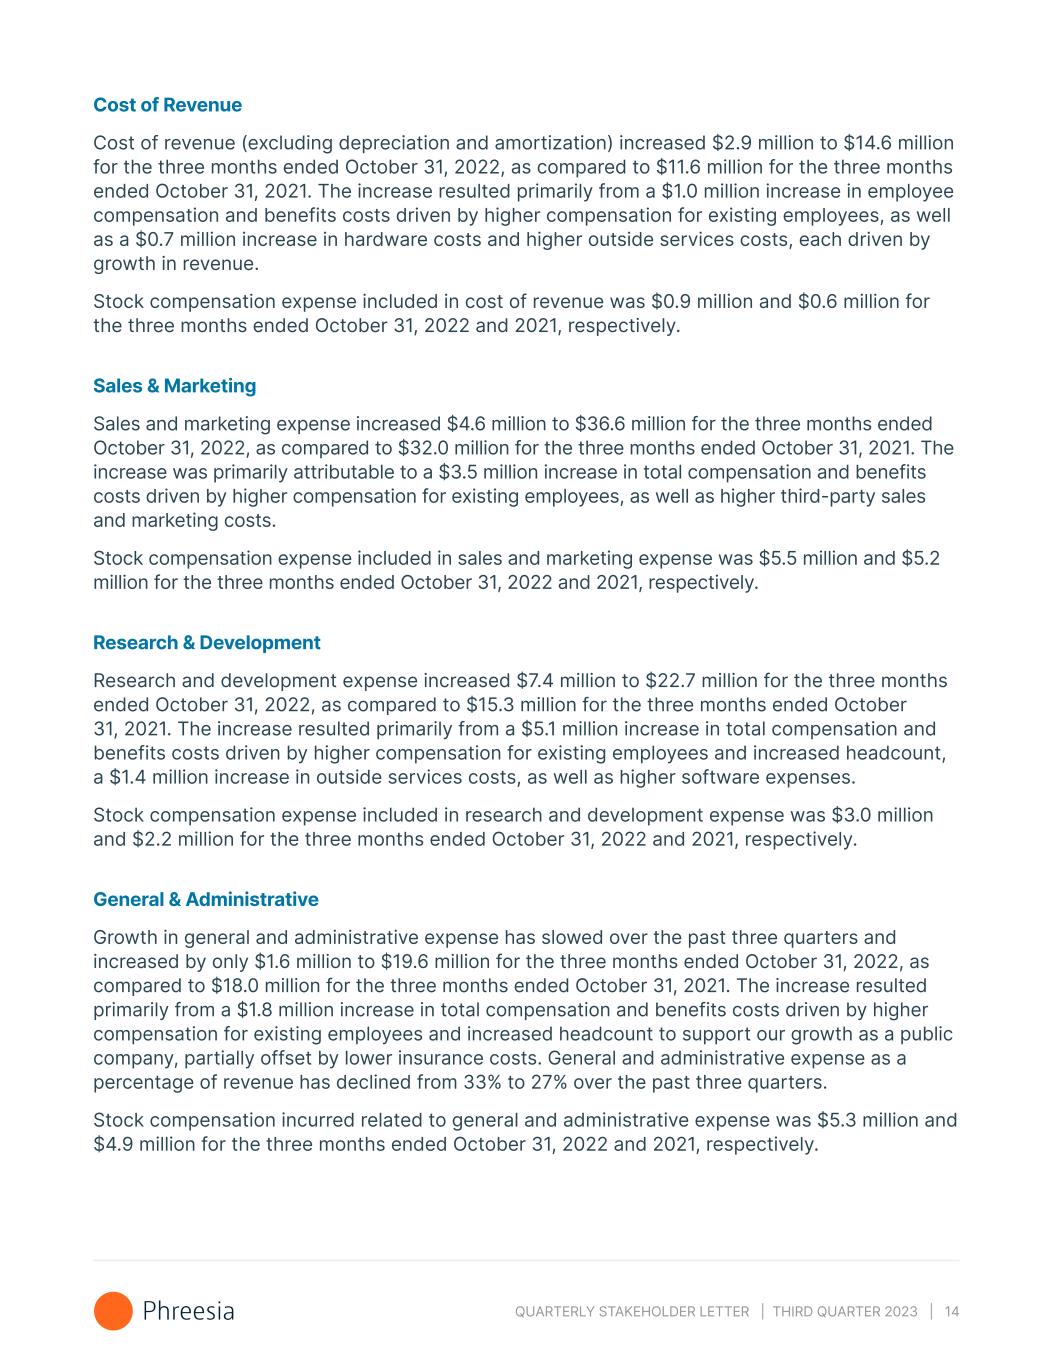
QUARTERLY STAKEHOLDER LETTER | THIRD QUARTER 2023 | 14 Cost of Revenue Cost of revenue (excluding depreciation and amortization) increased $2.9 million to $14.6 million for the three months ended October 31, 2022, as compared to $11.6 million for the three months ended October 31, 2021. The increase resulted primarily from a $1.0 million increase in employee compensation and benefits costs driven by higher compensation for existing employees, as well as a $0.7 million increase in hardware costs and higher outside services costs, each driven by growth in revenue. Stock compensation expense included in cost of revenue was $0.9 million and $0.6 million for the three months ended October 31, 2022 and 2021, respectively. Sales & Marketing Sales and marketing expense increased $4.6 million to $36.6 million for the three months ended October 31, 2022, as compared to $32.0 million for the three months ended October 31, 2021. The increase was primarily attributable to a $3.5 million increase in total compensation and benefits costs driven by higher compensation for existing employees, as well as higher third-party sales and marketing costs. Stock compensation expense included in sales and marketing expense was $5.5 million and $5.2 million for the three months ended October 31, 2022 and 2021, respectively. Research & Development Research and development expense increased $7.4 million to $22.7 million for the three months ended October 31, 2022, as compared to $15.3 million for the three months ended October 31, 2021. The increase resulted primarily from a $5.1 million increase in total compensation and benefits costs driven by higher compensation for existing employees and increased headcount, a $1.4 million increase in outside services costs, as well as higher software expenses. Stock compensation expense included in research and development expense was $3.0 million and $2.2 million for the three months ended October 31, 2022 and 2021, respectively. General & Administrative Growth in general and administrative expense has slowed over the past three quarters and increased by only $1.6 million to $19.6 million for the three months ended October 31, 2022, as compared to $18.0 million for the three months ended October 31, 2021. The increase resulted primarily from a $1.8 million increase in total compensation and benefits costs driven by higher compensation for existing employees and increased headcount to support our growth as a public company, partially offset by lower insurance costs. General and administrative expense as a percentage of revenue has declined from 33% to 27% over the past three quarters. Stock compensation incurred related to general and administrative expense was $5.3 million and $4.9 million for the three months ended October 31, 2022 and 2021, respectively.

QUARTERLY STAKEHOLDER LETTER | THIRD QUARTER 2023 | 15 OPERATING EXPENSE TRENDS 27% 29% 29% 30% 33% 31% 27% Subscription & Network Solutions Cost of Revenue % Rev Q1 FY22 Q2 FY22 Q3 FY22 Q4 FY22 Q1 FY23 Q2 FY23 Q3 FY23 58% 59% 59% 61% 63% 64% 65%Payment processing expense % Rev Q1 FY22 Q2 FY22 Q3 FY22 Q4 FY22 Q1 FY23 Q2 FY23 Q3 FY23 Sales & Marketing $ / % of Rev Q1 FY22 Q2 FY22 Q3 FY22 Q4 FY22 Q1 FY23 Q2 FY23 Q3 FY23 31% 43% 57% 64% 63% 56% 50% $15 $22 $32 $37 $40 $38 $37 17% 22% 27% 30% 33% 33% 31% Research & Development $ / % of Rev Q1 FY22 Q2 FY22 Q3 FY22 Q4 FY22 Q1 FY23 Q2 FY23 Q3 FY23 $8 $11 $15 $17 $21 $23 $23 26% 32% 32% 37% 33% 30% 27% General & Administrative $ / % Rev Q1 FY22 Q2 FY22 Q3 FY22 Q4 FY22 Q1 FY23 Q2 FY23 Q3 FY23 $13 $16 $18 $22 $21 $20 $20 1 Subscription & Network Solutions Cost as a % of Revenue equals cost of revenue (excluding depreciation and amortization), divided by the sum of subscription and related services revenues and network solutions revenues, each per our unaudited consolidated statements of operations for the periods presented. 2 Payment processing expense as a % of Revenue equals payment processing expense divided by payment processing fees revenues, each per our unaudited consolidated statements of operations for the periods presented. FY ended January 31
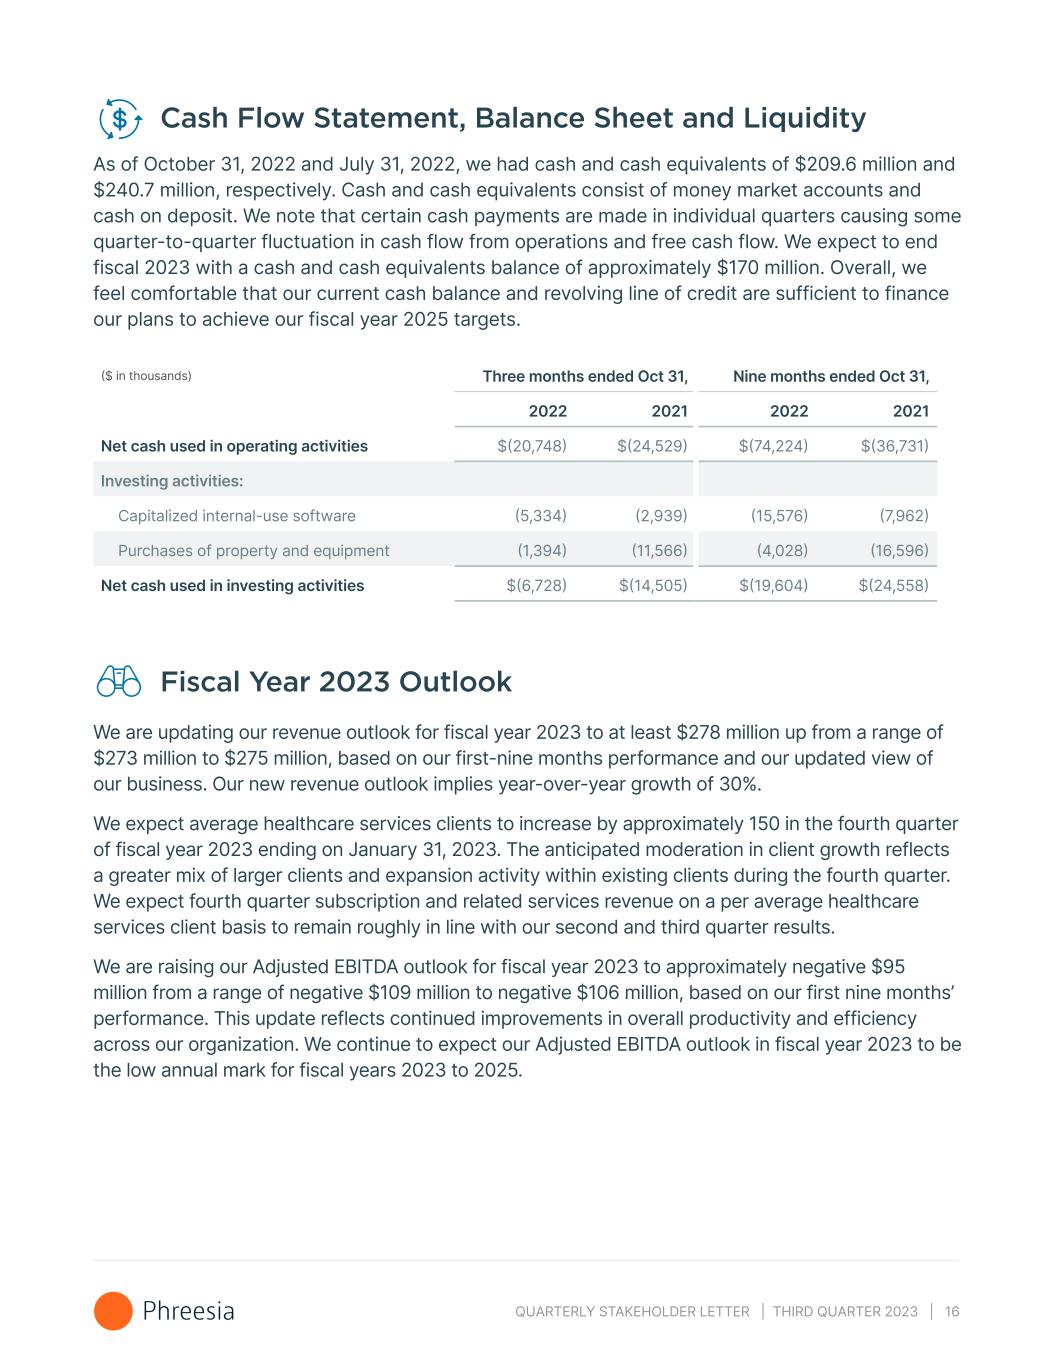
QUARTERLY STAKEHOLDER LETTER | THIRD QUARTER 2023 | 16 Cash Flow Statement, Balance Sheet and Liquidity As of October 31, 2022 and July 31, 2022, we had cash and cash equivalents of $209.6 million and $240.7 million, respectively. Cash and cash equivalents consist of money market accounts and cash on deposit. We note that certain cash payments are made in individual quarters causing some quarter-to-quarter fluctuation in cash flow from operations and free cash flow. We expect to end fiscal 2023 with a cash and cash equivalents balance of approximately $170 million. Overall, we feel comfortable that our current cash balance and revolving line of credit are sufficient to finance our plans to achieve our fiscal year 2025 targets. ($ in thousands) Three months ended Oct 31, Nine months ended Oct 31, 2022 2021 2022 2021 Net cash used in operating activities $(20,748) $(24,529) $(74,224) $(36,731) Investing activities: Capitalized internal-use software (5,334) (2,939) (15,576) (7,962) Purchases of property and equipment (1,394) (11,566) (4,028) (16,596) Net cash used in investing activities $(6,728) $(14,505) $(19,604) $(24,558) Fiscal Year 2023 Outlook We are updating our revenue outlook for fiscal year 2023 to at least $278 million up from a range of $273 million to $275 million, based on our first-nine months performance and our updated view of our business. Our new revenue outlook implies year-over-year growth of 30%. We expect average healthcare services clients to increase by approximately 150 in the fourth quarter of fiscal year 2023 ending on January 31, 2023. The anticipated moderation in client growth reflects a greater mix of larger clients and expansion activity within existing clients during the fourth quarter. We expect fourth quarter subscription and related services revenue on a per average healthcare services client basis to remain roughly in line with our second and third quarter results. We are raising our Adjusted EBITDA outlook for fiscal year 2023 to approximately negative $95 million from a range of negative $109 million to negative $106 million, based on our first nine months’ performance. This update reflects continued improvements in overall productivity and efficiency across our organization. We continue to expect our Adjusted EBITDA outlook in fiscal year 2023 to be the low annual mark for fiscal years 2023 to 2025.
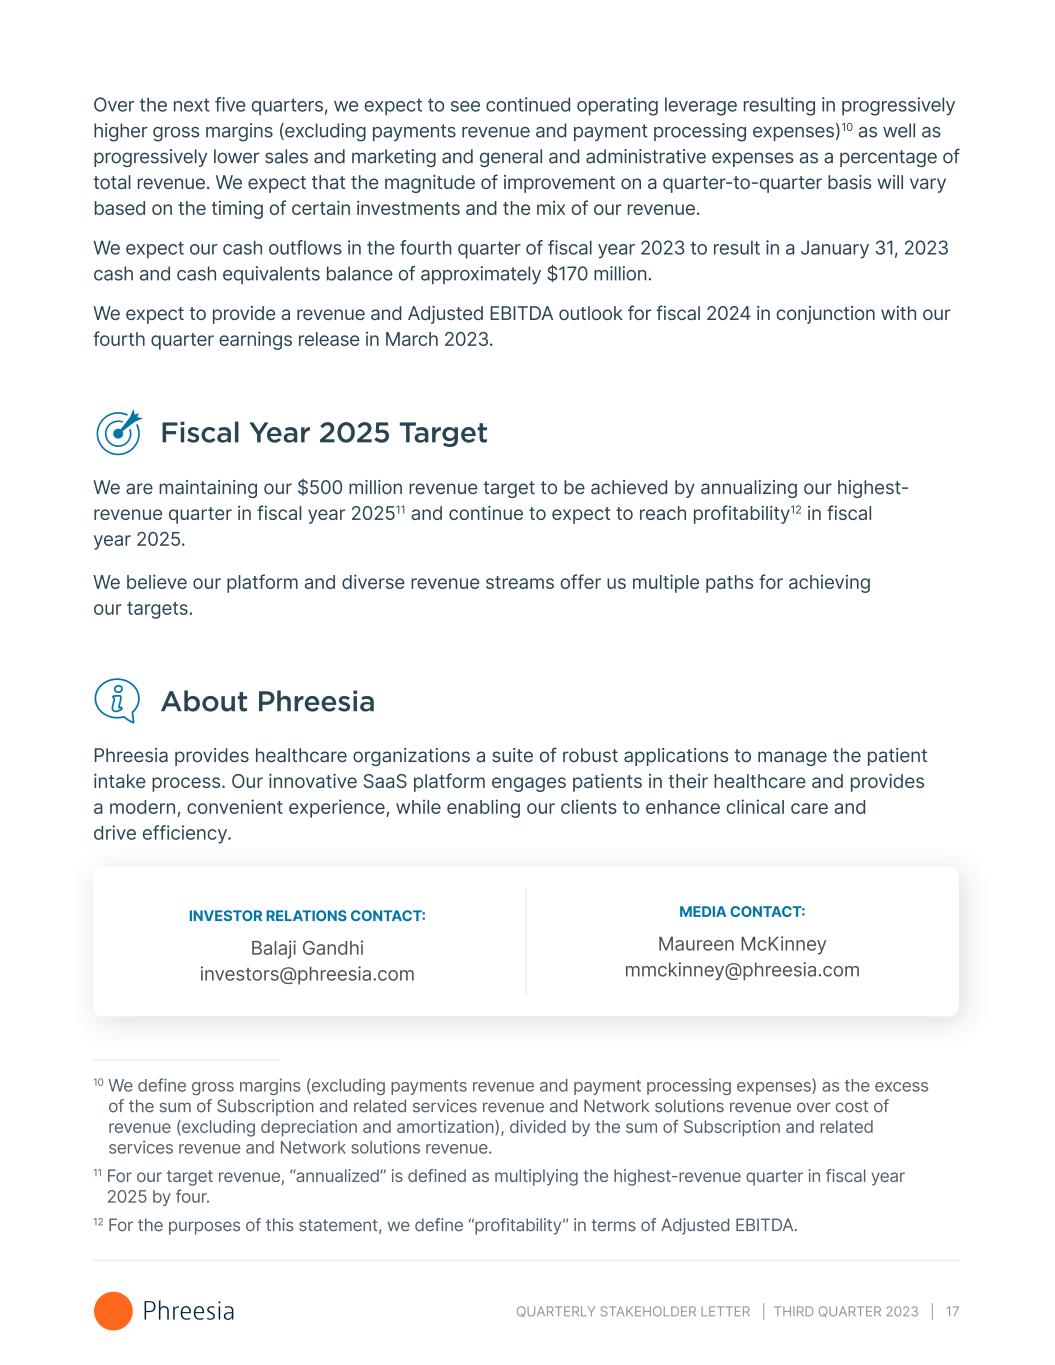
QUARTERLY STAKEHOLDER LETTER | THIRD QUARTER 2023 | 17 Over the next five quarters, we expect to see continued operating leverage resulting in progressively higher gross margins (excluding payments revenue and payment processing expenses)10 as well as progressively lower sales and marketing and general and administrative expenses as a percentage of total revenue. We expect that the magnitude of improvement on a quarter-to-quarter basis will vary based on the timing of certain investments and the mix of our revenue. We expect our cash outflows in the fourth quarter of fiscal year 2023 to result in a January 31, 2023 cash and cash equivalents balance of approximately $170 million. We expect to provide a revenue and Adjusted EBITDA outlook for fiscal 2024 in conjunction with our fourth quarter earnings release in March 2023. Fiscal Year 2025 Target We are maintaining our $500 million revenue target to be achieved by annualizing our highest- revenue quarter in fiscal year 202511 and continue to expect to reach profitability12 in fiscal year 2025. We believe our platform and diverse revenue streams offer us multiple paths for achieving our targets. About Phreesia Phreesia provides healthcare organizations a suite of robust applications to manage the patient intake process. Our innovative SaaS platform engages patients in their healthcare and provides a modern, convenient experience, while enabling our clients to enhance clinical care and drive efficiency. INVESTOR RELATIONS CONTACT: Balaji Gandhi investors@phreesia.com MEDIA CONTACT: Maureen McKinney mmckinney@phreesia.com 10 We define gross margins (excluding payments revenue and payment processing expenses) as the excess of the sum of Subscription and related services revenue and Network solutions revenue over cost of revenue (excluding depreciation and amortization), divided by the sum of Subscription and related services revenue and Network solutions revenue. 11 For our target revenue, “annualized” is defined as multiplying the highest-revenue quarter in fiscal year 2025 by four. 12 For the purposes of this statement, we define “profitability” in terms of Adjusted EBITDA.
QUARTERLY STAKEHOLDER LETTER | THIRD QUARTER 2023 | 18 Non-GAAP Financial Measures We have not reconciled our Adjusted EBITDA outlook to GAAP Net income (loss) because we do not provide an outlook for GAAP Net income (loss) due to the uncertainty and potential variability of Other (income) expense, net and (Benefit from) provision for income taxes, which are reconciling items between Adjusted EBITDA and GAAP Net income (loss). Because we cannot reasonably predict such items, a reconciliation of the non-GAAP financial measure outlook to the corresponding GAAP measure is not available without unreasonable effort. We caution, however, that such items could have a significant impact on the calculation of GAAP Net income (loss). Forward-Looking Statements This stakeholder letter includes express or implied statements that are not historical facts and are considered forward-looking within the meaning of Section 27A of the Securities Act of 1933, as amended, and Section 21E of the Securities Exchange Act of 1934, as amended. Forward-looking statements generally relate to future events or our future financial or operating performance and may contain projections of our future results of operations or of our financial information or state other forward-looking information. These statements include, but are not limited to, statements regarding: our future financial and operational performance, including our revenue, margins, Adjusted EBITDA, cash flows and expected cash balance, average number of healthcare services clients and our ability to reach profitability in fiscal year 2025; our outlook for fiscal year 2023 and fiscal year 2025 targets; our expected increase in average number of healthcare services clients for the quarter ended January 31, 2023; our fiscal year 2023 outlook for Adjusted EBITDA; our ability to finance our plans to achieve our 2025 targets with our current cash balance and revolving line of credit; our business strategy and operating plans; industry trends and predictions; our estimated total addressable market; (including any components thereof); our anticipated growth and operating leverage; our expectation that Network solutions will more meaningfully contribute to revenue over time; our data center migration plans; our expectations regarding the value and potential of our MemberConnect solution; and successful implementation of our solutions under development. In some cases, you can identify forward- looking statements by the following words: “may,” “will,” “could,” “would,” “should,” “expect,” “intend,” “plan,” “anticipate,” “believe,” “estimate,” “predict,” “project,” “potential,” “continue,” “ongoing,” or the negative of these terms or other comparable terminology, although not all forward-looking statements contain these words. Although we believe that the expectations reflected in these forward-looking statements are reasonable, these statements relate to future events or our future operational or financial performance and involve known and unknown risks, uncertainties and other factors that may cause our actual results, performance or achievements to be materially different from any future results, performance or achievements expressed or implied by these forward-looking statements. Furthermore, actual results may differ materially
QUARTERLY STAKEHOLDER LETTER | THIRD QUARTER 2023 | 19 from those described in the forward-looking statements and will be affected by a variety of risks and factors that are beyond our control, including, without limitation, risks associated with: our ability to effectively manage our growth and meet our growth objectives; our focus on the long-term and our investments in growth; the competitive environment in which we operate; our ability to develop and release new products and services; our ability to develop and release successful enhancements, features and modifications to our existing products and services; our ability to successfully complete our data center migration; our ability to maintain the security and availability of our platform; changes in laws and regulations applicable to our business model; our ability to make accurate predictions about our industry and addressable market; the impact of the COVID-19 pandemic on our business and economic conditions; our ability to attract, retain and cross-sell to healthcare services clients; our ability to continue to operate effectively with a primarily remote workforce and attract and retain key talent; our ability to realize the intended benefits of our acquisitions; the recent high inflationary environment and other general market, political, economic and business conditions (including as a result of the warfare and/or political and economic instability in Ukraine). The forward-looking statements contained in this letter are also subject to other risks and uncertainties, including those listed or described in our filings with the Securities and Exchange Commission (the "SEC"), including in our Annual Report on Form 10-K for the fiscal year ended January 31, 2022 and in our Quarterly Report on Form 10-Q for the quarter ended October 31, 2022 that will be filed with the SEC after this letter. The forward- looking statements in this letter speak only as of the date on which the statements are made. We undertake no obligation to update, and expressly disclaim the obligation to update, any forward- looking statements made in this letter to reflect events or circumstances after the date of this letter or to reflect new information or the occurrence of unanticipated events, except as required by law. This letter also includes statistical data, estimates and forecasts that are based on industry publications or other publicly available information, as well as other information based on our internal sources. This information may be based on many assumptions and limitations, and you are cautioned not to give undue weight to such information. We have not independently verified the accuracy or completeness of the information contained in these industry publications and other publicly available information. Conference Call Information We will hold a conference call on December 8, 2022 at 5:00 PM ET to review our fiscal year 2023 third quarter financial results. To participate in our live conference call and webcast, please dial (888) 350-3437 (or (646) 960-0153 for international participants) using conference code number 4000153 or visit the “Events & Presentations” section of our Investor Relations website ir.phreesia.com. A replay of the call will be available via webcast for on-demand listening shortly after the completion of the call, at the same web link, and will remain available for approximately 90 days.


