Exhibit 99.1
| For further information, please contact: Volker Braun, SVP Head of Global Investor Relations & ESG, volker.braun@evotec.com, M. +49.(0)151.1940 5058, www.evotec.com |
 | HALF-YEAR REPORT 2023 |
|
I. MANAGEMENT REPORT
| 4 | NEW AND EXTENDED ALLIANCES underline PIPELINE POTENTIAL |
| 4 | NEW GUIDANCE For full-year 2023 confIRMED |
HIGHLIGHTS
Q2 CYBER-incident IMPACTING STRONG organic REVENUE GROWTH
| 4 | Group revenues increased by 14% to € 383.8 m (H1 2022: € 336.9 m) driven by strong demand for base business and successful partnering activities; like-for-like revenue growth (excluding fx-effects and M&A effects) 14%, thereof € 36.9 m coming from the new Biologics partnership in Q2. |
| 4 | Costs of € 39.3 m were incurred in Q2 as a direct result of the cyber-incident, including additional expenditures and underutilised capacities. |
| 4 | Total EVT Execute revenues (incl. intersegment revenues) up 2% to € 356.6 m (H1 2022: € 351.0 m), strongly affected by cyber-incident; EVT Innovate revenues up 66% to € 129.7 m (H1 2022: € 78.0 m) |
| 4 | Adjusted Group EBITDA totalled € 26.1 m (H1 2022: € 33.6 m); delivery of Sandoz work packages and Bristol-Myers Squibb (“BMS”) collaboration yield excellent gross margin, partially compensating for underutilised capacities as a result of the cyber-incident. |
new and extended alliances reflect success of growth strategy “ACTION PLAN 2025”
| 4 | New significant collaboration announced with Janssen |
| 4 | Extension and expansion of strategic neurodegeneration partnership with BMS, and strong progress in strategic targeted protein degradation partnership with BMS |
| 4 | Validation of Just – Evotec Biologics’ strategy, new agreements with Sandoz and the U.S. Department of Defense (after period-end) |
| 4 | Milestone payment received with first patient dosed in Phase I study of Bayer kidney disease program |
| 2 |
| HALF-YEAR REPORT 2023 |
|
Business Outlook for Full-Year 2023 reflecting CYBER-ATTACk;
mid-term goals 2025 Confirmed
| 4 | Group revenues expected to be in a range of € 750 – 790 m (€ 765 – 805 m at constant exchange rates) (2022: € 751 m) in FY 2023 |
| 4 | Adjusted Group EBITDA guidance range between € 60 – 80 m (€ 70 – 90 m at constant exchange rates) (2022: € 102 m) |
| 4 | Unpartnered research and development expenses expected to be in a range of € 60 – 70 m (2022: € 70 m) |
| Guidance 2023 | Guidance 2023 at constant fx1) | Actual 31 December 20222) | ||||
| Group revenues | € 750 – 790 m | € 765 – 805 m | € 751 m | |||
| Unpartnered R&D expenses | € 60 – 70 m | - | € 70 m | |||
| Adjusted Group EBITDA | € 60 - 80 m | € 70 - 90 m | € 102 m |
1) Average exchange rate euro vs. US Dollar for 2023: 1.0530
2) Including effects related the M&A (Rigenerand, Central Glass)
| 4 | Mid-term goals target revenue growth to > € 1,000 m, adjusted EBITDA of ≥ € 300 m and unpartnered research and development expenses of > € 100 m |
Due to the criminal cyber-attack discovered on 6 April 2023, productivity was affected throughout the entire second quarter. In response to the criminal cyber-attack, Evotec took immediate action to contain and remediate the attack by taking its external-facing systems offline. This was deemed necessary to protect all the Company’s partners and stakeholders and meant Evotec could ensure that integrity of scientific data remained unaffected. The Company re-started operations at the end of April with productivity reaching approx. 50% in May and more than 80% in June.
| 3 |
| HALF-YEAR REPORT 2023 |
|
Financial Highlights
The following table provides an initial overview of the financial performance in the first half-year 2023 compared to the same period in 2022. More detailed information can be found from page 6 of this report.
Key figures of unaudited consolidated income statement & segment information
Evotec SE & subsidiaries – First half-year 2023
| In k€ | Evotec Group H1 2023 | Evotec Group H1 2022 | ||||||
| Revenues1) | 383,835 | 336,875 | ||||||
| Intersegment revenues | – | – | ||||||
| Costs of revenue | (284,275 | ) | (273,685 | ) | ||||
| Gross profit | 99,560 | 63,190 | ||||||
| Gross margin in % | 25.9 | % | 18.8 | % | ||||
| R&D expenses2) | (30,863 | ) | (36,838 | ) | ||||
| SG&A expenses | (88,192 | ) | (67,379 | ) | ||||
| Other operating income (expenses), net | (4,278 | ) | 37,738 | |||||
| Net operating income (loss) | (23,773 | ) | (3,307 | ) | ||||
1) Adjusted for exchange rate effects of € 0.8 m, Group revenues would have amounted to € 383.0 m
2) Includes unpartnered R&D expenses of € 29.0 m € in H1 2023 (H1 2022: € 33.3 m)
The following table details Evotec’s segment revenues and operating income (loss) for the six months ended 30 June 2023
| In T€ | EVT Execute | EVT Innovate | Intersegment Eliminations | Evotec Group 6M 2023 | ||||||||||||
| Revenues | 254,150 | 129,685 | (102,445 | ) | 383,835 | |||||||||||
| Operating result | (24,708 | ) | 934 | – | (23,773 | ) | ||||||||||
| 4 |
| HALF-YEAR REPORT 2023 |
|
Operational Highlights
Signing of new and extended drug discovery and development agreements
In the first half-year of 2023, Evotec continued to further expand its operational activities based on its fully integrated End-to-End shared R&D and precision medicine platforms. Despite the cyber-attack, the Company entered into several new partnerships and extended existing alliances across the various stages of drug discovery and development e.g.:
| · | In January, Evotec announced a new strategic collaboration and licence agreement with Janssen focussing on the development of first-in-class targeted immune-based therapies for oncology. Besides research funding, Evotec is entitled to an undisclosed upfront payment, success-based research and commercial milestones exceeding US$ 350 m over a minimum of 3 years, as well as tiered royalties on products resulting from the collaboration. | |
| · | In February, Evotec extended and expanded its integrated multi-target drug discovery agreement with Related Sciences to continue to grow the joint portfolio of drug development candidates through 2030, leveraging Evotec’s industry-leading capabilities across the full R&D continuum. | |
| · | In March, Evotec announced key scientific progress in the targeted protein degradation alliance with BMS, first signed in 2018. Performance-based and programme-based achievements triggered payments of in total US$ 72.6 m to Evotec. | |
| · | Also in March, Evotec and BMS extended and expanded their neurodegeneration partnership, originally signed in 2016 for an additional 8 years. Evotec received a US$ 50 m upfront payment, undisclosed license, and performance milestone payments, as well as tiered royalties of up to low double-digit percentages on product sales. Including the upfront and downstream performance milestone payments, the overall transaction results in a deal value of US$ 4 bn with revenue recognized over the lie of the contract. |
Just – Evotec Biologics: Validation of paradigm shift in biologics manufacturing
Just – Evotec Biologics, while still in start-up and investment phase, has demonstrated its strategic potential through newly signed agreements and ongoing discussions from discovery through process development to clinical and commercial supply.
| · | In May, Just – Evotec Biologics and Sandoz launched a multi-year, long-term tech partnership for the immediate development and subsequent manufacturing of multiple biosimilars. Just – Evotec Biologics will receive a double-digit-million upfront and future payments US$ 640 m dependent on successful development progress of as well as additional payments dependent on progress into commercial manufacturing. | |
| · | In June, the successful installation of multiple cleanroom PODs significantly advanced the construction of J.POD Toulouse, France (EU). The strategic investment in this platform expansion will make Just – Evotec Biologics’ J.POD technology, with its cost-effective and flexible clinical and commercial supply solutions for biomanufacturing available for the first time in Europe. | |
| · | On 5 July 2023 (after period-end), the U.S. Department of Defense (“DOD”) awarded Just – Evotec Biologics a second contract under the accelerated antibodies program valued up to US$ 74 m for the rapid development of monoclonal antibody (“mAb”) -based drug product prototypes targeting orthopoxviruses. |
| 5 |
| HALF-YEAR REPORT 2023 |
|
Co-owned pipeline projects progressing well.
| · | In June, Evotec received a € 2 m milestone payment from Bayer which was triggered by the first patient dosed in the clinical Phase I study of a kidney disease programme stemming from the Evotec-Bayer multi-target research collaboration in kidney diseases. The drug candidate, a monoclonal antibody targeting the protein Semaphorin-3A (“Sema3A”) is being developed as a potential first-to-market treatment for Alport syndrome, a rare genetic kidney disease. |
New funding for long-term growth
| · | In February, Evotec and the European Investment Bank (“EIB”) finalized an agreement for an unsecured loan facility that includes a low fixed interest rate plus a reward-sharing component for the EIB. The loan will be invested over a period of three years and each tranche will mature seven years after drawing down. Evotec will use the loan, with a total volume of up to € 150 m, to fund its internal R&D activities, equity investments, as well as the new biologics manufacturing facility, J.POD Toulouse, France (EU). | |
| · | In June, Evotec received a US$ 1.7 m grant from Open Philanthropy. Under the grant, Evotec leverages its RNA-targeting small molecules platform to identify promising RNA sequences to target with small molecule ligands that can be developed into potentially first-in-class therapeutics against Henipaviruses. |
Strong start to the year
Prior to the cyber-attack on 6 April, the Company’s Q1 results remained materially unaffected and represented a strong start to the year. While all efforts were focused on a fast return to full productivity and business recovery, Q2 saw delays in business operations, of which most are expected to be recovered in the second half of 2023.
Report on the Financial Situation and Results
1. Results of operations
Group revenues in the reporting period increased by 14% or € 47.0 m to € 383.8 m (H1 2022: € 336.9 m). Evotec had a strong start to the year with revenues of € 213.6 m (Q1 2022: € 164.7 m) and 30% revenue growth in the first quarter of 2023, driven by robust underlying business dynamics in a challenging environment and payments from BMS after the extensions and expansions of strategic alliances in targeted protein degradation and neurodegeneration. Due to the criminal cyber-attack on 6 April 2023, productivity was affected throughout the entire second quarter. In response to the criminal cyber-attack, Evotec took immediate action to contain and remediate the attack by taking its external-facing systems offline. This was deemed necessary to protect all the Company’s partners and stakeholders and Evotec could ensure that integrity of scientific data remained unaffected. The Company re-started operations at the end of April with productivity reaching approx. 50% in May and more than 80% in June leading to a contribution of € 170.2 m (Q2 2022: € 172.2 m). The second quarter was positively influenced by the recognition of the delivery of work packages as part of the new Technology-Partnership with Sandoz. Excluding the recognition of minor fx-effects, Group revenues grew by 14% or € 47.0 m to € 383.8 m within the first 6 months. Growth of the base business was 14% or € 49.4 m from € 330.1 m in H1 2022 to € 379.5 m in the first six months of 2023, of which € 212.0 m were generated in Q1 2023 and € 167.5 m in the second quarter of 2023. In connection with other collaborations, we generated milestone, upfront and license revenues of € 4.3 m (H1 2022: € 6.8 m); thereof € 1.6 m achieved between January and March, € 2.7 m from April until June 2023. Just – Evotec Biologics more than doubled its revenue share year-over-year to € 59.0 m during the six months ended 30 June 2023 (H1 2022: € 21.4 m) which composes of € 11.1 m in Q1 2023 and € 47.9 m in Q2 2023.
| 6 |
| HALF-YEAR REPORT 2023 |
|
Geographically, 26% of Evotec’s revenues were generated with partners in Germany, France, and UK, 72% with partners in the USA and 2% with partners in the rest of the world. This compares to 29%, 53% and 17%, respectively, in the same period of the previous year.
The Costs of revenue during the six months ended 30 June 2023 amounted to € 284.3 m (H1 2022: € 273.7 m) yielding a gross margin of 25.9% (H1 2022: 18.8%). The significant increase of margin was attributable to recent signed beneficial cooperations and partnerships with BMS, Sandoz and the milestone payment of € 2 m from Bayer. Excluding Just – Evotec Biologics, total gross margin amounted to 25.3% vs. 27.3% during the same period last year. The cost of revenues of the group was divided into € 160.3 m in Q1 2023 (Gross margin: 24.9 %) versus € 124.0 m in Q2 2023 (Gross margin: 27.2 %).
Total R&D expenses decreased by € 6.0 m or 16% for the six months ended 30 June 2023 to € 30.9 m (H1 2022: € 36.8 m). The decrease in unpartnered R&D expenses by 11% to € 29.0 m (H1 2022: € 33.3 m) and partnered R&D expenses by 64% to € 1.9m (H1 2022: € 3.5 m) was primarily related to the impacted business activity due to the cyber incident in the second quarter leading to a temporary reduction of R&D costs in Q2 2023. to € 12.2 m (Q2 2022: € 18.7 m) after € 18.7 m in Q1 2023 (Q1 2022: € 18.1 m).
In comparison to the same period of 2022, SG&A expenses increased by € 20.8 m or 31% to € 88.2 m (H1 2022: € 67.4 m), mainly driven by increasing headcount at all sites to sustain the business expansion.and strengthen the end-to-end global processes and systems.
Other operating income and expenses amounted in total to € (4.3) m expense (H1 2022: Other operating income of € 37.7 m). The decrease is mainly resulted from costs related to managing the impact of the cyber-attack in Q2. These costs – which are one-off costs in nature – related to third party involvement like consultants and legal advisors as well as to work contributed by Evotec staff and totalled to € 39.3 m as of 30 June 2023. Internal costs reported under Other operating expenses related mainly to time spent in IT and other departments on recovering after the cyber-attack. Further, the company recognized € 5.1 m of impairment on intangible assets.
Less activity in R&D resulted in a lower than anticipated other operating income from R&D tax credits of € 20.1 m (H1 2022: 19.3 m). Recharges of Sanofi for ID Lyon amounted to € 16.9 m in H1 2023 (H1 2022: € 16.8 m).
The improvement in net income (loss) before taxes of € (26.7) m (H1 2022: € (93.1) m) was mainly related to a gain on investment in equity instruments re-evaluation in the amount of € 5.6 m (H1 2022 € (97.7) m for Evotec’s equity position in Exscientia plc . In H1 2023, Exscientia's ordinary share price increased by 11% from US$ 5.33 at the end of 2022 to US$ 5.92 as of 30 June 2023.
Adjusted Group EBITDA of the first six months 2023 totalled at € 26.1 m (H1 2022: € 33.6 m), caused by missed revenues after the cyber-attack as well as higher costs to manage adverse effects of the incident. Business dynamics were fully intact until 6 April, leading to a very strong start to the year yielding an EBITDA of € 34.3 m in Q1 2023. One-off burdens in Q2 2023 were partially mitigated due to the signing of the Technology-Partnership with Sandoz. Still, adjusted EBITDA was negative at € (8.2) m in Q2 2023.
Just – Evotec Biologics started ahead of plan mainly based on closing of the Tech-Partnership with Sandoz and a strong overall orderbook, contributing an EBITDA of € 8.5 m for H1 2023 (Q1 2023: € (11.5) m; Q2 2023: € 20.0 m).
Group net income as of 30 June 2023 amounted to € (28.8) m (H1 2022: € (101.2) m), mainly because of the gain on revaluation of investments in equity instruments of € 5.6 m versus € (97.7) m in H1 2022 for Evotec’s 14 m shares in Exscientia plc.
| 7 |
| HALF-YEAR REPORT 2023 |
|
2. Progressing convergence of integrated services
The majority of missed external revenues € 70 m (net) were related to EVT Execute while EVT Innovate demonstrated a very strong H1, mainly driven by the progress in its PanOmics-based partnerships with BMS. Despite material one-off effects, total EVT Execute revenues (incl. intersegment revenues) increased by 2% to € 356.6 m (H1 2022: € 351.0 m), supported by an increase of revenues of Just – Evotec Biologics. Intersegment revenues amounted to € 102.4 m (H1 2022: € 92.1 m), which is an indicator for the convergence of our offering based on our fully integrated platform. Intersegment sales are reflective of the progress of projects recognised within EVT Innovate where Evotec maintains rights to participate in the success of partnered projects in the future.
EVT Execute recorded costs of revenue of € 291.4 m in the first six months of 2023 (H1 2022: € 289.8 m), resulting in a gross margin of 25.7% (H1 2022: 17.4%). EVT Execute gross margin excluding Just – Evotec Biologics (US) would have reached 23.2% in H1 2023, a 210-basis point change compared to 25.3% in the same period 2022. The delta to the total gross margin of EVT Execute shows the positive contribution of our Biologics business. R&D expenses were € 2.4 m (H1 2022: € 2.6 m), SG&A expenses increased to € 67.3 m (H1 2022: € 54.1 m) as a mix of increase in headcount and more consultancy. The impact of the cyber-attack is visible in line with Other operating expense (income), net, which amounted to € 20.2 m and included internal as well as external costs.
Adjusted EBITDA of the EVT Execute segment was € 22.6 m, 59% below the previous year level (H1 2022: € 54.7 m) due to loss of operations as a consequence of the cyber-attack. While the miss of revenues and related costs are considered temporary, preparations for future growth have been pursued by moderately increasing headcount even in a challenging situation.
The EVT Innovate segment generated revenues of € 129.7 m (H1 2022: € 78.0 m). This increase of 66% was mainly driven by high base revenues from the collaborations with BMS.
The EVT Innovate segment incurred costs of revenue of € 89.5 m (H1 2022: € 68.3 m). Gross margin as a percent of revenue was 31.0%, a significant increase of 18.6 percentage points compared with H1 2022 (12.4%). The EVT Innovate segment reported R&D expenses of € 34.3 m (H1 2022: € 42.0 m) which were below budget due to the cyber-attack in early April. Expanded business development activities resulted in an increase of SG&A expenses to € 20.9 m (H1 2022: € 13.3 m). Other operating expense (income), net, decreased from € 22.2 m to € 15.9 m, mainly as a result of the cyber-attack. The EVT Innovate adjusted EBITDA reached € 3.5 m in H1 2023 (H1 2022: € (21.1) m).
3. Financing and financial position
Cash flow provided by operating activities in the first six months of 2023 amounted to € (5.2) m (H1 2022: € 240.6 m). The comparable figure last year was driven by a $ 200 m upfront payment from BMS. In H1 2023, this figure does not yet reflect payments in connection with the BMS collaboration and the agreement with Sandoz, which were received after the due date on 30 June.
Cash flow from investing activities for the first six months of 2023 amounted to € 28.8 m (Cash flow used in investing activities in H1 2022: € 206.9 m), mainly driven by a positive net effect of € 141.6 m from purchase and proceeds of investments. The proceeds from investments were mainly used to fund the capital expenditures. Capital expenditure amounted to € 104.0 m (H1 2022: € 81.4 m), of which investments into the J.POD, Toulouse (EU) facility amounted to € 48.3 m. Apart from this growth projects, capital expenditures include investments focused on Global Drug Discovery (GDD), Drug Discovery Services (DDS), the J.POD Redmond (U.S.) facility, energy-efficiency improvements and the taken measures after the cyber-attack.
| 8 |
| HALF-YEAR REPORT 2023 |
|
Cash flow from financing activities were € 10.5 m for the first six month against € (45.8) m in H1 2022. Proceeds from new loans amounted to € 20 m, partly offset by repayments of lease obligations.
Cash and cash equivalents were € 459.8 m as of 30 June 2023 (31 December 2022: € 415.2 m). In detail, the cash outflow from investing activities decreased to € 28.8 m (H1 2022: € (206.9) m), which was more than off-set by the received pre-payments from the recent extension of partnership with BMS in protein degradation. Consequently, total Liquidity amounted to € 620.8 m (31 December 2022: € 718.5 m).
4. Assets, liabilities, and stockholders’ equity
Assets
Between 31 December 2022 and 3o June 2023, total assets increased slightly by € 44.0 m to € 2,301.2 m (31 December 2022: € 2,257.2 m).
Investments, and other current financial assets including derivatives amounted to € 173.2 m (31 December 2022: € 314.8 m). This significant decrease was a result of the sale of current investments as part of the financing of our capacity expansion.
Trade and other receivables increased in the six months ended 30 June 2023 by € 30.7 m to € 202.5 m (31 December 2022: € 171.8 m), due to the recognition of the new contracts with BMS and Sandoz. As of 30 June, Days Sales Outstanding (DSO) of 96 were significantly reduced to 62 again in July 2023 after reception of the payments from BMS and Sandoz.
Contract assets and Inventories remained relatively stable with € 59.1 m versus € 60.3 m as of 31 December 2022.
Current tax assets increased from € 54.4 m as per 31 December 2022 to € 62.4 m as per 30 June 2023, mainly related to increased tax credits in Italy.
Prepaid expenses and other current assets increased by € 12.4 m to € 69.6 m (31 December 2022: € 57.1 m) mainly due to the increase of VAT receivables.
Property, plant, and equipment rose by € 70.9 m to € 721.1 m (31 December 2022: € 650.2 m) caused by capital expenditures for site expansion, exceeding depreciations.
Intangible assets and Goodwill declined by € 6.0 m compared with 31 December 2022, to € 292.6 m (31 December 2022: € 298.6 m), primarily due to straight-line amortisation of definite life intangibles and fx-effects.
Non-current tax receivables increased to € 88.8 m (31 December 2022: € 70.3 m) mainly due to receivables relating to R&D tax credits in France and Prepayments regarding Corporate Income Tax and Trade Tax in Germany.
Long-term financial investments and other long-term assets and investments in associates and Joint ventures amounted to € 160.8 m (31 December 2022: € 154.1 m). This increase resulted mainly from the revaluation to Evotec’s stake in Exscientia plc.
| 9 |
| HALF-YEAR REPORT 2023 |
|
Liabilities
Trade and other payables increased by € 8.7 m in the six months ended 30 June 2023 to € 106.0 m (31 December 2022: € 97.3 m) in accordance with the overall business growth.
Provisions decreased by € 6.1 m to € 48.3 m (31 December 2022: € 54.4 m) due to annual bonus payments in April 2023.
Other current financial liabilities increased to € 151.6 m (31 December 2022: € 23.5 m) mainly due to reclassification of long-term financial liabilities.
Current and non-current contract liabilities increased by € 29.5 m to € 358.6 m (31 December 2022: € 329.1 m) due to the recognition of the upfront payments from BMS.
Net debt leverage ratio of (3,6)x adjusted EBITDA, excl. IFRS 16 effect and (0,9)x incl. IFRS 16 improved versus Q4 2022 with reference to the overall positive net cash position.
Stockholders’ equity
As of 30 June 2023, Evotec’s overall capital structure remained stable at a strong equity balance compared with the end of 2022. Total stockholders’ equity declined by one percent (€ 12.9 m) to € 1,174.3 m (31 December 2022: € 1,187.2 m). Due to the exercise of stock options and Share Performance Awards, a total amount of 177,185,744 shares were issued and outstanding with a nominal value of € 1.00 per share as of 30 June 2023. Evotec’s equity ratio as of 3o June 2023 amounted to 51.0% (31 December 2022: 52.6%).
5. Human Resources
Employees
Headquartered in Hamburg, Germany, the Evotec Group employed 5,067 people globally as of 30 June 2023 (31 December 2022: 4,952 employees), which corresponds to a total increase of 2.3% compared to the prior year’s end. Overall, the number of employees grew by 115 in the first six months of 2023 (H1 2022: 323 employees).
Stock-based compensation
During the first half of 2023, 227,555 Share Performance and Restricted Awards from the total granted 806,500 Share Performance and 603,161 Restricted Awards were given to the members of the Management Board. The remaining number of awards were given to other key employees.
During the first half-year 2023 233,083 shares were issued through the exercise of Share Performance Awards. As of 30 June 2023, the total number of Share Performance and Restricted Awards available for future exercise amounted to 2,802,180 (approximately 1.0% of shares in issue).
Share Performance and Restricted Awards have been accounted for under IFRS 2 using the fair value at the grant date.
With the exception of Dr Mario Polywka, the Supervisory Board of Evotec SE does not hold any Share Performance Awards.
| 10 |
| HALF-YEAR REPORT 2023 |
|
Shareholdings of the Boards of Evotec SE as of 30 June 2023
| Shares | Stock options | Outstanding Shares from vested SPA’s | Granted unvested SPA’s and RSA´s (total) | |||||||||||||
| Management Board | ||||||||||||||||
| Dr Werner Lanthaler | 1,540,906 | – | – | 241,824 | ||||||||||||
| Dr Cord Dohrmann | 195,079 | – | – | 115,201 | ||||||||||||
| Dr Matthias Evers | – | – | – | 39,353 | ||||||||||||
| Dr Craig Johnstone | 20,161 | – | – | 108,197 | ||||||||||||
| Laetitia Rouxel | 51,655 | – | – | 42,488 | ||||||||||||
| Supervisory Board | ||||||||||||||||
| Prof. Dr Iris Löw-Friedrich | – | – | – | – | ||||||||||||
| Roland Sackers | – | – | – | – | ||||||||||||
| Camilla Macapili Languille | – | – | – | – | ||||||||||||
| Dr Mario Polywka | 11,938 | – | – | – | ||||||||||||
| Dr Constanze Ulmer-Eilfort | – | – | – | – | ||||||||||||
| Dr Elaine Sullivan | – | – | – | – | ||||||||||||
Pursuant to Article 19 of the European Market Abuse Regulation (EU-Marktmissbrauchsverordnung), the above tables and information list the number of Company shares held and rights for such shares granted to each board member as of 30 June 2023 separately for each member of Evotec’s Management Board.
RISKS AND OPPORTUNITIES MANAGEMENT
The risks and opportunities described in Evotec’s Annual Report 2022 on pages 66 to 80 remain mainly unchanged. At present, no risks have been identified that either individually or in combination could endanger the continued existence of Evotec SE.
General Market and Healthcare environment
Trends in the pharmaceutical and biotechnology sector
There were no material changes to the overall trends in the pharmaceutical and biotechnology sector described in Evotec’s Annual Report 2022 on page 43 and 44. Please see Evotec’s Annual Report 2022 for further information.
| 11 |
| HALF-YEAR REPORT 2023 |
|
FORWARD-LOOKING STATEMENTS
This half-year interim report contains forward-looking statements concerning future events. Words such as “anticipate,” “believe,” “could,” “estimate,” “expect,” “intend,” “may,” “might,” “plan,” “potential,” “should,” “target,” “would” and variations of such words and similar expressions are intended to identify forward-looking statements. Such statements include comments regarding Evotec’s expectations for revenues, Adjusted Group EBITDA and unpartnered R&D expenses, as well as the anticipated impact from the Russian invasion of Ukraine. These forward-looking statements are based on the information available to, and the expectations and assumptions deemed reasonable by Evotec at the time these statements were made. No assurance can be given that such expectations will prove to have been correct. These statements involve known and unknown risks and are based upon a number of assumptions and estimates, which are inherently subject to significant uncertainties and contingencies, many of which are beyond the control of Evotec. Factors that could cause actual results to differ are discussed under the heading "Risk Factors" in our Annual Report for the year ended December 31, 2021. Evotec expressly disclaims any obligations or undertaking to release publicly any updates or revisions to any forward-looking statements contained herein to reflect any change in Evotec’s expectations with respect thereto or any change in events, conditions or circumstances on which any statement is based.
NON-IFRS METRICS
This interim report includes certain financial measures and metrics not based on IFRS, including Adjusted Group EBITDA. We define Adjusted EBITDA as net income (loss) adjusted for interest, taxes, depreciation and amortization of intangibles, impairments on goodwill and other intangible and tangible assets, total non-operating results and change in contingent consideration (earn-out).
Adjusted EBITDA should not be considered in isolation from, or as a substitute for, financial information prepared in accordance with IFRS. Adjusted EBITDA is a non-IFRS measures presented as a supplemental measure of our performance. Adjusted EBITDA should not be considered as an alternative to net income as a measure of financial performance. Adjusted EBITDA is presented because it is a key metric used by our Management Board to assess our financial performance. Management believes Adjusted EBITDA is an appropriate measure of operating performance because it eliminates the impact of expenses that do not relate directly to the performance of the underlying business. Our definition of this non-IFRS financial measure may not be comparable to similarly titled measures of other companies, thereby, reducing the usefulness of our Adjusted EBITDA as a tool for comparison.
| 12 |
| HALF-YEAR REPORT 2023 |
|
The following table shows the reconciliation of net income to Adjusted EBITDA
| In T€ | Evotec Group 6M 2023 | Evotec Group 6M 2022 | ||||||
| Net income | (28,828 | ) | (101.179 | ) | ||||
| Interest expense (net) | 640 | (5,796 | ) | |||||
| Tax expense | 2,175 | 8,110 | ||||||
| Depreciation of tangible assets | 40,851 | 32.833 | ||||||
| Amortization of intangible assets | 3,902 | 4.885 | ||||||
| EBITDA | 17.460 | (49.555 | ) | |||||
| Impairment of intangible assets | 5,119 | - | ||||||
| Impairment of goodwill | - | - | ||||||
| Measurement gains from investments | (5,567 | ) | 97,718 | |||||
| Share of loss of associates accounted for using the equity method | 7,149 | 7,628 | ||||||
| Impairment of financial assets | - | - | ||||||
| Other income from financial assets, net | - | - | ||||||
| Foreign currency exchange (loss) gain, net | 2,477 | (21,456 | ) | |||||
| Other non-operating income, net | (540 | ) | 76 | |||||
| Change in contingent consideration (earn-out) | - | (775 | ) | |||||
| Adjusted EBITDA | 26.099 | 33,636 | ||||||
| 13 |
| HALF-YEAR REPORT 2023 |
|
The Evotec share
Performance of the Evotec share in the first six months of 2023
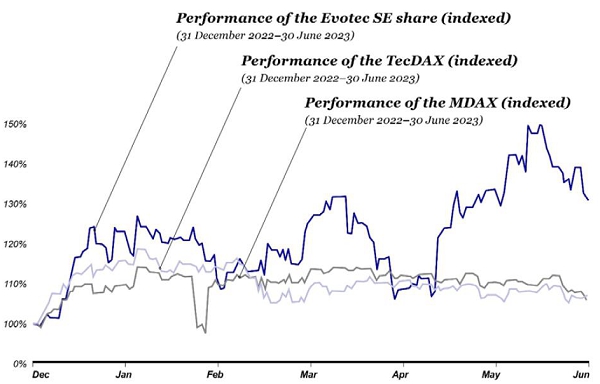
The performance of the Evotec share in the first six months of 2023 was accompanied by numerous company announcements. At the end of January, Evotec already announced that it had entered into an agreement with Janssen for the development of immune-based therapies. The extension of the strategic partnership with BMS at the end of March, too, led to an upward movement. The announcement of a criminal cyber-attack on 6 April ended this trend.
Due to the attack, Evotec was unable to report its results for the fiscal year 2022 in due time. The delay, which in the end amounted to 12 days, prompted Qontigo GmbH, a part of Deutsche Börse Group, to remove Evotec from all relevant indices on 5 May and to implement its decision accordingly four days later. The announcement by Evotec and Sandoz to launch a technology partnership for the development and commercial manufacturing of biosimilars triggered a strong recovery immediately thereafter. Following the ad-hoc release on the new partnership on 9 May 2023, the Evotec share gained 14 percentage points. With the publication of the annual report on 12 May, Evotec satisfied the conditions to re-join the MDAX and the TecDAX, which further strengthened the positive share price performance even before the announcement that it would resume its dual listing as of 19 June. As a result, based on the closing price of 30 June 2023, the Evotec share traded 35% higher than at the end of 2022. The share price significantly outperformed both benchmark indices, TecDAX and the MDAX, by more than 20%.
| 14 |
| HALF-YEAR REPORT 2023 |
|
II. UNAUDITED INTERIM CONDENSED CONSOLIDATED FINANCIAL STATEMENTS
Evotec SE and Subsidiaries
Consolidated interim statement of financial position as of 30 June 2023
| in k€ except share data | Note reference | as of 30 June 2023 | as of 31 December 2022 | ||||||||
| ASSETS | |||||||||||
| Current assets: | |||||||||||
| — Cash and cash equivalents | 459,752 | 415,155 | |||||||||
| — Investments | 161,094 | 303,334 | |||||||||
| — Trade and other receivables | 202,496 | 171,799 | |||||||||
| — Contract assets | 26,459 | 30,516 | |||||||||
| — Inventories | 32,612 | 29,825 | |||||||||
| — Current tax assets | 62.346 | 54,422 | |||||||||
| — Other current financial assets including derivatives | 12,127 | 11,494 | |||||||||
| — Prepaid expenses and other current assets | 69,563 | 57,126 | |||||||||
| Total current assets | 1,026,449 | 1,073,671 | |||||||||
| Non-current assets: | |||||||||||
| — Long-term financial investments and other long-term assets | 149,738 | 138,074 | |||||||||
| — Investments in associates and Joint Ventures | 11,104 | 16,043 | |||||||||
| — Property, plant and equipment | 721,136 | 650,201 | |||||||||
| — Intangible assets and Goodwill | 6 | 292,612 | 298,638 | ||||||||
| — Deferred tax assets | 11,382 | 10,327 | |||||||||
| — Non-current tax assets | 88,800 | 70,293 | |||||||||
| Total non-current assets | 1,274,772 | 1,183,576 | |||||||||
| Total assets | 2,301,221 | 2,257,247 | |||||||||
| LIABILITIES AND STOCKHOLDERS’ EQUITY | |||||||||||
| Current liabilities: | |||||||||||
| — Current financial liabilities | 151,638 | 23,468 | |||||||||
| — Trade and other payables | 106,038 | 97,277 | |||||||||
| — Contract liabilities | 138,893 | 122,922 | |||||||||
| — Deferred income | 11,539 | 13,748 | |||||||||
| — Provisions | 48,257 | 54,410 | |||||||||
| — Current income tax liabilities | 10,480 | 8,987 | |||||||||
| — Other current liabilities | 21,263 | 16,894 | |||||||||
| Total current liabilities | 488,107 | 337,706 | |||||||||
| Non-current liabilities: | |||||||||||
| — Long-term financial liabilities | 382,509 | 490,293 | |||||||||
| — Deferred tax liabilities | 19,130 | 18,524 | |||||||||
| — Provisions | 16,641 | 16,427 | |||||||||
| — Contract liabilities | 219,654 | 206,136 | |||||||||
| — Other non-current liabilities | 893 | 977 | |||||||||
| Total non-current liabilities | 638,827 | 732,357 | |||||||||
| Stockholders’ equity: | |||||||||||
| —Share capital1) | 177,186 | 176,953 | |||||||||
| — Additional paid-in capital | 1,445,357 | 1,440,010 | |||||||||
| — Retained Earnings | (448,256 | ) | (429,779 | ) | |||||||
| Equity attributable to shareholders of Evotec SE | 1,174,287 | 1,187,184 | |||||||||
| — Non-controlling interest | - | - | |||||||||
| Total stockholders’ equity | 1,174,287 | 1,187,184 | |||||||||
| Total liabilities and stockholders’ equity | 2,301,221 | 2,257,247 | |||||||||
1) 177,185,744 and 176,952,653 shares issued and outstanding in 2023 and 2022, respectively
| 15 |
| HALF-YEAR REPORT 2023 |
|
Evotec SE and Subsidiaries
Consolidated interim income statement for the six months ended 30 June 2023 and 30 June 2022
| in k€ except share and per share data |
Note reference | Six months ended 30 June 2023 | Six months ended 30 June 2022 | Three months ended 30 June 2023 | Three months ended 30 June 2022 | |||||||||||||||
| Revenue | 5 | 383,835 | 336,875 | 170,279 | 172,203 | |||||||||||||||
| Cost of Revenue | (284,275 | ) | (273,686 | ) | (123,956 | ) | (141,308 | ) | ||||||||||||
| Gross profit | 99,560 | 63,189 | 46,324 | 30,895 | ||||||||||||||||
| — Research and development | (30,863 | ) | (36,838 | ) | (12,377 | ) | (18,725 | ) | ||||||||||||
| — Selling, General and Administrative | (88,192 | ) | (67,396 | ) | (45,609 | ) | (35,830 | ) | ||||||||||||
| — Other operating income (expense) | (4,278 | ) | 37,738 | (24,626 | ) | 19,890 | ||||||||||||||
| Operating income (loss) | (23,773 | ) | (3,307 | ) | (36,288 | ) | (3,770 | ) | ||||||||||||
| — Gain (loss) on investment in equity instruments revaluation | 5,567 | (97,718 | ) | 8,065 | (34,914 | ) | ||||||||||||||
| — Share of profit (loss) of associates and Joint ventures | (7,149 | ) | (7,628 | ) | (3,090 | ) | (3,528 | ) | ||||||||||||
| — Financial income | 5,678 | 2,021 | 2,826 | 1,232 | ||||||||||||||||
| — Financial expense | (5,038 | ) | (7,817 | ) | (2,540 | ) | (3,667 | ) | ||||||||||||
| — Other non-operating income (expense) | (1,937 | ) | 21,380 | 10,590 | 20,311 | |||||||||||||||
| Net Income (loss) before taxes | (26,652 | ) | (93,069 | ) | (20,437 | ) | (24,336 | ) | ||||||||||||
| — Income taxes | (2,175 | ) | (8,110 | ) | 5,508 | (3,601 | ) | |||||||||||||
| Net income (loss) | (28,828 | ) | (101,179 | ) | (14,929 | ) | (27,937 | ) | ||||||||||||
| Weighted average shares outstanding | 176,935,744 | 176,702,653 | 176,935,744 | 176,702,653 | ||||||||||||||||
| Net income per share (basic) | (0.16 | ) | (0.57 | ) | (0.08 | ) | (0.16 | ) | ||||||||||||
| Net income per share (diluted) | (0.16 | ) | (0.57 | ) | (0.08 | ) | (0.16 | ) | ||||||||||||
| 16 |
| HALF-YEAR REPORT 2023 |
|
Evotec SE and Subsidiaries
Consolidated interim statement of comprehensive income (loss) for the six months ended 30 June 2023 and 30 June 2022
| in k€ | Six months ended 30 June 2023 | Six months ended 30 June 2022 | Three months ended 30 June 2023 | Three months ended 30 June 2022 | ||||||||||||
| Net income (loss) | (28,828 | ) | (101,179 | ) | (14,929 | ) | (27,937 | ) | ||||||||
| Accumulated other comprehensive income | ||||||||||||||||
| Items which are not re-classified to the income statement | ||||||||||||||||
| — Remeasurement of defined benefit obligation | - | - | ||||||||||||||
| — Revaluation of investments | 1,861 | (4,112 | ) | 865 | (4,112 | ) | ||||||||||
| Items which may have to be re-classified to the income statement at a later date | ||||||||||||||||
| — Foreign currency translation | 4,264 | 10,364 | 5,475 | 7,244 | ||||||||||||
| — Revaluation and disposal of investments | 4,225 | (12,973 | ) | (4,216 | ) | (12,579 | ) | |||||||||
| Other comprehensive income (loss) | 10,350 | (6,721 | ) | 2,124 | (9,447 | ) | ||||||||||
| Total comprehensive income (loss) | (18,478 | ) | (107,900 | ) | (12,805 | ) | (37,384 | ) | ||||||||
| Total comprehensive income (loss) attributable to: | ||||||||||||||||
| — Shareholders of Evotec SE | (18,478 | ) | (107,900 | ) | (12,805 | ) | (37,384 | ) | ||||||||
| 17 |
| HALF-YEAR REPORT 2023 |
|
Evotec SE and Subsidiaries
Condensed consolidated interim statement of cash flows for the six months ended 30 June 2023 and 30 June 2022
| in k€ |
Note reference | Six months ended 30 June 2023 | Six months ended 30 June 2022 | |||||||||
| Cash flow from operating activities: | ||||||||||||
| — Net income (loss) | (28,828 | ) | (101,179 | ) | ||||||||
| — Adjustments to reconcile net income to net cash provided by operating activities | 59,695 | 163,178 | ||||||||||
| — Change in assets and liabilities | (36,442 | ) | 178,608 | |||||||||
| Net cash provided by operating activities | (5,575 | ) | 240,607 | |||||||||
| Cash flow from investing activities: | ||||||||||||
| — Purchase of current investments | (19,203 | ) | (161,289 | ) | ||||||||
| — Purchase of investments in associated companies and other long-term investments | (4,631 | ) | (59,413 | ) | ||||||||
| — Purchase of property, plant and equipment | (104,034 | ) | (81,371 | ) | ||||||||
| — Purchase of convertible loans | (4,579 | ) | (2,053 | ) | ||||||||
| — Proceeds from sale of current investments | 160,818 | 97,270 | ||||||||||
| — Dividends received | 424 | - | ||||||||||
| Net cash used in investing activities | 28,793 | (206,857 | ) | |||||||||
| Cash flow from financing activities: | ||||||||||||
| — Proceeds from capital increase | - | 355 | ||||||||||
| — Proceeds from option exercise | 233 | 345 | ||||||||||
| — Proceeds from loans | 20,807 | - | ||||||||||
| — Repayment lease obligation | (8,281 | ) | (10,967 | ) | ||||||||
| — Repayment of loans | (2,280 | ) | (35,538 | ) | ||||||||
| Net cash provided by (used in) financing activities | 10,480 | (45,805 | ) | |||||||||
| Net increase in cash and cash equivalents | 34,122 | (12,055 | ) | |||||||||
| — Exchange rate difference | 10,899 | 9,721 | ||||||||||
| — Cash and cash equivalents at beginning of year | 415,155 | 699,326 | ||||||||||
| Cash and cash equivalents at end of the period | 459,752 | 696,992 | ||||||||||
| 18 |
| HALF-YEAR REPORT 2023 |
|
Evotec SE and Subsidiaries
Interim consolidated statement of changes in stockholders’ equity of the six months ended 30 June 2023 and 30 June 2022
| Share capital | Income and expense recognised in other comprehensive income | |||||||||||||||||||||||
| in k€ except share data | Shares | Amount | Additional paid-in capital | Foreign currency translation | Re- valuation | Accumulated deficit | Stockholders’ attributable to the Shareholders of Evotec SE | Total stockholders’ | ||||||||||||||||
| Balance at 1 January 2022 | 176,608,195 | 176,608 | 1,430,136 | (15,691 | ) | 3,053 | (216,421 | ) | 1,377,685 | 1,377,685 | ||||||||||||||
| — Capital Increase | - | |||||||||||||||||||||||
| — Exercised stock options | 344,458 | 345 | - | - | - | 345 | 345 | |||||||||||||||||
| — Stock option plan | - | 4,810 | - | - | - | 4,810 | 4,810 | |||||||||||||||||
| — Transaction costs | - | - | 355 | - | - | - | 355 | 355 | ||||||||||||||||
— Deferred and current tax on future deductible expenses | - | - | - | - | - | 244 | 244 | 244 | ||||||||||||||||
| Other comprehensive income | - | - | - | 10,364 | (17,085 | ) | - | (6,721 | ) | (6,721 | ) | |||||||||||||
Net income (loss) for the period | - | - | - | - | - | (101,179 | ) | (101,179 | ) | (101,179 | ) | |||||||||||||
| Total comprehensive income (loss) | - | - | - | 10,364 | (17,085 | ) | (101,179 | ) | (107,900 | ) | (107,900 | ) | ||||||||||||
| Balance at 30 June 2022 | 176,952,653 | 176,953 | 1,435,301 | (5,327 | ) | (14,032 | ) | (317,356 | ) | 1,275,539 | 1,275,539 | |||||||||||||
| Balance at 1 January 2023 | 176,952,653 | 176,953 | 1,440,010 | (16,289 | ) | (21,113 | ) | (392,377 | ) | 1,187,184 | 1,187,184 | |||||||||||||
| — Capital Increase | - | - | - | - | - | - | - | - | ||||||||||||||||
| — Exercised stock options | 233,091 | 233 | (77 | ) | - | - | - | 156 | 156 | |||||||||||||||
| — Stock option plan | - | - | 5,425 | - | - | - | 5,425 | 5,425 | ||||||||||||||||
| — Transaction costs | - | - | - | - | - | - | - | - | ||||||||||||||||
| — Deferred and current tax on future deductible expenses | - | - | - | - | - | - | - | - | ||||||||||||||||
| Other comprehensive income | - | - | - | 4,264 | 6,086 | - | 10,350 | 10,350 | ||||||||||||||||
| Net income (loss) for the period | - | - | - | - | - | (28,828 | ) | (28,828 | ) | (28,828 | ) | |||||||||||||
| Total comprehensive income (loss) | - | - | - | 4,264 | 6,086 | (28,828 | ) | (18,478 | ) | (18,478 | ) | |||||||||||||
| Balance at 30 June 2023 | 177,185,744 | 177,186 | 1,445,358 | (12,025 | ) | (15,027 | ) | (421,205 | ) | 1,174,287 | 1,174,287 | |||||||||||||
| 19 |
| HALF-YEAR REPORT 2023 |
|
Notes to the unaudited Interim condensed consolidated financial statements
1. Corporate information
| 4 | Effective April 2023, Laetitia Rouxel joins Management Board as Chief Financial Officer |
| 4 | Remediation of cyber-attack discovered on 06 April 2023 proceeding to plan |
| 4 | Unsecured loan facility of m€ 150 granted by European Investment Bank to support R&D activities, equity investments and the construction of the new J.POD Toulouse, France (EU) production facility |
| 4 | Relocation of Cyprotex US, LLC from Watertown, MA to a new facility in Framingham, MA completed |
| 4 | Annual General Meeting 2023: Approval of all proposed agenda items |
2. Basis of presentation
The interim condensed consolidated financial statements for the six months ended June 30, 2023, have been prepared in accordance with IAS 34 Interim Financial Reporting as endorsed in the European Union. The Group has prepared the interim condensed financial statements on the basis that it will continue to operate as a going concern. The Group considers that there are no material uncertainties that may cast significant doubt over this assumption. The interim condensed consolidated financial statements do not include all the information and disclosures required in the annual financial statements and should be read in conjunction with the Group’s consolidated financial statements and accompanying notes for the year ended 31 December 2022.
All majority-owned subsidiaries of the Company are included in the interim condensed consolidated financial statements and intercompany transactions have been eliminated in consolidation. The interim condensed financial statements are presented in Euros, due to rounding, amounts may not add up to totals provided.
3. New standards, interpretations and amendments adopted by the Group
The accounting policies adopted in the preparation of the interim condensed consolidated financial statements are consistent with those followed in the preparation of the Group’s annual consolidated financial statement for the year ended 31 December 2022, except for the adoption of new standards effective as of 1 January 2023. The Group has not early adopted any standard, interpretation or amendment that has been issued but is not yet effective.
Several amendments apply for the first time in 2023, but do not have a significant impact on the interim condensed consolidated financial statements of the Group:
| 4 | IFRS 17 Insurance Contracts (including Amendments to IFRS 17 issued in June 2020 and Amendment to IFRS 17 - Initial Application of IFRS 17 and IFRS 9 — Comparative Information issued in December 2021) |
| 4 | Amendments to IAS 12 – Deferred Tax related to Assets and Liabilities arising from a Single Transaction |
| 4 | Amendments to IAS 1 and IFRS Practice Statement 2 – Disclosure of Accounting Policies |
| 4 | Amendments to IAS 8 – Definition of Accounting Estimates |
4. Segment information
EVT Execute and EVT Innovate have been identified by the Management Board as operating segments. The segments’ key performance indicators are used monthly by the Management Board to evaluate the resource allocation as well as Evotec’s performance. Intersegment revenues are valued with a price comparable to other third-party revenues. The evaluation of each operating segment by the management is performed based on revenues and adjusted EBITDA. For the EVT Innovate segment, R&D expenses are another key performance indicator.
| 20 |
| HALF-YEAR REPORT 2023 |
|
The segment information for the first six months of 2023 is as follows:
| In k€ | EVT Execute | EVT Innovate | Intersegment eliminations |
Evotec Group | ||||||||||||
| Revenue | 254,150 | 129,685 | – | 383,835 | ||||||||||||
| Intersegment revenues | 102,445 | – | (102,445 | ) | – | |||||||||||
| Cost of Revenue | (291,383 | ) | (89,538 | ) | 96,646 | (284,275 | ) | |||||||||
| Gross profit | 65,213 | 40,147 | (5,800 | ) | 99,560 | |||||||||||
| — Research and development | (2,356 | ) | (34,306 | ) | 5,800 | (30,863 | ) | |||||||||
| — Selling, general and administrative | (67,338 | ) | (20,855 | ) | – | (88,192 | ) | |||||||||
| — Other operating income (expense) | (20,227 | ) | 15,949 | – | (4,278 | ) | ||||||||||
| Operating income (loss) | (24,708 | ) | 934 | – | (23,773 | ) | ||||||||||
| — Gain (loss) on investment in equity instruments re-evaluation | – | – | – | 5,567 | ||||||||||||
| — Share of profit (loss) of associates and Joint ventures | – | – | – | (7,149 | ) | |||||||||||
| — Financial income | – | – | – | 5,678 | ||||||||||||
| — Financial expense | – | – | – | (5,038 | ) | |||||||||||
| — Other non-operating income (expense) | – | – | – | (1,937 | ) | |||||||||||
| Net Income (loss) before taxes | – | – | – | (26,652 | ) | |||||||||||
| — Income taxes | – | – | – | (2,175 | ) | |||||||||||
| Net income (loss) | – | – | – | (28,828 | ) | |||||||||||
The EBITDA adjusted for the first six months of 2023 is derived from Net operating income (loss) as follows:
| in k€ | EVT Execute | EVT Innovate | Evotec Group | |||||||||
| Net operating income (loss) | (24,708 | ) | 934 | (23,773 | ) | |||||||
| plus, depreciation of tangible assets | 38,293 | 2,558 | 40,851 | |||||||||
| plus, amortisation of intangible assets | 3,868 | 34 | 3,902 | |||||||||
| plus, impairment of intangible assets | 5,119 | – | 5,119 | |||||||||
| less, change in contingent consideration (earn-out) | – | – | – | |||||||||
| EBITDA Adjusted | 22,572 | 3,526 | 26,099 | |||||||||
| 21 |
| HALF-YEAR REPORT 2023 |
|
The segment information for the first six months of 2022 is as follows:
| In k€ | EVT Execute | EVT Innovate | Intersegment eliminations | Evotec Group | ||||||||||||
| Revenue | 258,847 | 78,028 | – | 336,875 | ||||||||||||
| Intersegment revenues | 92,142 | 0 | (92,142 | ) | 0 | |||||||||||
| Cost of Revenue | (289,752 | ) | (68,324 | ) | 84,391 | (273,685 | ) | |||||||||
| Gross profit | 61,237 | 9,704 | (7,751 | ) | 63,190 | |||||||||||
| — Research and development | (2,561 | ) | (42,028 | ) | 7,751 | (36,838 | ) | |||||||||
| — Selling, general and administrative | (54,139 | ) | (13,258 | ) | – | (67,397 | ) | |||||||||
| — Other operating income (expense) | 15,573 | 22,165 | – | 37,738 | ||||||||||||
| Operating income (loss) | 20,110 | (23,417 | ) | – | (3,307 | ) | ||||||||||
| — Gain (loss) on investment in equity instruments re-evaluation | – | – | – | (97,718 | ) | |||||||||||
| — Share of profit (loss) of associates and Joint ventures | – | – | – | (7,628 | ) | |||||||||||
| — Financial income | – | – | – | 2,021 | ||||||||||||
| — Financial expense | – | – | – | (7,817 | ) | |||||||||||
| — Other non-operating income (expense) | – | – | – | 21,380 | ||||||||||||
| Net Income (loss) before taxes | – | – | – | (93,069 | ) | |||||||||||
| — Income taxes | – | – | – | (8,110 | ) | |||||||||||
| Net income (loss) | – | – | – | (101,179 | ) | |||||||||||
The EBITDA adjusted for the first six months 2022 is derived from Net operating income (loss) as follows:
| in k€ | EVT Execute | EVT Innovate | Evotec Group | |||||||||
| Net operating income (loss) | 20,110 | (23,417 | ) | (3,307 | ) | |||||||
| plus, depreciation of tangible assets | 30,554 | 2,279 | 32,833 | |||||||||
| plus, amortisation of intangible assets | 4,800 | 85 | 4,885 | |||||||||
| plus, impairment of intangible assets | – | 683 | 683 | |||||||||
| less change in contingent consideration (earn-out) | 775 | – | 775 | |||||||||
| EBITDA Adjusted | 54,689 | (21,053 | ) | 33,626 | ||||||||
| 22 |
| HALF-YEAR REPORT 2023 |
|
5. Revenues
The following schedule shows a breakdown of the revenue Evotec recognised for the first six months of 2023:
| 6 months | ||||||||||||
| in k€ | EVT Execute | EVT Innovate |
Total | |||||||||
| Revenues | ||||||||||||
| Service fees and FTE-based research payments | 207,641 | 115,430 | 359,971 | |||||||||
| Material Recharges | 14,957 | 2,774 | 17,731 | |||||||||
| Compound access fees | 1,209 | 665 | 1,875 | |||||||||
| Milestone fees | 38,222 | 2,832 | 4,154 | |||||||||
| Licences | 0 | 105 | 105 | |||||||||
| Total | 262,030 | 121,805 | 383,835 | |||||||||
| Timing of revenue recognition | ||||||||||||
| At a certain time | 53,179 | 5,605 | 21,884 | |||||||||
| Over a period of time | 208,851 | 116,200 | 361,951 | |||||||||
| Total | 262,030 | 121,805 | 383,835 | |||||||||
| Revenues by region | ||||||||||||
| USA | 123,320 | 96,055 | 219,375 | |||||||||
| Germany | 6,718 | 11,463 | 18,181 | |||||||||
| France | 13,147 | 2,902 | 16,049 | |||||||||
| United Kingdom | 37,096 | 3,036 | 40,132 | |||||||||
| Rest of the World | 81,749 | 8,349 | 90,098 | |||||||||
| Total | 262,030 | 121,805 | 383,835 | |||||||||
Included in the revenues are revenues from contribution in the amount of k€ 4,539 (H1 2022: k€ 5,269).
| 23 |
| HALF-YEAR REPORT 2023 |
|
The following schedule shows a breakdown of the revenue Evotec recognised for the first six months of 2022:
| 6 months | ||||||||||||
| in k€ | EVT Execute | EVT Innovate |
Total | |||||||||
| Revenues | ||||||||||||
| Service fees and FTE-based research payments | 236,717 | 74,799 | 311,516 | |||||||||
| Material Recharges | 18,136 | 2,491 | 20,627 | |||||||||
| Compound access fees | 230 | 444 | 674 | |||||||||
| Milestone fees | 3,764 | – | 3,764 | |||||||||
| Licence | – | 294 | 294 | |||||||||
| Total | 258,847 | 78,028 | 336,875 | |||||||||
| Timing of revenue recognition | ||||||||||||
| At a certain time | 21,900 | 2,491 | 24,391 | |||||||||
| Over a period of time | 236,947 | 75,537 | 312,484 | |||||||||
| Total | 258,847 | 78,028 | 336,875 | |||||||||
| Revenues by region | ||||||||||||
| USA | 130,561 | 51,490 | 182,051 | |||||||||
| Germany | 16,946 | 12,372 | 29,318 | |||||||||
| France | 6,802 | 6,024 | 12,826 | |||||||||
| United Kingdom | 57,420 | 4,278 | 61,698 | |||||||||
| Rest of the World | 47,118 | 3,864 | 50,982 | |||||||||
| Total | 258,847 | 78,028 | 336,875 | |||||||||
6. Goodwill and other Intangible asset
Goodwill:
Goodwill amounted to k€ 277,490 as of June 30, 2023, versus k€ 274,819 as of December 31, 2022. The movement during the period was due to the impact of changes in exchange rates.
The Group performs its annual impairment test over goodwill in the fourth quarter of the fiscal year and when circumstances indicate that the carrying value may be impaired. The Group’s impairment test for goodwill is based on value-in-use calculations.
The key assumptions used to determine the recoverable amount for the different cash generating units were disclosed in the Group’s consolidated financial statements for the year ended 31 December 2022.
Based on the analysis of the business performance as of and for the six months ended 30 June 2023, the Group has not identified any impairment trigger
| 24 |
| HALF-YEAR REPORT 2023 |
|
Long lived intangible assets:
The Group has also reviewed its finite lived intangible assets for impairment whenever triggering events or changes in circumstances indicate that carrying amount value may not be recoverable. This review led to the recognition of an impairment loss of k€ 5,119 linked to research and development projects.
7. Equity investments
In the six months ended 30 June 2023, Evotec participated in a capital contribution of a company accounted for using the equity method. The add-on investment amounts to k€ 935.
| in k€ | 2023 | 2022 | ||||||
| Balance at 1 Jan | 16,043 | 13,068 | ||||||
| Additions | 935 | 7,185 | ||||||
| Pro rata net result | (5,451 | ) | (7,750 | ) | ||||
| Dividends received | (423 | ) | – | |||||
| Balance at 30 June | 11,104 | 12,503 | ||||||
8. Borrowings
External borrowings increased to k€ 534,147 (2022 k€ 513,761) mainly to support networking increase and capex investments.
9. Changes in shareholder’s equity and potentially dilutive instruments
In the six months ended 30 June 2023 227,555 of the 806,500 total granted Share Performance Awards were given to the members of the Management Board. During the first half of 2023, 233,083 shares were issued through the exercise of Share Performance Awards which increased stockholder’s equity.
On February 14, 2023, Evotec’s Management Board approved the U.S. Restricted Share Unit Plan (“U.S. RSU Plan”). The U.S. RSU Plan became effective May 31, 2023. The U.S. RSU Plan provides for the grant of restricted share units, which payment may be granted in the form of shares, American depositary shares, each representing one-half of one Evotec SE ordinary share (ADSs), or cash amounts as the Management Board determines to be consistent with best interests of the Company, Evotec and its shareholders and in accordance with the purpose of the U.S. RSU Plan. The number of restricted share units granted in the six months ended 30 June 2023 totalled 603,161.
10. Financial risk management
The Group’s activities expose it to a variety of financial risks such as currency risks, interest rate risks, credit risks and liquidity risks. The interim condensed consolidated financial statements do not include all financial risk management information and disclosures required. Additional disclosures can be found in the “Risks and uncertainties” section of the management report as of and for the six months ended 30 June 2023. They should be read in conjunction with the Group’s annual management report as of and for the year ended 31 December 2022. The fair values of financial assets and liabilities, together with the carrying amounts shown in the balance sheet as of 30 June 2023 and 31 December 2022 are as follows:
There have not been significant changes to the risk management approach or to risk management policies since 31 December 2022.
| 25 |
| HALF-YEAR REPORT 2023 |
|
Fair value of financial assets and liabilities:
The Group classifies its fair value measurements using a fair value hierarchy that reflects the significance of the inputs used in making the measurements, The fair value hierarchy has the following levels:
▪ Level 1 – Quoted (unadjusted) prices in active markets for identical assets or liabilities
▪ Level 2 – Observable inputs other than quoted prices included within Level 1 that are observable for the assets or liabilities, either directly (i.e., such as prices) or indirectly (i.e.., derived from prices)
▪ Level 3 – Inputs for the assets or liabilities that are not based on observable market data
The carrying amounts and fair values of the financial assets and liabilities as of 30 June 2023 are as follows:
| In k€ | Carrying amount | Fair value |
Level 1 |
Level 2 |
Level 3 | |||||||||||||||
| Financial assets | ||||||||||||||||||||
| Equity instruments | 130,437 | 130,437 | 76,466 | - | 53,971 | |||||||||||||||
| Financial assets carried at FVTPL | 130,437 | 130,437 | 76,466 | - | 53,971 | |||||||||||||||
| Equity instruments | 10,426 | 10,426 | 10,426 | |||||||||||||||||
| Current financial assets | 161,094 | 161,094 | 161,094 | |||||||||||||||||
| Financial assets carried at FVOCI | 171,519 | 171,519 | 171,519 | |||||||||||||||||
| Derivative financial instruments | 9,086 | 9,086 | 9,086 | |||||||||||||||||
| Financial assets carried at fair value | 9,086 | 9,086 | 9,086 | |||||||||||||||||
| Cash and cash equivalents | 459,752 | 459,752 | ||||||||||||||||||
| Receivables and Contract Assets | 226,710 | 226,710 | ||||||||||||||||||
| Other financial assets | 10,556 | 10,556 | ||||||||||||||||||
| Carried at (amortized) costs | 697,017 | 697,017 | ||||||||||||||||||
| Total financial assets | 1,008,060 | 1,008,060 | 247,986 | 9,086 | 53,971 | |||||||||||||||
| In k€ | Carrying amount | Fair value | Level 1 | Level 2 | Level 3 | |||||||||||||||
| Financial liabilities | ||||||||||||||||||||
| Derivative financial instruments | (2,028 | ) | (2,028 | ) | (2,028 | ) | ||||||||||||||
| Financial liabilities carried at fair value | (2,028 | ) | (2,028 | ) | (2,028 | ) | ||||||||||||||
| Payables and Contract Liabilities | (467,210 | ) | (467,210 | ) | ||||||||||||||||
| Loans and Borrowings | (348,377 | ) | (308,875 | ) | ||||||||||||||||
| Other liabilities | (184,635 | ) | (184,635 | ) | ||||||||||||||||
| Carried at (amortized) costs | (1,000,222 | ) | (960,719 | ) | ||||||||||||||||
| Total financial assets | (1,002,249 | ) | (962,747 | ) | (2,028 | ) | ||||||||||||||
| 26 |
| HALF-YEAR REPORT 2023 |
|
The carrying amounts and fair values of the financial assets and liabilities as of 31 December 2022 are as follows:
| In k€ | Carrying amount |
Fair value |
Level 1 | Level 2 | Level 3 | |||||||||||||||
| Financial assets | ||||||||||||||||||||
| Equity instruments | 122,477 | 122,477 | 70,133 | - | 52,344 | |||||||||||||||
| Financial assets carried at FVTPL | 122,477 | 122,477 | 70,133 | - | 52,344 | |||||||||||||||
| Equity instruments | 8,565 | 8,565 | 8,565 | |||||||||||||||||
| Current financial assets | 303,334 | 303,334 | 303,334 | |||||||||||||||||
| Financial assets carried at FVOCI | 311,899 | 311,899 | 311,899 | |||||||||||||||||
| Derivative financial instruments | 8,215 | 8,215 | 8,215 | |||||||||||||||||
| Financial assets carried at fair value | 8,215 | 8,215 | 8,215 | |||||||||||||||||
| Cash and cash equivalents | 415,155 | 415,155 | ||||||||||||||||||
| Receivables and Contract Assets | 199,169 | 199,169 | ||||||||||||||||||
| Other financial assets | 6,526 | 6,526 | ||||||||||||||||||
| Carried at (amortized) costs | 620,850 | 620,850 | ||||||||||||||||||
| Total financial assets | 1,063,441 | 1,063,441 | 382,032 | 8,215 | 52,344 | |||||||||||||||
| In k€ | Carrying amount |
Fair value |
Level 1 |
Level 2 |
Level 3 | |||||||||||||||
| Financial liabilities | ||||||||||||||||||||
| Contingent consideration | (306 | ) | (306 | ) | (306 | ) | ||||||||||||||
| Financial liabilities carried at FVTPL | (306 | ) | (306 | ) | (306 | ) | ||||||||||||||
| Derivative financial instruments | (7,358 | ) | (7,358 | ) | (7,358 | ) | ||||||||||||||
| Financial liabilities carried at fair value | (7,358 | ) | (7,358 | ) | (7,358 | ) | ||||||||||||||
| Payables and Contract Liabilities | (426,335 | ) | (426,335 | ) | ||||||||||||||||
| Loans and Borrowings | (329,851 | ) | (308,130 | ) | ||||||||||||||||
| Other liabilities | (177,800 | ) | (177,800 | ) | ||||||||||||||||
| Carried at (amortized) costs | (933,986 | ) | (912,265 | ) | ||||||||||||||||
| Total financial assets | (941,650 | ) | (919,929 | ) | (7,358 | ) | (306 | ) | ||||||||||||
| 27 |
| HALF-YEAR REPORT 2023 |
|
There were no changes in the Group’s valuation process, valuation techniques and types of inputs used in the fair value measurements during the period.
There were no transfers between levels during the six-month period ended 30 June 2023.
Apart from borrowings, the Group considers the carrying value of the financial instruments to approximate their fair value.
Currency risk:
Foreign exchange exposure also arises because of inter-company loans and deposits. When the lending company enters such arrangements, the financing is generally provided in the functional currency of the subsidiary entity. When such loans would be part of the net investment in the subsidiary, net investment hedging would be applied. Translation exposure of foreign-currency equity invested in consolidated entities is generally not hedged.
11. Income taxes
Income tax expense amounted to k€ 2,175 for the six months ended 30 June 2023 compared to k€ 6,110 for the six months ended 30 June 2022. The lower income tax expense during the six months ended 30 June 2023 versus the prior year is mainly due to decreased budgeted tax rates for France and Germany and decreased profits in Italy.
12. Related party transactions
Except for the transactions described in Evotec’s Annual Report 2022 Note (32) on page 125, no other material transactions with related parties were entered into in the first six months of 2023.
13. Subsequent events
On 1, July 2023, the Group acquired the remaining 50% of the share in its Joint Venture Nephtera for a total consideration of k€ 1,650.
| 28 |
| HALF-YEAR REPORT 2023 |
|
III. RESPONSIBILITY STATEMENT
To the best of our knowledge and in accordance with the applicable reporting principles for interim financial reporting, the Interim Condensed Consolidated Financial Statements give a true and fair view of the assets, liabilities, financial position and financial results of the Group, and the Group Interim Management Report includes a fair review of the development and performance of the business and the position of the Group, together with a description of the principal opportunities and risks associated with the expected development of the Group.
29 August 2023
| Dr Werner Lanthaler | Dr Cord Dohrmann | Dr Matthias Evers | ||
| Chief Executive Officer | Chief Scientific Officer | Chief Business Officer | ||
| Dr Craig Johnstone | Laetitia Rouxel | |||
| Chief Operating Officer | Chief Financial Officer |
| 29 |
| HALF-YEAR REPORT 2023 |
|
Financial calendar 2023
| 8 November 2023 | Quarterly Statement 9M 2023 | |
| 15 November 2023 | Capital Markets Day (Hamburg) |
| 30 |