Exhibit 99.2

Subordinated Notes Offering Investor Presentation July 8, 2020
2 Disclaimer The information included in this presentation is confidential and may not be reproduced or redistributed, passed on or divulg ed, directly or indirectly, to any other person. MidWest One Financial Group, Inc. (the “Company” or “MidWest One ”) reserves the right to request the return of this presentation at any time. FORWARD - LOOKING STATEMENTS This presentation contains certain “forward - looking statements” within the meaning of such term in the Private Securities Litiga tion Reform Act of 1995. We and our representatives may, from time to time, make written or oral statements that are “forward - looking” and provide information other than historical information. These statements involve known and unknown risks, uncertainties and other factors that may cause actual results to be materially di ffe rent from any results, levels of activity, performance or achievements expressed or implied by any forward looking statement. These factors include, among other things, th e factors listed below. Forward - looking statements, which may be based upon beliefs, expectations and assumptions of our management and on information curren tly available to management, are generally identifiable by the use of words such as “believe,” “expect,” “anticipate,” “should,” “could,” “would,” “plans,” “g oal s,” “intend,” “project,” “estimate,” “forecast,” “may” or similar expressions. These forward looking statements are subject to certain risks and uncertainties tha t c ould cause actual results to differ materially from those expressed in, or implied by, these statements. Readers are cautioned not to place undue reliance on any such forwa rd - looking statements, which speak only as of the date made. Additionally, we undertake no obligation to update any statement in light of new information or future e ven ts, except as required under federal securities law. Our ability to predict results or the actual effect of future plans or strategies is inherently uncertain. Factors that could ha ve an impact on our ability to achieve operating results, growth plan goals and future prospects include, but are not limited to, the following: (1) effects of the COVID - 19 pand emic, including its potential effects on the economic environment, our customers and our operations, as well as any changes to federal, state, or local government laws, r egu lations, or orders in connection with the pandemic; (2) credit quality deterioration or pronounced and sustained reduction in real estate market values causing an inc rease in the allowance for credit losses, an increase in the credit loss expense, and a reduction in net earnings; (3) the effects of interest rates, including on our net income and the value of our securities portfolio; (4) changes in the economic environment, competition, or other factors that may affect our ability to acquire loan s o r influence the anticipated growth rate of loans and deposits and the quality of the loan portfolio and loan and deposit pricing; (5) fluctuations in the value of our i nve stment securities; (6) governmental monetary and fiscal policies; (7) changes in benchmark interest rates used to price loans and deposits, including the expected elimina tio n of LIBOR; (8) legislative and regulatory changes, including changes in banking, securities, trade, and tax laws and regulations and their application by our regulator s; (9) the ability to attract and retain key executives and employees experienced in banking and financial services; (10) the sufficiency of the allowance for credit loss es to absorb the amount of actual losses inherent in our existing loan portfolio; (11) our ability to adapt successfully to technological changes to compete effective ly in the marketplace; (12) credit risks and risks from concentrations (by geographic area and by industry) within our loan portfolio; (13) the effects of competition from othe r c ommercial banks, thrifts, mortgage banking firms, consumer finance companies, credit unions, securities brokerage firms, insurance companies, money market and o the r mutual funds, financial technology companies, and other financial institutions operating in our markets or elsewhere or providing similar services; (14) the fai lur e of assumptions underlying the establishment of allowances for credit losses and estimation of values of collateral and various financial assets and liabili tie s; (15) the risks of mergers, including, without limitation, the related time and costs of implementing such transactions, integrating operations as part of these transaction s a nd possible failures to achieve expected gains, revenue growth and/or expense savings from such transactions; (16) volatility of rate - sensitive deposits; (17) operationa l risks, including data processing system failures or fraud; (18) asset/liability matching risks and liquidity risks; (19) the costs, effects and outcomes of existing or future litigation; (20) changes in general economic, political, or industry conditions, nationally, internationally or in the communities in which we conduct business; (21 ) changes in accounting policies and practices, as may be adopted by state and federal regulatory agencies and the Financial Accounting Standards Board, such as t he implementation of the current expected credit losses (CECL) standard; (22) war or terrorist activities, widespread disease or pandemic, or other adverse external ev ent s, which may cause deterioration in the economy or cause instability in credit markets; (23) the effects of cyber - attacks; (24) the imposition of tariffs or other domes tic or international governmental policies impacting the value of the agricultural or other products of our borrowers; and (25) other risk factors detailed from time to ti me in Securities and Exchange Commission (“SEC”) filings made by the Company .

3 Disclaimer NOTICE TO RECIPIENTS This presentation has been prepared by the Company solely for informational purposes based on information regarding its business, ope rations and financial condition, as well as information from public sources. This presentation has been prepared to assist interested parties in making their own ev aluation of the Company and does not purport to contain all of the information that may be relevant or material to an interested party’s investment decision. In a ll cases, interested parties should conduct their own investigation and analysis of the Company, the information set forth in this presentation and other information provided by or on behalf of the Company. No representation or warranty as to the accuracy, completeness, or fairness of such information is being made by the Company or any other person, and neither the Company nor any other person shall have any liability for any information contained herein, or for any omissions from this pr ese ntation or any other written or oral communications transmitted to the recipient by the Company or any other person in the course of the recipient’s evaluation. This presentation does not constitute an offer to sell, or a solicitation of an offer to buy, any securities of the Company b y a ny person in any jurisdiction in which it is unlawful for such person to make such an offering or solicitation. Neither the SEC nor any other regulatory body has approved or disapproved of the securities of the Company or passed upon the ac curacy or adequacy of this presentation. Any representation to the contrary is a criminal offense. Securities of the Company are not deposits or insured or guaranteed by the FDIC or any other governmental agency. The offer to invest in the securities of the Company and the sale thereof have not been registered under the Securities Act o f 1 933, as amended (the “1933 Act”), nor under any state securities act. The securities are being offered and sold in reliance on exemptions from the registration re qui rements of such acts. Therefore, the securities may not be sold or transferred absent an exemption from registration under the 1933 Act and under applicable state se curities law. The Company reserves the right to withdraw or amend this offering for any reason and to reject any subscription in whole or in part. Except where information is provided as of a specified date, this presentation speaks as of the date hereof. The delivery of thi s presentation shall not, under any circumstances, create any implication that there has been no change in the affairs of the Company after the date hereof. Market data and other statistical data used in this presentation has been obtained from independent industry sources and publ ica tions as well as from research reports prepared for other purposes. Industry publications and surveys and forecasts generally state that the information contained t her ein has been obtained from sources believed to be reliable. The Company has not independently verified the data obtained from these sources. Forward - looking inform ation obtained from these sources is subject to the same qualifications and the additional uncertainties regarding the other forward - looking statements in this prese ntation. This presentation includes certain measures that are not calculated under United States generally accepted accounting princip les (“GAAP”). These non - GAAP financial measures should be considered only as supplemental to, and not superior to, financial measures prepared in accordance with GA AP. Please refer to the appendix of this presentation for a reconciliation of the non - GAAP financial measures included in this presentation to the most directly comparab le financial measures prepared in accordance with GAAP.
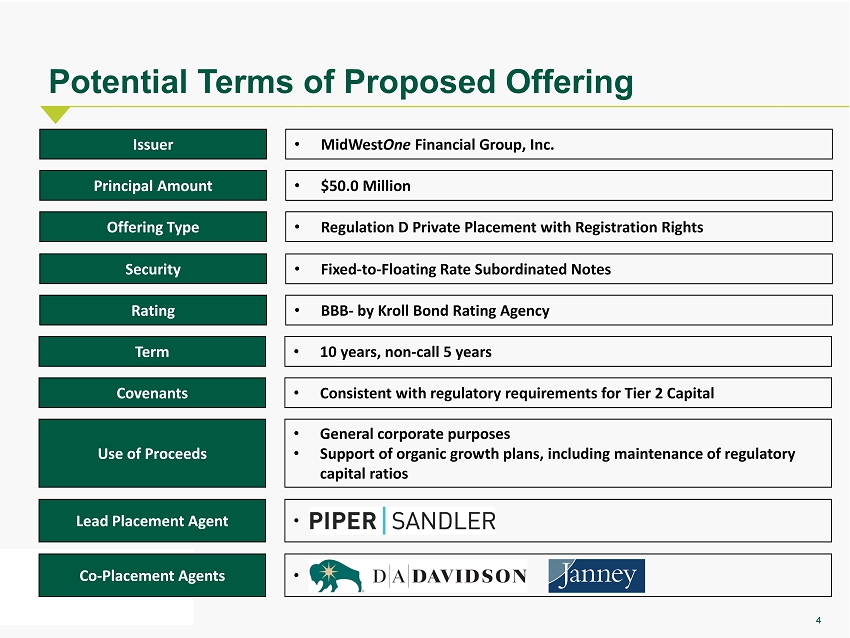
4 Potential Terms of Proposed Offering Issuer • MidWest One Financial Group, Inc. Principal Amount • $50.0 Million Offering Type • Regulation D Private Placement with Registration Rights Security • Fixed - to - Floating Rate Subordinated Notes Rating • BBB - by Kroll Bond Rating Agency Term • 10 years, non - call 5 years Lead Placement Agent • Covenants • Consistent with regulatory requirements for Tier 2 Capital Use of Proceeds • General corporate purposes • Support of organic growth plans, including maintenance of regulatory capital ratios Co - Placement Agents •
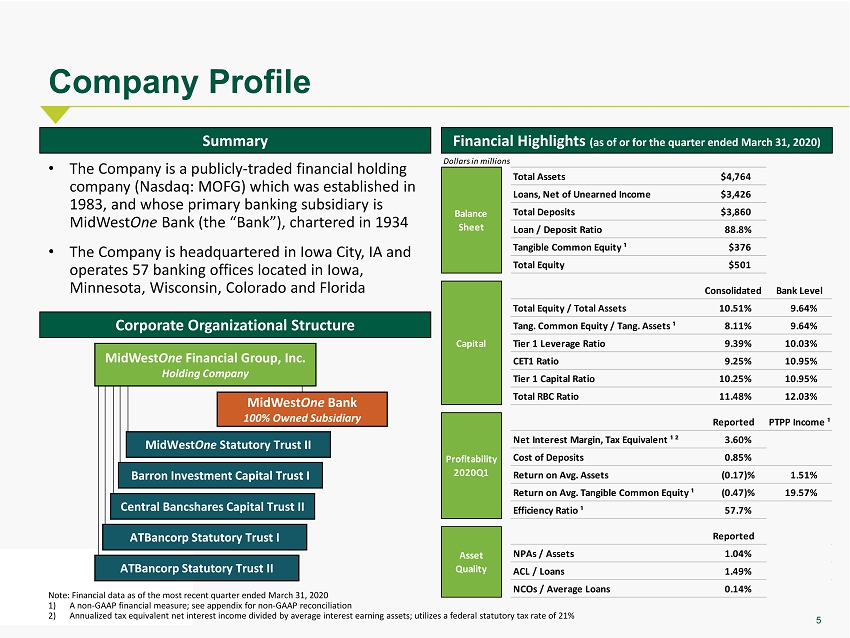
5 Company Profile • The Company is a publicly - traded financial holding company (Nasdaq: MOFG) which was established in 1983, and whose primary banking subsidiary is MidWest One Bank (the “Bank”), chartered in 1934 • The Company is headquartered in Iowa City, IA and operates 57 banking offices located in Iowa, Minnesota, Wisconsin, Colorado and Florida Summary Corporate Organizational Structure MidWest One Bank 100% Owned Subsidiary Note: Financial data as of the most recent quarter ended March 31, 2020 1) A non - GAAP financial measure; see appendix for non - GAAP reconciliation 2) Annualized tax equivalent net interest income divided by average interest earning assets; utilizes a federal statutory tax ra te of 21 % Financial Highlights (as of or for the quarter ended March 31, 2020) MidWest One Statutory Trust II Barron Investment Capital Trust I Central Bancshares Capital Trust II ATBancorp Statutory Trust I ATBancorp Statutory Trust II MidWest One Financial Group, Inc. Holding Company Dollars in millions Total Assets $4,764 Loans, Net of Unearned Income $3,426 Total Deposits $3,860 Loan / Deposit Ratio 88.8% Tangible Common Equity ¹ $376 Total Equity $501 Consolidated Bank Level Total Equity / Total Assets 10.51% 9.64% Tang. Common Equity / Tang. Assets ¹ 8.11% 9.64% Tier 1 Leverage Ratio 9.39% 10.03% CET1 Ratio 9.25% 10.95% Tier 1 Capital Ratio 10.25% 10.95% Total RBC Ratio 11.48% 12.03% Reported PTPP Income ¹ Net Interest Margin, Tax Equivalent ¹ ² 3.60% Cost of Deposits 0.85% Return on Avg. Assets (0.17)% 1.51% Return on Avg. Tangible Common Equity ¹ (0.47)% 19.57% Efficiency Ratio ¹ 57.7% Reported NPAs / Assets 1.04% ACL / Loans 1.49% NCOs / Average Loans 0.14% Balance Sheet Capital Profitability 2020Q1 Asset Quality
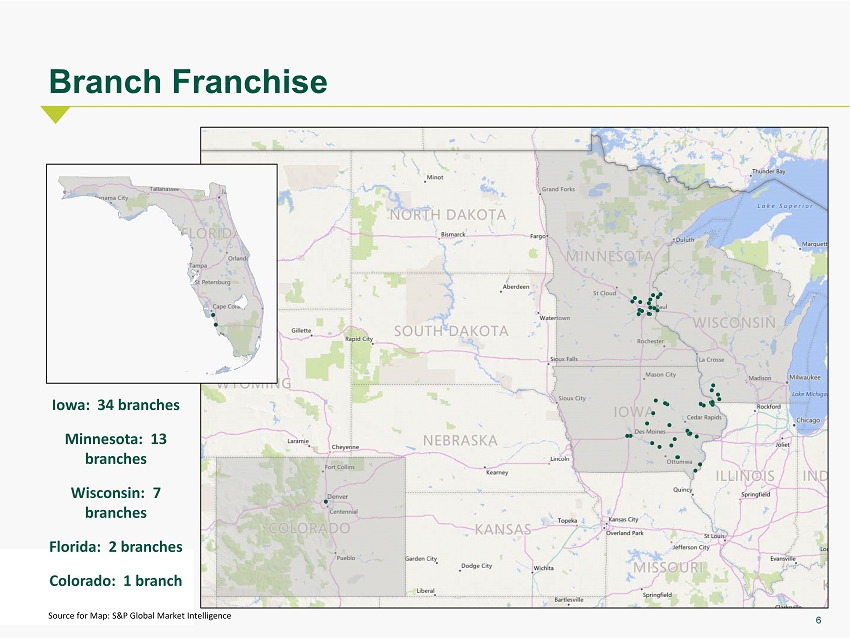
6 Source for Map: S&P Global Market Intelligence Branch Franchise Iowa: 34 branches Minnesota: 13 branches Wisconsin: 7 branches Florida: 2 branches Colorado: 1 branch
7 • Our operating strategy is based upon a community banking model of delivering a comprehensive suite of financial products and services while following five operating principles: • Management believes the depth and breadth of MidWest One ’s products and services, coupled with the personal and professional delivery of these financial services, provides an appealing alternative to our competitors, larger and smaller alike Corporate Strategy 1) Take good care of our customers 2) Hire and retain excellent employees 3) Always conduct yourself with the utmost integrity 4) Work as One team 5) Learn constantly so we can continually improve
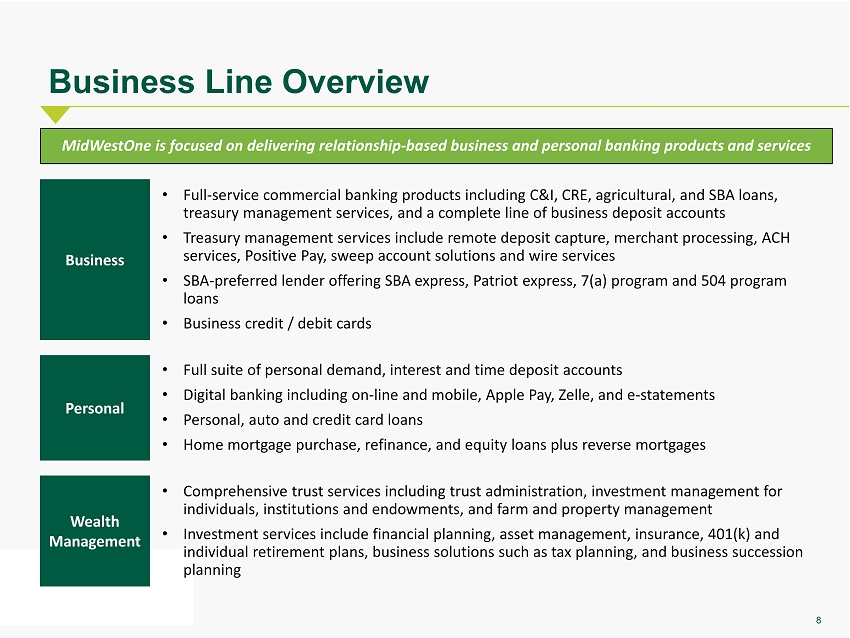
8 Business • Full - service commercial banking products including C&I, CRE, agricultural, and SBA loans, treasury management services, and a complete line of business deposit accounts • Treasury management services include remote deposit capture, merchant processing, ACH services, Positive Pay, sweep account solutions and wire services • SBA - preferred lender offering SBA express, Patriot express, 7(a) program and 504 program loans • Business credit / debit cards Business Line Overview • Full suite of personal demand, interest and time deposit accounts • Digital banking including on - line and mobile, Apple Pay, Zelle , and e - statements • Personal, auto and credit card loans • Home mortgage purchase, refinance, and equity loans plus reverse mortgages Personal MidWestOne is focused on delivering relationship - based business and personal banking products and services Wealth Management • Comprehensive trust services including trust administration, investment management for individuals, institutions and endowments, and farm and property management • Investment services include financial planning, asset management, insurance, 401(k) and individual retirement plans, business solutions such as tax planning, and business succession planning

9 Market Demographics Note: Demographic data is estimated per Claritas; deposit data as of June 30, 2019 per FDIC Source: S&P Global Market Intelligence • The Company is engaged in the business of commercial and retail banking, and investment management with operations throughout Iowa, the Minneapolis/St. Paul metropolitan area of Minnesota, western Wisconsin, Naples and Fort Myers, Florida, and Denver, Colorado • The Company has diversified its economic exposure away from a full reliance on the Iowa economy, with a unique branch network in a mix of key growth MSAs and rural markets • Concentrated focus on commercial and commercial real estate lending supplemented by agriculture and mortgage / consumer lending • Due to COVID - 19, the U.S. has recently experienced a substantial decline in economic conditions; each Governor within our 5 state footprint has issued a series of orders that outline business restrictions and reopening plans • As an essential business, the Bank has remained open during the pandemic, serving its customers through its digital banking channels, drive - thru banking locations, and customer service phone lines while its branch lobbies were closed • On June 1, the Bank began re - opening its branch lobbies at select locations Market Commentary ONE Place Employers Market Branch Dep. In Franchise 2010-2020 2020-2025 2020 2020-2025 Rank Count Market Percent Population Pop. Proj. Pop. Median HHProj. HH Inc. State (#) (#) ($M) (%) ($M) Change (%) Change (%) Inc. ($) Change (%) Iowa 7 34 2,430 64.77 3.2 4.19 2.13 62,995 7.06 Minnesota 20 13 838 22.33 5.7 6.91 3.50 74,486 11.44 Wisconsin 65 7 334 8.90 5.8 2.65 1.47 65,076 10.20 Florida 132 2 110 2.93 21.8 15.92 6.63 58,586 11.56 Colorado 105 1 40 1.07 5.8 15.67 6.39 75,052 12.34 Total 57 3,752 100.00 42.3 Weighted Average 5.13 2.55 65,746 8.51 Nationwide Average 7.00 3.27 66,010 9.87
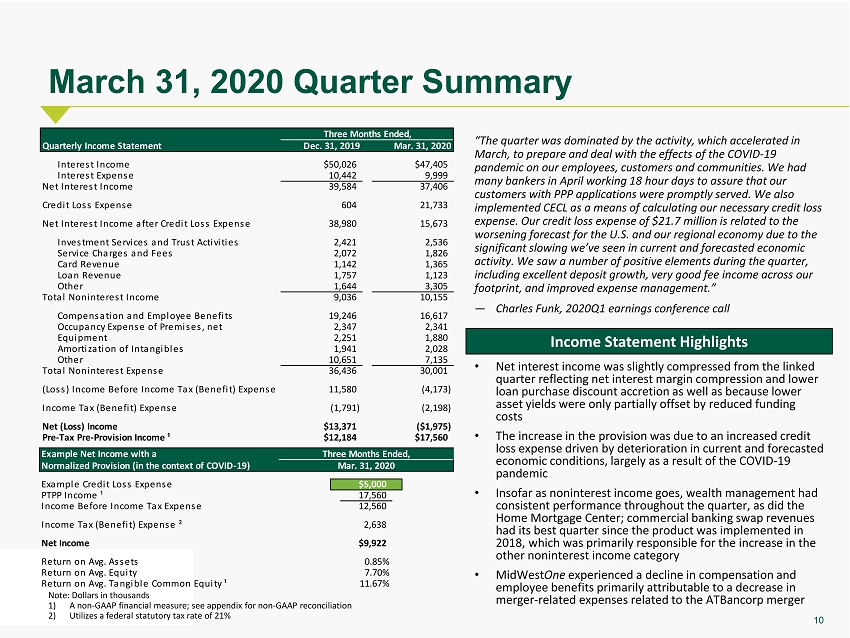
10 March 31, 2020 Quarter Summary “ The quarter was dominated by the activity, which accelerated in March, to prepare and deal with the effects of the COVID - 19 pandemic on our employees, customers and communities. We had many bankers in April working 18 hour days to assure that our customers with PPP applications were promptly served. We also implemented CECL as a means of calculating our necessary credit loss expense. Our credit loss expense of $21.7 million is related to the worsening forecast for the U.S. and our regional economy due to the significant slowing we’ve seen in current and forecasted economic activity. We saw a number of positive elements during the quarter, including excellent deposit growth, very good fee income across our footprint, and improved expense management .” — Charles Funk , 2020Q1 earnings conference call Note: Dollars in thousands 1) A non - GAAP financial measure; see appendix for non - GAAP reconciliation 2) Utilizes a federal statutory tax rate of 21% Income Statement Highlights • Net interest income was slightly compressed from the linked quarter reflecting net interest margin compression and lower loan purchase discount accretion as well as because lower asset yields were only partially offset by reduced funding costs • The increase in the provision was due to an increased credit loss expense driven by deterioration in current and forecasted economic conditions, largely as a result of the COVID - 19 pandemic • Insofar as noninterest income goes, wealth management had consistent performance throughout the quarter, as did the Home Mortgage Center; commercial banking swap revenues had its best quarter since the product was implemented in 2018, which was primarily responsible for the increase in the other noninterest income category • MidWest One experienced a decline in compensation and employee benefits primarily attributable to a decrease in merger - related expenses related to the ATBancorp merger Quarterly Income Statement Dec. 31, 2019 Mar. 31, 2020 Interest Income $50,026 $47,405 Interest Expense 10,442 9,999 Net Interest Income 39,584 37,406 Credit Loss Expense 604 21,733 Net Interest Income after Credit Loss Expense 38,980 15,673 Investment Services and Trust Activities 2,421 2,536 Service Charges and Fees 2,072 1,826 Card Revenue 1,142 1,365 Loan Revenue 1,757 1,123 Other 1,644 3,305 Total Noninterest Income 9,036 10,155 Compensation and Employee Benefits 19,246 16,617 Occupancy Expense of Premises, net 2,347 2,341 Equipment 2,251 1,880 Amortization of Intangibles 1,941 2,028 Other 10,651 7,135 Total Noninterest Expense 36,436 30,001 (Loss) Income Before Income Tax (Benefit) Expense 11,580 (4,173) Income Tax (Benefit) Expense (1,791) (2,198) Net (Loss) Income $13,371 ($1,975) Pre-Tax Pre-Provision Income ¹ $12,184 $17,560 Three Months Ended, Example Net Income with a Normalized Provision (in the context of COVID-19) Example Credit Loss Expense $5,000 PTPP Income ¹ 17,560 Income Before Income Tax Expense 12,560 Income Tax (Benefit) Expense ² 2,638 Net Income $9,922 Return on Avg. Assets 0.85% Return on Avg. Equity 7.70% Return on Avg. Tangible Common Equity ¹ 11.67% Mar. 31, 2020 Three Months Ended,
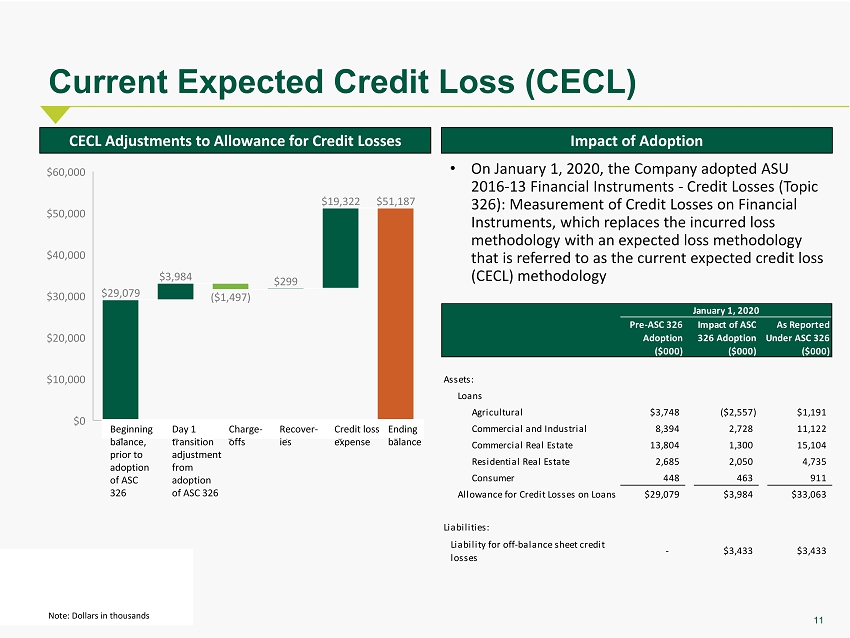
11 Current Expected Credit Loss (CECL) Note: Dollars in thousands CECL Adjustments to Allowance for Credit Losses Impact of Adoption • On January 1, 2020, the Company adopted ASU 2016 - 13 Financial Instruments - Credit Losses (Topic 326): Measurement of Credit Losses on Financial Instruments, which replaces the incurred loss methodology with an expected loss methodology that is referred to as the current expected credit loss (CECL) methodology Pre-ASC 326 Impact of ASC As Reported Adoption 326 Adoption Under ASC 326 ($000) ($000) ($000) Assets: Loans Agricultural $3,748 ($2,557) $1,191 Commercial and Industrial 8,394 2,728 11,122 Commercial Real Estate 13,804 1,300 15,104 Residential Real Estate 2,685 2,050 4,735 Consumer 448 463 911 Allowance for Credit Losses on Loans $29,079 $3,984 $33,063 Liabilities: Liability for off-balance sheet credit losses - $3,433 $3,433 January 1, 2020 Beginning balance, prior to adoption of ASC 326 Day 1 transition adjustment from adoption of ASC 326 Charge - offs Recover - ies Credit loss expense Ending balance
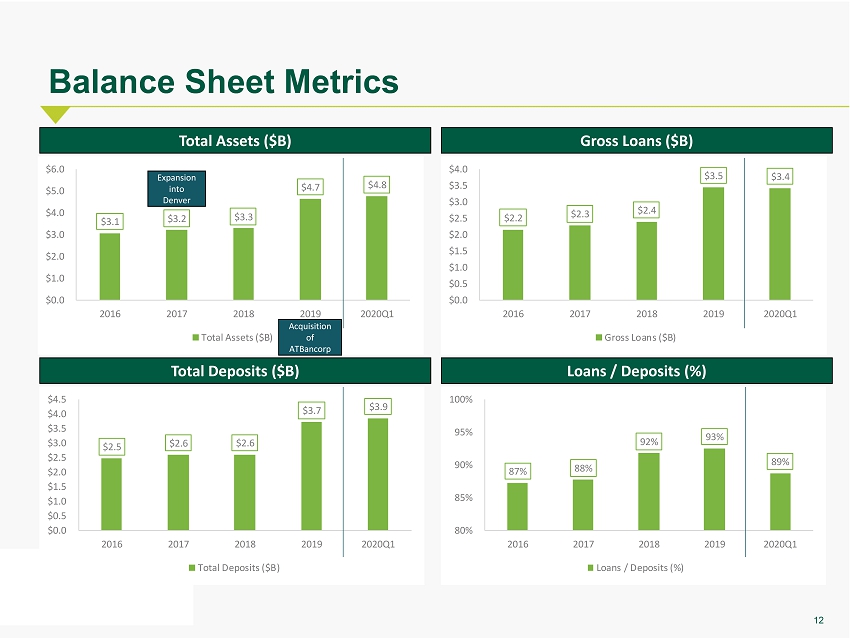
12 Balance Sheet Metrics Total Assets ($B) Gross Loans ($B) Total Deposits ($B) Loans / Deposits (%) $2.2 $2.3 $2.4 $3.5 $3.4 $0.0 $0.5 $1.0 $1.5 $2.0 $2.5 $3.0 $3.5 $4.0 2016 2017 2018 2019 2020Q1 Gross Loans ($B) $2.5 $2.6 $2.6 $3.7 $3.9 $0.0 $0.5 $1.0 $1.5 $2.0 $2.5 $3.0 $3.5 $4.0 $4.5 2016 2017 2018 2019 2020Q1 Total Deposits ($B) 87% 88% 92% 93% 89% 80% 85% 90% 95% 100% 2016 2017 2018 2019 2020Q1 Loans / Deposits (%) $3.1 $3.2 $3.3 $4.7 $4.8 $0.0 $1.0 $2.0 $3.0 $4.0 $5.0 $6.0 2016 2017 2018 2019 2020Q1 Total Assets ($B) Expansion into Denver Acquisition of ATBancorp
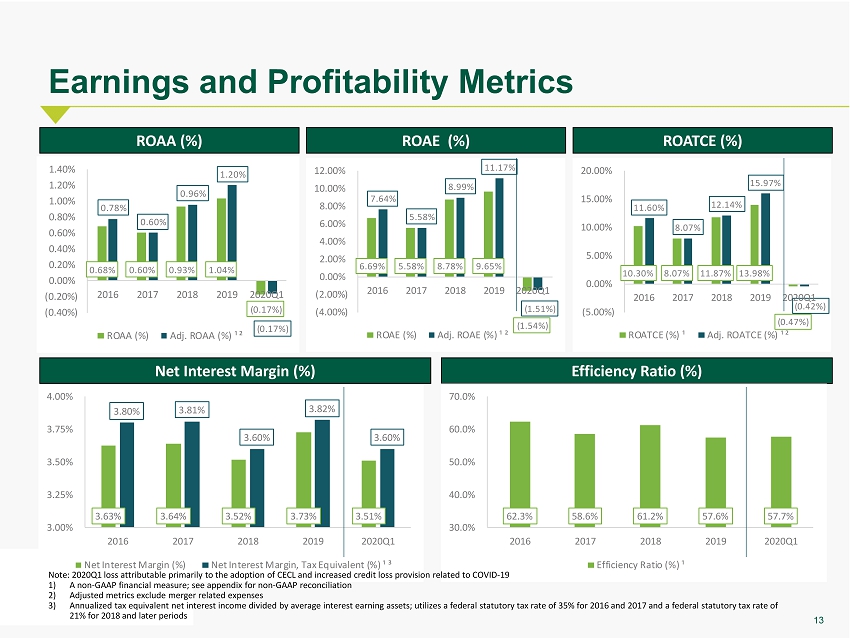
13 3.63% 3.64% 3.52% 3.73% 3.51% 3.80% 3.81% 3.60% 3.82% 3.60% 3.00% 3.25% 3.50% 3.75% 4.00% 2016 2017 2018 2019 2020Q1 Net Interest Margin (%) Net Interest Margin, Tax Equivalent (%) ¹ ³ 10.30% 8.07% 11.87% 13.98% (0.47%) 11.60% 8.07% 12.14% 15.97% (0.42%) (5.00%) 0.00% 5.00% 10.00% 15.00% 20.00% 2016 2017 2018 2019 2020Q1 ROATCE (%) ¹ Adj. ROATCE (%) ¹ ² Earnings and Profitability Metrics ROAA (%) ROATCE (%) Net Interest Margin (%) Efficiency Ratio (%) 62.3% 58.6% 61.2% 57.6% 57.7% 30.0% 40.0% 50.0% 60.0% 70.0% 2016 2017 2018 2019 2020Q1 Efficiency Ratio (%) ¹ Note: 2020Q1 loss attributable primarily to the adoption of CECL and increased credit loss provision related to COVID - 19 1) A non - GAAP financial measure; see appendix for non - GAAP reconciliation 2) Adjusted metrics exclude merger related expenses 3) Annualized tax equivalent net interest income divided by average interest earning assets; utilizes a federal statutory tax ra te of 35% for 2016 and 2017 and a federal statutory tax rate of 21% for 2018 and later periods ROAE (%) 6.69% 5.58% 8.78% 9.65% (1.54%) 7.64% 5.58% 8.99% 11.17% (1.51%) (4.00%) (2.00%) 0.00% 2.00% 4.00% 6.00% 8.00% 10.00% 12.00% 2016 2017 2018 2019 2020Q1 ROAE (%) Adj. ROAE (%) ¹ ² 0.68% 0.60% 0.93% 1.04% (0.17%) 0.78% 0.60% 0.96% 1.20% (0.17%) (0.40%) (0.20%) 0.00% 0.20% 0.40% 0.60% 0.80% 1.00% 1.20% 1.40% 2016 2017 2018 2019 2020Q1 ROAA (%) Adj. ROAA (%) ¹ ²
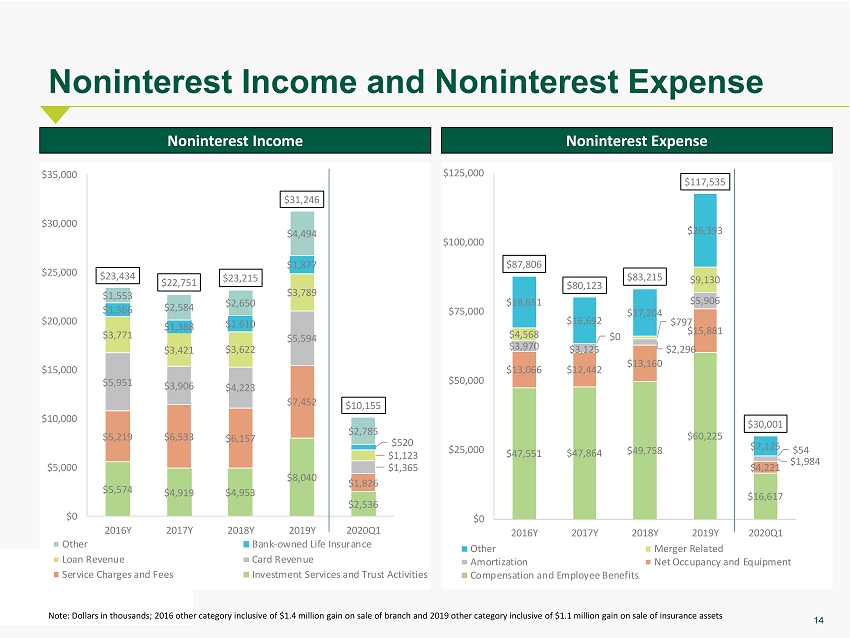
14 $47,551 $47,864 $49,758 $60,225 $16,617 $13,066 $12,442 $13,160 $15,881 $4,221 $3,970 $3,125 $2,296 $5,906 $1,984 $4,568 $0 $797 $9,130 $54 $18,651 $16,692 $17,204 $26,393 $7,125 $87,806 $80,123 $83,215 $117,535 $30,001 $0 $25,000 $50,000 $75,000 $100,000 $125,000 2016Y 2017Y 2018Y 2019Y 2020Q1 Other Merger Related Amortization Net Occupancy and Equipment Compensation and Employee Benefits Noninterest Income and Noninterest Expense Note: Dollars in thousands; 2016 other category inclusive of $1.4 million gain on sale of branch and 2019 other category incl usi ve of $1.1 million gain on sale of insurance assets Noninterest Income Noninterest Expense $23,434 $22,751 $23,215 $31,246 $10,155 $1,553 $2,584 $2,650 $4,494 $2,785 $1,366 $1,388 $1,610 $1,877 $520 $3,771 $3,421 $3,622 $3,789 $1,123 $5,951 $3,906 $4,223 $5,594 $1,365 $5,219 $6,533 $6,157 $7,452 $1,826 $5,574 $4,919 $4,953 $8,040 $2,536 $0 $5,000 $10,000 $15,000 $20,000 $25,000 $30,000 $35,000 2016Y 2017Y 2018Y 2019Y 2020Q1 Other Bank-owned Life Insurance Loan Revenue Card Revenue Service Charges and Fees Investment Services and Trust Activities
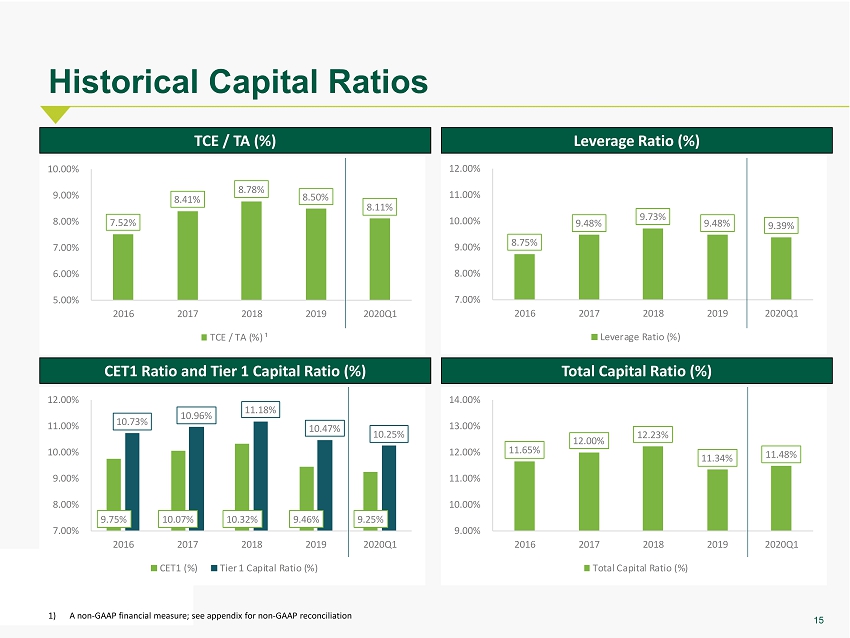
15 Historical Capital Ratios 1) A non - GAAP financial measure; see appendix for non - GAAP reconciliation TCE / TA (%) Leverage Ratio (%) CET1 Ratio and Tier 1 Capital Ratio (%) Total Capital Ratio (%) 9.75% 10.07% 10.32% 9.46% 9.25% 10.73% 10.96% 11.18% 10.47% 10.25% 7.00% 8.00% 9.00% 10.00% 11.00% 12.00% 2016 2017 2018 2019 2020Q1 CET1 (%) Tier 1 Capital Ratio (%) 11.65% 12.00% 12.23% 11.34% 11.48% 9.00% 10.00% 11.00% 12.00% 13.00% 14.00% 2016 2017 2018 2019 2020Q1 Total Capital Ratio (%) 8.75% 9.48% 9.73% 9.48% 9.39% 7.00% 8.00% 9.00% 10.00% 11.00% 12.00% 2016 2017 2018 2019 2020Q1 Leverage Ratio (%) 7.52% 8.41% 8.78% 8.50% 8.11% 5.00% 6.00% 7.00% 8.00% 9.00% 10.00% 2016 2017 2018 2019 2020Q1 TCE / TA (%) ¹
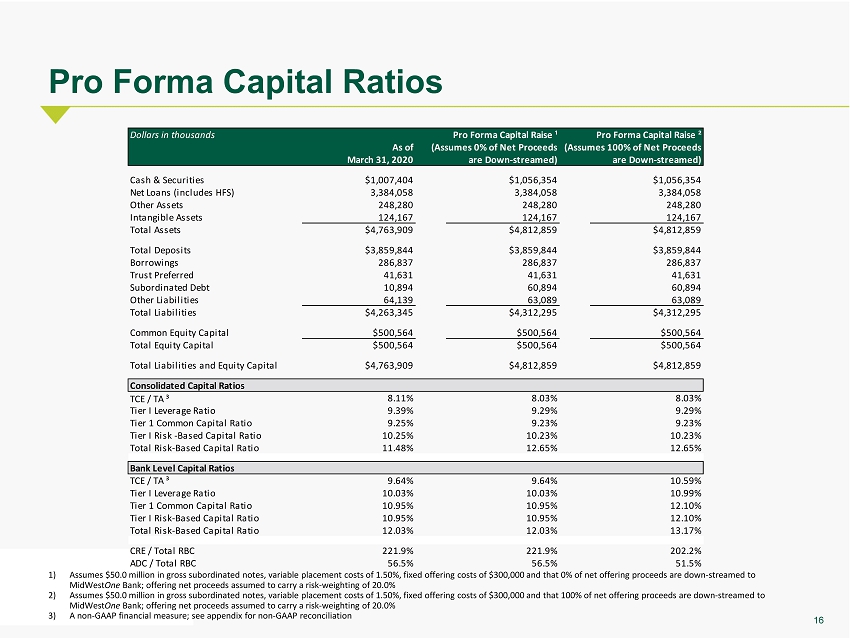
16 Pro Forma Capital Ratios 1) Assumes $50.0 million in gross subordinated notes, variable placement costs of 1.50%, fixed offering costs of $300,000 and that 0% of net o ffe ring proceeds are down - streamed to MidWest One Bank; offering net proceeds assumed to carry a risk - weighting of 20.0% 2) Assumes $50.0 million in gross subordinated notes, variable placement costs of 1.50%, fixed offering costs of $300,000 and that 100 % of net offering proceeds are down - streamed to MidWest One Bank ; offering net proceeds assumed to carry a risk - weighting of 20.0 % 3) A non - GAAP financial measure; see appendix for non - GAAP reconciliation Dollars in thousands Pro Forma Capital Raise ¹ Pro Forma Capital Raise ² As of (Assumes 0% of Net Proceeds (Assumes 100% of Net Proceeds March 31, 2020 are Down-streamed) are Down-streamed) Cash & Securities $1,007,404 $1,056,354 $1,056,354 Net Loans (includes HFS) 3,384,058 3,384,058 3,384,058 Other Assets 248,280 248,280 248,280 Intangible Assets 124,167 124,167 124,167 Total Assets $4,763,909 $4,812,859 $4,812,859 Total Deposits $3,859,844 $3,859,844 $3,859,844 Borrowings 286,837 286,837 286,837 Trust Preferred 41,631 41,631 41,631 Subordinated Debt 10,894 60,894 60,894 Other Liabilities 64,139 63,089 63,089 Total Liabilities $4,263,345 $4,312,295 $4,312,295 Common Equity Capital $500,564 $500,564 $500,564 Total Equity Capital $500,564 $500,564 $500,564 Total Liabilities and Equity Capital $4,763,909 $4,812,859 $4,812,859 Consolidated Capital Ratios TCE / TA ³ 8.11% 8.03% 8.03% Tier I Leverage Ratio 9.39% 9.29% 9.29% Tier 1 Common Capital Ratio 9.25% 9.23% 9.23% Tier I Risk -Based Capital Ratio 10.25% 10.23% 10.23% Total Risk-Based Capital Ratio 11.48% 12.65% 12.65% Bank Level Capital Ratios TCE / TA ³ 9.64% 9.64% 10.59% Tier I Leverage Ratio 10.03% 10.03% 10.99% Tier 1 Common Capital Ratio 10.95% 10.95% 12.10% Tier I Risk-Based Capital Ratio 10.95% 10.95% 12.10% Total Risk-Based Capital Ratio 12.03% 12.03% 13.17% CRE / Total RBC 221.9% 221.9% 202.2% ADC / Total RBC 56.5% 56.5% 51.5%
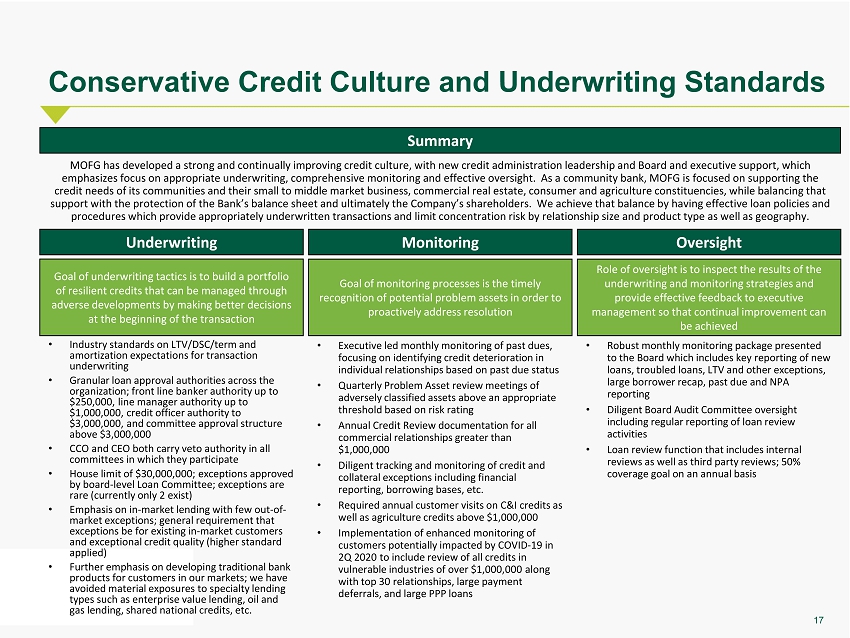
17 Conservative Credit Culture and Underwriting Standards Summary Underwriting Oversight MOFG has developed a strong and continually improving credit culture, with new credit administration leadership and Board and ex ecutive support, which emphasizes focus on appropriate underwriting, comprehensive monitoring and effective oversight. As a community b ank, MOFG is focused on supporting the credit needs of its communities and their small to middle market business, commercial real estate, consumer and agriculture c ons tituencies, while balancing that support with the protection of the Bank’s balance sheet and ultimately the Company’s shareholders. We achieve that balance b y h aving effective loan policies and procedures which provide appropriately underwritten transactions and limit concentration risk by relationship size and produc t t ype as well as geography. Monitoring • Industry standards on LTV/DSC/term and amortization expectations for transaction underwriting • Granular loan approval authorities across the organization; front line banker authority up to $250,000, line manager authority up to $1,000,000, credit officer authority to $3,000,000, and committee approval structure above $ 3,000,000 • CCO and CEO both carry veto authority in all committees in which they participate • House limit of $ 30,000,000; exceptions approved by board - level Loan Committee; exceptions are rare (currently only 2 exist) • Emphasis on in - market lending with few out - of - market exceptions; general requirement that exceptions be for existing in - market customers and exceptional credit quality (higher standard applied ) • Further emphasis on developing traditional bank products for customers in our markets; we have avoided material exposures to specialty lending types such as enterprise value lending, oil and gas lending, shared national credits, etc. • Executive led monthly monitoring of past dues, focusing on identifying credit deterioration in individual relationships based on past due status • Quarterly Problem Asset review meetings of adversely classified assets above an appropriate threshold based on risk rating • Annual Credit Review documentation for all commercial relationships greater than $ 1,000,000 • Diligent tracking and monitoring of credit and collateral exceptions including financial reporting, borrowing bases, etc. • Required annual customer visits on C&I credits as well as agriculture credits above $ 1,000,000 • Implementation of enhanced monitoring of customers potentially impacted by COVID - 19 in 2Q 2020 to include review of all credits in vulnerable industries of over $1,000,000 along with top 30 relationships, large payment deferrals, and large PPP loans • Robust monthly monitoring package presented to the Board which includes key reporting of new loans, troubled loans, LTV and other exceptions, large borrower recap, past due and NPA reporting • Diligent Board Audit Committee oversight including regular reporting of loan review activities • Loan review function that includes internal reviews as well as third party reviews; 50 % coverage goal on an annual basis Goal of underwriting tactics is to build a portfolio of resilient credits that can be managed through adverse developments by making better decisions at the beginning of the transaction Role of oversight is to inspect the results of the underwriting and monitoring strategies and provide effective feedback to executive management so that continual improvement can be achieved Goal of monitoring processes is the timely recognition of potential problem assets in order to proactively address resolution
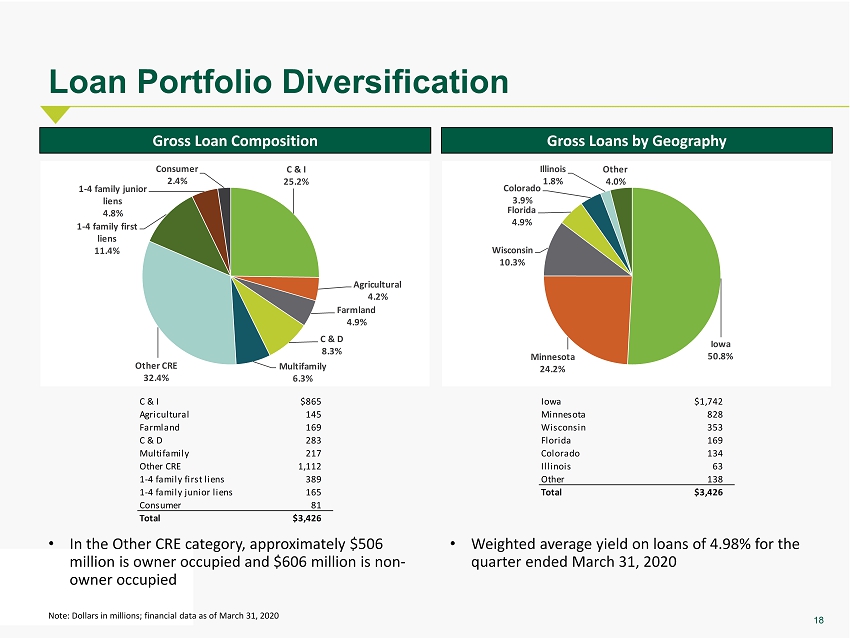
18 Loan Portfolio Diversification Note: Dollars in millions; financial data as of March 31, 2020 C & I $865 Agricultural 145 Farmland 169 C & D 283 Multifamily 217 Other CRE 1,112 1-4 family first liens 389 1-4 family junior liens 165 Consumer 81 Total $3,426 C & I 25.2% Agricultural 4.2% Farmland 4.9% C & D 8.3% Multifamily 6.3% Other CRE 32.4% 1 - 4 family first liens 11.4% 1 - 4 family junior liens 4.8% Consumer 2.4% Gross Loan Composition Gross Loans by Geography Iowa $1,742 Minnesota 828 Wisconsin 353 Florida 169 Colorado 134 Illinois 63 Other 138 Total $3,426 Iowa 50.8% Minnesota 24.2% Wisconsin 10.3% Florida 4.9% Colorado 3.9% Illinois 1.8% Other 4.0% • In the Other CRE category, approximately $506 million is owner occupied and $606 million is non - owner occupied • Weighted average yield on loans of 4.98% for the quarter ended March 31, 2020
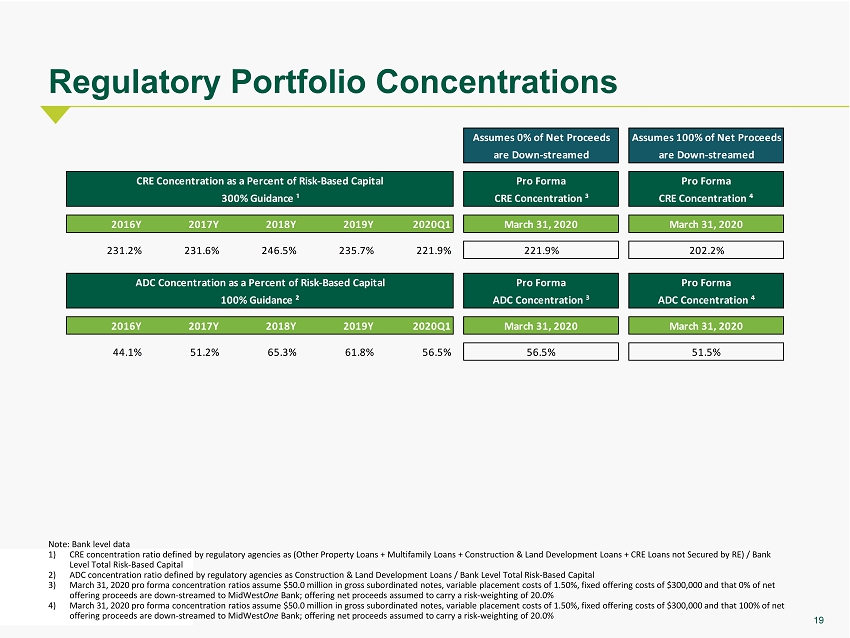
19 Regulatory Portfolio Concentrations Note: Bank level data 1) CRE concentration ratio defined by regulatory agencies as (Other Property Loans + Multifamily Loans + Construction & Land Develop men t Loans + CRE Loans not Secured by RE) / Bank Level Total Risk - Based Capital 2) ADC concentration ratio defined by regulatory agencies as Construction & Land Development Loans / Bank Level Total Risk - Based Capital 3) March 31, 2020 pro forma concentration ratios assume $50.0 million in gross subordinated notes, variable placement costs of 1.50%, fixed offering costs of $300,000 and that 0 % of net offering proceeds are down - streamed to MidWest One Bank; offering net proceeds assumed to carry a risk - weighting of 20.0 % 4) March 31, 2020 pro forma concentration ratios assume $50.0 million in gross subordinated notes, variable placement costs of 1 .50 %, fixed offering costs of $300,000 and that 100 % of net offering proceeds are down - streamed to MidWest One Bank; offering net proceeds assumed to carry a risk - weighting of 20.0 % 2016Y 2017Y 2018Y 2019Y 2020Q1 231.2% 231.6% 246.5% 235.7% 221.9% 2016Y 2017Y 2018Y 2019Y 2020Q1 44.1% 51.2% 65.3% 61.8% 56.5% Pro Forma March 31, 2020 56.5% 221.9% March 31, 2020 51.5% Assumes 0% of Net Proceeds Assumes 100% of Net Proceeds are Down-streamedare Down-streamed Pro FormaCRE Concentration as a Percent of Risk-Based Capital 100% Guidance ² ADC Concentration as a Percent of Risk-Based Capital 300% Guidance ¹ ADC Concentration ³ Pro Forma CRE Concentration ⁴ March 31, 2020 Pro Forma ADC Concentration ⁴ CRE Concentration ³ March 31, 2020 202.2%

20 CRE and C&D Portfolio Concentrations Note: Dollars in millions; financial data as of March 31, 2020 CRE Portfolio C&D Portfolio Owner Occupied CRE $505 Multifamily 217 Retail - NOO CRE 166 Office - NOO CRE 156 Industrial and Warehouse - NOO CRE 101 Hotel/Motel - NOO CRE 76 Other - NOO CRE 36 Sr Housing/Nursing Home - NOO CRE 25 Restaurant - NOO CRE 15 Medical - NOO CRE 11 Ministorage - NOO CRE 10 C-Store/Gas S/Car Wash - NOO CRE 9 Total $1,329 Owner Occupied CRE 38.9% Multifamily 16.7% Retail - NOO CRE 12.8% Office - NOO CRE 12.0% Industrial and Warehouse - NOO CRE 7.8% Hotel/Motel - NOO CRE 5.9% Other - NOO CRE 2.8% Sr Housing/Nursing Home - NOO CRE 1.9% Restaurant - NOO CRE 1.2% 1-4 Family $68 Improved Land 55 Hotel - NOO CRE 49 Industrial and Warehouse - OO CRE 25 Unimproved Land 20 Multifamily 16 Office - OO CRE 14 Other - OO CRE 9 Restaurant - OO CRE 7 C-Store/Gas S/Car Wash - OO CRE 6 Retail - NOO CRE 5 Office - NOO CRE 5 Industrial - NOO CRE 3 Other - NOO CRE 2 Total $283 1 - 4 Family 24.9% Improved Land 20.1% Hotel - NOO CRE 17.8% Industrial and Warehouse - OO CRE 9.0% Unimproved Land 7.4% Multifamily 6.0% Office - OO CRE 5.3% Other - OO CRE 3.3% Restaurant - OO CRE 2.4% C - Store/Gas S/Car Wash - OO CRE 2.1% Retail - NOO CRE 1.7%
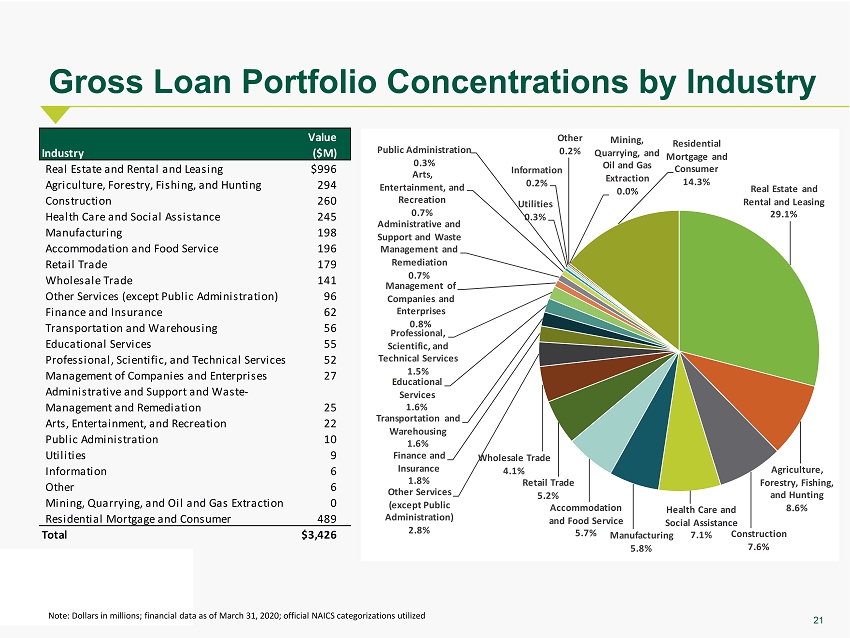
21 Gross Loan Portfolio Concentrations by Industry Value Industry ($M) Real Estate and Rental and Leasing $996 Agriculture, Forestry, Fishing, and Hunting 294 Construction 260 Health Care and Social Assistance 245 Manufacturing 198 Accommodation and Food Service 196 Retail Trade 179 Wholesale Trade 141 Other Services (except Public Administration) 96 Finance and Insurance 62 Transportation and Warehousing 56 Educational Services 55 Professional, Scientific, and Technical Services 52 Management of Companies and Enterprises 27 Administrative and Support and Waste- Management and Remediation 25 Arts, Entertainment, and Recreation 22 Public Administration 10 Utilities 9 Information 6 Other 6 Mining, Quarrying, and Oil and Gas Extraction 0 Residential Mortgage and Consumer 489 Total $3,426 Real Estate and Rental and Leasing 29.1% Agriculture, Forestry, Fishing, and Hunting 8.6% Construction 7.6% Health Care and Social Assistance 7.1% Manufacturing 5.8% Accommodation and Food Service 5.7% Retail Trade 5.2% Wholesale Trade 4.1% Other Services (except Public Administration) 2.8% Finance and Insurance 1.8% Transportation and Warehousing 1.6% Educational Services 1.6% Professional, Scientific, and Technical Services 1.5% Management of Companies and Enterprises 0.8% Administrative and Support and Waste Management and Remediation 0.7% Arts, Entertainment, and Recreation 0.7% Public Administration 0.3% Utilities 0.3% Information 0.2% Other 0.2% Mining, Quarrying, and Oil and Gas Extraction 0.0% Residential Mortgage and Consumer 14.3% Note: Dollars in millions; financial data as of March 31, 2020; official NAICS categorizations utilized
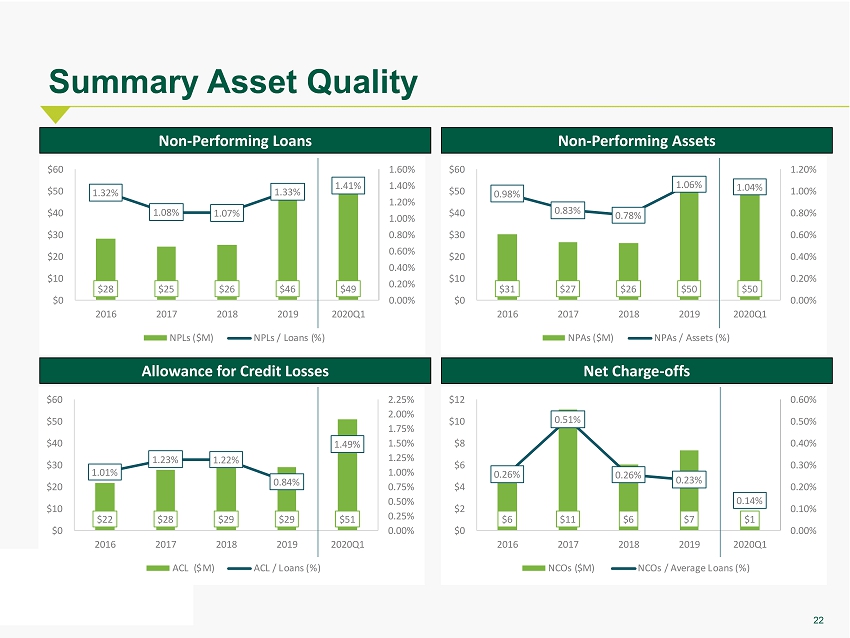
22 Summary Asset Quality Non - Performing Loans Non - Performing Assets Allowance for Credit Losses Net Charge - offs $6 $11 $6 $7 $1 0.26% 0.51% 0.26% 0.23% 0.14% 0.00% 0.10% 0.20% 0.30% 0.40% 0.50% 0.60% $0 $2 $4 $6 $8 $10 $12 2016 2017 2018 2019 2020Q1 NCOs ($M) NCOs / Average Loans (%) $22 $28 $29 $29 $51 1.01% 1.23% 1.22% 0.84% 1.49% 0.00% 0.25% 0.50% 0.75% 1.00% 1.25% 1.50% 1.75% 2.00% 2.25% $0 $10 $20 $30 $40 $50 $60 2016 2017 2018 2019 2020Q1 ACL ($M) ACL / Loans (%) $31 $27 $26 $50 $50 0.98% 0.83% 0.78% 1.06% 1.04% 0.00% 0.20% 0.40% 0.60% 0.80% 1.00% 1.20% $0 $10 $20 $30 $40 $50 $60 2016 2017 2018 2019 2020Q1 NPAs ($M) NPAs / Assets (%) $28 $25 $26 $46 $49 1.32% 1.08% 1.07% 1.33% 1.41% 0.00% 0.20% 0.40% 0.60% 0.80% 1.00% 1.20% 1.40% 1.60% $0 $10 $20 $30 $40 $50 $60 2016 2017 2018 2019 2020Q1 NPLs ($M) NPLs / Loans (%)

23 Non - Performing Assets Note: Dollars in thousands; financial data as of March 31, 2020 1) Indicates a credit risk area of focus (agriculture and vulnerable industries) Agriculture / Farmland ¹ $19,622 Arts, Entertainment & Gaming ¹ 384 CRE - Retail ¹ 1,242 Hotel ¹ 1,434 Non-essential Retail ¹ 3,928 Restaurants ¹ 1,163 C&I 9,677 CRE 5,796 1-4 Family 5,595 C&D 424 Consumer & Other 338 Total $49,603 Agriculture / Farmland 39.6% Arts, Entertainment & Gaming 0.8% CRE - Retail 2.5% Hotel 2.9% Non - essential Retail 7.9% Restaurants 2.3% C&I 19.5% CRE 11.7% 1 - 4 Family 11.3% C&D 0.9% Consumer & Other 0.7%
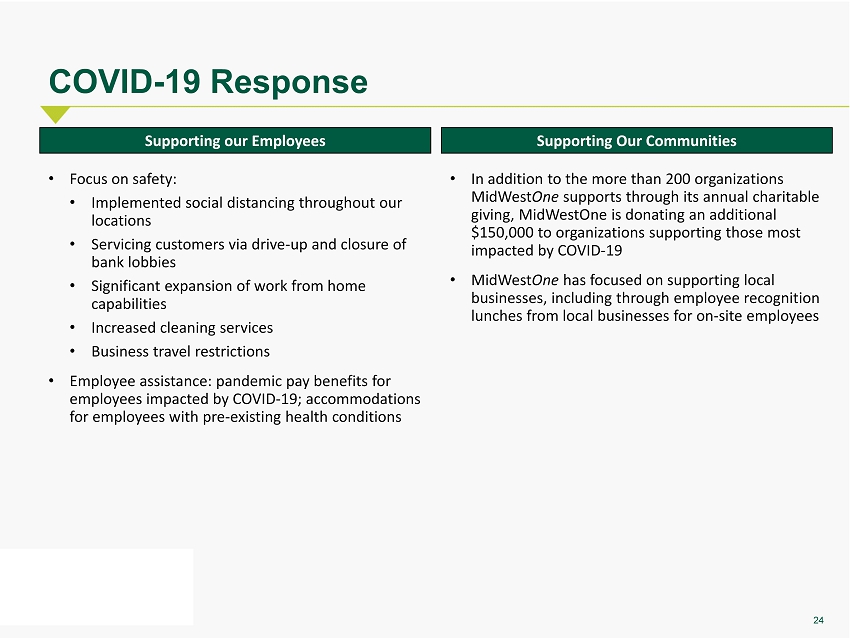
24 COVID - 19 Response • Focus on safety: • Implemented social distancing throughout our locations • S ervicing customers via drive - up and closure of bank lobbies • S ignificant expansion of work from home capabilities • I ncreased cleaning services • Business travel restrictions • Employee assistance: pandemic pay benefits for employees impacted by COVID - 19; accommodations for employees with pre - existing health conditions Supporting our Employees Supporting Our Communities • In addition to the more than 200 organizations MidWest One supports through its annual charitable giving, MidWestOne is donating an additional $150,000 to organizations supporting those most impacted by COVID - 19 • MidWest One has focused on supporting local businesses, including through employee recognition lunches from local businesses for on - site employees
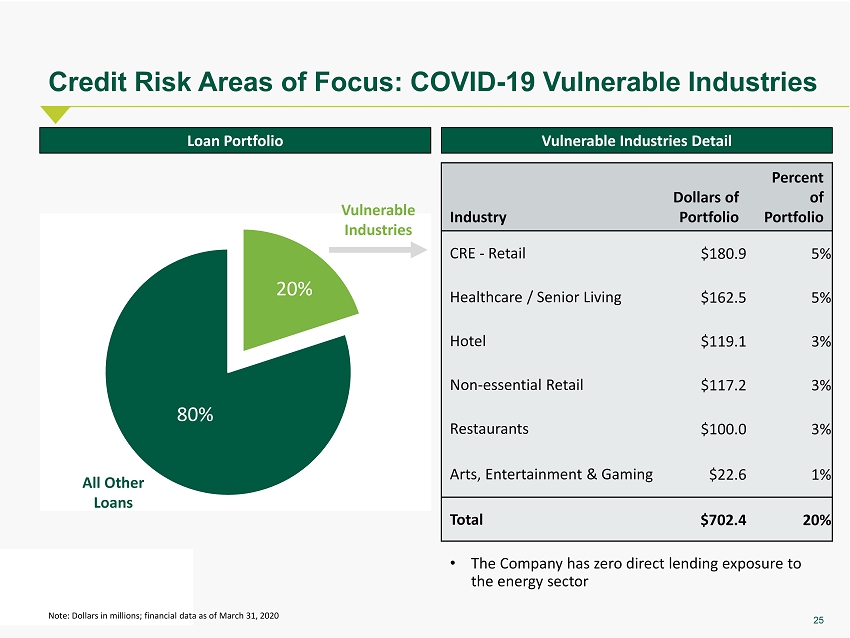
25 Credit Risk Areas of Focus: COVID - 19 Vulnerable Industries Industry Dollars of Portfolio Percent of Portfolio CRE - Retail $180.9 5% Healthcare / Senior Living $162.5 5% Hotel $119.1 3% Non - essential Retail $117.2 3% Restaurants $100.0 3% Arts, Entertainment & Gaming $22.6 1% Total $702.4 20% Note: Dollars in millions; financial data as of March 31, 2020 Loan Portfolio Vulnerable Industries Detail Vulnerable Industries 20% 80% All Other Loans • The Company has zero direct lending exposure to the energy sector
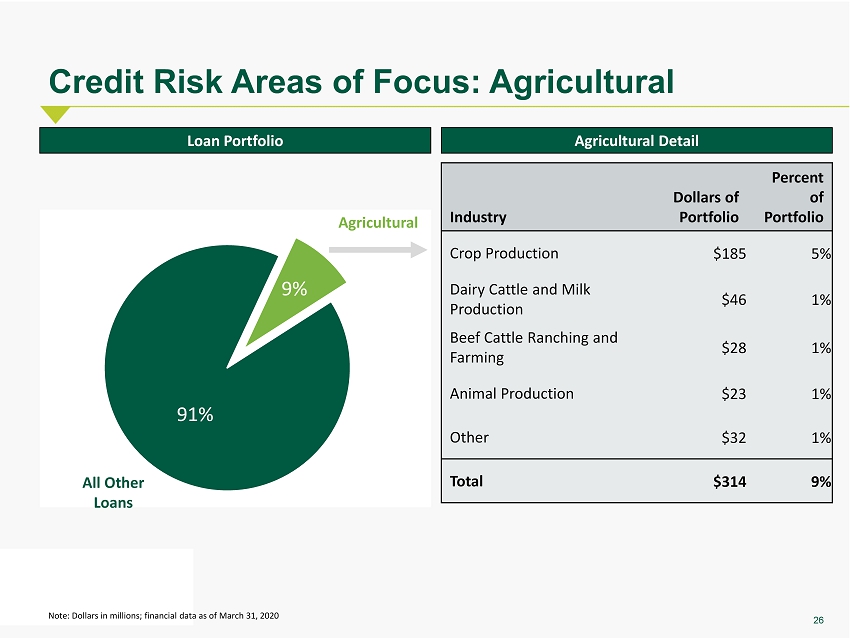
26 Credit Risk Areas of Focus: Agricultural Industry Dollars of Portfolio Percent of Portfolio Crop Production $185 5% Dairy Cattle and Milk Production $46 1% Beef Cattle Ranching and Farming $28 1% Animal Production $23 1% Other $32 1% Total $314 9% Note: Dollars in millions; financial data as of March 31, 2020 Loan Portfolio Agricultural Detail Agricultural 9% 91% All Other Loans
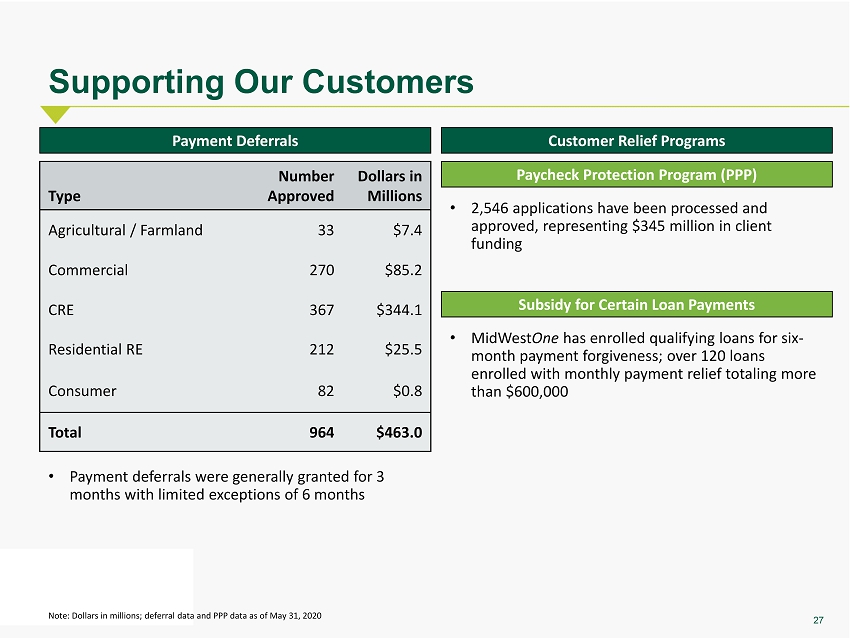
27 Supporting Our Customers • 2,546 applications have been processed and approved, representing $ 345 million in client funding Type Number Approved Dollars in Millions Agricultural / Farmland 33 $7.4 Commercial 270 $85.2 CRE 367 $344.1 Residential RE 212 $25.5 Consumer 82 $ 0.8 Total 964 $463.0 Payment Deferrals Customer Relief Programs Paycheck Protection Program (PPP) Subsidy for Certain Loan Payments • MidWest One has enrolled qualifying loans for six - month payment forgiveness; over 120 loans enrolled with monthly payment relief totaling more than $ 600,000 Note: Dollars in millions; deferral data and PPP data as of May 31, 2020 • Payment deferrals were generally granted for 3 months with limited exceptions of 6 months
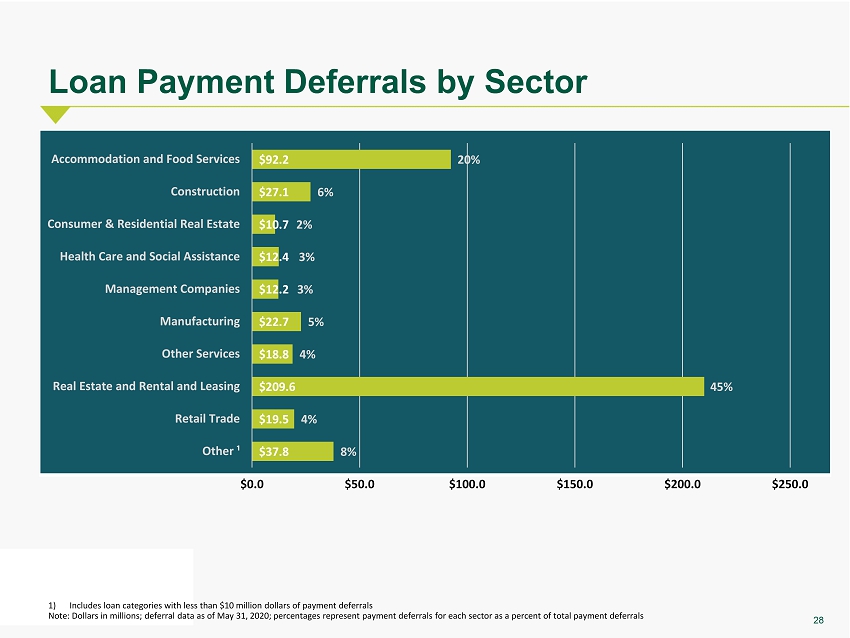
28 Loan Payment Deferrals by Sector 1) Includes loan categories with less than $10 million dollars of payment deferrals Note: Dollars in millions; deferral data as of May 31, 2020; percentages represent payment deferrals for each sector as a percent of total payment deferrals $37.8 $19.5 $209.6 $18.8 $22.7 $12.2 $12.4 $10.7 $27.1 $92.2 8% 4% 45% 4% 5% 3% 3% 2% 6% 20% $0.0 $50.0 $100.0 $150.0 $200.0 $250.0 Other ¹ Retail Trade Real Estate and Rental and Leasing Other Services Manufacturing Management Companies Health Care and Social Assistance Consumer & Residential Real Estate Construction Accommodation and Food Services

29 Note: The Company has not finalized its financial statements as of and for the quarter ended June 30, 2020. The observations set f ort h herein are estimates only, and the Company’s actual financial results may vary from such estimates. These estimates do not include any potential goodwill impairment. 1) Dollars in millions; excludes performing TDRs Preliminary June 30, 2020 Quarter Update Consolidated Capital Ratios Income Statement Balance Sheet Capital and Performance Metrics • Pre - tax pre - provision income expected to be $18 - $19 million for the quarter ended June 30, 2020, an increase from $17.6 million in 2020Q1 • Net interest income is expected to be $ 38 - $39 million, an increase from $ 37.4 million in 2020Q1 • Q2 NIM impacted by the continued flat yield curve, a shift in earning asset mix and lower - yielding PPP loans; cost of total deposits is expected to decline by 23 bps for 2020Q2 as compared to 2020Q1 • Credit loss expense is expected to be approximately $4.7 million • Noninterest income is expected to be $ 8.0 - $9.0 million, a decrease from $ 10.2 million in 2020Q1 • Noninterest expense is expected to be $ 28 - $29 million, as compared to $30.0 million in 2020Q1 • Goodwill impairment as of June 30, 2020 is still under review and could result in a significant decrease to GAAP earnings, including impairment of the full amount of the Company’s goodwill ($94.0 million at March 31, 2020); goodwill and other intangible assets are excluded from regulatory capital ratios • Gross loan balances • $3.6 billion expected, as compared to $3.4 billion at the end of 2020Q1 (~+ 5 %) • Gross PPP loan balances of $337 million at June 30, 2020 • Excluding PPP loans, $ 3.3 billion expected (~ - 5%) • Deposit balances • $4.3 billion expected, as compared to $3.9 billion at the end of 2020Q1 (~+ 11 %) Performance 2020Q1 2020Q2 Actual Est. Net Interest Margin - Tax Equivalent 3.60% 3.38% Earning Asset Yield 4.54% 4.07% Cost of Total Deposits 0.85% 0.62% PTPP ROAA 1.51% 1.49% Non-Performing Assets ¹ $45.2 $45.5 2020Q1 2020Q2 Actual Est. Tangible Common Equity 8.11% 7.8% Excluding PPP Loans 8.3% CET1 Ratio 9.25% 9.3% Leverage Ratio 9.39% 8.8% Excluding PPP Loans 9.3% Tier 1 Risk-Based Capital Ratio 10.25% 10.2% Total Risk-Based Capital Ratio 11.48% 11.4% Capital Conservation Buffer 3.48% 3.4%
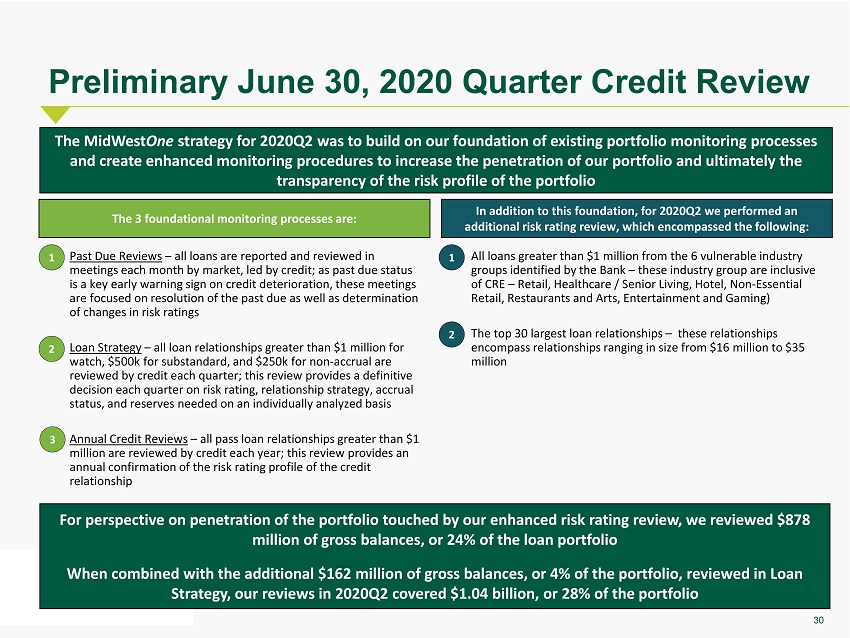
30 Preliminary June 30, 2020 Quarter Credit Review The MidWest One strategy for 2020Q2 was to build on our foundation of existing portfolio monitoring processes and create enhanced monitoring procedures to increase the penetration of our portfolio and ultimately the transparency of the risk profile of the portfolio • Past Due Reviews – all loans are reported and reviewed in meetings each month by market, led by credit; a s past due status is a key early warning sign on credit deterioration, these meetings are focused on resolution of the past due as well as determination of changes in risk ratings • Loan Strategy – all loan relationships greater than $ 1 million for watch, $ 500k for substandard, and $ 250k for non - accrual are reviewed by credit each quarter; t his review provides a definitive decision each quarter on risk rating, relationship strategy, accrual status, and reserves needed on an individually analyzed basis • Annual C redit Reviews – all pass loan relationships greater than $ 1 million are reviewed by credit each year; this review provides an annual confirmation of the risk rating profile of the credit relationship The 3 foundational monitoring processes are: • All loans greater than $ 1 million from the 6 vulnerable industry groups identified by the Bank – these industry group are inclusive of CRE – Retail, Healthcare / Senior Living, Hotel, Non - Essential Retail, Restaurants and Arts, Entertainment and Gaming) • The top 30 largest loan relationships – these relationships encompass relationships ranging in size from $ 16 million to $ 35 million In addition to this foundation, for 2020Q2 we performed an additional risk rating review, which encompassed the following: 1 2 3 1 2 For perspective on penetration of the portfolio touched by our enhanced risk rating review, we reviewed $ 878 million of gross balances, or 24% of the loan portfolio When combined with the additional $ 162 million of gross balances, or 4% of the portfolio, reviewed in Loan Strategy, our reviews in 2020Q2 covered $ 1.04 billion, or 28% of the portfolio
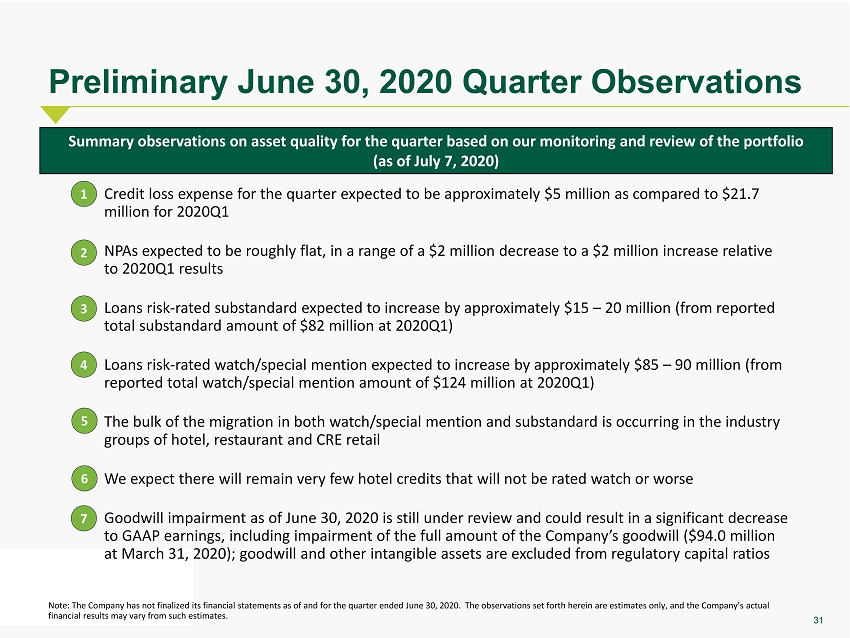
31 Preliminary June 30, 2020 Quarter Observations Summary observations on asset quality for the quarter based on our monitoring and review of the portfolio (as of July 7, 2020) • Credit loss expense for the quarter expected to be approximately $ 5 million as compared to $21.7 million for 2020Q1 • NPAs expected to be roughly flat, in a range of a $2 million decrease to a $2 million increase relative to 2020Q1 results • Loans risk - rated substandard expected to increase by approximately $15 – 20 million (from reported total substandard amount of $ 82 million at 2020Q1) • Loans risk - rated watch/special mention expected to increase by approximately $85 – 90 million (from reported total watch/special mention amount of $124 million at 2020Q1) • The bulk of the migration in both watch/special mention and substandard is occurring in the industry groups of hotel , restaurant and CRE retail • We expect there will remain very few hotel credits that will not be rated watch or worse • Goodwill impairment as of June 30, 2020 is still under review and could result in a significant decrease to GAAP earnings, including impairment of the full amount of the Company’s goodwill ($94.0 million at March 31, 2020); goodwill and other intangible assets are excluded from regulatory capital ratios 1 2 3 4 5 6 7 Note: The Company has not finalized its financial statements as of and for the quarter ended June 30, 2020. The observations set f ort h herein are estimates only, and the Company’s actual financial results may vary from such estimates.
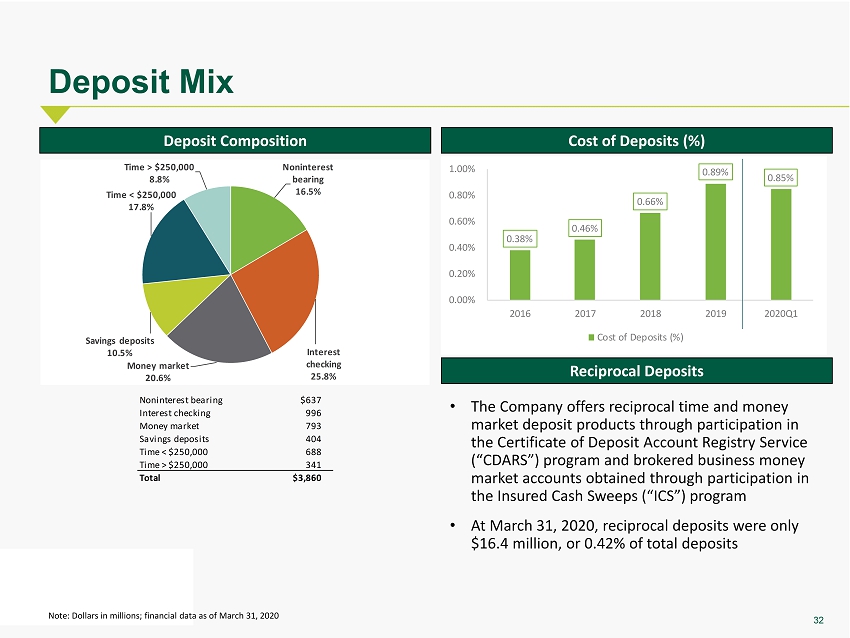
32 Deposit Mix Note: Dollars in millions; financial data as of March 31, 2020 Deposit Composition Cost of Deposits (%) Reciprocal Deposits Noninterest bearing $637 Interest checking 996 Money market 793 Savings deposits 404 Time < $250,000 688 Time > $250,000 341 Total $3,860 Noninterest bearing 16.5% Interest checking 25.8% Money market 20.6% Savings deposits 10.5% Time < $250,000 17.8% Time > $250,000 8.8% 0.38% 0.46% 0.66% 0.89% 0.85% 0.00% 0.20% 0.40% 0.60% 0.80% 1.00% 2016 2017 2018 2019 2020Q1 Cost of Deposits (%) • The Company offers reciprocal time and money market deposit products through participation in the Certificate of Deposit Account Registry Service (“ CDARS ”) program and brokered business money market accounts obtained through participation in the Insured Cash Sweeps (“ICS”) program • At March 31, 2020 , reciprocal deposits were only $16.4 million, or 0.42% of total deposits
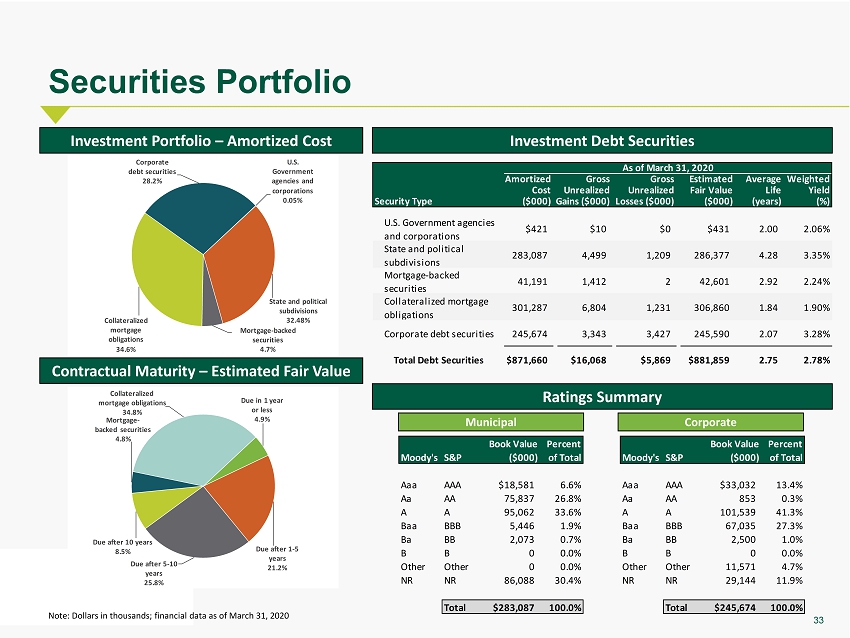
33 Securities Portfolio Investment Portfolio – Amortized Cost Investment Debt Securities Note: Dollars in thousands; financial data as of March 31, 2020 U.S. Government agencies and corporations 0.05% State and political subdivisions 32.48% Mortgage - backed securities 4.7% Collateralized mortgage obligations 34.6% Corporate debt securities 28.2% Contractual Maturity – Estimated Fair Value Ratings Summary Due in 1 year or less 4.9% Due after 1 - 5 years 21.2% Due after 5 - 10 years 25.8% Due after 10 years 8.5% Mortgage - backed securities 4.8% Collateralized mortgage obligations 34.8% Book Value Percent Moody's S&P ($000) of Total Aaa AAA $18,581 6.6% Aa AA 75,837 26.8% A A 95,062 33.6% Baa BBB 5,446 1.9% Ba BB 2,073 0.7% B B 0 0.0% Other Other 0 0.0% NR NR 86,088 30.4% Total $283,087 100.0% Municipal Corporate Book Value Percent Moody's S&P ($000) of Total Aaa AAA $33,032 13.4% Aa AA 853 0.3% A A 101,539 41.3% Baa BBB 67,035 27.3% Ba BB 2,500 1.0% B B 0 0.0% Other Other 11,571 4.7% NR NR 29,144 11.9% Total $245,674 100.0% Amortized Gross Gross Estimated AverageWeighted Cost Unrealized Unrealized Fair Value Life Yield Security Type ($000)Gains ($000)Losses ($000) ($000) (years) (%) U.S. Government agencies and corporations $421 $10 $0 $431 2.00 2.06% State and political subdivisions 283,087 4,499 1,209 286,377 4.28 3.35% Mortgage-backed securities 41,191 1,412 2 42,601 2.92 2.24% Collateralized mortgage obligations 301,287 6,804 1,231 306,860 1.84 1.90% Corporate debt securities 245,674 3,343 3,427 245,590 2.07 3.28% Total Debt Securities $871,660 $16,068 $5,869 $881,859 2.75 2.78% As of March 31, 2020
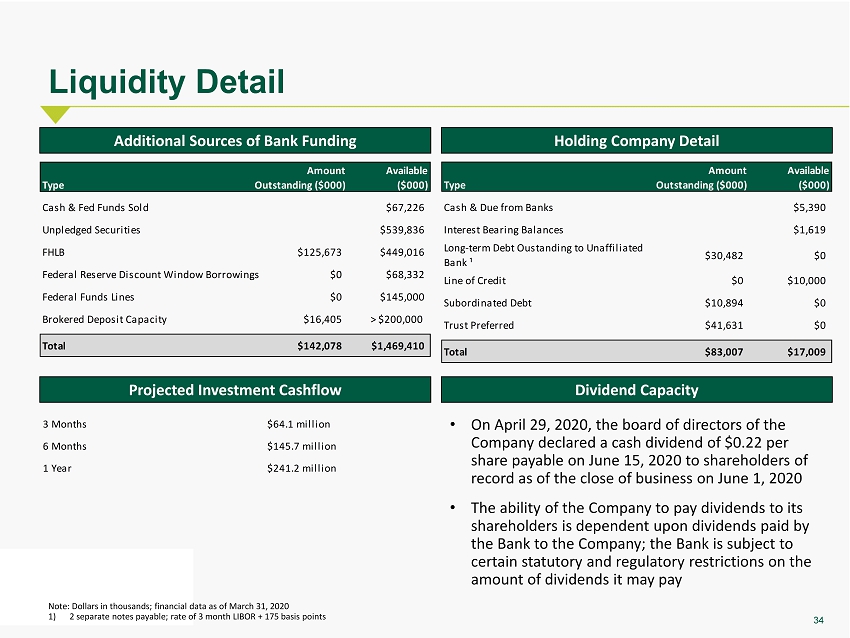
34 Liquidity Detail Note: Dollars in thousands; financial data as of March 31, 2020 1) 2 separate notes payable; rate of 3 month LIBOR + 175 basis points Additional Sources of Bank Funding Holding Company Detail Dividend Capacity Amount Available Type Outstanding ($000) ($000) $5,390 $1,619 $30,482 $0 $0 $10,000 $10,894 $0 $41,631 $0 Total $83,007 $17,009 Cash & Due from Banks Interest Bearing Balances Long-term Debt Oustanding to Unaffiliated Bank ¹ Line of Credit Subordinated Debt Trust Preferred • On April 29, 2020, the board of directors of the Company declared a cash dividend of $0.22 per share payable on June 15, 2020 to shareholders of record as of the close of business on June 1, 2020 • The ability of the Company to pay dividends to its shareholders is dependent upon dividends paid by the Bank to the Company; the Bank is subject to certain statutory and regulatory restrictions on the amount of dividends it may pay 3 Months $64.1 million 6 Months $145.7 million 1 Year $241.2 million Projected Investment Cashflow Amount Available Type Outstanding ($000) ($000) Cash & Fed Funds Sold $67,226 Unpledged Securities $539,836 FHLB $125,673 $449,016 Federal Reserve Discount Window Borrowings $0 $68,332 Federal Funds Lines $0 $145,000 Brokered Deposit Capacity $16,405 > $200,000 Total $142,078 $1,469,410

35 Historical and Pro Forma Double Leverage and Interest Coverage 1) Assumes $50.0 million in gross subordinated notes, variable placement costs of 1.50%, fixed offering costs of $300,000 and that 100% of net of fering proceeds are down - streamed to MidWest One Bank for illustrative purposes 2) Interest coverage calculation assumes $50.0 million in gross subordinated notes with a 5.50% coupon 3) Adjusted metrics exclude merger related expenses; a non - GAAP financial measure; see appendix for non - GAAP reconciliation Dollars in thousands Pro Forma 2016 2017 2018 2019 3/31/2020 3/31/2020 Equity Investment in Subsidiaries $336,937 $366,672 $372,595 $575,508 $570,837 $570,837 Consolidated Equity 305,456 340,304 357,067 508,982 500,564 500,564 Double Leverage Ratio 110.3% 107.7% 104.3% 113.1% 114.0% Proposed Downstream of Debt Offering ¹ $48,950 Pro Forma Bank-Level Equity $619,787 Pro Forma Double Leverage Ratio 123.8% Dollars in thousands Pro Forma 2016 2017 2018 2019 3/31/2020 3/31/2020 ² Total Deposit Interest $9,378 $11,489 $17,331 $29,927 $32,186 $32,186 Trust Preferred Stock Interest 825 949 1,184 1,853 1,997 1,997 Subordinated Debt Issuance 0 0 0 0 0 2,750 Other Borrowing Interest 2,519 2,707 4,326 7,011 7,205 7,205 Total Interest Expense $12,722 $15,145 $22,841 $38,791 $41,388 $44,138 Pre-Tax Income 27,251 29,075 37,968 50,203 36,856 34,106 Interest Coverage (including deposit expense) 3.1x 2.9x 2.7x 2.3x 1.9x 1.8x Interest Coverage (excluding deposit expense) 9.1x 9.0x 7.9x 6.7x 5.0x 3.9x Adj. Pre-Tax Income ³ 31,819 29,075 38,765 59,333 45,873 43,123 Interest Coverage (including deposit expense) 3.5x 2.9x 2.7x 2.5x 2.1x 2.0x Interest Coverage (excluding deposit expense) 10.5x 9.0x 8.0x 7.7x 6.0x 4.6x For the Year Ended December 31, Last Twelve Months Ended, Calculation of Double Leverage For the Year Ended December 31, Last Twelve Months Ended, Calculation of Interest Coverage
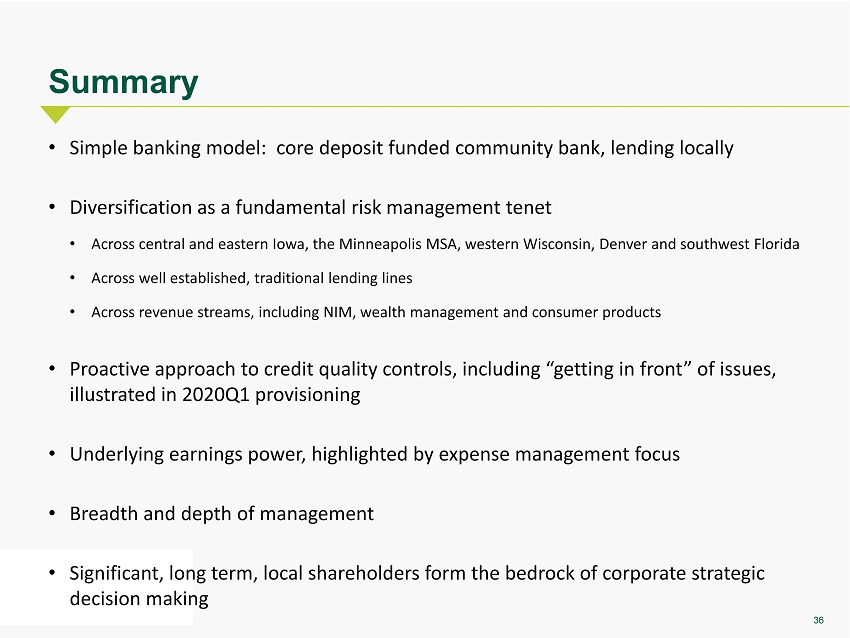
36 Summary • Simple banking model: core deposit funded community bank, lending locally • Diversification as a fundamental risk management tenet • A cross central and eastern Iowa, the Minneapolis MSA, western Wisconsin, Denver and southwest Florida • Across well established, traditional lending lines • Across revenue streams, including NIM, wealth management and consumer products • Proactive approach to credit quality controls, including “getting in front” of issues, illustrated in 2020Q1 provisioning • Underlying earnings power, highlighted by expense management focus • Breadth and depth of management • Significant, long term, local shareholders form the bedrock of corporate strategic decision making

Appendix

38 Corporate History 1983 ISB Financial Corporation Established, the Parent Company of Iowa State Bank & Trust Company 2008 Merger of MidWest One Financial Group, Inc . into ISB and Name Change to MidWest One 1934 Iowa State Bank & Trust Company Founded 2019 Acquisition of ATBancorp (Dubuque / Des Moines / Southwest Wisconsin) 2015 Acquisition of Central Bancshares, Inc. (Minneapolis / St. Paul Metro / Southwest Florida) 2020 57 branches across 5 state footprint • The Bank was founded in 1934 by Ben Samuel Summerwill , known as “Grandpa Ben” • The Bank still operates under the same charter founded in 1934, and in the same historic location on the corner of Clinton and Washington Streets in Iowa City 2017 Expansion into Denver

39 Managerial Organizational Structure President & Chief Operating Officer EVP, Chief Credit Officer Senior EVP, Chief Financial Officer Senior EVP, Chief Investment Officer & Treasurer SVP, Chief Risk Officer SVP, Senior Regional Pres. Commercial Banking Len Devaisher Gary Sims Barry Ray Jim Cantrell Susan Moore Mitch Cook Chief Executive Officer Charlie Funk Board of Directors EVP, Retail Banking David Lindstrom SVP, Chief Human Resources Officer Soni Harney EVP, Wealth Management & Corporate Communications Greg Turner SVP, Chief Operations Officer Barb Finney SVP, Chief Information Officer John Henk

40 Management Biographies Charles N. Funk Len Devaisher President & Chief Executive Officer President & Chief Operating Officer Years at MidWestOne: 20 │ Years in Banking: 41 Years at MidWestOne: < 1 │ Years in Banking: 19 Barry S. Ray Gary L. Sims Senior Executive Vice President & Chief Financial Officer Executive Vice President & Chief Credit Officer Years at MidWestOne: 2 │ Years in Banking: 20 Years at MidWestOne: 2 │ Years in Banking: 31 Mr. Funk is the President and Chief Executive Officer of the Company and the Bank, positions he has held since November 2000. Prior to that, he held positions as President and Central Region Manager and Chief Investment Officer for Brenton Bank-Des Moines. Mr. Funk has taught for the Colorado Graduate School of Banking in Boulder, Colorado, the Iowa School of Banking, and the Stonier Graduate School of Banking at Georgetown University. He previously served on the board of Folience and the American Bankers Association and was the Chairman of the Iowa Bankers Association in 2010 and 2011. Mr. Funk graduated with a Bachelor’s degree from William Jewell College. Mr. Ray is the Senior Executive Vice President and Chief Financial Officer of the Company and the Bank, positions he has held since June 2018. From May 2006 until May 2018 he served as Chief Accounting Officer and Controller of Columbia State Bank, a subsidiary of Columbia Banking Systems, Inc. Prior to that, he was employed as a Business Analyst, Investment Operations, with Russell Investment Group from 2005 to 2006, and prior to that, was a Consulting Services Manager with RSM US LLP from 2000 to 2005. Mr. Ray served in the U.S. Navy, and received his Bachelor’s degree from the University of Washington. He is a Certified Public Accountant. Mr. Sims is the Senior Vice President and Chief Credit Officer of the Company and Executive Vice President and Chief Credit Officer of the Bank. Prior to joining the Company in 2018, he served as Managing Director - Corporate and Institutional, and as the Chief Credit Officer of NBH Bank. Prior to that, he was employed as the Senior Credit Officer for Regions Bank in Dallas, Texas. Mr. Sims received a Bachelor of Business Administration degree in Finance from the University of North Texas, Denton, Texas. Mr. Devaisher will be the President and Chief Operating Officer for both the Company and the Bank effective July 27, 2020. Mr. Devaisher most recently was Old National Bank’s Wisconsin Region Chief Executive Officer. He has more than 19 years of banking experience with focused expertise in commercial banking and business development. Mr. Devaisher earned a Bachelor of Science degree in Economics from the University of Evansville, completed the American Bankers Association Stonier Graduate School of Banking, and earned a leadership certificate in banking from The Wharton School at the University of Pennsylvania.

41 Management Biographies (cont.) James M. Cantrell Gregory W. Turner Senior Executive Vice President & Chief Investment Officer, Treasurer Executive Vice President, Wealth Management & Corporate Years at MidWestOne: 11 │ Years in Banking: 34 Communications Years at MidWestOne: 11 │ Years in Banking: 22 David Lindstrom Susan Moore Executive Vice President, Retail Banking Senior Vice President & Chief Risk Officer Years at MidWestOne: 3 │ Years in Banking: 31 Years at MidWestOne: 1 │ Years in Banking: 18 Mr. Turner is Vice President, Wealth Management & Corporate Communications of the Company and Executive Vice President, Wealth Management & Corporate Communications of the Bank, employed by the Bank since January 2009. From 1998 to 2009 he was employed by Citizens National Bank in Macomb, IL where he held various roles in wealth management and marketing. He also served on the Citizens National Bank Board of Directors. He received a Bachelor of Arts degree in Marketing from Quincy University, Quincy, IL. Mr. Lindstrom is the Executive Vice President, Retail Banking of the Bank, a position he has held since January 2018. Prior to his employment with the Bank, Mr. Lindstrom had been employed by BMO Harris Bank, a subsidiary of the Bank of Montreal, since 1989. From 2014 to January 2018, he served as Market President, West Market, of BMO Harris Bank, where he was responsible for growth across all business lines and being a key community contact for the bank. From 2012 to 2014, he was the Senior Vice President, Head of Retail banking and Regional Sales Manager; Northwest Region Minnesota and Wisconsin for BMO Harris Bank. Mr. Lindstrom received his Bachelor's degree in economics from the University of Wisconsin, Madison. Ms. Moore is the Senior Vice President and Chief Risk Officer of the Bank, a position she has held since April 2019. From October 2011 until March 2019 she was employed by Hills Bank & Trust Company where she held various roles in enterprise risk management including Senior Vice President, Director of Risk Management from March 2016 to March 2019. Prior to that, she was employed in various roles in the financial institutions practice with RSM US LLP from 2001 to 2011. Ms. Moore received her Bachelor’s degree in 2001 and her Master of Accounting in 2002 from the University of Iowa. She is a Certified Public Accountant (inactive). Mr. Cantrell is Senior Executive Vice President, Chief Investment Officer and Treasurer of the Company and the Bank. He has also served as the Interim Chief Financial Officer of both the Company and the Bank between December 2017 and June 2018. He joined the Company in his current positions in July 2009. Prior to joining the Bank, he had been with Provident Bank in Baltimore, Maryland, since 2008, where he served as Senior Vice President and Director of Treasury Operations. In that capacity, he was responsible for management of asset/liability activities, investment portfolio accounting, and derivative activity and compliance. Prior to that, he was employed as the Senior Vice President and Treasurer of Mercantile-Safe Deposit and Trust Company in Baltimore, Maryland, where he had been employed since 2001. Mr. Cantrell has a Bachelor’s degree in business and economics from Wittenberg University.
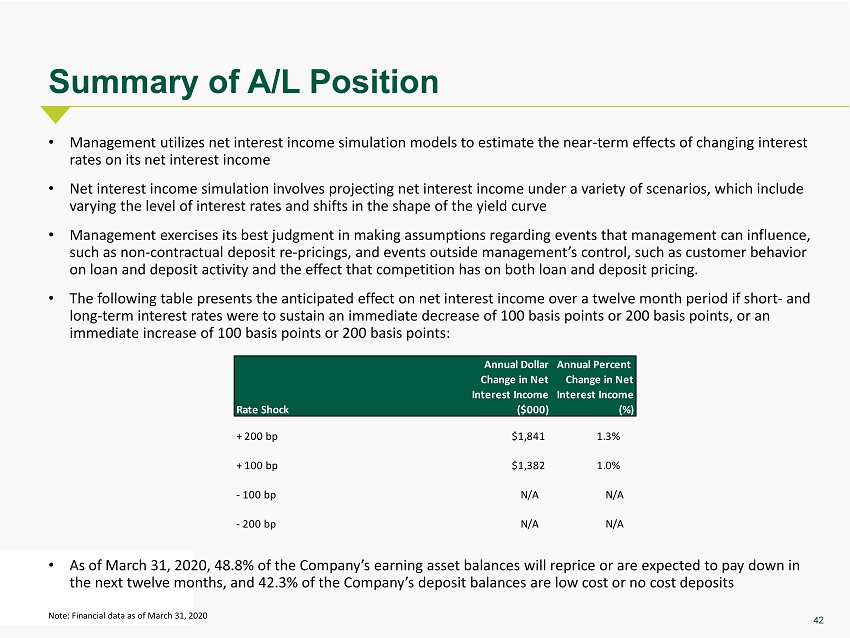
42 Summary of A/L Position • Management utilizes net interest income simulation models to estimate the near - term effects of changing interest rates on its net interest income • Net interest income simulation involves projecting net interest income under a variety of scenarios, which include varying the level of interest rates and shifts in the shape of the yield curve • Management exercises its best judgment in making assumptions regarding events that management can influence, such as non - contractual deposit re - pricings, and events outside management’s control, such as customer behavior on loan and deposit activity and the effect that competition has on both loan and deposit pricing. • The following table presents the anticipated effect on net interest income over a twelve month period if short - and long - term interest rates were to sustain an immediate decrease of 100 basis points or 200 basis points, or an immediate increase of 100 basis points or 200 basis points : • As of March 31, 2020, 48.8% of the Company’s earning asset balances will reprice or are expected to pay down in the next twelve months , and 42.3% of the Company’s deposit balances are low cost or no cost deposits Note: Financial data as of March 31, 2020 Annual Dollar Annual Percent Change in Net Change in Net Interest Income Interest Income Rate Shock ($000) (%) + 200 bp $1,841 1.3% + 100 bp $1,382 1.0% - 100 bp N/A N/A - 200 bp N/A N/A
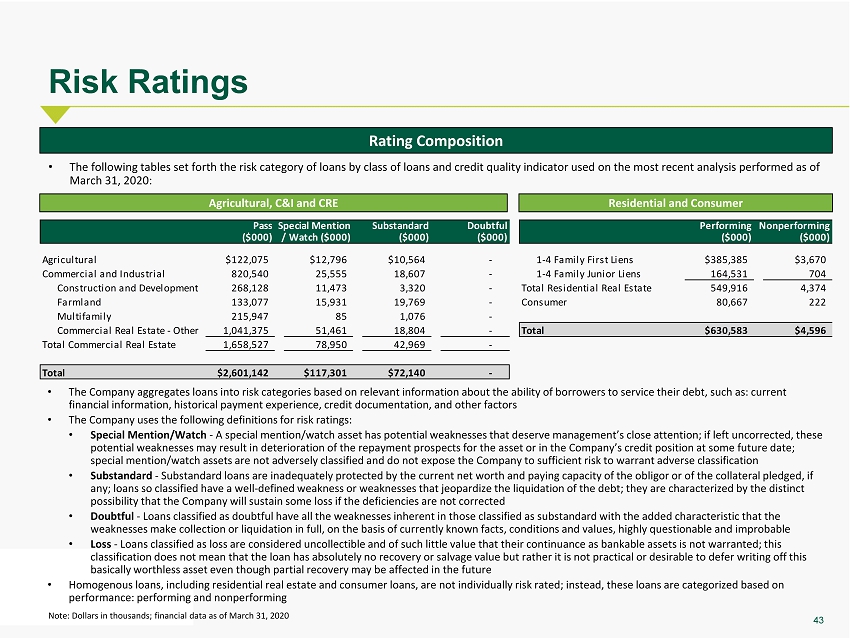
43 Risk Ratings Note: Dollars in thousands; financial data as of March 31, 2020 Rating Composition • The Company aggregates loans into risk categories based on relevant information about the ability of borrowers to service the ir debt , such as: current financial information, historical payment experience, credit documentation, and other factors • The Company uses the following definitions for risk ratings: • Special Mention/Watch - A special mention/watch asset has potential weaknesses that deserve management’s close attention; if left uncorrected , these potential weaknesses may result in deterioration of the repayment prospects for the asset or in the Company’s credit position at some future date; special mention/watch assets are not adversely classified and do not expose the Company to sufficient risk to warrant adverse classification • Substandard - Substandard loans are inadequately protected by the current net worth and paying capacity of the obligor or of the collateral pledged, if any; l oans so classified have a well - defined weakness or weaknesses that jeopardize the liquidation of the debt ; t hey are characterized by the distinct possibility that the Company will sustain some loss if the deficiencies are not corrected • Doubtful - Loans classified as doubtful have all the weaknesses inherent in those classified as substandard with the added characteristic that the weaknesses make collection or liquidation in full, on the basis of currently known facts, conditions and values, highly questionable and improbable • Loss - Loans classified as loss are considered uncollectible and of such little value that their continuance as bankable assets is not warranted; this classification does not mean that the loan has absolutely no recovery or salvage value but rather it is not practical or desirable to defer writing off this basically worthless asset even though partial recovery may be affected in the future • Homogenous loans, including residential real estate and consumer loans, are not individually risk rated; instead , these loans are categorized based on performance: performing and nonperforming • The following tables set forth the risk category of loans by class of loans and credit quality indicator used on the most recent analysis performed as of March 31, 2020: PassSpecial Mention Substandard Doubtful Performing Nonperforming($000) / Watch ($000) ($000) ($000) ($000) ($000) Agricultural $122,075 $12,796 $10,564 - 1-4 Family First Liens $385,385 $3,670 Commercial and Industrial 820,540 25,555 18,607 - 1-4 Family Junior Liens 164,531 704 Construction and Development 268,128 11,473 3,320 - Total Residential Real Estate 549,916 4,374 Farmland 133,077 15,931 19,769 - Consumer 80,667 222 Multifamily 215,947 85 1,076 - Commercial Real Estate - Other 1,041,375 51,461 18,804 - Total $630,583 $4,596 Total Commercial Real Estate 1,658,527 78,950 42,969 - Total $2,601,142 $117,301 $72,140 - Agricultural, C&I and CRE Residential and Consumer
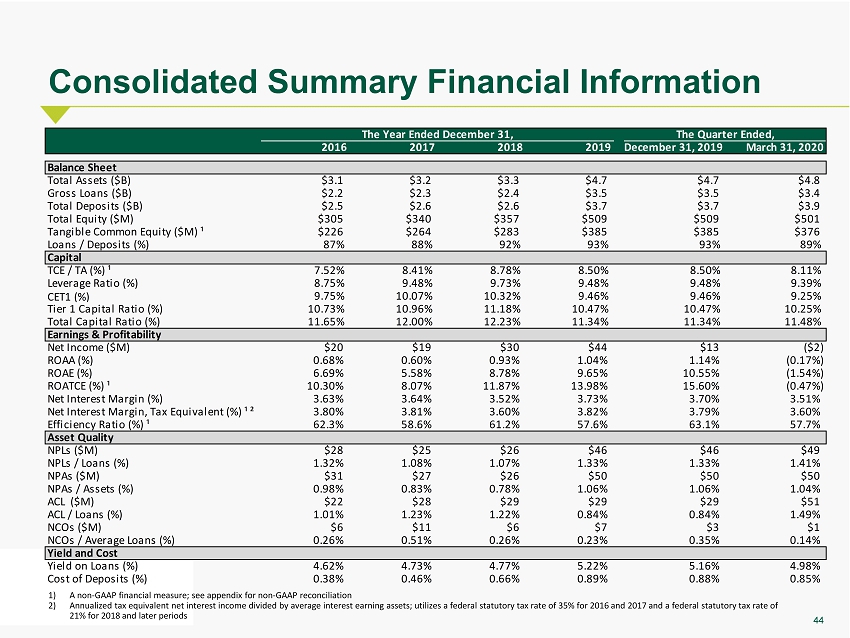
44 2016 2017 2018 2019 December 31, 2019 March 31, 2020 Balance Sheet Total Assets ($B) $3.1 $3.2 $3.3 $4.7 $4.7 $4.8 Gross Loans ($B) $2.2 $2.3 $2.4 $3.5 $3.5 $3.4 Total Deposits ($B) $2.5 $2.6 $2.6 $3.7 $3.7 $3.9 Total Equity ($M) $305 $340 $357 $509 $509 $501 Tangible Common Equity ($M) ¹ $226 $264 $283 $385 $385 $376 Loans / Deposits (%) 87% 88% 92% 93% 93% 89% Capital TCE / TA (%) ¹ 7.52% 8.41% 8.78% 8.50% 8.50% 8.11% Leverage Ratio (%) 8.75% 9.48% 9.73% 9.48% 9.48% 9.39% CET1 (%) 9.75% 10.07% 10.32% 9.46% 9.46% 9.25% Tier 1 Capital Ratio (%) 10.73% 10.96% 11.18% 10.47% 10.47% 10.25% Total Capital Ratio (%) 11.65% 12.00% 12.23% 11.34% 11.34% 11.48% Earnings & Profitability Net Income ($M) $20 $19 $30 $44 $13 ($2) ROAA (%) 0.68% 0.60% 0.93% 1.04% 1.14% (0.17%) ROAE (%) 6.69% 5.58% 8.78% 9.65% 10.55% (1.54%) ROATCE (%) ¹ 10.30% 8.07% 11.87% 13.98% 15.60% (0.47%) Net Interest Margin (%) 3.63% 3.64% 3.52% 3.73% 3.70% 3.51% Net Interest Margin, Tax Equivalent (%) ¹ ² 3.80% 3.81% 3.60% 3.82% 3.79% 3.60% Efficiency Ratio (%) ¹ 62.3% 58.6% 61.2% 57.6% 63.1% 57.7% Asset Quality NPLs ($M) $28 $25 $26 $46 $46 $49 NPLs / Loans (%) 1.32% 1.08% 1.07% 1.33% 1.33% 1.41% NPAs ($M) $31 $27 $26 $50 $50 $50 NPAs / Assets (%) 0.98% 0.83% 0.78% 1.06% 1.06% 1.04% ACL ($M) $22 $28 $29 $29 $29 $51 ACL / Loans (%) 1.01% 1.23% 1.22% 0.84% 0.84% 1.49% NCOs ($M) $6 $11 $6 $7 $3 $1 NCOs / Average Loans (%) 0.26% 0.51% 0.26% 0.23% 0.35% 0.14% Yield and Cost Yield on Loans (%) 4.62% 4.73% 4.77% 5.22% 5.16% 4.98% Cost of Deposits (%) 0.38% 0.46% 0.66% 0.89% 0.88% 0.85% The Year Ended December 31, The Quarter Ended,Consolidated Summary Financial Information 1) A non - GAAP financial measure; see appendix for non - GAAP reconciliation 2) Annualized tax equivalent net interest income divided by average interest earning assets; utilizes a federal statutory tax ra te of 35% for 2016 and 2017 and a federal statutory tax rate of 21% for 2018 and later periods
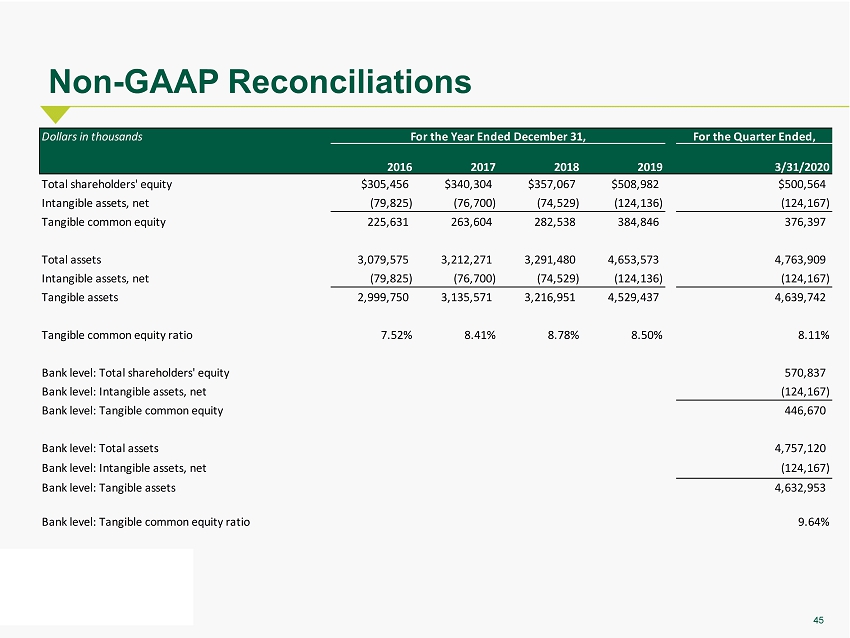
45 Non - GAAP Reconciliations Dollars in thousands For the Year Ended December 31, For the Quarter Ended, 2016 2017 2018 2019 3/31/2020 Total shareholders' equity $305,456 $340,304 $357,067 $508,982 $500,564 Intangible assets, net (79,825) (76,700) (74,529) (124,136) (124,167) Tangible common equity 225,631 263,604 282,538 384,846 376,397 Total assets 3,079,575 3,212,271 3,291,480 4,653,573 4,763,909 Intangible assets, net (79,825) (76,700) (74,529) (124,136) (124,167) Tangible assets 2,999,750 3,135,571 3,216,951 4,529,437 4,639,742 Tangible common equity ratio 7.52% 8.41% 8.78% 8.50% 8.11% Bank level: Total shareholders' equity 570,837 Bank level: Intangible assets, net (124,167) Bank level: Tangible common equity 446,670 Bank level: Total assets 4,757,120 Bank level: Intangible assets, net (124,167) Bank level: Tangible assets 4,632,953 Bank level: Tangible common equity ratio 9.64%
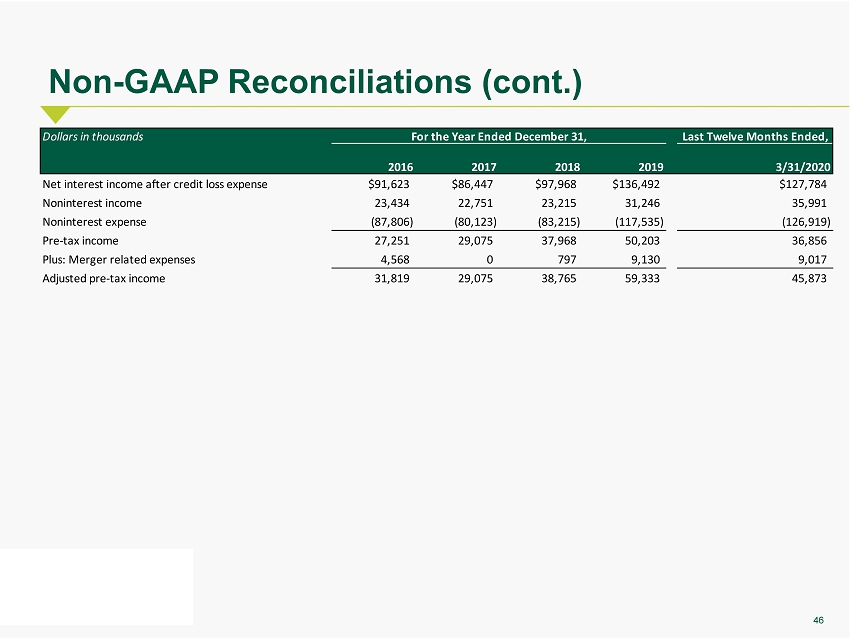
46 Non - GAAP Reconciliations (cont.) Dollars in thousands For the Year Ended December 31, Last Twelve Months Ended, 2016 2017 2018 2019 3/31/2020 Net interest income after credit loss expense $91,623 $86,447 $97,968 $136,492 $127,784 Noninterest income 23,434 22,751 23,215 31,246 35,991 Noninterest expense (87,806) (80,123) (83,215) (117,535) (126,919) Pre-tax income 27,251 29,075 37,968 50,203 36,856 Plus: Merger related expenses 4,568 0 797 9,130 9,017 Adjusted pre-tax income 31,819 29,075 38,765 59,333 45,873
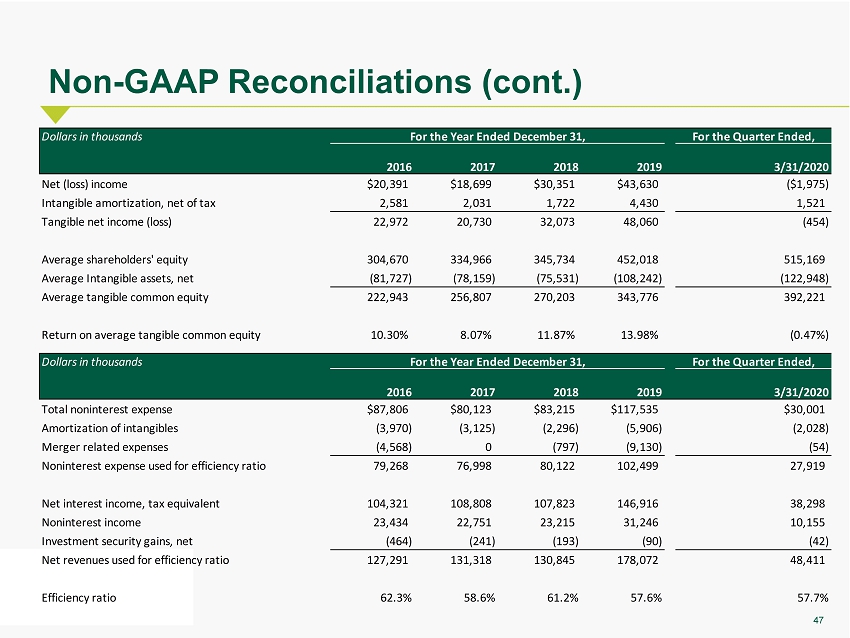
47 Non - GAAP Reconciliations (cont.) Dollars in thousands For the Year Ended December 31, For the Quarter Ended, 2016 2017 2018 2019 3/31/2020 Net (loss) income $20,391 $18,699 $30,351 $43,630 ($1,975) Intangible amortization, net of tax 2,581 2,031 1,722 4,430 1,521 Tangible net income (loss) 22,972 20,730 32,073 48,060 (454) Average shareholders' equity 304,670 334,966 345,734 452,018 515,169 Average Intangible assets, net (81,727) (78,159) (75,531) (108,242) (122,948) Average tangible common equity 222,943 256,807 270,203 343,776 392,221 Return on average tangible common equity 10.30% 8.07% 11.87% 13.98% (0.47%) Dollars in thousands For the Year Ended December 31, For the Quarter Ended, 2016 2017 2018 2019 3/31/2020 Total noninterest expense $87,806 $80,123 $83,215 $117,535 $30,001 Amortization of intangibles (3,970) (3,125) (2,296) (5,906) (2,028) Merger related expenses (4,568) 0 (797) (9,130) (54) Noninterest expense used for efficiency ratio 79,268 76,998 80,122 102,499 27,919 Net interest income, tax equivalent 104,321 108,808 107,823 146,916 38,298 Noninterest income 23,434 22,751 23,215 31,246 10,155 Investment security gains, net (464) (241) (193) (90) (42) Net revenues used for efficiency ratio 127,291 131,318 130,845 178,072 48,411 Efficiency ratio 62.3% 58.6% 61.2% 57.6% 57.7%
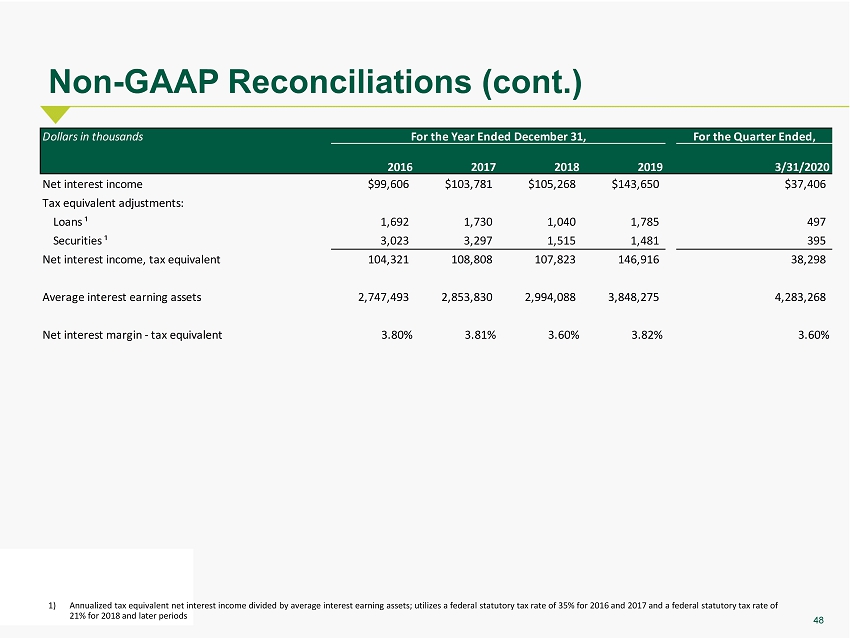
48 Non - GAAP Reconciliations (cont.) 1) Annualized tax equivalent net interest income divided by average interest earning assets ; utilizes a federal statutory tax rate of 35% for 2016 and 2017 and a federal statutory tax rate of 21% for 2018 and later periods Dollars in thousands For the Year Ended December 31, For the Quarter Ended, 2016 2017 2018 2019 3/31/2020 Net interest income $99,606 $103,781 $105,268 $143,650 $37,406 Tax equivalent adjustments: Loans ¹ 1,692 1,730 1,040 1,785 497 Securities ¹ 3,023 3,297 1,515 1,481 395 Net interest income, tax equivalent 104,321 108,808 107,823 146,916 38,298 Average interest earning assets 2,747,493 2,853,830 2,994,088 3,848,275 4,283,268 Net interest margin - tax equivalent 3.80% 3.81% 3.60% 3.82% 3.60%

49 Non - GAAP Reconciliations (cont.) Dollars in thousands For the Quarter Ended, 3/31/2020 Net interest income $37,406 Noninterest income 10,155 Noninterest expense (30,001) Pre-tax pre-provision net revenue 17,560 Intangible amortization, net of tax 1,521 Pre-tax pre-provision net revenue used for return on tangible common equity 19,081 Average assets 4,669,724 PTPP ROAA 1.51% Average tangible common equity 392,221 PTPP ROATCE 19.57%
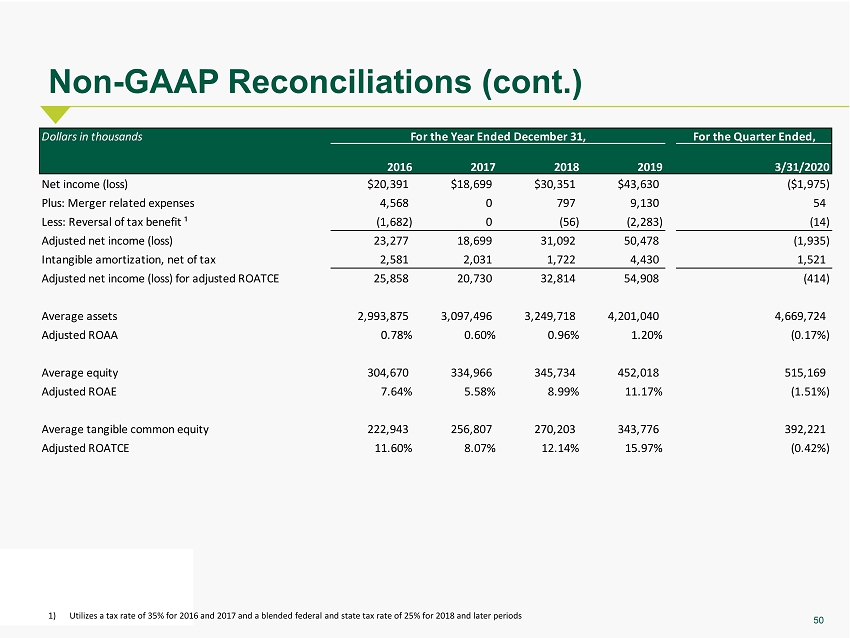
50 Non - GAAP Reconciliations (cont.) 1) Utilizes a tax rate of 35% for 2016 and 2017 and a blended federal and state tax rate of 25% for 2018 and later periods Dollars in thousands For the Year Ended December 31, For the Quarter Ended, 2016 2017 2018 2019 3/31/2020 Net income (loss) $20,391 $18,699 $30,351 $43,630 ($1,975) Plus: Merger related expenses 4,568 0 797 9,130 54 Less: Reversal of tax benefit ¹ (1,682) 0 (56) (2,283) (14) Adjusted net income (loss) 23,277 18,699 31,092 50,478 (1,935) Intangible amortization, net of tax 2,581 2,031 1,722 4,430 1,521 Adjusted net income (loss) for adjusted ROATCE 25,858 20,730 32,814 54,908 (414) Average assets 2,993,875 3,097,496 3,249,718 4,201,040 4,669,724 Adjusted ROAA 0.78% 0.60% 0.96% 1.20% (0.17%) Average equity 304,670 334,966 345,734 452,018 515,169 Adjusted ROAE 7.64% 5.58% 8.99% 11.17% (1.51%) Average tangible common equity 222,943 256,807 270,203 343,776 392,221 Adjusted ROATCE 11.60% 8.07% 12.14% 15.97% (0.42%)