 Exhibit 99.1 |
 Total Assets: $1,534,783,000 (#6 in Iowa*) Bank Loans: $966,998,000 Loan Pools: $85,186,000 Total Loans: $1,052,184,000 Total Deposits: $1,179,868,000 As of 12/31/2009: Source: MOFG 10-K *Based on bank holding companies headquartered in Iowa |
 Source: SNL. Largest Iowa Bank Holding Companies: Company Name Total Assets ($000) 12/31/2009 Equity to Assets 12/31/2009 2009 ROAA Heartland Financial USA, Inc. (Dubuque Bank & Trust) $4,012,991 7.78% 0.17% BTC Financial Corporation (Banker’s Trust) $2,766,882 5.58% 0.27% Hills Bancorporation (Hills Bank & Trust) $1,830,626 9.54% 0.88% Stark Bank Group, Ltd. (First American Bank) $1,691,463 6.88% -0.32% West Bancorporation, Inc. (West Bank) $1,575,054 8.45% -0.90% MidWestOne Financial Group, Inc. (MidWestOne Bank) $1,534,783 9.92% 0.29% National Bancshares, Inc. (THE National Bank, Bettendorf) $1,272,914 9.50% -0.86% Northwest Financial Corp. (Northwest Bank, Spencer) $1,249,368 9.17% 0.53% Ida Grove Bancshares, Inc. (United Bank of Iowa) $1,094,269 8.16% 1.37% First Citizens Financial Corp. (First Citizens National Bank) $1,060,857 12.22% 1.13% Bank Iowa Corporation (Bank Iowa, West Des Moines) $1,051,492 6.43% -0.32% Average: 8.51% |
 Non-Performing Assets / Total Assets: Company Ticker NPA's & 90+ / Total Assets as of 12/31/2009 German American Bancorp (IN) GABC 0.90% *MOFG – Bank Loan Portfolio Only (IA) MOFG 1.21% Lakeland Financial Corp (IN) LKFN 1.23% First Financial Corp (IN) THFF 1.52% Horizon Bancorp (IN) HBNC 1.55% Hills Bancorporation (IA) HBIA 1.68% QCR Holdings, Inc (IL) QCRH 2.27% Enterprise Financial Services Corp (MO) EFSC 2.74% MutualFirst Financial, Inc. (IN) MFSF 2.86% West Bancorporation, Inc (IA) WTBA 3.36% BankFinancial Corp (IL) BFIN 4.04% Hawthorn Bancshares, Inc (MO) HWBK 4.11% Baylake Corp (WI) BYLK 4.18% NASB Financial, Inc (MO) NASB 4.75% Mercantile Bancorp (IL) MBR 4.83% CFS Bancorp, Inc (IN) CITZ 7.31% Centrue Financial Corporation (MO) TRUE 7.40% Waterstone Financial, Inc (WI) WSBF 9.04% Source: SNL Financial *Bank loan portfolio only; excludes loan pools Midwestern Peer Group |
 Net Charge-offs / Average Loans: Source: SNL Financial Company Ticker Net Charge Off /Avg Loans 2009 YTD German American Bancorp (IN) GABC 0.25% NASB Financial, Inc (MO) NASB 0.32% BankFinancial Corp (IL) BFIN 0.39% Lakeland Financial Corp (IN) LKFN 0.42% MutualFirst Financial, Inc. (IN) MFSF 0.47% *MOFG – Bank Loan Portfolio Only(IA) MOFG 0.48% First Financial Corp (IN) THFF 0.56% Hawthorn Bancshares, Inc (MO) HWBK 0.62% Hills Bancorporation (IA) HBIA 0.69% QCR Holdings, Inc (IL) QCRH 1.00% Horizon Bancorp (IN) HBNC 1.01% CFS Bancorp, Inc (IN) CITZ 1.15% Enterprise Financial Services Corp (MO) EFSC 1.42% Baylake Corp (WI) BYLK 1.50% Waterstone Financial, Inc (WI) WSBF 1.54% West Bancorporation, Inc (IA) WTBA 1.89% Mercantile Bancorp (IL) MBR 2.68% Centrue Financial Corporation (MO) TRUE 2.74% *Bank NCOsonly; excludes Loan Pools Midwestern Peer Group |
 Coverage of Non-performing Loans Source: SNL Financial Midwestern Peer Group *Bank Reserves and NPLs only; excludes Loan Pools Company Ticker Total Reserves / NPLs 12/31/2009 Hills Bancorporation (IA) HBIA 142.27% German American Bancorp (IN) GABC 126.91% Enterprise Financial Services Corp (MO) EFSC 111.56% Lakeland Financial Corp (IN) LKFN 105.10% *MOFG – Bank Loan Portfolio Only (IA) MOFG 100.56% Horizon Bancorp (IN) HBNC 89.09% West Bancorporation, Inc (IA) WTBA 77.31% QCR Holdings, Inc (IL) QCRH 76.86% First Financial Corp (IN) THFF 53.93% MutualFirst Financial, Inc. (IN) MFSF 50.38% Mercantile Bancorp (IL) MBR 43.10% Centrue Financial Corporation (MO) TRUE 41.32% Waterstone Financial, Inc (WI) WSBF 37.83% BankFinancial Corp (IL) BFIN 37.60% Baylake Corp (WI) BYLK 35.54% CFS Bancorp, Inc (IN) CITZ 32.98% Hawthorn Bancshares, Inc (MO) HWBK 30.30% |
 Profitability: Source: SNL Financial 2009 MOFG Earnings: $3,630,000 Company Ticker Return on Average Tangible Equity 2009 YTD Return on Average Assets 2009 YTD German American Bancorp (IN) GABC 13.16% 0.99% NASB Financial, Inc (MO) NASB 12.04% 1.22% Hills Bancorporation (IA) HBIA 11.20% 0.88% Lakeland Financial Corp (IN) LKFN 9.23% 0.78% Horizon Bancorp (IN) HBNC 9.01% 0.68% First Financial Corp (IN) THFF 8.01% 0.95% Baylake Corp (WI) BYLK 6.62% 0.41% Hawthorn Bancshares, Inc (MO) HWBK 5.05% 0.44% MidWestOne Financial Group, Inc (IA) MOFG 3.82% 0.29% MutualFirst Financial, Inc. (IN) MFSF 3.35% 0.23% QCR Holdings, Inc (IL) QCRH 1.71% 0.10% BankFinancial Corp (IL) BFIN 0.15% -0.05% CFS Bancorp, Inc (IN) CITZ -0.48% -0.05% West Bancorporation, Inc (IA) WTBA -4.37% -0.90% Waterstone Financial, Inc (WI) WSBF -6.12% -0.54% Enterprise Financial Services Corp (MO) EFSC -10.93% -2.43% Centrue Financial Corporation (MO) TRUE -28.82% -2.43% Mercantile Bancorp (IL) MBR -68.64% -3.29% Midwestern Peer Group |
 Key factors that affected 2009 earnings: Poor loan pool performance: 2009 Income: $1.8 million vs. $4.5 million in 2008 Loan loss provision: 2009 LLP: $7.7 million vs. $4.4 million in 2008 FDIC premiums: 2009 FDIC expense: $3.2 million vs. $595,000 in 2008 |
 * EPS excluding goodwill impairment at 12/31/08 ** Internal estimate of 2010 basic EPS: range of $0.70 - $1.00 per share Estimated 2010 Basic EPS $0.70 - $1.00 per share |
 #1 Problem % of Responses 1. Sales 34% 2. Taxes 23% 3. Gov’t Reqs/Red Tape 12% 4. Insurance 7% 5. Large Competitors 6% 6. Other 5% 7a. Cost of Labor 3% 7b. Inflation 3% 7c. Credit 3% NFIB: Credit Not The Major Concern for Small Businesses Source: NFIB Small Business Trends March 2010 |
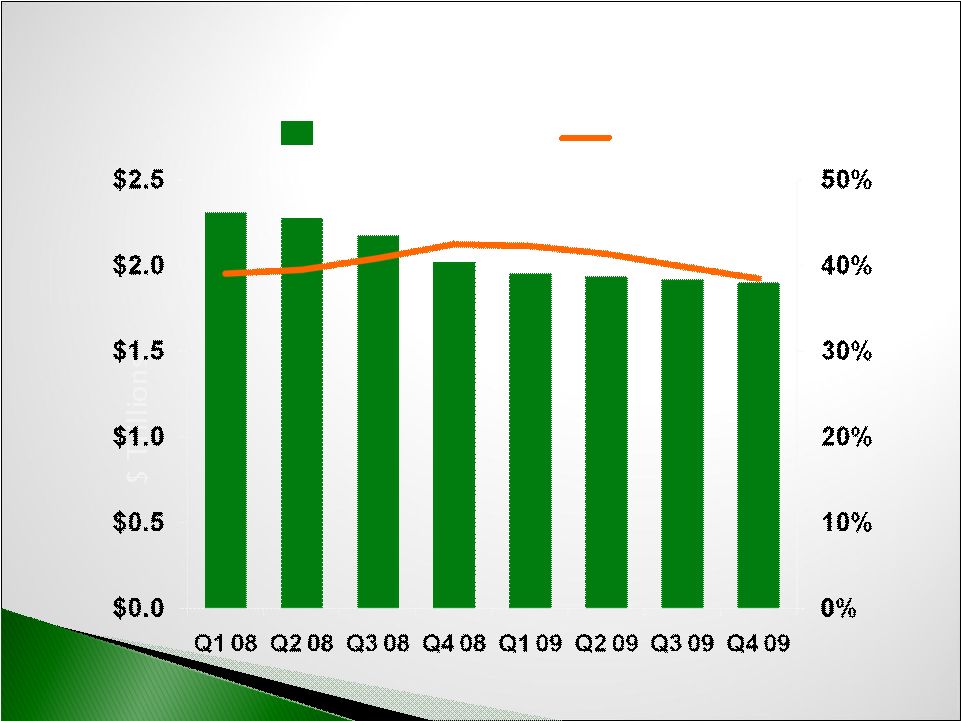 Business Line Utilization Unused Commitments Utilization Rate Source: FDIC |
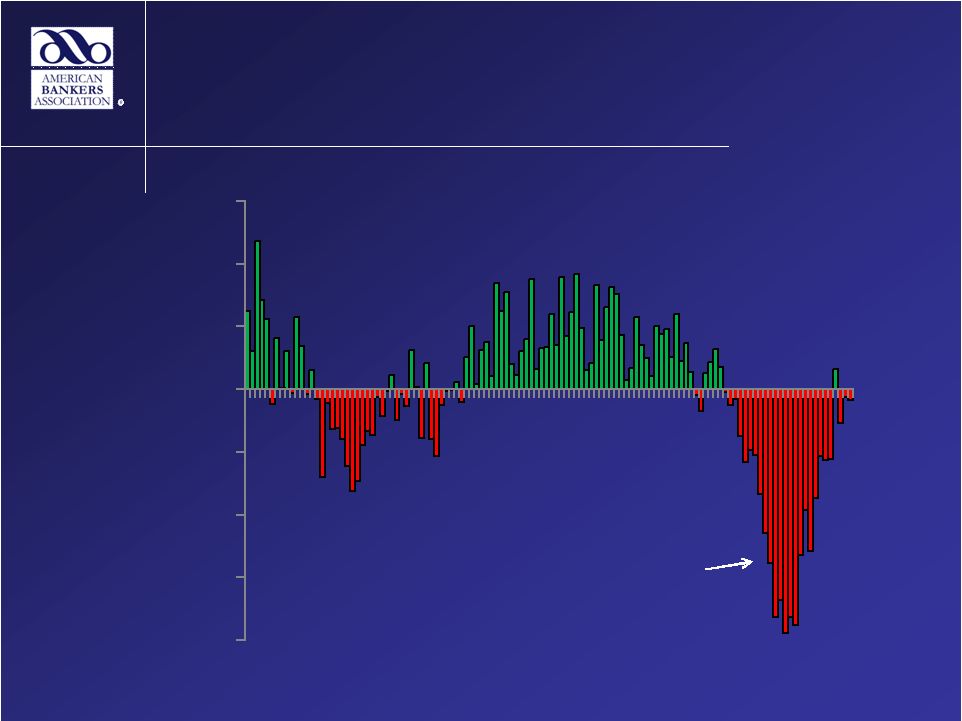 Consumer Delinquencies & Job Losses Job Losses Job Losses (# 000s) Source: Bureau of Labor Statistics & American Bankers Association - -800 -600 -400 -200 0 200 400 600 2000 2002 2004 2006 2008 |
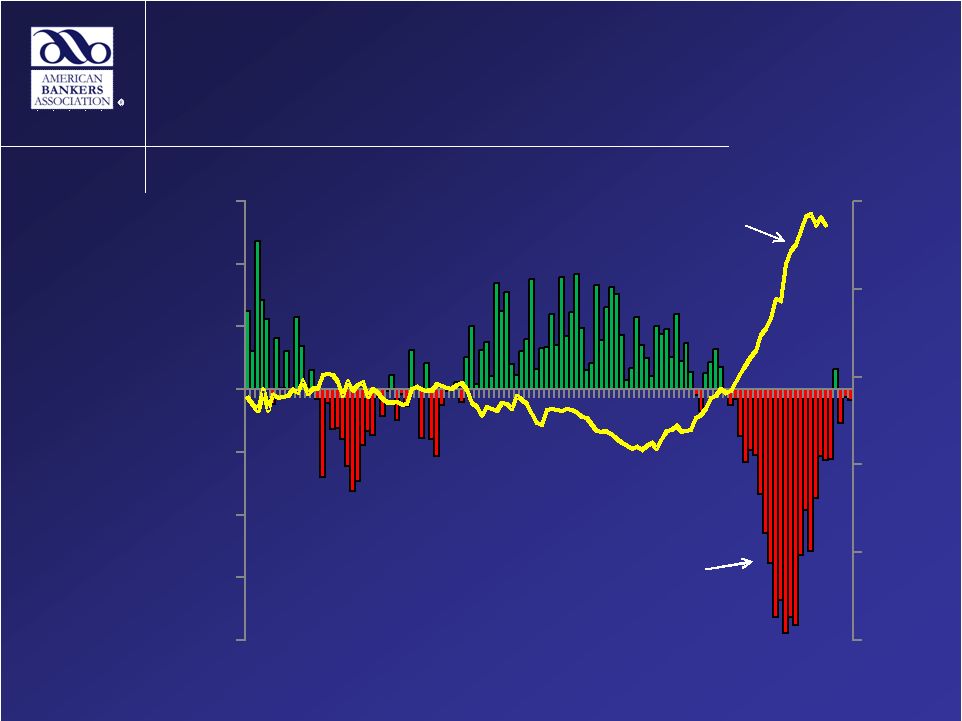 Consumer Delinquencies & Job Losses % of Composite Balances Delinquent ($) Job Losses Job Losses (# 000s) -1% 0% 1% 2% 3% 4% -800 -600 -400 -200 0 200 400 600 2000 2002 2004 2006 2008 Source: Bureau of Labor Statistics & American Bankers Association |
 |
 Prolonged Unemployment = Prolonged CRE Loss Curve Projection Analysis – Estimated CRE Loss Curve Source: Federal Reserve, FDIC . 4.0 5.0 6.0 7.0 8.0 9.0 10.0 11.0 12.0 - 3.0 6.0 9.0 12.0 15.0 18.0 21.0 24.0 Unemployment Rate SCAP "More Adverse" Cum. Losses KBW "Regression-Implied" Cum. Losses |
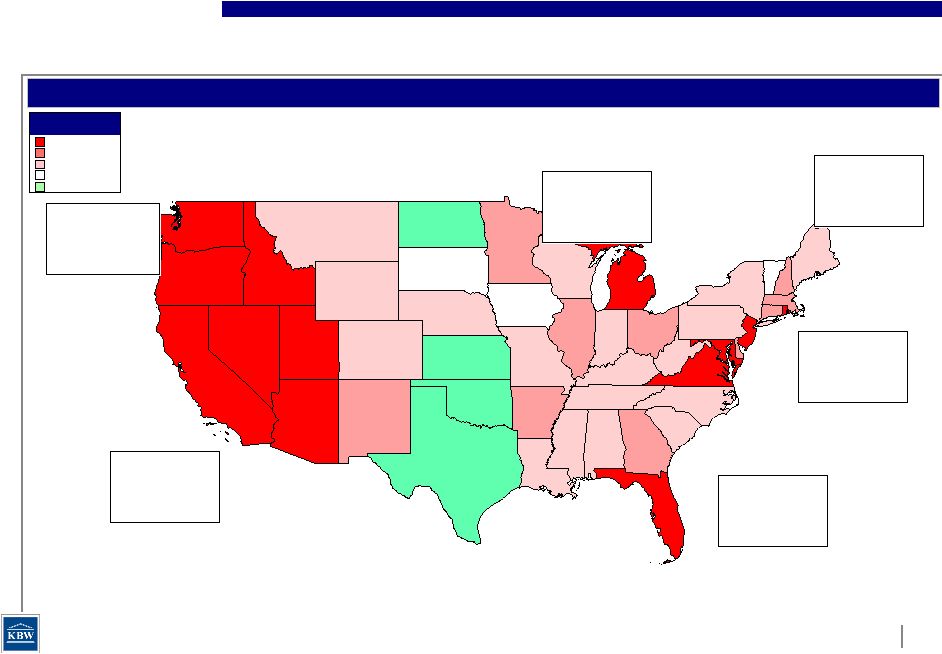 Source: Office of Federal Housing Enterprise Oversight, RealtyTrac and MapInfo. * Annualized Home Price Decline By State (%) > (10.0) (10.0) - (5.0) (5.0) - (0.5) (0.5) - 0.5 0.5 - 2.0 Property Value Depreciation and Foreclosures NY VT VA MD NV IL MA NC MN ID CA KY LA AL AR AZ CO CT DE FL GA IA IN KS ME MI MO MS MT ND NE NH NJ NM OH OK OR PA RI SC SD TN TX UT WI WV WY WA Region: West Median % Change: (13.15) Worst States: NV (41.24) CA (27.30) Best States: WY (2.40) MT (4.14) Region: Southwest Median % Change: (1.95) Worst States UT (14.72) NM (5.87) Best States: OK 1.02 TX 0.74 Region: Southeast Median % Change: (4.11) Worst States FL (29.87) VA (10.23) Best States: WV (3.16) AL (3.63) Region: Midwest Median % Change: (3.85) Worst States MI (11.96) IL (7.75) Best States: ND 2.67 SD 0.40 Region: Mid-Atlantic Median % Change: (8.78) Worst States MD (14.13) DE (8.78) Best States: PA (4.44) NJ (10.16) Region: New England Median % Change: (6.96) Worst States RI (11.51) NH (8.29) Best States: VT (0.08) ME (4.58) Home Price Decline Q4 2007 – Q3 2009 |
 Property Value Depreciation and Foreclosures NY VT VA MD NV IL MA NC MN ID CA KY LA AL AR AZ CO CT DE FL GA IA IN KS ME MI MO MS MT ND NE NH NJ NM OH OK OR PA RI SC SD TN TX UT WI WV WY WA Foreclosure Rate By State (%) > 2.50 1.25 - 2.50 .75 - 1.25 .50 - .75 0 - .50 Region: West Median Rate: 3.34 Highest Foreclosure Rates: NV 17.39 AZ 7.55 CA 7.55 Region: Southwest Median Rate: 1.25 Highest Foreclosure Rates: UT 4.12 CO 3.05 TX 1.27 Region: Midwest Median Rate: 1.19 Highest Foreclosure Rates: MI 3.28 IL 2.84 OH 2.34 Region: Southeast Median Rate: 1.55 Highest Foreclosure Rates: FL 7.14 GA 3.36 VA 2.04 Region: Mid-Atlantic Median Rate: 1.03 Highest Foreclosure Rates: MD 2.55 NJ 2.07 PA 1.03 Region: New England Median Rate: 1.34 Highest Foreclosure Rates: MA 1.86 CT 1.42 NH 1.31 Q3 2009 Foreclosure Rate* Source: Office of Federal Housing Enterprise Oversight, RealtyTrac and MapInfo. * Annualized |
 Bank Failures Since January 1, 2008 Source: SNL Financial, FDIC and MapInfo As of 1/8/2010. # of Bank Failures > 5 3 - 5 1 - 2 0 $ in millions NY VT VA MD NV IL MA NC MN ID CA KY LA AL AR AZ CO CT DE FL GA IA IN KS ME MI MO MS MT ND NE NH NJ NM OH OK OR PA RI SC SD TN TX UT WI WV WY WA Region: West Number of Failures: 42 Assets of Failed Banks: $400,490 Top Problem States' Failures: CA 22 NV 6 AZ 5 Region: Southwest Number of Failures: 14 Assets of Failed Banks: $22,603 Top Problem States' Failures: TX 8 UT 3 CO 2 Region: Southeast Number of Failures: 53 Assets of Failed Banks: $66,835 Top Problem States' Failures: GA 30 FL 16 Region: Mid-Atlantic Number of Failures: 6 Assets of Failed Banks: $1,098 Top Problem States' Failures: MD 2 NJ 2 PA 1 Region: New England Number of Failures: 0 Assets of Failed Banks: $0 Top Problem States' Failures: NA Region: Midwest Number of Failures: 51 Assets of Failed Banks: $35,244 Top Problem States' Failures: IL 22 MN 7 MI 5 |
 Source: Federal Deposit Insurance Corporation. Bank & Thrift Failures since 1990 Historical Bank & Thrift Failures 0 50 100 150 200 250 300 350 400 450 1990 1991 1992 1993 1994 1995 1996 1997 1998 1999 2000 2001 2002 2003 2004 2005 2006 2007 2008 2009 2010 0 50 100 150 200 250 300 350 400 450 Bank and thrift failures remain well below those levels seen in the early 1990s, though they are on the rise, with the number of failures in 2009 (140) more than five times full-year 2008 failures (25) Aggregate Assets ($B) Number of Failures |
 |
 1. Collect more deposits and make more good loans 2. Better loan pool performance 3. Work as One team 4. Become more efficient 5. How will regulatory reform affect our long term business model? |
 1. Take care of our customers … and those who should be. 2. Hire and retain excellent employees. 3. Always conduct yourself with the utmost integrity. 4. Work as one team. 5. Learn constantly so we can continually improve. |
 |
 |