Exhibit 99.1
|

Exhibit 99.1
Investor Presentation Chicago & Milwaukee May 12, 2010
MidWestOne Financial Group, Inc.
102 South Clinton Street Iowa City, Iowa 52240 319.356.5800 www.MidWestOne.com
|
Forward-Looking Statements
This presentation contains forward-looking statements relating to the financial condition, results of operations and business of MidWestOne Financial Group, Inc. Forward-looking statements generally include words such as believes, expects, anticipates and other similar expressions. Actual results could differ materially from those indicated. Among the important factors that could cause actual results to differ materially are interest rates, changes in the mix of the business, competitive pressures, general economic conditions and the risk factors detailed in the company’ speriodic reports and registration statements filed with the Securities and Exchange Commission. MidWestOne Financial Group, Inc. undertakes no obligation to publicly revise or update these forward-looking statements to reflect events or circumstances after the date of this presentation.
2
|
MidWestOne Overview
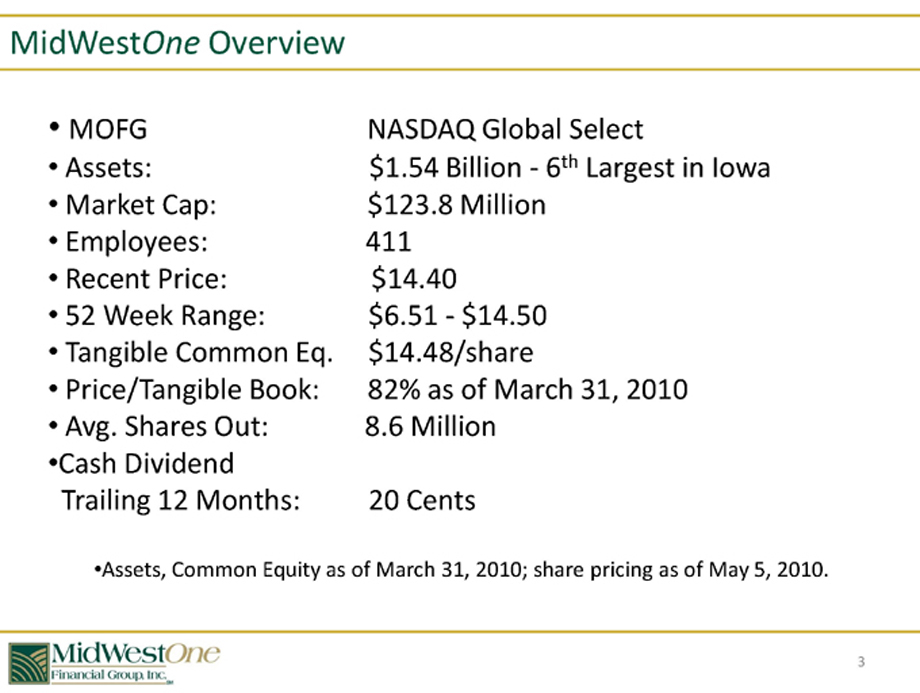
MOFG NASDAQ Global Select
Assets: $1.54 Billion - 6th Largest in Iowa
Market Cap: $123.8 Million
Employees: 411
Recent Price: $14.40
52 Week Range: $6.51 -$14.50
Tangible Common Eq. $14.48/share
Price/Tangible Book: 82% as of March 31, 2010
Avg. Shares Out: 8.6 Million
Cash Dividend
Trailing 12 Months: 20 Cents
Assets, Common Equity as of March 31, 2010; share pricing as of May 5, 2010.
3 |
|
|
The MidWestOne Footprint
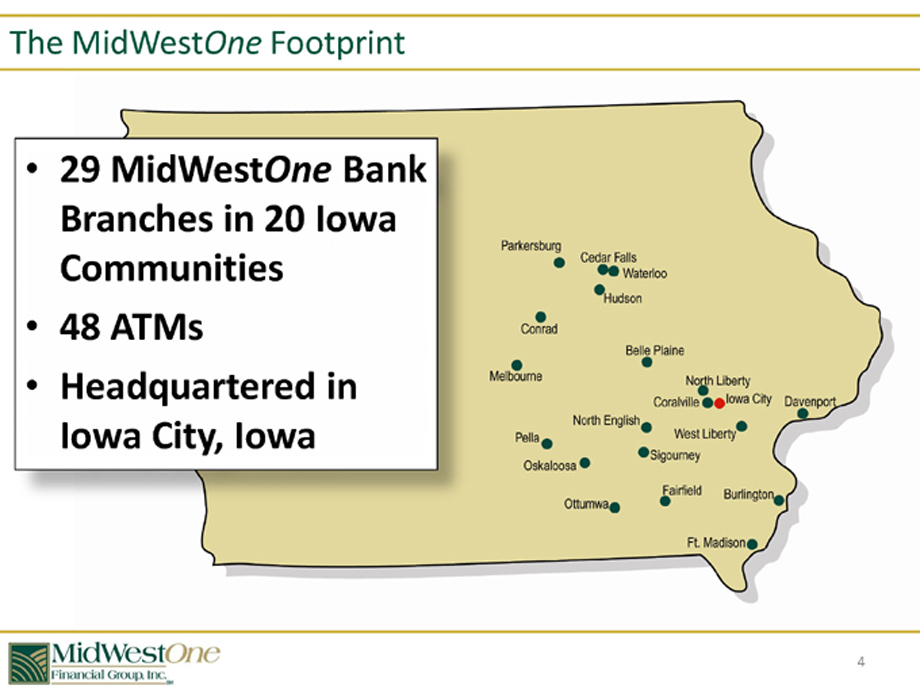
29 MidWestOne Bank Branches in 20 Iowa Communities
48 ATMs
Headquartered in Iowa City, Iowa
4 |
|
|

The Iowa Market
Stable to growing
Certain markets growing faster •Good demographics •Well educated
Good average income levels in primary markets •Comparatively low unemployment •Over banked
Consolidation due
5
Markets
Market Market Deposits Share Rank/ Branches Population est.: Income change
Market in Market 2009-2014 % 2009-2014 %
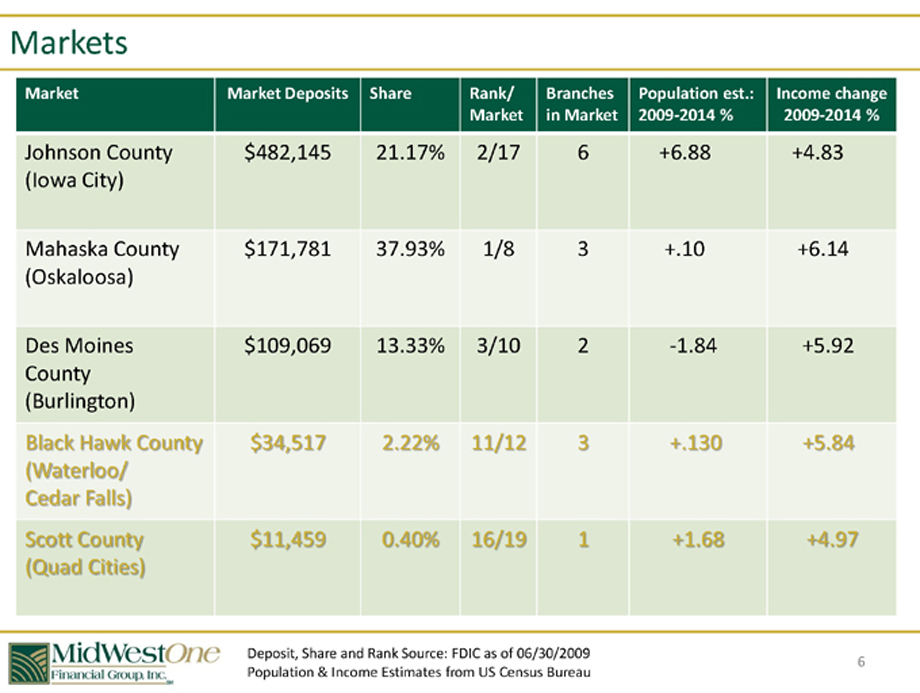
Johnson County $482,145 21.17% 2/17 6 +6.88 +4.83
(Iowa City)
Mahaska County $171,781 37.93% 1/8 3 +.10 +6.14
(Oskaloosa)
Des Moines $109,069 13.33% 3/10 2 -1.84 +5.92
County
(Burlington)
Black Hawk County $34,517 2.22% 11/12 3 +.130 +5.84
(Waterloo/
Cedar Falls)
Scott County $11,459 0.40% 16/19 1 +1.68 +4.97
(Quad Cities)
Deposit, Share and Rank Source: FDIC as of 06/30/2009
6 Population & Income Estimates from US Census Bureau
|
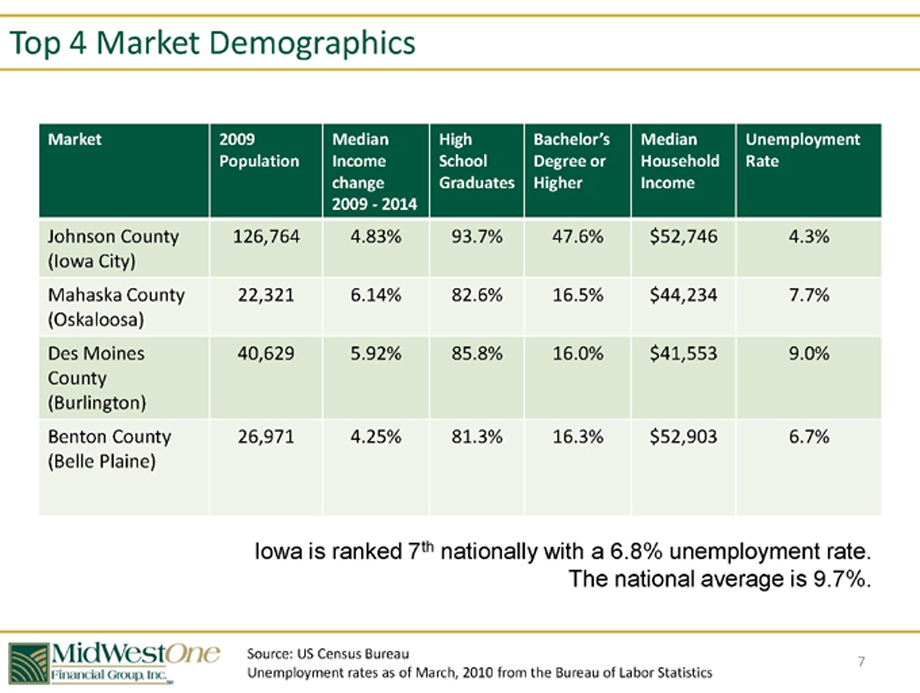
Top 4 Market Demographics
Market 2009 Median High Bachelor’sMedian Unemployment
Population Income School Degree or Household Rate
change Graduates Higher Income
2009—2014
Johnson County 126,764 4.83% 93.7% 47.6% $52,746 4.3%
(Iowa City)
Mahaska County 22,321 6.14% 82.6% 16.5% $44,234 7.7%
(Oskaloosa)
Des Moines 40,629 5.92% 85.8% 16.0% $41,553 9.0%
County
(Burlington)
Benton County 26,971 4.25% 81.3% 16.3% $52,903 6.7%
(Belle Plaine)
Iowa is ranked 7th nationally with a 6.8% unemployment rate.
The national average is 9.7%.
Source: US Census Bureau
Unemployment rates as of March, 2010 from the Bureau of Labor Statistics
7
|
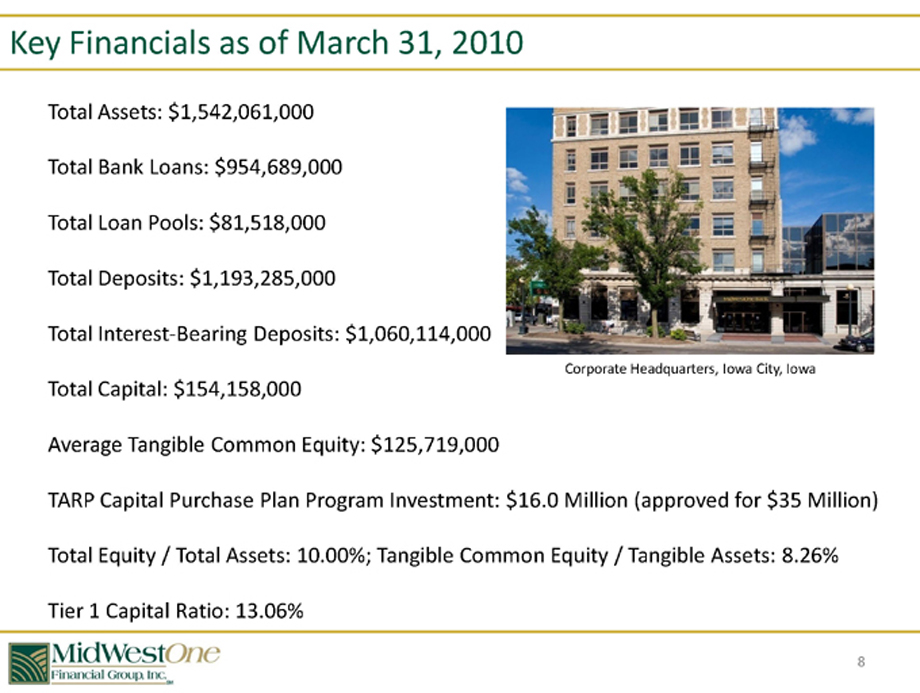
Key Financials as of March 31, 2010
Total Assets: $1,542,061,000 Total Bank Loans: $954,689,000 Total Loan Pools: $81,518,000 Total Deposits: $1,193,285,000
Total Interest-Bearing Deposits: $1,060,114,000
Corporate Headquarters, Iowa City, Iowa
Total Capital: $154,158,000
Average Tangible Common Equity: $125,719,000
TARP Capital Purchase Plan Program Investment: $16.0 Million (approved for $35 Million) Total Equity / Total Assets: 10.00%; Tangible Common Equity / Tangible Assets: 8.26% Tier 1 Capital Ratio: 13.06%
8 |
|
|
Our Strategy
•Maintain strong, diverse balance sheet •Improve ROE, ROA and earnings •Increase market share in existing markets •Seek out new markets in our target area •Watch for acquisition opportunities in Iowa •Expand along Avenue of the Saints •Expand other services •Reward shareholders
9
|
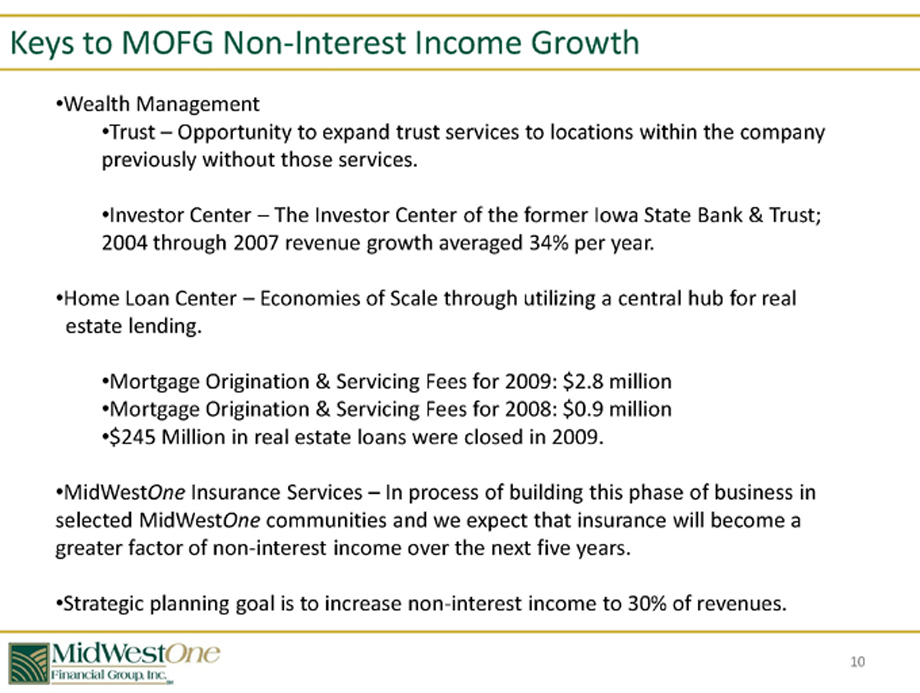
Keys to MOFG Non-Interest Income Growth
Wealth Management
Trust –Opportunity to expand trust services to locations within the company previously without those services.
Investor Center –The Investor Center of the former Iowa State Bank & Trust; 2004 through 2007 revenue growth averaged 34% per year.
Home Loan Center –Economies of Scale through utilizing a central hub for real estate lending.
Mortgage Origination & Servicing Fees for 2009: $2.8 million •Mortgage Origination & Servicing Fees for 2008: $0.9 million •$245 Million in real estate loans were closed in 2009.
MidWestOne Insurance Services –In process of building this phase of business in selected MidWestOne communities and we expect that insurance will become a greater factor of non-interest income over the next five years.
Strategic planning goal is to increase non-interest income to 30% of revenues.
10
|
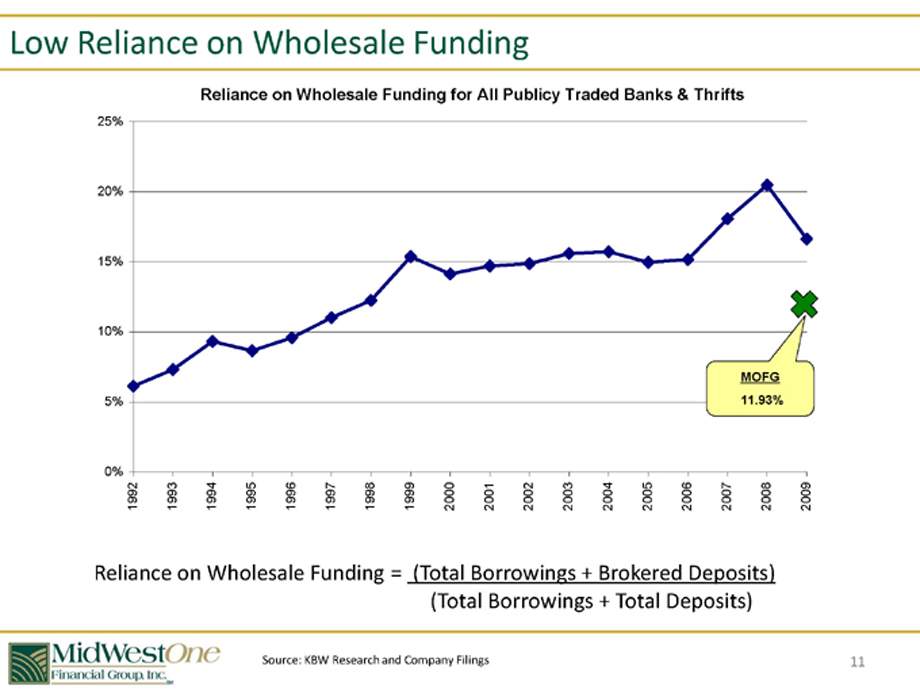
Low Reliance on Wholesale Funding
Reliance on Wholesale Funding for All Publicy Traded Banks & Thrifts
25% 20% 15%
10%
MOFG
5% 11.93%
0%
1992 1993 1994 1995 1996 1997 1998 1999 2000 2001 2002 2003 2004 2005 2006 2007 2008 2009
Reliance on Wholesale Funding = (Total Borrowings + Brokered Deposits) (Total Borrowings + Total Deposits)
Source: KBW Research and Company Filings
11
|
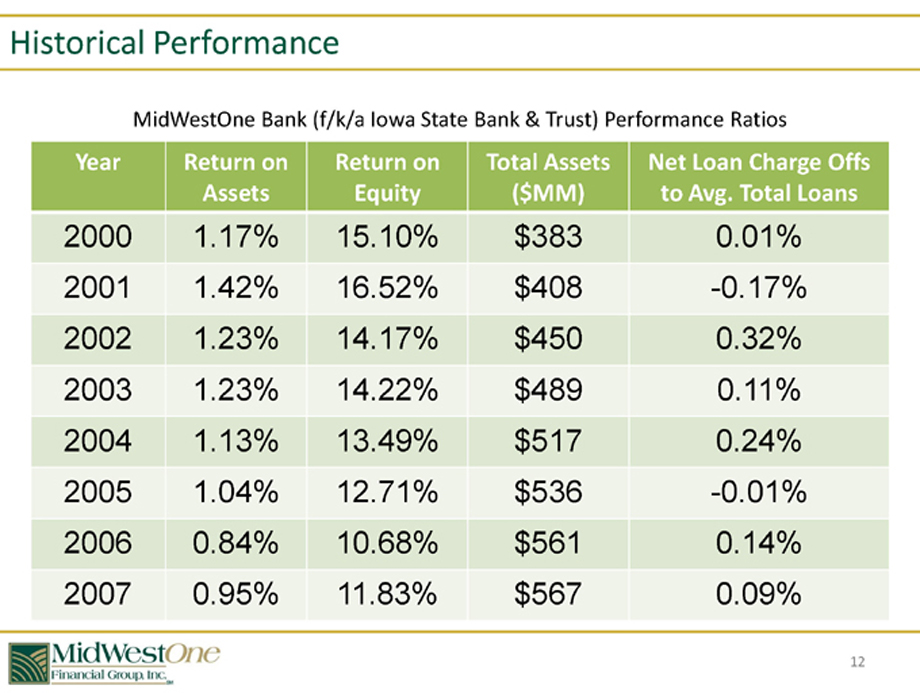
Historical Performance
MidWestOne Bank (f/k/a Iowa State Bank & Trust) Performance Ratios
Year Return on Return on Total Assets Net Loan Charge Offs
Assets Equity ($MM) to Avg. Total Loans
2000 1.17% 15.10% $383 0.01%
2001 1.42% 16.52% $408 -0.17%
2002 1.23% 14.17% $450 0.32%
2003 1.23% 14.22% $489 0.11%
2004 1.13% 13.49% $517 0.24%
2005 1.04% 12.71% $536 -0.01%
2006 0.84% 10.68% $561 0.14%
2007 0.95% 11.83% $567 0.09%
12
|
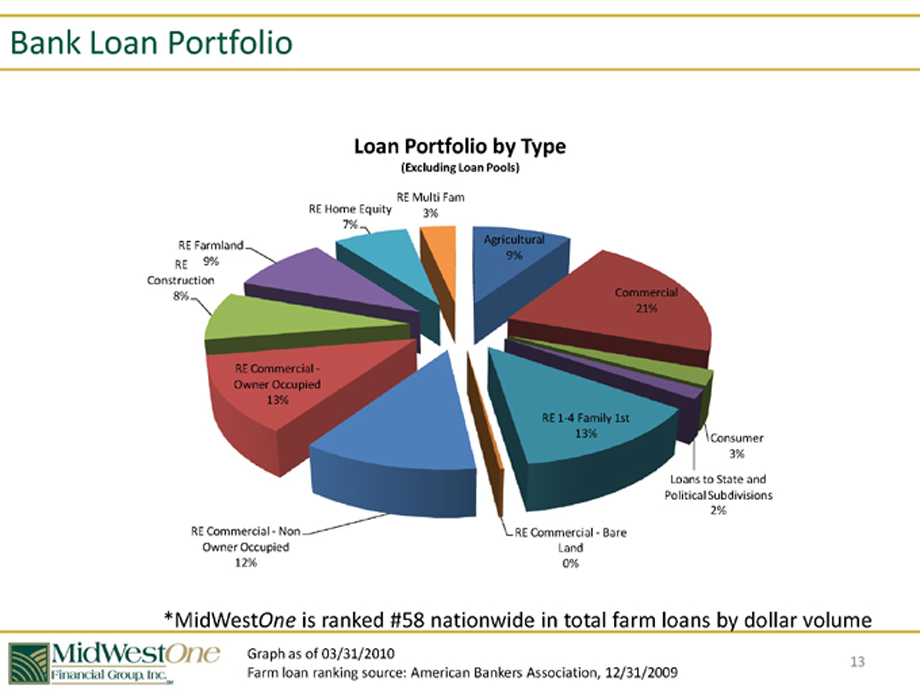
Bank Loan Portfolio
Loan Portfolio by Type
(Excluding Loan Pools)
RE Multi Fam RE Home Equity 3% 7%
Agricultural RE Farmland 9% RE 9% Construction
8% Commercial 21%
RE Commercial -Owner Occupied 13%
RE 1-4 Family 1st
13% Consumer 3%
Loans to State and Political Subdivisions 2% RE Commercial—Non RE Commercial—Bare Owner Occupied Land 12% 0%
*MidWestOne is ranked #58 nationwide in total farm loans by dollar volume
Graph as of 03/31/2010
13 Farm loan ranking source: American Bankers Association, 12/31/2009
|
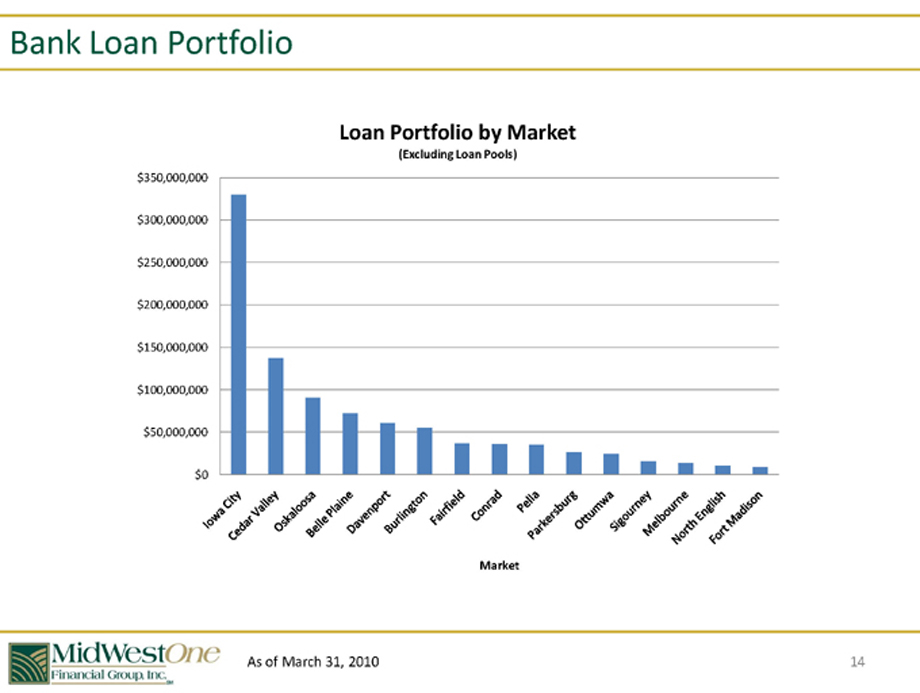
Bank Loan Portfolio
Loan Portfolio by Market
(Excluding Loan Pools)
$350,000,000
$300,000,000 $250,000,000 $200,000,000 $150,000,000 $100,000,000 $50,000,000 $0
Market
Iowa City
Cedar Valley
Oskaloosa
Bella Plaine
Davenport
Burlington
Fairfield
Conrad
Pella
Parkersburg
Ottumwa
Sigourney
Melbourne
North English
Fort Madison
As of March 31, 2010 14
|
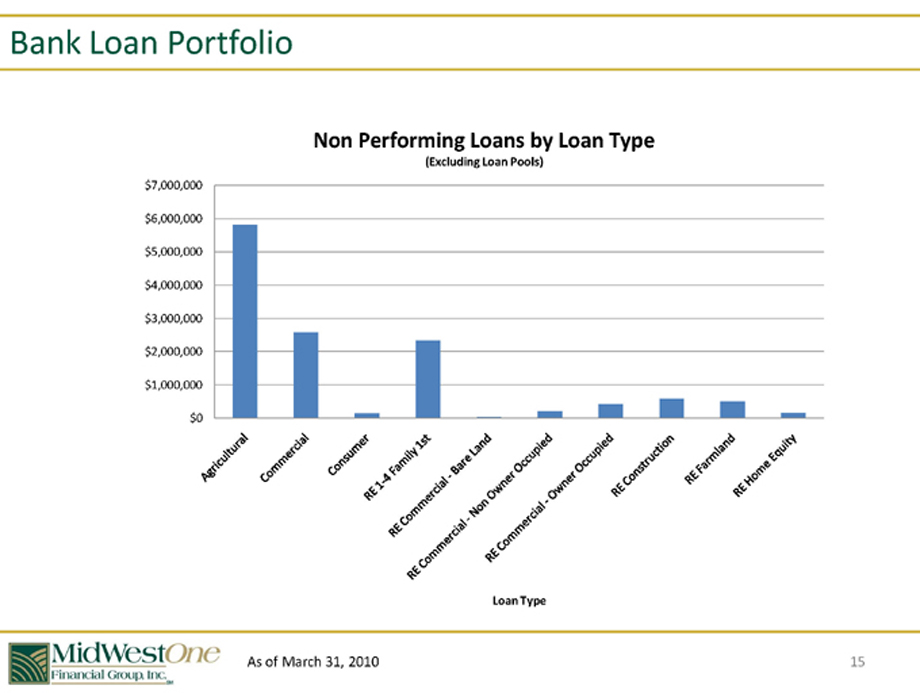
Bank Loan Portfolio
Non Performing Loans by Loan Type
(Excluding Loan Pools)
$7,000,000
$6,000,000 $5,000,000 $4,000,000 $3,000,000 $2,000,000 $1,000,000 $0
Agricultural
Commercial
Consumer
RE1-4 Family 1st
RE Commercial - Bare Land
RE Commercial - Non Owner Occupied
RE Commercial - Owner Occupied
RE Construction
RE Farmland
RE Home Equity
Loan Type
As of March 31, 2010
15
|
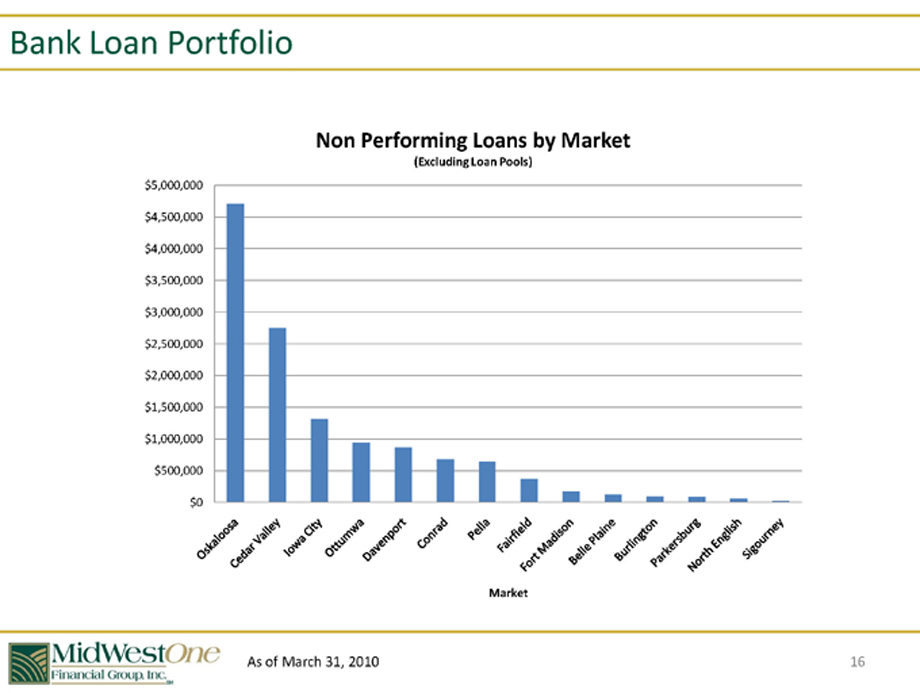
Bank Loan Portfolio
Non Performing Loans by Market
(Excluding Loan Pools)
$5,000,000
$4,500,000 $4,000,000 $3,500,000 $3,000,000 $2,500,000 $2,000,000 $1,500,000 $1,000,000 $500,000 $0
Market
Oskaloosa
Cedar Valley
Iowa City
Ottumwa
Davenport
Conrad
Pella
Fairfield
Fort Madison
Belle Plaine
Burlington
Parkersburg
North English
Sigourney
As of March 31, 2010
16
|
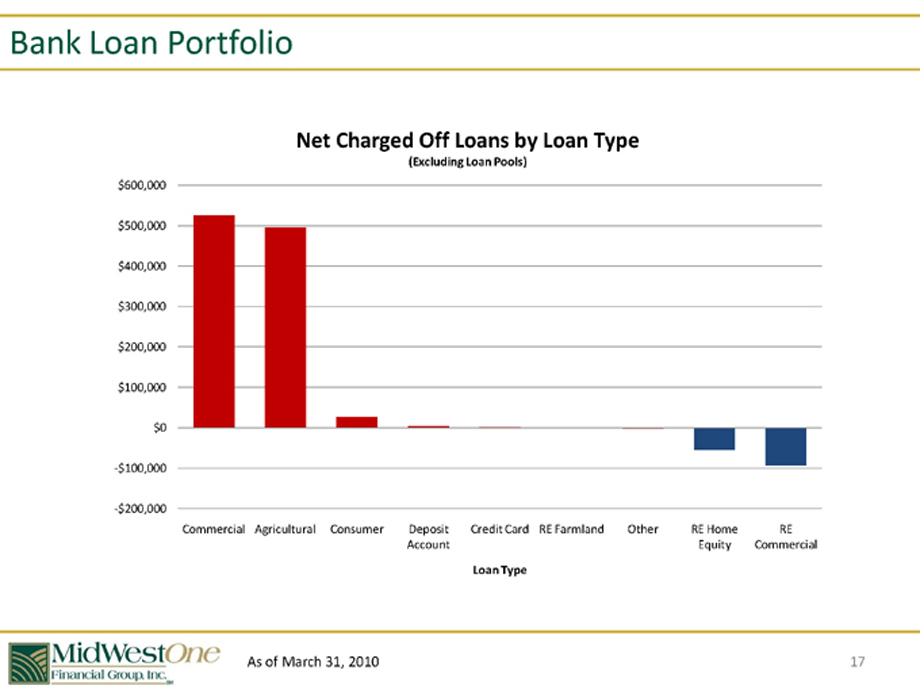
Bank Loan Portfolio
Net Charged Off Loans by Loan Type
(Excluding Loan Pools)
$600,000
$500,000 $400,000 $300,000 $200,000 $100,000 $0 -$100,000
-$200,000
Commercial Agricultural Consumer Deposit Credit Card RE Farmland Other RE Home RE Account Equity Commercial
Loan Type
As of March 31, 2010
17
|
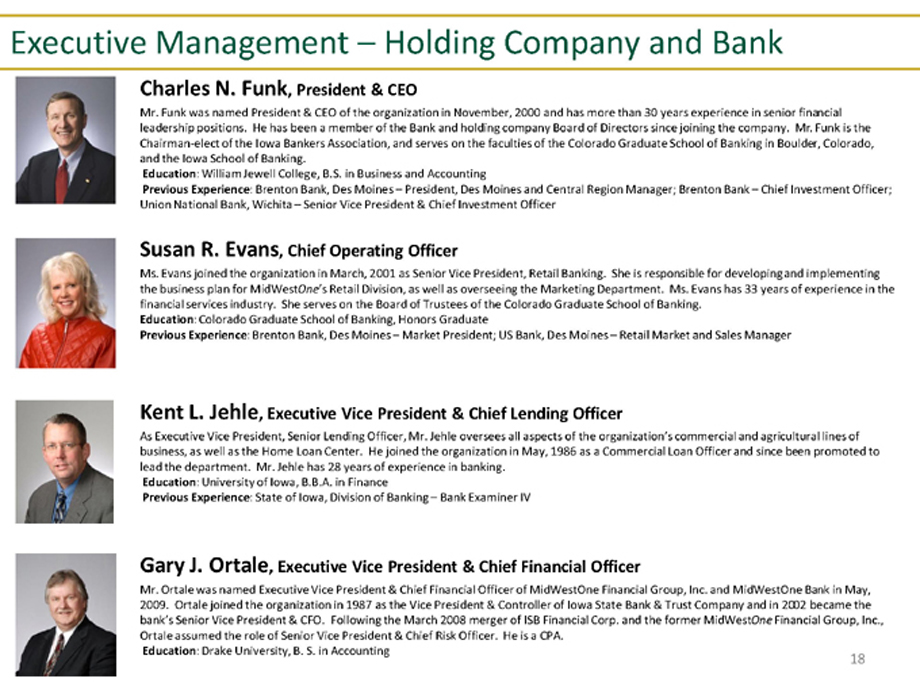
Executive Management – Holding Company and Bank
Charles N. Funk, President & CEO
Mr. Funk was named President & CEO of the organization in November, 2000 and has more than 30 years experience in senior financial leadership positions. He has been a member of the Bank and holding company Board of Directors since joining the company. Mr. Funk is the Chairman-elect of the Iowa Bankers Association, and serves on the faculties of the Colorado Graduate School of Banking in Boulder, Colorado, and the Iowa School of Banking.
Education: William Jewell College, B.S. in Business and Accounting
Previous Experience: Brenton Bank, Des Moines – President, Des Moines and Central Region Manager; Brenton Bank –Chief Investment Officer; Union National Bank, Wichita –Senior Vice President & Chief Investment Officer
Susan R. Evans, Chief Operating Officer
Ms. Evans joined the organization in March, 2001 as Senior Vice President, Retail Banking. She is responsible for developingand implementing the business plan for MidWestOne’s Retail Division, as well as overseeing the financial services industry. She serves on the Board of Trustees of the Colorado Graduate School of Banking.
Education: Colorado Graduate School of Banking, Honors Graduate
Previous Experience: Brenton Bank, Des Moines – Market President; US Bank, Des Moines – Retail Market and Sales Manager
Kent L. Jehle, Executive Vice President & Chief Lending Officer
As Executive Vice President, Senior Lending Officer, culturalMr. lines of business, as well as the Home Loan Center. He joined the organization in May, 1986 as a Commercial Loan Officer and since been promoted to lead the department. Mr. Jehle has 28 years of experience in banking.
Education: University of Iowa, B.B.A. in Finance
Previous Experience: State of Iowa, Division of Banking – Bank Examiner IV
Gary J. Ortale, Executive Vice President & Chief Financial Officer
Mr. Ortale was named Executive Vice President & Chief Financial Officer of MidWestOne Financial Group, Inc. and MidWestOne Bank in May, 2009. Ortale joined the organization in 1987 as the Vice President & Controller of Iowa State Bank & Trust Company and in 2002 became the bank’s Senior Vice President 2008 merger of& ISBCFO. Financial Corp. Following and the former MidWestOne the Financial March Group, Inc., Ortale assumed the role of Senior Vice President & Chief Risk Officer. He is a CPA.
Education: Drake University, B. S. in Accounting
18
|
Loan Pool Participations
At March 31, 2010, our loan pool investment was $83.2 million. As of March 31, 2010, approximately 6% of our earning assets were invested in loan pools, and approximately 6% of our total revenue was derived from loan pools. The former MidWestOne had engaged in this business since 1988 and the company continued the business following the merger. These loan pool participations are pools of performing, sub-performing and nonperforming loans purchased at varying discounts from the aggregate outstanding principal amount of the underlying loans. Our basis across the total loan pool portfolio is approximately $0.47 per $1.00 of loan face value as of March 31, 2010.
Loan pools are researched, bought, held and serviced by a third-party independent servicing corporation working in cooperation with MOFG management. The bank chooses to invest in certain pools purchased by the servicer from nonaffiliated banking organizations and from the FDIC acting as receiver of failed banks and savings associations. The company has very minimal exposure in loan pools to consumer real estate, subprime credit or to construction and real estate development loans.
Please see the White Paper in your information kits.
19
|
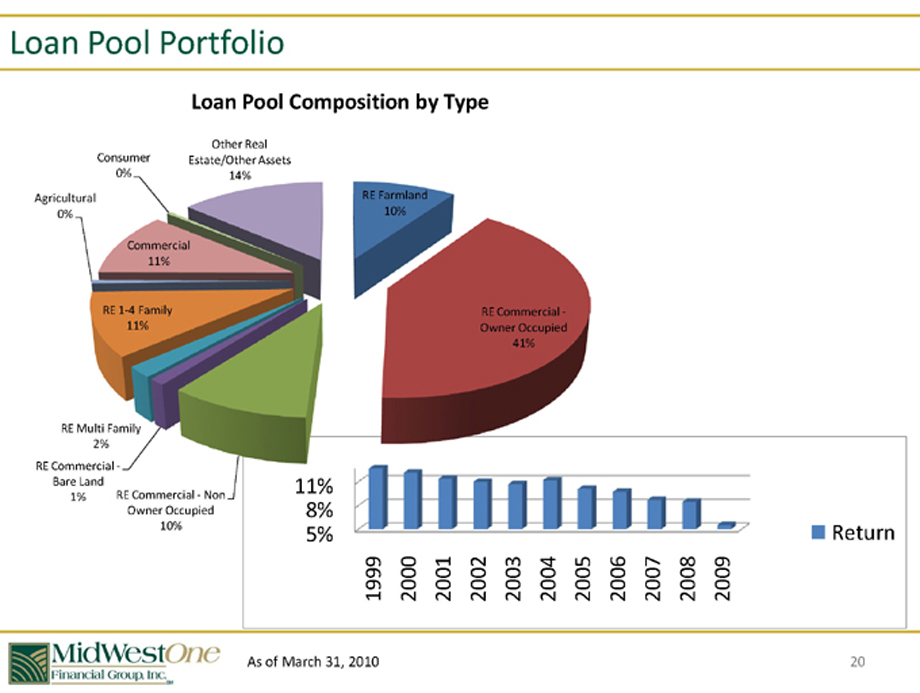
Loan Pool Portfolio
Loan Pool Composition by Type
Other Real Consumer Estate/Other Assets
0% 14%
Agricultural RE Farmland
0% 10%
Commercial 11%
RE 1-4 Family RE Commercial -11% Owner Occupied 41%
RE Multi Family 2%
RE Commercial -
Bare Land 11%
1% RE Commercial—Non
Owner Occupied 8%
10% 5% Return 1999 2000 2001 2002 2003 2004 2005 2006 2007 2008 *2009
As of March 31, 2010
20
|
Loan Pool Targets
Management has set a target range for loan pool participations of $90 Million to $110 Million and continues to be active in bidding on new pools. The most recently purchased pools have performed well and management believes the business will again perform acceptably over the long term.
21
|
Why MidWestOne?
Strong Capital Position
Ample Liquidity
High Credit and Loan Quality
NPAs are traditionally better than peer group Excellent historical track record
Major agricultural lender (#58 in the U.S. according to the ABA)
Competitive product lines
Iowa banking likely to consolidate in the next five years
Iowa has the 4th highest number of banking charters in the US
Opportunity to increase market share in larger communities in our footprint •Grow internally and possibly through acquisition
Company has strategic plan to grow
Commitment to our shareholders
People
22
|
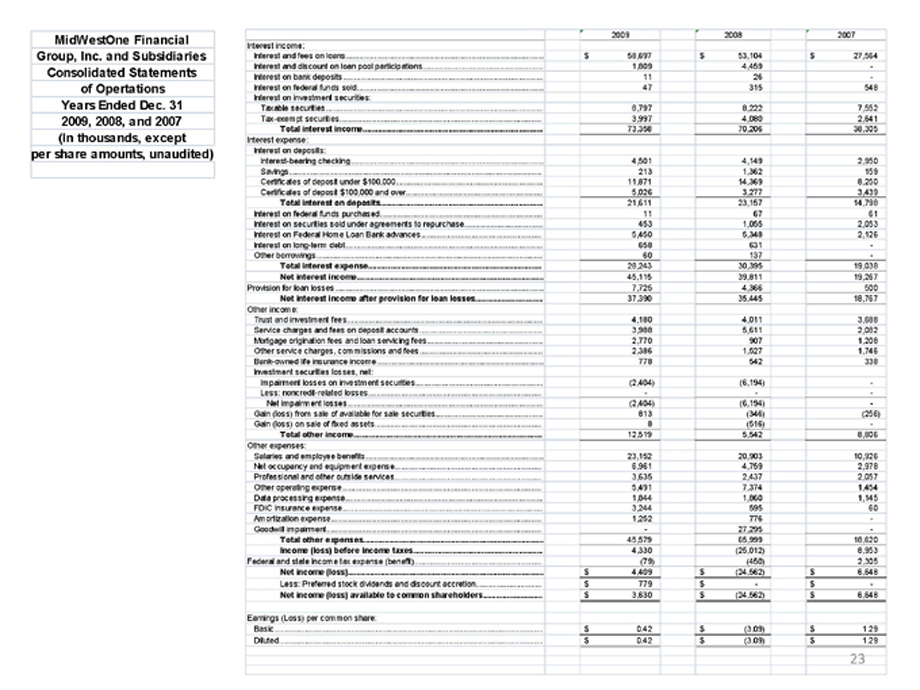
MidWestOne Financial 2009 2008 2007
Interest income:
Group, Inc. and Subsidiaries Interest and fees on loans. $ 58,697 $ 53,104 $ 27,564 Interest and discount on loan pool participations. 1,809 4,459 -Consolidated Statements Interest on bank deposits. 11 26 -of Opertations Interest on federal funds sold 47 315 548 Interest on investment securities: Years Ended Dec. 31 Taxable securities. 8,797 8,222 7,552 2009, 2008, and 2007 Tax-exempt securities. 3,997 4,080 2,641
Total interest income. 73,358 70,206 38,305
(In thousands, except Interest expense: per share amounts, unaudited) Interest on deposits:
Interest-bearing checking. 4,501 4,149 2,950 Savings. 213 1,362 159 Certificates of deposit under $100,000. 11,871 14,369 8,250 Certificates of deposit $100,000 and over. 5,026 3,277 3,439
Total interest on deposits. 21,611 23,157 14,798 Interest on federal funds purchased. 11 67 61 Interest on securities sold under agreements to repurchase. 453 1,055 2,053 Interest on Federal Home Loan Bank advances. 5,450 5,348 2,126 Interest on long-term debt. 658 631 -Other borrowings. 60 137 -
Total interest expense. 28,243 30,395 19,038 Net interest income. 45,115 39,811 19,267 Provision for loan losses. 7,725 4,366 500
Net interest income after provision for loan losses. 37,390 35,445 18,767 Other income: Trust and investment fees. 4,180
4,011 3,688 Service charges and fees on deposit accounts. 3,988 5,611 2,082 Mortgage origination fees and loan servicing fees. 2,770 907 1,208 Other service charges, commissions and fees. 2,386 1,527 1,746 Bank-owned life insurance income. 778 542 338 Investment securities losses, net: Impairment losses on investment securities. (2,404) (6,194) -Less: noncredit-related losses. - Net impairment losses. (2,404) (6,194) -Gain (loss) from sale of available for sale securities. 813 (346) (256) Gain (loss) on sale of fixed assets. 8 (516) -
Total other income. 12,519 5,542 8,806 Other expenses: Salaries and employee benefits. 23,152 20,903 10,926 Net occupancy and equipment expense. 6,961 4,759 2,978 Professional and other outside services. 3,635 2,437 2,057 Other operating expense. 5,491 7,374 1,454 Data processing expense. 1,844 1,860 1,145 FDIC Insurance expense. 3,244 595 60 Amortization expense. 1,252 776 -Goodwill impairment. - 27,295 -
Total other expenses. 45,579 65,999 18,620 Income (loss) before income taxes. 4,330 (25,012) 8,953 Federal and state income tax expense (benefit). (79) (450) 2,305
Net income (loss). $ 4,409 $ (24,562) $ 6,648 Less: Preferred stock dividends and discount accretion. $ 779 $ -$ -Net income (loss) available to common shareholders. $ 3,630 $ (24,562) $ 6,648
Earnings (Loss) per common share:
Basic. $ 0.42 $ (3.09) $ 1.29
Diluted. $ 0.42 $ (3.09) $ 1.29
23
|
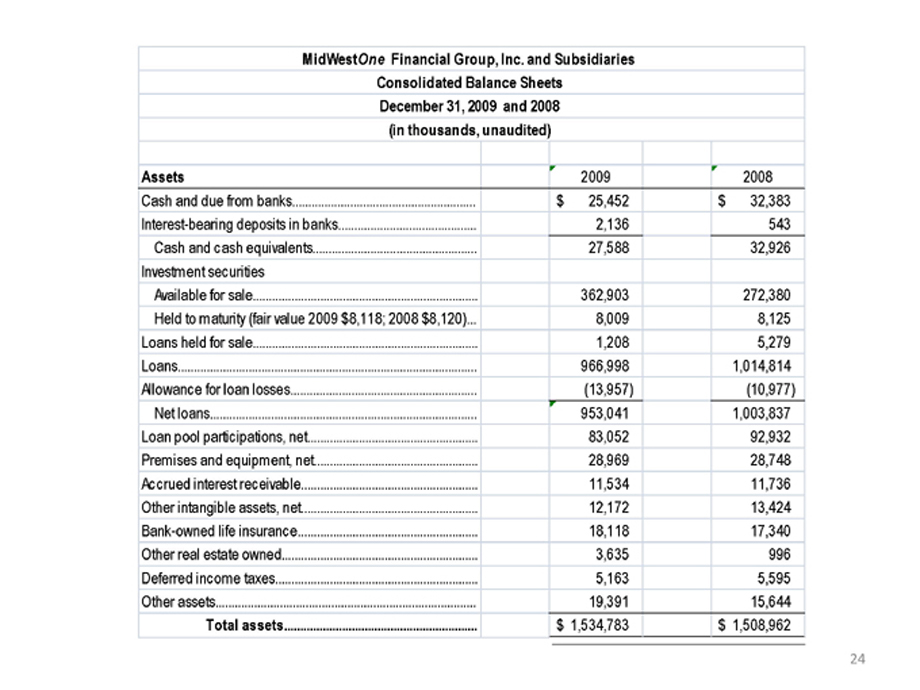
MidWest One Financial Group, Inc. and Subsidiaries
Consolidated Balance Sheets
December 31, 2009 and 2008
(in thousands, unaudited)
Assets 2009 2008
Cash and due from banks $ 25,452 $ 32,383
Interest-bearing deposits in banks 2,136 543
Cash and cash equivalents 27,588 32,926
Investment securities
Available for sale 362,903 272,380
Held to maturity (fair value 2009 $8,118; 2008 $8,120) 8,009 8,125
Loans held for sale 1,208 5,279
Loans 966,998 1,014,814
Allowance for loan losses (13,957) (10,977)
Net loans 953,041 1,003,837
Loan pool participations, net 83,052 92,932
Premises and equipment, net 28,969 28,748
Accrued interest receivable 11,534 11,736
Other intangible assets, net 12,172 13,424
Bank-owned life insurance 18,118 17,340
Other real estate owned 3,635 996
Deferred income taxes 5,163 5,595
Other assets 19,391 15,644
Total assets $ 1,534,783 $ 1,508,962
24
|
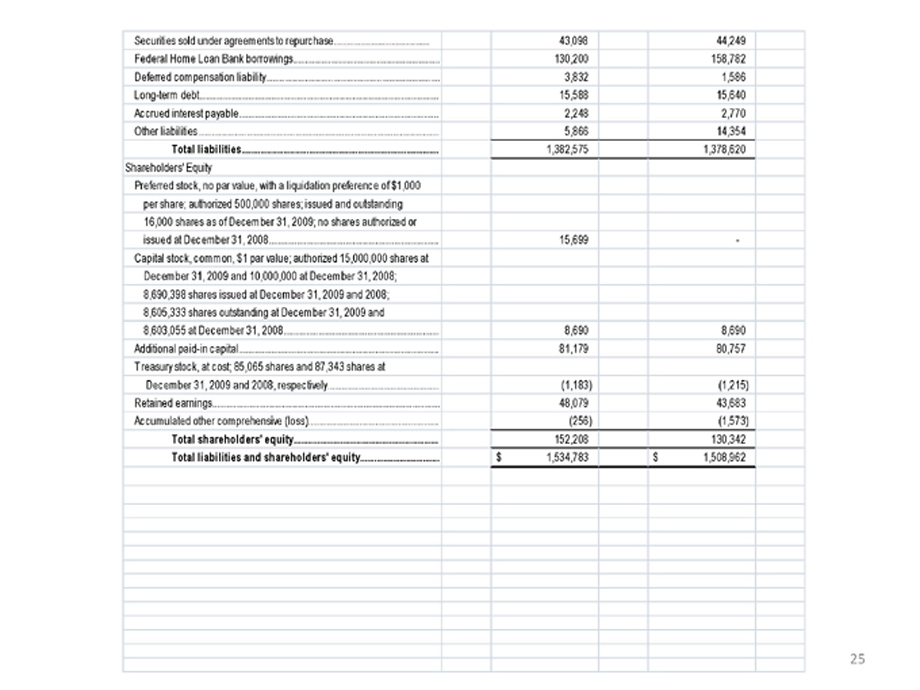
Securities sold under agreements to repurchase 43,098 44,249
Federal Home Loan Bank borrowings 130,200 158,782
Deferred compensation liability 3,832 1,586
Long-term debt 15,588 15,640
Accrued interest payable 2,248 2,770
Other liabilities 5,866 14,354
Total liabilities 1,382,575 1,378,620
Shareholders’ Equity
Preferred stock, no par value, with a liquidation preference of $1,000
per share; authorized 500,000 shares; issued and outstanding
16,000 shares as of December 31, 2009; no shares authorized or
issued at December 31, 2008 15,699
Capital stock, common, $1 par value; authorized 15,000,000 shares at
December 31, 2009 and 10,000,000 at December 31, 2008;
8,690,398 shares issued at December 31, 2009 and 2008;
8,605,333 shares outstanding at December 31, 2009 and
8,603,055 at December 31, 2008 8,690 8,690
Additional paid-in capital 81,179 80,757
Treasury stock, at cost; 85,065 shares and 87,343 shares at
December 31, 2009 and 2008, respectively (1,183) (1,215)
Retained earnings 48,079 43,683
Accumulated other comprehensive (loss) (256) (1,573)
Total shareholders’ equity 152,208 130,342
Total liabilities and shareholders’ equity $ 1,534,783 $ 1,508,962
25
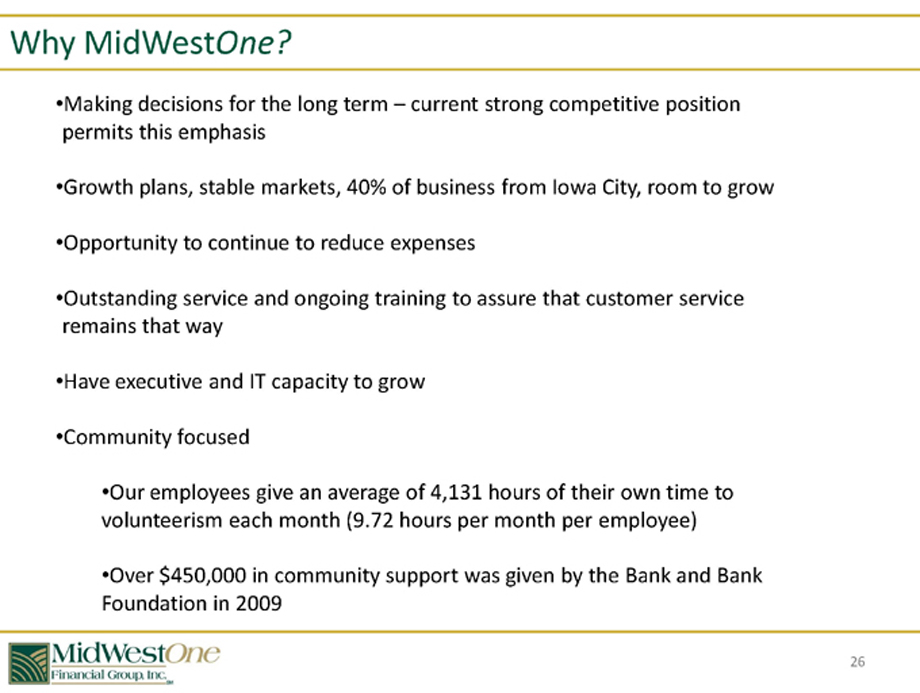
Why Mid WestOne?
Making decisions for the long term – current strong competitive position permits this emphasis
Growth plans, stable markets, 40% of business from Iowa City, room to grow
Opportunity to continue to reduce expenses
Outstanding service and ongoing training to assure that customer service remains that way
Have executive and IT capacity to grow
Community focused
Our employees give an average of 4,131 hours of their own time to volunteerism each month (9.72 hours per month per employee)
Over $450,000 in community support was given by the Bank and Bank Foundation in 2009
26

27