
| Class | Costs of a $10,000 investment | Costs paid as a percentage of a $10,000 investment |
| Class 1 | $ 37 | 0.68% |
| Fund net assets | $ 2,955,724,353 |
| Total number of portfolio holdings | 115 |
| Portfolio turnover for the reporting period | 26% |
| Microsoft Corp. | 8.7% |
| NVIDIA Corp. | 7.3% |
| Apple, Inc. | 6.4% |
| Amazon.com, Inc. | 4.4% |
| Alphabet, Inc., Class C | 2.3% |
| UnitedHealth Group, Inc. | 2.1% |
| AbbVie, Inc. | 1.6% |
| Alphabet, Inc., Class A | 1.6% |
| CSX Corp. | 1.6% |
| NXP Semiconductors NV | 1.6% |


| Class | Costs of a $10,000 investment | Costs paid as a percentage of a $10,000 investment |
| Class 2 | $ 50 | 0.93% |
| Fund net assets | $ 2,955,724,353 |
| Total number of portfolio holdings | 115 |
| Portfolio turnover for the reporting period | 26% |
| Microsoft Corp. | 8.7% |
| NVIDIA Corp. | 7.3% |
| Apple, Inc. | 6.4% |
| Amazon.com, Inc. | 4.4% |
| Alphabet, Inc., Class C | 2.3% |
| UnitedHealth Group, Inc. | 2.1% |
| AbbVie, Inc. | 1.6% |
| Alphabet, Inc., Class A | 1.6% |
| CSX Corp. | 1.6% |
| NXP Semiconductors NV | 1.6% |


| Class | Costs of a $10,000 investment | Costs paid as a percentage of a $10,000 investment |
| Class 3 | $ 44 | 0.81% |
| Fund net assets | $ 2,955,724,353 |
| Total number of portfolio holdings | 115 |
| Portfolio turnover for the reporting period | 26% |
| Microsoft Corp. | 8.7% |
| NVIDIA Corp. | 7.3% |
| Apple, Inc. | 6.4% |
| Amazon.com, Inc. | 4.4% |
| Alphabet, Inc., Class C | 2.3% |
| UnitedHealth Group, Inc. | 2.1% |
| AbbVie, Inc. | 1.6% |
| Alphabet, Inc., Class A | 1.6% |
| CSX Corp. | 1.6% |
| NXP Semiconductors NV | 1.6% |

Item 2. Code of Ethics.
Not applicable.
Item 3. Audit Committee Financial Expert.
Not applicable.
Item 4. Principal Accountant Fees and Services.
Not applicable.
Item 5. Audit Committee of Listed Registrants.
Not applicable.
Item 6. Investments.
(a) The registrant’s “Schedule I – Investments in securities of unaffiliated issuers” (as set forth in 17 CFR 210.12-12) is included in Item 7 of this Form N-CSR.
(b) Not applicable.
Item 7. Financial Statements and Financial Highlights for Open-End Management Investment Companies.

Not FDIC or NCUA Insured | No Financial Institution Guarantee | May Lose Value |
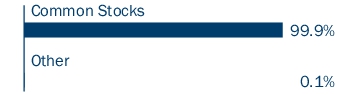
Common Stocks 99.9% | ||
Issuer | Shares | Value ($) |
Communication Services 7.0% | ||
Entertainment 1.0% | ||
Electronic Arts, Inc. | 78,786 | 10,977,253 |
Netflix, Inc.(a) | 28,236 | 19,055,912 |
Total | 30,033,165 | |
Interactive Media & Services 5.5% | ||
Alphabet, Inc., Class A | 262,469 | 47,808,728 |
Alphabet, Inc., Class C | 372,210 | 68,270,758 |
Meta Platforms, Inc., Class A | 92,659 | 46,720,521 |
Total | 162,800,007 | |
Wireless Telecommunication Services 0.5% | ||
T-Mobile US, Inc. | 86,782 | 15,289,253 |
Total Communication Services | 208,122,425 | |
Consumer Discretionary 10.3% | ||
Broadline Retail 4.4% | ||
Amazon.com, Inc.(a) | 672,992 | 130,055,704 |
Hotels, Restaurants & Leisure 2.4% | ||
Booking Holdings, Inc. | 3,506 | 13,889,019 |
Hilton Worldwide Holdings, Inc. | 53,939 | 11,769,490 |
Marriott International, Inc., Class A | 45,434 | 10,984,578 |
McDonald’s Corp. | 135,207 | 34,456,152 |
Total | 71,099,239 | |
Specialty Retail 3.5% | ||
AutoZone, Inc.(a) | 5,211 | 15,445,925 |
Lowe’s Companies, Inc. | 154,673 | 34,099,209 |
O’Reilly Automotive, Inc.(a) | 10,736 | 11,337,860 |
TJX Companies, Inc. (The) | 274,877 | 30,263,958 |
Tractor Supply Co. | 43,964 | 11,870,280 |
Total | 103,017,232 | |
Total Consumer Discretionary | 304,172,175 | |
Consumer Staples 3.8% | ||
Beverages 1.1% | ||
Coca-Cola Co. (The) | 277,833 | 17,684,070 |
Keurig Dr. Pepper, Inc. | 415,484 | 13,877,166 |
Total | 31,561,236 | |
Common Stocks (continued) | ||
Issuer | Shares | Value ($) |
Consumer Staples Distribution & Retail 0.9% | ||
Target Corp. | 68,660 | 10,164,426 |
Walmart, Inc. | 237,612 | 16,088,709 |
Total | 26,253,135 | |
Food Products 0.6% | ||
Mondelez International, Inc., Class A | 266,211 | 17,420,848 |
Household Products 1.2% | ||
Colgate-Palmolive Co. | 195,297 | 18,951,621 |
Procter & Gamble Co. (The) | 110,182 | 18,171,215 |
Total | 37,122,836 | |
Total Consumer Staples | 112,358,055 | |
Energy 5.1% | ||
Energy Equipment & Services 2.0% | ||
Baker Hughes Co. | 864,956 | 30,420,503 |
Halliburton Co. | 142,462 | 4,812,366 |
Schlumberger NV | 383,075 | 18,073,479 |
TechnipFMC PLC | 180,087 | 4,709,275 |
Total | 58,015,623 | |
Oil, Gas & Consumable Fuels 3.1% | ||
Chesapeake Energy Corp. | 158,293 | 13,010,102 |
ConocoPhillips Co. | 103,700 | 11,861,206 |
Diamondback Energy, Inc. | 71,730 | 14,359,629 |
EQT Corp. | 439,079 | 16,237,141 |
Exxon Mobil Corp. | 322,394 | 37,113,997 |
Total | 92,582,075 | |
Total Energy | 150,597,698 | |
Financials 12.4% | ||
Banks 3.3% | ||
Huntington Bancshares, Inc. | 954,700 | 12,582,946 |
JPMorgan Chase & Co. | 141,469 | 28,613,520 |
U.S. Bancorp | 480,204 | 19,064,099 |
Wells Fargo & Co. | 620,030 | 36,823,582 |
Total | 97,084,147 | |
Common Stocks (continued) | ||
Issuer | Shares | Value ($) |
Capital Markets 2.5% | ||
Goldman Sachs Group, Inc. (The) | 36,715 | 16,606,929 |
LPL Financial Holdings, Inc. | 47,643 | 13,306,690 |
Morgan Stanley | 259,966 | 25,266,095 |
Raymond James Financial, Inc. | 101,782 | 12,581,273 |
S&P Global, Inc. | 14,919 | 6,653,874 |
Total | 74,414,861 | |
Consumer Finance 1.4% | ||
American Express Co. | 172,245 | 39,883,330 |
Financial Services 2.8% | ||
Block, Inc., Class A(a) | 103,116 | 6,649,951 |
Corpay, Inc.(a) | 28,717 | 7,650,496 |
MasterCard, Inc., Class A | 71,747 | 31,651,906 |
Visa, Inc., Class A | 141,447 | 37,125,594 |
Total | 83,077,947 | |
Insurance 2.4% | ||
Allstate Corp. (The) | 73,330 | 11,707,868 |
Marsh & McLennan Companies, Inc. | 66,151 | 13,939,339 |
MetLife, Inc. | 178,354 | 12,518,667 |
Progressive Corp. (The) | 84,667 | 17,586,183 |
Travelers Companies, Inc. (The) | 77,969 | 15,854,216 |
Total | 71,606,273 | |
Total Financials | 366,066,558 | |
Health Care 12.6% | ||
Biotechnology 4.0% | ||
AbbVie, Inc. | 279,956 | 48,018,053 |
Amgen, Inc. | 34,200 | 10,685,790 |
Biogen, Inc.(a) | 32,013 | 7,421,254 |
Regeneron Pharmaceuticals, Inc.(a) | 32,610 | 34,274,088 |
Vertex Pharmaceuticals, Inc.(a) | 39,183 | 18,365,856 |
Total | 118,765,041 | |
Health Care Equipment & Supplies 1.2% | ||
Medtronic PLC | 173,830 | 13,682,159 |
Stryker Corp. | 64,444 | 21,927,071 |
Total | 35,609,230 | |
Common Stocks (continued) | ||
Issuer | Shares | Value ($) |
Health Care Providers & Services 3.7% | ||
Cencora, Inc. | 79,924 | 18,006,877 |
Elevance Health, Inc. | 30,484 | 16,518,060 |
Molina Healthcare, Inc.(a) | 40,087 | 11,917,865 |
UnitedHealth Group, Inc. | 124,344 | 63,323,426 |
Total | 109,766,228 | |
Life Sciences Tools & Services 1.9% | ||
Danaher Corp. | 58,196 | 14,540,271 |
Mettler-Toledo International, Inc.(a) | 8,000 | 11,180,720 |
Thermo Fisher Scientific, Inc. | 53,099 | 29,363,747 |
Total | 55,084,738 | |
Pharmaceuticals 1.8% | ||
Eli Lilly & Co. | 42,629 | 38,595,444 |
Merck & Co., Inc. | 131,139 | 16,235,008 |
Total | 54,830,452 | |
Total Health Care | 374,055,689 | |
Industrials 10.9% | ||
Aerospace & Defense 1.8% | ||
General Dynamics Corp. | 60,814 | 17,644,574 |
Howmet Aerospace, Inc. | 140,818 | 10,931,701 |
Northrop Grumman Corp. | 55,793 | 24,322,959 |
Total | 52,899,234 | |
Building Products 1.1% | ||
Carrier Global Corp. | 232,843 | 14,687,736 |
Trane Technologies PLC | 55,591 | 18,285,548 |
Total | 32,973,284 | |
Commercial Services & Supplies 0.3% | ||
Republic Services, Inc. | 49,400 | 9,600,396 |
Electrical Equipment 1.4% | ||
AMETEK, Inc. | 94,704 | 15,788,104 |
Eaton Corp. PLC | 76,973 | 24,134,884 |
Total | 39,922,988 | |
Ground Transportation 2.0% | ||
CSX Corp. | 1,418,763 | 47,457,622 |
Old Dominion Freight Line, Inc. | 62,334 | 11,008,185 |
Total | 58,465,807 | |
Common Stocks (continued) | ||
Issuer | Shares | Value ($) |
Industrial Conglomerates 0.5% | ||
Honeywell International, Inc. | 69,419 | 14,823,733 |
Machinery 2.9% | ||
Cummins, Inc. | 38,659 | 10,705,837 |
Deere & Co. | 81,462 | 30,436,647 |
Dover Corp. | 71,700 | 12,938,265 |
Ingersoll Rand, Inc. | 119,300 | 10,837,212 |
Parker-Hannifin Corp. | 21,300 | 10,773,753 |
Westinghouse Air Brake Technologies Corp. | 69,372 | 10,964,244 |
Total | 86,655,958 | |
Professional Services 0.9% | ||
Booz Allen Hamilton Holding Corp. | 90,560 | 13,937,184 |
Broadridge Financial Solutions, Inc. | 60,339 | 11,886,783 |
Total | 25,823,967 | |
Total Industrials | 321,165,367 | |
Information Technology 32.8% | ||
Electronic Equipment, Instruments & Components 1.4% | ||
Amphenol Corp., Class A | 236,384 | 15,925,190 |
Keysight Technologies, Inc.(a) | 73,500 | 10,051,125 |
TE Connectivity Ltd. | 109,895 | 16,531,505 |
Total | 42,507,820 | |
IT Services 0.4% | ||
Accenture PLC, Class A | 34,617 | 10,503,144 |
Semiconductors & Semiconductor Equipment 13.7% | ||
Analog Devices, Inc. | 181,360 | 41,397,234 |
Applied Materials, Inc. | 94,101 | 22,206,895 |
ASML Holding NV | 3,533 | 3,613,305 |
KLA Corp. | 27,416 | 22,604,766 |
Marvell Technology, Inc. | 139,990 | 9,785,301 |
Micron Technology, Inc. | 237,236 | 31,203,651 |
NVIDIA Corp. | 1,748,668 | 216,030,445 |
NXP Semiconductors NV | 175,302 | 47,172,015 |
QUALCOMM, Inc. | 56,644 | 11,282,352 |
Total | 405,295,964 | |
Common Stocks (continued) | ||
Issuer | Shares | Value ($) |
Software 10.6% | ||
Fortinet, Inc.(a) | 160,500 | 9,673,335 |
Intuit, Inc. | 33,323 | 21,900,209 |
Microsoft Corp. | 578,521 | 258,569,961 |
Oracle Corp. | 174,868 | 24,691,361 |
Total | 314,834,866 | |
Technology Hardware, Storage & Peripherals 6.7% | ||
Apple, Inc. | 891,902 | 187,852,399 |
Seagate Technology Holdings PLC | 98,741 | 10,196,983 |
Total | 198,049,382 | |
Total Information Technology | 971,191,176 | |
Materials 2.5% | ||
Chemicals 0.5% | ||
Linde PLC | 31,110 | 13,651,379 |
Construction Materials 1.2% | ||
Martin Marietta Materials, Inc. | 16,000 | 8,668,800 |
Vulcan Materials Co. | 109,592 | 27,253,338 |
Total | 35,922,138 | |
Containers & Packaging 0.4% | ||
International Paper Co. | 300,138 | 12,950,955 |
Metals & Mining 0.4% | ||
Southern Copper Corp. | 108,017 | 11,637,752 |
Total Materials | 74,162,224 | |
Real Estate 1.0% | ||
Industrial REITs 0.6% | ||
Prologis, Inc. | 153,314 | 17,218,695 |
Specialized REITs 0.4% | ||
Public Storage | 40,510 | 11,652,702 |
Total Real Estate | 28,871,397 | |
Utilities 1.5% | ||
Electric Utilities 1.5% | ||
NextEra Energy, Inc. | 303,948 | 21,522,558 |
PG&E Corp. | 1,262,817 | 22,048,785 |
Total | 43,571,343 | |
Total Utilities | 43,571,343 | |
Total Common Stocks (Cost $2,243,188,974) | 2,954,334,107 | |
Money Market Funds 0.2% | ||
Shares | Value ($) | |
Columbia Short-Term Cash Fund, 5.547%(b),(c) | 4,790,866 | 4,789,428 |
Total Money Market Funds (Cost $4,789,428) | 4,789,428 | |
Total Investments in Securities (Cost: $2,247,978,402) | 2,959,123,535 | |
Other Assets & Liabilities, Net | (3,399,182 ) | |
Net Assets | 2,955,724,353 | |
(a) | Non-income producing investment. |
(b) | The rate shown is the seven-day current annualized yield at June 30, 2024. |
(c) | As defined in the Investment Company Act of 1940, as amended, an affiliated company is one in which the Fund owns 5% or more of the company’s outstanding voting securities, or a company which is under common ownership or control with the Fund. The value of the holdings and transactions in these affiliated companies during the period ended June 30, 2024 are as follows: |
Affiliated issuers | Beginning of period($) | Purchases($) | Sales($) | Net change in unrealized appreciation (depreciation)($) | End of period($) | Realized gain (loss)($) | Dividends($) | End of period shares |
Columbia Short-Term Cash Fund, 5.547% | ||||||||
11,224,125 | 213,058,799 | (219,492,855 ) | (641 ) | 4,789,428 | 455 | 239,102 | 4,790,866 | |
Level 1 ($) | Level 2 ($) | Level 3 ($) | Total ($) | |
Investments in Securities | ||||
Common Stocks | ||||
Communication Services | 208,122,425 | — | — | 208,122,425 |
Consumer Discretionary | 304,172,175 | — | — | 304,172,175 |
Consumer Staples | 112,358,055 | — | — | 112,358,055 |
Energy | 150,597,698 | — | — | 150,597,698 |
Financials | 366,066,558 | — | — | 366,066,558 |
Health Care | 374,055,689 | — | — | 374,055,689 |
Industrials | 321,165,367 | — | — | 321,165,367 |
Information Technology | 971,191,176 | — | — | 971,191,176 |
Materials | 74,162,224 | — | — | 74,162,224 |
Real Estate | 28,871,397 | — | — | 28,871,397 |
Utilities | 43,571,343 | — | — | 43,571,343 |
Total Common Stocks | 2,954,334,107 | — | — | 2,954,334,107 |
Money Market Funds | 4,789,428 | — | — | 4,789,428 |
Total Investments in Securities | 2,959,123,535 | — | — | 2,959,123,535 |
Assets | |
Investments in securities, at value | |
Unaffiliated issuers (cost $2,243,188,974) | $2,954,334,107 |
Affiliated issuers (cost $4,789,428) | 4,789,428 |
Receivable for: | |
Investments sold | 12,026,323 |
Capital shares sold | 87 |
Dividends | 1,532,541 |
Foreign tax reclaims | 59,830 |
Prepaid expenses | 10,531 |
Total assets | 2,972,752,847 |
Liabilities | |
Due to custodian | 10,412 |
Payable for: | |
Investments purchased | 11,085,640 |
Capital shares redeemed | 5,577,911 |
Management services fees | 54,471 |
Distribution and/or service fees | 198 |
Service fees | 1,939 |
Compensation of chief compliance officer | 258 |
Compensation of board members | 4,937 |
Other expenses | 44,457 |
Deferred compensation of board members | 248,271 |
Total liabilities | 17,028,494 |
Net assets applicable to outstanding capital stock | $2,955,724,353 |
Represented by | |
Trust capital | $2,955,724,353 |
Total - representing net assets applicable to outstanding capital stock | $2,955,724,353 |
Class 1 | |
Net assets | $2,912,298,787 |
Shares outstanding | 66,723,950 |
Net asset value per share | $43.65 |
Class 2 | |
Net assets | $14,242,950 |
Shares outstanding | 337,595 |
Net asset value per share | $42.19 |
Class 3 | |
Net assets | $29,182,616 |
Shares outstanding | 680,449 |
Net asset value per share | $42.89 |
Net investment income | |
Income: | |
Dividends — unaffiliated issuers | $18,074,930 |
Dividends — affiliated issuers | 239,102 |
Foreign taxes withheld | (58,827 ) |
Total income | 18,255,205 |
Expenses: | |
Management services fees | 9,665,158 |
Distribution and/or service fees | |
Class 2 | 16,967 |
Class 3 | 17,797 |
Service fees | 12,979 |
Custodian fees | 16,955 |
Printing and postage fees | 7,804 |
Accounting services fees | 27,692 |
Legal fees | 21,018 |
Interest on interfund lending | 5,895 |
Compensation of chief compliance officer | 257 |
Compensation of board members | 20,693 |
Deferred compensation of board members | 34,183 |
Other | 22,064 |
Total expenses | 9,869,462 |
Net investment income | 8,385,743 |
Realized and unrealized gain (loss) — net | |
Net realized gain (loss) on: | |
Investments — unaffiliated issuers | 170,384,467 |
Investments — affiliated issuers | 455 |
Futures contracts | 377,685 |
Net realized gain | 170,762,607 |
Net change in unrealized appreciation (depreciation) on: | |
Investments — unaffiliated issuers | 278,454,421 |
Investments — affiliated issuers | (641 ) |
Net change in unrealized appreciation (depreciation) | 278,453,780 |
Net realized and unrealized gain | 449,216,387 |
Net increase in net assets resulting from operations | $457,602,130 |
Six Months Ended June 30, 2024 (Unaudited) | Year Ended December 31, 2023 | |
Operations | ||
Net investment income | $8,385,743 | $21,854,013 |
Net realized gain | 170,762,607 | 68,967,934 |
Net change in unrealized appreciation (depreciation) | 278,453,780 | 508,041,258 |
Net increase in net assets resulting from operations | 457,602,130 | 598,863,205 |
Decrease in net assets from capital stock activity | (302,564,646 ) | (385,486,788 ) |
Total increase in net assets | 155,037,484 | 213,376,417 |
Net assets at beginning of period | 2,800,686,869 | 2,587,310,452 |
Net assets at end of period | $2,955,724,353 | $2,800,686,869 |
Six Months Ended | Year Ended | |||
June 30, 2024 (Unaudited) | December 31, 2023 | |||
Shares | Dollars ($) | Shares | Dollars ($) | |
Capital stock activity | ||||
Class 1 | ||||
Shares sold | 15,662 | 630,654 | 116,000 | 3,683,979 |
Shares redeemed | (7,390,190 ) | (299,820,834 ) | (11,405,696 ) | (384,374,995 ) |
Net decrease | (7,374,528 ) | (299,190,180 ) | (11,289,696 ) | (380,691,016 ) |
Class 2 | ||||
Shares sold | 8,963 | 346,272 | 23,275 | 760,889 |
Shares redeemed | (24,962 ) | (991,127 ) | (50,662 ) | (1,623,587 ) |
Net decrease | (15,999 ) | (644,855 ) | (27,387 ) | (862,698 ) |
Class 3 | ||||
Shares sold | 9,657 | 381,808 | 27,674 | 861,997 |
Shares redeemed | (77,748 ) | (3,111,419 ) | (146,799 ) | (4,795,071 ) |
Net decrease | (68,091 ) | (2,729,611 ) | (119,125 ) | (3,933,074 ) |
Total net decrease | (7,458,618 ) | (302,564,646 ) | (11,436,208 ) | (385,486,788 ) |
Net asset value, beginning of period | Net investment income | Net realized and unrealized gain (loss) | Total from investment operations | |
Class 1 | ||||
Six Months Ended 6/30/2024 (Unaudited) | $37.25 | 0.12 | 6.28 | 6.40 |
Year Ended 12/31/2023 | $29.87 | 0.27 | 7.11 | 7.38 |
Year Ended 12/31/2022 | $36.14 | 0.22 | (6.49 ) | (6.27 ) |
Year Ended 12/31/2021 | $27.91 | 0.16 | 8.07 | 8.23 |
Year Ended 12/31/2020 | $23.85 | 0.24 | 3.82 | 4.06 |
Year Ended 12/31/2019 | $18.84 | 0.27 | 4.74 | 5.01 |
Class 2 | ||||
Six Months Ended 6/30/2024 (Unaudited) | $36.06 | 0.07 | 6.06 | 6.13 |
Year Ended 12/31/2023 | $28.98 | 0.18 | 6.90 | 7.08 |
Year Ended 12/31/2022 | $35.15 | 0.14 | (6.31 ) | (6.17 ) |
Year Ended 12/31/2021 | $27.21 | 0.08 | 7.86 | 7.94 |
Year Ended 12/31/2020 | $23.31 | 0.18 | 3.72 | 3.90 |
Year Ended 12/31/2019 | $18.47 | 0.21 | 4.63 | 4.84 |
Class 3 | ||||
Six Months Ended 6/30/2024 (Unaudited) | $36.63 | 0.09 | 6.17 | 6.26 |
Year Ended 12/31/2023 | $29.41 | 0.22 | 7.00 | 7.22 |
Year Ended 12/31/2022 | $35.62 | 0.18 | (6.39 ) | (6.21 ) |
Year Ended 12/31/2021 | $27.54 | 0.12 | 7.96 | 8.08 |
Year Ended 12/31/2020 | $23.57 | 0.21 | 3.76 | 3.97 |
Year Ended 12/31/2019 | $18.65 | 0.24 | 4.68 | 4.92 |
Notes to Financial Highlights | |
(a) | In addition to the fees and expenses that the Fund bears directly, the Fund indirectly bears a pro rata share of the fees and expenses of any other funds in which it invests. Such indirect expenses are not included in the Fund’s reported expense ratios. |
(b) | Total net expenses include the impact of certain fee waivers/expense reimbursements made by the Investment Manager and certain of its affiliates, if applicable. |
(c) | Ratios include interfund lending expense which is less than 0.01%. |
(d) | Ratios include interest on collateral expense which is less than 0.01%. |
Net asset value, end of period | Total return | Total gross expense ratio to average net assets(a) | Total net expense ratio to average net assets(a),(b) | Net investment income ratio to average net assets | Portfolio turnover | Net assets, end of period (000’s) | |
Class 1 | |||||||
Six Months Ended 6/30/2024 (Unaudited) | $43.65 | 17.18% | 0.68% (c) | 0.68% (c) | 0.59% | 26% | $2,912,299 |
Year Ended 12/31/2023 | $37.25 | 24.71% | 0.69% (c) | 0.69% (c) | 0.81% | 56% | $2,760,520 |
Year Ended 12/31/2022 | $29.87 | (17.35% ) | 0.68% (c),(d) | 0.68% (c),(d) | 0.72% | 75% | $2,550,753 |
Year Ended 12/31/2021 | $36.14 | 29.49% | 0.68% (d) | 0.68% (d) | 0.50% | 99% | $3,254,887 |
Year Ended 12/31/2020 | $27.91 | 17.02% | 0.68% | 0.68% | 1.02% | 92% | $3,085,119 |
Year Ended 12/31/2019 | $23.85 | 26.59% | 0.70% | 0.69% | 1.25% | 129% | $2,237,714 |
Class 2 | |||||||
Six Months Ended 6/30/2024 (Unaudited) | $42.19 | 17.00% | 0.93% (c) | 0.93% (c) | 0.34% | 26% | $14,243 |
Year Ended 12/31/2023 | $36.06 | 24.43% | 0.94% (c) | 0.94% (c) | 0.56% | 56% | $12,749 |
Year Ended 12/31/2022 | $28.98 | (17.55% ) | 0.93% (c),(d) | 0.93% (c),(d) | 0.47% | 75% | $11,042 |
Year Ended 12/31/2021 | $35.15 | 29.18% | 0.93% (d) | 0.93% (d) | 0.26% | 99% | $13,396 |
Year Ended 12/31/2020 | $27.21 | 16.73% | 0.93% | 0.93% | 0.76% | 92% | $11,239 |
Year Ended 12/31/2019 | $23.31 | 26.21% | 0.95% | 0.94% | 1.00% | 129% | $10,760 |
Class 3 | |||||||
Six Months Ended 6/30/2024 (Unaudited) | $42.89 | 17.09% | 0.81% (c) | 0.81% (c) | 0.46% | 26% | $29,183 |
Year Ended 12/31/2023 | $36.63 | 24.55% | 0.81% (c) | 0.81% (c) | 0.69% | 56% | $27,418 |
Year Ended 12/31/2022 | $29.41 | (17.43% ) | 0.81% (c),(d) | 0.81% (c),(d) | 0.59% | 75% | $25,516 |
Year Ended 12/31/2021 | $35.62 | 29.34% | 0.80% (d) | 0.80% (d) | 0.38% | 99% | $34,599 |
Year Ended 12/31/2020 | $27.54 | 16.84% | 0.80% | 0.80% | 0.89% | 92% | $31,113 |
Year Ended 12/31/2019 | $23.57 | 26.38% | 0.83% | 0.81% | 1.13% | 129% | $32,859 |
Amount of realized gain (loss) on derivatives recognized in income | |
Risk exposure category | Futures contracts ($) |
Equity risk | 377,685 |
Derivative instrument | Average notional amounts ($) |
Futures contracts — long | 2,079,617 |
Fee rate(s) contractual through April 30, 2025 (%) | |
Class 1 | 0.70 |
Class 2 | 0.95 |
Class 3 | 0.825 |
Borrower or lender | Average loan balance ($) | Weighted average interest rate (%) | Number of days with outstanding loans |
Borrower | 1,167,742 | 5.86 | 31 |
Agreements
The Board analyzed various reports and presentations it had received detailing the services performed by the Investment Manager and the Subadvisers, as well as their history, expertise, resources and relative capabilities, and the qualifications of their personnel.
The Board carefully reviewed the investment performance of the Fund, including detailed reports providing the results of analyses performed by each of the Investment Manager, Broadridge and JDL collectively showing, for various periods (including since manager inception): (i) the performance of the Fund, (ii) the Fund’s performance relative to peers and benchmarks and (iii) the net assets of the Fund. The Board observed that the Fund’s performance for certain periods ranked above median based on information provided by Broadridge.
The Board reviewed comparative fees and the costs of services provided under each of the Advisory Agreements. The Board members considered detailed comparative information set forth in an annual report on fees and expenses, including, among other things, data (based on analyses conducted by Broadridge and JDL) showing a comparison of the Fund’s expenses with median expenses paid by funds in its comparative peer universe, as well as data showing the Fund’s contribution to the Investment Manager’s profitability.
The Board considered the potential existence of economies of scale in the provision by the Investment Manager of services to the Fund, and whether those economies of scale were shared with the Fund through breakpoints in investment management fees or other means, such as expense limitation arrangements and additional investments by the Investment Manager in investment, trading, compliance and other resources. The Board considered the economies of scale that might be realized as the Fund’s net asset level grows and took note of the extent to which Fund shareholders might also benefit from such growth. In this regard, the Board took into account that management fees decline as Fund assets exceed various breakpoints, all of which have not been surpassed. The Board observed that the Management Agreement thus provides for breakpoints in the management fee rate schedule that allow opportunities for shareholders to realize lower fees as Fund assets grow and that there are additional opportunities through other means for sharing economies of scale with shareholders. The Board also noted that the breakpoints in the Subadvisory Agreements did not occur at the same levels as the breakpoints in the Management Agreement. In this regard, the Board noted the potential challenges of seeking to tailor the Management Agreement breakpoints to those of a subadvisory agreement in this context.
The Board reviewed all of the above considerations in reaching its decision to approve the continuation of the Management Agreement and each of the Subadvisory Agreements. In reaching its conclusions, no single factor was determinative.

Item 8. Changes in and Disagreements with Accountants for Open-End Management Investment Companies.
Not applicable.
Item 9. Proxy Disclosures for Open-End Management Investment Companies.
Not applicable.
Item 10. Remuneration Paid to Directors, Officers, and Others of Open-End Management Investment Companies.
Remuneration Paid to Directors, Officers, and Others of Open-End Management Investment Companies is included in Item 7 of this Form N-CSR.
Item 11. Statement Regarding Basis for Approval of Investment Advisory Contract.
Statement regarding basis for approval of Investment Advisory Contract is included in Item 7 of this Form N-CSR.
Item 12. Disclosure of Proxy Voting Policies and Procedures for Closed-End Management Investment Companies.
Not applicable.
Item 13. Portfolio Managers of Closed-End Management Investment Companies.
Not applicable.
Item 14. Purchases of Equity Securities by Closed-End Management Investment Company and Affiliated Purchasers.
Not applicable.
Item 15. Submission of Matters to a Vote of Security Holders.
There were no material changes to the procedures by which shareholders may recommend nominees to the registrant’s board of directors implemented since the registrant last provided disclosure as to such procedures in response to the requirements of Item 407(c)(2)(iv) of Regulation S-K or Item 15 of Form N-CSR.
Item 16. Controls and Procedures.
(a) The registrant’s principal executive officer and principal financial officer, based on their evaluation of the registrant’s disclosure controls and procedures as of a date within 90 days of the filing of this report, have concluded that such controls and procedures are adequately designed to ensure that information required to be disclosed by the registrant in Form N-CSR is accumulated and communicated to the registrant’s management, including the principal executive officer and principal financial officer, or persons performing similar functions, as appropriate to allow timely decisions regarding required disclosure.
(b) There was no change in the registrant’s internal control over financial reporting that occurred during the period covered by this report that has materially affected, or is reasonably likely to materially affect, the registrant’s internal control over financial reporting.
Item 17. Disclosure of Securities Lending Activities for Closed-End Management Investment Companies.
Not applicable.
Item 18. Recovery of Erroneously Awarded Compensation.
Not applicable.
Item 19. Exhibits.
(a)(1) Not applicable.
SIGNATURES
Pursuant to the requirements of the Securities Exchange Act of 1934 and the Investment Company Act of 1940, the registrant has duly caused this report to be signed on its behalf by the undersigned, thereunto duly authorized.
| (registrant) | Columbia Funds Variable Series Trust II |
| By (Signature and Title) | /s/ Daniel J. Beckman |
| Daniel J. Beckman, President and Principal Executive Officer | |
| Date | August 22, 2024 |
Pursuant to the requirements of the Securities Exchange Act of 1934 and the Investment Company Act of 1940, this report has been signed below by the following persons on behalf of the registrant and in the capacities and on the dates indicated.
| By (Signature and Title) | /s/ Daniel J. Beckman |
| Daniel J. Beckman, President and Principal Executive Officer | |
| Date | August 22, 2024 |
| By (Signature and Title) | /s/ Michael G. Clarke |
| Michael G. Clarke, Chief Financial Officer, | |
| Principal Financial Officer and Senior Vice President | |
| Date | August 22, 2024 |
| By (Signature and Title) | /s/ Charles H. Chiesa |
| Charles H. Chiesa, Treasurer, Chief Accounting | |
| Officer and Principal Financial Officer | |
| Date | August 22, 2024 |