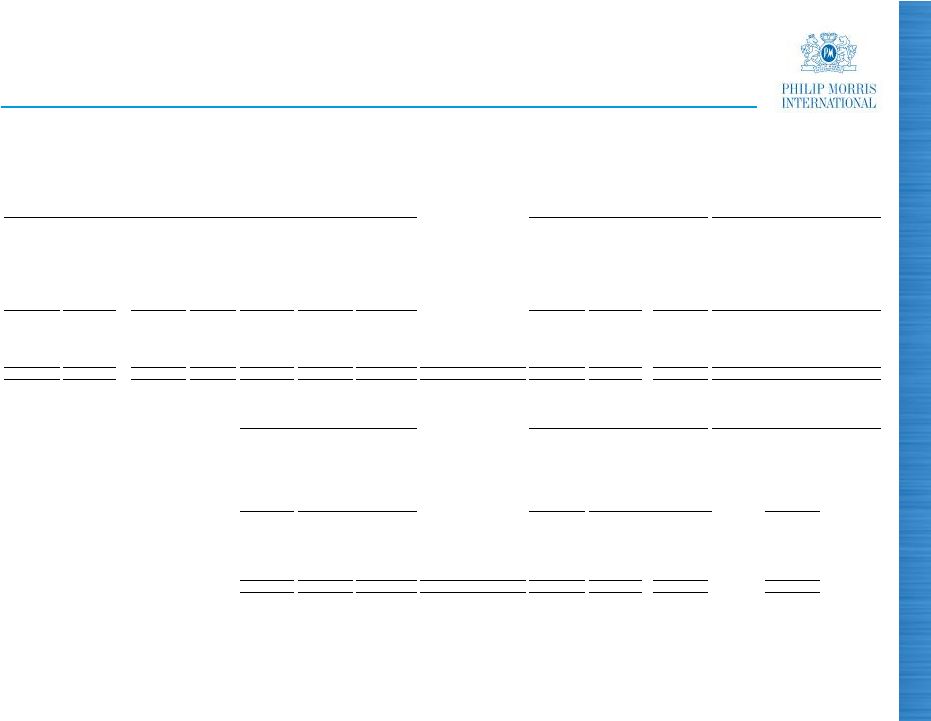
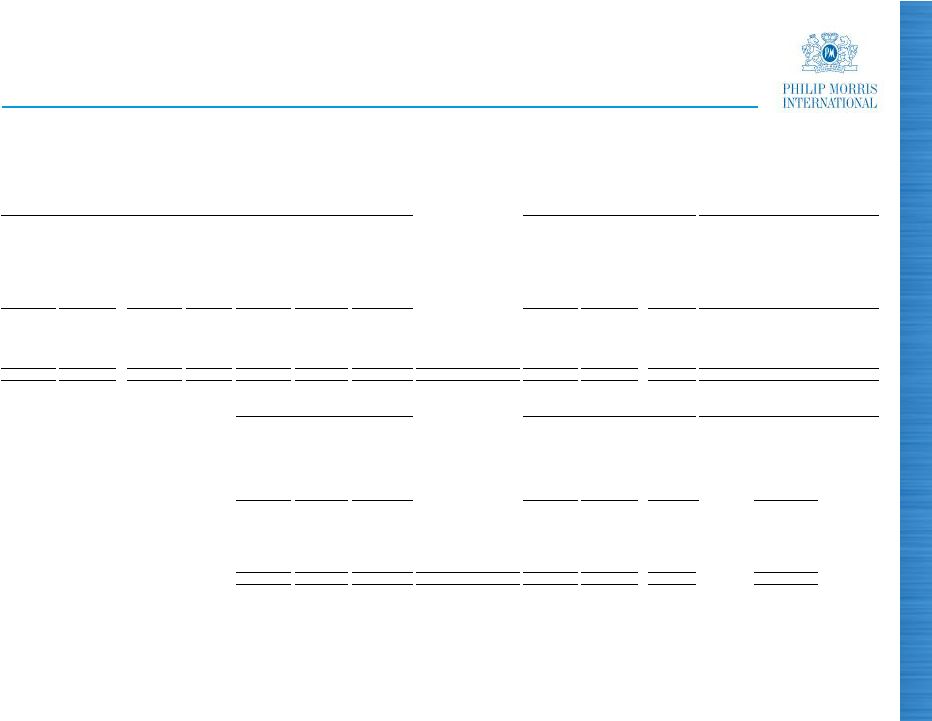
34 PHILIP MORRIS INTERNATIONAL INC. and Subsidiaries Reconciliation of Non-GAAP Measures Adjustments for Impact of Currency and Acquisitions For the Years Ended December 31, (in millions) (Unaudited) Reported Net Revenues Less Excise Taxes Reported Net Revenues excluding Excise Taxes Less Currency Reported Net Revenues excluding Excise Taxes & Currency Less Acquisi- tions Reported Net Revenues excluding Excise Taxes, Currency & Acquisitions Reported Net Revenues Less Excise Taxes Reported Net Revenues excluding Excise Taxes Reported Reported excluding Currency Reported excluding Currency & Acquisitions 28,550 $ 19,509 $ 9,041 $ (856) $ 9,897 $ 61 $ 9,836 $ European Union 30,265 $ 20,577 $ 9,688 $ (6.7)% 2.2% 1.5% 13,865 7,070 6,795 (1,373) 8,168 41 8,127 EEMA 14,817 7,313 7,504 (9.4)% 8.8% 8.3% 12,413 5,885 6,528 (41) 6,569 - 6,569 Asia 12,222 6,037 6,185 5.5% 6.2% 6.2% 7,252 4,581 2,671 (328) 2,999 462 2,537 Latin America & Canada 6,336 4,008 2,328 14.7% 28.8% 9.0% 62,080 $ 37,045 $ 25,035 $ (2,598) $ 27,633 $ 564 $ 27,069 $ PMI Total 63,640 $ 37,935 $ 25,705 $ (2.6)% 7.5% 5.3% Reported Operating Companies Income Less Currency Reported Operating Companies Income excluding Currency Less Acquisi- tions Reported Operating Companies Income excluding Currency & Acquisitions Reported Operating Companies Income Reported Reported excluding Currency Reported excluding Currency & Acquisitions 4,506 $ (481) $ 4,987 $ 40 $ 4,947 $ European Union 4,738 $ (4.9)% 5.3% 4.4% 2,663 (893) 3,556 18 3,538 EEMA 3,119 (14.6)% 14.0% 13.4% 2,436 146 2,290 - 2,290 Asia 2,057 18.4% 11.3% 11.3% 666 (162) 828 202 626 Latin America & Canada 520 28.1% 59.2% 20.4% 10,271 $ (1,390) $ 11,661 $ 260 $ 11,401 $ PMI Total 10,434 $ (1.6)% 11.8% 9.3% 2009 2008 % Change in Reported Net Revenues excluding Excise Taxes 2009 2008 % Change in Reported Operating Companies Income |


