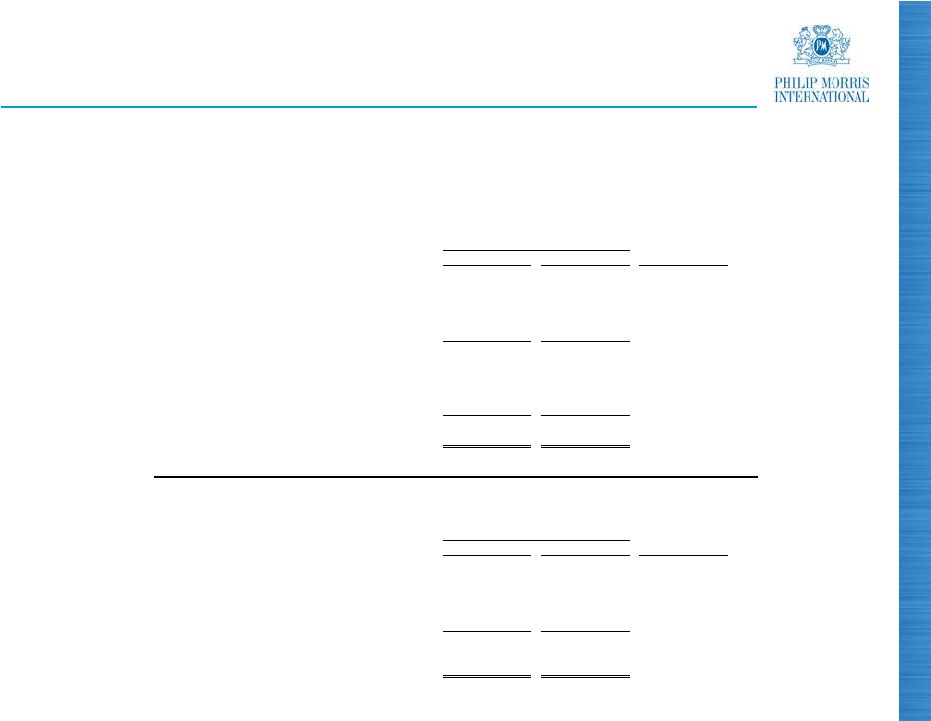
35 PHILIP MORRIS INTERNATIONAL INC. and Subsidiaries Reconciliation of Non-GAAP Measures Reconciliation of Reported Operating Companies Income to Adjusted Operating Companies Income & Reconciliation of Adjusted Operating Companies Income Margin, excluding Currency and Acquisitions For the Nine Months Ended September 30, ($ in millions) (Unaudited) (1) Represents the business combination in the Philippines (2) Represents 2009 Colombian investment and cooperation agreement charge (3) For the calculation of net revenues excluding excise taxes, currency and acquisitions refer to previous slide Reported Operating Companies Income Less Asset Impairment & Exit Costs Adjusted Operating Companies Income Less Currency Adjusted Operating Companies Income excluding Currency Less Acquisi- tions Adjusted Operating Companies Income excluding Currency & Acquisitions Reported Operating Companies Income Less Asset Impairment, Exit Costs & Other Adjusted Operating Companies Income Adjusted Adjusted excluding Currency Adjusted excluding Currency & Acquisitions 3,280 $ (20) $ 3,300 $ (81) $ 3,381 $ 2 $ 3,379 $ European Union 3,397 $ (3) $ 3,400 $ (2.9)% (0.6)% (0.6)% 2,412 - 2,412 74 2,338 28 2,310 EEMA 1,982 - 1,982 21.7% 18.0% 16.5% 2,259 - 2,259 263 1,996 63 (1) 1,933 Asia 1,933 - 1,933 16.9% 3.3% - 699 - 699 69 630 (2) 632 Latin America & Canada 452 (135) (2) 587 19.1% 7.3% 7.7% 8,650 $ (20) $ 8,670 $ 325 $ 8,345 $ 91 $ 8,254 $ PMI Total 7,764 $ (138) $ 7,902 $ 9.7% 5.6% 4.5% % Points Change Adjusted Operating Companies Income excluding Currency Net Revenues excluding Excise Taxes & Currency (3) Adjusted Operating Companies Income Margin excluding Currency Adjusted Operating Companies Income excluding Currency & Acquisitions Net Revenues excluding Excise Taxes, Currency & Acquisitions (3) Adjusted Operating Companies Income Margin excluding Currency & Acquisitions Adjusted Operating Companies Income Net Revenue excluding Excise Taxes (3) Adjusted Operating Companies Income Margin Adjusted Operating Companies Income Margin excluding Currency Adjusted Operating Companies Income Margin excluding Currency & Acquisitions 3,381 $ 6,624 $ 51.0% 3,379 $ 6,621 $ 51.0% European Union 3,400 $ 6,675 $ 50.9% 0.1 0.1 2,338 5,426 43.1% 2,310 5,346 43.2% EEMA 1,982 4,922 40.3% 2.8 2.9 1,996 5,345 37.3% 1,933 4,968 38.9% Asia 1,933 4,814 40.2% (2.9) (1.3) 630 2,042 30.9% 632 2,042 31.0% Latin America & Canada 587 1,907 30.8% 0.1 0.2 8,345 $ 19,437 $ 42.9% 8,254 $ 18,977 $ 43.5% PMI Total 7,902 $ 18,318 $ 43.1% (0.2) 0.4 2009 2010 2009 2010 % Change in Adjusted Operating Companies Income |