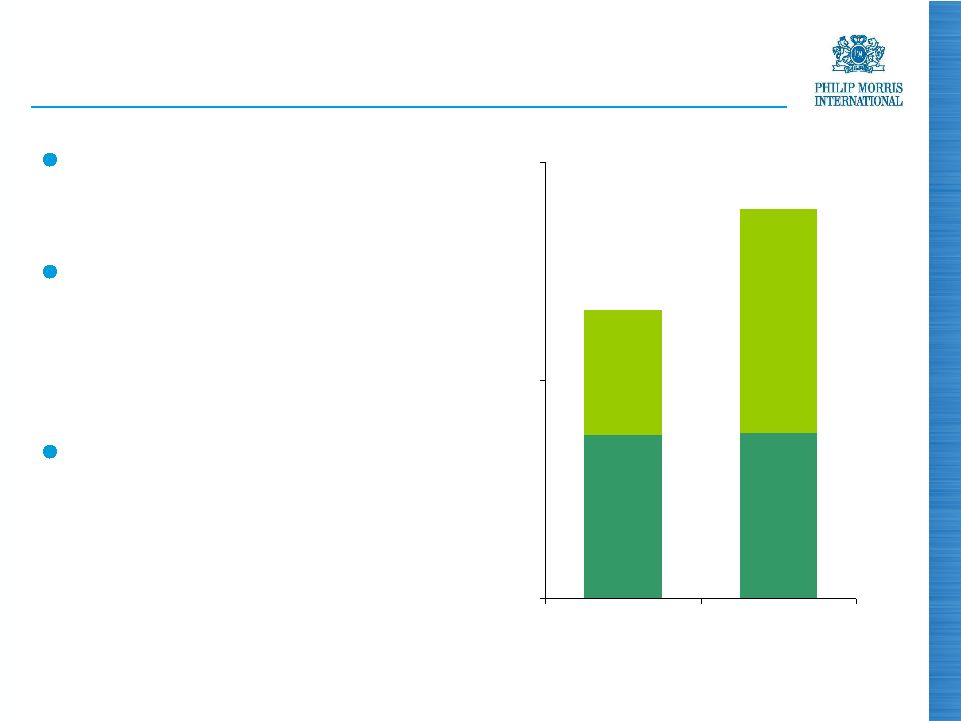
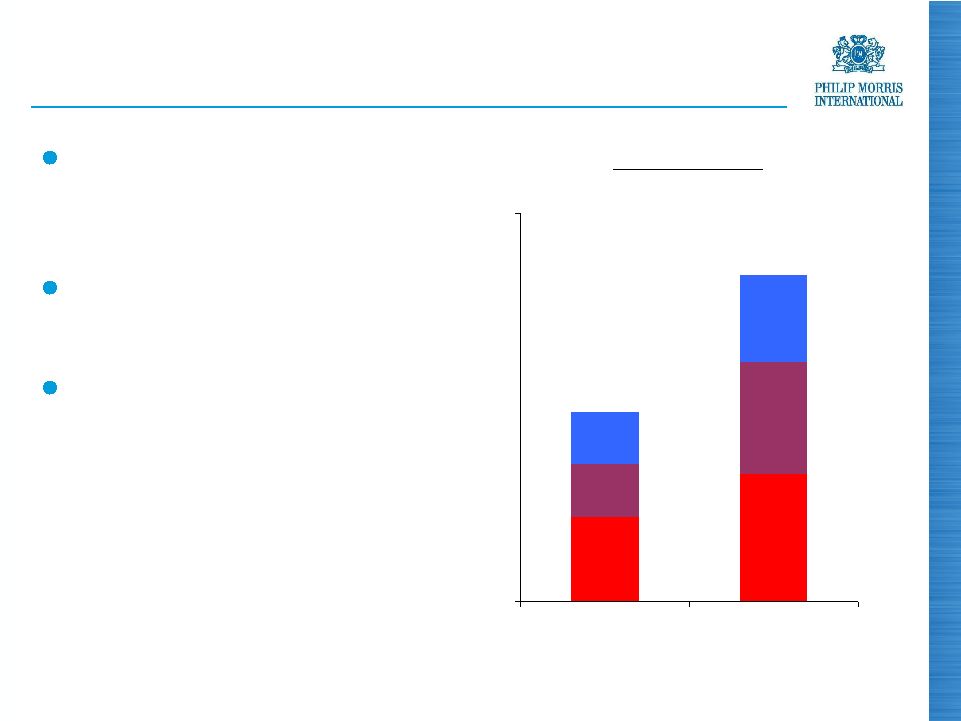
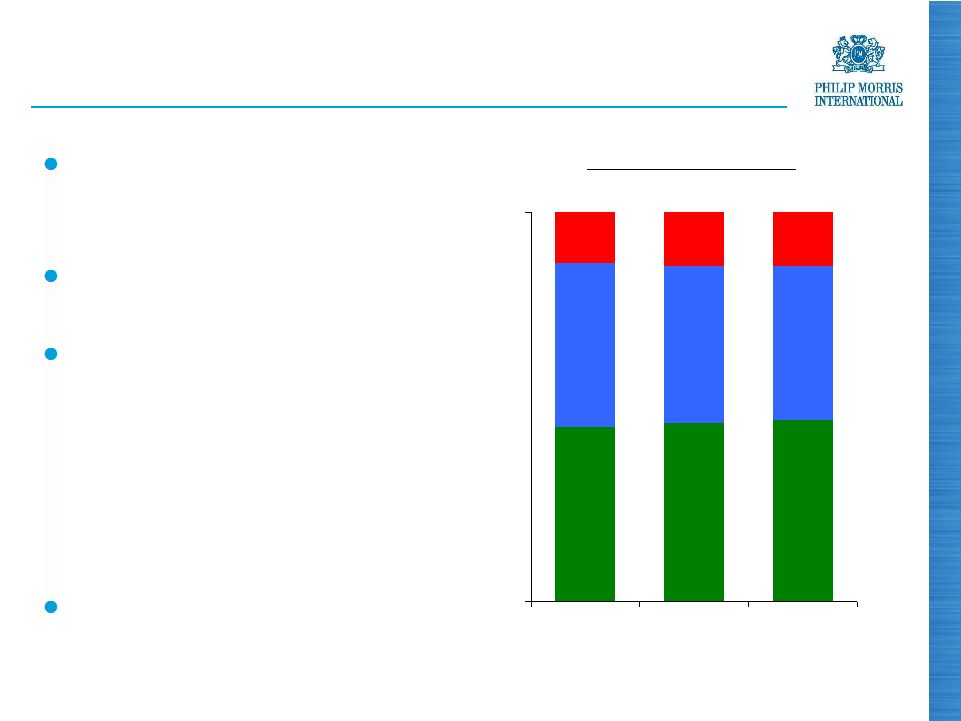
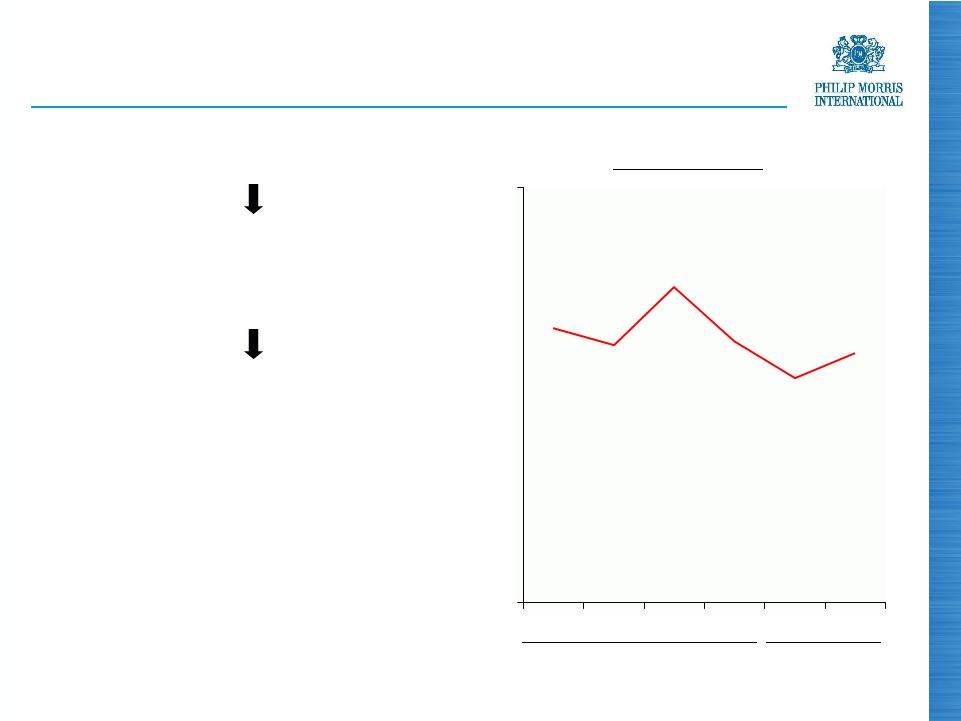
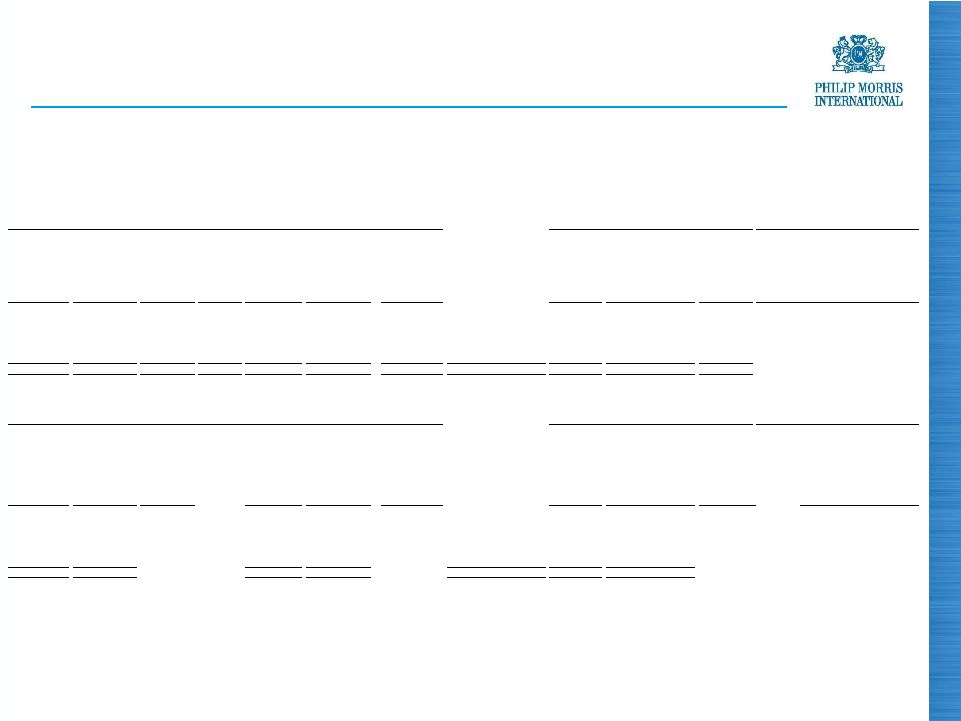
35 PHILIP MORRIS INTERNATIONAL INC. and Subsidiaries Reconciliation of Non-GAAP Measures Reconciliation of Reported Operating Companies Income to Adjusted Operating Companies Income & Reconciliation of Adjusted Operating Companies Income Margin, excluding Currency and Acquisitions For the Six Months Ended June 30, ($ in millions) (Unaudited) (a) Includes the business combination in the Philippines ($23) (b) For the calculation of net revenues excluding excise taxes, currency and acquisitions, refer to previous slide Reported Operating Companies Income Less Asset Impairment & Exit Costs Adjusted Operating Companies Income Less Currency Adjusted Operating Companies Income excluding Currency Less Acquisi- tions Adjusted Operating Companies Income excluding Currency & Acquisitions Reported Operating Companies Income Less Asset Impairment & Exit Costs Adjusted Operating Companies Income Adjusted Adjusted excluding Currency Adjusted excluding Currency & Acquisitions 2,286 $ (12) $ 2,298 $ 131 $ 2,167 $ (1) $ 2,168 $ European Union 2,167 $ - $ 2,167 $ 6.0% - % - % 1,557 (2) 1,559 (1) 1,560 - 1,560 EEMA 1,556 - 1,556 0.2% 0.3% 0.3% 2,491 (2) 2,493 247 2,246 24 (a) 2,222 Asia 1,569 - 1,569 58.9% 43.1% 41.6% 519 (1) 520 10 510 - 510 Latin America & Canada 455 - 455 14.3% 12.1% 12.1% 6,853 $ (17) $ 6,870 $ 387 $ 6,483 $ 23 $ 6,460 $ PMI Total 5,747 $ - $ 5,747 $ 19.5% 12.8% 12.4% % Points Change Adjusted Operating Companies Income excluding Currency Net Revenues excluding Excise Taxes & Currency (b) Adjusted Operating Companies Income Margin excluding Currency Adjusted Operating Companies Income excluding Currency & Acquisitions Net Revenues excluding Excise Taxes, Currency & Acquisitions (b) Adjusted Operating Companies Income Margin excluding Currency & Acquisitions Adjusted Operating Companies Income Net Revenues excluding Excise Taxes (b) Adjusted Operating Companies Income Margin Adjusted Operating Companies Income Margin excluding Currency Adjusted Operating Companies Income Margin excluding Currency & Acquisitions 2,167 $ 4,417 $ 49.1% 2,168 $ 4,417 $ 49.1% European Union 2,167 $ 4,479 $ 48.4% 0.7 0.7 1,560 3,673 42.5% 1,560 3,673 42.5% EEMA 1,556 3,635 42.8% (0.3) (0.3) 2,246 4,909 45.8% 2,222 4,801 46.3% Asia 1,569 3,996 39.3% 6.5 7.0 510 1,554 32.8% 510 1,554 32.8% Latin America & Canada 455 1,447 31.4% 1.4 1.4 6,483 $ 14,553 $ 44.5% 6,460 $ 14,445 $ 44.7% PMI Total 5,747 $ 13,557 $ 42.4% 2.1 2.3 2010 2011 2010 2011 % Change in Adjusted Operating Companies Income |


